3. The outlook for consumer spending and online retail 1
|
|
|
- Eustacia Warner
- 5 years ago
- Views:
Transcription
1 3. The outlook for consumer spending and online retail 1 Key points Consumer spending growth is estimated to have slowed for a second consecutive year in 2018, but is still expected to have grown at an average of 2.2% a year faster than inflation since This spending has aided the economy s recovery from the financial crisis and supported it during the more recent period of Brexitrelated uncertainty. Factors driving continued consumer spending growth include rising employment levels, accelerating real wage growth, a prolonged period of very low interest rates and consumers willingness to reduce their savings rate. Assuming an orderly Brexit, we project real household disposable income growth to accelerate mildly in 2019 and 2020, reaching 2% in the latter year. This will reflect further upward pressure on wages thanks to the tight labour market. Despite higher income growth, we expect real household expenditure growth to slow in 2019 as a result of temporary uncertainty around the outcome of the Brexit process. Growth should then be able to pick up later in 2019 and into 2020 assuming an orderly Brexit is achieved. Given the acceleration in income growth and the slowdown in spending growth, the household saving ratio is likely to begin to rise again gradually in 2019 and reach 2% in Housing and utilities will continue to represent the largest share of total household spending in the long run, with the proportion rising to more than 30% by Spending on discretionary services will also increase in proportional terms over this period, while the share spent on more basic goods, such as food, clothing and alcohol, will continue to decline. The disruption to consumer spending patterns caused by growth in online shopping will continue. The online share of total retail spending could rise between 2018 and 2030 from 5% to 8% for food, from 10% to 22% for furnishings and from 18% to 32% for clothing. Introduction Consumer spending accounts for more than two-thirds of UK GDP and is therefore the most important driver of economic growth. And it has been strong consumer spending growth that has powered the recovery of the economy since But how sustainable is this spending in 2019 and 2020? Looking further ahead, which areas of consumer expenditure might grow the fastest over the next decade? To answer these questions, we have looked at past trends and future prospects for the two main determinants of household spending growth: Real household disposable income (RHDI) growth, which is turn is driven by trends in real employment, state benefits and pensions and other private income such as share dividends; and Changes in the household savings ratio, which are particularly influenced by the relative indebtedness of households and wealth effects (e.g. from changes in house prices). We also consider the outlook for growth in online retail and consider what proportion of several of the main consumer spending categories could be generated by online sales in the coming years. The discussion is structured as follows: Section 3.1 provides an overview of recent trends in each of the key determinants of RHDI growth; Section 3.2 looks at potential future trends in household disposable income growth; Section 3.3 examines past trends and future prospects for the household savings ratio; Section 3.4 brings these analyses together to set out our main scenario for future consumer spending growth and assess risks around this as captured in alternative scenarios; Section 3.5 considers how consumer spending growth might vary by expenditure category over the period to 2030; Section 3.6 focuses on growth in online retail and projects the proportion of sales that may be accounted for by online shopping in the future; and Section 3.7 summarises key findings from the research. 1 This section was written by Mike Jakeman. 18 UK Economic Outlook March 2019
2 3.1 Recent trends in household disposable income The ONS defines household disposable income as the sum of earnings, state transfers (e.g. benefits) minus direct taxes (such as income tax and national insurance) and other net income accruing to households (e.g. from interest, dividends and rents). Table 3.1 shows how the most important elements of household disposable income have changed over the six years to Q During this period the economy recovered on a more sustained basis from the global financial crisis. By the final quarters of this period, the unemployment rate was down to multi-decade lows of around 4% and nominal wage growth had begun to accelerate in response. Real growth rates in the final column of the table have been calculated by deflating the nominal growth rates using the household expenditure deflator (which averaged 1.7% a year in the six years to Q3 2018). The most notable feature of this analysis is that RHDI growth stood at around 1.5% a year on average, while household expenditure grew 0.7 percentage points faster, at 2.2% a year. The difference between income and expenditure is savings; and when expenditure grows faster than income this difference diminishes, manifested in a lower ratio of savings to income. Accordingly, the household saving ratio (adjusted to exclude changes in pension entitlements) fell from around 5% of household disposable income in Q to 1.5% in Q Table 3.1: Key drivers of real household disposable income (RHDI) billion Average growth rates per year 2012 Q Q3 Nominal Deflator Real Wages and salaries % 1.7% 1.8% Household share of gross operating profits % 1.7% 2.6% Pre-tax earnings % 1.7% 2.0% Income tax paid % 1.7% 2.4% National insurance contribution by workers % 1.7% 1.7% Post-tax earnings % 1.7% 2% Social security benefits % 1.7% 0.0% Post-tax earnings and benefits % 1.7% 1.4% Net property income received (interest, dividends, rent etc.) % 1.7% 2.8% Net current transfers % 1.7% -0.1% Household disposable income % 1.7% 1.5% Adjustment for change in pensions entitlements % 1.7% -7.1% Available household resources % 1.7% 1.2% Memo: Household expenditure % 1.7% 2.2% Source: PwC analysis of ONS data Note: Totals may not round exactly to the sum of the sub-categories owing to rounding UK Economic Outlook March
3 Table 3.1 shows that wages and salaries grew by 1.8% a year in real terms over the period, supported by a fall in the unemployment rate from 7.9% to 4.1% in this time. However, this was outstripped by the profits earned by self-employed workers and business owners, which rose at an annual average rate of 2.6% during the six years. Within this period there was a pronounced shift towards self-employment and small business creation in , when self-employment grew by 10% and regular employment by 5%. This divergence was encouraged by the greater ability of small firms to compete through the internet and mobile technology, the rise of the gig economy, generally lower national insurance rates paid by the self-employed and a broader push to boost entrepreneurship by successive governments. By contrast, between 2015 and 2018, regular employment has grown by 5%, while self-employment has been flat, perhaps because an underlying preference for regular employment remained and this reasserted itself as the labour market tightened and wages increased. These shifting trends have resulted in slightly slower growth in national insurance contributions relative to wage growth and slightly faster growth in income tax payments. Table 3.1 also shows areas that have dampened growth in RHDI over the period: Social security benefits: this category has shown no growth at all in real terms since Although total state pension expenditure has grown relatively strongly at a real annual average rate of 2.3% during , there has been a freeze on working-age benefits in nominal terms 2. Net current transfers: this income category includes transfers to and from UK households in the form of financial gifts (e.g. to and from overseas family members) and some insurance claims, but excludes government transfers. The data in this category are volatile with no apparent trend. Transfers are also a comparatively small component of household income (around 4%), so the effect on overall growth is small. The final row in Table 3.1 shows that total real household resources grew by 1.2% a year after taking into account the change in pension fund entitlements (referred to as net equity in pension funds in the national accounts). However, such changes in pension values are unlikely to be perceived by most households as income that can be spent, so we prefer to remove this from our analysis and instead focus on an adjusted household saving ratio defined as the difference between household disposable income and household expenditure, expressed as a percentage of disposable income. This is lower than the standard ONS definition based on household resources rather than disposable income, but provides a more realistic indication of the difference between household income and spending. 2 Department for Work & Pensions Expenditure Caseload forecasts (2018). 20 UK Economic Outlook March 2019
4 3.2 Future trends in household disposable income How will household disposable incomes fare in the future? There are many uncertainties here, but Table 3.2 sets out what, assuming a reasonably orderly Brexit, we consider to be a plausible main scenario for real growth to 2020 for each of the main elements of household disposable income growth. In particular we assume that: Total income from wages and salaries will grow at a reasonable real rate of 3% in 2019 and 2.9% in 2020, owing to a tight labour market that will put upward pressure on remuneration and slower inflation that will be roughly in line with the Bank of England s 2% year-on-year target (as discussed further in Section 2 above). Income of households from gross operating profits will struggle to match the growth in salaries, as the demand for workers from companies will continue to draw potential employees away from self-employment. Income tax receipts will grow broadly in line with wages and salaries. Social security benefits will rise by just 0.3% in 2019 and 0.2% in 2020 owing to the government s continued welfare cap for working age benefits. In the medium and long term we expect the average rate of benefits growth to be a little stronger, driven by the expanding number of people accessing the state pension (offset in part by planned rises in the state pension age). But even then growth is likely to be relatively modest in real terms as welfare reform programmes continue. Table 3.2: Main scenario projections of RHDI growth Net property income growth will be particularly sluggish in 2019 as the housing market loses momentum. Faster growth is possible thereafter, but this will be constrained by the Bank of England gradually increasing its policy rate, which will result in more expensive mortgage repayments. Based on these assumptions, we project that RHDI growth will accelerate slightly to 1.8% in 2019 and 2% in 2020, up from 1.7% in 2018 and just 0.5% in This mostly reflects the continued strong labour market in our main scenario. In the long term we expect RHDI growth to settle between around 1.5% and 2% a year, weaker than in the period before the global financial crisis, but also significantly stronger than in the years immediately afterwards e 2019p 2020p Wages and salaries 1.8% 2.2% 3.0% 2.9% Household share of gross operating profits -0.9% 2.3% 3.1% 2.3% Pre-tax earnings 1.0% 2.3% 3.0% 2.7% Income tax paid 2.9% 2.4% 3.7% 2.4% National insurance contribution by workers 1.2% 2.7% 3.6% 3.0% Post-tax earnings 0.5% 2.1% 2.7% 2.8% Social security benefits 0.0% -0.6% 0.3% 0.2% Post-tax earnings and benefits 0.3% 1.3% 2.0% 2.0% Net property income received (interest, dividends, rent etc.) -3.9% 3.1% 0.7% 2.0% Net current transfers 24.7% 5.6% 3.5% 1.6% Household disposable income 0.5% 1.7% 1.8% 2.0% Source: PwC analysis of ONS data for and PwC projections for all growth rates are expressed in real terms UK Economic Outlook March
5 3.3 Household saving ratio: trends and projections The official household savings ratio is defined by the ONS as the difference between available household resources (household disposable income plus an adjustment for the change in pension entitlements as measured by net equity in pension funds) and household expenditure, expressed as a proportion of household resources. As noted above, we prefer to focus on an adjusted savings ratio that excludes changes in net equity in pension funds. Figure 3.1 shows how this adjusted ratio compares to the standard ONS headline measure. Both saving ratios show broadly similar trends over time, but at much lower levels for the adjusted savings rate. The latter fell from around 5% at the turn of the millennium to as a low as -0.2% before the onset of the financial crisis. This period saw consistent economic growth and easy credit conditions, which allowed house prices and household debt levels to rise. Following the shock of the post-crisis recession, household confidence and borrowing slumped and the adjusted savings ratio jumped to more than 6% on average in Since the end of the recession, however, the ratio has fallen back again as confidence and consumer borrowing have revived, although it has been volatile from quarter to quarter. The latest adjusted savings ratio for Q is estimated to be around 1.4%, which is still some way above pre-crisis lows, but also well below post-crisis highs. So what might be the future direction of the household savings ratio? Figure 3.1 Historical trends in headline and adjusted UK household savings ratios % Headline savings ratio (with net equity) Source: PwC analysis of ONS data Projecting forward the savings ratio is subject to considerable uncertainties, reflecting the fact that it is determined by the difference between two much larger numbers: gross disposable income and consumer spending. To address this issue we generated two additional scenarios in addition to our main scenario projections. In our main scenario, a combination of faster nominal wage growth, slightly lower inflation, a softer housing market and some Brexit-related consumer caution push up the savings rate to around 2% by 2020, from an estimated 1.3% in Adjusted savings ratio (without net equity) Table 3.3: Projections of the adjusted household savings ratio in alternative PwC scenarios (% of household disposable income) e 2019p 2020p Lower savings ratio 1.4% 1.1% 0.6% 0.6% Main scenario 1.4% 1.3% 1.7% 2.0% Higher savings ratio 1.4% 1.5% 2.8% 3.5% Source: PwC analysis based on ONS data for Q3 22 UK Economic Outlook March 2019
6 3.4 Alternative scenarios for consumer spending growth to 2030 We now combine our household disposable income projections from Table 3.2 with our alternative savings ratio scenarios from Table 3.3 to derive scenarios for real consumer spending growth to We also make illustrative further assumptions on longer growth in spending to Specifically, as set out in Tables : Our main scenario projects real household consumer spending growth to slow down from 1.9% in 2018 to 1.4% in 2019, followed by a mild acceleration to 1.7% in The main factor behind the moderation in growth in 2019 is weakening consumer confidence in the first half of the year owing to broader worries about how Brexit will affect the economy. So far, household spending growth has been remarkably resilient to political turmoil, but we believe that this has become sufficiently acute in early 2019 to trigger more cautious expenditure. Data from our 2019 Retail Outlook report supports this argument, with the proportion of consumers reporting that Brexit will affecting their spending rising to 40%, from 27% in Yet on the assumption that an orderly withdrawal from the EU is achieved, spending growth ought to be stronger in the second half of the year and in We note that RHDI growth is likely to accelerate in , and that this contributes to a slightly higher savings rate. In the longer term, consumer spending growth is likely to return to around 1.8% a year in the 2020s. This is consistent with our estimate for longer term economic growth. Table 3.4: Main scenario projections of growth in real household expenditure (% per year) e 2019p 2020p Average p Real household expenditure 2.1% 1.9% 1.4% 1.7% 1.8% Real household disposable income 0.5% 1.7% 1.8% 2.0% Adjusted savings ratio 1.4% 1.3% 1.7% 2.0% Sources: ONS for Q3. PwC estimates and projections for later periods. The figures for are illustrative assumptions for consumer spending only based on alternative views of long-term trends in GDP growth Table 3.5: Optimistic scenario projections of growth in real household expenditure (% per year) e 2019p 2020p Average p Real household expenditure 2.1% 2.1% 2.4% 2.4% 2.3% Real household disposable income 0.5% 1.7% 2.0% 2.3% Adjusted savings ratio 1.4% 1.1% 0.6% 0.6% Sources: ONS for Q3. PwC estimates and projections for later periods. The figures for are illustrative assumptions for consumer spending only based on alternative views of long-term trends in GDP growth Table 3.6: Pessimistic scenario projections of growth in real household expenditure (% per year) e 2019p 2020p Average p Real household expenditure 2.1% 1.6% 0.2% 0.6% 1.3% Real household disposable income 0.5% 1.7% 1.6% 1.3% Adjusted savings ratio 1.4% 1.5% 2.8% 3.5% Sources: ONS for Q3. PwC estimates and projections for later periods. The figures for are illustrative assumptions for consumer spending only based on alternative views of long-term trends in GDP growth Our optimistic scenario assumes that households enjoy the benefit of faster wage growth and that Brexitrelated developments do not alter their spending decisions. This acceleration of the existing trend lowers the adjusted savings rate to an annual average of 0.6% in , which would be a record low in the modern era. In the long term, we assume that RHDI grows faster than the main scenario due to higher UK productivity growth and so supports average real household expenditure growth of around 2.5% a year in the 2020s. Our pessimistic scenario assumes that the saving ratio rises to 2.8% in 2019 and then increases further in 2020 while disposable income growth is unimpressive. This type of scenario could be associated with UK consumers being less confident owing to a deteriorating global economy and an unsatisfactory conclusion to the Brexit negotiations, together with weak UK productivity growth in the long term, beyond Retail Outlook (PwC, February 2019): UK Economic Outlook March
7
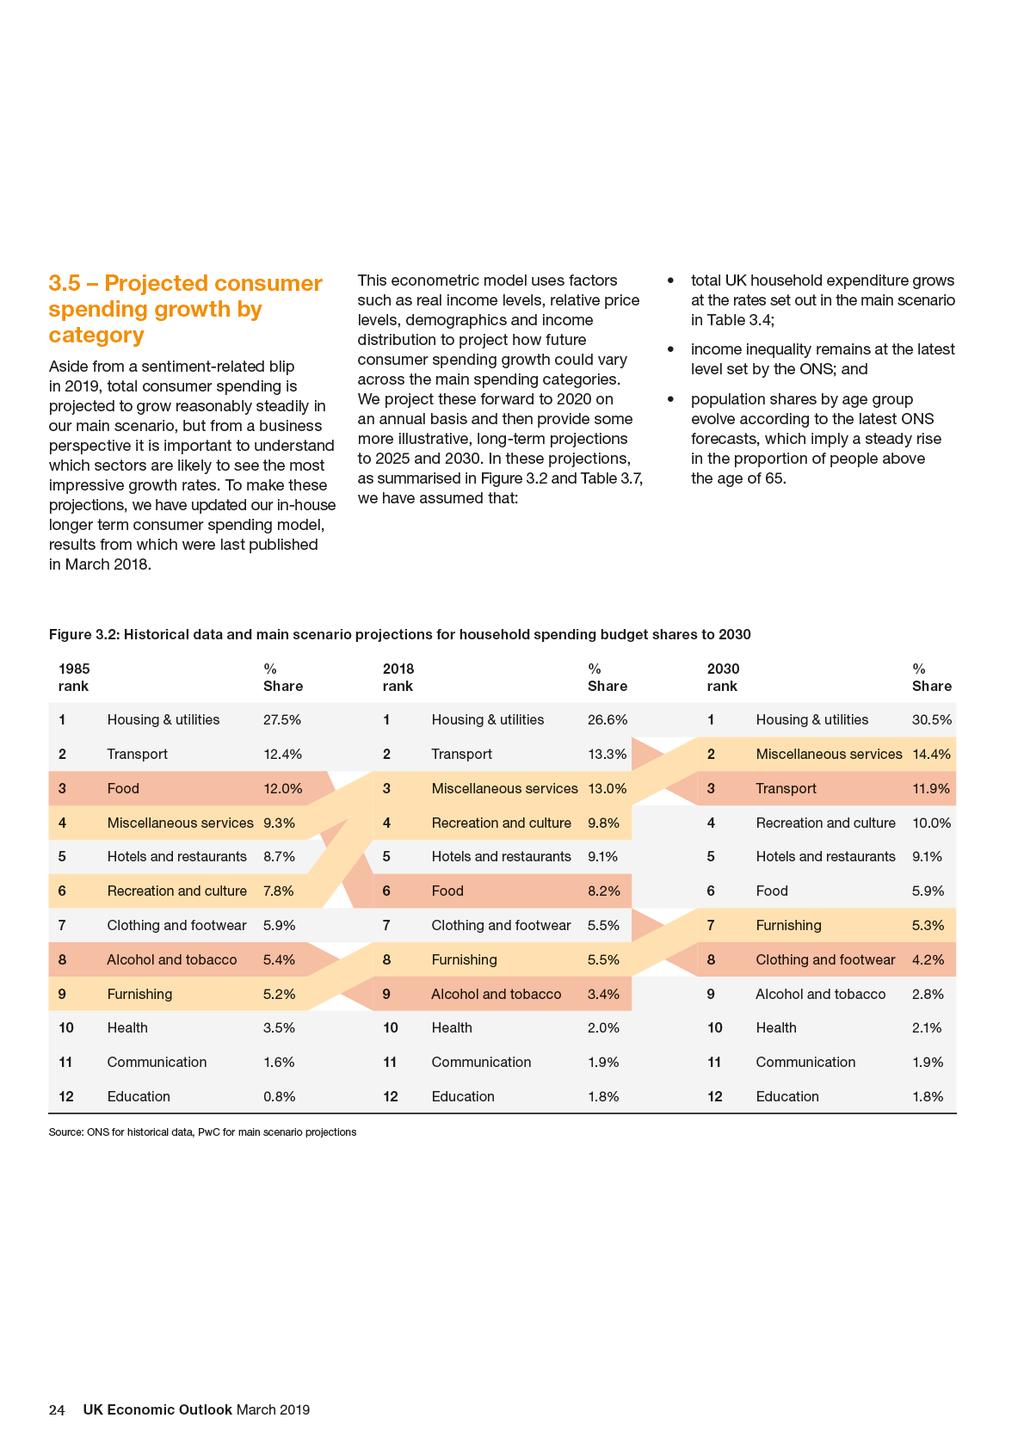
8 Table 3.7: Household budget share projections to 2030 and implied average annual real growth rates by household spending category in our main scenario Shares of total spending Implied average real growth rates 2018e 2025p 2030p p p Housing and utilities 26.6% 28.5% 30.5% 2.2% 2.6% Transport 13.3% 12.6% 11.9% 1.0% 0.5% Miscellaneous services 13.0% 13.9% 14.4% 2.3% 1.9% Recreation and culture 9.8% 10.0% 10.0% 1.8% 1.4% Hotels and restaurants 9.1% 9.1% 9.1% 1.5% 1.5% Food 8.2% 6.9% 5.9% -0.4% -1.0% Clothing and footwear 5.5% 4.7% 4.2% -0.1% -0.4% Furnishings 5.5% 5.4% 5.3% 1.5% 1.0% Alcohol and tobacco 3.4% 3.0% 2.8% 0.4% 0.2% Health 2.0% 2.0% 2.1% 1.7% 2.0% Communications 1.9% 1.9% 1.9% 1.8% 1.5% Education 1.8% 1.8% 1.8% 1.5% 1.4% Total spending 100% 100% 100% 1.7% 1.8% Source: PwC analysis of ONS data for and PwC projections for all growth rates are expressed in real terms Figure 3.2 shows that, by 2030, we estimate that households will need to allocate over 30% of their spending to housing and utilities, compared with around 27% at present. This reflects our expectation, based on past research, that supply shortages will keep house prices and rents rising relatively rapidly in real terms. Indeed, the average real growth rate of housing and utilities spending in both and is expected to be the fastest of all categories in Table 3.7. The miscellaneous services category, which includes financial services (such as credit cards and insurance) and personal care, is expected to become the second largest expenditure category in the period between 2018 and 2025, displacing transport. We expect its share to continue to rise in the years to 2030, so that it accounts for around 14% of total spending by that year. This is intuitive as we expect the Bank of England to raise interest rates gradually in the medium term in our main scenario, and insurance premiums, including tax, may also tend to increase. Reflecting the UK s status as a highincome economy, the two leisure categories recreation and culture and hotels and restaurants are also relatively income-elastic, and so tend to increase their share of total spending as RDHI grows over time. In contrast, necessities such as food and clothing will tend to see their spending shares decline in the long run, continuing the historic trends shown in Figure 3.2. These are also industries where prices have fallen owing to the development of highly efficient and sophisticated supply chains. Particularly in the case of food, however, there could be some volatility around this declining trend owing to fluctuations in harvest size and exchange rates. The transport sector is also expected to see a fall in its budgetary share in the long term, although it may still see some modest growth in real terms. The decline reflects both an ageing population and a fall in the proportion of younger adults with driving licences, coupled with the growth of internet shopping (see Section 3.6), food delivery companies and disruptive entrants into the transport sector (such as Uber) which are expected to impact on transport spend per person. UK Economic Outlook March
9
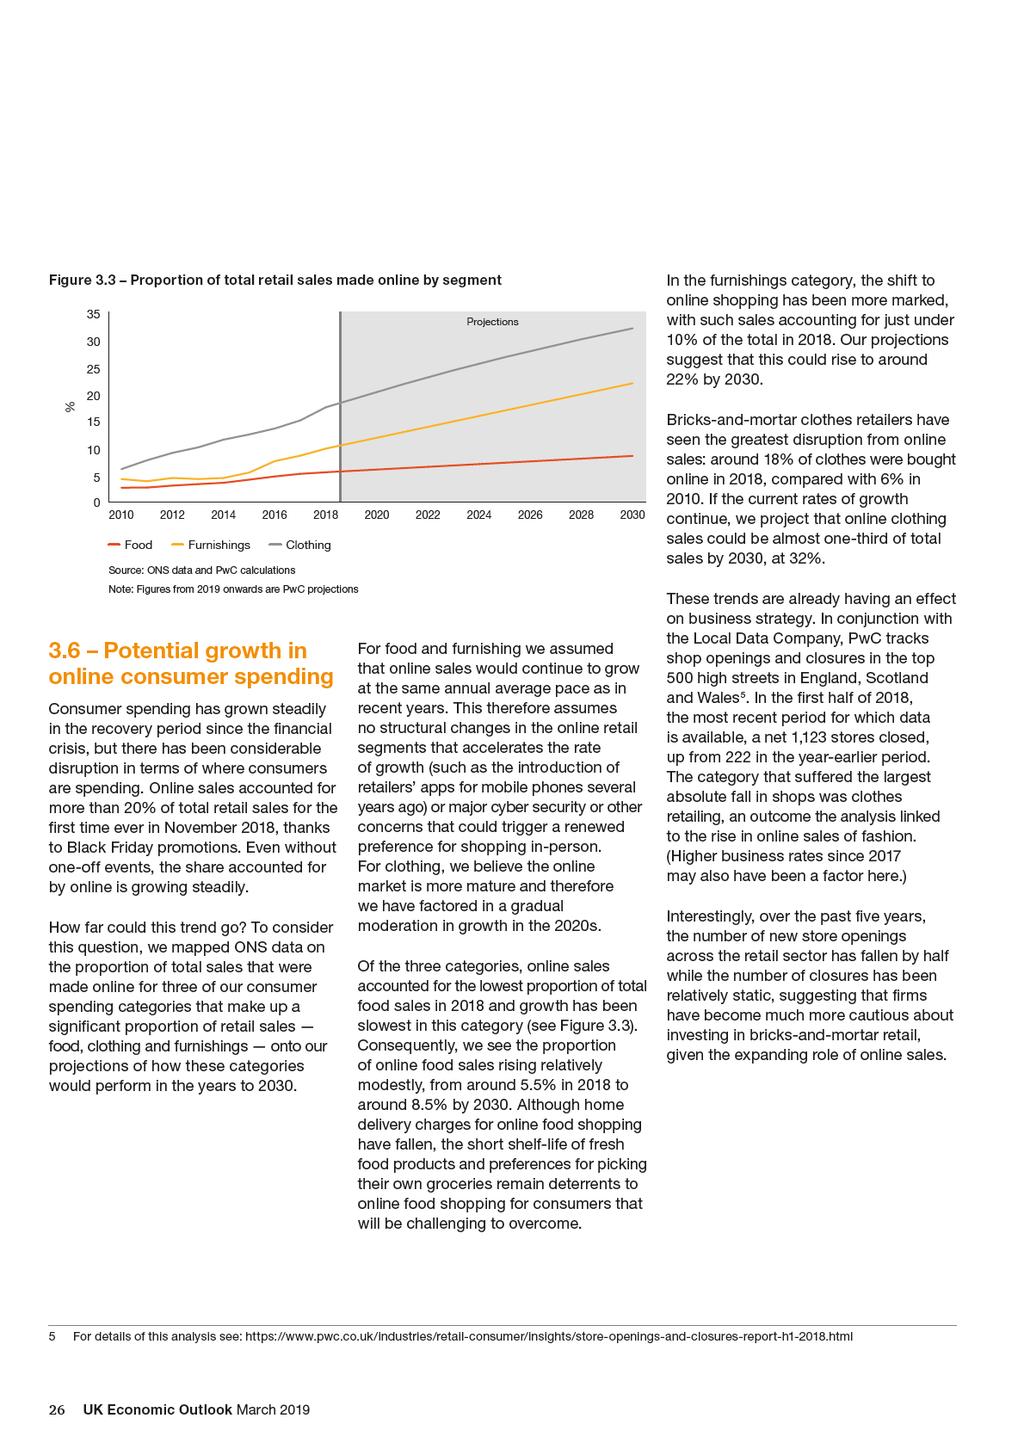
10 3.7 Summary and conclusions Over the past six years, household spending has tended to outpace consumer price inflation and support the UK s recovery from the global financial crisis, helped by continued low interest rates, strong employment growth and a willingness of households to borrow more. However, growth in consumer spending has also slowed since 2016 because of the effects of a weaker pound and rising inflation on real wage growth. These effects are beginning to fade, ut we expect more subdued growth in house prices and uncertainties about the Brexit process to mean that household spending growth slows for another year in At the same time, assuming a reasonably orderly Brexit, the labour market is likely to continue to tighten, with firms having to pay ever higher wages to attract new employees. This means that RDHI growth should accelerate in 2019 and again in Slower growth in spending and faster growth in income means that the adjusted saving ratio which had been in long-term decline could receive at least a temporary boost in these years. In our main scenario, we therefore project that real consumer spending will slow from around 1.9% in 2018 to 1.4% in 2019, before returning to its trend growth of around 1.8% on average in the 2020s. Other scenarios show long-term real consumer spending growth of between around 1.3% and 2.3% a year over the period to We expect that housing and utilities will absorb a larger and larger share of household spending, rising above the 30% threshold by 2030, from less than 27% in We also expect to see financial services and personal care account for a greater proportion of spending in the same period, while more basic categories, such as food, clothing and alcohol will see their shares decline. Social and industrial changes are likely to drive particular disruption in the transport category. Where transport was once accounting for a rising share of spending in the 30 years to 2018, this trend is projected to reverse in the years to Online sales are likely to become an even more important part of consumer spending in the long term. The proportion of sales conducted online doubled in each of the food, furnishing and clothing categories between 2010 and Assuming no structural change that accelerates the rate of growth from recent levels (or major cyber security or other concerns that trigger a significant slowdown or decline), we estimate that the online proportion of retail spending in each of these segments could rise between 2018 and 2030 from 5% to 8% for food, from 10% to 22% for furnishings and from 18% to 32% for clothing. UK Economic Outlook March
11 At PwC, our purpose is to build trust in society and solve important problems. PwC is a network of firms in 158 countries with more than 236,000 people who are committed to delivering quality in assurance, advisory and tax services. Find out more and tell us what matters to you by visiting us at This publication has been prepared for general guidance on matters of interest only, and does not constitute professional advice. You should not act upon the information contained in this publication without obtaining specific professional advice. No representation or warranty (express or implied) is given as to the accuracy or completeness of the information contained in this publication, and, to the extent permitted by law, PricewaterhouseCoopers LLP, its members, employees and agents do not accept or assume any liability, responsibility or duty of care for any consequences of you or anyone else acting, or refraining to act, in reliance on the information contained in this publication or for any decision based on it PricewaterhouseCoopers LLP. All rights reserved. In this document, PwC refers to the UK member firm, and may sometimes refer to the PwC network. Each member firm is a separate legal entity. Please see for further details. The Design Group (03/19)
Highlights and key messages for business and public policy
 Highlights and key messages for business and public policy Key projections 2019 2020 Real GDP growth 1.1% 1.6% Consumer spending growth 1.4% 1.7% Fixed investment growth -1.0% 2.1% Inflation (CPI) 1.8%
3 The outlook for consumer spending and the impact of automation 1
 3 The outlook for consumer spending and the impact of automation 1 Key points Consumer spending slowed during 2017, but has nonetheless grown by an average of 2.3 percentage points per annum faster than
Highlights and key messages for business and public policy
 Highlights and key messages for business and public policy Key projections 2018 2019 Real GDP growth 1.5% 1.6% Consumer spending growth 1.1% 1.3% Inflation (CPI) 2.7% 2.3% Source: PwC main scenario projections
4 Regional growth trends and prospects 1
 4 Regional growth trends and prospects 1 Key points has consistently outperformed other UK regions for most of the past two decades in terms of economic growth, both before and after the global financial
Highlights and key messages for business and public policy
 Highlights and key messages for business and public policy Key projections 2018 2019 Real GDP growth 1.5% 1.6% Consumer spending growth 1.1% 1.3% Inflation (CPI) 2.7% 2.3% Source: PwC main scenario projections
Value of debt stock ( trillion at end of 2017)
") We consider this change in behaviour has its origins in both demand and supply factors. On the demand side, several years of improvement in the labour market boosted consumer confidence, while the introduction
We consider this change in behaviour has its origins in both demand and supply factors. On the demand side, several years of improvement in the labour market boosted consumer confidence, while the introduction
UK Economic Outlook March 2017
 www.pwc.co.uk/economics Contents 1 2 3 4 Global outlook UK economic trends and prospects Consumer spending prospects after Brexit Will robots steal our jobs? 2 Global growth in 2017 should be slightly
Monthly Economic Review
 Monthly Economic Review FEBRUARY 2018 Based on January 2018 data releases Bedfordshire Chamber of Commerce Headlines UK GDP growth picked up in Q4, driven by stronger output from the services sector The
Philip Lowe: Changing patterns in household saving and spending
 Philip Lowe: Changing patterns in household saving and spending Speech by Mr Philip Lowe, Assistant Governor (Economic) of the Reserve Bank of Australia, to the Australian Economic Forum 2011, Sydney,
Finland falling further behind euro area growth
 BANK OF FINLAND FORECAST Finland falling further behind euro area growth 30 JUN 2015 2:00 PM BANK OF FINLAND BULLETIN 3/2015 ECONOMIC OUTLOOK Economic growth in Finland has been slow for a prolonged period,
Asda Income Tracker. Report: December 2015 Released: January Centre for Economics and Business Research ltd
 Asda Income Tracker Report: December 2015 Released: January 2016 M a k i n g B u s i n e s s S e n s e Centre for Economics and Business Research ltd Unit 1, 4 Bath Street, London EC1V 9DX t 020 7324 2850
Legal services sector forecasts
 www.lawsociety.org.uk Legal services sector forecasts 2017-2025 August 2018 Legal services sector forecasts 2017-2025 2 The Law Society of England and Wales August 2018 CONTENTS SUMMARY OF FORECASTS 4
UK Economic Outlook July 2017
 www.pwc.co.uk/economics Contents 1 2 3 4 Global outlook UK economic trends and prospects UK housing market outlook Nowcasting current GDP growth PwC 2 Global growth in 2017 should be slightly stronger
INFLATION REPORT PRESS CONFERENCE. Thursday 10 th May Opening Remarks by the Governor
 INFLATION REPORT PRESS CONFERENCE Thursday 10 th May 2018 Opening Remarks by the Governor Three months ago, the MPC said that an ongoing tightening of monetary policy over the next few years would be appropriate
The Deloitte Consumer Tracker Consumer confidence rises, underlying caution remains
 The Deloitte Consumer Tracker Consumer confidence rises, underlying caution remains Q1 2018 Contents Q1 2018 at a glance Overall consumer confidence (q/q)* Previous Latest -7% -6% Consumer confidence Deloitte
The UK economic and fiscal outlook
 The UK economic and fiscal outlook Report for StepChange Debt Charity Centre for Economics and Business Research ltd Contents Executive summary 3 Global economic outlook 4 UK economic outlook 8 UK regional
Structural changes in the Maltese economy
 Structural changes in the Maltese economy Article published in the Annual Report 2014, pp. 72-76 BOX 4: STRUCTURAL CHANGES IN THE MALTESE ECONOMY 1 Since the global recession that took hold around the
Outlook for the Hawai'i Economy
 Outlook for the Hawai'i Economy May 3, 2001 Dr. Carl Bonham University of Hawai'i Economic Research Organization Summary The Hawaii economy entered 2001 in its best shape in more than a decade. While the
Structural Changes in the Maltese Economy
 Structural Changes in the Maltese Economy Dr. Aaron George Grech Modelling and Research Department, Central Bank of Malta, Castille Place, Valletta, Malta Email: grechga@centralbankmalta.org Doi:10.5901/mjss.2015.v6n5p423
Asda Income Tracker. Report: June 2012 Released: July Centre for Economics and Business Research ltd
 Asda Income Tracker Report: June 2012 Released: July 2012 M a k i n g B u s i n e s s S e n s e Centre for Economics and Business Research ltd Unit 1, 4 Bath Street, London EC1V 9DX t 020 7324 2850 w www.cebr.com
Economic ProjEctions for
 Economic Projections for 2016-2018 ECONOMIC PROJECTIONS FOR 2016-2018 Outlook for the Maltese economy 1 Economic growth is expected to ease Following three years of strong expansion, the Bank s latest
Haruhiko Kuroda: Japan s economy and monetary policy
 Haruhiko Kuroda: Japan s economy and monetary policy Speech by Mr Haruhiko Kuroda, Governor of the Bank of Japan, at a meeting with business leaders, Osaka, 28 September 2015. Introduction * * * It is
BANK OF FINLAND ARTICLES ON THE ECONOMY
 BANK OF FINLAND ARTICLES ON THE ECONOMY Table of Contents Global economy to grow steadily 3 FORECAST FOR THE GLOBAL ECONOMY Global economy to grow steadily TODAY 1:00 PM BANK OF FINLAND BULLETIN 1/2017
Economic Projections :2
 Economic Projections 2018-2020 2018:2 Outlook for the Maltese economy Economic projections 2018-2020 The Central Bank s latest economic projections foresee economic growth over the coming three years to
Asda Income Tracker. Report: March 2012 Released: April Centre for Economics and Business Research ltd
 Asda Income Tracker Report: March 2012 Released: April 2012 M a k i n g B u s i n e s s S e n s e Centre for Economics and Business Research ltd Unit 1, 4 Bath Street, London EC1V 9DX t 020 7324 2850 w
Gauging Current Conditions:
 Gauging Current Conditions: The Economic Outlook and Its Impact on Workers Compensation Vol. 2 2005 The gauges below indicate the economic outlook for the current year and for 2006 for factors that typically
The Deloitte Consumer Tracker. Confidence remains undented Q Key indicators. Authors -5% -6% -4% -4% +5% +12% -2% 0% -1.1% +7.1% +0.2% +1.
 Q4 The Deloitte Consumer Tracker Confidence remains undented In a sign that consumer sentiment has remained resilient following the Brexit vote, the latest Deloitte Consumer Tracker shows that despite
4 Does trade hold the key to the UK services productivity puzzle? 1
 4 Does trade hold the key to the UK services productivity puzzle? 1 Introduction and summary The UK economy is a highly servicesoriented economy. Services make up over three-quarters of GDP and over 80%
Asda Income Tracker. Report: November 2017 Released: December Centre for Economics and Business Research ltd
 Asda Income Tracker Report: November 2017 Released: December 2017 M a k i n g B u s i n e s s S e n s e Centre for Economics and Business Research ltd Unit 1, 4 Bath Street, London EC1V 9DX t 020 7324
a labour market that has continued to exhibit strong growth in employment, but weak growth in earnings and productivity; and
 1 Executive summary 1.1 Twice a year at the OBR, we provide a detailed central forecast for the economy and the public finances. These forecasts provide a transparent benchmark against which to judge the
Japan's Economy and Monetary Policy
 September 28, 2015 B ank of Japan Japan's Economy and Monetary Policy Speech at a Meeting with Business Leaders in Osaka Haruhiko Kuroda Governor of the Bank of Japan (English translation based on the
The international environment
 The international environment This article (1) discusses developments in the global economy since the August 1999 Quarterly Bulletin. Domestic demand growth remained strong in the United States, and with
Figure 2.3 Purchasing Managers Indices of business activity. Figure 2.4 US dollar and euro exchange rates against the pound.
 Prior to 20, consumer spending was a key driver of GDP growth, but this was achieved in part by running up ever higher debts. We explore this further in our latest Precious Plastic report 2, which highlighted
Asda Income Tracker. Report: December 2012 Released: January Centre for Economics and Business Research ltd
 Asda Income Tracker Report: December 2012 Released: January 2013 M a k i n g B u s i n e s s S e n s e Centre for Economics and Business Research ltd Unit 1, 4 Bath Street, London EC1V 9DX t 020 7324 2850
Summary and Economic Outlook
 Pentti Vartia Managing director Pasi Sorjonen Head of forecasting group 1.1 Summary The world economy started to recover rapidly at the start of the year. Despite this rebound in activity, near-term growth
Potential Output in Denmark
 43 Potential Output in Denmark Asger Lau Andersen and Morten Hedegaard Rasmussen, Economics 1 INTRODUCTION AND SUMMARY The concepts of potential output and output gap are among the most widely used concepts
Economic Projections for
 Economic Projections for 2015-2017 Article published in the Quarterly Review 2015:3, pp. 86-91 7. ECONOMIC PROJECTIONS FOR 2015-2017 Outlook for the Maltese economy 1 The Bank s latest macroeconomic projections
Monthly Economic Review
 Monthly Economic Review DECEMBER 2017 Based on November 2017 data releases Bedfordshire Chamber of Commerce Headlines UK GDP growth in Q3 unrevised as business investment and the UK s trade position weakens
FISCAL COUNCIL OPINION ON THE SUMMER FORECAST 2018 OF THE MINISTRY OF FINANCE
 FISCAL COUNCIL OPINION ON THE SUMMER FORECAST 2018 OF THE MINISTRY OF FINANCE September 2018 Contents Opinion... 3 Explanatory Report... 4 Opinion on the summer forecast 2018 of the Ministry of Finance...
Insolvency forecasts. Economic Research August 2017
 Insolvency forecasts Economic Research August 2017 Summary We present our new insolvency forecasting model which offers a broader scope of macroeconomic developments to better predict insolvency developments.
Economic Projections :1
 Economic Projections 2017-2020 2018:1 Outlook for the Maltese economy Economic projections 2017-2020 The Central Bank s latest economic projections foresee economic growth over the coming three years to
Koji Ishida: Japan s economy, price developments and monetary policy
 Koji Ishida: Japan s economy, price developments and monetary policy Speech by Mr Koji Ishida, Member of the Policy Board of the Bank of Japan, at a meeting with business leaders, Fukuoka, 18 February
Asda Income Tracker. Report: January 2012 Released: February Centre for Economics and Business Research ltd
 Asda Income Tracker Report: January 2012 Released: February 2013 M a k i n g B u s i n e s s S e n s e Centre for Economics and Business Research ltd Unit 1, 4 Bath Street, London EC1V 9DX t 020 7324 2850
LABOUR MARKET DEVELOPMENTS IN THE EURO AREA AND THE UNITED STATES SINCE THE BEGINNING OF THE GLOBAL FINANCIAL CRISIS
 Box 7 LABOUR MARKET IN THE EURO AREA AND THE UNITED STATES SINCE THE BEGINNING OF THE GLOBAL FINANCIAL CRISIS This box provides an overview of differences in adjustments in the and the since the beginning
LESS DYNAMIC GROWTH AMID HIGH UNCERTAINTY
 OVERVIEW: The European economy has moved into lower gear amid still robust domestic fundamentals. GDP growth is set to continue at a slower pace. LESS DYNAMIC GROWTH AMID HIGH UNCERTAINTY Interrelated
2015: FINALLY, A STRONG YEAR
 2015: FINALLY, A STRONG YEAR A Cushman & Wakefield Research Publication U.S. GDP GROWTH IS ACCELERATING 4% 3.5% Percent Change Annual Rate 2% 0% -2% -4% -5.4% -0.5% 1.3% 3.9% 1.7% 3.9% 2.7% 2.5% -1.5%
Global PMI. Solid Q2 growth masks widening growth differentials. July 7 th IHS Markit. All Rights Reserved.
 Global PMI Solid Q2 growth masks widening growth differentials July 7 th 2017 2 Widening developed and emerging world growth trends The global economy enjoyed further steady growth in June, according to
Asda Income Tracker. Report: July 2016 Released: August Centre for Economics and Business Research ltd
 Asda Income Tracker Report: July 2016 Released: August 2016 M a k i n g B u s i n e s s S e n s e Centre for Economics and Business Research ltd Unit 1, 4 Bath Street, London EC1V 9DX t 020 7324 2850 w
Regulatory Announcement RNS Number: RNS to insert number here Québec 27 November, 2017
 ISSN 1718-836 Regulatory Announcement RNS Number: RNS to insert number here Québec 27 November, 2017 Re: Québec Excerpts from The Quebec Economic Plan November 2017 Update, Québec Public Accounts 2016-2017
MINUTES OF THE MONETARY POLICY COMMITTEE MEETING 7 AND 8 OCTOBER 2009
 Publication date: 21 October 2009 MINUTES OF THE MONETARY POLICY COMMITTEE MEETING 7 AND 8 OCTOBER 2009 These are the minutes of the Monetary Policy Committee meeting held on 7 and 8 October 2009. They
Monthly Bulletin of Economic Trends: Review of the Australian Economy
 MELBOURNE INSTITUTE Applied Economic & Social Research Monthly Bulletin of Economic Trends: Review of the Australian Economy March 2018 Released on 22 March 2018 Outlook for Australia 1 Economic Activity
Northern Ireland Quarterly Sectoral Forecasts
 2017 Quarter 1 Northern Ireland Quarterly Sectoral Forecasts Forecast summary The Northern Ireland economy enjoyed a solid performance in 2016 with overall growth of 1.5%, the strongest rate of growth
Asda Income Tracker. Report: September 2015 Released: October Centre for Economics and Business Research ltd
 Asda Income Tracker Report: September 2015 Released: October 2015 M a k i n g B u s i n e s s S e n s e Centre for Economics and Business Research ltd Unit 1, 4 Bath Street, London EC1V 9DX t 020 7324
Economic Projections For 2014 And 2015
 Economic Projections For 2014 And 2015 Article published in the Quarterly Review 2014:3, pp. 77-81 7. ECONOMIC PROJECTIONS FOR 2014 AND 2015 Outlook for the Maltese economy 1 The Bank s latest macroeconomic
Lars Heikensten: Monetary policy and the economic situation
 Lars Heikensten: Monetary policy and the economic situation Speech by Mr Lars Heikensten, Governor of the Sveriges Riksbank, at Handelsbanken, Karlstad, 26 January 2004. * * * It is nice to meet a group
BCC UK Economic Forecast Q4 2015
 BCC UK Economic Forecast Q4 2015 David Kern, Chief Economist at the BCC The main purpose of the BCC Economic Forecast is to articulate a BCC view on economic topics that are relevant to our members, and
MACROECONOMIC FORECAST
 MACROECONOMIC FORECAST Autumn 2017 Ministry of Finance of the Republic of Bulgaria The Autumn macroeconomic forecast of the Ministry of Finance takes into account better performance of the Bulgarian economy
Corporate and Household Sectors in Austria: Subdued Growth of Indebtedness
 Corporate and Household Sectors in Austria: Subdued Growth of Indebtedness Stabilization of Corporate Sector Risk Indicators The Austrian Economy Slows Down Against the background of the renewed recession
SME Monitor Q aldermore.co.uk
 SME Monitor Q1 2014 aldermore.co.uk aldermore.co.uk Contents Executive summary UK economic overview SME inflation index one year review SME cost inflation trends SME business confidence SME credit conditions
Note de conjuncture n
 Note de conjuncture n 1-2005 Growth accelerates in 2004, expected to slow down in 2005 STATEC has just published Note de Conjoncture No. 1-2005. The first issue of the year serves as an "Annual Economic
HOUSEHOLD EXPENDITURE IN MALTA AND THE RPI INFLATION BASKET
 HOUSEHOLD EXPENDITURE IN MALTA AND THE RPI INFLATION BASKET Article published in the Quarterly Review 2018:3, pp. 33-40 BOX 2: HOUSEHOLD EXPENDITURE IN MALTA AND THE RPI INFLATION BASKET 1 In early 2018,
Economic Outlook, January 2015 January 9, Jeffrey M. Lacker President Federal Reserve Bank of Richmond
 Economic Outlook, January 2015 January 9, 2015 Jeffrey M. Lacker President Federal Reserve Bank of Richmond Virginia Bankers Association and Virginia Chamber of Commerce 2015 Financial Forecast Richmond,
UK Economic Outlook July 2018
 www.pwc.co.uk/economics UK Economic Outlook July 2018 Contents 1 2 3 4 Global outlook UK economic prospects UK housing market outlook Impact of AI and related technologies on jobs in the UK UK Economic
Monetary Policy Summary and minutes of the Monetary Policy Committee meeting ending on 15 March 2017
 Monetary Policy Summary and minutes of the Monetary Policy Committee meeting ending on 15 March 2017 Publication date: 16 March 2017 These are the minutes of the Monetary Policy Committee meeting ending
UK Economic Outlook July 2013
 www.pwc.co.uk UK Economic Outlook July 213 Feature articles: Is the UK housing market on the road to recovery? The trillion pound question are gilts the next bubble to burst? PwC firms help organisations
Incomes and inequality: the last decade and the next parliament
 Incomes and inequality: the last decade and the next parliament IFS Briefing Note BN202 Andrew Hood and Tom Waters Incomes and inequality: the last decade and the next parliament Andrew Hood and Tom Waters
Macroeconomic and financial market developments. March 2014
 Macroeconomic and financial market developments March 2014 Background material to the abridged minutes of the Monetary Council meeting 25 March 2014 Article 3 (1) of the MNB Act (Act CXXXIX of 2013 on
Economic projections
 Economic projections 2017-2020 December 2017 Outlook for the Maltese economy Economic projections 2017-2020 The pace of economic activity in Malta has picked up in 2017. The Central Bank s latest economic
OUTLOOK THE CHANGING STRUCTURE OF THE WA ECONOMY ABOUT OUTLOOK
 OUTLOOK July 2017 I Chamber of Commerce and Industry of Western Australia (Inc) THE CHANGING STRUCTURE OF THE WA ECONOMY ABOUT OUTLOOK Outlook is CCIWA s biannual analysis of the Western Australian economy.
The Deloitte Consumer Tracker Consumer confidence sees its largest increase in 18 months
 The Deloitte Consumer Tracker Consumer confidence sees its largest increase in 18 months Q3 The latest Deloitte Consumer Tracker shows that UK consumers have shrugged off postreferendum pessimism, with
In fiscal year 2016, for the first time since 2009, the
 Summary In fiscal year 216, for the first time since 29, the federal budget deficit increased in relation to the nation s economic output. The Congressional Budget Office projects that over the next decade,
EUROPEAN EXPORT INDEX Q4 2017
 EUROPEAN EXPORT INDEX Q4 2017 BDO EXPORT INDEX KEY FIGURES The BDO Export Indices are composite indicators which provide snapshots of the export markets in Europe s five largest economies Germany, UK,
Main Economic & Financial Indicators UK
 Main Economic & Financial Indicators UK 17 MAY 217 AKIKO DARVELL ASSOCIATE ECONOMIST ECONOMIC RESEARCH OFFICE (LONDON) T +44-()2-7577-1591 E akiko.darvell@uk.mufg.jp The Bank of Tokyo-Mitsubishi UFJ, Ltd.
2014 Annual Review & Outlook
 2014 Annual Review & Outlook As we enter 2014, the current economic expansion is 4.5 years in duration, roughly the average life of U.S. economic expansions. There is every reason to believe it will continue,
RÉMUNÉRATION DES SALARIÉS. ÉTAT ET ÉVOLUTION COMPARÉS 2010 MAIN FINDINGS
 RÉMUNÉRATION DES SALARIÉS. ÉTAT ET ÉVOLUTION COMPARÉS 2010 MAIN FINDINGS PART I SALARIES AND TOTAL COMPENSATION All other Quebec employees In 2010, the average salaries of Quebec government employees 1
The Deloitte Consumer Tracker Confidence pauses as consumers react to wider uncertainty
 2016 The Deloitte Consumer Tracker Confidence pauses as consumers react to wider uncertainty The latest Deloitte Consumer Tracker shows a fall in consumer confidence in the first quarter of 2016, a sign
The Budget and Economic Outlook: 2018 to 2028
 CONGRESS OF THE UNITED STATES CONGRESSIONAL BUDGET OFFICE The Budget and Economic Outlook: 2018 to 2028 Percentage of GDP 30 25 20 Outlays Actual Current-Law Projection Over the next decade, the gap between
Meeting with Analysts
 CNB s New Forecast (Inflation Report III/2018) Meeting with Analysts Karel Musil Prague, 3 August 2018 Outline 1. Assumptions of the forecast 2. The new macroeconomic forecast 3. Comparison with the previous
Business Outlook Survey
 Business Outlook Survey Results of the Autumn 15 Survey Vol. 12.3 9 October 15 The autumn Business Outlook Survey shows that firms expectations continue to diverge as they gradually adjust to an environment
Observation. January 18, credit availability, credit
 January 18, 11 HIGHLIGHTS Underlying the improvement in economic indicators over the last several months has been growing signs that the economy is also seeing a recovery in credit conditions. The mortgage
State of the Economy. Office of the Chief Economic Adviser
 State of the Economy Office of the Chief Economic Adviser October 2018 1 State of the Economy October 2018 State of the Economy Office of the Chief Economic Adviser October 2018 State of the Economy Dr
Economic Outlook
 2013-2014 Economic Outlook Published by: Department of Finance Province of New Brunswick P.O. Box 6000 Fredericton, New Brunswick E3B 5H1 Canada Internet: www.gnb.ca/0024/index-e.asp March 26, 2013 Cover:
RICS Economic Research
 RICS Economic Research / February 7 th 2014 Michael Hanley Economist www.rics.org/economics The Outlook for the Construction Sector Growth of 4% expected over 2014 Private housing and infrastructure to
Global PMI. Global economy buoyed by rising US strength. June 12 th IHS Markit. All Rights Reserved.
 Global PMI Global economy buoyed by rising US strength June 12 th 2018 2 Global PMI rises but also brings signs of slower future growth At 54.0 in May, the headline JPMorgan Global Composite PMI, compiled
MEDIUM-TERM FORECAST
 MEDIUM-TERM FORECAST Q2 2010 Published by: Národná banka Slovenska Address: Národná banka Slovenska Imricha Karvaša 1 813 25 Bratislava Slovakia Contact: Monetary Policy Department +421 2 5787 2611 +421
Lars Heikensten: The Swedish economy and monetary policy
 Lars Heikensten: The Swedish economy and monetary policy Speech by Mr Lars Heikensten, Governor of the Sveriges Riksbank, at a seminar arranged by the Stockholm Chamber of Commerce and Veckans Affärer,
Monetary Policy Summary and minutes of the Monetary Policy Committee meeting ending on 19 December 2018
 Monetary Policy Summary and minutes of the Monetary Policy Committee meeting ending on 19 December 2018 Publication date: 20 December 2018 These are the minutes of the Monetary Policy Committee meeting
Svein Gjedrem: Interest rates, the exchange rate and the outlook for the Norwegian economy
 Svein Gjedrem: Interest rates, the exchange rate and the outlook for the Norwegian economy Speech by Mr Svein Gjedrem, Governor of Norges Bank (Central Bank of Norway), to the Mid-Norway Chamber of Commerce
Irish Economic Update AIB Treasury Economic Research Unit
 Irish Economic Update AIB Treasury Economic Research Unit 9th October 2018 Budget 2019 Public Finances in Balance The Irish economy has performed strongly in recent years, boosting tax revenues. Corporation
ECONOMY REPORT - CHINESE TAIPEI
 ECONOMY REPORT - CHINESE TAIPEI (Extracted from 2001 Economic Outlook) REAL GROSS DOMESTIC PRODUCT The Chinese Taipei economy grew strongly during the first three quarters of 2000, thanks largely to robust
Socio-economic Series Changes in Household Net Worth in Canada:
 research highlight October 2010 Socio-economic Series 10-018 Changes in Household Net Worth in Canada: 1990-2009 introduction For many households, buying a home is the largest single purchase they will
1 World Economy. Value of Finnish Forest Industry Exports Fell by Almost a Quarter in 2009
 1 World Economy The recovery in the world economy that began during 2009 has started to slow since spring 2010 as stocks are replenished and government stimulus packages are gradually brought to an end.
Main Economic & Financial Indicators The Czech Republic
 Main Economic & Financial Indicators The Czech Republic 15 OCTOBER 215 NAOKO ISHIHARA ECONOMIST ECONOMIC RESEARCH OFFICE (LONDON) T +44-()2-7577-2179 E naoko.ishihara@uk.mufg.jp The Bank of Tokyo-Mitsubishi
South African Reserve Bank STATEMENT OF THE MONETARY POLICY COMMITTEE. Issued by Lesetja Kganyago, Governor of the South African Reserve Bank
 South African Reserve Bank PRESS STATEMENT EMBARGO DELIVERY 23 November 2017 STATEMENT OF THE MONETARY POLICY COMMITTEE Issued by Lesetja Kganyago, Governor of the South African Reserve Bank Since the
UK BUSINESS CONFIDENCE MONITOR Q4 2013
 UK BUSINESS CONFIDENCE MONITOR 213 BUSINESS WITH CONFIDENCE WELCOME This quarter s ICAEW/Grant Thornton Business Confidence Monitor shows that business confidence has now risen for five consecutive quarters.
Greece. Eurozone rebalancing. EY Eurozone Forecast June Portugal Slovakia Slovenia Spain. Latvia Lithuania Luxembourg Malta Netherlands
 EY Forecast June 215 rebalancing recovery Outlook for Delay in agreeing reform agenda has undermined the recovery Published in collaboration with Highlights The immediate economic outlook for continues
AUGUST 2012 An Update to the Budget and Economic Outlook: Fiscal Years 2012 to 2022 Provided as a convenience, this screen-friendly version is identic
 AUGUST 2012 An Update to the Budget and Economic Outlook: Fiscal Years 2012 to 2022 Provided as a convenience, this screen-friendly version is identical in content to the principal, printer-friendly version
US Economy Update May 2014
 US Economy Update May 2014 MACRO REPORT Key Insights Monica Defend Head of Global Asset Allocation Research Annalisa Usardi Economist, US & LATAM Global Asset Allocation Research Also contributing Riccardo
UK Business Confidence Monitor Q4 2016
 UK Business Confidence Monitor 2016 BUSINESS WITH CONFIDENCE icaew.com/bcm 2016 Overall confidence -9.8 Export sales growth Input price growth remains negative to outpace domestic sales rising faster than
Projections for the Portuguese Economy:
 Projections for the Portuguese Economy: 2018-2020 March 2018 BANCO DE PORTUGAL E U R O S Y S T E M BANCO DE EUROSYSTEM PORTUGAL Projections for the portuguese economy: 2018-20 Continued expansion of economic