PERRIS UNION HIGH SCHOOL DISTRICT ANNUAL FINANCIAL REPORT JUNE 30, 2009
|
|
|
- Elizabeth Whitehead
- 5 years ago
- Views:
Transcription

1 PERRIS UNION HIGH SCHOOL DISTRICT ANNUAL FINANCIAL REPORT
2 OF RIVERSIDE COUNTY PERRIS, CALIFORNIA GOVERNING BOARD MEMBER OFFICE TERM EXPIRES Joan D. Cooley President 2011 Carolyn A. Twyman Vice President 2009 Randy J. Williams Clerk 2011 William F. Hulstrom Member 2009 Eric F. Kroencke Member 2011 ADMINISTRATION Dr. Jonathan Greenberg Candace Reines Steve Spraker Leslie Ventuleth Mary Perea Superintendent Assistant Superintendent, Business Services Assistant Superintendent, Educational Services Chief Human Resources Officer Director of Fiscal Services
3 TABLE OF CONTENTS FINANCIAL SECTION Independent Auditors' Report 2 Management's Discussion and Analysis 4 Basic Financial Statements Government-Wide Financial Statements Statement of Net Assets 14 Statement of Activities 15 Fund Financial Statements Governmental Funds - Balance Sheet 16 Reconciliation of the Governmental Funds Balance Sheet to the Statement of Net Assets 17 Governmental Funds - Statement of Revenues, Expenditures, and Changes in Fund Balance 18 Reconciliation of the Governmental Funds Statement of Revenues, Expenditures, and Changes in Fund Balances to the District-Wide Statement of Activities 19 Fiduciary Funds - Statement of Net Assets 20 Notes to Financial Statements 21 REQUIRED SUPPLEMENTARY INFORMATION General Fund - Budgetary Comparison Schedule 51 Charter School Fund - Budgetary Comparison Schedule 52 Schedule of Other Postemployment Benefits (OPEB) Funding Progress 53 SUPPLEMENTARY INFORMATION Schedule of Expenditures of Federal Awards 55 Local Education Agency Organization Structure 56 Schedule of Average Daily Attendance 57 Schedule of Instructional Time 58 Reconciliation of Annual Financial and Budget Report with Audited Financial Statements 59 Schedule of Financial Trends and Analysis 60 Schedule of Charter Schools 61 Combining Statements - Non-Major Governmental Funds Combining Balance Sheet 62 Combining Statement of Revenues, Expenditures, and Changes in Fund Balance 63 Note to Supplementary Information 65 INDEPENDENT AUDITORS' REPORTS Report on Internal Control Over Financial Reporting and on Compliance and Other Matters Based on an Audit of Financial Statements Performed in Accordance with Government Auditing Standards 68 Report on Compliance with Requirements Applicable to Each Major Program and on Internal Control over Compliance in Accordance with OMB Circular A Report on State Compliance 72
4 TABLE OF CONTENTS SCHEDULE OF FINDINGS AND QUESTIONED COSTS Summary of Auditors' Results 75 Financial Statement Findings 76 Federal Award Findings and Questioned Costs 77 State Award Findings and Questioned Costs 78 Summary Schedule of Prior Audit Findings 80 Management Letter 83
5 FINANCIAL SECTION 1
6

7
8 Perris Union High School District Growing Together Through Education District Superintendent 155 East Fourth Street Faxes: Superintendent s Office Jonathan L. Greenberg, Ed. D. Perris, CA Business Office Main Office No. Personnel Office Website: Educational Svcs. Office This section of Perris Union High School District's (the District) ( ) annual financial report presents our discussion and analysis of the District's financial performance during the fiscal year that ended on June 30, 2009, with comparative information from Please read it in conjunction with the District's financial statements, which immediately follow this section. OVERVIEW OF THE FINANCIAL STATEMENTS The Financial Statements The financial statements presented herein include all of the activities of the District and its component units using the integrated approach as prescribed by Governmental Accounting Standards Board (GASB) Statement No. 34. The Government-Wide Financial Statements present the financial picture of the District from the economic resources measurement focus using the accrual basis of accounting. These statements include all assets of the District, as well as all liabilities (including long-term obligations). Additionally, certain eliminations have occurred as prescribed by the statement in regards to interfund activity, payables, and receivables. The Fund Financial Statements include statements for each of the two categories of activities: governmental and fiduciary. The Governmental Activities are prepared using the current financial resources measurement focus and modified accrual basis of accounting. The Primary unit of the government is the Perris Union High School District. 4 Board of Trustees Eric J. Kroencke Joan D. Cooley William F. Hulstrom Carolyn A. Twyman Randy J. Williams
9 MANAGEMENT'S DISCUSSION AND ANALYSIS FINANCIAL HIGHLIGHTS OF THE PAST YEAR The District continued to maintain a strong financial position exceeding required State reserves by one percent while maintaining strong educational programs for the students served by the District. The strength of our position is due for the most part to the continued increase in student enrollment as well as the District's fiscally conservative position. In addition to its ongoing efforts in the maintenance and repair of existing facilities, the District continued its aggressive facilities acquisition, construction and modernization programs, a few of which are listed below: Heritage High School opened its doors to 11 th graders in the fall of Perris High School's stadium project, funded by Measures "T" and "Z" Bonds, was completed and rededicated in September Paloma Valley High School's shade and lunch shelter project was completed and dedicated in May The repainting of Paloma Valley High School and California Military Academy began in June Perris High School HVAC and Roofing Projects were completed in June The District opened escrow for the purchase of land in Menifee for the fourth High School in July REPORTING THE DISTRICT AS A WHOLE The Statement of Net Assets and the Statement of Activities The Statement of Net Assets and the Statement of Activities report information about the District as a whole and about its activities. These statements include all assets and liabilities of the District using the accrual basis of accounting, which is similar to the accounting used by most private-sector companies. All of the current year's revenues and expenses are taken into account regardless of when cash is received or paid. These two statements report the District's net assets and changes in them. Net assets are the difference between assets and liabilities, which is one way to measure the District's financial health, or financial position. Over time, increases or decreases in the District's net assets are one indicator of whether its financial health is improving or deteriorating. Other factors to consider are changes in the District's property tax base and the condition of the District's facilities. The relationship between revenues and expenses is the District's operating results. Since the governing board's responsibility is to provide services to our students and not to generate profit as commercial entities do, one must consider other factors when evaluating the overall health of the District. The quality of the education and the safety of our schools will likely be an important component in this evaluation. In the Statement of Net Assets and the Statement of Activities, we present the District activities as follows: Governmental Activities - The District reports all of its services in this category. This includes the education of seventh through twelfth grade students, adult education students, the operation of a community day school program, two charter schools and the on-going effort to expand, improve and maintain buildings and sites. Property taxes, State income taxes, user fees, interest income, Federal, State, and local grants, as well as general obligation bonds, finance these activities. 5
10 MANAGEMENT'S DISCUSSION AND ANALYSIS REPORTING THE DISTRICT'S MOST SIGNIFICANT FUNDS Fund Financial Statements The fund financial statements provide detailed information about the most significant funds - not the District as a whole. Some funds are required to be established by State law and by bond covenants. However, management establishes many other funds to help it control and manage money for particular purposes or to show that it is meeting legal responsibilities for using certain taxes, grants, and other money that it receives from the U.S. Department of Education. Governmental Funds - Most of the District's basic services are reported in governmental funds, which focus on how money flows into and out of those funds and the balances left at year-end that are available for spending. These funds are reported using an accounting method called modified accrual accounting, which measures cash and all other financial assets that can readily be converted to cash. The governmental fund statements provide a detailed short-term view of the District's general government operations and the basic services it provides. Governmental fund information helps determine whether there are more or fewer financial resources that can be spent in the near future to finance the District's programs. The differences of results in the governmental fund financial statements to those in the government-wide financial statements are explained in a reconciliation following each governmental fund financial statement. THE DISTRICT AS A TRUSTEE Reporting the District's Fiduciary Responsibilities The District is the trustee, or fiduciary, for funds held on behalf of others, such as funds for associated student body activities, scholarships, employee retiree benefits, and pensions. The District's fiduciary activities are reported in the Statements of Fiduciary Net Assets. We exclude these activities from the District's other financial statements because the District cannot use these assets to finance its operations. The District is responsible for ensuring that the assets reported in these funds are used for their intended purposes. 6
11 MANAGEMENT'S DISCUSSION AND ANALYSIS THE DISTRICT AS A WHOLE Net Assets The District's net assets were $163,280,850 for the fiscal year ended June 30, Of this amount, $4,537,885 was unrestricted. Restricted net assets are reported separately to show legal constraints from debt covenants and enabling legislation that limit the Governing board's ability to use those net assets for day-to-day operations. Our analysis below, in summary form, focuses on the net assets (Table 1) and change in net assets (Table 2) of the District's governmental activities. Table 1 Governmental Activities Assets Current and other assets $ 72,447,486 $ 76,616,448 Capital assets 200,021, ,089,676 Total Assets 272,469, ,706,124 Liabilities Current liabilities 7,865,960 10,923,274 Long-term obligations (includes current portion) 101,322, ,811,767 Total Liabilities 109,188, ,735,041 Net Assets Invested in capital assets, net of related debt 113,055, ,113,729 Restricted 45,687,804 48,992,834 Unrestricted 4,537,885 1,864,520 Total Net Assets $ 163,280,850 $ 162,971,083 The $4,537,885 in unrestricted net assets of governmental activities represents the accumulated results of all past years' operations. 7
12 MANAGEMENT'S DISCUSSION AND ANALYSIS Changes in Net Assets The results of this year's operations for the District as a whole are reported in the Statement of Activities on page 15. Table 2 takes the information from the Statement, rounds off the numbers, and rearranges them slightly so you can see our total revenues for the year. Table 2 Governmental Activities Revenues Program revenues: Charges for services $ 212,507 $ 319,593 Operating grants and contributions 14,374,205 17,380,982 Capital grants and contributions 250,671 2,433,191 General revenues: State revenue limit sources 37,273,804 34,547,696 Property taxes 36,865,288 35,308,664 Other general revenues 5,319,057 5,380,487 Total Revenues 94,295,532 95,370,613 Expenses Instruction 51,918,163 48,003,975 Instruction-related 11,125,949 11,000,684 Student support services 8,543,263 8,488,400 Administration 6,107,106 5,863,737 Maintenance and operations 9,950,142 10,291,671 Other 6,341,142 9,087,065 Total Expenses 93,985,765 92,735,532 Change in Net Assets $ 309,767 $ 2,635,081 8
13 MANAGEMENT'S DISCUSSION AND ANALYSIS Governmental Activities As reported in the Statement of Activities on page 15, the cost of all of our governmental activities this year was $93,985,765. However, the amount that our taxpayers ultimately financed for these activities through local taxes was only $36,865,288 because the cost was paid by those who benefited from the programs ($212,507) or by other governments and organizations who subsidized certain programs with grants and contributions ($14,624,876). We paid for the remaining "public benefit" portion of our governmental activities with State funds, and with other revenues, like interest and general entitlements. In Table 3, we have presented the cost of each of the District's largest functions: instruction and instructionrelated, pupil services, administration, maintenance and operations, and other outgo. As discussed above, net cost shows the financial burden that was placed on the District's taxpayers by each of these functions. Providing this information allows our citizens to consider the cost of each function in comparison to the benefits they believe are provided by that function. Table 3 Total Cost of Services Net Cost of Services Instruction and instruction-related $ 63,044,112 $ 59,004,659 $ 50,697,565 $ 44,775,393 Pupil services 8,543,263 8,488,400 6,843,424 6,143,174 Administration 6,107,106 5,863,737 5,578,166 5,232,947 Maintenance and operations 9,950,142 10,291,671 9,941,698 8,438,531 Other outgo 6,341,142 9,087,065 6,087,529 8,011,721 Total $ 93,985,765 $ 92,735,532 $ 79,148,382 $ 72,601,766 9
14 MANAGEMENT'S DISCUSSION AND ANALYSIS THE DISTRICT'S FUNDS As the District completed this year, our governmental funds reported a combined fund balance of $64,276,646, which is a decrease of $1,060,878 from last year (Table 4). Table 4 Balances and Activity July 1, 2008 Revenues Expenditures June 30, 2009 General Fund $ 14,571,341 $ 81,186,051 $ 80,347,725 $ 15,409,667 Charter School Fund 1,158,883 3,922,822 3,955,182 1,126,523 Building Fund 10,603, ,821 2,372,638 8,481,908 Capital Facilities Fund 10,881,157 1,237,893 2,575,834 9,543,216 Non-Major Governmental Funds 28,122,418 15,572,286 13,979,372 29,715,332 Total $ 65,337,524 $ 102,169,873 $ 103,230,751 $ 64,276,646 The primary reasons for the increases and decreases to the Districts' fund balances are: 1. As the District's principal operating fund, the General Fund is comprised of unrestricted as well as restricted dollars. The fund balance in the General Fund increased by $838,326. The net increase is primarily due to the receipt of one-time revenues from the American Recovery and Reinvestment Act to help offset the Revenue Limit deficits and the shift of categorical revenues from to The Charter School Fund balance decreased by $32,360 due to an increase of expenditures. 3. The Building, Capital Facilities, County School Facilities and Capital Project Funds decreased $1,866,844 collectively due primarily to the completion of Modernization projects at Perris High School and new projects at Paloma Valley High School. General Fund Budgetary Highlights Over the course of the year, the District revises its budget as it attempts to manage unexpected changes in revenues and expenditures. A schedule showing the District's original and final budget amounts compared with amounts actually paid and received is provided in our audit report on page 51. Significant revenue revisions made to the adopted budget were attributable to a combination of increased Revenue Limit funding, new one-time Federal awards and a funding modification for State restricted fund revenues. Budgeted expenditures decreased due to a mid-year reduction of site and department budgets and professional consulting services. 10
15 MANAGEMENT'S DISCUSSION AND ANALYSIS CAPITAL ASSET AND DEBT ADMINISTRATION Capital Assets At June 30, 2009, the District had $200,021,873 in a broad range of capital assets (net of depreciation), including land, buildings, and furniture and equipment. This amount represents a net decrease (including additions, deductions, and depreciation) of $67,803, or.03 percent, from last year (Table 5). Table 5 Governmental Activities Land and construction in progress $ 3,561,470 $ 4,132,530 Buildings and improvements 190,164, ,151,318 Furniture and equipment 6,295,618 6,805,828 Total $ 200,021,873 $ 200,089,676 This year's increase of $1 million in Buildings and Improvements is primarily a result of the completion of several projects and their reclassification from construction in progress such as the Perris High School HVAC and Roofing project and the Paloma Valley High School Shade/Lunch structure. In addition, the $510,210 decrease in Furniture and equipment is due to depreciation expense being higher in than actual purchases incurred, thus reducing the book value of the existing assets. The overall total asset amount includes $5.9 million in current year depreciation expense for the fiscal year. Long-Term Obligations At the end of this year, the District had $101,322,549 in long-term obligations outstanding versus $102,811,767 last year, a decrease of 1.5 percent. These long-term obligations consisted of: Table 6 Governmental Activities General obligation bonds $ 62,641,645 $ 62,682,531 Certificates of participation 28,480,000 29,400,000 QZAB lease purchase agreement 5,000,000 5,000,000 Capital lease obligations 4,682,009 5,238,519 Other 518, ,717 Total $ 101,322,549 $ 102,811,767 General Obligation Bonds, Certificates of Participation and Capital Lease obligations decreased by the required annual principal payment. Other obligations include accumulated vacation payable and Public Agency Retirement Services retirement payable. We present more detailed information regarding our long-term obligations in Note 8 of the financial statements. 11
16 MANAGEMENT'S DISCUSSION AND ANALYSIS SIGNIFICANT ACCOMPLISHMENTS OF FISCAL YEAR ARE NOTED BELOW: Accomplishments to support student learning during the school year included staff development activities for over 300 teachers, administrators and support staff, adoption of new English Language Arts and math textbooks for all students, standards based curriculum development in all core academic classes, and a continued increase in technology for student use. During the summer of 2009, the District implemented a stateof-the-art web-based student information system that will allow staff, parents, and students to access grades and other pertinent information from home allowing increased communication between home and school. The District's State Academic Performance Index (API) and Federal Adequate Yearly Progress (AYP) scores have continually increased over past years and this trend continued into Though the District had been making significant progress each year, students in two identified subgroups were unable to meet Federal standards and in 2006, the District was consequently identified as a Program Improvement (PI) District. In response to identification as a PI District, the District took a number of steps to identify the reason it did not meet District goals for AYP and as a result contracted with a State approved District Assistance Intervention Team (DAIT) to implement a plan to address teaching and learning needs of the District. The District provided training for staff to implement an efficient system to assist schools in reallocating their fiscal resources to support student achievement and to examine District budgets for optimal support in implementing the "Nine Essential Program Components" (NEPCs). The District also continued its efforts to ensure alignment of expenditures and purchases toward achievement of the NEPCs through review of the professional development plans and purchase orders. As a result of Program Improvement, the budget was built around the fundamental element of exiting the District from this status. This plan included reallocating resources and prioritizing goals to build a budget centered around the NEPCs. Included in this reallocation was a significant increase in funds to support professional development activities for teachers and administrators. 12
17 MANAGEMENT'S DISCUSSION AND ANALYSIS ECONOMIC FACTORS AND NEXT YEAR'S BUDGETS AND RATES In considering the District Budget for the year, the governing board and management used the following criteria at adoption: 1. District enrollment, including Charter schools, is projected to be 10,413. This represented an increase of 3.07 percent District-wide which, in comparison with past years, is a decrease in the District's growth rate. Overall district Average Daily Attendance (ADA); including Charters is projected to be 9,617. This represents an increase of 291 or 3.12 percent. 2. Lottery funding for is projected to be $121 per prior-year annual ADA. This per-pupil rate reflects $ per pupil for unrestricted lottery revenues and $11.50 per pupil for lottery funding restricted to the purchase of instructional materials. 3. Base Revenue Limit was calculated at $6, per ADA including a statutory Cost of Living Adjustment (COLA) of 4.25 percent paired with a deficit factor of percent. 4. The District reserve for economic uncertainty is maintained at four percent which is one percent higher than the required reserve of three percent. 5. With the uncertainty of the State budget and the Governor's anticipated cuts proposed to schools, in an effort to continue a fiscally conservative approach, the District moved forward in implementing budget reductions that were recommended by the Budget Advisory Committee to the Superintendent and his Cabinet and were subsequently presented to and approved by the Board. CONTACTING THE DISTRICT'S FINANCIAL MANAGEMENT This financial report is designed to provide our citizens, taxpayers, students, and investors and creditors with a general overview of the District's finances and to show the District's accountability for the money it receives. If you have questions about this report or need any additional financial information, contact Candace Reines, Assistant Superintendent, Business Services, at Perris Union High School District, 155 E. 4 th Street, Perris, California, 92570, or at candace.reines@puhsd.org. 13
18 STATEMENT OF NET ASSETS Governmental Activities ASSETS Deposits and investments $ 62,901,464 Receivables 8,561,137 Prepaid expenditures 2,815 Deferred charges 982,070 Capital assets Land and construction in process 3,561,470 Other capital assets 237,219,973 Accumulated depreciation (40,759,570) Total Capital Assets 200,021,873 Total Assets 272,469,359 LIABILITIES Accounts payable 6,437,904 Interest payable 677,190 Deferred revenue 750,866 Long-term obligations Current portion of long-term obligations 2,622,797 Noncurrent portion of long-term obligations 98,699,752 Total Long-Term Obligations 101,322,549 Total Liabilities 109,188,509 NET ASSETS Invested in capital assets, net of related debt 113,055,161 Restricted for: Debt service 8,803,192 Capital projects 27,506,385 Educational programs 7,850,373 Other activities 1,527,854 Unrestricted 4,537,885 Total Net Assets $ 163,280,850 The accompanying notes are an integral part of these financial statements. 14
19 STATEMENT OF ACTIVITIES FOR THE YEAR ENDED Net (Expenses) Revenues and Changes in Program Revenues Net Assets Charges for Operating Capital Services and Grants and Grants and Governmental Functions/Programs Expenses Sales Contributions Contributions Activities Governmental Activities: Instruction $ 51,918,163 $ - $ 10,775,988 $ 250,671 $ (40,891,504) Instruction-related activities: Supervision of instruction 2,365,447-1,134,942 - (1,230,505) Instructional library, media and technology 658, (658,993) School site administration 8,101, ,946 - (7,916,563) Pupil services: Home-to-school transportation 3,919, , ,203 - (2,843,180) All other pupil services 4,623, ,554 - (4,000,244) Administration: Data processing 1,093,216-13,725 - (1,079,491) All other administration 5,013, ,790 - (4,498,675) Plant services 9,950,142-8,444 - (9,941,698) Ancillary services 1,859, (1,859,023) Community services 1, (1,723) Interest on long-term obligations 4,228, (4,228,422) Other outgo 251, ,455-1,639 Total Governmental Activities $ 93,985,765 $ 212,507 $ 14,374,205 $ 250,671 (79,148,382) General revenues and subventions: Property taxes, levied for general purposes 30,365,441 Property taxes, levied for debt service 3,017,839 Taxes levied for other specific purposes 3,482,008 Federal and State aid not restricted to specific purposes 37,273,804 Interest and investment earnings 1,097,974 Miscellaneous 4,221,083 Subtotal, General Revenues 79,458,149 Change in Net Assets 309,767 Net Assets - Beginning 162,971,083 Net Assets - Ending $ 163,280,850 The accompanying notes are an integral part of these financial statements. 15
20 GOVERNMENTAL FUNDS BALANCE SHEET Charter General School Building Fund Fund Fund ASSETS Deposits and investments $ 13,543,119 $ 1,295,234 $ 8,549,800 Receivables 8,105, ,487 33,149 Due from other funds 914, ,345 - Prepaid expenditures 2, Total Assets $ 22,565,348 $ 1,760,066 $ 8,582,949 LIABILITIES AND FUND BALANCES Liabilities: Accounts payable $ 5,646,609 $ 238,575 $ 97,163 Due to other funds 758, ,968 3,878 Deferred revenue 750, Total Liabilities 7,155, , ,041 Fund Balances: Reserved for: Revolving cash 25, Prepaid expenditures 2, Legally restricted balances 7,643, ,861 - Unreserved: Designated 7,738, ,662 8,481,908 Undesignated, reported in: Debt service funds Capital projects funds Total Fund Balance 15,409,667 1,126,523 8,481,908 Total Liabilities and Fund Balances $ 22,565,348 $ 1,760,066 $ 8,582,949 The accompanying notes are an integral part of these financial statements. 16
21 Capital Non-Major Total Facilities Governmental Governmental Fund Funds Funds $ 9,695,278 $ 29,818,033 $ 62,901,464 36,425 86,765 8,561, ,170 1,806, ,815 $ 9,731,905 $ 30,631,968 $ 73,272,236 $ 54,380 $ 401,177 $ 6,437, , ,459 1,806, , , ,636 8,995, , , ,827,225 9,543,216 18,616,253 45,322,527-11,099,079 11,099, ,543,216 29,715,332 64,276,646 $ 9,731,905 $ 30,631,968 $ 73,272,236 16
22 RECONCILIATION OF THE GOVERNMENTAL FUNDS BALANCE SHEET TO THE STATEMENT OF NET ASSETS Total Fund Balance - Governmental Funds $ 64,276,646 Amounts Reported for Governmental Activities in the Statement of Net Assets are Different Because: Capital assets used in governmental activities are not financial resources and, therefore, are not reported as assets in governmental funds. The cost of capital assets is: $ 240,781,443 Accumulated depreciation is: (40,759,570) Net Capital Assets 200,021,873 Expenditures relating to issuance of debt of next fiscal year were recognized on modified accrual basis, but are not recognized on the accrual basis. 982,070 In governmental funds, unmatured interest on long-term obligations is recognized in the period when it is due. On the government-wide financial statements, unmatured interest on long-term obligations is recognized when incurred. ( 677,190) Long-term obligations at year-end consist of: General Obligation Bonds 62,641,645 Certificates of Participation 28,480,000 QZAB Lease Purchase Agreement 5,000,000 Capital Leases 4,682,009 Accumulated Vacation 369,069 PARS Retirement 149,826 Total Long-Term Obligations (101,322,549) Total Net Assets - Governmental Activities $ 163,280,850 The accompanying notes are an integral part of these financial statements. 17
23 GOVERNMENTAL FUNDS STATEMENT OF REVENUES, EXPENDITURES, AND CHANGES IN FUND BALANCE FOR THE YEAR ENDED Charter General School Building Fund Fund Fund REVENUES Revenue limit sources $ 57,952,716 $ 3,375,214 $ - Federal sources 7,622, ,075 - Other State sources 7,515, ,817 - Other local sources 7,491,438 30, ,821 Total Revenues 80,582,179 3,922, ,821 EXPENDITURES Current Instruction 43,934,649 2,220,336 - Instruction-related activities: Supervision of instruction 2,360, Instructional library, media, and technology 658, School site administration 6,973, ,356 - Pupil services: Home-to-school transportation 3,918, All other pupil services 4,547,884 71,981 - Administration: Data processing 1,089, All other administration 4,494, ,021 - Plant services 9,072, ,051 - Facility acquisition and construction 212,131 43,847 1,734,265 Ancillary services 1,741, ,097 - Community services 1, Other outgo 9, Debt service Principal 619, Interest and other Total Expenditures 79,635,206 3,922,689 1,734,265 Excess (Deficiency) of Revenues Over Expenditures 946, (1,483,444) Other Financing Sources (Uses) Transfers in 98, Other sources 505, Transfers out (712,519) (32,493) (638,373) Net Financing Sources (Uses) (108,647) (32,493) (638,373) NET CHANGE IN FUND BALANCES 838,326 (32,360) (2,121,817) Fund Balance - Beginning 14,571,341 1,158,883 10,603,725 Fund Balance - Ending $ 15,409,667 $ 1,126,523 $ 8,481,908 The accompanying notes are an integral part of these financial statements. 18
24 Capital Non-Major Total Facilities Governmental Governmental Fund Funds Funds $ - $ - $ 61,327,930-76,410 7,904, ,190 8,764,309 1,237,893 7,288,217 16,299,085 1,237,893 8,301,817 94,295, ,022 46,378, ,360, , ,970 8,075, ,918, ,619, ,089, ,274 20,229 5,051,260 24, ,529 9,917, ,111 3,202,268 5,474, ,864, , , ,816-1,960,000 2,579,647-3,115,401 3,115, ,826 9,447,424 95,356, ,067 (1,145,607) (1,060,878) - 7,270,469 7,368,710 - (505,631) - (1,959,008) (4,026,317) (7,368,710) (1,959,008) 2,738,521 - (1,337,941) 1,592,914 (1,060,878) 10,881,157 28,122,418 65,337,524 $ 9,543,216 $ 29,715,332 $ 64,276,646 18
25 RECONCILIATION OF THE GOVERNMENTAL FUNDS STATEMENT OF REVENUES, EXPENDITURES, AND CHANGES IN FUND BALANCES TO THE DISTRICT-WIDE STATEMENT OF ACTIVITIES FOR THE YEAR ENDED Total Net Change in Fund Balances - Governmental Funds $ (1,060,878) Amounts Reported for Governmental Activities in the Statement of Activities are Different Because: Capital outlays to purchase or build capital assets a re reported in governmental funds as expenditures; however, for governmental activities, those costs are shown in the Statement of Net Assets and allocated over their estimated useful lives as annual depreciation expenses in the Statement of Activities. This is the amount by which capital depreciation exceeds outlays in the period. Depreciation expense $ (5,913,548) Capital outlays 5,845,745 Net Expense Adjustment (67,803) In the Statement of Activities, certain operating expenses, such as compensated absences (vacations) and supplemental retirement are measured by the amounts earned during the year. In the governmental funds, however, expenditures for these items are measured by the amount of financial resources used (essentially, the amounts actually paid). Vacation earned was more than the amounts used by $103,091 and supplementary retirement earned was less than the amounts used by $74,913. (28,178) In governmental funds, debt issuance costs are recognized as expenditures in the period they are incurred. In the Statement of Activities, they are amortized over the life of the debt. The difference between debt issuance costs recognized in the current period and issue costs amortized for the period is: Issuance costs amortized for the period (62,703) Repayment of debt principal is an expenditure in the governmental funds, but it reduces long-term obligations in the Statement of Net Assets and does not affect the statement of activities: General obligation bonds 1,040,000 Certificates of participation 920,000 Capital lease obligations 556,510 Interest on long-term obligations in the Statement of Activities differs from the amount reported in the governmental funds because interest is recorded as an expenditure in the funds when it is due, and thus requires the use of current financial resources. In the Statement of Activities, however, interest expense is recognized as the interest accrues, regardless of when it is due. The additional interest reported in the statement of activities is the result of two factors. First, accrued interest on the general obligation bonds decreased by $11,933, and second, $999,114 of additional accumulated interest was accreted on the Districts' "capital appreciation" general obligation bonds. $ (987,181) Change in Net Assets of Governmental Activities $ 309,767 The accompanying notes are an integral part of these financial statements. 19
26 FIDUCIARY FUNDS STATEMENT OF NET ASSETS Agency Funds ASSETS Deposits and investments $ 504,379 Receivables 4,160 Total Assets $ 508,539 LIABILITIES Due to student groups $ 508,539 The accompanying notes are an integral part of these financial statements. 20
27 NOTES TO FINANCIAL STATEMENTS NOTE 1 - SUMMARY OF SIGNIFICANT ACCOUNTING POLICIES Financial Reporting Entity The Perris Union High School District (the District) was incorporated on August 23, 1897, under the laws of the State of California. The District operates under a locally elected five-member Board form of government and provides educational services to grades 7-12 as mandated by the State and/or Federal agencies. The District operates one middle school, three high schools, a continuation school, a community day school, two charter schools and an adult education school. A reporting entity is comprised of the primary government, component units, and other organizations that are included to ensure the financial statements are not misleading. The primary government of the District consists of all funds, departments, boards, and agencies that are not legally separate from the District. For Perris Union High School District, this includes general operations, food service, and student related activities of the District. Component Units Component units are legally separate organizations for which the District is financially accountable. Component units may also include organizations that are fiscally dependent on the District, in that the District approves their budget, the issuance of their debt or the levying of their taxes. In addition, component units are other legally separate organizations for which the District is not financially accountable but the nature and significance of the organization's relationship with the District is such that exclusion would cause the District's financial statements to be misleading or incomplete. For financial reporting purposes, the component unit discussed below is reported in the District's financial statements because of the significance of its relationship with the District. The component unit, although a legally separate entity, is reported in the financial statements using the blended presentation method as if it were part of the District's operations because the Governing Board of the component unit is essentially the same as the governing board of the District and because its purpose is to finance the construction of facilities to be used for the direct benefit of the District. The Perris Valley Schools Capital Facilities Corporation's (the Corporation) financial activity is presented in the financial statements in the Capital Project Fund for Blended Component Units and the Corporation Debt Service Fund. Certificates of participation issued by the Corporation are included as long-term obligations in the government-wide financial statements. Individually-prepared financial statements are not prepared for Perris Valley Schools Capital Facilities Corporation. The Community Facilities District 91-1 and the Community Facilities District 92-1 (the CFDs) financial activity is presented in the financial statements in the Capital Project Fund for Blended Units, included in the Governmental Funds of the District. No debt has been issued by the CFDs. Individually prepared financial statements are not prepared for the CFDs. Other Related Entities Charter School The District has approved Charters for Choice 2000 Online Charter School and California Military Institute pursuant to Education Code Section The Charter Schools are operated by the District, and their financial activities are presented in the Charter School Fund. 21
28 NOTES TO FINANCIAL STATEMENTS Basis of Presentation - Fund Accounting The accounting system is organized and operated on a fund basis. A fund is defined as a fiscal and accounting entity with a self-balancing set of accounts, which are segregated for the purpose of carrying on specific activities or attaining certain objectives in accordance with special regulations, restrictions, or limitations. The District's funds are grouped into two broad fund categories: governmental and fiduciary. Governmental Funds Governmental funds are those through which most governmental functions typically are financed. Governmental fund reporting focuses on the sources, uses, and balances of current financial resources. Expendable assets are assigned to the various governmental funds according to the purposes for which they may or must be used. Current liabilities are assigned to the fund from which they will be paid. The difference between governmental fund assets and liabilities is reported as fund balance. The following are the District's major and non-major governmental funds: Major Governmental Funds General Fund The General Fund is the chief operating fund for all districts. It is used to account for the ordinary operations of a district. All transactions except those required or permitted by law to be in another fund are accounted for in this fund. Charter Schools Fund The Charter School's Fund may be used by authorizing districts to account separately for the activities of district-operated charter schools that would otherwise be reported in the authorizing district's General Fund. Building Fund The Building Fund exists primarily to account separately for proceeds from the sale of bonds (Education Code Section 15146) and may not be used for any purposes other than those for which the bonds were issued. Capital Facilities Fund The Capital Facilities Fund is used primarily to account separately for monies received from fees levied on developers or other agencies as a condition of approving a development (Education Code Sections ). Expenditures are restricted to the purposes specified in Government Code Sections or to the items specified in agreements with the developer (Government Code Section 66006). Non-Major Governmental Funds Special Revenue Funds The Special Revenue funds are used to account for the proceeds of specific revenue sources that are legally restricted to expenditures for specific purposes. The District maintains the following special revenue funds: Adult Education Fund The Adult Education Fund is used to account separately for Federal, State, and local revenues for adult education programs and is to be expended for adult education purposes only. Deferred Maintenance Fund The Deferred Maintenance Fund is used to account separately for State apportionments and the District's contributions for deferred maintenance purposes (Education Code Sections ) and for items of maintenance approved by the State Allocation Board. 22
29 NOTES TO FINANCIAL STATEMENTS County School Facilities Fund The County School Facilities Fund is established pursuant to Education Code Section to receive apportionments from the 1998 State School Facilities Fund (Proposition la), the 2002 State School Facilities Fund (Proposition 47), or the 2004 State School Facilities Fund (Proposition 55) authorized by the State Allocation Board for new school facility construction, modernization projects, and facility hardship grants, as provided in the Leroy F. Greene School Facilities Act of 1998 (Education Code Section et seq.). Special Reserve Fund for Capital Outlay Projects The Special Reserve Fund for Capital Outlay Projects exists primarily to provide for the accumulation of General Fund monies for capital outlay purposes (Education Code Section 42840). Capital Project Fund for Blended Component Units The Capital Project Fund for Blended Component Units is used to account for capital projects financed by the Perris Valley Schools Capital Facilities Corporation, the 91-1 Community Facilities District, and the 92-1 Community Facilities District that are considered blended component units of the District under generally accepted accounting principles. Capital Projects Funds The Capital Projects funds are used to account for the acquisition and/or construction of all major governmental fixed assets. The District maintains the following capital projects fund: Debt Service Funds The Debt Service funds are used to account for the accumulation of resources for, and the payment of, long-term debt principal, interest, and related costs. The District maintains the following debt service funds: Bond Interest and Redemption Fund The Bond Interest and Redemption Fund is used for the repayment of bonds issued for a district (Education Code Sections ). QZAB Fund The QZAB Fund is used to account for the accumulation of resources for the lease payment related to the QZAB lease purchase agreement between the District and the Public Property Financing Corporation of California. Corporation Debt Service Fund The Corporation Debt Service Fund is used to account for the accumulation of resources for the payment of the principal and interest related to certificates of participation issued by the Perris Valley Schools Capital Facilities Corporation that is considered a blended component unit of the District under generally accepted accounting principles (GAAP) COP Debt Service Fund The 2003 COP Debt Service Fund is used to account for the accumulation of resources for the payment of the principal and interest related to the 2003 certificates of participation issued by the Perris Valley Schools Capital Facilities Corporation that is considered a blended component unit of the District under generally accepted accounting principles (GAAP) COP Debt Service Fund The 2007 COP Debt Service Fund is used to account for the accumulation of resources for the payment of the principal and interest related to the 2007 certificates of participation issued by the Perris Valley Schools Capital Facilities Corporation that is considered a blended component unit of the District under generally accepted accounting principles (GAAP). 23
30 NOTES TO FINANCIAL STATEMENTS Proprietary Funds Proprietary fund reporting focuses on the determination of operating income, changes in net assets, financial position, and cash flows. The District applies all GASB pronouncements, as well as the Financial Accounting Standards Board pronouncements issued on or before November 30, 1989, unless those pronouncements conflict with or contradict GASB pronouncements. Proprietary funds are classified as enterprise or internal service. The District has no proprietary funds. Fiduciary Funds Fiduciary fund reporting focuses on net assets and changes in net assets. The fiduciary fund category is split into four classifications: pension trust funds, investment trust funds, private-purpose trust funds, and agency funds. Trust funds are used to account for the assets held by the District under a trust agreement for individuals, private organizations, or other governments and are therefore, not available to support the District's own programs. The District has no trust funds. Agency funds are custodial in nature (assets equal liabilities) and do not involve measurement of results of operations. Such funds have no equity accounts since all assets are due to individuals or entities at some future time. The District's agency fund accounts for student body activities (ASB). Basis of Accounting - Measurement Focus Government-Wide Financial Statements The government-wide financial statements are prepared using the economic resources measurement focus and the accrual basis of accounting. This is the same approach used in the preparation of the proprietary fund financial statements, but differs from the manner in which governmental fund financial statements are prepared. The government-wide statement of activities presents a comparison between expenses, both direct and indirect, of the District and for each governmental function. Direct expenses are those that are specifically associated with a service, program, or department and are therefore, clearly identifiable to a particular function. The District does not allocate indirect expenses to functions in the Statement of Activities, except for depreciation. Program revenues include charges paid by the recipients of the goods or services offered by the programs and grants and contributions that are restricted to meeting the operational or capital requirements of a particular program. Revenues that are not classified as program revenues are presented as general revenues. The comparison of program revenues and expenses identifies the extent to which each program is self-financing or draws from the general revenues of the District. Net assets should be reported as restricted when constraints placed on net asset use are either externally imposed by creditors (such as through debt covenants), grantors, contributors, or laws or regulations of other governments or imposed by law through constitutional provisions or enabling legislation. The net assets restricted for other activities result from special revenue funds and the restrictions on their net asset use. Fund Financial Statements Fund financial statements report detailed information about the District. The focus of governmental fund financial statements is on major funds rather than reporting funds by type. Each major fund is presented in a separate column. Non-major funds are aggregated and presented in a single column. 24
31 NOTES TO FINANCIAL STATEMENTS Governmental Funds All governmental funds are accounted for using the flow of current financial resources measurement focus and the modified accrual basis of accounting. With this measurement focus, only current assets and current liabilities generally are included on the balance sheet. The Statement of Revenues, Expenditures, and Changes in Fund Balance reports on the sources (revenues and other financing sources) and uses (expenditures and other financing uses) of current financial resources. This approach differs from the manner in which the governmental activities of the government-wide financial statements are prepared. Governmental fund financial statements, therefore, include reconciliations with brief explanations to better identify the relationship between the government-wide financial statements, prepared using the economic resources measurement focus and the accrual basis of accounting, and the governmental fund financial statements, prepared using the flow of current financial resources measurement focus and the modified accrual basis of accounting. Fiduciary Funds Fiduciary funds are accounted for using the flow of economic resources measurement focus and the accrual basis of accounting. Fiduciary funds are excluded from the government-wide financial statements because they do not represent resources of the District. Revenues - Exchange and Non-Exchange Transactions Revenue resulting from exchange transactions, in which each party gives and receives essentially equal value, is recorded on the accrual basis when the exchange takes place. On a modified accrual basis, revenue is recorded in the fiscal year in which the resources are measurable and become available. Available means that the resources will be collected within the current fiscal year or are expected to be collected soon enough thereafter, to be used to pay liabilities of the current fiscal year. Generally, available is defined as collectible within 60 days. However to achieve comparability of reporting among California districts and so as not to distort normal revenue patterns, with specific respect to reimbursement grants and corrections to State-aid apportionments, the California Department of Education has defined available for districts as collectible within one year. The following revenue sources are considered to be both measurable and available at fiscal year-end: State apportionments, interest, certain grants, and other local sources. Non-exchange transactions, in which the District receives value without directly giving equal value in return, include property taxes, certain grants, entitlements, and donations. Revenue from property taxes is recognized in the fiscal year in which the taxes are received. Revenue from certain grants, entitlements, and donations is recognized in the fiscal year in which all eligibility requirements have been satisfied. Eligibility requirements include time and purpose restrictions. On a modified accrual basis, revenue from non-exchange transactions must also be available before it can be recognized. Deferred Revenue Deferred revenue arises when potential revenue does not meet both the "measurable" and "available" criteria for recognition in the current period or when resources are received by the District prior to the incurrence of qualifying expenditures. In subsequent periods, when both revenue recognition criteria are met, or when the District has a legal claim to the resources, the liability for deferred revenue is removed from the balance sheet and revenue is recognized. Certain grants received before the eligibility requirements are met are recorded as deferred revenue. On the governmental fund financial statements, receivables that will not be collected within the available period are also recorded as deferred revenue. 25
32 NOTES TO FINANCIAL STATEMENTS Expenses/Expenditures On the accrual basis of accounting, expenses are recognized at the time they are incurred. The measurement focus of governmental fund accounting is on decreases in net financial resources (expenditures) rather than expenses. Expenditures are generally recognized in the accounting period in which the related fund liability is incurred, if measurable, and typically paid within 90 days. Principal and interest on longterm obligations, which have not matured, are recognized when paid in the governmental funds as expenditures. Allocations of costs, such as depreciation and amortization, are not recognized in the governmental funds but are recognized in the entity-wide statements. Cash and Cash Equivalents The District's cash and cash equivalents are considered to be cash on hand, demand deposits, and short-term investments with original maturities of three months or less from the date of acquisition. Investments Investments held at June 30, 2009, with original maturities greater than one year are stated at fair value. Fair value is estimated based on quoted market prices at year-end. All investments not required to be reported at fair value are stated at cost or amortized cost. Fair values of investments in county and State investment pools are determined by the program sponsor. Restricted Assets Restricted assets arise when restrictions on their use change the normal understanding of the availability of the asset. Such constraints are either imposed by creditors, contributors, grantors, or laws of other governments or imposed by enabling legislation. Restricted assets in the Corporation Debt Service Fund represent cash and cash equivalents required by debt covenants to be set aside by the District for the purpose of satisfying certain requirements of the bonded debt issuance. Capital Assets and Depreciation The accounting and reporting treatment applied to the capital assets associated with a fund are determined by its measurement focus. Capital assets are long-lived assets of the District. The District maintains a capitalization threshold of $5,000. The District does not possess any infrastructure. Improvements are capitalized; the costs of normal maintenance and repairs that do not add to the value of the asset or materially extend an asset's life are not capitalized, but are expensed as incurred. When purchased, such assets are recorded as expenditures in the governmental funds and capitalized in the government-wide statement of net assets. The valuation basis for capital assets is historical cost, or where historical cost is not available, estimated historical cost based on replacement cost. Donated capital assets are capitalized at estimated fair market value on the date donated. Capital assets in the proprietary funds are capitalized in the fund in which they are utilized. The valuation basis for proprietary fund capital assets is the same as those used for the capital assets of governmental funds. Depreciation is computed using the straight-line method. Estimated useful lives of the various classes of depreciable capital assets are as follows: buildings, 25 to 50 years; improvements, 7 to 30 years; equipment, 5 to 20 years. 26
33 NOTES TO FINANCIAL STATEMENTS Interfund Balances On fund financial statements, receivables and payables resulting from short-term interfund loans are classified as "interfund receivables/payables". These amounts are eliminated in the governmental activities column of the statement of net assets. Compensated Absences Accumulated unpaid vacation benefits are accrued as a liability as the benefits are earned. The entire compensated absence liability is reported on the government-wide statement of net assets. For governmental funds, the current portion of unpaid compensated absences is recognized upon the occurrence of relevant events such as employee resignations and retirements that occur prior to year-end that have not yet been paid with expendable available financial resources. These amounts are reported in the fund from which the employees who have accumulated leave are paid. Sick leave is accumulated without limit for each employee at the rate of one day for each month worked. Leave with pay is provided when employees are absent for health reasons; however, the employees do not gain a vested right to accumulated sick leave. Employees are never paid for any sick leave balance at termination of employment or any other time. Therefore, the value of accumulated sick leave is not recognized as a liability in the District's financial statements. However, credit for unused sick leave is applicable to all classified school members who retire after January 1, At retirement, each member will receive.004 year of service credit for each day of unused sick leave. Credit for unused sick leave is applicable to all certificated employees and is determined by dividing the number of unused sick days by the number of base service days required to complete the last school year, if employed full-time. Accrued Liabilities and Long-Term Obligations All payables, accrued liabilities, and long-term obligations are reported in the government-wide fund financial statements. In general, governmental fund payables and accrued liabilities that, once incurred, are paid in a timely manner and in full from current financial resources are reported as obligations of the governmental funds. However, claims and judgments, compensated absences, special termination benefits, and contractually required pension contributions that will be paid from governmental funds are reported as a liability in the governmental fund financial statements only to the extent that they are due for payment during the current year. Bonds, certificates of participation, and other long-term obligations are recognized as liabilities in the governmental fund financial statements when due. Fund Balance Reserves and Designations The District reserves those portions of fund balance which are legally segregated for a specific future use or which do not represent available expendable resources and therefore are not available for appropriation or expenditure. Unreserved fund balance indicates that portion of fund balance which is available for appropriation in future periods. Fund balance reserves have been established for revolving cash accounts and legally restricted grants and entitlements. Designations of fund balances consist of that portion of the fund balance that has been designated (set aside) by the Governing board to provide for specific purposes or uses. Fund balance designations have been established for economic uncertainties and other purposes. 27
34 NOTES TO FINANCIAL STATEMENTS Net Assets Net assets represent the difference between assets and liabilities. Net assets invested in capital assets, net of related debt consists of capital assets, net of accumulated depreciation, reduced by the outstanding balances of any borrowings used for the acquisition, construction or improvement of those assets. Net assets are reported as restricted when there are limitations imposed on their use either through the enabling legislation adopted by the District or through external restrictions imposed by creditors, grantors, or laws or regulations of other governments. The District first applies restricted resources when an expense is incurred for purposes for which both restricted and unrestricted net assets are available. The government-wide financial statements report $45,687,804 of restricted net assets. Interfund Activity Exchange transactions between funds are reported as revenues in the seller funds and as expenditures/expenses in the purchaser funds. Flows of cash or goods from one fund to another without a requirement for repayment are reported as interfund transfers. Interfund transfers are reported as other financing sources/uses in governmental funds. Repayments from funds responsible for particular expenditures/expenses to the funds that initially paid for them are not presented in the financial statements. Interfund transfers are eliminated in the governmental and business-type activities columns of the Statement of Activities, except for the net residual amounts transferred between governmental and business-type activities. Estimates The preparation of the financial statements in conformity with accounting principles generally accepted in the United States of America requires management to make estimates and assumptions that affect the amounts reported in the financial statements and accompanying notes. Actual results may differ from those estimates. Budgetary Data The budgetary process is prescribed by provisions of the California Education Code and requires the Governing board to hold a public hearing and adopt an operating budget no later than July 1 st of each year. The District governing board satisfied these requirements. The adopted budget is subject to amendment throughout the year to give consideration to unanticipated revenue and expenditures primarily resulting from events unknown at the time of budget adoption with the legal restriction that expenditures cannot exceed appropriations by major object account. The amounts reported as the original budgeted amounts in the budgetary statements reflect the amounts when the original appropriations were adopted. The amounts reported as the final budgeted amounts in the budgetary statements reflect the amounts after all budget amendments have been accounted for. For budget purposes, on behalf payments have not been included as revenue and expenditures as required under generally accepted accounting principles. Property Tax Secured property taxes attach as an enforceable lien on property as of January 1. Taxes are payable in two installments on November 1 and February 1 and become delinquent on December 10 and April 10, respectively. Unsecured property taxes are payable in one installment on or before August 31. The County of Riverside bills and collects the taxes on behalf of the District. Local property tax revenues are recorded when received. 28
35 NOTES TO FINANCIAL STATEMENTS Changes in Accounting Principles In July 2004, the GASB issued Statement No. 45, Accounting and Financial Reporting by Employers for Postemployment Benefits Other Than Pensions. This Statement will require local governmental employers who provide other postemployment benefits (OPEB) as part of the total compensation offered to employees to recognize the expense and related liabilities (assets) in the government-wide financial statements of net assets and activities. This Statement establishes standards for the measurement, recognition, and display of OPEB expense/expenditures and related liabilities (assets), note disclosures, and, if applicable, required supplementary information (RSI) in the financial reports of State and local governmental employers. Current financial reporting practices for OPEB generally are based on pay-as-you-go financing approaches. They fail to measure or recognize the cost of OPEB during the periods when employees render the services or to provide relevant information about OPEB obligations and the extent to which progress is being made in funding those obligations. This Statement generally provides for prospective implementation - that is, that employers set the beginning net OPEB obligation at zero as of the beginning of the initial year. The District has implemented the provisions of this Statement on or before fiscal year ended June 30, New Accounting Pronouncements In March 2009, the GASB issued GASB Statement No. 54, Fund Balance Reporting and Governmental Fund Type Definitions. The objective of this Statement is to enhance the usefulness of fund balance information by providing clearer fund balance classifications that can be more consistently applied and by clarifying the existing governmental fund type definitions. This Statement establishes fund balance classifications that comprise a hierarchy based primarily on the extent to which a government is bound to observe constraints imposed upon the use of the resources reported in governmental funds. The requirements of this Statement are effective for the financial statements for periods beginning after June 15, Early implementation is encouraged. In April 2009, the GASB issued GASB Statement No. 55, The Hierarchy of Generally Accepted Accounting Principles for State and Local Governments. The objective of this Statement is to incorporate the hierarchy of generally accepted accounting principles (GAAP) for State and local governments into the GASB authoritative literature. The "GAAP hierarchy" consists of the sources of accounting principles used in the preparation of financial statements of State and local governmental entities that are presented in conformity with GAAP, and the framework for selecting those principles. GASB Statement No. 55 is effective immediately. In April 2009, the GASB issued GASB Statement No. 56, Codification of Accounting and Financial Reporting Guidance Contained in the AICPA Statements on Auditing Standards. The objective of this Statement is to incorporate into the GASB's authoritative literature certain accounting and financial reporting guidance presented in the American Institute of Certified Public Accountants' Statements on Auditing Standards. This Statement addresses three issues not included in the authoritative literature that establishes accounting principles related party transactions, going concern considerations, and subsequent events. The presentation of principles used in the preparation of financial statements is more appropriately included in accounting and financial reporting standards rather than in the auditing literature. GASB Statement No. 56 is effective immediately. 29
36 NOTES TO FINANCIAL STATEMENTS NOTE 2 - DEPOSITS AND INVESTMENTS Summary of Deposits and Investments Deposits and investments as of June 30, 2009, are classified in the accompanying financial statements as follows: Governmental activities $ 62,901,464 Fiduciary funds 504,379 Total Deposits and Investments $ 63,405,843 Deposits and investments as of June 30, 2009, consist of the following: Cash on hand and in banks $ 6,497,857 Cash in revolving 25,000 Investments 56,882,986 Total Deposits and Investments $ 63,405,843 Policies and Practices The District is authorized under California Government Code to make direct investments in local agency bonds, notes, or warrants within the State; U.S. Treasury instruments; registered State warrants or treasury notes; securities of the U.S. Government, or its agencies; bankers acceptances; commercial paper; certificates of deposit placed with commercial banks and/or savings and loan companies; repurchase or reverse repurchase agreements; medium term corporate notes; shares of beneficial interest issued by diversified management companies, certificates of participation, obligations with first priority security; and collateralized mortgage obligations. Investment in County Treasury - The District is considered to be an involuntary participant in an external investment pool as the District is required to deposit all receipts and collections of monies with their County Treasurer (Education Code Section 41001). The fair value of the District's investment in the pool is reported in the accounting financial statements at amounts based upon the District's pro-rata share of the fair value provided by the County Treasurer for the entire portfolio (in relation to the amortized cost of that portfolio). The balance available for withdrawal is based on the accounting records maintained by the County Treasurer, which is recorded on the amortized cost basis. 30
37 NOTES TO FINANCIAL STATEMENTS General Authorizations Limitations as they relate to interest rate risk, credit risk, and concentration of credit risk are indicated in the schedules below: Maximum Maximum Maximum Authorized Remaining Percentage Investment Investment Type Maturity of Portfolio in One Issuer Local Agency Bonds, Notes, Warrants 5 years None None Registered State Bonds, Notes, Warrants 5 years None None U.S. Treasury Obligations 5 years None None U.S. Agency Securities 5 years None None Banker's Acceptance 180 days 40% 30% Commercial Paper 270 days 25% 10% Negotiable Certificates of Deposit 5 years 30% None Repurchase Agreements 1 year None None Reverse Repurchase Agreements 92 days 20% of base None Medium-Term Corporate Notes 5 years 30% None Mutual Funds N/A 20% 10% Money Market Mutual Funds N/A 20% 10% Mortgage Pass-Through Securities 5 years 20% None County Pooled Investment Funds N/A None None Local Agency Investment Fund (LAIF) N/A None None Joint Powers Authority Pools N/A None None Interest Rate Risk Interest rate risk is the risk that changes in market interest rates will adversely affect the fair value of an investment. Generally, the longer the maturity of an investment, the greater the sensitivity of its fair value to changes in market interest rates. The District manages its exposure to interest rate risk by investing in the county pool. Weighted Average Maturity The District monitors the interest rate risk inherent in its portfolio by measuring the weighted average maturity of its portfolio. Information about the weighted average maturity of the District's portfolio is presented in the following schedule: Weighted Average Fair Maturity Investment Type Value in Days Money Market Mutual Funds $ 7,097,139 1 County Pool 50,004, Total $ 57,102,044 31
38 NOTES TO FINANCIAL STATEMENTS Credit Risk Credit risk is the risk that an issuer of an investment will not fulfill its obligation to the holder of the investment. This is measured by the assignment of a rating by a nationally recognized statistical rating organization. Presented below is the minimum rating required by the California Government Code, the District's investment policy, or debt agreements, and the actual rating as of the year-end for each investment type. Minimum Rating Legal as of Investment Type Rating June 30, 2009 Fair Value Money Market Mutual Funds Not Required Not Rated $ 7,097,139 County Pool Not Required AAA/V1+ 50,004,905 Total Investments $ 57,102,044 Custodial Credit Risk - Deposits This is the risk that in the event of a bank failure, the District's deposits may not be returned to it. The District does not have a policy for custodial credit risk for deposits. However, the California Government Code requires that a financial institution secure deposits made by State or local governmental units by pledging securities in an undivided collateral pool held by a depository regulated under State law (unless so waived by the governmental unit). The market value of the pledged securities in the collateral pool must equal at least 110 percent of the total amount deposited by the public agency. California law also allows financial institutions to secure public deposits by pledging first trust deed mortgage notes having a value of 150 percent of the secured public deposits and letters of credit issued by the Federal Home Loan Bank of San Francisco having a value of 105 percent of the secured deposits. As of June 30, 2009, the District's bank balance of $370,256 was exposed to custodial credit risk because it was uninsured and collateralized with securities held by the pledging financial institution's trust department or agent, but not in the name of the District. 32
39 NOTES TO FINANCIAL STATEMENTS NOTE 3 - RECEIVABLES Receivables at June 30, 2009, consisted of intergovernmental grants, entitlements, interest and other local sources. All receivables are considered collectible in full. Charter General School Building Fund Fund Fund Federal Government Categorical aid $ 2,536,327 $ - $ - State Government Apportionment 2,866, ,175 - Categorical aid (137,268) 43,439 - Lottery 563,251 28,825 - Local Government Interest 69,963 3,103 33,149 Other Local Sources 2,206, Total $ 8,105,311 $ 299,487 $ 33,149 Federal Government Categorical aid State Government Apportionment Categorical aid Lottery Local Government Interest Other Local Sources Total Capital Non-Major Total Facilities Governmental Governmental Fund Funds Funds $ - $ 38,205 $ 2,574, ,090, (93,829) ,076 36,425 48, , ,207,059 $ 36,425 $ 86,765 $ 8,561,137 33
40 NOTES TO FINANCIAL STATEMENTS NOTE 4 - CAPITAL ASSETS Capital asset activity for the fiscal year ended June 30, 2009, was as follows: Governmental Activities Capital Assets Not Being Depreciated: Land 3,515,140 Balance Balance July 1, 2008 Additions Deductions June 30, 2009 $ $ - $ - $ 3,515,140 Construction in Progress 617,390 4,630,746 5,201,806 46,330 Total Capital Assets Not Being Depreciated 4,132,530 4,630,746 5,201,806 3,561,470 Capital Assets Being Depreciated: Land Improvements 13,717, ,453-14,551,463 Buildings 209,140,199 5,201, ,342,005 Equipment 7,951, ,546 5,200 8,326,505 Total Capital Assets Being Depreciated 230,808,368 6,416,805 5, ,219,973 Total Capital Assets 234,940,898 11,047,551 5,207, ,781,443 Less Accumulated Depreciation: Land Improvements 7,084, ,189-7,682,009 Buildings 26,621,071 4,425,603-31,046,674 Equipment 1,145, ,756 5,200 2,030,887 Total Accumulated Depreciation 34,851,222 5,913,548 5,200 40,759,570 Governmental Activities Capital Assets, Net $ 200,089,676 $ 5,134,003 $ 5,201,806 $ 200,021,873 Depreciation expense was charged as a direct expense to governmental functions as follows: Governmental Activities Instruction $ 5,554,795 School site administration 5,228 Data processing 119,083 All other administration 18,304 Plant services 216,138 Total Depreciation Expenses All Activities $ 5,913,548 34
41 NOTES TO FINANCIAL STATEMENTS NOTE 5 - INTERFUND TRANSACTIONS Interfund receivable and payable balances arise from interfund transactions and are recorded by all funds affected in the period in which transactions are executed. Interfund receivable and payable balances at June 30, 2009, between major and non-major governmental funds are as follows: Due From Charter General School Building Due To Fund Fund Fund General Fund $ - $ 394,968 $ 3,878 Charter School Fund 165, Capital Facilities Fund Non-Major Governmental Funds 592, Total $ 758,206 $ 394,968 $ 3,878 Due To General Fund Charter School Fund Capital Facilities Fund Non-Major Governmental Funds Total Due From Capital Non-Major Facilities Governmental Fund Funds Total $ - $ 515,257 $ 914, , , ,170 $ 134,309 $ 515,459 $ 1,806,820 35
42 NOTES TO FINANCIAL STATEMENTS Operating Transfers Interfund transfers for the year ended June 30, 2009, consisted of the following: Transfer From Charter Capital Non-Major General School Building Facilities Governmental Transfer To Fund Fund Fund Fund Funds Total General Fund $ - $ 32,493 $ - $ - $ 65,748 $ 98,241 Non-Major Governmental Funds 712, ,373 1,959,008 3,960,569 7,270,469 Total $ 712,519 $ 32,493 $ 638,373 $ 1,959,008 $ 4,026,317 $ 7,368,710 The General Fund transferred to the Adult Education Fund to reverse overestimated flexibility transfer. $ 167,015 The General Fund transferred to the Deferred Maintenance Fund to make deferred maintenance match. 469,054 The General Fund transferred to the Special Reserve Fund for Capital Outlay Projects to reimburse Williams costs incurred. The Charter School Fund transferred to the General Fund for flexibility transfers. The Adult Education Fund transferred to the General Fund for sweep of beginning balance. The Capital Projects Fund for Blended Component Units transferred to the COP Debt Service Fund for debt service payments. The Capital Facilities Fund transferred to the 2003 COP Debt Service Fund to establish a new Debt Service Fund. The Building Fund transferred to the 2007 COP Debt Service Fund to establish a new Debt Service Fund. The COP Debt Service Fund transferred to the 2003 COP Debt Service Fund for COP payments. 76,450 32,493 65,748 1,950,000 1,959, ,373 1,351,004 The Special Reserve Fund for Capital Outlay Projects transferred to the Debt Service Fund for debt service payments. 659,565 Total $ 7,368,710 36
43 NOTES TO FINANCIAL STATEMENTS NOTE 6 - ACCOUNTS PAYABLE Accounts payable at June 30, 2009, consisted of the following: Charter Capital General School Building Facilities Fund Fund Fund Fund Vendor payables $ 1,977,913 $ 170,130 $ 2,016 $ 54,080 State apportionment 3,299,198 67, Salaries and benefits 362,852 1, Construction 6,646-95, Total $ 5,646,609 $ 238,575 $ 97,163 $ 54,380 Vendor payables State apportionment Salaries and benefits Construction Total Non-Major Total Governmental Governmental Funds Funds $ 263,786 $ 2,467,925-3,366,236 7, , , ,900 $ 401,177 $ 6,437,904 NOTE 7 - DEFERRED REVENUE Deferred revenue at June 30, 2009, consists of the following: General Fund Federal financial assistance $ 666,558 State categorical aid 84,308 Total $ 750,866 37
44 NOTES TO FINANCIAL STATEMENTS NOTE 8 - LONG-TERM OBLIGATIONS Summary The changes in the District's long-term obligations during the year consisted of the following: Additions Balance and Balance Due in July 1, 2008 Adjustments Deductions June 30, 2009 One Year General Obligation Bonds $ 62,682,531 $ 999,114 $ 1,040,000 $ 62,641,645 $ 1,240,000 Certificates of Participation 29,400, ,000 28,480, ,000 QZAB Lease Purchase Agreement 5,000, ,000,000 - Capital Leases 5,238, ,510 4,682, ,884 Accumulated Vacation 265, , ,069 - PARS Retirement 224,739-74, ,826 74,913 OPEB Obligation - 50,841 50, $ 102,811,767 $ 1,153,046 $ 2,642,264 $ 101,322,549 $ 2,622,797 Payments on the General Obligation Bonds are made from the Bond Interest and Redemption Fund. Payments on the Certificates of Participation are made from the 2003 Debt Service Fund and the 2007 COP Debt Service Fund. Payments on the QZAB Lease Purchase Agreement will be made from the QZAB Fund. Payments for Accumulated Vacation are typically liquidated in the General Fund and Non-Major Governmental Funds. Payments for the PARS Retirement are made from the General Fund. Payments for the OPEB obligation are made from the General Fund. Bonded Debt The outstanding general obligation bonded debt is as follows: Bonds Bonds Issue Maturity Interest Original Outstanding Capital Outstanding Date Date Rate Issue July 1, 2008 Issued Appreciation Redeemed June 30, /1/00 3/1/ % $ 8,313,075 $ 4,482,856 $ - $ 312,074 $ - $ 4,794,930 11/1/02 9/1/ % 7,686,807 6,101, ,858-6,436,636 2/25/05 9/1/ % 7,805,000 6,080, ,000 5,375,000 2/25/05 3/1/ % 38,764,558 39,026, , ,000 39,234,908 3/28/06 9/1/ % 7,232,820 6,991,089-24, ,000 6,800,171 $ 62,682,531 $ - $ 999,114 $ 1,040,000 $ 62,641,645 Election 1999, Series A General Obligation Bonds In May 2000, the District issued $8,313,075 in Election 1999, Series A General Obligation Bonds. Proceeds from the bonds will be used for the purpose of construction and renovation of various school facilities in the District. In March 2005, the 2005 General Obligation Refunding Bonds refunded the current interest portion of the bonds. At June 30, 2009, the principal balance outstanding was $4,794,
45 NOTES TO FINANCIAL STATEMENTS Election 1999, Series B General Obligation Bonds In November 2002, the District issued $7,686,807 in Election 1999, Series B General Obligation Bonds. Proceeds from the bonds will be used for the purpose of construction and renovation of various school facilities in the District. In March 2005, the 2005 General Obligation Refunding Bonds refunded the current interest portion of the bonds. At June 30, 2009, the principal balance outstanding was $6,436, General Obligation Refunding Bonds In February 2005, the District issued $7,805,000 in 2005 General Obligation Refunding Bonds. Proceeds from the bonds will be used to refund certain maturities of the District's outstanding General Obligation Bonds, Election 1999, Series A General Obligation Bonds, Election 1999, Series B and to finance the acquisition, construction and modernization of property and school facilities. At June 30, 2009, the principal balance outstanding was $5,375,000. Election 2004, Series A General Obligation Bonds In February 2005, the District issued $38,764,558 in Election 2004, Series A General Obligation Bonds. Proceeds from the bonds will be used to finance the acquisition, construction, and modernization of property and school facilities. At June 30, 2009, the principal balance outstanding was $39,234,908. Election 2004, Series B General Obligation Bonds In March 2006, the District issued $7,232,820 in Election 2004, Series B General Obligation Bonds. Proceeds from the bonds will be used to finance the acquisition, construction, and modernization of property and school facilities. At June 30, 2009, the principal balance outstanding was $6,800,171. Debt Service Requirements to Maturity The bonds mature through 2034 as follows: Interest and Accreted Fiscal Year Principal Value Payment Total 2010 $ 1,240,000 $ 2,010,420 $ 3,250, ,455,000 1,964,632 3,419, ,685,000 1,907,794 3,592, ,945,000 1,838,569 3,783, ,225,000 1,757,938 3,982, ,111,592 11,196,883 23,308, ,476,501 11,822,427 29,298, ,002,495 13,254,832 30,257, ,271,671 3,899,926 6,171,597 Subtotal 57,412,259 49,653, ,065,680 Accreted Interest 5,229,386 (5,229,386) - Total $ 62,641,645 $ 44,424,035 $ 107,065,680 39
46 NOTES TO FINANCIAL STATEMENTS Certificates of Participation In January 2004, the District issued $23,500,000 in Certificates of Participation to finance modernization, improvement and construction of District's facilities. The Certificates are subject to a floating rate of interest. At June 30, 2009, the floating rate of interest was percent. The outstanding principal balance at June 30, 2009, is $19,710,000. In December 2007, the District issued $23,500,000 in Certificates of Participation for the purpose of defeasing and prepaying a portion of the 2000 Certificates of Participation. The interest rate is set at 6 percent per annum. The outstanding principal balance at June 30, 2009, is $8,770,000. Payments are required as follows: Year Ending 2003 COP 2007 COP June 30, Principal Interest Total Principal Interest Total 2010 $ 605,000 $ 193,158 $ 798,158 $ 255,000 $ 360,994 $ 615, , , , , , , , , , , , , , , , , , , , , , , , , ,275, ,210 4,024,210 1,670,000 1,391,469 3,061, ,790, ,886 4,368,886 2,050,000 1,020,791 3,070, ,395, ,612 4,776,612 2,500, ,781 3,047, ,100, ,880 5,252,880 1,165,000 52,988 1,217,988 Total $ 19, 710,000 $ 2,766,932 $ 22,476,932 $ 8,770,000 $ 4,709,399 $ 13,479,399 Year Ending June 30, Total Total Principal Interest $ 860,000 $ 554, , , , , , , , ,862 4,945,000 2,140,679 5,840,000 1,599,677 6,895, ,393 6,265, ,868 $ 28,480,000 $ 7,476,331 40
47 NOTES TO FINANCIAL STATEMENTS Qualified Zone Academy Bonds (QZAB) Lease Purchase Agreement On December 9, 2003, the District, pursuant to a lease purchase agreement with the Public Property Financing Corporation of California, issued $5,000,000 Qualified Zone Academy Bonds (QZAB) to provide funds to finance certain improvements, equipment, and related costs for the District's Literacy and Information Technology Academy and to pay certain costs of issuance. The Bonds mature on December 9, 2018 with the entire principal amount of $5,000,000 due at this date. The Bonds do not bear interest. In lieu of receiving periodic interest or sinking fund payments, qualified buyers will receive an annual federal tax credit as set by the U.S. Treasury Department. Payment of principal on the Bonds is secured by an initial deposit of $2,618,141 made by the District on the date of issuance. The initial deposit, together with accrued interest earnings shall be sufficient to make the lease payment in full at maturity. As of June 30, 2009, US Bank held $4,433,669 for the lease payment. Capital Leases The District has entered into agreements to lease various facilities and equipment. Such agreements are, in substance, purchases (capital leases) and are reported as capital lease obligations. The District's liability on lease agreements with options to purchase is summarized below: School Buses Balance, July 1, 2008 $ 6,211,183 Additions - Payments 621,118 Balance, June 30, 2009 $ 5,590,065 The capital leases have minimum lease payments as follows: Year Ending Lease June 30, Payment 2010 $ 621, , , , , ,484,475 Total 5,590,065 Less: Amount Representing Interest 908,056 Present Value of Minimum Lease Payments $ 4,682,009 Leased land, buildings, and equipment under capital leases in capital assets at June 30, 2009, include the following: Equipment $ 5,238,519 Less: Accumulated depreciation (654,815) Total $ 4,583,704 Amortization of leased buildings and equipment under capital assets is included with depreciation expense. 41
48 NOTES TO FINANCIAL STATEMENTS Accumulated Unpaid Employee Vacation The long-term portion of accumulated unpaid employee vacation for the District at June 30, 2009, amounted to $369,069. PARS Retirement The PARS retirement balance for the District at June 30, 2009, amounted to $149,826. Year Ending June 30, Payment 2010 $ 74, ,913 Total $ 149,826 Other Postemployment Benefit (OPEB) Obligation The District implemented GASBS No. 45, Accounting and Financial Reporting by Employers for Postemployment Benefits Other Than Pensions during the year ended June 30, The District's annual required contribution for the year ended June 30, 2009, was $50,841 and contributions made by the District during the year were $50,841, which resulted in no OPEB obligation as of June 30, See Note 10 for additional information regarding the OPEB Obligation and the postemployment benefit plan. 42
49 NOTES TO FINANCIAL STATEMENTS NOTE 9 - FUND BALANCES Fund balances are composed of the following elements: Charter General School Building Fund Fund Fund Reserved Revolving cash $ 25,000 $ - $ - Stores inventories Prepaid expenditures 2, Restricted programs 7,666, ,861 - Total Reserved 7,694, ,861 - Unreserved Designated Economic uncertainties 3,144, Other designations 4,570, ,662 8,481,908 Total Designated 7,715, ,662 8,481,908 Undesignated Total Unreserved 7,715, ,662 8,481,908 Total $ 15,409,667 $ 1,126,523 $ 8,481,908 Reserved Revolving cash Stores inventories Prepaid expenditures Restricted programs Total Reserved Unreserved Designated Economic uncertainties Other designations Total Designated Undesignated Total Unreserved Total Capital Non-Major Facilities Governmental Fund Funds Total $ - $ - $ 25, , ,850, ,878, ,144,605 9,543,216 18,616,253 42,154,774 9,543,216 18,616,253 45,299,379-11,099,079 11,099,079 9,543,216 29,715,332 56,398,458 $ 9,543,216 $ 29,715,332 $ 64,276,646 43
50 NOTES TO FINANCIAL STATEMENTS NOTE 10 - POSTEMPLOYMENT HEALTH CARE PLAN AND OTHER POSTEMPLOYMENT BENEFITS (OPEB) OBLIGATION Plan Description The Postemployment Benefit Plan (the Plan) is a single-employer defined benefit healthcare plan administered by the Perris Union High School District. The Plan provides medical and dental insurance benefits to eligible retirees and their spouses. Membership of the Plan consists of five retirees currently receiving benefits. Contribution Information For fiscal year , the District contributed $50,841 to the plan, all of which was used for current premiums (100 percent of total premiums). Annual OPEB Cost and Net OPEB Obligation The District's annual OPEB cost (expense) is calculated based on the annual required contribution of the employer (ARC), an amount actuarially determined in accordance with the parameters of GASB Statement No. 45. The ARC represents a level of funding that, if paid on an ongoing basis, is projected to cover normal cost each year and amortize any unfunded actuarial accrued liabilities (UAAL) (or funding excess) over a period not to exceed thirty years. The following table shows the components of the District's annual OPEB cost for the year, the amount actually contributed to the plan, and changes in the District's net OPEB obligation to the Plan: Annual required contribution $ 50,841 Annual OPEB cost (expense) 50,841 Contributions made 50,841 Increase in net OPEB obligation - Net OPEB obligation, beginning of year - Net OPEB obligation, end of year $ - The annual OPEB cost, the percentage of annual OPEB cost contributed to the Plan, and the net OPEB obligation for 2009 was as follows: Annual Required Percentage Net OPEB Fiscal Year Contribution Contributed Obligation 2009 $ 50, % $ - 44
51 NOTES TO FINANCIAL STATEMENTS NOTE 11 - RISK MANAGEMENT The District is exposed to various risks of loss related to torts, theft, damage and destruction of assets; errors and omissions, injuries to employees, life and health of employees and natural disasters. The District purchases coverage for property damage with limits up to a maximum of $250,000,000, subject to various policy sublimits generally ranging from $500 to $100,000,000 and deductibles ranging from $500 to $5,000. The District also purchases coverage for general liability claims with limits up to $1,000,000 per occurrence with excess liability coverage up to $25,000,000 per occurrence and $60,000,000 in the aggregate, all subject to various deductibles up to $5,000 per occurrence. The District participates in a finite risk sharing pool for workers' compensation coverage up to $150,000,000 per occurrence with no self-insured retention. Employee health benefits are covered by a commercial insurance policy purchased by the District. The District provides health insurance benefits to District employees electing to participate in the plan by paying a monthly premium based on the number of District employees participating in the Plan. Property and Liability The District is exposed to various risks of loss related to torts, theft, damage and destruction of assets; errors and omissions, injuries to employees, life and health of employees and natural disasters. During fiscal year ending June 30, 2009, the District pooled for property and liability coverage as a member of Riverside Schools' Insurance Authority, a Joint Powers Authority. Settlement claims have not exceeded the limits of this coverage in any of the past three years. Workers' Compensation For fiscal year 2009, the District participated in the Riverside Schools' Risk Management Authority (RSRMA), a Workers' Compensation coverage purchasing pool. The intent of RSRMA is to achieve the benefit of a reduced premium for the District by virtue of its grouping and representation with other participants. RSRMA, in turn, pools for workers' compensation coverage through their membership in the Protected Insurance Program for Schools and Community Colleges (PIPS), a finite risk sharing pool. Pooling in this manner allows the member districts and joint powers authorities to take advantage of increased purchasing power and greater spread of risk. As a member of PIPS, RSRMA is assigned a rate based on the JPA's overall payroll and loss experience compared to the other members within PIPS. Each participant in RSRMA pays its workers' compensation premium based on its individual rate which is weighted based on their payroll and loss experience within RSRMA. This arrangement insures that each participant shares equally in the overall performance of RSRMA. Participation in RSRMA is limited to districts that can meet the selection criteria. Employee Medical Benefits The District is a member of the Riverside Employer/Employee Partnership (REEP) to provide employee health benefits. REEP is a shared risk pool comprised of various school districts. Rates are set through an annual calculation process. The District pays a monthly contribution, which is placed in a common fund from which claim payments are made for all participating districts. Claims are paid for all participants regardless of claims flow. The Board of Directors has a right to return monies to a district subsequent to the settlement of all expenses and claims if a district withdraws from the pool. 45
52 NOTES TO FINANCIAL STATEMENTS NOTE 12 - EMPLOYEE RETIREMENT SYSTEMS Qualified employees are covered under multiple-employer retirement plans maintained by agencies of the State of California. Certificated employees are members of the California State Teachers' Retirement System (CalSTRS) and classified employees are members of the California Public Employees' Retirement System (CalPERS). CalSTRS Plan Description The District contributes to CalSTRS, a cost-sharing multiple-employer public employee retirement system defined benefit pension plan administered by CalSTRS. The plan provides retirement and disability benefits, annual cost-of-living adjustments, and survivor benefits to beneficiaries. Benefit provisions are established by State statutes, as legislatively amended, within the State Teachers' Retirement Law. CalSTRS issues a separate comprehensive annual financial report that includes financial statements and required supplementary information. Copies of the CalSTRS annual financial report may be obtained from CalSTRS, 7919 Folsom Blvd., Sacramento, California Funding Policy Active plan members are required to contribute 8.0 percent of their salary and the District is required to contribute an actuarially determined rate. The actuarial methods and assumptions used for determining the rate are those adopted by CalSTRS Teachers' Retirement Board. The required employer contribution rate for fiscal year was 8.25 percent of annual payroll. The contribution requirements of the plan members are established by State statute. The District's contributions to CalSTRS for the fiscal years ending June 30, 2009, 2008, and 2007, were $3,137,639, $3,008,543, and $2,653,844, respectively, and equal 100 percent of the required contributions for each year. CalPERS Plan Description The District contributes to the School Employer Pool under the CalPERS, a cost-sharing multiple-employer public employee retirement system defined benefit pension plan administered by CalPERS. The plan provides retirement and disability benefits, annual cost-of-living adjustments, and survivor benefits to plan members and beneficiaries. Benefit provisions are established by State statutes, as legislatively amended, within the Public Employees' Retirement Laws. CalPERS issues a separate comprehensive annual financial report that includes financial statements and required supplementary information. Copies of the CalPERS' annual financial report may be obtained from the CalPERS Executive Office, 400 P Street, Sacramento, California
53 NOTES TO FINANCIAL STATEMENTS Funding Policy Active plan members are required to contribute seven percent of their salary and the District is required to contribute an actuarially determined rate. The actuarial methods and assumptions used for determining the rate are those adopted by the CalPERS Board of Administration. The required employer contribution rate for fiscal year was percent of covered payroll. The contribution requirements of the plan members are established by State statute. The District's contributions to CalPERS for the fiscal years ending June 30, 2009, 2008, and 2007, were $1,851,468, $1,659,892, and $833,207, respectively, and equal 100 percent of the required contributions for each year. On Behalf Payments The State of California makes contributions to CalSTRS on behalf of the District. These payments consist of State General Fund contributions to CalSTRS in the amount of $1,757,799 (4.517 percent of annual payroll). Under accounting principles generally accepted in the United States of America, these amounts are to be reported as revenues and expenditures; however, guidance received from the California Department of Education advises local educational agencies not to record these amounts in the Annual Financial and Budget Report. These amounts have not been included in the budget amounts reported in the General Fund - Budgetary Comparison Schedule. These amounts have been recorded in these financial statements. On behalf payments have been excluded from the calculation of available reserves. NOTE 13 - COMMITMENTS AND CONTINGENCIES Grants The District received financial assistance from Federal and State agencies in the form of grants. The disbursement of funds received under these programs generally requires compliance with terms and conditions specified in the grant agreements and are subject to audit by the grantor agencies. Any disallowed claims resulting from such audits could become a liability of the General Fund or other applicable funds. However, in the opinion of management, any such disallowed claims will not have a material adverse effect on the overall financial position of the District at June 30, Litigation The District is not currently a party to any legal proceedings. 47
54 NOTES TO FINANCIAL STATEMENTS Construction Commitments As of June 30, 2009, the District had the following commitments with respect to the unfinished capital projects: Remaining Expected Construction Date of CAPITAL PROJECTS Commitment Completion Heritage High School $ 2,286,819 6/30/2010 Pinacate Middle School Wiring Project 29,815 12/31/2009 $ 2,316,634 NOTE 14 - PARTICIPATION IN PUBLIC ENTITY RISK POOLS The District is a member of the Riverside Schools Risk Management Authority (RSRMA), Riverside Employer/Employee Partnership (REEP), and the Riverside Schools' Insurance Authority (RSIA) public entity risk pools. The District pays an annual premium to the applicable entity for its health, workers' compensation, and property liability coverage. The relationships between the District and the pools are such that they are not component units of the District for financial reporting purposes. These entities have budgeting and financial reporting requirements independent of member units and their financial statements are not presented in these financial statements; however, fund transactions between the entities and the District are included in these statements. Audited financial statements are generally available from the respective entities. During the year ended June 30, 2009, the District made payments of $1,279,890, $5,285,298, and $454,038 to RSRMA, REEP, and RSIA respectively, for its workers' compensation health, property liability coverage. NOTE 15 - FISCAL ISSUES RELATING TO BUDGET REDUCTIONS The State of California continues to suffer the effects of a recessionary economy. California school districts are reliant on the State of California to appropriate the funding necessary to continue the level of educational services expected by the State constituency. With the implementation of education trailer bill Senate Bill 4 of the Third Extraordinary Session (SBX3 4) (Chapter 12, Statutes of 2009), 14 percent of current year appropriations have now been deferred to a subsequent period, creating significant cash flow management issues for districts in addition to requiring substantial budget reductions, ultimately impacting the ability of California school districts to meet their goals for educational services. 48
55 NOTES TO FINANCIAL STATEMENTS NOTE 16 - SUBSEQUENT EVENT Assembly Bill of the Fourth Extraordinary Session (ABX4 3) On July 28, 2009, Governor Schwarzenegger signed a package of bills amending the and California State budgets. The budget amendments were designed to address the State's budget gap of $24 billion that had developed as a result of the deepening recession since the State's last budget actions in February The July budget package reduced, on a State-wide basis, $1.6 billion in Proposition 98 funding through a reversion of undistributed categorical program balances. The budget language identified 51 specific programs and required the amounts associated with these programs that were "unallocated, unexpended, or not liquidated as of June 30, 2009," to revert to the State's General Fund. The July budget package also provided an appropriation in to backfill $1.5 billion of these cuts to repay the reversion of the undistributed categorical program balances. In accordance with the requirements of GASB Statement No. 33, the District has not recorded the revenue and related receivable associated with the District's portion of the unallocated, unexpended or unliquidated categorical program balances identified in the July 2009 State Budget package. Subsequently, on November 6, 2009, the California State Controller's advisory directed affected local governments to recognize their portion of the reduced appropriation as stated in ABX4 3 above. 49
56 REQUIRED SUPPLEMENTARY INFORMATION 50
57 GENERAL FUND BUDGETARY COMPARISON SCHEDULE FOR THE YEAR ENDED Variances - Positive Budgeted Amounts (Negative) (GAAP Basis) Actual Final Original Final (GAAP Basis) to Actual REVENUES Revenue limit sources $ 59,558,558 $ 55,627,416 $ 57,952,716 $ 2,325,300 Federal sources 3,423,585 3,742,154 7,622,723 3,880,569 Other State sources 7,461,790 7,429,202 7,515,302 86,100 Other local sources 6,044,419 6,909,077 7,491, ,361 Total Revenues 1 76,488,352 73,707,849 80,582,179 6,874,330 EXPENDITURES Current Instruction 44,081,228 42,538,567 43,934,649 (1,396,082) Instruction-related activities: Supervision of instruction 2,367,462 2,331,357 2,360,642 (29,285) Instructional library, media, and technology 660, , ,308 (8,167) School site administration 6,994,100 6,887,434 6,973,950 (86,516) Pupil services: Home-to-school transportation 4,031,349 3,869,627 3,918,687 (49,060) All other pupil services 4,678,636 4,490,947 4,547,884 (56,937) General administration: Data processing 1,163,709 1,147,759 1,089,488 58,271 All other general administration 4,800,939 4,735,134 4,494, ,398 Plant services 9,471,561 9,000,859 9,072,518 (71,659) Facility acquisition and construction ,131 (212,131) Ancillary services 1,361,152 1,648,608 1,741,032 (92,424) Community services - 1,559 1,723 (164) Other outgo 633, ,141 9, ,330 Debt service Principal ,647 (619,647) Total Expenditures 1 80,243,694 77,944,133 79,635,206 (1,691,073) Excess (Deficiency) of Revenues Over Expenditures (3,755,342) (4,236,284) 946,973 5,183,257 OTHER FINANCING SOURCES (USES) Transfers in - 506,966 98,241 (408,725) Other sources , ,631 Transfers out 403, ,397 (712,519) (1,133,916) Net Financing Sources (Uses) 403, ,363 (108,647) (1,037,010) NET CHANGE IN FUND BALANCES (3,352,107) (3,307,921) 838,326 4,146,247 Fund Balance - Beginning 14,571,341 14,571,341 14,571,341 - Fund Balance - Ending $ 11,219,234 $ 11,263,420 $ 15,409,667 $ 4,146,247 1 On behalf payments of $1,757,799 are included in the actual revenues and expenditures, but have not been included in the budgeted amounts. 51
58 CHARTER SCHOOL FUND BUDGETARY COMPARISON SCHEDULE FOR THE YEAR ENDED Variances - Positive Budgeted Amounts (Negative) (GAAP Basis) Actual Final Original Final (GAAP Basis) to Actual REVENUES Revenue limit sources $ 3,189,800 $ 3,092,777 $ 3,375,214 $ 282,437 Federal sources , ,075 Other State sources 363, , ,817 (58,979) Other local sources 26,263 23,794 30,716 6,922 Total Revenues 3,579,966 3,487,367 3,922, ,455 EXPENDITURES Current Instruction 2,393,240 2,173,681 2,220,336 (46,655) Instruction-related activities: School site administration 663, , ,356 (3,028) Pupil services: All other pupil services 72,608 72,487 71, General administration: All other general administration 338, , ,021 (9,630) Plant services 502, , ,051 17,834 Facility acquisition and construction ,847 (43,847) Ancillary services 75, , ,097 (22,070) Total Expenditures 4,045,786 3,815,799 3,922,689 (106,890) Excess (Deficiency) of Revenues Over Expenditures (465,820) (328,432) ,565 OTHER FINANCING SOURCES Transfers out - - (32,493) (32,493) Net Financing Uses - - (32,493) (32,493) NET CHANGE IN FUND BALANCES (465,820) (328,432) (32,360) 296,072 Fund Balance - Beginning 1,158,883 1,158,883 1,158,883 - Fund Balance - Ending $ 693,063 $ 830,451 $ 1,126,523 $ 296,072 52
59 SCHEDULE OF OTHER POSTEMPLOYMENT BENEFITS (OPEB) FUNDING PROGRESS FOR THE YEAR ENDED Schedule of Funding Progress Actuarial Accrued Liability Unfunded UAAL as a Actuarial (AAL) - AAL Percentage of Valuation Actuarial Value Unprojected (UAAL) Funded Ratio Covered Covered Payroll Date of Assets (a) Unit Credit (b) (b - a) (a / b) Payroll (c) ([b - a] / c) September 4, 2009 $ - $ 422,310 $ 422,310 $ - $
60 SUPPLEMENTARY INFORMATION 54
61 SCHEDULE OF EXPENDITURES OF FEDERAL AWARDS FOR THE YEAR ENDED Pass-through Entity Federal Grantor/Pass-Through CFDA Identifying Program Grantor/Program Number Number Expenditures U.S. DEPARTMENT OF EDUCATION Passed through California Department of Education (CDE): Adult Basic Education - ABE and ESL Services A $ 33,012 Adult Basic Education - Adult Secondary ,398 Adult Basic Education - English Literacy and Civics Education A ,000 Elementary and Secondary Education Act as amended by the No Child Left Behind Act (NCLB): Title I, Part A - Basic Grants Low Income and Neglected ,844,210 Title I, Part A - Program Improvement District Intervention ,250 Title I, Part A - Program Improvement LEA Corrective Action Resources ,236 ARRA - State Fiscal Stabilization Fund ,924,979 Title II, Part A - Improving Teacher Quality Local Grants ,493 Title II, Part D- Enhancing Education Through Technology, Formula Grants ,105 Title III - Immigrant Education Program ,642 Title III - Limited English Proficiency Program ,548 Title IV, Part A - Safe and Drug Free Schools and Communities, Formula Grants ,918 Title V, Part A - Innovative Education Strategies, Formula Entitlements A ,911 Subtotal 6,633,702 Passed through Riverside County Special Education Local Plan Area: Individuals with Disabilities Education Act (IDEA): Basic Local Assistance, Part B ,397 Vocational Programs: Vocational and Applied Technology Secondary II C, Sec ,653 Subtotal 1,098,050 Total Department of Education 7,731,752 U.S. DEPARTMENT OF DEFENSE Junior Reserve Officers Training Corps [1] 162,886 Total Department of Defense 162,886 U.S. DEPARTMENT OF HEALTH AND HUMAN SERVICES Passed through California Department of Health Services: Medi-Cal Billing Option ,570 Total Federal Programs $ 7,904,208 [1] Direct funded program, Pass-Through Entity Number not applicable. See accompanying note to supplementary information. 55
62 LOCAL EDUCATION AGENCY ORGANIZATION STRUCTURE ORGANIZATION The Perris Union High School District was incorporated on August 23, 1897, and consists of an area comprising approximately 179 square miles. The District operates one middle school, three high schools, a continuation school, a community day school, two charter schools, and an adult education school. There were no boundary changes during the year. GOVERNING BOARD MEMBER OFFICE TERM EXPIRES Joan D. Cooley President 2011 Carolyn A. Twyman Vice President 2009 Randy J. Williams Clerk 2011 William F. Hulstrom Member 2009 Eric F. Kroencke Member 2011 ADMINISTRATION Dr. Jonathan Greenberg Candace Reines Steve Spraker Leslie Ventuleth Mary Perea Superintendent Assistant Superintendent, Business Services Assistant Superintendent, Educational Services Chief Human Resources Officer Director of Fiscal Services See accompanying note to supplementary information. 56
63 SCHEDULE OF AVERAGE DAILY ATTENDANCE FOR THE YEAR ENDED Second Period Annual Report Report ELEMENTARY Seventh and eighth 1,257 1,256 Special education Community day school Total Elementary 1,324 1,326 SECONDARY Regular classes 6,814 6,760 Continuation education Home and hospital 1 1 Special education Community day school Total Secondary 7,459 7,387 Total K-12 8,783 8,713 CLASSES FOR ADULTS Concurrently enrolled 1 2 Not concurrently enrolled Total Classes for Adults Grand Total 8,935 8,892 CHARTER SCHOOLS California Military Institute Seventh and eighth Ninth through twelfth Total California Military Institute - Classroom-based Seventh and eighth Ninth through twelfth Total Choice 2000 On-Line Ninth through twelfth Choice 2000 On-Line - Classroom-based Ninth through twelfth - - Hours of Attendance SUPPLEMENTAL INSTRUCTIONAL HOURS Elementary 21,030 High school 232,558 Charter school - California Military Institute 4,184 Total Hours 257,772 See accompanying note to supplementary information. 57
64 SCHEDULE OF INSTRUCTIONAL TIME FOR THE YEAR ENDED Number of Days Actual Minutes Actual Traditional Multitrack Grade Level Minutes Requirement Minutes Calendar Calendar Status Grades ,200 54,000 Grade 7 65, N/A Complied Grade 8 65, N/A Complied Grades ,332 64,800 Grade 9 65, N/A Complied Grade 10 65, N/A Complied Grade 11 65, N/A Complied Grade 12 65, N/A Complied Grades Paloma Valley High School Grade 9 55,332 64,800 Grade 10 65, N/A Complied Grade 11 65, N/A Complied Grade 12 65, N/A Complied 65, N/A Complied California Military Institute Number of Days Actual Minutes Actual Traditional Multitrack Grade Level Minutes Requirement Minutes Calendar Calendar Status Grades ,200 54,000 Grade 7 67, N/A Complied Grade 8 67, N/A Complied Grade 9 55,332 64,800 67, N/A Complied See accompanying note to supplementary information. 58
65 RECONCILIATION OF ANNUAL FINANCIAL AND BUDGET REPORT WITH AUDITED FINANCIAL STATEMENTS FOR THE YEAR ENDED Summarized below are the fund balance reconciliations between the Unaudited Actual Financial Report and the audited financial statements. General Fund FUND BALANCE Balance, June 30, 2009, Unaudited Financial Statement $ 17,659,921 Decrease in: Accounts receivable 1 (2,250,254) Balance, June 30, 2009, Audited Financial Statement $ 15,409,667 1 The adjustment is the ABX4 3 categorical un-appropriated State categorical as described in Note 16. See accompanying note to supplementary information. 59
66 SCHEDULE OF FINANCIAL TRENDS AND ANALYSIS FOR THE YEAR ENDED (Budget) GENERAL FUND Revenues $ 74,148,548 $ 80,582,179 $ 76,818,088 $ 74,267,924 Other sources and transfers in 1,320, ,872 5,376,480 - Total Revenues and Other Sources 75,469,245 81,186,051 82,194,568 74,267,924 Expenditures 79,318,756 79,635,206 83,263,758 68,520,928 Other uses and transfers out - 712, , ,364 Total Expenditures and Other Uses 79,318,756 80,347,725 83,690,997 68,981,292 INCREASE (DECREASE) IN FUND BALANCE $ (3,849,511) $ 838,326 $ (1,496,429) $ 5,286,632 ENDING FUND BALANCE $ 11,560,156 $ 15,409,667 $ 14,571,341 $ 16,067,770 AVAILABLE RESERVES 2 $ 3,172,750 $ 3,144,605 $ 3,070,439 $ 2,701,131 AVAILABLE RESERVES AS A PERCENTAGE OF TOTAL OUTGO % 4.00% 3.74% 4.00% LONG-TERM OBLIGATIONS N/A $ 101,322,549 $ 102,811,767 $ 95,313,577 K-12 AVERAGE DAILY ATTENDANCE AT P-2 4 8,950 8,783 8,523 8,094 The General Fund balance has decreased by $658,103 over the past two years. The fiscal year budget projects a further decrease of $3,849,511 (25 percent). For a district this size, the State recommends available reserves of at least three percent of total General Fund expenditures, transfers out, and other uses (total outgo). The District has incurred operating surpluses in two of the past three years, but anticipates incurring an operating deficit during the fiscal year. Total long-term obligations have increased by $6,008,972 over the past two years. Average daily attendance has increased by 689 over the past two years. Additional growth of 167 ADA is anticipated during fiscal year Budget 2010 is included for analytical purposes only and has not been subjected to audit. 2 Available reserves consist of all undesignated fund balances and all funds designated for economic uncertainty contained within the General Fund. 3 On behalf payments of $1,757,799, $1,691,520, and $ 1,453,020 have been excluded from the calculation of available reserves for the fiscal years ending June 30, 2009, 2008, and Excludes adult education and charter school ADA. See accompanying note to supplementary information. 60
67 SCHEDULE OF CHARTER SCHOOLS FOR THE YEAR ENDED Name of Charter School California Military Institute Choice 2000 On-Line High School Included in Audit Report Yes Yes See accompanying note to supplementary information. 61
68 NON-MAJOR GOVERNMENTAL FUNDS COMBINING BALANCE SHEET Special Reserve Adult Deferred County School Fund for Education Maintenance Facilities Capital Outlay Fund Fund Fund Projects ASSETS Deposits and investments $ 253,432 $ 413,839 $ 6,118,913 $ 5,940,035 Receivables 38,205-24,927 22,890 Due from other funds 167, , ,309 76,450 Total Assets $ 458,815 $ 763,072 $ 6,278,149 $ 6,039,375 LIABILITIES AND FUND BALANCES Liabilities: Accounts payable $ 7,803 $ 113,635 $ 278,863 $ 876 Due to other funds 451,012 64, Total Liabilities 458, , , Fund Balances: Unreserved: Designated - 585,192 5,999,084 6,038,499 Undesignated, reported in: Debt service funds Total Fund Balance - 585,192 5,999,084 6,038,499 Total Liabilities and Fund Balances $ 458,815 $ 763,072 $ 6,278,149 $ 6,039,375 See accompanying note to supplementary information. 62
69 Capital Project Fund Bond Total for Blended Interest and Corporation 2003 COP 2007 COP Non-Major Component Redemption QZAB Debt Service Debt Service Debt Service Governmental Units Fund Fund Fund Fund Fund Funds $ 5,993,478 $ 3,889,891 $ 4,433,669 $ 111,306 $ 2,037,306 $ 626,164 $ 29,818, , ,170 $ 5,993,478 $ 3,889,891 $ 4,433,669 $ 112,049 $ 2,037,306 $ 626,164 $ 30,631,968 $ - $ - $ - $ - $ - $ - $ 401, , ,636 5,993, ,616,253-3,889,891 4,433, ,049 2,037, ,164 11,099,079 5,993,478 3,889,891 4,433, ,049 2,037, ,164 29,715,332 $ 5,993,478 $ 3,889,891 $ 4,433,669 $ 112,049 $ 2,037,306 $ 626,164 $ 30,631,968 62
70 NON-MAJOR GOVERNMENTAL FUNDS COMBINING STATEMENT OF REVENUES, EXPENDITURES, AND CHANGES IN FUND BALANCE FOR THE YEAR ENDED Adult Deferred County School Education Maintenance Facilities Fund Fund Fund REVENUES Federal sources $ 76,410 $ - $ - Other State sources 623, ,535 - Other local sources 15,775 3,806 1,157,843 Total Revenues 715, ,341 1,157,843 EXPENDITURES Current Instruction 223, Instruction-related activities: School site administration 246, Administration: All other general administration 20, Plant services 8, , Facility acquisition and construction - 173,291 2,078,203 Other outgo Debt service Principal Interest and other Total Expenditures 498, ,583 2,078,413 Excess (Deficiency) of Revenues Over Expenditures 217,201 (52,242) (920,570) OTHER FINANCING SOURCES (USES) Transfers in 167, ,054 - Other sources (441,386) (64,245) - Transfers out (65,748) - - Net Financing Sources (Uses) (340,119) 404,809 - NET CHANGE IN FUND BALANCES (122,918) 352,567 (920,570) Fund Balance - Beginning 122, ,625 6,919,654 Fund Balance - Ending $ - $ 585,192 $ 5,999,084 See accompanying note to supplementary information. 63
71 Capital Project Special Reserve Fund Bond Fund For for Blended Interest and Corporation Capital Outlay Component Redemption QZAB Debt Service Projects Units Fund Fund Fund $ - $ - $ - $ - $ , ,662 2,658,772 3,069, ,618 8, ,662 2,658,772 3,103, ,618 8, , , , , ,040, ,050, ,007, ,731 3,090, ,005 - (853,260) 2,449,041 13,614 (63,387) 8,476 76, ,950, (1,950,000) - - (2,010,569) 76,450 (1,950,000) - - (60,569) (776,810) 499,041 13,614 (63,387) (52,093) 6,815,309 5,494,437 3,876,277 4,497, ,142 $ 6,038,499 $ 5,993,478 $ 3,889,891 $ 4,433,669 $ 112,049 63
72 NON-MAJOR GOVERNMENTAL FUNDS COMBINING STATEMENT OF REVENUES, EXPENDITURES, AND CHANGES IN FUND BALANCE (Continued) FOR THE YEAR ENDED Total 2003 COP 2007 COP Non-Major Debt Service Debt Service Governmental Fund Fund Funds REVENUES Federal sources $ - $ - $ 76,410 Other State sources ,190 Other local sources 9,707 30,920 7,288,217 Total Revenues 9,707 30,920 8,301,817 EXPENDITURES Current Instruction ,022 Instruction-related activities: School site administration ,970 Administration: All other general administration ,229 Plant services ,529 Facility acquisition and construction - - 3,202,268 Other outgo ,005 Debt service Principal 590, ,000 1,960,000 Interest and other 692, ,694 3,115,401 Total Expenditures 1,282, ,694 9,447,424 Excess (Deficiency) of Revenues Over Expenditures (1,272,706) (671,774) (1,145,607) OTHER FINANCING SOURCES (USES) Transfers in 3,310,012 1,297,938 7,270,469 Other sources - - (505,631) Transfers out - - (4,026,317) Net Financing Sources (Uses) 3,310,012 1,297,938 2,738,521 NET CHANGE IN FUND BALANCES 2,037, ,164 1,592,914 Fund Balance - Beginning ,122,418 Fund Balance - Ending $ 2,037,306 $ 626,164 $ 29,715,332 See accompanying note to supplementary information. 64
73 NOTE TO SUPPLEMENTARY INFORMATION NOTE 1 - PURPOSE OF SCHEDULES Schedule of Expenditures of Federal Awards The accompanying schedule of expenditures of Federal awards includes the Federal grant activity of the District and is presented on the modified accrual basis of accounting. The information in this schedule is presented in accordance with the requirements of the United States Office of Management and Budget Circular A-133, Audits of States, Local Governments, and Non-Profit Organizations. Therefore, some amounts presented in this schedule may differ from amounts presented in, or used in the preparation of, the financial statements. Local Education Agency Organization Structure This schedule provides information about the District's boundaries and schools operated, members of the governing board, and members of the administration. Schedule of Average Daily Attendance (ADA) Average daily attendance (ADA) is a measurement of the number of pupils attending classes of the District. The purpose of attendance accounting from a fiscal standpoint is to provide the basis on which apportionments of State funds are made to school districts. This schedule provides information regarding the attendance of students at various grade levels and in different programs. Schedule of Instructional Time The District has received incentive funding for increasing instructional time as provided by the Incentives for Longer Instructional Day. This schedule presents information on the amount of instructional time offered by the District and whether the District complied with the provisions of Education Code Sections through Districts must maintain their instructional minutes at either the actual minutes or the requirement, whichever is greater, as required by Education Code Section Reconciliation of Annual Financial and Budget Report with Audited Financial Statements This schedule provides the information necessary to reconcile the fund balance of all funds reported on the Unaudited Actual Financial Report to the audited financial statements. Schedule of Financial Trends and Analysis This schedule discloses the District's financial trends by displaying past years' data along with current year budget information. These financial trend disclosures are used to evaluate the District's ability to continue as a going concern for a reasonable period of time. Schedule of Charter Schools This schedule lists all charter schools chartered by the District, and displays information for each charter school on whether or not the charter school is included in the District's audit. 65
74 NOTE TO SUPPLEMENTARY INFORMATION Non-Major Governmental Funds - Balance Sheet and Statement of Revenues, Expenditures and Changes in Fund Balance The Non-Major Governmental Funds Combining Balance Sheet and Combining Statement of Revenues, Expenditures and Changes in Fund Balance is included to provide information regarding the individual funds that have been included in the Non-Major Governmental Funds column on the Governmental Funds Balance Sheet and Statement of Revenues, Expenditures, and Changes in Fund Balance. 66
75 INDEPENDENT AUDITORS' REPORTS 67
76
77
78
79

80
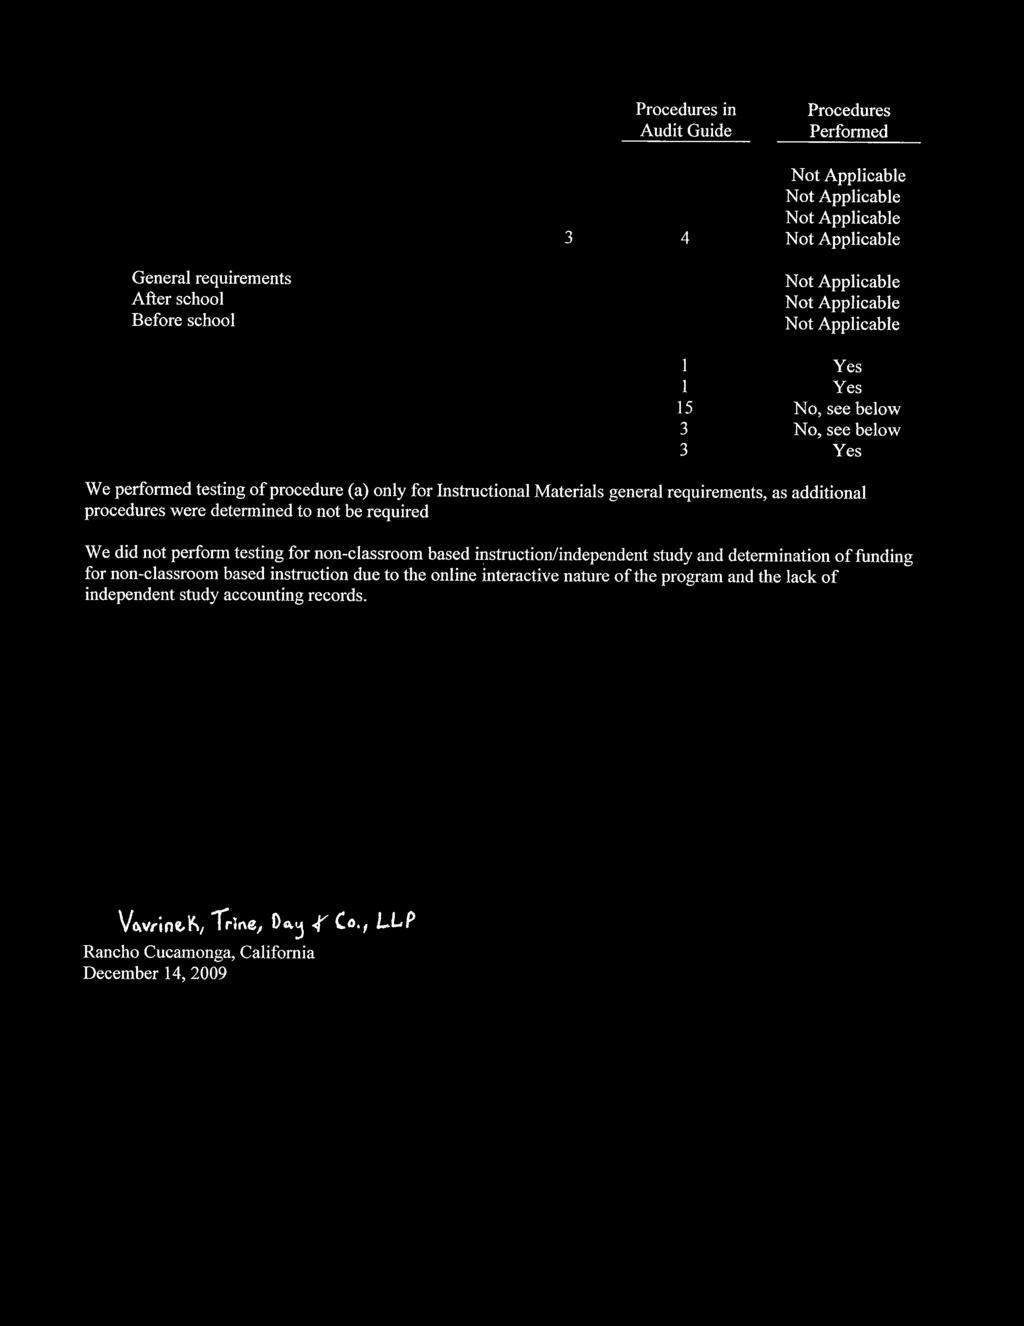
81
82 SCHEDULE OF FINDINGS AND QUESTIONED COSTS 74
83 SUMMARY OF AUDITORS' RESULTS FOR THE YEAR ENDED FINANCIAL STATEMENTS Type of auditors' report issued: Internal control over financial reporting: Material weaknesses identified? Significant deficiencies identified not considered to be material weaknesses? Noncompliance material to financial statements noted? FEDERAL AWARDS Internal control over major programs: Material weaknesses identified? Significant deficiencies identified not considered to be material weaknesses? Type of auditors' report issued on compliance for major programs: Any audit findings disclosed that are required to be reported in accordance with Circular A-133, Section.510(a) Identification of major programs: Unqualified No None reported No No None reported Unqualified No CFDA Number Name of Federal Program or Cluster Special Education - Local Assistant Entitlement ARRA - State Fiscal Stabilization Fund Dollar threshold used to distinguish between Type A and Type B programs: Auditee qualified as low-risk auditee? STATE AWARDS Internal control over State programs: Material weaknesses identified? Significant deficiencies identified not considered to be material weaknesses? Type of auditors' report issued on compliance for State programs: $ 300,000 Yes No Yes Qualified 75
84 FINANCIAL STATEMENT FINDINGS FOR THE YEAR ENDED None reported. 76
85 FEDERAL AWARDS FINDINGS AND QUESTIONED COSTS FOR THE YEAR ENDED None reported. 77
86 STATE AWARDS FINDINGS AND QUESTIONED COSTS FOR THE YEAR ENDED The following findings represent instances of noncompliance and/or questioned costs relating to State program laws and regulations. The findings have been coded as follows: Five Digit Code AB 3627 Finding Type State Compliance CHOICE 2000 ONLINE HIGH SCHOOL Finding The California Code of Regulations, Title 5, pursuant to Section of the California Education Code and in compliance with Article 5.5 Section through of the California Education Code requires that a Non-Classroom Based Charter Program utilize Independent Study attendance accounting procedures. Questioned Costs Independent study regulations must be followed to account for attendance in a "non-classroom based" charter program, therefore all ADA reported by the school for should be considered non-allowable for funding purposes. Per the certified July 2, 2009, Second Principal Apportionment, the total General Purpose Entitlement Funding was $1,024,903 at $6,611 per ADA, and the Categorical per ADA Block Grant Funding was $77,515, at $500 per ADA. Additionally, on September 29, 2009, a revised P-2 report was submitted with ADA of The increase of 8.64 ADA should also be considered non-allowable for funding purposes. The additional General Purpose Entitlement Funding is $57,119 at $6,611 per ADA, and the categorical per ADA Block Grant Funding is $4,320, at $500 per ADA. Context The questioned costs were based upon testing of the attendance records at Choice 2000 Online High School. Effect Due to the application of regular seat time attendance procedures instead of Independent Study attendance accounting, Choice 2000 Online High School is not in compliance with referenced guidelines. Cause Choice 2000 Online Charter, a Non-Classroom Based charter school has been in operation since The school has been utilizing contemporaneous attendance records and a course bell schedule, similar to that of a classroom based high school. 78
87 STATE AWARDS FINDINGS AND QUESTIONED COSTS FOR THE YEAR ENDED Recommendation Section of the "Standards and Procedures for Audits of California K - 12 Local Educational Agencies" Audit Guide published by the Education Audit Appeals Panel for fiscal year requires that Independent Study attendance accounting procedures be followed for non-classroom based charter programs. In order to avoid future penalty, we recommend that the District establish procedures of attendance accounting to be in compliance with Section of the Audit Guide. District Response The District will continue to work with legal counsel through the appeal process. The District believes Choice 2000 complied with all legal requirements governing the educational program being provided at Choice 2000, and therefore believes ADA should be allowable for funding purposes. Choice 2000 has acted in good faith at all times to comply with the conditions established in law or regulation necessary for apportionment of funding. 79
88 SUMMARY SCHEDULE OF PRIOR AUDIT FINDINGS FOR THE YEAR ENDED Except as specified in previous sections of this report, summarized below is the current status of all audit findings reported in the prior year's schedule of financial statement findings. State Award Findings Five Digit Code AB 3627 Finding Type State Compliance CHOICE 2000 ONLINE HIGH SCHOOL Finding The California Code of Regulations, Title 5, pursuant to Section of the California Education Code and in compliance with Article 5.5 Section through of the California Education Code requires that a Non-Classroom Based Charter Program utilize Independent Study attendance accounting procedures. Questioned Costs Independent study regulations must be followed to account for attendance in a "non-classroom based" charter program, therefore all ADA reported by the school for should be considered non-allowable for funding purposes. Per the certified July 2, 2008, Second Principal Apportionment, the total General Purpose Entitlement Funding was $1,003,817 at $6,767 per ADA, and the Categorical per ADA Block Grant Funding was $74,170, at $500 per ADA. Context The questioned costs were based upon testing of the attendance records at Choice 2000 Online High School. Effect Due to the application of regular seat time attendance procedures instead of Independent Study attendance accounting, Choice 2000 Online High School is not in compliance with referenced guidelines. Cause Choice 2000 Online Charter, a Non-Classroom Based charter school has been in operation since The school has been utilizing contemporaneous attendance records and a course bell schedule, similar to that of a classroom based high school. 80
89 SUMMARY SCHEDULE OF PRIOR AUDIT FINDINGS FOR THE YEAR ENDED Recommendation Section of the "Standards and Procedures for Audits of California K - 12 Local Educational Agencies" Audit Guide published by the Education Audit Appeals Panel for fiscal year requires that Independent Study attendance accounting procedures be followed for non-classroom based charter programs. In order to avoid future penalty, we recommend that the District establish procedures of attendance accounting to be in compliance with Section of the Audit Guide. Current Status Not implemented, see current year Criteria or Specific Requirements The District must offer instructional time equivalent to, or greater than, the required amount of instructional time as set forth in Education Code Section 46201, or the amount offered by the District during the school year, whichever is greater. Condition The annual instructional time calculation for grades 9-12 at Paloma Valley High School appears to be 148 minutes below the 64,800 minute requirement needed to receive funding under the Longer Day/Longer Year Incentive Program. Questioned Costs The penalty as calculated per Education Code Section 46201(d) is as follows: Context Average Daily Base Revenue Limit Attendance (ADA) per ADA Apportionment 6, X $6, = $43,372, Number of Minutes Number of Required Short Minutes ,800 = Apportionment Percentage Penalty $43,372, X 0.23 percent = $99, The questioned costs and findings were based on testing of the Longer Day/Longer Year Incentive Program. 81
90 SUMMARY SCHEDULE OF PRIOR AUDIT FINDINGS FOR THE YEAR ENDED Effect It appears that the District is out of compliance with the Longer Day/Longer Year Incentive Program. Cause Per inquiry with the District's personnel, it appears that the bell schedules at Paloma Valley High School were revised at some point during the school year, without verifying the effect on continued compliance. Recommendation Per Education Code 46206(b) a waiver may be filed with the Department of Education to avoid any penalties that may be levied by the State on funds already allocated to the District. The District must maintain minutes of instruction equal to those lost in addition to the amount otherwise required for the two years following the year in which the waiver is granted. Current Status Implemented. 82
91
92
PERRIS UNION HIGH SCHOOL DISTRICT ANNUAL FINANCIAL REPORT JUNE 30, 2010
 PERRIS UNION HIGH SCHOOL DISTRICT ANNUAL FINANCIAL REPORT TABLE OF CONTENTS FINANCIAL SECTION Independent Auditors' Report 2 Management's Discussion and Analysis 4 Basic Financial Statements Government-Wide
PERRIS UNION HIGH SCHOOL DISTRICT ANNUAL FINANCIAL REPORT JUNE 30, 2008
 PERRIS UNION HIGH SCHOOL DISTRICT ANNUAL FINANCIAL REPORT OF RIVERSIDE COUNTY PERRIS, CALIFORNIA GOVERNING BOARD MEMBER OFFICE TERM EXPIRES Eric J. Kroencke President 2011 Joan D. Cooley Vice President
MANHATTAN BEACH UNIFIED SCHOOL DISTRICT TABLE OF CONTENTS JUNE 30, 2010
 TABLE OF CONTENTS FINANCIAL SECTION Independent Auditors' Report 2 Management's Discussion and Analysis 4 Basic Financial Statements Government-Wide Financial Statements Statement of Net Assets 13 Statement
VICTOR VALLEY UNION HIGH SCHOOL DISTRICT ANNUAL FINANCIAL REPORT JUNE 30, 2015
 VICTOR VALLEY UNION HIGH SCHOOL DISTRICT ANNUAL FINANCIAL REPORT TABLE OF CONTENTS FINANCIAL SECTION Independent Auditor's Report 2 Management's Discussion and Analysis 5 Basic Financial Statements Government-Wide
ANNUAL FINANCIAL REPORT JUNE 30, 2015
 ANNUAL FINANCIAL REPORT TABLE OF CONTENTS FINANCIAL SECTION Independent Auditor's Report 2 Management's Discussion and Analysis 5 Basic Financial Statements Government-Wide Financial Statements Statement
CASTRO VALLEY UNIFIED SCHOOL DISTRICT ANNUAL FINANCIAL REPORT JUNE 30, 2009
 CASTRO VALLEY UNIFIED SCHOOL DISTRICT ANNUAL FINANCIAL REPORT JUNE 30, 2009 OF ALAMEDA COUNTY CASTRO VALLEY, CALIFORNIA JUNE 30, 2009 GOVERNING BOARD MEMBER OFFICE TERM EXPIRES George Granger President
WEST SONOMA COUNTY UNION HIGH SCHOOL DISTRICT ANNUAL FINANCIAL REPORT JUNE 30, 2011
 WEST SONOMA COUNTY UNION HIGH SCHOOL DISTRICT ANNUAL FINANCIAL REPORT TABLE OF CONTENTS FINANCIAL SECTION Independent Auditors' Report 2 Management's Discussion and Analysis 4 Basic Financial Statements
COACHELLA VALLEY UNIFIED SCHOOL DISTRICT TABLE OF CONTENTS JUNE 30, 2010
 TABLE OF CONTENTS FINANCIAL SECTION Independent Auditors' Report 2 Management's Discussion and Analysis 4 Basic Financial Statements Government-Wide Financial Statements Statement of Net Assets 14 Statement
PERRIS UNION HIGH SCHOOL DISTRICT ANNUAL FINANCIAL REPORT JUNE 30, 2015
 PERRIS UNION HIGH SCHOOL DISTRICT ANNUAL FINANCIAL REPORT TABLE OF CONTENTS FINANCIAL SECTION Independent Auditor's Report 2 Management's Discussion and Analysis 5 Basic Financial Statements Government-Wide
MORONGO UNIFIED SCHOOL DISTRICT ANNUAL FINANCIAL REPORT JUNE 30, 2015
 ANNUAL FINANCIAL REPORT TABLE OF CONTENTS FINANCIAL SECTION Independent Auditor's Report 2 Management's Discussion and Analysis 5 Basic Financial Statements Government-Wide Financial Statements Statement
ANNUAL FINANCIAL REPORT JUNE 30, 2017
 ANNUAL FINANCIAL REPORT TABLE OF CONTENTS FINANCIAL SECTION Independent Auditor's Report 2 Management's Discussion and Analysis 5 Basic Financial Statements Government-Wide Financial Statements Statement
CUCAMONGA SCHOOL DISTRICT ANNUAL FINANCIAL REPORT JUNE 30, 2016
 CUCAMONGA SCHOOL DISTRICT ANNUAL FINANCIAL REPORT TABLE OF CONTENTS FINANCIAL SECTION Independent Auditor's Report 2 Management's Discussion and Analysis 5 Basic Financial Statements Government-Wide Financial
BANNING UNIFIED SCHOOL DISTRICT ANNUAL FINANCIAL REPORT JUNE 30, 2016
 BANNING UNIFIED SCHOOL DISTRICT ANNUAL FINANCIAL REPORT TABLE OF CONTENTS FINANCIAL SECTION Independent Auditor's Report 2 Management's Discussion and Analysis 5 Basic Financial Statements Government-Wide
TRACY UNIFIED SCHOOL DISTRICT ANNUAL FINANCIAL REPORT JUNE 30, 2014
 TRACY UNIFIED SCHOOL DISTRICT ANNUAL FINANCIAL REPORT TABLE OF CONTENTS FINANCIAL SECTION Independent Auditor s Report 2 Management's Discussion and Analysis 5 Basic Financial Statements Government-Wide
LINDSAY UNIFIED SCHOOL DISTRICT ANNUAL FINANCIAL REPORT JUNE 30, 2015
 ANNUAL FINANCIAL REPORT TABLE OF CONTENTS FINANCIAL SECTION Independent Auditor's Report 2 Management's Discussion and Analysis 5 Basic Financial Statements Government-Wide Financial Statements Statement
PERRIS UNION HIGH SCHOOL DISTRICT ANNUAL FINANCIAL REPORT JUNE 30, 2012
 PERRIS UNION HIGH SCHOOL DISTRICT ANNUAL FINANCIAL REPORT TABLE OF CONTENTS FINANCIAL SECTION Independent Auditors' Report 2 Management's Discussion and Analysis 4 Basic Financial Statements Government-Wide
REDWOOD CITY SCHOOL DISTRICT ANNUAL FINANCIAL REPORT JUNE 30, 2017
 REDWOOD CITY SCHOOL DISTRICT ANNUAL FINANCIAL REPORT TABLE OF CONTENTS FINANCIAL SECTION Independent Auditor s Report 2 Management's Discussion and Analysis 5 Basic Financial Statements Government-Wide
CERES UNIFIED SCHOOL DISTRICT ANNUAL FINANCIAL REPORT JUNE 30, 2014
 Vavrinek, Trine, Day & Co., LLP Certified Public Accountants VALUE THE DIFFERENCE December 14, 2014 State Controller's Office Division of Audits Financial Audits Bureau - Education Oversight Unit Via PDF
WASHINGTON UNIFIED SCHOOL DISTRICT ANNUAL FINANCIAL REPORT JUNE 30, 2015
 ANNUAL FINANCIAL REPORT TABLE OF CONTENTS FINANCIAL SECTION Independent Auditor's Report 2 Management's Discussion and Analysis 5 Basic Financial Statements Government-Wide Financial Statements Statement
FALLBROOK UNION HIGH SCHOOL DISTRICT ANNUAL FINANCIAL REPORT JUNE 30, 2017
 FALLBROOK UNION HIGH SCHOOL DISTRICT ANNUAL FINANCIAL REPORT TABLE OF CONTENTS FINANCIAL SECTION Independent Auditor's Report 2 Management's Discussion and Analysis 5 Basic Financial Statements Government-Wide
ANNUAL FINANCIAL REPORT JUNE 30, 2018
 ANNUAL FINANCIAL REPORT TABLE OF CONTENTS FINANCIAL SECTION Independent Auditor's Report 2 Management's Discussion and Analysis 5 Basic Financial Statements Government-Wide Financial Statements Statement
HUGHSON UNIFIED SCHOOL DISTRICT ANNUAL FINANCIAL REPORT JUNE 30, 2016
 ANNUAL FINANCIAL REPORT TABLE OF CONTENTS FINANCIAL SECTION Independent Auditor's Report 2 Management's Discussion and Analysis 5 Basic Financial Statements Government-Wide Financial Statements Statement
PALO VERDE UNIFIED SCHOOL DISTRICT ANNUAL FINANCIAL REPORT JUNE 30, 2015
 PALO VERDE UNIFIED SCHOOL DISTRICT ANNUAL FINANCIAL REPORT TABLE OF CONTENTS FINANCIAL SECTION Independent Auditor's Report 2 Management's Discussion and Analysis 5 Basic Financial Statements Government-Wide
WASHINGTON UNIFIED SCHOOL DISTRICT ANNUAL FINANCIAL REPORT JUNE 30, 2014
 ANNUAL FINANCIAL REPORT TABLE OF CONTENTS FINANCIAL SECTION Independent Auditor's Report 2 Management's Discussion and Analysis 5 Basic Financial Statements Government-Wide Financial Statements Statement
BISHOP UNIFIED SCHOOL DISTRICT ANNUAL FINANCIAL REPORT
 BISHOP UNIFIED SCHOOL DISTRICT ANNUAL FINANCIAL REPORT TABLE OF CONTENTS FINANCIAL SECTION Independent Auditor's Report 2 Management's Discussion and Analysis 5 Basic Financial Statements Government-Wide
ANAHEIM UNION HIGH SCHOOL DISTRICT ANNUAL FINANCIAL REPORT JUNE 30, 2015
 ANAHEIM UNION HIGH SCHOOL DISTRICT ANNUAL FINANCIAL REPORT TABLE OF CONTENTS FINANCIAL SECTION Independent Auditor's Report 2 Management's Discussion and Analysis 5 Basic Financial Statements Government-Wide
SOLEDAD UNIFIED SCHOOL DISTRICT ANNUAL FINANCIAL REPORT JUNE 30, 2015
 ANNUAL FINANCIAL REPORT TABLE OF CONTENTS FINANCIAL SECTION Independent Auditor's Report 2 Management's Discussion and Analysis 5 Basic Financial Statements Government-Wide Financial Statements Statement
LOS ALAMITOS UNIFIED SCHOOL DISTRICT ANNUAL FINANCIAL REPORT JUNE 30, 2015
 LOS ALAMITOS UNIFIED SCHOOL DISTRICT ANNUAL FINANCIAL REPORT TABLE OF CONTENTS FINANCIAL SECTION Independent Auditor's Report 2 Management's Discussion and Analysis 5 Basic Financial Statements Government-Wide
TRAVIS UNIFIED SCHOOL DISTRICT ANNUAL FINANCIAL REPORT JUNE 30, 2017
 TRAVIS UNIFIED SCHOOL DISTRICT ANNUAL FINANCIAL REPORT TABLE OF CONTENTS FINANCIAL SECTION Independent Auditor's Report 2 Management's Discussion and Analysis 5 Basic Financial Statements Government-Wide
LAGUNA BEACH UNIFIED SCHOOL DISTRICT ANNUAL FINANCIAL REPORT JUNE 30, 2018
 LAGUNA BEACH UNIFIED SCHOOL DISTRICT ANNUAL FINANCIAL REPORT TABLE OF CONTENTS FINANCIAL SECTION Independent Auditor's Report 2 Management's Discussion and Analysis 5 Basic Financial Statements Government-Wide
OJAI UNIFIED SCHOOL DISTRICT
 OJAI UNIFIED SCHOOL DISTRICT ANNUAL FINANCIAL REPORT TABLE OF CONTENTS FINANCIAL SECTION Independent Auditor's Report 2 Management's Discussion and Analysis 5 Basic Financial Statements Government-Wide
CONEJO VALLEY UNIFIED SCHOOL DISTRICT ANNUAL FINANCIAL REPORT JUNE 30, 2017
 CONEJO VALLEY UNIFIED SCHOOL DISTRICT ANNUAL FINANCIAL REPORT JUNE 30, 2017 TABLE OF CONTENTS JUNE 30, 2017 FINANCIAL SECTION Independent Auditor's Report 2 Management's Discussion and Analysis 5 Basic
LOMPOC UNIFIED SCHOOL DISTRICT ANNUAL FINANCIAL REPORT JUNE 30, 2016
 LOMPOC UNIFIED SCHOOL DISTRICT ANNUAL FINANCIAL REPORT TABLE OF CONTENTS FINANCIAL SECTION Independent Auditor's Report 2 Management's Discussion and Analysis 5 Basic Financial Statements Government-Wide
SOLEDAD UNIFIED SCHOOL DISTRICT ANNUAL FINANCIAL REPORT JUNE 30, 2016
 ANNUAL FINANCIAL REPORT TABLE OF CONTENTS FINANCIAL SECTION Independent Auditor's Report 2 Management's Discussion and Analysis 5 Basic Financial Statements Government-Wide Financial Statements Statement
WASHINGTON UNIFIED SCHOOL DISTRICT ANNUAL FINANCIAL REPORT JUNE 30, 2016
 ANNUAL FINANCIAL REPORT TABLE OF CONTENTS FINANCIAL SECTION Independent Auditor's Report 2 Management's Discussion and Analysis 5 Basic Financial Statements Government-Wide Financial Statements Statement
DOS PALOS-ORO LOMA JOINT UNIFIED SCHOOL DISTRICT ANNUAL FINANCIAL REPORT JUNE 30, 2016
 DOS PALOS-ORO LOMA JOINT UNIFIED SCHOOL DISTRICT ANNUAL FINANCIAL REPORT TABLE OF CONTENTS FINANCIAL SECTION Independent Auditor's Report 2 Management's Discussion and Analysis 5 Basic Financial Statements
TRACY UNIFIED SCHOOL DISTRICT ANNUAL FINANCIAL REPORT JUNE 30, 2015
 TRACY UNIFIED SCHOOL DISTRICT ANNUAL FINANCIAL REPORT TABLE OF CONTENTS FINANCIAL SECTION Independent Auditor s Report 2 Management's Discussion and Analysis 5 Basic Financial Statements Government-Wide
SANTEE SCHOOL DISTRICT ANNUAL FINANCIAL REPORT JUNE 30, 2015
 ANNUAL FINANCIAL REPORT TABLE OF CONTENTS FINANCIAL SECTION Independent Auditor's Report 2 Management's Discussion and Analysis 5 Basic Financial Statements Government-Wide Financial Statements Statement
REDWOOD CITY SCHOOL DISTRICT ANNUAL FINANCIAL REPORT JUNE 30, 2016
 REDWOOD CITY SCHOOL DISTRICT ANNUAL FINANCIAL REPORT TABLE OF CONTENTS FINANCIAL SECTION Independent Auditor s Report 2 Management's Discussion and Analysis 5 Basic Financial Statements Government-Wide
RIM OF THE WORLD UNIFIED SCHOOL DISTRICT
 RIM OF THE WORLD UNIFIED SCHOOL DISTRICT ANNUAL FINANCIAL REPORT TABLE OF CONTENTS FINANCIAL SECTION Independent Auditor's Report 2 Management's Discussion and Analysis 5 Basic Financial Statements Government-Wide
PALO ALTO UNIFIED SCHOOL DISTRICT ANNUAL FINANCIAL REPORT FOR THE YEAR ENDED JUNE 30, 2016
 PALO ALTO UNIFIED SCHOOL DISTRICT ANNUAL FINANCIAL REPORT FOR THE YEAR ENDED TABLE OF CONTENTS FINANCIAL SECTION Independent Auditor's Report 2 Management s Discussion and Analysis 5 Basic Financial Statements
ANNUAL FINANCIAL REPORT JUNE 30, 2017
 ANNUAL FINANCIAL REPORT TABLE OF CONTENTS FINANCIAL SECTION Independent Auditor's Report 2 Management's Discussion and Analysis 5 Basic Financial Statements Government-Wide Financial Statements Statement
MAMMOTH UNIFIED SCHOOL DISTRICT ANNUAL FINANCIAL REPORT JUNE 30, 2013
 ANNUAL FINANCIAL REPORT TABLE OF CONTENTS FINANCIAL SECTION Independent Auditors' Report 2 Management's Discussion and Analysis 5 Basic Financial Statements Government-Wide Financial Statements Statement
ABC UNIFIED SCHOOL DISTRICT ANNUAL FINANCIAL REPORT JUNE 30, 2013
 ABC UNIFIED SCHOOL DISTRICT ANNUAL FINANCIAL REPORT TABLE OF CONTENTS FINANCIAL SECTION Independent Auditors' Report 2 Management's Discussion and Analysis 5 Basic Financial Statements Government-Wide
SANTEE SCHOOL DISTRICT ANNUAL FINANCIAL REPORT JUNE 30, 2012
 ANNUAL FINANCIAL REPORT TABLE OF CONTENTS FINANCIAL SECTION Independent Auditors' Report 2 Management's Discussion and Analysis 4 Basic Financial Statements Government-Wide Financial Statements Statement
ANAHEIM UNION HIGH SCHOOL DISTRICT ANNUAL FINANCIAL REPORT JUNE 30, 2016
 ANAHEIM UNION HIGH SCHOOL DISTRICT ANNUAL FINANCIAL REPORT TABLE OF CONTENTS FINANCIAL SECTION Independent Auditor's Report 2 Management's Discussion and Analysis 5 Basic Financial Statements Government-Wide
ANAHEIM UNION HIGH SCHOOL DISTRICT ANNUAL FINANCIAL REPORT JUNE 30, 2013
 ANAHEIM UNION HIGH SCHOOL DISTRICT ANNUAL FINANCIAL REPORT TABLE OF CONTENTS FINANCIAL SECTION Independent Auditors' Report 2 Management's Discussion and Analysis 5 Basic Financial Statements Government-Wide
LOS ALAMITOS UNIFIED SCHOOL DISTRICT ANNUAL FINANCIAL REPORT JUNE 30, 2016
 LOS ALAMITOS UNIFIED SCHOOL DISTRICT ANNUAL FINANCIAL REPORT TABLE OF CONTENTS FINANCIAL SECTION Independent Auditor's Report 2 Management's Discussion and Analysis 5 Basic Financial Statements Government-Wide
Lawndale Elementary School District. Annual Financial Report. June 30, 2015
 Lawndale Elementary School District Annual Financial Report June 30, 2015 TABLE OF CONTENTS FINANCIAL SECTION Independent Auditor's Report 2 Management's Discussion and Analysis 5 Basic Financial Statements
IRVINE UNIFIED SCHOOL DISTRICT ANNUAL FINANCIAL REPORT JUNE 30, 2016
 IRVINE UNIFIED SCHOOL DISTRICT ANNUAL FINANCIAL REPORT TABLE OF CONTENTS FINANCIAL SECTION Independent Auditor's Report 2 Management's Discussion and Analysis 5 Basic Financial Statements Government-Wide
BAKERSFIELD CITY SCHOOL DISTRICT ANNUAL FINANCIAL REPORT JUNE 30, 2017
 ANNUAL FINANCIAL REPORT TABLE OF CONTENTS FINANCIAL SECTION Independent Auditor's Report 2 Management's Discussion and Analysis 5 Basic Financial Statements Government-Wide Financial Statements Statement
BURNT RANCH ELEMENTARY SCHOOL DISTRICT TABLE OF CONTENTS JUNE 30, 2016
 BURNT RANCH ELEMENTARY SCHOOL DISTRICT ANNUAL FINANCIAL REPORT 12/14/2016 TABLE OF CONTENTS FINANCIAL SECTION Independent Auditor's Report 2 Management's Discussion and Analysis 5 Basic Financial Statements
SAN LEANDRO UNIFIED SCHOOL DISTRICT ANNUAL FINANCIAL REPORT JUNE 30, 2018
 SAN LEANDRO UNIFIED SCHOOL DISTRICT ANNUAL FINANCIAL REPORT TABLE OF CONTENTS FINANCIAL SECTION Independent Auditor's Report 2 Management's Discussion and Analysis 5 Basic Financial Statements Government-Wide
Vavrinek, Trine, Day & Co., LLP
 Vavrinek, Trine, Day & Co., LLP Certified Public Accountants VALUE THE DIFFERENCE October 21, 2014 State Controller's Office Division of Audits Financial Audits Bureau - Education Oversight Unit Via PDF
COACHELLA VALLEY UNIFIED SCHOOL DISTRICT ANNUAL FINANCIAL REPORT JUNE 30, 2012
 COACHELLA VALLEY UNIFIED SCHOOL DISTRICT ANNUAL FINANCIAL REPORT TABLE OF CONTENTS FINANCIAL SECTION Independent Auditors' Report 2 Management's Discussion and Analysis 4 Basic Financial Statements Government-Wide
IRVINE UNIFIED SCHOOL DISTRICT ANNUAL FINANCIAL REPORT JUNE 30, 2017
 IRVINE UNIFIED SCHOOL DISTRICT ANNUAL FINANCIAL REPORT TABLE OF CONTENTS FINANCIAL SECTION Independent Auditor's Report 2 Management's Discussion and Analysis 5 Basic Financial Statements Government-Wide
ANNUAL FINANCIAL REPORT JUNE 30, 2017
 ANNUAL FINANCIAL REPORT TABLE OF CONTENTS FINANCIAL SECTION Independent Auditor's Report 2 Management's Discussion and Analysis 5 Basic Financial Statements Government-Wide Financial Statements Statement
LITTLE LAKE CITY SCHOOL DISTRICT ANNUAL FINANCIAL REPORT JUNE 30, 2016
 ANNUAL FINANCIAL REPORT TABLE OF CONTENTS FINANCIAL SECTION Independent Auditor's Report 2 Management's Discussion and Analysis 5 Basic Financial Statements Government-Wide Financial Statements Statement
ETIWANDA SCHOOL DISTRICT ANNUAL FINANCIAL REPORT 1883 JUNE 30, 2017
 ETIWANDA SCHOOL DISTRICT ANNUAL FINANCIAL REPORT 1883 TABLE OF CONTENTS FINANCIAL SECTION Independent Auditor's Report 2 Management's Discussion and Analysis 5 Basic Financial Statements Government-Wide
SANTA BARBARA UNIFIED SCHOOL DISTRICT ANNUAL FINANCIAL REPORT JUNE 30, 2013
 SANTA BARBARA UNIFIED SCHOOL DISTRICT ANNUAL FINANCIAL REPORT TABLE OF CONTENTS FINANCIAL SECTION Independent Auditors' Report 2 Management's Discussion and Analysis 5 Basic Financial Statements Government-Wide
WILLIAM S. HART UNION HIGH SCHOOL DISTRICT ANNUAL FINANCIAL REPORT JUNE 30, 2017
 WILLIAM S. HART UNION HIGH SCHOOL DISTRICT ANNUAL FINANCIAL REPORT JUNE 30, 2017 TABLE OF CONTENTS JUNE 30, 2017 FINANCIAL SECTION Independent Auditor's Report 2 Management's Discussion and Analysis 5
LINDSAY UNIFIED SCHOOL DISTRICT ANNUAL FINANCIAL REPORT JUNE 30, 2008
 LINDSAY UNIFIED SCHOOL DISTRICT ANNUAL FINANCIAL REPORT JUNE 30, 2008 OF TULARE COUNTY LINDSAY, CALIFORNIA JUNE 30, 2008 MEMBER Frank Moreno Mercedes Herrera Vahnn Blue Jean Miller Jim Williams GOVERNING
SWEETWATER UNION HIGH SCHOOL DISTRICT
 SWEETWATER UNION HIGH SCHOOL DISTRICT AUDIT REPORT For the Fiscal Year Ended June 30, 2010 AUDIT REPORT For the Fiscal Year Ended June 30, 2010 Table of Contents FINANCIAL SECTION Page Independent Auditor
SAN LEANDRO UNIFIED SCHOOL DISTRICT ANNUAL FINANCIAL REPORT JUNE 30, 2016
 SAN LEANDRO UNIFIED SCHOOL DISTRICT ANNUAL FINANCIAL REPORT TABLE OF CONTENTS FINANCIAL SECTION Independent Auditor s Report 2 Management's Discussion and Analysis 5 Basic Financial Statements Government-Wide
ANNUAL FINANCIAL REPORT JUNE 30, 2018
 ANNUAL FINANCIAL REPORT JUNE 30, 2018 TABLE OF CONTENTS JUNE 30, 2018 FINANCIAL SECTION Independent Auditor's Report 2 Management's Discussion and Analysis 5 Basic Financial Statements Government-Wide
ANNUAL FINANCIAL REPORT JUNE 30, 2018
 ANNUAL FINANCIAL REPORT TABLE OF CONTENTS FINANCIAL SECTION Independent Auditor's Report 2 Management's Discussion and Analysis 5 Basic Financial Statements Government-Wide Financial Statements Statement
GLENN COUNTY OFFICE OF EDUCATION AUDIT REPORT
 GLENN COUNTY OFFICE OF EDUCATION AUDIT REPORT For the Fiscal Year Ended June 30, 2010 AUDIT REPORT For the Fiscal Year Ended June 30, 2010 Table of Contents FINANCIAL SECTION Page Independent Auditor s
SAN LUIS OBISPO COUNTY OFFICE OF EDUCATION ANNUAL FINANCIAL REPORT JUNE 30, 2018
 SAN LUIS OBISPO COUNTY OFFICE OF EDUCATION ANNUAL FINANCIAL REPORT TABLE OF CONTENTS FINANCIAL SECTION Independent Auditor's Report 2 Management's Discussion and Analysis 5 Basic Financial Statements Government-Wide
COVINA-VALLEY UNIFIED SCHOOL DISTRICT ANNUAL FINANCIAL REPORT JUNE 30, 2017
 ANNUAL FINANCIAL REPORT TABLE OF CONTENTS FINANCIAL SECTION Independent Auditor's Report 2 Management's Discussion and Analysis 5 Basic Financial Statements Government-Wide Financial Statements Statement
MARK TWAIN UNION ELEMENTARY SCHOOL DISTRICT ANNUAL FINANCIAL REPORT FOR THE YEAR ENDED JUNE 30, 2017
 MARK TWAIN UNION ELEMENTARY SCHOOL DISTRICT ANNUAL FINANCIAL REPORT FOR THE YEAR ENDED This page left blank intentionally. TABLE OF CONTENTS FOR THE YEAR ENDED FINANCIAL SECTION Independent Auditor s Report
HERMOSA BEACH CITY SCHOOL DISTRICT ANNUAL FINANCIAL REPORT JUNE 30, 2014
 Vavrinek, Trine, Day & Co., LLP Certified Public Accountants VALUE THE DIFFERENCE December 15, 2014 State Controller's Office Division of Audits Financial Audits Bureau - Education Oversight Unit Via PDF
BURTON SCHOOL DISTRICT ANNUAL FINANCIAL REPORT JUNE 30, 2016
 ANNUAL FINANCIAL REPORT TABLE OF CONTENTS FINANCIAL SECTION Independent Auditor's Report 2 Management's Discussion and Analysis 5 Basic Financial Statements Government-Wide Financial Statements Statement
ESCALON UNIFIED SCHOOL DISTRICT OF SAN JOAQUIN COUNTY ESCALON, CALIFORNIA JUNE 30, 2018 GOVERNING BOARD MEMBER OFFICE TERM EXPIRES
 OF SAN JOAQUIN COUNTY ESCALON, CALIFORNIA GOVERNING BOARD MEMBER OFFICE TERM EXPIRES Martha Coelho President 2020 Kate Powell Vice President 2018 John Largent Clerk 2018 Richard Thompson Member 2018 Nick
SAUGUS UNION SCHOOL DISTRICT
 SAUGUS UNION SCHOOL DISTRICT Excellence in Elementary Education ANNUAL FINANCIAL REPORT TABLE OF CONTENTS FINANCIAL SECTION Independent Auditor's Report 2 Management's Discussion and Analysis 5 Basic Financial
MARK TWAIN UNION ELEMENTARY SCHOOL DISTRICT ANNUAL FINANCIAL REPORT FOR THE YEAR ENDED JUNE 30, 2018
 MARK TWAIN UNION ELEMENTARY SCHOOL DISTRICT ANNUAL FINANCIAL REPORT FOR THE YEAR ENDED This page left blank intentionally. TABLE OF CONTENTS FOR THE YEAR ENDED FINANCIAL SECTION Independent Auditor's Report
SAUGUS UNION SCHOOL DISTRICT
 SAUGUS UNION SCHOOL DISTRICT Excellence in Elementary Education ANNUAL FINANCIAL REPORT TABLE OF CONTENTS FINANCIAL SECTION Independent Auditor's Report 2 Management's Discussion and Analysis 5 Basic Financial
ESCALON UNIFIED SCHOOL DISTRICT OF SAN JOAQUIN COUNTY ESCALON, CALIFORNIA JUNE 30, 2016 GOVERNING BOARD MEMBER OFFICE TERM EXPIRES
 OF SAN JOAQUIN COUNTY ESCALON, CALIFORNIA JUNE 30, 2016 GOVERNING BOARD MEMBER OFFICE TERM EXPIRES Richard Thompson President 2018 Amy Bavaro Vice President 2016 Martha Coelho Clerk 2016 Kate Powell Member
SUNNYVALE SCHOOL DISTRICT ANNUAL FINANCIAL REPORT FOR THE YEAR ENDED JUNE 30, 2017
 ANNUAL FINANCIAL REPORT FOR THE YEAR ENDED This page left blank intentionally. TABLE OF CONTENTS FINANCIAL SECTION Independent Auditor s Report 2 Management's Discussion and Analysis 5 Basic Financial
DINUBA UNIFIED SCHOOL DISTRICT
 AUDIT REPORT JUNE 30, 2016 TABLE OF CONTENTS FOR THE YEAR ENDED JUNE 30, 2016 FINANCIAL SECTION Independent Auditors Report... 1 Management s Discussion and Analysis... 4 Basic Financial Statements Government
COVINA-VALLEY UNIFIED SCHOOL DISTRICT ANNUAL FINANCIAL REPORT JUNE 30, 2016
 ANNUAL FINANCIAL REPORT TABLE OF CONTENTS FINANCIAL SECTION Independent Auditor's Report 2 Management's Discussion and Analysis 5 Basic Financial Statements Government-Wide Financial Statements Statement
FREMONT UNION HIGH SCHOOL DISTRICT ANNUAL FINANCIAL REPORT FOR THE YEAR ENDED JUNE 30, 2016
 FREMONT UNION HIGH SCHOOL DISTRICT ANNUAL FINANCIAL REPORT FOR THE YEAR ENDED TABLE OF CONTENTS FINANCIAL SECTION Independent Auditor s Report 2 Management's Discussion and Analysis 5 Basic Financial
ETIWANDA SCHOOL DISTRICT ANNUAL FINANCIAL REPORT 1883 JUNE 30, 2016
 ETIWANDA SCHOOL DISTRICT ANNUAL FINANCIAL REPORT 1883 TABLE OF CONTENTS FINANCIAL SECTION Independent Auditor's Report 2 Management's Discussion and Analysis 5 Basic Financial Statements Government-Wide
SUNNYVALE SCHOOL DISTRICT ANNUAL FINANCIAL REPORT FOR THE YEAR ENDED JUNE 30, 2016
 ANNUAL FINANCIAL REPORT FOR THE YEAR ENDED TABLE OF CONTENTS FINANCIAL SECTION Independent Auditor s Report 2 Management's Discussion and Analysis 5 Basic Financial Statements Government-Wide Financial
FILLMORE UNIFIED SCHOOL DISTRICT
 AUDIT REPORT JUNE 30, 2017 TABLE OF CONTENTS FOR THE YEAR ENDED JUNE 30, 2017 FINANCIAL SECTION Independent Auditors Report... 1 Management s Discussion and Analysis... 4 Basic Financial Statements Government
ROSS VALLEY SCHOOL DISTRICT COUNTY OF MARIN SAN ANSELMO, CALIFORNIA AUDIT REPORT JUNE 30, 2009
 COUNTY OF MARIN SAN ANSELMO, CALIFORNIA AUDIT REPORT JUNE 30, 2009 JUNE 30, 2009 TABLE OF CONTENTS FINANCIAL SECTION Independent Auditor's Report Management's Discussion and Analysis (Unaudited) 1 3 Basic
PAJARO VALLEY UNIFIED SCHOOL DISTRICT ANNUAL FINANCIAL REPORT FOR THE YEAR ENDED JUNE 30, 2017
 PAJARO VALLEY UNIFIED SCHOOL DISTRICT ANNUAL FINANCIAL REPORT FOR THE YEAR ENDED This page left blank intentionally. TABLE OF CONTENTS FINANCIAL SECTION Independent Auditor s Report 2 Management's Discussion
CALAVERAS UNIFIED SCHOOL DISTRICT COUNTY OF CALAVERAS SAN ANDREAS, CALIFORNIA ANNUAL FINANCIAL REPORT JUNE 30, 2014
 COUNTY OF CALAVERAS SAN ANDREAS, CALIFORNIA ANNUAL FINANCIAL REPORT JUNE 30, 2014 JUNE 30, 2014 FINANCIAL SECTION TABLE OF CONTENTS Page Independent Auditor's Report 1 Management s Discussion and Analysis
EL SEGUNDO UNIFIED SCHOOL DISTRICT
 AUDIT REPORT OF LOS ANGELES COUNTY EL SEGUNDO, CALIFORNIA The El Segundo Unified School District maintains a K 12 educational program. The District is located primarily within the boundaries of the City
MANHATTAN BEACH UNIFIED SCHOOL DISTRICT ANNUAL FINANCIAL REPORT JUNE 30, 2016
 MANHATTAN BEACH UNIFIED SCHOOL DISTRICT ANNUAL FINANCIAL REPORT TABLE OF CONTENTS FINANCIAL SECTION Independent Auditor's Report 2 Management's Discussion and Analysis 5 Basic Financial Statements Government-Wide
MODESTO CITY SCHOOLS (MODESTO CITY SCHOOL DISTRICT) (MODESTO HIGH SCHOOL DISTRICT) ANNUAL FINANCIAL REPORT JUNE 30, 2015
 (MODESTO HIGH SCHOOL DISTRICT) ANNUAL FINANCIAL REPORT JUNE 30, 2015") (MODESTO CITY SCHOOL DISTRICT) (MODESTO HIGH SCHOOL DISTRICT) ANNUAL FINANCIAL REPORT TABLE OF CONTENTS FINANCIAL SECTION Independent Auditor's Report 2 Management's Discussion and Analysis 5 Basic Financial
(MODESTO CITY SCHOOL DISTRICT) (MODESTO HIGH SCHOOL DISTRICT) ANNUAL FINANCIAL REPORT TABLE OF CONTENTS FINANCIAL SECTION Independent Auditor's Report 2 Management's Discussion and Analysis 5 Basic Financial
GOLETA UNION SCHOOL DISTRICT ANNUAL FINANCIAL REPORT JUNE 30, 2017
 GOLETA UNION SCHOOL DISTRICT ANNUAL FINANCIAL REPORT TABLE OF CONTENTS FINANCIAL SECTION Independent Auditor's Report 2 Management's Discussion and Analysis 5 Basic Financial Statements Government-Wide
VENTURA COUNTY OFFICE OF EDUCATION ANNUAL FINANCIAL REPORT JUNE 30, 2016
 VENTURA COUNTY OFFICE OF EDUCATION ANNUAL FINANCIAL REPORT TABLE OF CONTENTS FINANCIAL SECTION Independent Auditor's Report 2 Management's Discussion and Analysis 5 Basic Financial Statements Government-Wide
BEAUMONT UNIFIED SCHOOL DISTRICT AUDIT REPORT For the Fiscal Year Ended June 30, 2016
 BEAUMONT UNIFIED SCHOOL DISTRICT AUDIT REPORT For the Fiscal Year Ended June 30, 2016 For the Fiscal Year Ended June 30, 2016 Table of Contents FINANCIAL SECTION Page Independent Auditors' Report... 1
TULARE COUNTY OFFICE OF EDUCATION AUDIT REPORT JUNE 30, 2016
 AUDIT REPORT JUNE 30, 2016 Received 12/15/2016 TABLE OF CONTENTS FOR THE YEAR ENDED JUNE 30, 2016 FINANCIAL SECTION Independent Auditors Report... 1 Management s Discussion and Analysis... 4 Basic Financial
CAMPBELL UNION SCHOOL DISTRICT ANNUAL FINANCIAL REPORT FOR THE YEAR ENDED JUNE 30, 2016
 CAMPBELL UNION SCHOOL DISTRICT ANNUAL FINANCIAL REPORT FOR THE YEAR ENDED TABLE OF CONTENTS FINANCIAL SECTION Independent Auditor s Report 2 Management's Discussion and Analysis 5 Basic Financial Statements
BENICIA UNIFIED SCHOOL DISTRICT COUNTY OF SOLANO BENICIA, CALIFORNIA FINANCIAL STATEMENTS WITH INDEPENDENT AUDITOR S REPORT
 COUNTY OF SOLANO BENICIA, CALIFORNIA FINANCIAL STATEMENTS WITH INDEPENDENT AUDITOR S REPORT FOR THE FISCAL YEAR ENDED JAMES MARTA & COMPANY LLP CERTIFIED PUBLIC ACCOUNTANTS 701 HOWE AVENUE, E3 SACRAMENTO,
DELHI UNIFIED SCHOOL DISTRICT Delhi, California. FINANCIAL STATEMENTS June 30, 2014
 Delhi, California FINANCIAL STATEMENTS June 30, 2014 FINANCIAL STATEMENTS WITH SUPPLEMENTARY INFORMATION For the Year Ended June 30, 2014 TABLE OF CONTENTS Page Independent Auditor's Report 1 Management's
NORWALK-LA MIRADA UNIFIED SCHOOL DISTRICT ANNUAL FINANCIAL REPORT JUNE 30, 2013
 NORWALK-LA MIRADA UNIFIED SCHOOL DISTRICT ANNUAL FINANCIAL REPORT TABLE OF CONTENTS FINANCIAL SECTION Independent Auditors' Report 2 Management's Discussion and Analysis 5 Basic Financial Statements Government-Wide
FREMONT UNION HIGH SCHOOL DISTRICT ANNUAL FINANCIAL REPORT FOR THE YEAR ENDED JUNE 30, 2017
 FREMONT UNION HIGH SCHOOL DISTRICT ANNUAL FINANCIAL REPORT FOR THE YEAR ENDED This page left blank intentionally. TABLE OF CONTENTS FINANCIAL SECTION Independent Auditor s Report 2 Management's Discussion
SEQUOIA UNION HIGH SCHOOL DISTRICT COUNTY OF SAN MATEO REDWOOD CITY, CALIFORNIA AUDIT REPORT JUNE 30, 2015
 SEQUOIA UNION HIGH SCHOOL DISTRICT COUNTY OF SAN MATEO REDWOOD CITY, CALIFORNIA AUDIT REPORT JUNE 30, 2015 CHAVAN & ASSOCIATES, LLP CERTIFIED PUBLIC ACCOUNTANTS 1475 SARATOGA AVE., SUITE 180 SAN JOSE,