Labour Market Statistics: September 2017 quarter
|
|
|
- Nigel Sutton
- 5 years ago
- Views:
Transcription
1 Labour Market Statistics: September 2017 quarter Embargoed until 10:45am 01 November 2017 Key facts Labour market at a glance Unemployment rate fell to 4.6 percent. Underutilisation rate unchanged at 11.8 percent. Employment rate rises to 67.8 percent. Wage rates grow 1.9 percent. Employment at a glance (seasonally adjusted) Sep 2017 quarter Quarterly change Annual change Percent Percentage points Unemployment rate Employment rate Labour force participation rate (000) Percent Unemployed Employed 2, Filled jobs 1, Working-age population 3, Wages at a glance Index Percent All sectors Private Wage inflation (salary and wage rates, sector including overtime) Public sector LCI analytical unadjusted Level Percent Average ordinary time hourly earnings $ Hours at a glance (figures seasonally adjusted) Level Percent Ordinary Average weekly paid hours for FTEs (QES) time Total (Million) Percent Total weekly paid hours (QES) Total actual weekly hours worked (HLFS) Note: LCI Labour Cost Index (salary and wage rates) QES Quarterly Employment Survey HLFS Household Labour Force Survey
2 Unemployment, underutilisation, and NEET In the September 2017 quarter, the seasonally adjusted unemployment rate fell to 4.6 percent (down 0.2 percentage points from the June quarter), the lowest unemployment rate since the December 2008 quarter. The number of unemployed people fell 2,000 from 128,000 to 126,000. The unemployment rate for men fell to 4.1 percent (down 0.6 percentage points). The unemployment rate for women rose to 5.3 percent (up 0.4 percentage points). The seasonally adjusted underutilisation rate remained at 11.8 percent over the quarter, and dropped 0.5 percentage points annually. This annual decrease was primarily due to fewer available potential jobseekers (those who wanted to work and were available in the reference week, but were not actively applying for jobs). The underutilisation rate measures the potential labour supply and unmet need for work. An underutilised person may be unemployed, underemployed (wanting more hours), an unavailable jobseeker, or an available potential jobseeker. Looking at the underutilisation rate in combination with the unemployment rate provides a more comprehensive view of New Zealand s labour market. The seasonally adjusted not in employment, education, or training (NEET) rate for the years age group remained at 11.2 percent over the quarter. The NEET rate for the years age group fell to 7.2 percent (down 1.5 percentage points). The NEET rate for the years age group rose to 14.8 percent (up 1.5 percentage points). 2
3 Employment and the labour force Over the year to September 2017, the employment rate increased to 67.8 percent (up 1.2 percentage points), the highest rate since the series began in This follows a 0.4 percent contraction in the June 2017 quarter. This increase is a result of employment growth exceeding growth in the working-age population over the year. The labour force participation rate rose 1.0 percentage points over the quarter to 71.1 percent, as 54,000 more people entered the labour force. Employment by sex, age, and ethnicity Over the year to September 2017 (unadjusted), 102,700 more people were employed (up 4.2 percent). Men and women made roughly equal contributions to the annual increase. Male employment increased 52,400 (up 4.0 percent). Female employment increased 50,300 (up 4.3 percent). 87,700 (85.7 percent) of the growth in employment was from those employed full time. Over half the annual growth in employment came from those aged 25 39, as employment amongst that age group grew 53,200. There was also statistically significant employment growth for those aged and
4 Over the year, the ethnicities that changed significantly in employment were: Asian up 36,000 (11.3 percent) Māori up 21,900 (7.6 percent) Other up 23,000 (114.0 percent). This group is primarily made up of those that selfidentify ethnically as New Zealanders. Employment by region In the year to the September 2017 quarter, the greatest employment growth was in the following regions: Auckland up 46,800 (5.5 percent) Waikato up 21,600 (9.4 percent) Bay of Plenty up 13,300 (9.2 percent) Wellington up 10,000 (3.5 percent). The Gisborne/Hawke s Bay region had the highest unemployment rate in the September 2017 quarter, at 8.8 percent. The Wellington region had the highest employment rate in the September 2017 quarter, at 70.4 percent. 4
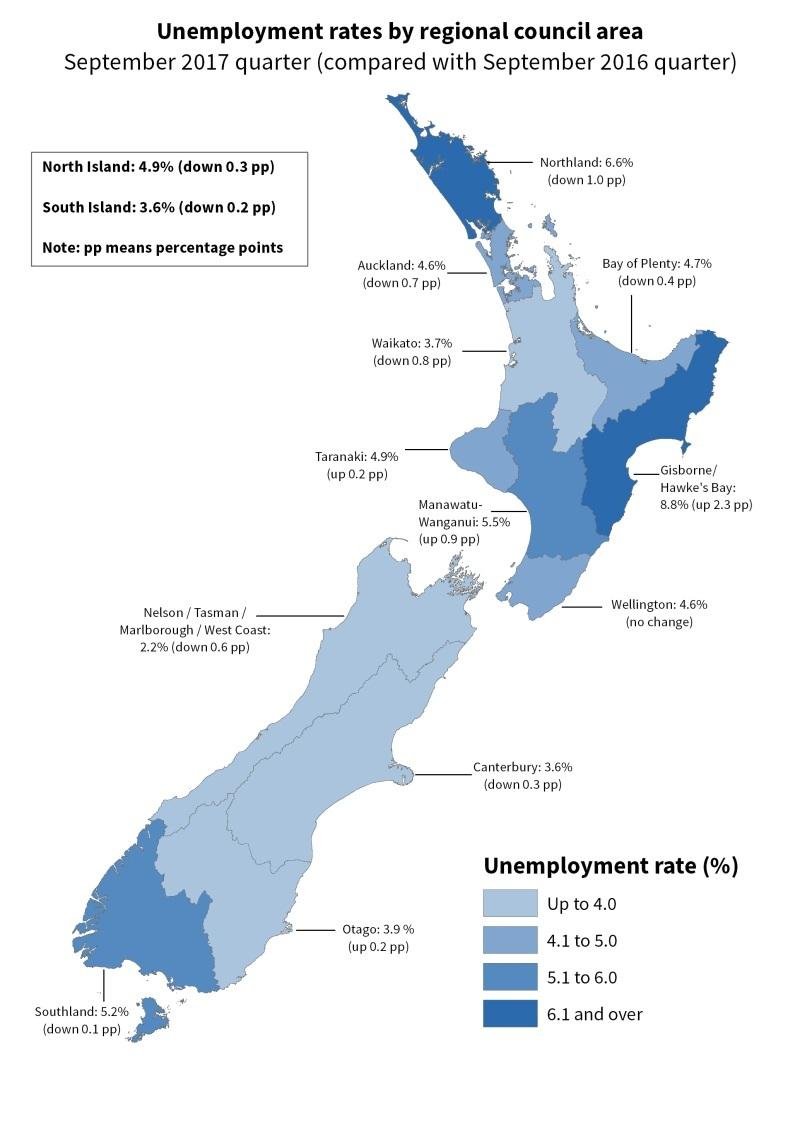
5 5
6 Industry Annual changes In the year to the September 2017 quarter, unadjusted employment (as measured by the HLFS) increased over a number of industries. The greatest contributors to annual employment growth were: professional, scientific, technical, administrative, and support services up 34,400 (12.0 percent) construction up 22,300 (9.9 percent) public administration and safety up 12,500 (9.1 percent). Almost two-thirds of the total increase in the construction industry occurred in the Auckland and Wellington regions. Filled jobs (as measured in the QES) increased 2.5 percent (unadjusted) annually, an increase of 46,300 jobs. The three main industries contributing to this growth were: construction up 18,100 (11.8 percent) retail up 9,600 (4.9 percent) 6
7 accommodation and food services up 9,500 (6.6 percent). Quarterly changes Over the quarter, unadjusted employment (as measured by the HLFS) rose 1.7 percent. The biggest contributors to that growth by industry were: agriculture, forestry, and fishing up 13,300 (9.0 percent) construction up 12,800 (5.4 percent) public administration and safety up 11,000 (8.0 percent). By comparison, filled jobs (unadjusted) in the QES fell by 10,100 (0.5 percent) over the September 2017 quarter. Key contributors were: professional, scientific, technical, administrative, and support services down 10,500 (3.7 percent) manufacturing down 5,900 (3.0 percent). Differences between the filled jobs in the QES and employment numbers in the HLFS can largely be explained by differences in survey coverage. The QES excludes a number of industries, including agriculture, and those who are self-employed without employees, to better fit international standards. Conversely, the HLFS only includes usually resident New Zealanders, so can exclude some temporary seasonal labourers. Wages All the following movements are for the year to the September 2017 quarter. The LCI salary and wage rates (including overtime) increased 1.9 percent, the largest annual increase since September The LCI is a key measure of wage inflation, reflecting changes in the rates employers pay to have the same job done to the same standard. The analytical unadjusted LCI reflects price change and quality change within occupations, such as individual performance or years of service, as well as changes in salary and wage rates for a fixed quantity of labour. It increased 3.4 percent in the year. 7
 Settlement Act 2017, which came into effect on 1 July 2017, and is explored in more depth in Pay deal for care and support workers")
8 Private sector wage inflation in the year to the September 2017 quarter was higher than that of the public sector. A key contributor was the Care and Support Workers (Pay Equity) Settlement Act 2017, which came into effect on 1 July 2017, and is explored in more depth in Pay deal for care and support workers lifts wages. Private sector wages increased 1.9 percent. Public sector wages increased 1.5 percent. Within the QES, wages also grew over the year. Average ordinary time hourly earnings increased to $30.45 (up 2.2 percent). The main contributors to QES wage growth were the professional, scientific, technical, administrative, and support services, and health care and social assistance industries. The main driver of wage growth in the health care and social assistance industry was the carer pay rise. In the professional, scientific, technical, administrative, and support services industry, earnings increases came partly from normal wage growth and partly from compositional changes, as there were fewer low-paying jobs in that industry in the September 2017 quarter. In the QES, average weekly earnings (including overtime) for full-time equivalent employees (FTEs) also increased over the year, up 2.5 percent to $1, per week. This growth reflects both the increase in hourly earnings and the increase in average weekly paid hours worked per FTE over the year. 8
9 Childcare in New Zealand 2017 The Childcare in New Zealand 2017 survey is the third major survey of childcare undertaken in New Zealand. The survey was included in the September 2017 quarter HLFS. Previous surveys were carried out in 1998 and The Childcare in New Zealand 2017 survey collected information about the use of early childhood education (ECE), out-of-school services (OSS), informal care arrangements (eg grandparents looking after children), subsidy use, and the relationship between the use of ECE, OSS, work, and study arrangements. Results from the survey will be released in the coming months. Improving Labour Market Statistics CSV files In response to customer feedback, Stats NZ has sought to improve data available via the Labour Market Statistics CSV file, by making them more machine-readable. The data has been split into three separate CSV files: HLFS, QES, and LCI. The new HLFS CSV file now includes annual data, and classifications applying to all series in unique columns. The original Labour Market Statistics CSV file will remain available. Please send your feedback to with "Labour Market Statistics improvements" in the subject line. Liz MacPherson, Government Statistician ISSN November
10 Related links Next release Labour Market Statistics: December 2017 quarter will be released on 7 February Subscribe to information releases, including this one, by completing the online subscription form. The release calendar lists information releases by date of release. Past releases Labour Market Statistics has links to past releases (from December 2014 quarter). Household Labour Force Survey has links to past releases. Quarterly Employment Survey has links to past releases. Labour Cost Index (Salary and Wage Rates) has links to past releases. Data quality Period-specific information See Labour Market Statistics period specific information DataInfo+ for labour market statistics information that changes between periods. General information See Labour Market Statistics concepts DataInfo+ for definitions of terms used in this release. See Household Labour Force Survey methodology DataInfo+ for general methodology used to produce household labour force statistics. See Labour Cost Index methodology DataInfo+ for general methodology used to produce labour cost index statistics. See Quarterly Employment Survey methodology DataInfo+ for general methodology used to produce quarterly employment survey statistics. Related information Improving labour market statistics for information (including papers and other relevant data) on the Household Labour Force Survey redevelopment Household Labour Force Survey population rebase from 2013 Census: Includes regional benchmarks for the revised HLFS results, which provides information on the population rebase. A guide to unemployment statistics (third edition) (published 2017) provides guidance to data users on the different features of four unemployment measures. User guide for wage and income measures (published 2013) has more information on the various Statistics NZ income and wage measures. 10
11 Extended region and age series now available (published 2014) introduces two key classifications in response to our users' needs. Future of the Household Labour Force Survey (published 2014) outlines changes to the HLFS and how these changes have affected the survey from mid-2016 onwards. See Employment and unemployment for more reports and articles about New Zealand's labour market. 11
12 Revisions Revisions to Household Labour Force Survey Each quarter, we apply the seasonal adjustment process to the latest quarter and all previous quarters. Every estimate is subject to revision each quarter as new data is added, which means that seasonally adjusted estimates for previous quarters may change slightly. In practice, estimates more than two years from the end-point will change little. The June 2017 quarter unemployment rate remained at 4.8 percent after we applied seasonal adjustment. This table lists the changes in estimates between the current and previous quarters for the seasonally adjusted data. Percent revision from last estimate, seasonally adjusted Quarter Male employed Female employed Male unemployed Female unemployed Male not in labour force Female not in labour force Sep Dec Mar Jun This table presents revisions for the trend estimates. Trend revisions are generally larger than those of the seasonally adjusted data. Percent revision from last estimate, trend Quarter Male employed Female employed Male unemployed Female unemployed Male not in labour force Female not in labour force Sep Dec Mar Jun
13 The table below shows the average of all such absolute revisions, expressed relatively, and indicates to what extent the current estimates might be revised when the revised data for the next quarter becomes available. Mean absolute percent revisions Seasonally adjusted Trend 1-step 4-step 1-step 4-step Male employed Female employed Male unemployed Female unemployed Male not in labour force Female not in labour force In the table above, a 1-step ahead revision is one we make to an estimate one quarter later. For example, if in the March 2010 quarter the seasonally adjusted estimate of females employed was first published as 1,020,000, and then in the June 2010 quarter this same estimate was revised to 1,022,000, this would be an upward revision of 0.20 percent. A 4-step ahead revision is one we make to an estimate four quarters later. For example, if in the March 2010 quarter release the trend estimate of females not in the labour force was first published as 665,000 and then in the March 2011 release, one year later, the trend estimate of females not in the labour force for the March 2010 quarter was revised to 664,000, this would be a decrease of 1,000, or a downward revision of 0.15 percent. 13
14 Contacts For media enquiries contact: Sean Broughton Wellington For technical information contact: Alexandra Ferguson or Ken Joe Wellington or For general enquiries contact our Information Centre: Phone: (toll free in New Zealand) (outside of New Zealand) info@stats.govt.nz Subscription service: Subscribe to information releases, including this one, by completing the online subscription form. Correction notifications: Subscribe to receive an if a correction notice is published for Labour Market Statistics. Unsubscribe to correction notifications for Labour Market Statistics. Subscribe to all to receive an if a correction notice is published for any of our information releases. Unsubscribe to all if you change your mind. 14
15 Tables See the Excel tables in the Downloads box on this page. If you have problems viewing the files, see opening files and PDFs. Household labour force survey tables 1. People employed, unemployed, and not in labour force, by sex, seasonally adjusted series 2. People employed, unemployed, and not in labour force, by sex, trend series 3. People employed, unemployed, and not in labour force, by sex 4. People employed, unemployed, and not in labour force, by age group 5. People employed, unemployed, and not in labour force, by ethnic group 6. People employed, unemployed, and not in labour force, by regional council 7. People employed 8. People employed, by employment status and sex 9. People employed, by industry and sex 10. Total actual hours worked 11. People employed, unemployed, not in the labour force, and total actual hours worked, seasonally adjusted series 12. Underutilisation, by sex, seasonally adjusted series 13. People underemployed, by sex 14. People employed, unemployed, and not in labour force, by sex and formal study status 15. Labour force and education status of those aged years, by age group, seasonally adjusted series 16. Harmonised unemployment rates in OECD countries, latest available 17. Employment rates in OECD countries, year-olds Quarterly employment survey tables 1. Full-time equivalent employees (FTEs), actual, seasonally adjusted, and trend series 2. Filled jobs, actual, seasonally adjusted, and trend series 3. Full-time equivalent employees (FTEs), by ANZSIC06 industry 4. Total weekly paid hours, actual, seasonally adjusted, and trend series 5. Total weekly gross earnings, actual, seasonally adjusted, and trend series 6. Average weekly paid hours for FTEs, actual, seasonally adjusted, and trend series 7. Average weekly earnings for FTEs, by sector 8. Average hourly earnings, by sector 9. Average hourly earnings, by sex Labour cost index tables 1. Salary and wage rates by sector, all industries/occupations combined 2.1 Salary and wage rates by industry and by occupation, public sector 2.2 Salary and wage rates by industry and by occupation, public sector, percentage change from previous quarter 2.3 Salary and wage rates by industry and by occupation, public sector, percentage change from same quarter of previous year 3.1 Salary and wage rates by industry and by occupation, private sector 3.2 Salary and wage rates by industry and by occupation, private sector, percentage change from previous quarter 15
16 3.3 Salary and wage rates by industry and by occupation, private sector, percentage change from same quarter of previous year 4.1 Salary and wage rates by industry, all sectors combined 4.2 Salary and wage rates by industry, all sectors combined, percentage change from previous quarter 4.3 Salary and wage rates by industry, all sectors combined, percentage change from same quarter of previous year 5.1 Salary and wage rates by occupation, all sectors combined 5.2 Salary and wage rates by occupation, all sectors combined, percentage change from previous quarter 5.3 Salary and wage rates by occupation, all sectors combined, percentage change from same quarter of previous year 6.1 Distribution of annual movements, all sectors combined 6.2 Proportions of salary and wage rates increasing, private sector and all sectors combined 6.3 Distribution of annual increases by reason, all sectors combined 7.1 Median and mean increases, all sectors combined 7.2 Median and mean increases by sector 8.1 Published and analytical unadjusted indexes for the private sector 8.2 Published and analytical unadjusted indexes for all sectors combined 9.1 Labour cost index, base expenditure weights by sector, cost, occupation, and skill level 9.2 Labour cost index, base expenditure weights by industry Quarterly employment survey supplementary tables 1. Average total hourly earnings, by ANZSIC06 industry 2. Filled jobs, by ANZSIC06 industry 3. Part-time employees, by ANZSIC06 industry 4. Full-time employees, by ANZSIC06 industry Labour cost index supplementary tables The following supplementary tables relate to the construction industry for Canterbury and the rest of New Zealand. 1. Regional analytical index for the construction industry, all salary and wage rates 2. Regional analytical index for the construction industry, salary and ordinary time wage rates 3. Regional analytical mean increases for the construction industry, all sectors combined Access more data on Infoshare Infoshare allows you to organise data in a way that best meets your needs. You can view the resulting tables onscreen or download them. Use Infoshare For this release, select the following categories from the Infoshare homepage: Subject category: Work Income and Spending Groups: Household Labour Force Survey [HLF], Earnings and Employment Survey (QES) [QEX], and Labour Cost Index [LCI] 16
17 Next release Labour Market Statistics: December 2017 quarter will be released on 7 February
Labour Market Statistics: June 2017 quarter
 Labour Market Statistics: June 2017 quarter Embargoed until 10:45am 02 August 2017 Key facts Labour market at a glance Employment rate drops to 66.7 percent. Unemployment rate down to 4.8 percent. Employment
Quarterly Labour Market Report. December 2016
 Quarterly Labour Market Report December 2016 MB13809 Dec 2016 Ministry of Business, Innovation and Employment (MBIE) Hikina Whakatutuki - Lifting to make successful MBIE develops and delivers policy, services,
Quarterly Labour Market Report. September 2016
 Quarterly Labour Market Report September 2016 MB13809 Sept 2016 Ministry of Business, Innovation and Employment (MBIE) Hikina Whakatutuki - Lifting to make successful MBIE develops and delivers policy,
Consumers Price Index: September 2017 quarter
 Consumers Price Index: September 2017 quarter Embargoed until 10:45am 17 October 2017 Key facts Quarterly change In the September 2017 quarter compared with the June 2017 quarter, the consumers price index
Quarterly Employment Survey: June 2012 quarter
 ly Employment Survey: June 2012 quarter Embargoed until 10:45am 07 August 2012 Key facts In the June 2012 quarter compared with the March 2012 quarter: The seasonally adjusted number of filled jobs rose
Quarterly Labour Market Report. May 2015
 Quarterly Labour Market Report May 2015 MB13090_1228 May 2015 Ministry of Business, Innovation and Employment (MBIE) Hikina Whakatutuki - Lifting to make successful MBIE develops and delivers policy, services,
Labour Cost Index (Salary and Wage Rates): March 2013 quarter
: March 2013 quarter") Labour Cost Index (Salary and Wage Rates): March 2013 quarter Embargoed until 10:45am 07 May 2013 Key facts In the March 2013 quarter, salary and wage rates (including overtime) rose 0.4 percent. In the
Labour Cost Index (Salary and Wage Rates): March 2013 quarter Embargoed until 10:45am 07 May 2013 Key facts In the March 2013 quarter, salary and wage rates (including overtime) rose 0.4 percent. In the
Quarterly Labour Market Report. February 2015
 Quarterly Labour Market Report February 2015 MB13090_1228 March 2015 Ministry of Business, Innovation and Employment (MBIE) Hikina Whakatutuki - Lifting to make successful MBIE develops and delivers policy,
Labour Cost Index (Salary and Wage Rates)
") Image description. Hot Off The Press. End of image description. Embargoed until 10:45am 6 November 2006 Labour Cost Index (Salary and Wage Rates) September 2006 quarter Highlights In the year to the September
Image description. Hot Off The Press. End of image description. Embargoed until 10:45am 6 November 2006 Labour Cost Index (Salary and Wage Rates) September 2006 quarter Highlights In the year to the September
Executive Summary MINISTRY OF BUSINESS, INNOVATION & EMPLOYMENT MĀORI IN THE LABOUR MARKET
 Executive Summary in the Labour Market presents key labour market information from 2009 to 2014 from the Household Labour Force Survey (HLFS) for both at a national and regional level. The key findings
Quarterly Labour Market Report. August 2018
 Quarterly Labour Market Report August 2018 Ministry of Business, Innovation and Employment (MBIE) Hikina Whakatutuki - Lifting to make successful MBIE develops and delivers policy, services, advice and
Ministry of Economic Development SMEs in New Zealand: Structure and Dynamics
 Ministry of Economic Development 27 SMEs in New Zealand: Structure and Dynamics July 27 1 Contents List of Graphs and Tables...3 Overview...5 Defining Small and Medium-Sized Enterprises...6 Employment
Quarterly Labour Market Report. November 2017
 Quarterly Labour Market Report November 2017 MBIE 3518 November 2017 Ministry of Business, Innovation and Employment (MBIE) Hikina Whakatutuki - Lifting to make successful MBIE develops and delivers policy,
Labour Cost Index (All Labour Costs): June 2011 quarter
: June 2011 quarter") Labour Cost Index (All Labour Costs): June 2011 quarter Embargoed until 10:45am 21 October 2011 Key facts From the June 2010 quarter to the June 2011 quarter: Surveyed labour costs increased 2.4 percent.
Labour Cost Index (All Labour Costs): June 2011 quarter Embargoed until 10:45am 21 October 2011 Key facts From the June 2010 quarter to the June 2011 quarter: Surveyed labour costs increased 2.4 percent.
Gross Domestic Product: June 2012 quarter
 Gross Domestic Product: June 2012 quarter Embargoed until 10:45am 20 September 2012 Key facts Gross domestic product (GDP): Economic activity increased 0.6 percent in the June 2012 quarter. Agriculture
Producers Price Index: September 2013 quarter
 Producers Price Index: September 2013 quarter Embargoed until 10:45am 20 November 2013 Key facts For the producers price index (PPI) in the September 2013 quarter, compared with the June 2013 quarter:
SMEs in New Zealand: Structure and Dynamics 2011
 SMEs in New Zealand: Structure and Dynamics 2011 Ministry of Economic Development September 2011 ISSN 1178-3281 Contents List of Commonly Used Abbreviations...2 Part 1: Overview...3 Introduction...3 Layout
Gross Domestic Product: June 2009 quarter
 Embargoed until 10:45am 23 September 2009 Highlights Gross domestic product (GDP): Economic activity was up 0.1 percent in the June 2009 quarter, following five quarters of contraction. Activity in the
Injury Statistics Work-related Claims: 2011
 Injury Statistics Work-related Claims: 2011 Embargoed until 10:45am 17 October 2012 Key facts Provisional data show that in 2011: 1 in 10 workers made a claim to ACC for a work-related injury. The overall
Gross Domestic Product: September 2009 quarter
 Embargoed until 10:45am 23 December 2009 Highlights Gross domestic product (GDP): Economic activity was up 0.2 percent in the September 2009 quarter, following a 0.2 percent increase in the June 2009 quarter.
Gross Domestic Product: March 2011 quarter
 Gross Domestic Product: March 2011 quarter Embargoed until 10:45am 14 July 2011 Highlights Gross domestic product (GDP): Economic activity was up 0.8 percent in the March 2011 quarter. The largest increase
Quarterly Labour Market Report. August 2017
 Quarterly Labour Market Report August 2017 MB14363 August 2017 Ministry of Business, Innovation and Employment (MBIE) Hikina Whakatutuki - Lifting to make successful MBIE develops and delivers policy,
TRADE UNION MEMBERSHIP Statistical Bulletin
 TRADE UNION MEMBERSHIP 2016 Statistical Bulletin May 2017 Contents Introduction 3 Key findings 5 1. Long Term and Recent Trends 6 2. Private and Public Sectors 13 3. Personal and job characteristics 16
Producers Price Index: June 2011 quarter
 Producers Price Index: June 2011 quarter Embargoed until 10:45am 17 August 2011 Highlights In the June 2011 quarter, compared with the March 2011 quarter: The producers price index (PPI) for outputs rose
newstats 2016 NWT Annual Labour Force Activity NWT Bureau of Statistics Overview
 newstats NWT Bureau of Statistics Released: March 27, 2017 2016 NWT Annual Labour Force Activity Overview The Labour Force Survey is a source of monthly estimates of employment and unemployment. On a yearly
4 Scottish labour market
 4 Scottish labour market Andrew Ross, Fraser of Allander Institute This section provides an overview of key labour market data in Scotland and contrasts these with both UK performance and changes over
Insolvency Statistics and Debtor Profile Report 1 JULY 2016 TO 30 JUNE 2017
 Insolvency Statistics and Debtor Profile Report 1 JULY 2016 TO 30 JUNE 2017 MB14340 Contents Introduction 2 Annual Statistics 3 Key Characteristics of Debtors 11 Summary Instalment Orders 12 No Asset Procedures
Injury Statistics Work-related Claims: 2008
 Embargoed until 10:45am 28 October 2009 Injury Statistics Work-related Claims: 2008 Highlights Provisionally, there were 224,900 claims for work-related injuries that occurred in 2008. Final figures for
The Northern Ireland labour market is characterised by relatively. population of working age are not active in the labour market at
 INTRODUCTION The Northern Ireland labour market is characterised by relatively high levels of economic inactivity. Around 28 per cent of the population of working age are not active in the labour market
Insolvency Statistics and Debtor Profile Report 1 JULY 2015 TO 30 JUNE 2016
 Insolvency Statistics and Debtor Profile Report 1 JULY 2015 TO 30 JUNE 2016 MB12830 Contents Introduction 2 Annual Statistics 3 Key Characteristics of Debtors 11 Summary Instalment Orders 12 No Asset Procedures
Happiness of New Zealand
 UMR Omnibus Results January 2012 Happiness of New Zealand Email: umr@umr.co.nz WELLINGTON 3 Collina Terrace Thorndon WELLINGTON 6011 NEW ZEALAND Tel: +64 4 473 1061 Fax: +64 4 472 3501 Website: www.umr.co.nz
Producers Price Index: June 2013 quarter
 Producers Price Index: June 2013 quarter Embargoed until 10:45am 19 August 2013 Key facts For the producers price index (PPI) in the June 2013 quarter, compared with the March 2013 quarter: The output
Highlights. For the purpose of this profile, the population is defined as women 15+ years.
 A L B E R T A L A B O U R F O R C E P R O F I L ES Women 2014 Highlights For the purpose of this profile, the population is defined as women 15+. Working Age Population of Women in Alberta The number of
Injury Statistics Work-related Claims: 2015
 Injury Statistics Work-related Claims: 2015 Embargoed until 10:45am 28 November 2016 Key facts Provisional data shows that in 2015: 230,200 claims were made to ACC for a work-related injury with 31,000
Injury Statistics Work-related Claims: 2009
 Embargoed until 10:45am 19 October 2010 Highlights In 2009 (all figures are provisional unless stated otherwise): Sprains and strains were the most common type of work-related injury claim. 94,400 claims
REGULATORY IMPACT STATEMENT FOR MINIMUM WAGE REVIEW 2012
 REGULATORY IMPACT STATEMENT FOR MINIMUM WAGE REVIEW 2012 Ministry of Business, Innovation and Employment February 2013 1 Agency Disclosure Statement 1 This Regulatory Impact Statement has been prepared
2016 Alberta Labour Force Profiles Women
 2016 Alberta Labour Force Profiles Alberta s Highlights Population Statistics Labour Force Statistics lowest percentage of women in the working age population 1. 51.7% NS 2. 51.5% PEI 9. 49.6% SK 10. 49.3%
Strathprints Institutional Repository
 Strathprints Institutional Repository Allan, Grant () Overview of the labour market [November ]. Commentary, 29 (3). pp. 31-37. ISSN 0306-7866 Quarterly Economic Strathprints is designed to allow users
From the economist. Quick quarterly statistics
 Issue 17 tember 217 In this issue Quick quarterly statistics page 1 Economic activity quarterly page 2 Employment quarterly page 3 Household welfare quarterly page 4 Tourism activity annual page 5 Spotlight
Quarterly Labour Force Survey Q3:2017
 Quarterly Labour Force Survey Q3:2017 Dr Pali Lehohla Statistician-General #StatsSA South African Labour Market: Current state vs NDP target South African Labour Market: Current state vs NDP target Unemployment
Labour Market Bulletin
 Labour Market Bulletin Newfoundland and Labrador December 2016 This Labour Market Bulletin is a report providing an analysis of Labour Force Survey results for the province of Newfoundland and Labrador,
Employment Outlook for. Public Administration and Safety
 Employment Outlook for Contents INTRODUCTION... 3 EMPLOYMENT GROWTH... 4 EMPLOYMENT PROSPECTS... 5 VACANCY TRENDS... 8 WORKFORCE AGEING... 11 EMPLOYMENT BY GENDER AND FULL-TIME/PART-TIME... 13 HOURS WORKED...
EMPLOYMENT AND EARNINGS
 EMPLOYMENT AND EARNINGS U.S. Department of Labor Bureau of Labor Statistics May U.S. DEPARTMENT OF LABOR Ann McLaughlin, Secretary BUREAU OF LABOR STATISTICS Janet L. Norwood, Commissioner Employment and
Great Britain (Numbers) All People 386,100 8,787,900 63,785,900 Males 190,800 4,379,300 31,462,500 Females 195,200 4,408,600 32,323,500
 All People 386,100 8,787,900 63,785,900 Males 190,800 4,379,300 31,462,500 Females 195,200 4,408,600 32,323,500") Labour Market Profile - The profile brings together data from several sources. Details about these and related terminology are given in the definitions section. Resident Population Total population (2016)
Labour Market Profile - The profile brings together data from several sources. Details about these and related terminology are given in the definitions section. Resident Population Total population (2016)
Great Britain (Numbers) All People 283,500 7,224,000 63,785,900 Males 140,400 3,563,200 31,462,500 Females 143,100 3,660,800 32,323,500
 All People 283,500 7,224,000 63,785,900 Males 140,400 3,563,200 31,462,500 Females 143,100 3,660,800 32,323,500") Labour Market Profile - The profile brings together data from several sources. Details about these and related terminology are given in the definitions section. Resident Population Total population (2016)
Labour Market Profile - The profile brings together data from several sources. Details about these and related terminology are given in the definitions section. Resident Population Total population (2016)
North West Leicestershire (Numbers) All People 98,600 4,724,400 63,785,900 Males 48,900 2,335,000 31,462,500 Females 49,800 2,389,400 32,323,500
 All People 98,600 4,724,400 63,785,900 Males 48,900 2,335,000 31,462,500 Females 49,800 2,389,400 32,323,500") Labour Market Profile - The profile brings together data from several sources. Details about these and related terminology are given in the definitions section. Resident Population Total population (2016)
Labour Market Profile - The profile brings together data from several sources. Details about these and related terminology are given in the definitions section. Resident Population Total population (2016)
Great Britain (Numbers) All People 186,600 6,130,500 63,785,900 Males 92,600 3,021,700 31,462,500 Females 94,000 3,108,900 32,323,500
 All People 186,600 6,130,500 63,785,900 Males 92,600 3,021,700 31,462,500 Females 94,000 3,108,900 32,323,500") Labour Market Profile - The profile brings together data from several sources. Details about these and related terminology are given in the definitions section. Resident Population Total population (2016)
Labour Market Profile - The profile brings together data from several sources. Details about these and related terminology are given in the definitions section. Resident Population Total population (2016)
Great Britain (Numbers) All People 7,700 8,825,000 64,169,400 Males 4,200 4,398,800 31,661,600 Females 3,500 4,426,200 32,507,800
 All People 7,700 8,825,000 64,169,400 Males 4,200 4,398,800 31,661,600 Females 3,500 4,426,200 32,507,800") Labour Market Profile - The profile brings together data from several sources. Details about these and related terminology are given in the definitions section. Resident Population Total population (2017)
Labour Market Profile - The profile brings together data from several sources. Details about these and related terminology are given in the definitions section. Resident Population Total population (2017)
Great Britain (Numbers) All People 267,500 9,080,800 64,169,400 Males 132,500 4,474,400 31,661,600 Females 135,000 4,606,400 32,507,800
 All People 267,500 9,080,800 64,169,400 Males 132,500 4,474,400 31,661,600 Females 135,000 4,606,400 32,507,800") Labour Market Profile - The profile brings together data from several sources. Details about these and related terminology are given in the definitions section. Resident Population Total population (2017)
Labour Market Profile - The profile brings together data from several sources. Details about these and related terminology are given in the definitions section. Resident Population Total population (2017)
Great Britain (Numbers) All People 325,300 4,724,400 63,785,900 Males 164,500 2,335,000 31,462,500 Females 160,800 2,389,400 32,323,500
 All People 325,300 4,724,400 63,785,900 Males 164,500 2,335,000 31,462,500 Females 160,800 2,389,400 32,323,500") Labour Market Profile - The profile brings together data from several sources. Details about these and related terminology are given in the definitions section. Resident Population Total population (2016)
Labour Market Profile - The profile brings together data from several sources. Details about these and related terminology are given in the definitions section. Resident Population Total population (2016)
Great Britain (Numbers) All People 49,600 5,559,300 64,169,400 Males 24,000 2,734,200 31,661,600 Females 25,700 2,825,100 32,507,800
 All People 49,600 5,559,300 64,169,400 Males 24,000 2,734,200 31,661,600 Females 25,700 2,825,100 32,507,800") Labour Market Profile - The profile brings together data from several sources. Details about these and related terminology are given in the definitions section. Resident Population Total population (2017)
Labour Market Profile - The profile brings together data from several sources. Details about these and related terminology are given in the definitions section. Resident Population Total population (2017)
Great Britain (Numbers) All People 140,700 9,026,300 63,785,900 Males 68,100 4,447,200 31,462,500 Females 72,600 4,579,100 32,323,500
 All People 140,700 9,026,300 63,785,900 Males 68,100 4,447,200 31,462,500 Females 72,600 4,579,100 32,323,500") Labour Market Profile - The profile brings together data from several sources. Details about these and related terminology are given in the definitions section. Resident Population Total population (2016)
Labour Market Profile - The profile brings together data from several sources. Details about these and related terminology are given in the definitions section. Resident Population Total population (2016)
All People 280,000 6,168,400 64,169,400 Males 138,200 3,040,300 31,661,600 Females 141,800 3,128,100 32,507,800. Central Bedfordshire (Numbers)
") Labour Market Profile - The profile brings together data from several sources. Details about these and related terminology are given in the definitions section. Resident Population Total population (2017)
Labour Market Profile - The profile brings together data from several sources. Details about these and related terminology are given in the definitions section. Resident Population Total population (2017)
Michigan s January Unemployment Rate Moves Up Seasonally
 Labor Market News Michigan s March 2016 Vol. 72, Issue No. 1 Percent Michigan s January Unemployment Rate Moves Up Seasonally Michigan s unemployment rate (not seasonally adjusted) increased by 0.6 of
Great Britain (Numbers) All People 64,000 6,168,400 64,169,400 Males 31,500 3,040,300 31,661,600 Females 32,500 3,128,100 32,507,800
 All People 64,000 6,168,400 64,169,400 Males 31,500 3,040,300 31,661,600 Females 32,500 3,128,100 32,507,800") Labour Market Profile - The profile brings together data from several sources. Details about these and related terminology are given in the definitions section. Resident Population Total population (2017)
Labour Market Profile - The profile brings together data from several sources. Details about these and related terminology are given in the definitions section. Resident Population Total population (2017)
All People 263,400 5,450,100 64,169,400 Males 129,400 2,690,500 31,661,600 Females 134,000 2,759,600 32,507,800. Rotherham (Numbers)
") Labour Market Profile - The profile brings together data from several sources. Details about these and related terminology are given in the definitions section. Resident Population Total population (2017)
Labour Market Profile - The profile brings together data from several sources. Details about these and related terminology are given in the definitions section. Resident Population Total population (2017)
Great Britain (Numbers) All People 176,200 6,168,400 64,169,400 Males 87,200 3,040,300 31,661,600 Females 89,000 3,128,100 32,507,800
 All People 176,200 6,168,400 64,169,400 Males 87,200 3,040,300 31,661,600 Females 89,000 3,128,100 32,507,800") Labour Market Profile - The profile brings together data from several sources. Details about these and related terminology are given in the definitions section. Resident Population Total population (2017)
Labour Market Profile - The profile brings together data from several sources. Details about these and related terminology are given in the definitions section. Resident Population Total population (2017)
All People 437,100 5,450,100 64,169,400 Males 216,700 2,690,500 31,661,600 Females 220,500 2,759,600 32,507,800. Kirklees (Numbers)
") Labour Market Profile - The profile brings together data from several sources. Details about these and related terminology are given in the definitions section. Resident Population Total population (2017)
Labour Market Profile - The profile brings together data from several sources. Details about these and related terminology are given in the definitions section. Resident Population Total population (2017)
Economic Standard of Living
 DESIRED OUTCOMES New Zealand is a prosperous society, reflecting the value of both paid and unpaid work. All people have access to adequate incomes and decent, affordable housing that meets their needs.
Great Britain (Numbers) All People 348,000 8,825,000 64,169,400 Males 184,000 4,398,800 31,661,600 Females 164,000 4,426,200 32,507,800
 All People 348,000 8,825,000 64,169,400 Males 184,000 4,398,800 31,661,600 Females 164,000 4,426,200 32,507,800") Labour Market Profile - The profile brings together data from several sources. Details about these and related terminology are given in the definitions section. Resident Population Total population (2017)
Labour Market Profile - The profile brings together data from several sources. Details about these and related terminology are given in the definitions section. Resident Population Total population (2017)
United Kingdom (Level) All People 8,825,000 66,040,200 Males 4,398,800 32,581,800 Females 4,426,200 33,458,400
 All People 8,825,000 66,040,200 Males 4,398,800 32,581,800 Females 4,426,200 33,458,400") Labour Market Profile - The profile brings together data from several sources. Details about these and related terminology are given in the definitions section. Resident Population Total population (2017)
Labour Market Profile - The profile brings together data from several sources. Details about these and related terminology are given in the definitions section. Resident Population Total population (2017)
All People 130,700 3,125,200 64,169,400 Males 63,500 1,540,200 31,661,600 Females 67,200 1,585,000 32,507,800. Vale Of Glamorgan (Numbers)
") Labour Market Profile - The profile brings together data from several sources. Details about these and related terminology are given in the definitions section. Resident Population Total population (2017)
Labour Market Profile - The profile brings together data from several sources. Details about these and related terminology are given in the definitions section. Resident Population Total population (2017)
All People 175,800 5,860,700 64,169,400 Males 87,400 2,904,300 31,661,600 Females 88,400 2,956,400 32,507,800. Telford And Wrekin (Numbers)
") Labour Market Profile - The profile brings together data from several sources. Details about these and related terminology are given in the definitions section. Resident Population Total population (2017)
Labour Market Profile - The profile brings together data from several sources. Details about these and related terminology are given in the definitions section. Resident Population Total population (2017)
Stockton-On- Tees (Numbers) All People 196,500 2,644,700 64,169,400 Males 96,800 1,297,900 31,661,600 Females 99,700 1,346,800 32,507,800
 All People 196,500 2,644,700 64,169,400 Males 96,800 1,297,900 31,661,600 Females 99,700 1,346,800 32,507,800") Labour Market Profile - The profile brings together data from several sources. Details about these and related terminology are given in the definitions section. Resident Population Total population (2017)
Labour Market Profile - The profile brings together data from several sources. Details about these and related terminology are given in the definitions section. Resident Population Total population (2017)
All People 295,800 2,644,700 64,169,400 Males 149,400 1,297,900 31,661,600 Females 146,400 1,346,800 32,507,800. Newcastle Upon Tyne (Numbers)
") Labour Market Profile - The profile brings together data from several sources. Details about these and related terminology are given in the definitions section. Resident Population Total population (2017)
Labour Market Profile - The profile brings together data from several sources. Details about these and related terminology are given in the definitions section. Resident Population Total population (2017)
Great Britain (Numbers) All People 836,300 8,947,900 63,258,400 Males 405,700 4,404,400 31,165,300 Females 430,500 4,543,500 32,093,100
 All People 836,300 8,947,900 63,258,400 Males 405,700 4,404,400 31,165,300 Females 430,500 4,543,500 32,093,100") Labour Market Profile - The profile brings together data from several sources. Details about these and related terminology are given in the definitions section. Resident Population Total population (2015)
Labour Market Profile - The profile brings together data from several sources. Details about these and related terminology are given in the definitions section. Resident Population Total population (2015)
Great Britain (Numbers) All People 843,800 9,026,300 63,785,900 Males 410,000 4,447,200 31,462,500 Females 433,800 4,579,100 32,323,500
 All People 843,800 9,026,300 63,785,900 Males 410,000 4,447,200 31,462,500 Females 433,800 4,579,100 32,323,500") Labour Market Profile - The profile brings together data from several sources. Details about these and related terminology are given in the definitions section. Resident Population Total population (2016)
Labour Market Profile - The profile brings together data from several sources. Details about these and related terminology are given in the definitions section. Resident Population Total population (2016)
Great Britain (Numbers) All People 497,900 7,219,600 63,785,900 Males 245,600 3,560,900 31,462,500 Females 252,300 3,658,700 32,323,500
 All People 497,900 7,219,600 63,785,900 Males 245,600 3,560,900 31,462,500 Females 252,300 3,658,700 32,323,500") Labour Market Profile - The profile brings together data from several sources. Details about these and related terminology are given in the definitions section. Resident Population Total population (2016)
Labour Market Profile - The profile brings together data from several sources. Details about these and related terminology are given in the definitions section. Resident Population Total population (2016)
Great Britain (Numbers) All People 1,201,900 7,258,600 64,169,400 Males 593,300 3,581,200 31,661,600 Females 608,600 3,677,400 32,507,800
 All People 1,201,900 7,258,600 64,169,400 Males 593,300 3,581,200 31,661,600 Females 608,600 3,677,400 32,507,800") Labour Market Profile - The profile brings together data from several sources. Details about these and related terminology are given in the definitions section. Resident Population Total population (2017)
Labour Market Profile - The profile brings together data from several sources. Details about these and related terminology are given in the definitions section. Resident Population Total population (2017)
Merseyside (Met County) (Numbers) All People 1,416,800 7,258,600 64,169,400 Males 692,300 3,581,200 31,661,600 Females 724,600 3,677,400 32,507,800
 (Numbers) All People 1,416,800 7,258,600 64,169,400 Males 692,300 3,581,200 31,661,600 Females 724,600 3,677,400 32,507,800") Labour Market Profile - The profile brings together data from several sources. Details about these and related terminology are given in the definitions section. Resident Population Total population (2017)
Labour Market Profile - The profile brings together data from several sources. Details about these and related terminology are given in the definitions section. Resident Population Total population (2017)
Great Britain (Numbers) All People 1,180,900 6,168,400 64,169,400 Males 578,500 3,040,300 31,661,600 Females 602,500 3,128,100 32,507,800
 All People 1,180,900 6,168,400 64,169,400 Males 578,500 3,040,300 31,661,600 Females 602,500 3,128,100 32,507,800") Labour Market Profile - The profile brings together data from several sources. Details about these and related terminology are given in the definitions section. Resident Population Total population (2017)
Labour Market Profile - The profile brings together data from several sources. Details about these and related terminology are given in the definitions section. Resident Population Total population (2017)
Cornwall And Isles Of Scilly (Numbers)
") Labour Market Profile - The profile brings together data from several sources. Details about these and related terminology are given in the definitions section. Resident Population Total population (2017)
Labour Market Profile - The profile brings together data from several sources. Details about these and related terminology are given in the definitions section. Resident Population Total population (2017)
Great Britain (Numbers) All People 564,600 5,860,700 64,169,400 Males 279,200 2,904,300 31,661,600 Females 285,400 2,956,400 32,507,800
 All People 564,600 5,860,700 64,169,400 Males 279,200 2,904,300 31,661,600 Females 285,400 2,956,400 32,507,800") Labour Market Profile - The profile brings together data from several sources. Details about these and related terminology are given in the definitions section. Resident Population Total population (2017)
Labour Market Profile - The profile brings together data from several sources. Details about these and related terminology are given in the definitions section. Resident Population Total population (2017)
West Midlands (Met County) (Numbers)
 (Numbers)") Labour Market Profile - The profile brings together data from several sources. Details about these and related terminology are given in the definitions section. Resident Population Total population (2017)
Labour Market Profile - The profile brings together data from several sources. Details about these and related terminology are given in the definitions section. Resident Population Total population (2017)
4 Scottish labour market
 4 Scottish labour market Andrew Ross, Fraser of Allander Institute This section provides an overview of key labour market data in Scotland and contrasts these with both UK performance and changes over
Great Britain (Numbers) All People 648,200 6,168,400 64,169,400 Males 324,200 3,040,300 31,661,600 Females 324,100 3,128,100 32,507,800
 All People 648,200 6,168,400 64,169,400 Males 324,200 3,040,300 31,661,600 Females 324,100 3,128,100 32,507,800") Labour Market Profile - Cambridgeshire The profile brings together data from several sources. Details about these and related terminology are given in the definitions section. Resident Population Total
Labour Market Profile - Cambridgeshire The profile brings together data from several sources. Details about these and related terminology are given in the definitions section. Resident Population Total
Coventry And Warwickshire (Numbers) All People 909,700 5,800,700 63,785,900 Males 453,500 2,872,600 31,462,500 Females 456,200 2,928,100 32,323,500
 All People 909,700 5,800,700 63,785,900 Males 453,500 2,872,600 31,462,500 Females 456,200 2,928,100 32,323,500") Labour Market Profile - The profile brings together data from several sources. Details about these and related terminology are given in the definitions section. Resident Population Total population (2016)
Labour Market Profile - The profile brings together data from several sources. Details about these and related terminology are given in the definitions section. Resident Population Total population (2016)
Great Britain (Numbers) All People 623,100 5,516,000 63,785,900 Males 305,300 2,711,600 31,462,500 Females 317,900 2,804,400 32,323,500
 All People 623,100 5,516,000 63,785,900 Males 305,300 2,711,600 31,462,500 Females 317,900 2,804,400 32,323,500") Labour Market Profile - Gloucestershire The profile brings together data from several sources. Details about these and related terminology are given in the definitions section. Resident Population Total
Labour Market Profile - Gloucestershire The profile brings together data from several sources. Details about these and related terminology are given in the definitions section. Resident Population Total
The Province of Prince Edward Island Employment Trends and Data Poverty Reduction Action Plan Backgrounder
 The Province of Prince Edward Island Employment Trends and Data Poverty Reduction Action Plan Backgrounder 5/17/2018 www.princeedwardisland.ca/poverty-reduction $000's Poverty Reduction Action Plan Backgrounder:
REGULATORY IMPACT STATEMENT FOR MINIMUM WAGE REVIEW 2013
 REGULATORY IMPACT STATEMENT FOR MINIMUM WAGE REVIEW 2013 TABLE OF CONTENTS AGENCY DISCLOSURE STATEMENT... 3 STATUS QUO AND PROBLEM DEFINITION... 5 The current minimum wage rates... 5 Key findings from
York, North Yorkshire And East Riding (Numbers)
") Labour Market Profile - The profile brings together data from several sources. Details about these and related terminology are given in the definitions section. Resident Population Total population (2017)
Labour Market Profile - The profile brings together data from several sources. Details about these and related terminology are given in the definitions section. Resident Population Total population (2017)
Stoke-On- Trent And Staffordshire (Numbers)
") Labour Market Profile - The profile brings together data from several sources. Details about these and related terminology are given in the definitions section. Resident Population Total population (2017)
Labour Market Profile - The profile brings together data from several sources. Details about these and related terminology are given in the definitions section. Resident Population Total population (2017)
Great Britain (Numbers) All People 370,300 5,404,700 63,785,900 Males 179,600 2,627,500 31,462,500 Females 190,800 2,777,200 32,323,500
 All People 370,300 5,404,700 63,785,900 Males 179,600 2,627,500 31,462,500 Females 190,800 2,777,200 32,323,500") Labour Market Profile - The profile brings together data from several sources. Details about these and related terminology are given in the definitions section. Resident Population Total population (2016)
Labour Market Profile - The profile brings together data from several sources. Details about these and related terminology are given in the definitions section. Resident Population Total population (2016)
Great Britain (Numbers) All People 228,800 5,424,800 64,169,400 Males 113,900 2,640,300 31,661,600 Females 114,900 2,784,500 32,507,800
 All People 228,800 5,424,800 64,169,400 Males 113,900 2,640,300 31,661,600 Females 114,900 2,784,500 32,507,800") Labour Market Profile - The profile brings together data from several sources. Details about these and related terminology are given in the definitions section. Resident Population Total population (2017)
Labour Market Profile - The profile brings together data from several sources. Details about these and related terminology are given in the definitions section. Resident Population Total population (2017)
Cornwall And Isles Of Scilly (Numbers)
") Labour Market Profile - The profile brings together data from several sources. Details about these and related terminology are given in the definitions section. Resident Population Total population (2017)
Labour Market Profile - The profile brings together data from several sources. Details about these and related terminology are given in the definitions section. Resident Population Total population (2017)
Nottingham And Nottingham And. All People 2,178,000 4,724,400 63,785,900 Males 1,077,300 2,335,000 31,462,500 Females 1,100,700 2,389,400 32,323,500
 Labour Market Profile - Derbyshire, Nottingham And Nottinghamshire The profile brings together data from several sources. Details about these and related terminology are given in the definitions section.
Great Britain (Numbers) All People 85,100 5,810,800 63,785,900 Males 42,300 2,878,100 31,462,500 Females 42,800 2,932,600 32,323,500
 All People 85,100 5,810,800 63,785,900 Males 42,300 2,878,100 31,462,500 Females 42,800 2,932,600 32,323,500") Labour Market Profile - The profile brings together data from several sources. Details about these and related terminology are given in the definitions section. Resident Population Total population (2016)
Labour Market Profile - The profile brings together data from several sources. Details about these and related terminology are given in the definitions section. Resident Population Total population (2016)
Great Britain (Numbers) All People 127,500 5,517,000 63,785,900 Males 63,200 2,712,300 31,462,500 Females 64,400 2,804,600 32,323,500
 All People 127,500 5,517,000 63,785,900 Males 63,200 2,712,300 31,462,500 Females 64,400 2,804,600 32,323,500") Labour Market Profile - The profile brings together data from several sources. Details about these and related terminology are given in the definitions section. Resident Population Total population (2016)
Labour Market Profile - The profile brings together data from several sources. Details about these and related terminology are given in the definitions section. Resident Population Total population (2016)
All People 532,500 5,425,400 63,785,900 Males 262,500 2,678,200 31,462,500 Females 270,100 2,747,200 32,323,500. Bradford (Numbers)
") Labour Market Profile - The profile brings together data from several sources. Details about these and related terminology are given in the definitions section. Resident Population Total population (2016)
Labour Market Profile - The profile brings together data from several sources. Details about these and related terminology are given in the definitions section. Resident Population Total population (2016)
All People 23,100 5,424,800 64,169,400 Males 11,700 2,640,300 31,661,600 Females 11,300 2,784,500 32,507,800. Shetland Islands (Numbers)
") Labour Market Profile - The profile brings together data from several sources. Details about these and related terminology are given in the definitions section. Resident Population Total population (2017)
Labour Market Profile - The profile brings together data from several sources. Details about these and related terminology are given in the definitions section. Resident Population Total population (2017)
Brighton And Hove (Numbers) All People 287,200 9,030,300 63,785,900 Males 144,300 4,449,200 31,462,500 Females 142,900 4,581,100 32,323,500
 All People 287,200 9,030,300 63,785,900 Males 144,300 4,449,200 31,462,500 Females 142,900 4,581,100 32,323,500") Labour Market Profile - The profile brings together data from several sources. Details about these and related terminology are given in the definitions section. Resident Population Total population (2016)
Labour Market Profile - The profile brings together data from several sources. Details about these and related terminology are given in the definitions section. Resident Population Total population (2016)
MAIN LABOUR FORCE SURVEY RESULTS FOR THE FOURTH QUARTER OF 2013
 MAIN LABOUR FORCE SURVEY RESULTS FOR THE FOURTH QUARTER OF Main labour market data for the fourth of The activity rate of population aged 15-64 was 68.6%, by 0.7 percentage point higher in comparison with
Great Britain (Numbers) All People 138,500 6,168,400 64,169,400 Males 69,400 3,040,300 31,661,600 Females 69,000 3,128,100 32,507,800
 All People 138,500 6,168,400 64,169,400 Males 69,400 3,040,300 31,661,600 Females 69,000 3,128,100 32,507,800") Labour Market Profile - The profile brings together data from several sources. Details about these and related terminology are given in the definitions section. Resident Population Total population (2017)
Labour Market Profile - The profile brings together data from several sources. Details about these and related terminology are given in the definitions section. Resident Population Total population (2017)
Insolvency Statistics and Debtor Profile Report 1 JULY 2014 TO 30 JUNE 2015
 Insolvency Statistics and Debtor Profile Report 1 JULY 2014 TO 30 JUNE 2015 Contents Introduction 2 Annual Statistics 3 Key Characteristics of Debtors 11 Summary Instalment Orders 12 No Asset Procedures
THE STATISTICAL REPORT
 THE STATISTICAL REPORT FOR THE YEAR ENDING JUNE 2011 2012 Ministry of Social Development Acknowledgments: The Ministry of Social Development is grateful for the assistance of staff from all of its service
Great Britain (Numbers) All People 2,300 5,517,000 63,785,900 Males 1,200 2,712,300 31,462,500 Females 1,100 2,804,600 32,323,500
 All People 2,300 5,517,000 63,785,900 Males 1,200 2,712,300 31,462,500 Females 1,100 2,804,600 32,323,500") Labour Market Profile - The profile brings together data from several sources. Details about these and related terminology are given in the definitions section. Resident Population Total population (2016)
Labour Market Profile - The profile brings together data from several sources. Details about these and related terminology are given in the definitions section. Resident Population Total population (2016)
Tonbridge And Malling (Numbers) All People 128,900 9,080,800 64,169,400 Males 63,100 4,474,400 31,661,600 Females 65,800 4,606,400 32,507,800
 All People 128,900 9,080,800 64,169,400 Males 63,100 4,474,400 31,661,600 Females 65,800 4,606,400 32,507,800") Labour Market Profile - The profile brings together data from several sources. Details about these and related terminology are given in the definitions section. Resident Population Total population (2017)
Labour Market Profile - The profile brings together data from several sources. Details about these and related terminology are given in the definitions section. Resident Population Total population (2017)
Economic Standard of Living
 DESIRED OUTCOMES New Zealand is a prosperous society where all people have access to adequate incomes and enjoy standards of living that mean they can fully participate in society and have choice about