NORTH CAROLINA BEACH AND INLET UPDATE MANAGEMENT PLAN FINAL REPORT DECEMBER 2016
|
|
|
- Christiana Kelly
- 5 years ago
- Views:
Transcription


1 NORTH CAROLINA BEACH AND INLET MANAGEMENT PLAN UPDATE FINAL REPORT DECEMBER 2016
2 EXECUTIVE SUMMARY North Carolina s oceanfront beaches and active tidal inlets play a dominant role in promulgating the state cultural heritage and providing significant economic impact to the state. The state recognized that to maintain and enhance these valuable resources necessitated the development of a management strategy that would evolve with changes to the State oceanfront beaches and tidal inlets. Through legislation passed by the General Assembly in 2000 (Section 13.9c of HB 1840) and recommendations presented in the Coastal Habitat Projection Plan of 2005), the North Carolina Department of Environmental Quality commissioned the development of a comprehensive Beach and Inlet Management Plan (BIMP) that was completed in An update to the BIMP was authorized in 2015 (HB 97) to incorporate new coastal and socio-economic data and reflect policy changes that had been implemented since the original report. The updated BIMP would also include supplemental studies conducted by the Departments of Commerce, Environmental Quality, and Revenue on the benefits of state s beaches and beach nourishment projects. The primary focus of the update to the BIMP was to incorporate beach nourishment and dredging activities completed over the past seven years as well as refine the historical data evaluated in the initial report in order to develop an updated accurate estimate of the funding needed to maintain the State s beaches and inlets. The more comprehensive data set served as the basis for refining the volume and cost projections of dredging and beach nourishment for current and future managed shorelines. Potential funding sources to establish a statewide beach preservation fund were identified and evaluated. Similarly, the funding for appropriations to the state s deep draft navigation fund were also identified. Revisions to the socio-economic impact study of the state s beaches and inlets were conducted to highlight the importance of these vital resources and the need for the state to increase their participation in preserving them. Socio-Economic Value of State Beaches and Inlets Citizens of the State and visitors derive considerable benefits from the coastal region. Beaches and inlets support millions of beach recreationists every year, provide billions in economic value through business and tourism as well as residential and commercial property value. They also provide a direct source of employment and generate associated jobs in the coastal communities. The direct expenditures generated by the beaches and inlets amounts to $2.5 billion. When multiplier effects are added, these numbers rise to $6.1 billion supporting almost 65,000 jobs. The total State tax revenue from all these sectors is $188.4 million/yr. The recreational consumer surplus resulting from beaches and inlets is over $214 million. ES-1
3 The value of coastal property at risk in the eight oceanfront counties as defined by the Ocean Erodible Area was $11.73 billion using the 1998 setback factors and $11.12 billion using the 2012 setback factors, indicating that beach and inlet management strategies have been effective in reducing risk ($600.8 million reduction). If only the five counties that actively complete nourishment are considered the reduction in risk is even greater at an approximate $818.8 million. Non-NC residents own less than half of the parcels at risk in the eight coastal counties but own more than half of the parcel value at risk. Data Collection and Refinement Dredging Projects or parts of projects where material was not used for beneficial reuse (each nourishment specifically) but placed on disposal islands or at offshore disposal sites were categorized as dredging projects. This database was updated for the 2008 to 2015 timespan and included additional historical data. Statewide dredging volume has decreased from 6 million cy/yr historically to under 4.5 million cy/yr in the past 5 years. Separating shallow and deep projects in the statewide trends; deep draft volumes have remained constant around 3 million cy/yr while shallow draft volumes have reduced from 3 million cy/yr historically to around 1.5 million cy/yr in the past five years. The reduction in dredged volumes is to a corresponding reduction in federal funds for shallow draft projects in NC. The total cost of dredging in 2015 dollars is $25 to $30 million, with federal deep draft spending averaging $21 million annually over the last five years and statewide shallow draft inlet spending averaging $7 million over the same time period. Historically, shallow draft spending averaged $17.5 million when the AIWW and other shallow draft inlet channels were routinely dredged to their authorized depth. Beach Nourishment The beach nourishment database was updated to include new data from 2008 to 2015 as well as complete data gaps prior to Total volumes, distances, and costs (total and average cost/yr) for beach nourishment events that occurred between 1955 and 2015 were summarized statewide and by region. Historically, the beach nourishment volume placed statewide has been between 1 and 2 million cubic yards (cy) but has increased to 4 to 5 million cubic yards over the last five years. The total statewide cost have reached approximately $50M; with Federal and State/Local share split evenly at approximately $25M each. ES-2
4 Projection of Funding Needs Dredging The state used to receive substantial federal funding to maintain shallow and deep draft inlets, however federal funding has declined in recent years, especially for shallow draft projects. In 2013, the state established a Shallow Draft Navigation Channel and Lake Dredging (SDI) Fund to compensate for the loss of federal funding. Current funding levels for the SDI are low ($6.6 million/yr) but funding level may rise to $20 to $25 million/yr if historical maintenance levels were achieved. Some increases have already been seen in the present year (e.g. Oregon Inlet). The Shallow Draft Navigation Channel and Lake Dredging Fund has a total appropriation (with the local cost share included) of $28.5 million/yr. All shallow draft projects including those associated with the AIWW can be maintained at present levels with present funds. Federal funding of the state s deep draft channels has been problematic as of late and has resulted in increased draft restrictions as dredging volumes have not kept pace with the increase in authorized dredge depths. The most challenging sections to maintain authorized depths are the ocean bars of the Wilmington Harbor and Morehead City Harbor projects where shoaling is a constant issue. Dredging of inland sections of deep draft navigation projects appear to receive adequate fund to maintain these portions. The General Assembly has recognized the need to maintain the two deep draft navigation projects in the state by establishing a deep draft fund but monies for this fund were not appropriated. These studies suggest that a conservative funding estimate of $17.5 million/yr may be needed to maintain the ocean bars of these deep draft harbor channels. The proposed split in the fund would be $10 million/yr for Wilmington Harbor and $7.5 million/yr for Morehead City Harbor. Beach Nourishment The total shoreline in North Carolina is 326 miles long and the total historically managed shoreline is approximately 74.8 miles. Currently there is a near 50% split in Federal managed and State/Local managed shoreline, each contributing approximately $25 million annually. The current total managed shoreline may increase from 74.8 miles to 85.3 miles with State/Local managed shoreline increasing from 38 to 57.1 miles after projects that are planned but not permitted are implemented. This would increase the state/ local s cost share to approximately $40 million annually. Assuming a gradual reduction in federal funding of Coastal Storm Damage Reduction Projects and taking into consideration storm impacts that occur on average every 4 years and other upfront engineering/environmental costs, the preliminary recommendation for a State/Local beach nourishment fund is $40 million to $60 million annually. Cost share scenarios between the state and local sponsors were identified for the recommended funding ES-3
5 levels. A minimum target of $25M annually is recommended for the state beach nourishment fund which would allow for some buffer and a minimum 50/50 cost share between State/Local interests. The ultimate need for beach nourishment and associated funding was projected based the management of all developed shoreline, a shoreline distance of miles. The ultimate State/Local funding need may increase to $92 million /yr for a projected total of $95 to $115 million, allowing for a buffer for some CSDR and storm funding or upfront engineering/environmental studies. Potential Funding Sources Dedicated Shallow Draft Dredging Fund As has been shown previously, the current shallow draft fund ($19 million/yr) is adequate to meet both current and future projected needs and should be kept as is. This fund is more than justified given the amount of economic impact provided by the inlets to our State. Based on results from Section II, the inlets in NC provide $651.8 million in direct impact, $908.8 million in indirect impact, and 13,220 jobs. This approximates a ROI of $34.3/$1 to $47.8/$1 depending on whether economic multiplier effects are considered or not. Dedicated Deep Draft Dredging Fund The Deep Draft Port fund should be a recurring appropriation of $17.5 million/yr by the legislature as part of its investment in our ports. As a condition of fund use, all beach compatible material must be placed directly on adjacent beaches. As discussed previously, the ports bring an estimated economic impact of $ million (direct) and $ million (indirect) with 2,973 jobs. This approximates a ROI of $12.7/$1 to $23.8/$1 depending on whether economic multiplier effects are considered or not. Dedicated Beach Nourishment Fund The documented benefits of beach preservation projects as identified the socio-economic analysis supports the creation of dedicated State funding sources to supplement local investment. Since the private sector and consumers in North Carolina s eight coastal counties already generate between $1 to $26 billion in taxable sales, meals, short-term lodging, real estate transfer, and non-resident property taxes, an increase to taxes on each of these revenues sources in the eight coastal counties may generate additional tax revenue as high as: ES-4
6 $25 million from seasonal 0.5% State sales tax $15.1 million from a new 1% State meals tax $10 million from an additional land transfer fee of $1/$500 $21.2 million from a new 2% State OT $26.4 million from a new $0.10 ad-valorem tax per $100 of valuation non-resident properties. To fund a Statewide beach preservation fund of $20M to $30M ($25M minimum target) annually based on a minimum 50% state cost share of the non-federal share of all beach preservation project, three preferred revenue options were further refined. 1) A single source: a. A new 0.5% seasonal State sales tax, which will generate $25 million. b. A new state ad-valorem property tax on property owned by non-nc residents ($0.10/$100), which will generate $26.4M 2) A combined source: a. A new 1% State meals tax, which will generate $15.1 million, and b. An additional land transfer fee of $1/$500, which will generate $10 million. 3) Reallocation of 50% of existing State sales tax collections revenues from shortterm lodging sales, which will generate $25.2 million. Each recommended funding source will keep pace with the State s beach preservation needs for the foreseeable future. The revenues generated by each funding source are ONLY the revenues generated in the eight coastal counties. If a new State tax were to be implemented statewide, ONLY that portion generated in the coastal counties would be deposited into the beach preservation fund. These funding strategies could be applied statewide if desire to also fund other regional needs. In any case, the development of a state dedicated beach nourishment fund is justified. Even if one were to just consider the economic impact to the counties outside of the eight coastal counties, the investment of $25 million provides $1.406 billion in indirect economic impact (ROI = $56/$1) and just over 10,000 jobs. If the eight coastal counties are included, the economic effect goes to $1.66 billion direct impact (ROI = $66.5/$1) and $4.74 billion indirect (ROI = $189.9/$1) with 48,718 jobs. Recommendations The current trend indicates that the scope and costs associated with beach nourishment and dredging projects in the state will continue to increase in the foreseeable future. Federal participation in beach nourishment and dredging projects has waned over the past decade as the federal government transfers the burden to the state and local ES-5
7 sponsors. The State of North Carolina has been actively supporting its shallow draft inlet dredging projects with the development of a dedicated Shallow Draft Navigation and Lake Dredging Fund which is projected to cover both current and future needs. Companion dedicated deep draft dredging and beach nourishment funds are needed. A recurring appropriation from general funds of $17.5 million/yr is recommended for the deep draft dredging fund with the condition that all beach compatible material must be placed directly on adjacent beaches. To support beach nourishment projects a State fund of a minimum of $25 million annually is recommended. There are three preferred options to generate revenue for the beach preservation fund including single and combined source new taxes or the reallocation of existing state sales tax within the eight coastal counties. The selection of the appropriate revenue source shall be made by the General Assembly with input from stakeholders in the eight coastal counties. These discussions should also include how the potential funding will be distributed amongst the regions and whether a simple (direct allocation to regions (counties) based on managed beach mileage) or complex (funding allocated to projects based on various criteria) decision tree should be followed. ES-6
8 Table of Contents I. INTRODUCTION AND BACKGROUND... I-1 II. III. A. Beach and Inlet Management Plan... I-1 B. Beach and Inlet Management Plan Update... I-3 C. Additional State Sponsored Studies... I-5 SOCIO-ECONOMIC VALUE OF NORTH CAROLINA BEACHES AND INLETS... II-1 A. Data Sources... II-2 1. National-Level Data Sources... II-2 2. State-Level Data Sources... II-2 3. Issue-Specific Studies... II-3 B. Value of Deep Draft Ports... II-3 C. Value of Beaches... II Value of Coastal Property At Risk... II Value of Beach Recreation... II Value of Shore and Pier Fishing... II Value of Marine Recreational Services... II-39 D. Value of Shallow Draft Inlets... II Value of Commercial Fisheries... II Value of For-Hire (Charter Boat and Head Boat) Fisheries... II Value of Private Recreational Boating... II Value of Coastal Boat Building... II Value of Coastal Marinas... II-52 E. Economic Impact Scenarios... II Economic Impacts of Beach Width Loss... II Economic Impacts of Inlet Shoaling... II-62 F. Overall Summary of Socio-Economic Value of Beaches and Inlets in North Carolina... II-69 DATA COLLECTION AND REFINEMENT... III Region Development... III Database Development... III-13 Dredging Overview... III-14 i
9 IV. 1. Dredge Types and Capabilities... III-14 Dredging Database Update... III Region 1... III Region 2... III Region 3... III Region 4... III Statewide Overall Summary... III-68 Beach Nourishment Overview... III-92 Beach Nourishment Database Update... III Region 1... III Region 2... III Region 3... III Region 4... III Statewide Overall Summary... III-130 PROJECTIONS OF FUNDING NEEDS... IV-1 A. Dredging Funding Need Projections... IV-1 1. Historical Data... IV-1 2. Shallow Draft Funding Needs Projections... IV-9 3. Deep Draft Funding Needs Projections... IV-11 B. Beach Nourishment Funding Need Projections... IV Historical Data... IV Beach Nourishment Funding Need Current and Future... IV-18 V. POTENTIAL FUNDING SOURCES AND RECOMMENDATIONS FOR NORTH CAROLINA BEACH AND INLET PROJECTS... V-1 A. Economic Value of North Carolina Coastal Resources... V-2 1. State Coastal and Beach Tourism... V-3 2. The Economy of Beaches Compared to Other Recreational Activities... V-5 3. The Atlantic Coast Development Region... V-7 B. Evaluation of Existing Beach Preservation Funding Programs... V Federal Funding Programs... V State Funding Programs... V-13 C. Potential Revenue Sources for Dedicated Beach and Inlet Funding... V-26 ii
10 1. Shallow Draft Dredging Funding... V Deep Draft Dredging Funding... V Beach Nourishment Funding... V-26 D. Potential Funding Prioritization Options... V Florida State Beach Preservation Grant Application Program... V Simple Annual Regional Funding Program... V-41 E. Funding Program Recommendations... V Shallow Draft Dredging Recommendations... V Deep Draft Dredging Recommendations... V Beach Nourishment Recommendations... V-42 VI. FINDINGS AND RECOMMENDATIONS... VI-1 A. Socio-Economic Value of State Beaches and Inlets... VI-1 B. Data Collection and Refinement... VI-3 1. Dredging... VI-3 2. Beach Nourishment... VI-3 C. Projection of Funding Needs... VI-4 1. Dredging... VI-4 2. Beach Nourishment... VI-5 D. Potential Funding Sources... VI-7 E. Recommendations... VI-8 Appendices Appendix A Data Bibliography Appendix B Beach Nourishment Database Appendix C Dredge Database Appendix D Stakeholder Process Appendix E Department of Environmental Quality (DEQ) Study Appendix F Department of Commerce (DOC) Study Appendix G Department of Revenue (DOR) Study iii
11 List of Figures Figure I-1. Beach and Inlet Management Regions... I-2 Figure II-1. Location of North Carolina Shore and Pier Fishing Sites... II-38 Figure III-1. Four Main Regions and the Capes... III-2 Figure III-2. Delineation of BIMP Sub-regions... III-3 Figure III-3. Region 1 Boundaries... III-4 Figure III-4. Region 2a Boundaries... III-5 Figure III-5. Region 2b Boundaries... III-6 Figure III-6. Region 2c Boundaries... III-7 Figure III-7. Region 3a Boundaries... III-8 Figure III-8. Region 3b Boundaries... III-9 Figure III-9. Region 4a Boundaries... III-10 Figure III-10. Region 4b Boundaries... III-11 Figure III-11. Region 4c Boundaries... III-12 Figure III-12. Typical Mechanical Dredge (Clamshell Bucket with Bottom Dumping Barge)... III-15 Figure III-13. Typical Hopper Dredge... III-15 Figure III-14. Typical Sidecaster Dredge... III-16 Figure III-15. Typical Cutterhead Hydraulic Dredge... III-17 Figure III-16. Summary of Total Dredge Volume Summary - Region 1 ( )... III-23 Figure III-17. Summary of Shallow Draft Dredge Volume Region 1 ( )... III-24 Figure III-18. Summary of Deep Draft Dredge Volume - Region 1 ( )... III-25 Figure III-19. Number of Dredge Project - Region 1 by Project Size... III-27 Figure III-20. Total Dredge Cost Data - Region 1 ( )... III-28 Figure III-21. Total Shallow Draft Cost Data - Region 1 ( )... III-29 Figure III-22. Total Deep Draft Cost Data - Region 1 ( )... III-30 Figure III-23. Summary of Shallow Draft Dredge Volume - Region 2a ( )... III-32 Figure III-24. Number of Dredge Project - Region 2a by Project Size... III-33 Figure III-25. Total Dredge Cost Data - Region 2a ( )... III-35 Figure III-26. Summary of Shallow Draft Dredge Volume - Region 2b ( )... III-37 iv
12 Figure III-27. Number of Dredge Projects - Region 2b by Project Size... III-38 Figure III-28. Total Dredge Cost Data - Region 2b ( )... III-40 Figure III-29. Summary of Total Dredging Volume - Region 2c ( )... III-42 Figure III-30. Summary of Shallow Draft Dredge Volume - Region 2c ( )... III-43 Figure III-31. Summary of Deep Draft Dredge Volume - Region 2c ( )... III-44 Figure III-32. Number of Dredge Projects - Region 2c by Project Size... III-46 Figure III-33. Total Dredge Cost Data - Region 2c ( )... III-47 Figure III-34. Total Shallow Draft Cost Data - Region 2c ( )... III-48 Figure III-35. Total Deep Draft Cost Data - Region 2c ( )... III-49 Figure III-36. Summary of Shallow Draft Volume Region 3a ( )... III-51 Figure III-37. Number of Dredge Projects - Region 3a by Project Size... III-52 Figure III-38. Total Dredge Cost Data - Region 3a ( )... III-53 Figure III-39. Summary of Shallow Draft Volume - Region 3b ( )... III-55 Figure III-40. Number of Dredge Projects - Region 3b by Project Size... III-57 Figure III-41. Total Dredge Cost Data - Region 3b ( )... III-58 Figure III-42. Summary of Shallow Draft Volume - Region 4a ( )... III-60 Figure III-43. Number of Dredge Projects Region - 4a by Project Size... III-61 Figure III-44. Total Dredge Cost Data - Region 4a ( )... III-62 Figure III-45. Summary of Shallow Draft Volume - Region 4b ( )... III-64 Figure III-46. Number of Dredge Projects - Region 4b by Project Size... III-65 Figure III-47. Total Dredge Cost Data Region 4b ( )... III-67 Figure III-48. Summary of Shallow Draft Volume - Statewide ( )... III-69 Figure III-49. Summary of Deep Draft Volume - Statewide ( )... III-70 Figure III-50. Summary of Shallow Draft Volume - AIWW & Inland Waterways ( )... III-72 Figure III-51. Number of Dredge Projects AIWW & Inland Waterways by Project Size... III-74 Figure III-52. Summary of Total Dredge Volume - Statewide ( )... III-75 Figure III-53. Summary of Total Dredge Volume by Region ( )... III-76 Figure III-54. Total Shallow Draft Cost Data - Statewide ( )... III-79 Figure III-55. Shallow Draft Unit Cost - Statewide ( )... III-80 v
13 Figure III-56. Total Deep Draft Cost Data - Statewide ( )... III-82 Figure III-57. Deep Draft Unit Cost - Statewide ( )... III-83 Figure III-58. Deep Draft Unit Cost with Beneficial Use ( )... III-84 Figure III-59. Total Dredge Data - AIWW & Inland Waterways ( )... III-86 Figure III-60. Total Dredge Cost Data - Statewide ( )... III-89 Figure III-61. Summary of Total Dredging Costs by Region ( )... III-90 Figure III-62. Cutter Suction Dredge Operation (Oak Island)... III-93 Figure III-63. Hopper Dredge Operation (Bogue Banks)... III-94 Figure III-64. Region 1 Volume Summary... III-98 Figure III-65. Region 1 Distance Summary... III-99 Figure III-66. Region 1 Cost Summary... III-100 Figure III-67. Region 2a Volume Summary... III-103 Figure III-68. Region 2a Distance Summary... III-104 Figure III-69. Region 2a Cost Summary... III-105 Figure III-70. Region 2b Volume Summary... III-108 Figure III-71. Region 2b Distance Summary... III-109 Figure III-72. Region 2b Cost Summary... III-110 Figure III-73. Region 2c Volume Summary... III-113 Figure III-74. Region 2c Distance Summary... III-114 Figure III-75. Region 2c Cost Summary... III-115 Figure III-76. Region 3a Volume Summary... III-118 Figure III-77. Region 3a Distance Summary... III-119 Figure III-78. Region 3a Cost Summary... III-120 Figure III-79. Region 4a Volume Summary... III-122 Figure III-80. Region 4a Distance Summary... III-123 Figure III-81. Region 4a Cost Summary... III-124 Figure III-82. Region 4b Volume Summary... III-127 Figure III-83. Region 4b Distance Summary... III-128 Figure III-84. Region 4b Cost Summary... III-129 Figure III-85. Statewide Total Volume Summary... III-132 vi
14 Figure III-86. Statewide Total Distance Summary... III-133 Figure III-87. Statewide Federal and State/Local Distance Summary... III-134 Figure III-88. Statewide Total Cost Summary... III-135 Figure III-89. Statewide Federal and State/Local Cost Summary... III-136 Figure III-90. Statewide Unit Cost Summary... III-137 Figure IV-1. Changes in Federal Spending (USACE, 2016a)... IV-1 Figure IV-2. Summary of Shallow Draft Volume Statewide ( )... IV-3 Figure IV-3. Summary of Shallow Draft Volume AIWW & Inland Waterways ( )... IV-3 Figure IV-4. Summary of Deep Draft Volume Statewide ( )... IV-4 Figure IV-5. Summary of Total Dredge Volume Statewide ( )... IV-4 Figure IV-6. Total Shallow Draft Cost Data - Statewide ( )... IV-7 Figure IV-7. Total Deep Draft Cost Data - Statewide ( )... IV-7 Figure IV-8. Total Dredge Data - AIWW & Inland Waterways ( )... IV-8 Figure IV-9. Total Dredge Cost Data - Statewide ( )... IV-8 Figure IV-10. Total Shallow Draft Cost Data - Statewide ( ) With 4-yr Moving Avg... IV-10 Figure IV-11. Total Dredge Data - AIWW & Inland Waterways ( ) With 4-yr Moving Avg.... IV-11 Figure IV-12. Comparison of NC Ports to Nearby Ports with National Ranking (USACE, 2016a)... IV-12 Figure IV-13. Deep Draft Funding... IV-13 Figure IV-14. Statewide Total Volume Summary... IV-15 Figure IV-15. Statewide Total Distance Summary... IV-15 Figure IV-16. Statewide Federal and State/Local Distance Summary... IV-16 Figure IV-17. Statewide Total Cost Summary... IV-16 Figure IV-18. Statewide Federal and State/Local Cost Summary... IV-17 Figure V Average Total Trip Spending of North Carolina Overnight Visitors (VNC, 2015)... V-4 Figure V-2. Dare County, NC, Monthly Occupancy Receipts (Sales), (EROB, 2016a)... V-6 Figure V-3. Example cost share breakdown: New Jersey... V-11 vii
15 Figure V-4. Histogram of the Frequency of Lodging Tax Rates in 150 Largest U.S. Cities... V-38 viii
16 List of Tables Table II-1. North Carolina State Ports Authority Operating Revenues... II-4 Table II-2. Port of Wilmington, Direct Revenue/Output, II-5 Table II-3. Port of Morehead City, Direct Revenue/Output, II-5 Table II-4. Port of Wilmington, Estimated Direct Revenue/Output, Average Year... II-6 Table II-5. Port of Morehead City, Estimated Direct Revenue/Output, Average Year... II-6 Table II-6. Port of Wilmington, Direct Employment, II-7 Table II-7. Port of Morehead City, Direct Employment, II-7 Table II-8. Port of Wilmington, Estimated Direct Employment, II-8 Table II-9. Port of Morehead City, Estimated Direct Employment, II-8 Table II-10. Deep Draft Port Economic Impact Values... II-9 Table II-11. Alternative Trucking Distances and Transport Costs... II-10 Table II-12. Alternative Rail Distances and Transport Costs... II-11 Table II-13. Increased Costs of Transporting North Carolina Cargo to Alternative Ports... II-12 Table II-14. North Carolina Coastal Counties Geographic Characteristics... II-13 Table II-15. North Carolina Coastal Counties Population and Socio-Economic Characteristics... II-13 Table II-16. Parcel Property Data Transfer Dates and Property Value Assessment Dates... II-14 Table II-17. Coastal N.C County Zip Codes... II-16 Table II-18. Brunswick County Property Statistics... II-17 Table II-19. Brunswick County Properties at Risk... II-18 Table II-20. Brunswick County Properties at Risk... II-18 Table II-21. Brunswick County Difference in Properties at Risk (1998 v. 2012)... II-18 Table II-22. New Hanover County 2015 Property Statistics... II-19 Table II-23. New Hanover County 1998 Properties at Risk... II-19 Table II-24. New Hanover County 2012 Properties at Risk... II-19 Table II-25. New Hanover County - Difference in Properties at Risk (1998 v. 2012)... II-20 ix
17 Table II-26. Onslow County Property Statistics... II-20 Table II-27. Onslow County 1998 Properties at Risk... II-20 Table II-28. Onslow County 2012 Properties at Risk... II-21 Table II-29. Onslow County - Difference in Properties at Risk (1998 v. 2012)... II-21 Table II-30. Pender County 2015 Property Statistics... II-21 Table II-31. Pender County 1998 Properties at Risk... II-22 Table II-32. Pender County 2012 Properties at Risk... II-22 Table II-33. Pender County - Difference in Properties at Risk (1998 v. 2012)... II-22 Table II-34. Carteret County 2015 Property Statistics... II-23 Table II-35. Carteret County 1998 Properties at Risk... II-23 Table II-36. Carteret County 2012 Properties at Risk... II-23 Table II-37. Carteret County - Difference in Properties at Risk (1998 v. 2012)... II-24 Table II-38. Hyde County 2015 Property Statistics... II-24 Table II-39. Dare County 2015 Property Statistics... II-25 Table II-40. Dare County 1998 Properties at Risk... II-25 Table II-41. Dare County 2012 Properties at Risk... II-25 Table II-42. Dare County - Difference in Properties at Risk (1998 v. 2012)... II-26 Table II-43. Currituck County 2015 Property Statistics... II-26 Table II-44. Currituck County 1998 Properties at Risk... II-26 Table II-45. Currituck County 2012 Properties at Risk... II-27 Table II-46. Currituck County - Difference in Properties at Risk (1998 v. 2012)... II-27 Table II-47. Oceanfront Coastal Counties 2015 Property Statistics... II-27 Table II-48. Oceanfront Coastal Counties 1998 Properties at Risk... II-28 Table II-49. Oceanfront Coastal Counties 2012 Properties at Risk... II-28 Table II-50. Oceanfront Coastal Counties - Difference in Properties at Risk (1998 v. 2012)... II-28 Table II-51. Five Oceanfront Coastal Counties with Nourishment Programs 2015 Property Statistics... II-29 Table II-52. Five Oceanfront Coastal Counties with Nourishment Programs 1998 Properties at Risk... II-29 x
18 Table II-53. Five Oceanfront Coastal Counties with Nourishment Programs 2012 Properties at Risk... II-29 Table II-54. Five Oceanfront Coastal Counties with Nourishment Programs Difference in Properties at Risk (1998 v. 2012)... II-30 Table II-55. Local Beach Recreation Values... II-36 Table II-56. Regional and Statewide Beach Recreation Values... II-37 Table II-57. Regional Shore and Pier Fishing Values... II-39 Table II-58. Regional Marine Recreational Services Values... II-40 Table II-59. Regional Commercial Fishing Values... II-42 Table II-60. Regional Seafood Packing and Processing Values... II-43 Table II-61. Regional For-Hire (Charter Boat and Head Boat) Fisheries Values... II-47 Table II-62. Regional Private Recreational Boating (Fishing and non-fishing) Values. II-50 Table II-63. Regional Coastal Boat Building Values... II-52 Table II-64. Regional Coastal Marinas Values... II-54 Table II-65. Baseline 2004 Beach Widths and Width Losses in the Bin et al. (2007) Analysis... II-58 Table II-66. Beach Width Values... II-59 Table II-67. Beach Recreational Loss and Shore Fishing Loss Estimates... II-61 Table II-68. Inlet Shoaling Scenario Depths... II-62 Table II-69. Shoaling Impacts on Commercial Fishing... II-64 Table II-70. Shoaling Impacts on For-Hire Fishing (Charter and Head Boat Fishing Combined)... II-66 Table II-71. Qualitative Impacts of Shoaling on Boat Builders... II-68 Table II-72. Other Qualitative Impacts of Shoaling... II-69 Table II-73. Oceanfront Coastal Counties - Summary of Property at Risk... II-70 Table II-74. North Carolina Statewide Summary... II-70 Table III-1. Comparison of Various Dredge Types... III-18 Table III-2. Summary of Dredge Data... III-21 Table III-3. Summary of Dredge Volume Data Region 1 ( )... III-26 Table III-4. Summary of Dredge Volume Data - Region 1 ( )... III-26 Table III-5. Summary of Dredge Volume Data - Region 1 ( )... III-26 xi
19 Table III-6. Dredging Costs - Region 1 ( )... III-31 Table III-7. Dredging Costs - Region 1 ( )... III-31 Table III-8. Dredging Costs - Region 1 ( )... III-31 Table III-9. Summary of Dredge Volume Data - Region 2a ( )... III-33 Table III-10. Summary of Dredge Volume Data - Region 2a ( )... III-33 Table III-11. Summary of Dredge Data - Region 2a ( )... III-33 Table III-12. Dredging Costs - Region 2a ( )... III-36 Table III-13. Dredging Costs - Region 2a ( )... III-36 Table III-14. Dredging Costs - Region 2a ( )... III-36 Table III-15. Summary of Dredge Volume Data - Region 2b ( )... III-38 Table III-16. Summary of Dredge Volume Data - Region 2b ( )... III-38 Table III-17. Summary of Dredge Volume Data - Region 2b ( )... III-38 Table III-18. Dredging Costs - Region 2b ( )... III-41 Table III-19. Dredging Costs Region 2b ( )... III-41 Table III-20. Dredging Costs Region 2b ( )... III-41 Table III-21. Summary of Dredge Volume Data - Region 2c ( )... III-45 Table III-22. Summary of Dredge Volume Data - Region 2c ( )... III-45 Table III-23. Summary of Dredge Volume Data - Region 2c ( )... III-45 Table III-24. Dredging Costs - Region 2c ( )... III-50 Table III-25. Dredging Costs - Region 2c ( )... III-50 Table III-26. Dredging Costs - Region 2c ( )... III-50 Table III-27. Summary of Dredge Volume Data - Region 3a ( )... III-52 Table III-28. Summary of Dredge Volume Data - Region 3a ( )... III-52 Table III-29. Summary of Dredge Volume Data - Region 3a ( )... III-52 Table III-30. Dredging Costs - Region 3a ( )... III-54 Table III-31. Dredging Costs - Region 3a ( )... III-54 Table III-32. Dredging Costs - Region 3a ( )... III-54 Table III-33. Summary of Dredge Volume Data - Region 3b ( )... III-56 Table III-34. Summary of Dredge Volume Data - Region 3b ( )... III-56 Table III-35. Summary of Dredge Volume Data - Region 3b ( )... III-56 xii
20 Table III-36. Dredging Costs - Region 3b ( )... III-59 Table III-37. Dredging Costs - Region 3b ( )... III-59 Table III-38. Dredging Costs - Region 3b ( )... III-59 Table III-39. Summary of Dredge Volume Data - Region 4a ( )... III-61 Table III-40. Summary of Dredge Volume Data - Region 4a ( )... III-61 Table III-41. Summary of Dredge Volume Data - Region 4a ( )... III-61 Table III-42. Dredging Costs - Region 4a ( )... III-63 Table III-43. Dredging Costs - Region 4a ( )... III-63 Table III-44. Dredging Costs - Region 4a ( )... III-63 Table III-45. Summary of Dredge Volume Data - Region 4b ( )... III-65 Table III-46. Summary of Dredge Volume Data - Region 4b ( )... III-65 Table III-47. Summary of Dredge Volume Data - Region 4b ( )... III-65 Table III-48. Dredging Costs - Region 4b ( )... III-68 Table III-49. Dredging Costs - Region 4b ( )... III-68 Table III-50. Dredging Costs - Region 4b ( )... III-68 Table III-51. Summary of Dredge Volume Data AIWW & Inland Waterways ( )... III-73 Table III-52. Summary of Dredge Volume Data - AIWW & Inland Waterways ( )... III-73 Table III-53. Summary of Dredge Volume Data AIWW & Inland Waterways ( )... III-73 Table III-54. Summary of Statewide Dredging Volumes ( )... III-77 Table III-55. Summary of Statewide Dredging Volumes ( )... III-77 Table III-56. Summary of Statewide Dredging Volumes ( )... III-77 Table III-57. Dredging Costs - AIWW & Inland Waterways ( )... III-87 Table III-58. Dredging Costs - AIWW & Inland Waterways ( )... III-87 Table III-59. Dredging Costs - AIWW & Inland Waterways ( )... III-87 Table III-60. Dredging Costs - Statewide ( )... III-91 Table III-61. Dredging Costs - Statewide ( )... III-91 Table III-62. Dredging Costs - Statewide ( )... III-91 Table III-63. Summary of Beach Nourishment Data... III-96 xiii
21 Table III-64. Beach Nourishment Summary Data Region 1 ( )... III-101 Table III-65. Beach Nourishment Summary Data Region 1 ( )... III-101 Table III-66. Beach Nourishment Summary Data Region 1 ( )... III-101 Table III-67. Beach Nourishment Summary Data Region 2a ( )... III-106 Table III-68. Beach Nourishment Summary Data Region 2a ( )... III-106 Table III-69. Beach Nourishment Summary Data Region 2a ( )... III-106 Table III-70. Beach Nourishment Summary Data Region 2b ( )... III-111 Table III-71. Beach Nourishment Summary Data Region 2b ( )... III-111 Table III-72. Beach Nourishment Summary Data Region 2b ( )... III-111 Table III-73. Beach Nourishment Summary Data Region 2c ( )... III-116 Table III-74. Beach Nourishment Summary Data Region 2c ( )... III-116 Table III-75. Beach Nourishment Summary Data Region 2c ( )... III-116 Table III-76. Beach Nourishment Summary Data Region 3b ( )... III-121 Table III-77. Beach Nourishment Summary Data Region 3b ( )... III-121 Table III-78. Beach Nourishment Summary Data Region 3b ( )... III-121 Table III-79. Beach Nourishment Summary Data Region 4a ( )... III-125 Table III-80. Beach Nourishment Summary Data Region 4a ( )... III-125 Table III-81. Beach Nourishment Summary Data Region 4a ( )... III-125 Table III-82. Beach Nourishment Summary Data Region 4b ( )... III-130 Table III-83. Beach Nourishment Summary Data Region 4b ( )... III-130 Table III-84. Beach Nourishment Summary Data Region 4b ( )... III-130 Table III-85. Beach Nourishment Summary Data Statewide ( )... III-138 Table III-86. Beach Nourishment Summary Data Statewide ( )... III-138 Table III-87. Beach Nourishment Summary Data Statewide ( )... III-138 Table IV-1. Summary of Statewide Dredging Volumes ( )... IV-5 Table IV-2. Summary of Statewide Dredging Volumes ( )... IV-5 Table IV-3. Summary of Statewide Dredging Volumes ( )... IV-5 Table IV-4. Dredging Costs - Statewide ( )... IV-9 Table IV-5. Dredging Costs - Statewide ( )... IV-9 Table IV-6. Dredging Costs - Statewide ( )... IV-9 xiv
22 Table IV-7. Beach Nourishment Summary Data Statewide ( )... IV-17 Table IV-8. Beach Nourishment Summary Data Statewide ( )... IV-18 Table IV-9. Beach Nourishment Summary Data Statewide ( )... IV-18 Table IV-10. Managed Shoreline Projections Summary... IV-19 Table IV-11. Current State/Local Beach Nourishment Funding Need Cost Share... IV-21 Table IV-12. Ultimate Future State/Local Beach Nourishment Funding Need Cost Share... IV-22 Table V-1. Top Five Activities 2014: State-wide vs. the Coastal Region (VNC, 2015)... V-3 Table V-2. Atlantic Coast (EDR) 2014 Economic Importance of NC Visitor Expenditures (USTA, 2015)... V-8 Table V-3.Comparison of Atlantic Coast EDR to other NCPED EDRs Economic Importance of NC Visitor Expenditures (USTA, 2015)... V-9 Table V-4. State Funding Models for Beach Preservation... V-15 Table V-5. Local Funding Models implemented in Dare County, NC... V-25 Table V-6. Hypothetical State Revenues Generated from "State Sales Tax"... V-29 Table V-7. Forecasts of Seasonal (May-September) State Sales Tax Revenue... V-30 Table V-8. Hypothetical State Revenues Generated from Meal Tax"... V-30 Table V-9. Forecasts of State Meal Tax Revenue.... V-31 Table V-10. Hypothetical State Revenues Generated from Additional Land Transfer Tax... V-32 Table V-11. Forecasts of Increased State Land Transfer Tax Revenue... V-32 Table V-12. Hypothetical State Revenues Generated from Occupancy Tax... V-33 Table V-13. Forecasts of New State Occupancy Tax Revenue... V-34 Table V-14. Hypothetical State Revenues Generated from Real Property (ad-valorem) Tax... V-35 Table V-15. Hypothetical State Revenues Derived from Reallocating Existing NC Sales and Use Tax Collections... V-36 Table V-16. Forecasts of Reallocated State Sales Tax Revenue... V-37 Table V-17. Total Lodging Taxes in Large U.S. Urban Areas... V-39 Table V-18. FDEP Criteria Used to Rank Annual Beach Preservation Grant Applications... V-40 xv
23 Table V-19. Annual Funding Requirements for a Dedicated State Beach Preservation Fund... V-43 Table VI-1. Economic Impact Summary... VI-2 Table VI-2. State/Local Beach Nourishment Funding Need Cost Share... VI-6 xvi
24 SECTION 1 INTRODUCTION AND BACKGROUND
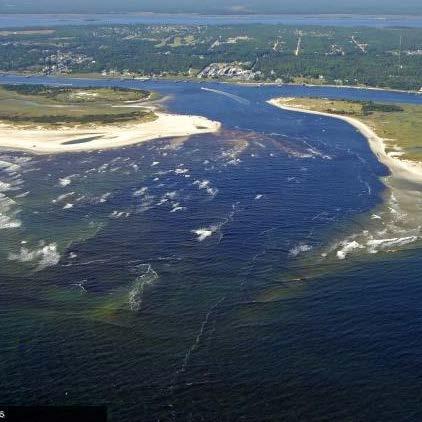
25 I. INTRODUCTION AND BACKGROUND North Carolina s 326 miles of oceanfront beaches and 19 active tidal inlets have and continue to be a critical aspect of the state s economic and environmental health while maintaining and promoting its cultural heritage. The use of state s beaches and inlets generated approximately $3 billion dollars in direct economic value (approximately $4.8 billion including multiplier effects) and over 39,000 direct jobs (approximately 62,000 jobs including multiplier effects) in 2008 to the state and the coastal communities through business and tourism activities. Marine-based economic sectors such as beach tourism, commercial and charter/headboat fishing, private boating and marinas, marine recreational services, and the boat building industry are directly linked to the health of beaches and inlets. Beach tourism by itself had a direct economic impact of $1.5 billion and produced over $400 million on consumer surplus value. Beaches and inlets also sustain coastal commercial and residential property values and reduce the vulnerability of coastal infrastructure and properties from damage during storm events and changing climatic conditions. These economic impacts do not include the contributions of the state s deepwater ports (Wilmington Harbor and Morehead City). The sustainability of these resources goes beyond economic impacts as the ecological value of a healthy coastal ecosystem cannot be measured by dollars alone. A. Beach and Inlet Management Plan The state recognized that to maintain and enhance these valuable resources an assessment of their condition and the development of a management strategy that would evolve with changes to the State oceanfront beaches and tidal inlets was required. Through legislation passed by the General Assembly in 2000 (Section 13.9c of HB 1840) and recommendations presented in the Coastal Habitat Projection Plan of 2005), the North Carolina Department of Environmental Quality (formerly Department of Environment and Natural Resources) commissioned the development of a comprehensive Beach and Inlet Management Plan (BIMP) to provide the following elements: Acquisition and review of coastal data to gain a thorough understanding of the state s beaches and inlets processes, Evaluation of the beach and inlet s role to the health and function of the state s coastal ecosystem, Identification of beach and inlet management regions, Assessment of the vulnerability of coastal infrastructure and cultural and ecological resources, Documentation of the socio-economic value of beaches and inlets, I-1

26 Development of management strategies and implementation costs, Considerations for the establishment of dedicated fund mechanism. This effort was conducted hand-in-hand with input from state and local stakeholders that resulted in the release of the BIMP report in An important outcome of the BIMP was the development of four main beach and inlet management regions and nine sub-regions as shown in Figure I-1. The beach and inlet management regions provide a holistic approach to addressing such issues as sediment resource or inlet management, shore protection, public access and estuarine wetland restoration. Figure I-1. Beach and Inlet Management Regions Another element of the plan was the compilation of historic beach and dredging management strategies that had been performed as a means to determine potential funding that may be needed to support beach and inlet strategies on a region or statewide basis. The collected project volume and cost data were averaged, annualized and escalated to 2008 dollars and incorporated into two databases; one for beach nourishment and one for dredging (shallow and deep draft projects and Atlantic I-2
27 Intracoastal Waterway). Short and long term trends were gleaned from the data to identify recent historic annualized volumes and cost. For beach nourishment projects up to 2007, an average of five to seven million cubic yards per year of material had been placed on state beaches at a cost of $35 to $38 million, with costs shared by federal, state, and local partners. For dredging associated with inlet and navigation, five to seven and half million cubic yards were historical dredged annually at a cost ranging from $24 to $33 million per year. Although the historic management strategies provided a snapshot into understanding the level of effort and associated costs in managing the state s beaches and inlet, the data was considered not representative of future beach nourishment needs. A statewide estimate for beach nourishment need was developed in the BIMP, utilizing statewide long-term erosion rates, a representative volume to shoreline loss ratio of 1.3 cy/ft and unit rates for dredging and sand placement to determine a need to place approximately 4 to 5.5 million cubic yards of material annually at a cost of $45 to $55 million. The findings from the BIMP stated that the estimated annual expenditures on beach nourishment and inlet projects ranged from $75 million to $85 million, inclusive of federal, state, and local cost shares. The federal interest, in 2008, funded between $15 to $30 million through long-term authorized storm damage reduction and deep draft navigation projects, which resulted in the need for the state and local sponsors to expend $45 to $55 million annually. The state was assumed to provide 40 to 50 percent of the funding of combined state and local share, resulting in a state funding requirement for beach and inlet management of approximately $25 to 30 million annually. If funding for federal deep draft navigation waned, the state share may grow to $30 to $42.5 million annually. This investment when compared with the $5 billion in economic impact produced by the state s beach and inlets produces a return on investment of $60 dollars for every $1 spent on maintaining these resources. The return on investment would increase if the economic contributions of deep draft ports were incorporated. A framework plan for the establishment of a dedicated state fund to support local beach and inlet management projects was presented, with revenue from the redirection of existing state sales tax on short-term leases and rentals of hotel, motels, and vacation homes in the eight coastal counties to support the fund. Other funding opportunities through the federal government including authorization of new coastal storm damage reduction projects or individual project reimbursements after declared disasters from the Federal Emergency Management Agency (FEMA). B. Beach and Inlet Management Plan Update The enabling legislation for the development of the BIMP recognized that new information including coastal and socio-economic data and changes in policy would I-3
28 warrant periodic updates to the management strategies. In 2015, the General Assembly ratified HB 97, which included Section 14.6(b)(4) authorizing NCDEQ to update the BIMP. In coordination with representatives of the NCDEQ, the following tasks were identified to address the goals and objectives of HB97. Task 1 - Update Dredging and Beach Nourishment Databases A more comprehensive data collection would be undertaken to update the dredging and beach nourishment spreadsheet databases and corresponding GIS-database developed during the original BIMP. This update would include project data since 2008 and refinement of historical data from the US Army Corps of Engineers, regional universities (NC State University and Western Carolina University) and local municipalities and their consultants. Information collected in preparing of the Shallow Draft Inlet project would be merged into the database. The database would be organized statewide and by region and include a breakdown in federal and state/local participation. Task 2 Develop Updated Dredging and Nourishment Projections/Costs and Cycle for Implementation Projections for dredging and beach nourishment projects by region/sub-region would be prepared for historical, current, and future conditions, with future conditions capped by the limit of developable shorelines in the state. Project costs would be developed for each projection based on historical data (stated in today s dollars) as well as available data for those areas that have not begun dredging/beach nourishment projects. This information would be used to develop a preliminary cycle of dredging/nourishment projects for both current and future conditions by region/sub-region. From these results, estimates of total annual costs over time would be developed for both current and future conditions. Task 3 Update Socio-Economic Study to Estimate Economic Benefits of Beach and Inlet Projects to North Carolina The socio-economic study to estimate the economic benefits of beach and inlet projects to the state and regions/sub-regions would be updated to reflect new or refined data since This update will include all factors included in the original BIMP and will incorporate studies produced by government agencies, consulting firms and professional journals since the release of the original BIMP. This update will also provide an order of magnitude estimate of the economic effect of the deep draft projects related to the NC ports. Task 4 Literature Review of Other States Funding Sources/Strategies & FEMA Engineered Beach Case Studies A literature review of other states funding sources and strategies for their state controlled beach and inlet funds would be undertaken. Possible integration of some of these items with past considerations for a NC beach and inlet management fund in the original BIMP will also be updated and explored. To maximize leveraging of available federal funds, I-4
29 documentation requirements for the development of FEMA engineered beaches and experiences from NC communities that have completed this effort would be included. A list of recommended items that a state beach/inlet fund could participate (cost-share) with local entities such as monitoring surveys, studies, master planning, EIS development, etc. would be identified. Task 5 Public Meetings & Projections/Costs/Cycles Revisions Based on Public Comment Presentations would be conducted at four regional meetings to review and received feedback on projections/costs and preliminary cycles for dredging/nourishment projects. Comments received at the meetings would be incorporated as warranted into revisions to the projections/costs. An outcome of the meetings would also include the agreement on an overall state fund need for dredging/nourishment projects and associated support efforts. Task 6 Prepare Draft and Final Report, Final Presentation & Client Meetings A comprehensive report based on the findings from Task 1 through 5 would be prepared for the State of North Carolina. The report will be a succinct summary of the work outlined above with references to the original BIMP. C. Additional State Sponsored Studies The General Assembly in 2016 ratified HB 1030 which included provisions in Section for the preparation of supplemental documents to the BIMP update. The Departments of Commerce, Environmental Quality, and Revenue would prepare the following studies that would be included in the appendix to the BIMP update. The Division of Coastal Management and the Department of Environmental Quality shall study and provide an executive summary of readily available data and existing studies on the physical and economic, storm mitigation, and public safety benefits of out-of-state coastal storm damage reduction and beach nourishment projects. The County Tax Office of each covered county shall work together to identify all privately and publicly owned property island-wide in the county. A covered county includes the Counties of Brunswick, New Hanover, Pender, Onslow, Carteret, Hyde, Dare, and Currituck. Each County Tax Office shall determine whether the mailing/ownership address on the tax record of such property is (i) in the county where such property is located, (ii) in a non-covered county in North Carolina, or (iii) outside the State of North Carolina. Each County Tax Office shall send an electronic list of the property addresses to the Department of Environmental Quality and the Joint Legislative Oversight Committee on Agriculture and Natural and Economic Resources I-5
30 The Department of Commerce shall study and provide an executive summary of readily available economic data related to the 20 coastal counties of the State for the purpose of quantifying the contribution of the coastal economy to the economy of the State as a whole, considering, at a minimum, the benefits of travel and tourism, small businesses, job creation and opportunity, and tax revenues, including property, sales, and income taxes. I-6
31 SECTION 2 SOCIO-ECONOMIC VALUE
32 II. SOCIO-ECONOMIC VALUE OF NORTH CAROLINA BEACHES AND INLETS North Carolina beaches and inlets have tremendous economic value. Beaches and inlets support millions of beach recreationists every year, provide billions in economic value through business and tourism as well as residential and commercial property value, provide ocean access for commercial and recreational fishermen, and serve as important habitat for fish and wildlife resources. This section documents the state of knowledge regarding the economic value of North Carolina beaches and inlets as of It reviews and summarizes existing studies currently available from academic, governmental, and industry sources. The issue is an active area of research for North Carolina academics and government staff, and many additional studies are currently underway. Where available, preliminary results from ongoing studies are assessed. The existing information on the economic value of North Carolina beaches and inlets varies in several dimensions. The information varies by topic (beach recreation value, fishing value, property value, shipping and industry (deep draft ports), etc.), by date, by geographic coverage area, by methodology used to produce the information, and by degree of technical and peer review. The information also varies in terms of whether the values measured are stock variables or flow variables. A stock variable provides an estimate of an economic value at a point in time; for example, the value of property on Topsail Island, on December 31, 2016 is a stock variable. (In business, a balance sheet measures stock variables; it measures the value of a company s assets and liabilities at a point in time.) In contrast, a flow variable provides an estimate of the change in an economic value over a period of time; for example, the decrease in property value due to a hurricane strike is a flow variable. (In business, an income statement measures flow variables; it measures the amounts of money entering and leaving the firm over a period of time). Several types of economic value can be measured, including stock and flow variables. Stock variables include household wealth, the value of coastal property, the value of public infrastructure, and the level of employment. Flow variables include household income, business profits, government tax collections, and consumer surplus. Consumer surplus is the economic value (measured in dollars) that consumers receive from some good or service beyond their expenditures for the good or service. Consumer surplus is typically measured as the difference between what consumers actually pay for something and the maximum amount they would be willing to pay. For example, if you would be willing to pay $50 to enjoy a day at the beach but you only pay $10 in gasoline and parking fees, your consumer surplus would be $40 ($50-$10). Consumer surplus is most II-1
33 important for goods and services that have free or very low-cost access, such as beach recreation and some types of fishing. The economic value supported by North Carolina beaches and inlets is threatened in several ways. First, there are short-term threats. These can be very local, such as rip tide deaths or shark attacks that reduce tourism for a few days, or widespread, such as the damage caused by a particular tropical storm or hurricane. Second, there are intermediate-term threats, such as beach erosion and natural inlet shifting and shoaling, and development patterns that do not achieve the optimal mix of land uses (and thus less than potential economic value) desired by North Carolina citizens. Finally, there are longterm threats, such as sea level rise resulting from global climate change. A goal of beach and inlet management is to anticipate and mitigate all of these threats. In doing so, management seeks to minimize net costs or damages. When adequate resources are not available to address all threats simultaneously, as is typically the case, threats must be prioritized and decisions must be made regarding which threats to address, to what degree, and in what order. To facilitate the management decision process, this report also reviews and summarizes the existing estimates of the potential economic costs of identified threats and the costs of threat-mitigation activities. This section is organized as follows: First, the economic impacts of North Carolina s deep draft port operations are assessed. Second, baseline estimates of the current economic impacts and consumer surplus supported by North Carolina beaches and shallow draft inlets are presented. Last, economic impact scenarios of beach width reduction and inlet shoaling are developed to estimate the potential value lost to Federal, State and local interests if North Carolina beaches and inlets are not managed and maintained at current levels. A. Data Sources 1. National-Level Data Sources The National Oceanic and Atmospheric Administration (NOAA), Fisheries Economics & Social Sciences Program, provides information on the economics of commercial, for-hire (charter and head boat), and private boat fishing. The U.S. Department of Transportation provides information on rail routes and distances, as well as information on average freight rates. 2. State-Level Data Sources The North Carolina State Ports Authority provides information on employment, railcar volume, truck volume, and revenues for North Carolina's deep-draft ports, Wilmington and Morehead City. II-2
34 The North Carolina Department of Commerce Tourism Services Division provides information on tourism expenditure and economic impact by county for North Carolina. The North Carolina Department of Environmental Quality, Division of Marine Fisheries, provides information on employment, economic output, and economic impact of commercial and recreational fishing in North Carolina. The North Carolina Department of Revenue provides information on sales, property and occupancy tax rates and revenues for North Carolina counties. The North Carolina Department of Information Technology provides information on property parcel locations, acreage, ownership and assessed values through the NC OneMap database. The North Carolina Department of Environmental Quality, Division of Coastal Management, provide information on Ocean Hazard Areas along North Carolina beaches and inlets. Ocean Hazard Areas are coastal areas at risk of loss due to ocean erosion. The North Carolina Department of Transportation provides GIS information on the geographic boundaries of towns and cities in North Carolina. 3. Issue-Specific Studies There are many topic-specific studies addressing the economics of particular issues related to North Carolina beaches and inlets. These studies are produced by government agencies, consulting firms, research institutes, and academics publishing in professional journals. These studies will be introduced below under the relevant topical heading. B. Value of Deep Draft Ports The economic impacts of the two deep draft ports in North Carolina, the Port of Wilmington and the Port of Morehead City, are considered here. The analysis uses information from two previous economic studies of the ports, Findley et al. (2014) and Martin Associates (2006), as well as the 2015 Strategic Plan of the North Carolina State Ports Authority (NCSPA 2015), and recent statistics obtained directly from the NCSPA website and NCSPA office located in Wilmington, NC (NCSPA 2016). In particular, the Martin Associates study provides detail on port operations by economic sector, and the Findley et al. study provides detail on the geographic distribution of port customers within North Carolina. Where information for year 2015 is not readily available, results from these prior studies will be scaled to year 2015 based on changes in annual direct port revenues or direct port jobs. In-depth assessment of all aspects of current port II-3
35 operations, as carried out in the Findley et al. and Martin Associates studies, was beyond the scope of the present BIMP study. Both the Findley et al. (2014) and Martin Associates (2006) studies present measures of the state ports' economic contribution to the state of North Carolina. Economic contribution includes conventionally-defined economic impacts of port operations plus the value of the port-handled cargo produced in North Carolina, as well as the economic impacts of the North Carolina businesses that produce the cargo. In the present study, we estimate conventional economic impacts of port operations under the assumption that, in the event that North Carolina ports were unable to operate due to unnavigable inlets, the same volume of cargo would still be produced by North Carolina businesses, but it would be diverted to other regional ports (Norfolk, Charleston, and/or Savannah). However, such diversion would likely increase shipping costs. These increased shipping costs are estimated and included as part of the economic impacts presented in this study. Table II-1 presents North Carolina State Ports Authority Operating Revenues (direct output) for recent years and for year 2005, the year of the Martin Associates (2006) study. From 2005 to 2015, NCSPA Revenues at the Port of Wilmington increased from $24.7 million/yr in 2005 to an average of $29.9 million/yr for , an increase of 21.05%. Revenues at the Port of Morehead City increased from $7.7 million/yr in 2005 to an average of $11.7 million/yr for , an increase of 51.95%. Table II-1. North Carolina State Ports Authority Operating Revenues Year Wilmington Morehead City ($ millions) ($ millions) 2015 $30 $ $27.10 $ $32.60 $10.80 average $29.90 $24.70 $11.70 $7.70 Sources: Years : NCSPA (2016), Year 2005: Martin Associates (2006). There is considerable, additional economic activity at the ports beyond the operations of the NCSPA. Table II-2 and Table II-3 present direct revenue/output for various economic sectors operating at the North Carolina deep draft ports in 2005 from the Martin Associates (2006) report. In addition to NCSPA activity, these sectors represent the direct business activity at risk in the event of North Carolina port closure. (Note: Revenues presented in the Martin Associates report for the trucking and rail sectors are omitted from Table II-2 and Table II-3 because the trucking and rail sectors would likely continue operations in the event of North Carolina port closure, but they would utilize other ports, such as Norfolk, Charleston and Savannah). II-4
36 Table II-2. Port of Wilmington, Direct Revenue/Output, 2005 Direct Revenue/Output, 2005 Sector Revenue per Dollar of NCSPA Revenue SECTOR PUBLIC PRIVATE PUBLIC PRIVATE TOTAL TERMINAL TERMINAL TERMINAL TERMINAL TOTAL TERMINAL EMPLOYEES $21,201,000 $5,993,000 $27,194,000 $0.86 $0.24 $1.10 TOWING/BARGE $7,156,000 $3,616,000 $10,772,000 $0.29 $0.15 $0.44 PILOTS $7,588,000 $3,527,000 $11,115,000 $0.31 $0.14 $0.45 AGENTS $1,005,000 $609,000 $1,614,000 $0.04 $0.03 $0.07 FORWARDERS $8,926,000 $3,822,000 $12,748,000 $0.36 $0.15 $0.52 WAREHOUSING $11,175,000 $0 $11,175,000 $0.45 $0.00 $0.45 MARITIME SERVICES $22,108,000 $12,934,000 $35,041,000 $0.89 $0.52 $1.42 NCSPA $24,744,000 $0 $24,744,000 $1.00 $ BANKING/INSURANCE $5,166,000 $0 $5,166,000 $0.21 $0.00 $0.21 TOTAL $109,069,000 $30,501,000 $139,569,000 $4.41 $1.23 $5.64 Source: Martin Associates (2006) Source: Martin Associates (2006) Table II-3. Port of Morehead City, Direct Revenue/Output, 2005 Direct Revenue/Output, 2005 Sector Revenue SECTOR PUBLIC/TOTAL per Dollar of MOREHEAD CITY NCSPA Revenue TERMINAL EMPLOYEES $10,915,000 $1.42 TOWING/BARGE $2,770,000 $0.36 PILOTS $1,189,000 $0.15 AGENTS $396,000 $0.05 FORWARDERS $990,000 $0.13 WAREHOUSING $314,000 $0.04 MARITIME SERVICES $10,107,000 $1.31 NCSPA $7,705, BANKING/INSURANCE $800,000 $0.10 TOTAL $35,186,000 $4.57 The direct revenue/output numbers in Table II-2 and Table II-3 are used to calculate the right-most columns of factors in each table, "Sector Revenue per Dollar of NCSPA Revenue." These factors are used to estimate the annual revenues in other portdependent economic sectors relative to NCSPA revenues for a given year. Table II-4 and Table II-5 present actual NCSPA direct revenue/output and estimated direct revenue/output for other sectors for the "average" year by port and by sector. II-5
37 Table II-4. Port of Wilmington, Estimated Direct Revenue/Output, Average Year SECTOR PUBLIC PRIVATE TERMINAL TERMINAL TOTAL TERMINAL EMPLOYEES $25,618,732 $7,241,784 $32,860,516 TOWING/BARGE $8,647,123 $4,369,479 $13,016,602 PILOTS $9,169,140 $4,261,934 $13,431,074 AGENTS $1,214,416 $735,900 $1,950,315 FORWARDERS $10,785,944 $4,618,404 $15,404,349 WAREHOUSING $13,503,577 $0 $13,503,577 MARITIME SERVICES $26,714,727 $15,629,106 $42,342,624 NCSPA $29,900,000 $0 $29,900,000 BANKING/INSURANCE $6,242,459 $0 $6,242,459 TOTAL $131,796,116 $36,856,608 $168,651,516 Source: NCSPA 2016, and calculations by authors of this study. Table II-5. Port of Morehead City, Estimated Direct Revenue/Output, Average Year SECTOR PUBLIC/TOTAL MOREHEAD CITY TERMINAL EMPLOYEES $16,574,367 TOWING/BARGE $4,206,230 PILOTS $1,805,490 AGENTS $601,324 FORWARDERS $1,503,310 WAREHOUSING $476,807 MARITIME SERVICES $15,347,424 NCSPA $11,700,000 BANKING/INSURANCE $1,214,796 TOTAL $53,429,747 Source: NCSPA 2016, and calculations by authors of this study Table II-6 and Table II-7 present direct employment for various economic sectors operating at the North Carolina deep draft ports in 2005 from the Martin Associates (2006) report. In addition to NCSPA jobs, these sectors represent direct jobs at risk in the event of North Carolina port closure. (Note: Jobs presented in the Martin Associates report for the trucking, rail and shipper/consignee sectors are omitted from Table II-6 and Table II-7 because these sectors would likely continue operations in the event of North Carolina port closure; they would simply utilize other ports, such as Norfolk, Charleston and Savannah). II-6
38 Table II-6. Port of Wilmington, Direct Employment, 2005 Sector Jobs Sector Jobs Sector Jobs SECTOR PUBLIC PRIVATE TOTAL per NCSPA job per NCSPA job per NCSPA job TERMINAL TERMINAL PUBLIC PRIVATE TOTAL TERMINAL EMPLOYEES ILA/DOCKWORKERS TOWING/BARGE PILOTS AGENTS FORWARDERS WAREHOUSING GOVERNMENT&ASSOCIATIONS MARITIME SERVICES NCSPA BANKING/INSURANCE TOTAL ,309 Source: Martin Associates (2006) Table II-7. Port of Morehead City, Direct Employment, 2005 SECTOR TOTAL Sector Jobs MOREHEAD CITY per NCSPA job TERMINAL EMPLOYEES ILA/DOCKWORKERS TOWING/BARGE PILOTS AGENTS FORWARDERS WAREHOUSING GOVERNMENT&ASSOCIATIONS MARITIME SERVICES NCSPA 76 1 BANKING/INSURANCE TOTAL 288 Source: Martin Associates (2006) The direct employment numbers in Table II-6 and Table II-7 are used to calculate the rightmost columns of factors in each table, "Sector Jobs per NCSPA job." These factors are used to estimate the employment in other port-dependent economic sectors relative to NCSPA employment. NCSPA employment for year 2015 is 170 jobs for the Port of Wilmington and 43 jobs for the Port of Morehead City. Table II-8 and Table II-9 present actual NCSPA employment and estimated direct employment for other sectors for year 2015 by port and by sector. Total direct employment at the Port of Wilmington (including both public and private terminal jobs) is an estimated 968 jobs. Total direct employment at the Port of Morehead City is 163 jobs. II-7
39 Table II-8. Port of Wilmington, Estimated Direct Employment, 2015 SECTOR PUBLIC PRIVATE TERMINAL TERMINAL TOTAL TERMINAL EMPLOYEES ILA/DOCKWORKERS TOWING/BARGE PILOTS AGENTS FORWARDERS WAREHOUSING GOVERNMENT & ASSOCIATIONS MARITIME SERVICES NCSPA BANKING/INSURANCE TOTAL Source: NCSPA 2016, and calculations by authors of this study. Table II-9. Port of Morehead City, Estimated Direct Employment, 2015 SECTOR TOTAL MOREHEAD CITY TERMINAL EMPLOYEES 22 ILA/DOCKWORKERS 20 TOWING/BARGE 11 PILOTS 2 AGENTS 2 FORWARDERS 22 WAREHOUSING 2 GOVERNMENT & ASSOCIATIONS 20 MARITIME SERVICES 15 NCSPA 43 BANKING/INSURANCE 5 TOTAL 163 Source: NCSPA 2016, and calculations by authors of this study. The conventional economic impacts in the county hosting the port and adjacent counties where employees reside are presented in Table II-10. However, port closure would result in an additional component of economic impact: the additional transportation costs that North Carolina firms would incur if forced to relocate cargo shipments to alternative ports due to unnavigable North Carolina inlets. This additional component of economic impact is assessed below. II-8
40 Port Sector Table II-10. Deep Draft Port Economic Impact Values Direct Impact Output/ Revenues (2015) Total Impact Output/Sales/ Business Activity (2015) Direct Impact Employment (2015) Total Impact Employment (2015) Total Local Tax Revenue (2015) Total State Tax Revenue (2015) Total Federal Tax Revenue (2015) Morehead NCSPA Operations $11,700,000 $19,594, $170,442 $241,971 $839,089 Morehead Other Operations at Port $41,729,747 $69,886, $607,907 $863,025 $2,992,732 Wilmington NCSPA Operations $29,900,000 $58,037, $622,845 $863,664 $3,299,674 Wilmington Other Operations at Port $138,751,516 $269,325, ,019 $2,890,323 $4,007,847 $15,312,201 Total $222,081,263 $416,844,855 1,131 2,973 $4,291,516 $5,976,508 $22,443,697 In the event that the deep draft inlets became unnavigable, in addition to the loss of the traditional economic impacts of port activities, there would be additional losses in the form of increased transportation costs for North Carolina producers who would need to transport their goods a greater distance to ports in Virginia or South Carolina. The two primary modes of transport from producers to North Carolina deep draft ports are truck and rail. The port of Wilmington handled 199,762 truck trips and 5,737 railcar trips in FY2015, and the port of Morehead City handled 17,064 truck trips and 753 railcar trips in FY 2015 (NCSPA 2016). Table II-11 presents approximate truck road mileage, shipping cost per truck, and percentage transportation cost increase from primary origin zones (Charlotte, Greensboro and Raleigh) to likely alternative destination ports (Norfolk, Charleston and Savannah). Table II-12 presents approximate rail mileage, shipping cost per railcar, and percentage transportation cost increase from primary origin zones (Charlotte, Raleigh, Pembroke and Aurora) to likely alternative destination ports (Norfolk, Charleston and Savannah). II-9
41 Table II-11. Alternative Trucking Distances and Transport Costs Alternative Alternative Shipping Truck Route Truck Route Origin Destination Port Approximate Cost Percentage Percentage Truck Miles per Truck Cost Increase Cost Increase over Morehead over Wilmington Charlotte Wilmington 199 $ baseline Charlotte Morehead 284 $ baseline Charlotte Charleston 209 $ % 5.03% Charlotte Savannah 252 $ % Charlotte Norfolk 325 $ % Raleigh Morehead 150 $ baseline Raleigh Wilmington 134 $ baseline Raleigh Norfolk 185 $ % 38.06% Raleigh Charleston 280 $ % % Greensboro Morehead 226 $ baseline Greensboro Wilmington 183 $ baseline Greensboro Norfolk 235 $ % 28.42% Greensboro Charleston 283 $ % 54.64% Riegelwood Wilmington 20 $ baseline Riegelwood Charleston 177 $ % 885% Riegelwood Morehead 107 $ baseline Aurora Morehead 61 $ baseline Aurora Norfolk 153 $ % Distances Source: Google Maps. Note: 2014 Operational Cost of Trucking, Average Marginal Cost per Mile, Southeast Region, $1.678 Source: An Analysis of the Operational Costs of Trucking: 2015 Update. American Transportation Research Institute. Arlington, VA. Sept II-10
42 Table II-12. Alternative Rail Distances and Transport Costs Alternative Alternative Origin / Rail Destination Approximate Shipping Rail Route Rail Route Junction Port Rail Miles Cost Percentage Percentage per Railcar Cost Increase Cost Increase over Morehead over Wilmington Charlotte Wilmington 182 $ baseline Charlotte Charleston 220 $ % Charlotte Savannah 240 $ % Raleigh Morehead 142 $ baseline Raleigh Norfolk 174 $ % Pembroke Wilmington 80 $ baseline Pembroke Charleston 155 $ % Aurora Morehead 94 $ baseline Aurora Norfolk 220 $ % Distances Source: USDOT, Federal Railroad Administration, Rail Network GIS mapping tool. Accessed: Sept. 3, and Google Maps. Note: Class 1 Rail, 2013 Average rail freight revenues per ton-mile = $ Source: The first two columns of Table II-13 present data from year 2014 on the percentage of state-port related economic contribution occurring in each the major geographic regions of North Carolina from Findley et al. (2014). These percentages were used with data from NCSPA on the number of truck and railcar trips attributable to each cargo type for FY to approximate then number of truck and railcar trips originating from each region. The key highway or rail hub with respect to transport routes to the state ports is presented together with estimates of the increased costs associated with using the nextbest alternative port for each origin region. These increased costs measure the additional transportation costs of diverting cargo from North Carolina ports to the next-best ports in Virginia or South Carolina. However, these costs do not include any additional costs of relocating commodity specific infrastructure from North Carolina ports to alternative ports. For example, if a North Carolina port has a special piece of equipment used to load commodity X, and the alternative port does not have that piece of equipment, then the costs of relocating cargo flow for that commodity to the alternative port would be higher (the special piece of equipment would need to be moved, or a new piece of equipment would need to be purchased and installed in the alternative port). Therefore, the costs in Table II-13 should viewed as conservative estimates, because they do not include costs of relocating/repurchasing commodity-specific cargo handling equipment. In summary, a II-11
43 conservative estimate of the additional transportation costs that North Carolina firms would incur if forced to relocate cargo shipments to alternative ports is $34 million annually. Table II-13. Increased Costs of Transporting North Carolina Cargo to Alternative Ports Approx. Original Alternate Approximate Approximate Increased Costs/Yr Increased Costs/Yr Origin Percent of Trip Origin Destination Destination Truck Trips on Railcar Trips on of Truck Trips to of Railcar Trips to Region Cargo Value Point Port Port Original Route FY 2015 Original Route FY 2015 Alternate Destination Alternate Destination Southeast Riegelwood Wilmington Charleston 97,772 2,808 $25,757,914 $609,066 /Pembroke Morehead Charleston 4, $542, East 0.33 Raleigh Morehead Norfolk 7,695 7 $456,361 $628 Northeast Aurora Morehead Norfolk 1, $282,075 $12,635 Research Triangle Raleigh Wilmington Norfolk 25, $2,205, Morehead Norfolk 1, $71,686 $31,776 Charlotte Charlotte Wilmington Charleston 38,841 2,737 $658,351 $300,770 Morehead Norfolk $18,653 $15,734 Piedmont Triad Greensboro Wilmington Norfolk 30, $2,726, Morehead Norfolk 1, $22,351 $18,480 West Charlotte Wilmington Charleston 6, $113,509 $21,136 Total ,826 6,491 $32,855,006 $1,010,224 Sources: NCSPA (2016), Findley et al. (2014), An Analysis of the Operational Costs of Trucking: 2015 Update. American Transportation Research Institute. Arlington, VA. Sept. 2015, USDOT, Federal Railroad Administration, Rail Network GIS mapping tool. Accessed: Sept. 3, Google Maps. In summary, the direct economic impact of the deep draft ports is $222.1 million while providing 1,131 direct employment jobs annually. Including multiplier effects, these values increase to $416.8 million (economic impact) and 2,973 jobs annually. In addition to these losses, North Carolina companies would have to spend an additional minimum of $34 million to utilize other ports. C. Value of Beaches 1. Value of Coastal Property At Risk a) Methodology The eight coastal North Carolina counties considered in this study are listed in Table II-14. For comparison purposes, Table II-14 and Table II-15 provide basic geographic and economic characteristics for each county and for the state of North Carolina as a whole. II-12
44 Table II-14. North Carolina Coastal Counties Geographic Characteristics Land Area Land Area GIS-measured GIS Property Shoreline Oceanfront County (sq.miles) (acres) Parcel Area (acres) Parcels Length (feet) (NC LINC) (NC LINC) (Present Study) (Present Study) (NCOneMap) Brunswick , , , ,916 Carteret , ,326 59, ,449 Currituck , ,195 25,291 58,047 Dare , ,438 39, ,305 Hyde , ,318 7, ,155 New Hanover , , , ,375 Onslow , ,770 84, ,605 Pender , ,683 47,639 90,627 Total for 8 Coastal Counties 4,435 2,838,560 2,862, ,897 1,902,480 Average for 8 Coastal Counties , ,819 63, ,810 Total for All 100 NC Counties 48,618 31,115, ,902,480 Average Across All 100 NC Counties , Table II-15. North Carolina Coastal Counties Population and Socio-Economic Characteristics County Population Pop. Density (persons/ sq.mile) Pct. Net Migration Median Net Family Migration Income Mean Family Income Pct. All Persons in Poverty Pct. Kids < 18 in Poverty Pct. Adults >65yrs in Poverty Employment Pct. Of Employed Pct. Pop in Accom/Food Employed Industry Brunswick 117, ,987 $45,806 $68, , Carteret 69, ,546 $46,155 $70, , Currituck 25, ,396 $55,376 $75, , Dare 35, ,172 $53,889 $79, , Hyde 5, $38,265 $49, New Hanover 216, ,245 $48,553 $85, , Onslow 193, ,132 $43,561 $58, , Pender 56, ,890 $44,338 $65, , Total for 8 Coastal Counties 720, , , Average for 8 Coastal Counties 90, ,292 $46,993 $69, Total for All 100 NC Counties 9,953, , ,421, Average for All 100 NC Counties: 99, ,632 $40,848 $62, In principle, the value of coastal North Carolina property at risk of loss due to ocean erosion is greatly influenced by property parcel values and erosion rates. The property values for individual property parcels for this study were obtained from the NC OneMap Geospatial data portal (NC OneMap 2016). Parcel property values are a component of the parcel data available for download from the NC OneMap Geographic Information System (GIS). The values reflect the most recent property value assessment/revaluation conducted by each county prior to the most recent update of the NC OneMap data by each county. The most recent parcel data transfer dates and associated property assessment/revaluation dates for each county at the time of the present study (July 2016) are provided in Table II-16. II-13
45 Table II-16. Parcel Property Data Transfer Dates and Property Value Assessment Dates Date of Data Date of Most Recent County Transfer Property Value Assessment from County to Conducted by County (as of NC OneMap July 2016) Brunswick June 8, Carteret April 1, Currituck April 8, Dare March 23, Hyde June 7, New Hanover March 25, Onslow April 28, Pender April 27, The state of North Carolina uses "Setback Factors" based on measured beach erosion rates to characterize the risk of loss to coastal property due to ocean and inlet beach erosion. Setback factors are used to site oceanfront development and to determine the geographic extent of ocean hazard Areas of Environmental Concern (AEC), where there is a substantial possibility of excessive shoreline erosion (NCDENR. 2012). The North Carolina Coastal Resources Commission (CRC) has designated the AEC for oceanfront property as the Ocean Erodible Area AEC (OEA-AEC). The OEA-AEC covers North Carolina's beaches and any other oceanfront lands that are subject to long-term erosion and significant shoreline changes (NCDEQ 2016). The seaward boundary of this AEC is the mean low water line. The landward limit of the AEC is measured landward from the first line of stable natural vegetation and is located 90 times the long-term, average annual erosion rate (setback factor) in the landward direction from the first line of stable natural vegetation. The erosion rate (setback factor), and thus the OEA-AEC, varies from location to location along the shore. The regulatory minimum setback factor is 2 feet if the erosion rate is less than 2 feet per year or if it is accreting. The CRC updates longterm erosion rates (setback factors) about every five to 10 years, using aerial photographs to examine shoreline changes. The present study uses the OEA-AEC area to identify "property at risk." For the purposes of this study, any property parcel intersecting the OEA-AEC is considered "at risk." Two sets of erosion rates / Setback Factors are considered in the present study, the "1998 Setback Factors" and the "2012 Setback Factors." The 1998 and 2012 Setback Factors were obtained from the North Carolina Department of Environmental Quality, Division of Coastal Management (NCDEQ-DCM. 2016). The Setback Factors are used to create two Setback Lines, a 1998 Setback Line and a 2012 Setback Line, using ArcMap GIS software (ArcMap 2015). For each of the two Setback Lines, an OEA-AEC region (defined II-14
46 as the geographic area between the Setback Line and the vegetation line) was calculated using the Buffer tool in ArcMap. Please note that in both cases, 90 times the setback factor for the given year was used to offset from the stable vegetation line for the given year. The reasoning behind the selection of these two dates was based on historical beach maintenance patterns. In 1998, nourishment activities across the State were not widespread and were mainly limited to USACE projects. The hurricanes of the late 1990 s and other storms have caused nourishment activities to substantially increase. Therefore, it was posited that computing the difference in property at risk from 1998 to 2012 may be a valid representation of the effects of beach nourishment. It is recognized that other factors may also affect the outcomes, but it was believed that it would be a meaningful exercise. However, it should be noted that beach nourishment will only provide this risk reduction benefit if the beach is maintained and that berms and dunes of adequate size and elevation are provided. The property parcels at risk for each county were determined by overlaying the GIS property parcel polygons for the county with the OEA-AEC region. This was done twice, once for the 2012 region, and once for the 1998 region. Property parcels lying within the OEA-AEC area were identified using the Select By Location tool in ArcMap, with the property parcels layer as the target layer, the OEA-AEC region as the source layer, and "Intersection" as the selection method. This means that all property parcels with any part of the parcel intersecting the OEA-AEC region would be identified as "at risk." This process resulted in two sets of "at risk" property parcels for each county, one for the 2012 setback region and one for the 1998 setback region. For each county and each setback region, property parcels at risk were categorized by town, land use, and owner residency status. The property parcel datasets hosted by NC OneMap are intended to provide information on the parcel owner, owner's address, land use, city and county for each parcel. However, not all counties provided all categories of information for all parcels. Where possible, missing information was inferred from other data categories in the parcel dataset or from other, auxiliary datasets. In cases where the town/city name of a parcel location was not present in the NC OneMap datasets, a GIS data layer of North Carolina municipality boundary polygons from the North Carolina Department of Transportation (NCDOT 2016) was used to identify the parcels located within each incorporated town/city. Unfortunately, the municipality boundary layer does not include the boundaries of unincorporated towns, so it was not possible to identify which parcels were located in which unincorporated town if the county did not provide this information. In such cases, the town/city is labeled "Unknown," which includes parcels with known locations in unincorporated areas and parcels with unknown locations (within the county). Land use classification systems differ across counties, so land use categories differ by county. Where possible, land use categories were renamed and in some cases combined II-15
47 to achieve greater consistency in land use categories across counties. Where possible, missing information was inferred from other data categories in the dataset. For example, if the parcel owner's name was "X Baptist Church," then the land use category was assumed to be "Church/Religious." As another example, if the parcel owner's name was "N.C. Coastal Land Trust," then the land use category was assumed to be "Conservation/Nonprofit." In some cases it was not possible to determine the land use category; in these cases, the land use category is labeled "XXX." Owner residency was divided into three categories: Non-NC residents, NC residents who live outside the eight coastal counties, and NC residents who live inside the eight coastal counties. Owners were categorized as "Non-NC residents" if the state of the owner's mailing address was other than "NC." NC residents were categorized as "coastal" NC residents if the zip code of the owner's mailing address was in the list of coastal county zip codes presented in Table II-17. In some cases, it was not possible to determine the owner's residency category; in these cases, the residency category is labeled "Unknown." Table II-17. Coastal N.C County Zip Codes ZIP Code County Name City/Area Name ZIP Code County Name City/Area Name ZIP Code County Name City/Area Name Brunswick Ash Currituck Grandy NewHanover Wilmington Brunswick Bolivia Currituck Harbinger NewHanover Wilmington Brunswick Delco Currituck Jarvisburg NewHanover Wilmington Brunswick Belville Currituck KnottsIsland NewHanover FigureEightIsland Brunswick Longwood Currituck Maple NewHanover Wilmington Brunswick Riegelwood Currituck Moyock NewHanover CarolinaBeach Brunswick Shallotte Currituck PointHarbor NewHanover CastleHayne Brunswick BaldHead Currituck PoplarBranch NewHanover KureBeach Brunswick HoldenBeach Currituck PowellsPoint NewHanover WrightsvilleBeach Brunswick CaswellBeach Currituck Shawboro Onslow HollyRidge Brunswick Calabash Dare Avon Onslow NorthTopsailBeach Brunswick Shallotte Dare Buxton Onslow Beulaville Brunswick OceanIsleBeach Dare Frisco Onslow Chinquapin Brunswick SouthBrunswick Dare Hatteras Onslow Hubert Brunswick Winnabow Dare KillDevilHills Onslow Jacksonville Carteret Atlantic Dare Collington Onslow Jacksonville Carteret AtlanticBeach Dare EastLake Onslow CampLejeune Carteret Beaufort Dare CapeHatterasNatlSeashore Onslow Jacksonville Carteret CedarIsland Dare NagsHead Onslow Jacksonville Carteret Davis Dare Rodanthe Onslow Jacksonville Carteret Gloucester Dare Salvo Onslow Jacksonville Carteret HarkersIs Dare StumpyPoint Onslow CampLejeune Carteret Marshallberg Dare Wanchese Onslow Maysville Carteret MoreheadCity Dare Waves Onslow PinkHill Carteret Bogue Hyde BelhavenArea Onslow Richlands Carteret SalterPath Hyde Engelhard Onslow CapeCarteret Carteret Sealevel Hyde Fairfield Pender Atkinson Carteret Smyrna Hyde Scranton Pender Burgaw Carteret Sealevel Hyde Swanquarter Pender Currie Carteret Stella Hyde Ocracoke Pender Hampstead Carteret Williston NewHanover Wilmington Pender Ivanhoe Carteret EmeraldIsle NewHanover Wilmington Pender MapleHill Currituck Aydlett NewHanover Wilmington Pender RockyPoint Currituck Barco NewHanover Wilmington Pender Wallace Currituck Coinjock NewHanover Wilmington Pender Watha Currituck Corolla NewHanover Wilmington Pender Watha Currituck Currituck NewHanover Wilmington For each county, set of Setback Factors (1998 and 2012), town, land use, and owner residency status, the number of parcels and dollar value of parcels (value of land plus value of structures) was calculated using SAS/STAT version 9.2 statistical software. For II-16
48 some counties, separate land values and structure values were not provided in the parcel dataset or did not sum to parcel value. In these cases, only parcel value is reported. Dollar values are presented in current dollar terms (not adjusted for inflation) for the year of the most recent property value assessment for the county. The year of the most recent property value assessment for each county is presented in Table II-16. b) Current Estimate of Coastal Property Value The following sections present, for each county: number of parcels and total parcel value for the entire county number of parcels at risk and total parcel value based on the 1998 setback factors number of parcels at risk and total parcel value based on the 2012 setback factors difference in the number of parcels at risk and total parcel value between the 1998 and 2012 setback factors (1) Brunswick County (Region 1) Table II-18 presents the number of parcels and total parcel value by ownership for all of Brunswick County. The total parcel value for all of Brunswick County is $21.65 billion and coastal residents retain the majority of the property value in the entire county. However, it should be noted that approximately 23% of property value is owned by NC residents outside the coastal counties and approximately 20% are out of state. Table II-18. Brunswick County Property Statistics Owner Type All Parcels Total Value ($) % of Total Value ($) Coastal Resident 77,436 $12,432,183, % NC Resident 30,420 $4,955,530, % US Resident 28,801 $4,242,019, % Unknown 1,265 $21,925, % Total 137,922 $21,651,658, % Table II-19 and Table II-20 present just the coastal properties at risk based on the 1998 and 2012 setback factors, respectively. Of the $21.6 billion in property value for the entire county, $1.94 billion of property was at risk in 1998 while $1.67 billion dollars of property was at risk in North Carolina residents retain the largest percentage of coastal property value at risk in Brunswick County. II-17
49 Table II-19. Brunswick County Properties at Risk Owner Type Parcels Effected Total Value ($) % of Total Value ($) Coastal Resident 998 $400,600, % NC Resident 1,769 $853,530, % US Resident 1,226 $681,864, % Unknown 129 $2,421, % Total 4,122 $1,938,417, % Table II-20. Brunswick County Properties at Risk Owner Type Parcels Effected Total Value ($) % of Total Value ($) Coastal Resident 874 $354,232, % NC Resident 1,378 $718,402, % US Resident 1,005 $592,298, % Unknown 109 $2,016, % Total 3,366 $1,666,949, % Brunswick County exhibited a reduction in the property value at risk of $271.5 million between 1998 and 2012 as presented in Table II-21. Recent beach nourishment in Brunswick County has, in many cases, caused the stable vegetation line to move seaward between 1998 and 2012, reducing the number of properties within the AEC. However, it must be again noted that this risk reduction is dependent on adequate berm and dune maintenance. It is also interesting to note that NC residents outside the coastal counties and US residents are the groups that are seeing the most reduction in risk. Table II-21. Brunswick County Difference in Properties at Risk (1998 v. 2012) Owner Type Parcels Effected Total Value ($) % of Total Value ($) Coastal Resident 124 $46,368, % NC Resident 391 $135,128, % US Resident 221 $89,566, % Unknown 20 $405, % Total 756 $271,467, % (2) New Hanover County (Region 2a) Table II-22 presents the number of parcels and total parcel value by ownership for all of New Hanover County. The total parcel value for all of New Hanover County is $29.78 billion and coastal residents retain the majority of the property value (73.1%) in the entire county with 15.5% of the property value being owned by NC residents outside the coastal counties and 11.3% of the property value being owned by out of state owners. II-18
50 Table II-22. New Hanover County 2015 Property Statistics Owner Type All Parcels Total Value ($) % of Total Value ($) Coastal Resident 84,388 $21,784,588, % NC Resident 10,511 $4,618,612, % US Resident 8,587 $3,361,122, % Unknown 50 $16,689, % Total 103,536 $29,781,013, % Table II-23 and Table II-24 present just the coastal properties at risk based on the 1998 and 2012 setback factors, respectively. Of the $29.78 billion in property value for the entire county, $1.93 billion of property was at risk in 1998 while $1.67 billion dollars of property was at risk in North Carolina residents retain the largest percentage of coastal property value at risk in New Hanover County. Table II-23. New Hanover County 1998 Properties at Risk Owner Type Parcels Effected Total Value ($) % of Total Value ($) Coastal Resident 1,282 $584,575, % NC Resident 1,503 $857,944, % US Resident 891 $481,417, % Unknown 4 $1,387, % Total 3,680 $1,925,324, % Table II-24. New Hanover County 2012 Properties at Risk Owner Type Parcels Effected Total Value ($) % of Total Value ($) Coastal Resident 1,028 $491,196, % NC Resident 1,266 $743,116, % US Resident 785 $433,660, % Unknown 4 $859, % Total 3,083 $1,668,832, % New Hanover County exhibited a reduction in the property value at risk of $256.5 million between 1998 and 2012 as presented in II-19
51 Table II-25. Increased levels of recent beach nourishment in New Hanover County has, in many cases, pushed the stable vegetation line seaward between 1998 and 2012, reducing the number of properties at risk. In this case, both NC residents within and outside the coastal counties are the primary groups seeing the reduction in risk. II-20
52 Table II-25. New Hanover County - Difference in Properties at Risk (1998 v. 2012) Owner Type Parcels Effected Total Value ($) % of Total Value ($) Coastal Resident 254 $93,378, % NC Resident 237 $114,828, % US Resident 106 $47,757, % Unknown 0 $528, % Total 597 $256,492, % (3) Onslow County (Region 2b) Table II-26 presents the number of parcels and total parcel value by ownership for all of Onslow County. The total parcel value for all of Onslow County is $12.86 billion and coastal residents retain the majority of the property value (72.4%) in the entire county with 11.1% of the property value being owned by NC residents outside the coastal counties and 16.5% of the property value being owned by out of state owners. Table II-26. Onslow County Property Statistics Owner Type All Parcels Total Value ($) % of Total Value ($) Coastal Resident 64,555 $9,310,442, % NC Resident 6,988 $1,422,958, % US Resident 12,816 $2,123,948, % Unknown 63 $5,905, % Total 84,422 $12,863,256, % Table II-27 and Table II-28 present just the coastal properties at risk based on the 1998 and 2012 setback factors, respectively. Of the $12.86 billion in property value for the entire county, $ million of property was at risk in 1998 while $ million dollars of property was at risk in US residents retain the largest percentage of coastal property value at risk in Onslow County. Table II-27. Onslow County 1998 Properties at Risk Owner Type Parcels Effected Total Value ($) % of Total Value ($) Coastal Resident 570 $104,715, % NC Resident 882 $200,713, % US Resident 965 $233,550, % Unknown 27 $2,971, % Total 2,444 $541,950, % II-21
53 Table II-28. Onslow County 2012 Properties at Risk Owner Type Parcels Effected Total Value ($) % of Total Value ($) Coastal Resident 527 $95,145, % NC Resident 765 $178,397, % US Resident 901 $220,441, % Unknown 25 $2,971, % Total 2,218 $496,956, % Onslow County exhibited a reduction in the property value at risk of $44.99 million between 1998 and 2012 as presented in Table II-29. Recent beach nourishment in Onslow County has, in many cases, pushed the stable vegetation line seaward between 1998 and 2012, reducing the number of properties at risk. In this case, NC residents outside the coastal counties are seeing the largest reduction in risk. Table II-29. Onslow County - Difference in Properties at Risk (1998 v. 2012) Owner Type Parcels Effected Total Value ($) % of Total Value ($) Coastal Resident 43 $9,569, % NC Resident 117 $22,315, % US Resident 64 $13,108, % Unknown 2 $ % Total 226 $44,994, % (4) Pender County (Region 2b) Table II-30 presents the number of parcels and total parcel value by ownership for all of Pender County. The total parcel value for all of Pender County is $6.65 billion and coastal residents retain the majority of the property value (71.3%) in the entire county with 17.9% of the property value being owned by NC residents outside the coastal counties and 10.5% of the property value being owned by out of state owners. Table II-30. Pender County 2015 Property Statistics Owner Type All Parcels Total Value ($) % of Total Value ($) Coastal Resident 36,394 $4,744,837, % NC Resident 5,883 $1,191,454, % US Resident 5,213 $699,991, % Unknown 149 $14,751, % Total 47,639 $6,651,035, % II-22
54 Table II-31 and Table II-32 present just the coastal properties at risk based on the 1998 and 2012 setback factors, respectively. Of the $6.65 billion in property value for the entire county, $ million of property was at risk in 1998 while $ million dollars of property was at risk in North Carolina residents retain the largest percentage of coastal property value at risk in Pender County. Table II-31. Pender County 1998 Properties at Risk Owner Type Parcels Effected Total Value ($) % of Total Value ($) Coastal Resident 455 $177,728, % NC Resident 775 $277,262, % US Resident 427 $147,057, % Unknown 2 $588, % Total 1,659 $602,637, % Table II-32. Pender County 2012 Properties at Risk Owner Type Parcels Effected Total Value ($) % of Total Value ($) Coastal Resident 398 $160,276, % NC Resident 681 $247,941, % US Resident 396 $137,798, % Unknown 2 $588, % Total 1,477 $546,604, % Pender County exhibited a reduction in the property value at risk of $56.03 million between 1998 and 2012 as presented in Table II-33. Recent beach nourishment in Pender County has, in many cases, pushed the stable vegetation line seaward between 1998 and 2012, reducing the number of properties at risk. In this case, both NC residents within and outside the coastal counties are the primary groups seeing the reduction in risk. Table II-33. Pender County - Difference in Properties at Risk (1998 v. 2012) Owner Type Parcels Effected Total Value ($) % of Total Value ($) Coastal Resident 57 $17,452, % NC Resident 94 $29,320, % US Resident 31 $9,258, % Unknown 0 $0 0.0% Total 182 $56,032, % II-23
55 (5) Carteret County (Region 2c, 3a) Table II-34 presents the number of parcels and total parcel value by ownership for all of Carteret County. The total parcel value for all of Carteret County is $16.79 billion and coastal residents retain the largest property value (46.7%) in the entire county however, there are also a significant number of NC residents (30.1%) and US residents (23.0%) who own property in Carteret County. Table II-34. Carteret County 2015 Property Statistics Owner Type All Parcels Total Value ($) % of Total Value ($) Coastal Resident 35,637 $7,840,367, % NC Resident 17,316 $5,044,138, % US Resident 6,548 $3,866,807, % Unknown 342 $33,895, % Total 59,843 $16,785,208, % Table II-35 and Table II-36 present just the coastal properties at risk based on the 1998 and 2012 setback factors, respectively. Of the $16.79 billion in property value for the entire county, $1.80 billion of property was at risk in 1998 while $1.61 billion dollars of property was at risk in North Carolina residents retain the largest percentage of coastal property value at risk in Carteret County. Table II-35. Carteret County 1998 Properties at Risk Owner Type Parcels Effected Total Value ($) % of Total Value ($) Coastal Resident 539 $301,566, % NC Resident 1,807 $1,042,111, % US Resident 761 $451,229, % Unknown 12 $6,862, % Total 3,119 $1,801,769, % Table II-36. Carteret County 2012 Properties at Risk Owner Type Parcels Effected Total Value ($) % of Total Value ($) Coastal Resident 463 $274,987, % NC Resident 1,434 $917,150, % US Resident 652 $412,957, % Unknown 12 $6,862, % Total 2,561 $1,611,958, % II-24
56 Carteret County exhibited a reduction in the property value at risk of $ million between 1998 and 2012 as presented in Table II-37. Recent beach nourishment in Carteret County has, in many cases, pushed the stable vegetation line seaward between 1998 and 2012, reducing the number of properties at risk. In this case, NC residents outside the coastal counties are the primary group seeing the reduction in risk. Table II-37. Carteret County - Difference in Properties at Risk (1998 v. 2012) Owner Type Parcels Effected Total Value ($) % of Total Value ($) Coastal Resident 76 $26,579, % NC Resident 373 $124,960, % US Resident 109 $38,272, % Unknown 0 $0 0.0% Total 558 $189,811, % (6) Hyde County (Region 3b) Table II-38 presents the number of parcels and total parcel value by ownership for all of Hyde County. The total parcel value for all of Hyde County is $1.69 billion and US residents retain the largest percentage of property value (49.7%) however, there are also a significant number of coastal residents who also own property in Hyde County (32.7%). Table II-38. Hyde County 2015 Property Statistics Owner Type All Parcels Total Value ($) % of Total Value ($) Coastal Resident 4,369 $551,679, % NC Resident 1,565 $281,290, % US Resident 1,213 $837,578, % Unknown 327 $14,709, % Total 7,474 $1,685,257, % Due to the location of property within Hyde County, there are no coastal properties at risk based on the methodology used. The Town of Ocracoke is situated on the sound side of the barrier island, sparing it from risk of coastal erosion. (7) Dare County (Region 3b, 4a, 4b) Table II-39 presents the number of parcels and total parcel value by ownership for all of Dare County. The total parcel value for all of Dare County is $14.01 billion and US residents retain the largest percentage of property value (53.8%) however, there are also a significant number of coastal residents who own property in Dare County (37.1%). II-25
57 Table II-39. Dare County 2015 Property Statistics Owner Type All Parcels Total Value ($) % of Total Value ($) Coastal Resident 18,356 $5,202,205, % NC Resident 3,414 $1,213,907, % US Resident 17,427 $7,538,669, % Unknown 571 $50,571, % Total 39,768 $14,005,353, % Table II-40 and Table II-41 present just the coastal properties at risk based on the 1998 and 2012 setback factors, respectively. Of the $14.01 billion in property value for the entire county, $3.76 billion of property was at risk in 1998 while $3.96 billion dollars of property was at risk in US residents retain the largest percentage of coastal property value at risk in Dare County. Table II-40. Dare County 1998 Properties at Risk Owner Type Parcels Effected Total Value ($) % of Total Value ($) Coastal Resident 848 $548,743, % NC Resident 444 $268,970, % US Resident 2,380 $2,937,592, % Unknown 157 $3,898, % Total 3,829 $3,759,205, % Table II-41. Dare County 2012 Properties at Risk Owner Type Parcels Effected Total Value ($) % of Total Value ($) Coastal Resident 906 $574,187, % NC Resident 479 $285,931, % US Resident 2,704 $3,092,863, % Unknown 156 $4,451, % Total 4,245 $3,957,434, % Dare County exhibited an increase in the property value at risk of $ million between 1998 and 2012 as presented in Table II-42. Absence of beach nourishment in Dare County has, in many cases, pushed the stable vegetation line landward between 1998 and 2012, increasing the number of properties at risk. In this case, US residents are the primary group seeing the increase in risk. Please note that the Nags Head project which was completed in 2011 had no effect on the 2012 setback factors. II-26
58 Table II-42. Dare County - Difference in Properties at Risk (1998 v. 2012) Owner Type Parcels Effected Total Value ($) % of Total Value ($) Coastal Resident -58 -$25,443, % NC Resident -35 -$16,961, % US Resident $155,271, % Unknown 1 -$553, % Total $198,229, % (8) Currituck County (Region 4c) Table II-43 presents the number of parcels and total parcel value by ownership for all of Currituck County. The total parcel value for all of Currituck County is $6.82 billion and US residents retain the largest percentage of property value (54.6%) however, there are also a significant number of coastal residents who own property in Currituck County (38.8%). Table II-43. Currituck County 2015 Property Statistics Owner Type All Parcels Total Value ($) % of Total Value ($) Coastal Resident 13,473 $2,647,656, % NC Resident 1,249 $445,209, % US Resident 10,384 $3,722,798, % Unknown 185 $1,652, % Total 25,291 $6,817,316, % Table II-44 and Table II-45 present just the coastal properties at risk based on the 1998 and 2012 setback factors, respectively. Of the $6.82 billion in property value for the entire county, $1.16 billion of property was at risk in 1998 while $1.18 billion dollars of property was at risk in US residents retain the largest percentage of coastal property value at risk in Currituck County. Table II-44. Currituck County 1998 Properties at Risk Owner Type Parcels Effected Total Value ($) % of Total Value ($) Coastal Resident 149 $66,795, % NC Resident 70 $52,208, % US Resident 1,323 $1,034,207, % Unknown 51 $2,585, % Total 1,593 $1,155,797, % II-27
59 Table II-45. Currituck County 2012 Properties at Risk Owner Type Parcels Effected Total Value ($) % of Total Value ($) Coastal Resident 122 $65,410, % NC Resident 58 $52,208, % US Resident 1,183 $1,055,410, % Unknown 36 $2,585, % Total 1,399 $1,175,613, % Currituck County exhibited an increase in the property value at risk of $19.82 million between 1998 and 2012 as presented in Table II-46. Absence of beach nourishment in Currituck County has, in many cases, pushed the stable vegetation line landward between 1998 and 2012, increasing the number of properties at risk. In this case, US residents are the primary group seeing the increase in risk. Table II-46. Currituck County - Difference in Properties at Risk (1998 v. 2012) Owner Type Parcels Effected Total Value ($) % of Total Value ($) Coastal Resident 27 $1,385, % NC Resident 12 $0 0.0% US Resident 140 -$21,202, % Unknown 15 $0 0.0% Total 194 -$19,816, % (9) Summary of Properties At Risk Table II-47 presents the number of parcels and total parcel value by ownership for all eight coastal counties. The total parcel value for all eight coastal counties is $ billion and coastal residents retain the largest percentage of property value (58.5%). However, NC non-coastal residents (17.4%) and non-nc US residents (23.9%) make up a large percentage as well. Table II-47. Oceanfront Coastal Counties 2015 Property Statistics Owner Type All Parcels Total Value ($) % of Total Value ($) Coastal Resident 334,608 64,513,960, % NC Resident 77,346 19,173,101, % US Resident 90,989 26,392,936, % Unknown 2, ,101, % Total 505,895 $110,240,099, % II-28
60 Table II-48 and Table II-49 present just the coastal properties at risk based on the 1998 and 2012 setback factors, respectively. Of the $ billion in property value for the entire county, $11.73 billion of property was at risk in 1998 while $11.12 billion dollars of property was at risk in US residents retain the largest percentage of coastal property value at risk in the eight coastal counties. Table II-48. Oceanfront Coastal Counties 1998 Properties at Risk Owner Type All Parcels Total Value ($) % of Total Value ($) Coastal Resident 4,841 2,184,726, % NC Resident 7,250 3,552,741, % US Resident 7,973 5,966,919, % Unknown ,715, % Total 20,446 $11,725,102, % Table II-49. Oceanfront Coastal Counties 2012 Properties at Risk Owner Type All Parcels Total Value ($) % of Total Value ($) Coastal Resident 4,318 2,015,436, % NC Resident 6,061 3,143,148, % US Resident 7,626 5,945,429, % Unknown ,335, % Total 18,349 $11,124,349, % The eight coastal counties exhibited a decrease in the property value at risk of $ million between 1998 and 2012 as presented in Table II-50. NC residents outside the coastal counties are the primary group seeing the reduction in risk followed by coastal residents. Table II-50. Oceanfront Coastal Counties - Difference in Properties at Risk (1998 v. 2012) Owner Type All Parcels Total Value ($) % of Total Value ($) Coastal Resident ,290, % NC Resident 1, ,592, % US Resident ,489, % Unknown , % Total 2,097 $600,752, % Of the five coastal counties with recent beach maintenance programs (Brunswick, New Hanover, Pender, Onslow, and Carteret), all exhibited a reduction in property at risk between 1998 and Conversely, Dare County and Currituck County which have been absent of beach maintenance activity, exhibited an increase in property value at risk between 1998 and Table II-51 presents the number of parcels and total parcel value II-29
61 by ownership for the five coastal counties with nourishment programs. The total parcel value for all five counties is $87.7 billion and coastal residents retain the largest percentage of property value (50.9%). However, NC non-coastal residents (15.6%) and non-nc US residents (13.0%) make up a large percentage as well. Table II-51. Five Oceanfront Coastal Counties with Nourishment Programs 2015 Property Statistics Owner Type All Parcels Total Value ($) % of Total Value ($) Coastal Resident 298,410 56,112,419, % NC Resident 71,118 17,232,694, % US Resident 61,965 14,293,889, % Unknown 1,869 93,167, % Total 433,362 $87,732,171, % Table II-52 and Table II-53 present just the coastal properties at risk for the five coastal counties with nourishment programs based on the 1998 and 2012 setback factors, respectively. Of the $87.7 billion in property value for the entire county, $6.81 billion of property was at risk in 1998 while $5.99 billion dollars of property was at risk in NC residents retain the largest percentage of coastal property value at risk in the eight coastal counties. Table II-52. Five Oceanfront Coastal Counties with Nourishment Programs 1998 Properties at Risk Owner Type All Parcels Total Value ($) % of Total Value ($) Coastal Resident 3,844 1,569,186, % NC Resident 6,736 3,231,562, % US Resident 4,270 1,995,119, % Unknown ,231, % Total 15,024 $6,810,099, % Table II-53. Five Oceanfront Coastal Counties with Nourishment Programs 2012 Properties at Risk Owner Type All Parcels Total Value ($) % of Total Value ($) Coastal Resident 3,290 1,375,838, % NC Resident 5,524 2,805,008, % US Resident 3,739 1,797,155, % Unknown ,298, % Total 12,705 $5,991,301, % II-30
62 The eight coastal counties exhibited a decrease in the property value at risk of $818.8 million between 1998 and 2012 as presented in Table II-54. NC residents outside the coastal counties are the primary group seeing the reduction in risk. Table II-54. Five Oceanfront Coastal Counties with Nourishment Programs Difference in Properties at Risk (1998 v. 2012) Owner Type All Parcels Total Value ($) % of Total Value ($) Coastal Resident ,348, % NC Resident 1, ,553, % US Resident ,963, % Unknown , % Total 2,319 $818,798, % Based on ownership breakdowns of coastal properties at risk in each of the eight coastal counties, it is apparent that the impacts of beach nourishment not only effects coastal residents but have far reaching implications to the rest of North Carolina as well as the US. For a further breakdown of property parcel ownership along the county barrier islands, please see Appendix G. These data also show the far reaching impacts of our coastal property, infrastructure, and economy. 2. Value of Beach Recreation a) Background Beaches are a leading tourist destination in the United States. The U.S. Travel Association (2016) reports that beaches are the top destination for U.S. domestic leisure travelers, following trips to visit family and friends. In 2012, beach recreation ranked third on the list of top activities for overnight travelers to North Carolina, just after visiting relatives and shopping (VisitNC, 2013). More people visited NC beaches than all state parks, national parks and historic sites in North Carolina combined. Six times more people visited NC for the beaches than for golf. The U.S. News and World Report (2012) ranked North Carolina Outer Banks beaches as the #1 Best Family Beach Vacation and the #5 Best Beach in the USA. National Geographic (2012) ranked Wrightsville Beach as one of the Top 20 World's Best Surf Towns. Beach tourism is clearly an important component of North Carolina travel and tourism, and North Carolina beaches enjoy a positive national and international reputation. A national poll found that beach erosion is the number one concern of beach tourists regarding beach quality (Hall and Staimer, 1995). The United States has 20,500 miles of eroding shoreline and 2,670 miles of critically eroding shoreline (National Research Council 1995; US Army Corps of Engineers, 1994). From the Federal II-31
63 government and its local government cost-sharing partners spent an average of $3.4 million (1993 dollars) annually on beach sand nourishment (US Army Corps of Engineers, 1994). The Federal investment in beach nourishment and renourishment has increased since the mid-1990 s and has been up to $100 million a year (Valverde, Trembanis and Pilkey, 1999; Trembanis and Pilkey, 1998). The State of North Carolina maintains two measures of tourism economic impact. County-by-county travel economic impact model (TEIM) statistics are prepared annually by the Research Department of the Travel Industry Association of America for the North Carolina Department of Commerce (NCDC 2016). In addition to the direct visitor spending estimates for all 100 North Carolina counties, county-level employment, payroll and tax revenues as a result of direct visitor spending are included. The NCDC also maintains separate measures of Tourist Spending Tax Information on occupancy tax and meals tax collections, which are important in coastal tourist areas (NCDC 2016). However, these TEIM estimates do not separate beach and inlet-related spending from all visitor spending. The second measure of tourism economic impact is the Tourism Satellite Account (TSA) produced for NCDC by GlobalInsight (NCDC 2016). This measure follows the official international standard for measuring the economic contribution of tourism. The TSA methodology was developed by the World Tourism Organization and ratified by the United Nations in The TSA for North Carolina provides measures of the contribution of travel and tourism to Income, Employment, Gross state product, Government tax revenues, and other measures. The economic impact measure produced by the TSA methodology is typically larger than that produced by the TIA methodology because the TSA methodology includes the spending of the following groups (in addition to domestic in-bound traveler spending measured by TIA): the spending of international and resident outbound visitors, North Carolina s Tourism Office budget, the construction of tourism sector infrastructure, and the rental income from a large number of seasonal second homes. However, again, the TSA estimates do not separate beach and inlet-related spending from all visitor spending. In contrast, the present (BIMP) study develops estimates of beach and inlet-related economic impacts and consumer surplus. b) Current Estimate of Beach Recreation Value Estimates of the value of beach recreation along the North Carolina coast were developed using data from several sources. The value of recreationists' direct expenditures on lodging, food and beverage, fuel, miscellaneous retail shopping, etc., were tabulated in addition to the economic multiplier effects of these expenditures and the additional value of the beach recreation experience to the recreationists themselves ("consumer surplus" value). Values were estimated for recreationists staying overnight in paid accommodations, including hotels, motels, inns and bed and breakfasts, rented II-32
64 condominiums, rented cottages, cottage courts, recreational vehicle parks and campgrounds, as well as for recreationists staying overnight with friends or family and for "day trip" recreationists visiting for the day and not staying overnight. The estimation methodology begins with occupancy tax rates and collections for coastal towns and counties available from the NCDC for State fiscal year Fiscal year was selected as the baseline year because it was the most recent year for which data was available. Occupancy tax is collected on overnight expenditures on hotels, motels, inns, bed and breakfasts, rented condominiums, rented cottages, cottage courts, recreational vehicle (RV) parks, and campgrounds. Only those communities located on beach islands or adjacent to the intracoastal waterway were selected. For example, in New Hanover County, occupancy taxes paid in Wrightsville Beach, Carolina Beach and Kure Beach were included in the analysis, but occupancy taxes paid in Wilmington were not. On the one hand, this may under-count beach recreationists' expenditures on lodging if some beach recreationists stay in Wilmington hotels. (However, if visitors are staying in Wilmington hotels off the beach and visiting the beach by day, only to return to hotels in Wilmington at night, then these visitors might be considered day visitors from the beach community's perspective. This is the perspective taken here.) On the other hand, the procedure may over-count beach recreation expenditures if some beach hotel visitors do not intend to recreate at the beach, but are there for some other reason, such as to attend a workshop or conference. To some extent, these sources of over- and under-counting should work to cancel one another and the net effect should be minor relative to overall levels of occupancy taxes. Occupancy tax collections in each beach town community were divided by communityspecific occupancy tax rates to derive estimates of overnight beach recreationists' lodging expenditures at hotels, motels, inns, bed and breakfasts, rented condominiums, rented cottages, cottage courts, RV parks, and campgrounds. When community-specific occupancy tax collections and rates were not available from NCDC, the individual counties were contacted to obtain community-specific tax collections and rates. For each beach community, overnight lodging expenditures were partitioned into three categories, expenditures attributable to (1) hotels/motels/inns/bed and breakfasts, (2) condo and cottage rentals, and (3) RV parks and campgrounds. In some cases the data needed to partition lodging expenditures were part of county occupancy tax records, in other cases the data were drawn from surveys of beach recreationists (BCTDA 2016, Brandon Agency 2013, Brothers et al. 2012, Downs 2013, Herstine et al. 2005, Imperial et al. 2004, Management Analysis, Inc. 2015, Tippett 2015). Numbers of overnight beach trips by lodging category for each beach community were then calculated by dividing the lodging expenditures in each community and category by the estimated lodging expenditures per trip made by overnight beach recreationists in each community and category. A trip is defined as all persons traveling together to the II-33
65 beach for all days of the trip, not the number of individual persons making trips, and not the individual number of days. So, the lodging expenditures made by all persons in a family traveling together to the beach for all days spent at the beach on the trip are counted as the expenditures made on one trip. Estimates of average overnight lodging expenditures per beach trip by lodging category for Dare county are provided by Management Analysis, Inc. (2015) (cottage & condo rentals: $2,521 per trip; hotel/motel/b&b: $687 per trip; RV and campgrounds: $510 per trip, in year dollars), and similar data are provided for Wrightsville Beach in Imperial et al. (2004) (cottage & condo rentals: $1,935 per trip; hotel/motel/b&b: $612 per trip; RV and campgrounds: not available, so Dare County value was used: $317 per trip, in inflationadjusted dollars). Per trip lodging expenditures by lodging category for Currituck County (Corolla area) and Hyde County (Ocracoke area) are assumed to be similar to those in Dare County. Per trip lodging expenditures by lodging category for Carteret, Pender and Brunswick Counties and other beach communities in New Hanover County are assumed to be similar to those in Wrightsville Beach. The number of overnight beach trips made by beach recreationists staying with family and friends at the beach (and therefore not paying occupancy tax) were estimated for Dare County based on data in Management Analysis, Inc. (2015) indicating that five percent of all overnight trips are of this type. Estimates for Hyde and Currituck Counties are made based on the five percent figure for Dare County. Imperial et al. (2004) found that a much higher percentage, forty-seven percent, of all overnight trips at Wrightsville Beach are trips in which visitors stay with family and friends. The Wrightsville Beach percentage is used to estimate "family and friend lodging" trips for Carteret, Pender, Hyde, and Brunswick Counties and the remaining beach communities in New Hanover County. The numbers of day (non-overnight) beach recreation trips for each community are estimated using information on (1) numbers of overnight trips as estimated above, (2) the proportions of day trips to overnight trips, and (3) the average number of days per overnight trip. Data for (2) are provided by Herstine et al. (2005) for Carteret, Pender, Onslow and Brunswick County beaches and by Imperial et al. (2004) for Wrightsville Beach (assumed to be the same for other New Hanover County beaches). Due to relatively remote location, it is assumed that only five percent of beach trips made to Currituck County and Dare County communities north of Oregon Inlet are day trips and zero percent of beach trips made to Dare County and Hyde County communities south of Oregon Inlet are day trips. (It is very likely that many visitors staying overnight in Manteo or Bodie Island communities make day trips to Hatteras communities, but the expenditures of these visitors are counted in the overnight category rather than the day trip category.) Data for (3) are provided by Management Analysis, Inc. (2015) for Dare County (5.8 days per overnight trip) and by Herstine et al. (2005), Imperial et al. (2004), BCTDA (2016), the Brandon Agency (2013), Downs (2013) and Tippett (2015) for Carteret County and counties south of Carteret (4.9 to 6.75 days per overnight trip). Given these II-34
66 data, the numbers of day trips for each community are estimated by multiplying the number of overnight trips by the proportion of day trips to overnight trips and then multiplying by the average number of days per overnight trip. The last multiplication is done to correct for sampling bias associated with the on-site beach surveys that are the source of the estimates of the proportions of day trips to overnight trips. (For example, if an on-site beach survey finds that on each of three different days of beach surveying, one person was a day visitor and one person was an overnight visitor, then a naïve estimate of the proportion of day visitors to overnight visitors is one-to-one. But, what if the average overnight visitor stays three days per trip? Then, on average, the beach survey picked up the same overnight visitor on each of the three different survey days, so the true proportion of day visitors to overnight visitors is three-to-one. Multiplying the naïve estimate of day trips by the average number of days per overnight trip corrects for this potential bias.) Given estimates of the number of overnight trips (by overnight trip category) and day trips for each beach community, estimates of the direct non-lodging expenditures made by beach recreationists on food and beverage purchased in restaurants and bars, food and beverage purchased in grocery stores and convenience stores, fuel, entertainment (movies, golf, etc.), retail shopping, etc., are developed by multiplying the number of trips in each trip category by the average expenditure per trip in each expenditure category for each trip category. Data on expenditures per trip for overnight trips and day trips by expenditure category are provided by Management Analysis, Inc. (2015) for Dare County and by Imperial et al. (2004) for Wrightsville Beach. The expenditure per trip estimates for Dare County are used for Hyde County and Currituck County, and the estimates for Wrightsville Beach are used for Carteret, Pender, Onslow, New Hanover and Brunswick County beach communities. Estimated direct expenditures are summed across expenditure categories and trip types and are reported for each beach community in year dollars. Direct expenditures by expenditure category are summed across all trip types for all communities in each county. These county-level direct expenditures by expenditure category were then entered into county-level economic input-output models (see Miller and Blair 1985 for additional information on input-output models) to estimate the countywide economic multiplier effects of the direct expenditures. County-level IMPLAN software models (IMPLAN Group 2014) were used to estimate multiplier effects. The input-output models provide estimates of total business sales (also known as economic output or business activity) and employment supported in each county by the direct beach recreation expenditures. Estimates of total impacts on business sales and employment were provided at the county level because multiplier effects occur countywide rather than being confined to particular beach communities. Estimates of business sales are provided in year dollars. Inflation adjustment does not change employment estimates. II-35
67 In addition to the direct economic expenditures of beach recreationists and the economic multiplier effects of the expenditures, beach recreationists also enjoy "consumer surplus" value during beach trips. Consumer surplus is the value to the recreationist of the recreation experience itself, value beyond the expenditures made in order to gain access to the experience. For example, if a recreationist would have been willing to pay $2,000 for a beach vacation but only ends up spending $1,900, then the consumer surplus is the difference, $100. Bin et al. (2005) provide estimates of consumer surplus value for beach recreation in North Carolina. The authors estimated consumer surplus of a beach day using the singlesite travel cost method. Onsite visitation data for southern North Carolina beaches were collected between July and November of One model pertained to beach visitors that make single day trips to the beach, while the other was for visitors that stay onsite overnight. Depending upon the site, the estimated consumer surplus ranged between $11 and $80 per person per day (in 2005 dollars) for day trips and between $11 and $41 per person per day (in 2005 dollars) for overnight trips. These estimates are of the same order of magnitude as the results from earlier studies using travel cost methods but are considerably larger than the previous findings based upon other (stated preference) methods. Bin et al. (2007) estimated consumer surplus values per trip for day trips and overnight trips to Carteret, Pender, Onslow, New Hanover and Brunswick County beaches based on data provided in Herstine et al. (2005). The average estimates of consumer surplus value are $55 per day trip and $65 per overnight trip in (The overnight trip value is based on a lower value per day, compared to day trips, multiplied by average days per overnight trip.) These values are similar to other estimates of consumer surplus per beach trip for North Carolina beach trips (e.g., Bin et al. 2005, Whitehead et al. 2008). These estimates of consumer surplus per trip were adjusted for inflation to $64 per day trip and $ $75 per overnight trip in The estimates were then multiplied by the number of trips to provide estimates of consumer surplus value by beach community. Local, State, and Federal Tax revenue related to beach recreation for was also compiled. Local tax revenue consists of sales tax and property tax. State tax revenue includes sales tax, payroll tax, corporate profits tax, and personal income tax. Federal tax revenue includes payroll tax, corporate profits tax, and personal income tax, and excise and import taxes. Estimates of direct impact, total impact, employment, tax revenue, and consumer surplus are presented in Table II-55 for each community along the North Carolina coastline. II-36
68 Region County Beach Table II-55. Local Beach Recreation Values Beach Recreation: Direct Impact Expenditures ( ) Beach Recreation: Total Impact Output/Sales/ Business Activity ( ) Beach Recreation: Total Impact Employment ( ) Beach Recreation: Total Local Tax Revenue ( ) Beach Recreation: Total State Tax Revenue ( ) Beach Recreation: Total Federal Tax Revenue ( ) Beach Recreation: Annual Consumer Surplus ( ) 4c Currituck Corolla $314,835,916 $569,356,701 6,528 $23,455,662 $23,574,367 $43,763,166 $9,473,122 4a Dare Avon $62,821,641 $132,467,215 1,487 $4,623,277 $4,607,503 $10,757,820 $1,890,245 4a Dare Buxton $16,961,115 $35,764, $1,248,231 $1,243,973 $2,904,487 $510,344 4b Dare Duck $131,466,842 $277,214,126 3,112 $9,675,130 $9,642,122 $22,512,888 $3,955,716 4a Dare Frisco $17,179,499 $36,225, $1,264,303 $1,259,989 $2,941,884 $516,915 3b Dare Hatteras Island $23,342,765 $49,221, $1,717,880 $1,712,019 $3,997,305 $702,362 3b Dare Hatteras Village $8,977,987 $18,931, $660,723 $658,469 $1,537,425 $270,139 4b Dare Kill Devil Hills $110,502,030 $233,007,222 2,615 $8,132,252 $8,104,508 $18,922,793 $3,324,904 4b Dare Kitty Hawk $45,787,732 $96,549,106 1,084 $3,369,688 $3,358,192 $7,840,868 $1,377,711 4b Dare Nags Head $186,572,268 $393,410,745 4,416 $13,730,542 $13,683,698 $31,949,354 $5,613,787 4a Dare Rodanthe $28,972,205 $61,091, $2,132,172 $2,124,897 $4,961,312 $871,747 4a Dare Salvo $26,861,165 $56,640, $1,976,812 $1,970,068 $4,599,809 $808,228 4b Dare Southern Shores $37,561,955 $79,204, $2,764,323 $2,754,892 $6,432,254 $1,130,205 4a Dare Waves $18,780,977 $39,602, $1,382,161 $1,377,446 $3,216,127 $565,102 3b Hyde Ocracoke $26,326,920 $42,852, $1,878,153 $1,768,226 $3,164,782 $792,153 2c Carteret Ft. Macon $1,929,664 $3,763, $163,263 $159,644 $304,243 $1,005,603 2c Carteret Atlantic Beach $29,578,898 $58,655, $2,529,311 $2,425,992 $4,556,770 $3,512,320 2c Carteret Pine Knoll Shores $8,310,221 $16,509, $711,456 $680,919 $1,276,859 $611,291 2c Carteret Salter Path/Indian Beach $6,654,442 $13,220, $569,695 $545,254 $1,022,475 $492,298 2c Carteret Emerald Isle $103,302,236 $205,221,971 2,561 $8,843,669 $8,464,534 $15,873,335 $7,713,156 2b Onslow North Topsail Beach $25,103,828 $38,129, $1,921,311 $1,649,488 $2,734,575 $2,429,707 2b Pender Topsail Beach $19,543,813 $29,754, $1,460,756 $1,320,738 $2,110,136 $1,010,145 2b Pender Surf City $26,904,885 $40,876, $2,007,613 $1,819,620 $2,927,761 $2,463,067 2a New Hanover Wrightsville Beach $103,955,613 $233,470,357 2,781 $8,719,067 $8,133,597 $18,370,823 $15,719,184 2a New Hanover Carolina Beach $77,853,553 $174,792,670 2,087 $6,527,639 $6,089,088 $13,756,085 $11,212,324 2a New Hanover Kure Beach $25,552,430 $57,551, $2,184,347 $2,021,137 $4,510,732 $3,025,882 1 Brunswick Bald Head Island $23,210,267 $45,046, $1,909,838 $1,768,945 $3,564,053 $758,539 1 Brunswick Caswell Beach $6,817,251 $13,182, $558,568 $519,297 $1,053,454 $615,518 1 Brunswick Holden Beach $41,512,749 $80,433, $3,408,349 $3,162,461 $6,393,315 $2,335,373 1 Brunswick Oak Island $33,430,485 $64,807, $2,746,256 $2,546,807 $5,144,002 $1,580,802 1 Brunswick Ocean Isle Beach $50,395,844 $97,695,619 1,139 $4,139,930 $3,839,265 $7,754,489 $2,383,031 1 Brunswick Sunset Beach $21,183,788 $41,066, $1,740,211 $1,613,827 $3,259,583 $1,001,702 Total $1,662,190,984 $3,335,713,884 38,642 $128,152,589 $124,600,983 $264,114,963 $89,672,622 Table II-56 presents a summary of the direct impact, total impact, employment, tax revenue, and consumer surplus summarized for each of the eight coastal counties as well as statewide impacts for comparison which allow the multiplier effects to ripple outside the county, throughout the state. II-37
69 Region County Table II-56. Regional and Statewide Beach Recreation Values 1 Brunswick $176,550,385 $342,231,219 3,992 $14,503,152 $13,450,602 $27,168,895 $8,674,965 2a New Hanover $207,361,596 $465,814,306 5,539 $17,431,052 $16,243,823 $36,637,640 $29,957,391 2b Pender $46,448,698 $70,630, $3,468,370 $3,140,358 $5,037,897 $3,473,212 2b Onslow $25,103,828 $38,129, $1,921,311 $1,649,488 $2,734,575 $2,429,707 2c, 3a Carteret $149,775,460 $297,370,636 3,730 $12,817,393 $12,276,342 $23,033,681 $13,334,667 3b Hyde $26,326,920 $42,852, $1,878,153 $1,768,226 $3,164,782 $792,153 3b, 4a, 4b Dare $715,788,182 $1,509,328,075 16,942 $52,677,495 $52,497,776 $122,574,325 $21,537,405 4c Currituck $314,835,916 $569,356,701 6,528 $23,455,662 $23,574,367 $43,763,166 $9,473,122 Total Total with Statewide Effects Difference Beach Recreation: Direct Impact Expenditures ( ) Beach Recreation: Total Impact Output/Sales/ Business Activity ( ) Beach Recreation: Total Impact Employment ( ) Beach Recreation: Total Local Tax Revenue ( ) Beach Recreation: Total State Tax Revenue ( ) Beach Recreation: Total Federal Tax Revenue ( ) Beach Recreation: Annual Consumer Surplus ( ) $1,662,190,984 $3,335,713,884 38,642 $128,152,589 $124,600,983 $264,114,963 $89,672,622 $1,662,190,984 $4,741,454,600 48,718 $155,806,220 $163,107,645 $375,840,980 $89,672,622 N/A $1,405,740,716 10,077 $27,653,631 $38,506,663 $111,726,017 N/A Overall, the direct impact of beach recreation is $1.66 billion. With multiplier effects, the economic impact of beach recreation to the eight coastal counties is $3.33 billion and 38,642 jobs with $124.6 million in annual sales tax revenue. When the entire state is included, the economic impact increases to $4.74 billion and 48,718 jobs. This equates to a benefit to non-nc coastal counties of $1.41 billion, 10,077 jobs, and a total of $163.1 million in annual sales tax revenue. 3. Value of Shore and Pier Fishing a) Background and Past Studies The value of shore and pier fishing (Figure II-1) in terms of trips and expenditures are captured in the estimates of beach recreation value in the previous section 2(b). However, the consumer surplus value of shore and pier fishing is not captured in the beach recreation value estimates. The Whitehead et al. (2008b) study of North Carolina shore and pier fishing found that the most popular target species of pier and shore anglers are spot, flounder, kingfish, seatrout, bluefish, striped bass, Spanish mackerel, red drum and king mackerel. Sixty-two percent of the anglers fish from manmade structures (piers and jetties), with 38 percent fishing directly on the beach. The frequency of trips, average respondent travel cost at each site and the three-year historic average catch at each site were developed for the 22 manmade fishing sites and the 28 beach fishing sites. A large number of consumer surplus estimates were developed from the model including the loss of access to fishing sites, changes in catch rates, and changes in beach width. A consumer surplus per trip value of $15.91 (in 2006 year dollars) for shore and pier fishing was used in the 2009 BIMP. II-38
 Current Estimate of Shore and Pier Fishing Value For the 2016 BIMP, consumer surplus estimates for shore and pier fishing were adjusted to")
70 Figure II-1. Location of North Carolina Shore and Pier Fishing Sites b) Current Estimate of Shore and Pier Fishing Value For the 2016 BIMP, consumer surplus estimates for shore and pier fishing were adjusted to account for an estimated 37.3 percent decrease in shore and pier fishing trips from 2006 to 2013 (NMFS 2016) and an increase of 12.4 percent in the consumer surplus per trip value from 2006 to 2013 due to inflation. Estimates of consumer surplus value arising from pier and shore fishing for each of the eight coastal counties are provided in inflationadjusted year dollars. These estimates are presented in Table II-57. II-39
71 Region Table II-57. Regional Shore and Pier Fishing Values County Annual Pier/Bridge/Jetty Fishing Consumer Surplus ( ) Annual Shore/Bank Fishing Consumer Surplus ( ) Total Annual Pier/Shore Fishing Consumer Surplus ( ) Region 1 Brunswick $991,114 $736,164 $1,727,278 Region 2a New Hanover $3,546,463 $1,262,593 $4,809,056 Region 2b Pender $1,245,356 $903,358 $2,148,714 Region 2b Onslow $754,108 $1,771,077 $2,525,185 Region 2c & 3a Carteret $8,583,907 $3,507,270 $12,091,177 Region 3b Hyde $0 $81,875 $81,875 Region 3b, 4a, 4b Dare $10,953,961 $14,395,428 $25,349,389 Region 4c Currituck $0 $262,994 $262,994 Total $26,074,909 $22,920,759 $48,995, Value of Marine Recreational Services a) Background and Past Studies Marine recreational services are defined here as recreational businesses that are dependent on saltwater but are not direct beach recreation and are not fishing-related (estimates of beach recreation and fishing-related value are presented elsewhere in this report). Examples of marine recreation services businesses include firms that operate saltwater ecotours, sunset cruises, canoe/kayak/sailboat/ surfboard rentals and lessons, scuba diving guides, etc. To date, very little investigation has been made into the value of marine recreational services in North Carolina. A study by Dumas and Ayres (2008) was the basis of the analysis in the 2009 BIMP. Dumas and Ayers (2008) identified and surveyed two hundred and forty-three North Carolina saltwater recreation businesses. Based on data collected by this telephone and in-person survey, the 2009 BIMP developed estimates by county of the number of firms, direct sales and employment, and total impacts on county sales and employment associated with the Marine Recreational Services industry. As noted in the 2009 BIMP, there is likely some overlap in the Marine Recreational Services impacts and the beach tourism/recreation impacts described in Section 2 of this report. b) Current Estimate of Marine Recreational Service Value The change in the number of Marine Recreational Services businesses between 2007 and 2013 is unknown. It is assumed that changes in Marine Recreational Services direct sales, employment, etc., are proportional to the change in direct expenditures on beach tourism II-40
72 recreation from 2007 to Estimates by county of the number of firms, direct sales and employment, and total impacts on county sales and employment (including multiplier effects) are provided in Table II-58 for year Local, State, and Federal Tax revenues related to marine recreational services for were also compiled and presented in Table II-58. Local tax revenue consists of sales tax and property tax. State tax revenue includes sales tax, payroll tax, corporate profits tax, and personal income tax. Federal tax revenue includes payroll tax, corporate profits tax, and personal income tax, and excise and import taxes. Estimates are not provided by community within each county because many of these firms operate at several locations within each county or operate from home based on appointments made at other locations (e.g., a canoe tour operator runs business from home but takes appointments at a local sporting goods store). Region County Table II-58. Regional Marine Recreational Services Values Marine Recreational Services: Direct Impact Annual Sales ( ) Marine Recreational Services: Total Impact Output/Sales/ Business Activity ( ) Marine Recreational Services: Direct Impact Employment ( ) Marine Recreational Services: Total Impact Employment ( ) Marine Recreational Services: Total Local Tax Revenue ( ) Marine Recreational Services: Total State Tax Revenue ( ) Marine Recreational Services: Total Federal Tax Revenue ( ) 1 Brunswick $965,017 $2,026, $79,141 $73,473 $148,750 2a New Hanover $3,328,528 $6,991, $279,800 $260,743 $588,100 2b Pender $1,087,866 $2,285, $81,232 $73,550 $117,992 2b Onslow Included in Pender Co. totals. 2c, 3a Carteret $1,938,733 $4,072, $165,938 $158,888 $298,050 3b Hyde Included in Dare Co. totals. 3b, 4a, 4b Dare $3,726,270 $7,826, $274,230 $273,294 $638,101 4c Currituck Included in Dare Co. totals. Total $11,046,413 $23,202,475 1,844 1,929 $880,340 $839,947 $1,790,992 D. Value of Shallow Draft Inlets 1. Value of Commercial Fisheries a) Background and Past Studies In North Carolina, commercial fishing vessels are docked in harbors that lie on the landward side of beach barrier islands. These locations provide the vessels some protection while in harbor against the large waves generated by storms at sea. In order for commercial fishing vessels to access the ocean, they must pass through inlets to reach the open waters of the Atlantic Ocean. As a result, maintaining inlet waterways at sufficient depths and widths to ensure navigability is important for maintaining ocean access for the commercial fishery. Not all commercial fishing requires ocean access. Some fishing is done in the sounds and waterways landward of the barrier islands. However, most fishing vessels fish in the ocean at least part of the year, and many fish exclusively in the ocean. II-41
73 b) Current Estimate of Commercial Fishing Value The North Carolina Division of Marine Fisheries (NCDMF) tracks sales of commercial fishery landings at dockside (NCDMF 2016). These dockside sales data provide information on the magnitude of commercial fishery landings value and its geographic distribution along the coast. However, the dockside sales data are actually reported by the seafood dealer who buys the fish from the fisherman, and the sales are attributed to the seafood dealer's business location (referred to as "landings by dealer city"). For example, if a seafood dealer based in New Hanover County travels to Brunswick County to buy fish from a Brunswick County fisherman who landed the fish at a Brunswick County location, the fish are recorded as being landed in New Hanover County, the seafood dealer's location. This implies that there is some discrepancy between the geographic distribution of landings as reported in the NCDMF data and the actual geographic distribution of landings. This is important if one is trying to determine the relative value of seafood landings in various ports or counties since the geographic distribution of landings in the NCDMF data may not reflect the true distribution of landings. Personal communication with NCDMF License and Statistics Section staff confirmed that the distribution of landings in the NCDMF data provide the best estimate of the true distribution of landings. With this caveat, this study proceeded with the analysis on the assumption that the distribution of landings in the NCDMF data is equivalent to the true distribution of landings. In making this assumption, the estimates of statewide commercial fishery value and regional (northern, central, southern coast) values should not be greatly biased, but estimates of relative value at adjacent ports or counties could be significantly biased in cases where there is significant seafood dealer activity between ports and across counties. NCDMF commercial seafood landings values by dealer city for 2015 were used as estimates of direct sales/output of the commercial fishery by port. These values were then attributed to use of the nearest inlet. Exceptions include landings in Currituck, Pasquotank, Perquimans, Camden, Chowan, Tyrrell, Washington, Beaufort, Pamlico, and Craven Counties, which were assumed to be based primarily on fishing in the sounds and bays without making use of the ocean inlets and so are not considered in the analysis. All landings in Hyde County were attributed to Ocracoke Inlet except landings at Engelhard (half of the landings in Engelhard, which is on mainland Hyde County, are attributed to Oregon Inlet, one-quarter to Hatteras Inlet, and one-quarter to Ocracoke Inlet). For New Hanover County landings, half of dockside sales were attributed to Carolina Beach Inlet and half were attributed to Masonboro Inlet (Wrightsville Beach). Commercial fishery landings values by supporting inlet are presented in Table II-59. Estimates of the number of commercial fishing jobs were based on NCDMF data on Commercial Fishing Participant Counts by County for In addition, Local, State, and Federal Tax revenue related to commercial fishing for 2015 was also compiled and presented in Table II-59. Local tax revenue consists of sales tax II-42
74 and property tax. State tax revenue includes sales tax, payroll tax, corporate profits tax, and personal income tax. Federal tax revenue includes payroll tax, corporate profits tax, and personal income tax, and excise and import taxes. Region County Table II-59. Regional Commercial Fishing Values Commercial Fishing: Direct Impact Landings Value at Dockside (2015) Commercial Fishing: Total Impact Output/Sales/ Business Activity (2015) Commercial Fishing: Total Impact Employment (2015) Commerical Fishing: Total Local Tax Revenue (2015) Commerical Fishing: Total State Tax Revenue (2015) Commerical Fishing: Total Federal Tax Revenue (2015) 1 Brunswick $2,908,338 $3,818, $49,497 $44,819 $83,190 2a New Hanover $2,086,239 $4,157, $64,883 $86,615 $215,926 2b Pender $1,645,650 $2,087, $23,703 $32,142 $58,461 2b Onslow $5,475,273 $7,342, $90,820 $122,561 $241,061 2c, 3a Carteret $18,878,984 $30,948,572 1,141 $454,489 $674,400 $1,494,921 3b Hyde $9,119,176 $14,359, $186,196 $279,299 $634,555 3b, 4a, 4b Dare $19,418,969 $33,901, $451,123 $681,536 $1,677,495 4c Currituck $0 $0 0 $0 $0 $0 Total $59,532,630 $96,617,338 3,462 $1,320,711 $1,921,371 $4,405,610 c) Current Estimate of Seafood Packing and Processing Value Commercial fishery landings also support seafood dealer, seafood processing and seafood packing jobs in North Carolina. The IMPLAN input-output model (IMPLAN Group 2014) provided an estimate of $0.319-$0.332 raw seafood input per $1.00 of seafood dealer/processing/packing sales on average for the North Carolina seafood industry in Assuming North Carolina seafood landings are sold to North Carolina seafood dealers/processors/packers, dividing commercial seafood landings values by $0.32 produces estimates of seafood dealer/processing/packing sales by region. The IMPLAN input-output model 2006 database also provided an estimate of the number of seafood dealer/processing/packing jobs per $1 million in seafood dealer/processing/packing sales on average for coastal North Carolina. Dividing estimates of seafood dealer/processing/packing sales by the number of jobs per $1 million produces estimates of seafood dealer/processing/packing jobs by region. Direct seafood dealer/processing/packing sales and jobs by region are presented in Table II-60. The economic multiplier effects of commercial fishery activity and seafood dealer/processing/packing activity were calculated in terms of total business sales supported and total jobs supported. Seafood dealer/processing/packing sales were aggregated by county. The indirect effects of seafood dealer/processing/packing activity on commercial fishing sales were excluded from the multiplier effect estimates to avoid double-counting the commercial fishing sales. Additional "forward-linkage" economic multiplier effects of commercial seafood landings on seafood restaurant sales, grocery store sales, etc., were not considered because seafood caught outside North Carolina II-43
75 could be a ready substitute at the retail level for North Carolina-caught seafood. That is, if locally-caught seafood were to disappear, commercial fishery jobs and seafood dealer/processing/packing sales and jobs would likely be lost, but restaurants and grocery store sales and jobs would remain, making use of seafood imported from outside North Carolina. Estimates of total (including multiplier effects) business sales and jobs supported by the commercial fishery and seafood dealer/packing/processing industries supported by region and inlet are presented in Table II-60. In addition, Local, State, and Federal Tax revenues pertaining to seafood packing and processing for 2015 were also compiled and presented in Table II-60. Local tax revenue consists of sales tax and property tax. State tax revenue includes sales tax, payroll tax, corporate profits tax, and personal income tax. Federal tax revenue includes payroll tax, corporate profits tax, and personal income tax, and excise and import taxes. Region County Table II-60. Regional Seafood Packing and Processing Values Seafood Packing & Processing: Direct Impact Sales (2015) Seafood Packing & Processing: Total Impact Output/Sales/ Business Activity (2015 Seafood Packing & Processing: Direct Impact Employment (2015) Seafood Packing & Processing: Total Impact Employment (2015) Seafood Packing & Processing: Total Local Tax Revenue (2015) Seafood Packing & Processing: Total State Tax Revenue (2015) Seafood Packing & Processing: Total Federal Tax Revenue (2015) 1 Brunswick $8,754,780 $12,207, $113,825 $116,174 $278,935 2a New Hanover $6,396,545 $7,986, $67,044 $68,934 $169,729 2b Pender $5,045,670 $6,299, $51,550 $55,711 $133,884 2b Onslow $16,787,540 $20,960, $175,090 $181,781 $445,449 2c, 3a Carteret $57,884,182 $72,271, $591,386 $639,122 $1,535,929 3b Hyde $28,133,484 $36,103, $289,886 $312,759 $787,276 3b, 4a, 4b Dare $59,087,801 $78,344, $641,043 $693,219 $1,828,269 4c Currituck $0 $0 0 0 $0 $0 $0 Total $182,090,002 $234,173, ,047 $1,929,825 $2,067,701 $5,179, Value of For-Hire (Charter Boat and Head Boat) Fisheries a) Background and Past Studies The "For-Hire" fisheries of North Carolina include the charter boat fishery and the head boat fishery. Charter boats take three to 12 (typically six) anglers on half-day or full-day saltwater fishing trips for a fee. Charter boat trips are customized, relatively expensive ($100-$300 per person) fishing trips. Head boats take 20 to 100 anglers on half-day or full-day saltwater fishing trips for a lower fee ($30-$125 per person). Head boat trips are less customized and less exclusive, and, therefore, less expensive. In 2002, a study of a prime recreational fishing area northeast of Cape Hatteras, known as The Point, was performed to evaluate economic impacts that would result from the proposed construction of exploratory wells for potential oil and gas production by Chevron Corporation (Palmquist, Schumann and Michael 2002). Given the location of The Point, it is likely a large percentage of anglers in this area come from Dare County through Oregon Inlet. The study used MRFSS data from 1990 and NMFS statistics on trip numbers II-44
76 to estimate losses, in dollars, to recreational anglers due to various closure scenarios. The total number of trips involving private and charter boats originating in Dare County and traveling to a location greater than 3 miles offshore was estimated at approximately 97,800 for Determined economic losses from various scenarios involving closure of the site and for some scenarios prolonged reduction in available catch (e.g. 50 percent reduction in probability of success for a 6-month period) ranged from as low as $1,300 during January and February (an off-season period) to $460,000 for July and August, at peak periods and worst-case scenarios. Moffatt & Nichol and Dumas (2006) assessed the economic impacts of Oregon Inlet to Dare County and the surrounding region. The study found that Oregon Inlet-dependent recreational charter fishing accounted for 596 jobs and $39.3 million and recreational sportfish tournaments for 480 jobs and $31.0 million. Unfortunately, data were not available to support estimates of private boat and rental (head boat) fishing impacts. Dumas et al. (2009) conducted a study to estimate the economic impacts and benefits of the North Carolina for-hire fishery. Two surveys were conducted in to collect data for the study. A mail survey of charter and head boat captains obtained information on the home ports, numbers of vessels by type (charter boat vs. head boat) and length, numbers of vessel trips by month, fish species targeted, crew sizes, fees charged, and fixed and variable vessel costs. Over 150 captain surveys were obtained. Two surveys of for-hire passengers, an on-site dockside survey and a telephone follow-up survey, collected information from passengers on fees paid, fish caught, numbers of trips per year and trip locations, numbers of non-fishing traveling companions accompanying the angler on the visit to the coast, and "off vessel" expenditures of both the angler and non-fishing travelling companions on lodging, restaurants, groceries, gasoline, shopping, etc. were completed. Over 1,300 passenger surveys were obtained. The Dumas et al. (2009) study data were used to estimate numbers of trips and expenditures per vessel per year by vessel type (charter vs. head boat), trip type (halfday vs. full-day trips) and vessel length. Data from NCDMF on the numbers of for-hire vessels by port and by vessel length (NCDMF 2008a) were used to aggregate the per vessel values from the Dumas et al. (2009) study to total amounts for all vessel by port and inlet. Estimates of the numbers of for-hire captain and crew jobs, direct expenditures by passengers on for-hire fishing fees (equal to the direct sales of the for-hire industry), the additional direct "off-vessel" expenditures by for-hire passengers, economic multiplier effects and tax impacts were presented by inlet in the 2009 BIMP. The study also estimated consumer surplus values for for-hire fishing passengers in North Carolina. The average estimates of consumer surplus value were $624 per trip per passenger for charter trips and $102 per trip per passenger for head boat trips in These estimates of consumer surplus per trip were multiplied by the number of passenger trips to obtain estimates of consumer surplus value by inlet. II-45
77 b) Current Estimate of For-Hire Fisheries Values The analysis of charter boat fishing is based on NMFS-MRIP (2016) estimates of ocean charter angler trips for year These trip estimates includes only those charter boat anglers who go through an inlet; charter boat anglers fishing in the AIWW are excluded. Numbers of charter boat vessels by county based on NCDMF data for Allocation of vessels within each county is made in proportion to the allocation used in the 2009 BIMP, which was based on the Dumas (2009) study and NCDMF vessel license data. The analysis uses values for trips per vessel per year and anglers per trip per vessel from the Dumas (2009) study, with the total number of NC charter anglers per year controlled to the total from the NMFS MRIP survey data for The percent of non-nc resident anglers is from an NCDMF angler intercept survey conducted in The analysis assumes an average of 2 captain/crew jobs per charter vessel, based on the NC industry average. Estimates of charter fees & tips per angler trip for 2015 and other spending per angler trip for 2011 are from Lovell et al. (2013), adjusted for inflation to year The analysis of head boat fishing is based on the numbers of head boat vessels and trips by county for year 2015 (NOAA-Fisheries 2016) supplemented by an internet search for head boat locations within each coastal NC county. In Brunswick County, at least four head boats are based in Calabash, these boats access the ocean through Little River Inlet in South Carolina. The analysis considers only those head boat anglers who fish in the ocean via an inlet; the analysis excludes head boat anglers fishing in the AIWW. Head boat trips are allocated to ports/towns based on the proportions used in the 2009 BIMP based on Dumas et al. (2009). The analysis assumes an average of 4 captain/crew jobs per head boat vessel, based on the NC industry average (Dumas et al. 2009). The number of head boat passengers per year is based on 2015 reported head boat angler trip data from NOAA-Fisheries (2016). The percentage of non-nc resident head boat anglers is from a NCDMF angler intercept survey conducted in 2015 (NCDMF 2016). Average head boat fees and tips per angler trip for 2015 is from the Dumas et al. (2009) study, adjusted for inflation. Other spending per head boat angler trip for 2011 is from Lovell et al. (2013) adjusted for inflation to year Estimates of the numbers of for-hire captain and crew jobs, direct expenditures by passengers on for-hire fishing fees (equal to the direct sales of the for-hire industry), and additional direct "off-vessel" direct expenditures by for-hire passengers on restaurants, gasoline for car, shopping, etc., by inlet are presented in Table II-61. "Off-vessel" direct expenditures do not include expenditures on lodging nor any expenditures made by nonfishing traveling companions. It is assumed that non-fishing traveling companions go to the beach, and any expenditures made by these traveling companions are included under the beach recreation impacts reported in this study. It is also assumed that the lodging expenditures reported by non-fishing traveling companions include the lodging expenses II-46
78 of the for-hire passengers. Taken together, these assumptions produce a conservative estimate of the off-vessel spending of for-hire anglers and their traveling companions; if the assumptions are incorrect, then it is likely that off-vessel spending and its economic impact are larger than reported here. Direct expenditures were summed across all inlets by county. These county-level direct expenditures by expenditure category were then entered into county-level economic input-output models (IMPLAN Group 2014) to estimate the county-wide economic multiplier effects. The input-output models provided estimates of total business sales (also known as economic output or business activity) and employment supported in each county by the expenditures of for-hire vessels and their passengers. County-level impacts were then allocated to inlets in proportion to direct expenditures supported by each inlet. These estimates are presented in Table II-61 for Local, State, and Federal Tax revenue pertaining to seafood packing and processing for 2015 was also compiled and presented in Table II-61. Local tax revenue consists of sales tax and property tax. State tax revenue includes sales tax, payroll tax, corporate profits tax, and personal income tax. Federal tax revenue includes payroll tax, corporate profits tax, and personal income tax, and excise and import taxes. For-hire anglers also enjoy "consumer surplus" value during fishing trips. Consumer surplus is the value to the recreationist of the recreation experience itself, value beyond the expenditures made in order to gain access to the experience. For example, if a fisherperson would have been willing to pay $2000 for a for-hire fishing trip but ends up spending only $1300, then the consumer surplus is the difference of $700. Dumas et al. (2009) estimated consumer surplus values for for-hire fishing passengers in North Carolina. The average estimates of consumer surplus value in 2008 are $624 per trip per passenger for charter trips and $102 per trip per passenger for head boat trips. Adjusted for inflation, these estimates of consumer surplus per trip are $690 and $113, respectively, in The 2015 estimates are multiplied by the number of passenger trips to obtain estimates of consumer surplus value by inlet. These consumer surplus estimates are presented in Table II-61 for The economic impact and consumer surplus estimates for the charter and head boat fisheries are lower today (2015) compared to the 2009 BIMP (which were based on data from ), likely due to the effects of the recession in The for-hire fisheries are still recovering. For example, the number of charter boat angler-days in 2015 is about half the 2006 value. II-47
79 Region Table II-61. Regional For-Hire (Charter Boat and Head Boat) Fisheries Values County Charter/Head Boat Fishing: Direct Impact Expenditures (2015) Charter/Head Boat Fishing: Total Impact Output/Sales/ Business Activity (2015) Charter/Head Boat Fishing: Direct Impact Employment (2015) Charter/Head Boat Fishing: Total Impact Employment (2015) Charter/Head Boat Fishing: Total Local Tax Revenue (2015) Charter/Head Boat Fishing: Total State Tax Revenue (2015) Charter/Head Boat Fishing: Total Federal Tax Revenue (2015) Charter/Head Boat Fishing: Annual Consumer Surplus (2015) 1 Brunswick $6,394,213 $9,792, $269,458 $254,069 $506,008 $7,059,111 2a New Hanover $4,544,826 $9,416, $223,846 $249,709 $587,117 $8,365,220 2b Pender $535,547 $713, $20,226 $20,591 $34,450 $1,033,735 2b Onslow $1,778,442 $2,379, $71,332 $68,514 $117,184 $2,848,193 2c, 3a Carteret $6,298,731 $10,958, $287,464 $332,110 $665,284 $10,856,531 3b Hyde $641,940 $917, $23,458 $25,986 $46,354 $1,444,972 3b, 4a, 4b Dare $17,169,280 $31,564, $679,979 $828,472 $1,967,118 $36,479,985 4c Currituck $1,012,887 $1,772, $42,601 $50,723 $107,692 $2,279,954 Total $38,375,865 $67,515, ,388 $1,618,364 $1,830,175 $4,031,208 $70,367, Value of Private Recreational Boating a) Background and Past Studies North Carolina's AIWW, sounds, bays, inlets, and near-shore ocean provide tremendous opportunities for private recreational boating. Boaters with waterfront residences along North Carolina's extensive waterway, estuarine and river coastlines dock their vessels at their own private docks. Other boaters pay to dock their vessels at marinas either in the water ("wet slips") or in a storage warehouse ("dry slips"). Still other boaters keep their vessels at home on a trailer and use either a marina boat ramp or a public boat ramp facility to access the water. In addition to resident boaters, many non-resident transient boaters travel through North Carolina on the AIWW twice a year, heading south to Florida for the winter and north to New York, New Jersey and points north for the summer. All of these boaters support economic activity along the coast, and this economic activity depends on access to boating waters and waterways of sufficient depth to allow boats to pass safely without grounding. In 1995, Dare County initiated a study of transient boater trends in the local area in an effort to attract more boaters to Dare County ports (Professional Management Group, Inc, 1995). In the context of the study, transient boaters were defined as those using the AIWW to travel between northern and southern states. Since the AIWW is within a few hours by boat to Dare County ports, the goal of the study was to profile transient boaters and determine strategies to attract boaters along an alternative route through the Pamlico Sound. The study profiled various marinas throughout North Carolina and in other States for comparison and surveyed boaters themselves, collecting data on boater s perceptions and typical expenditures. On average, boaters surveyed indicated average expenditures of $340 per day. For power boaters only, 40 percent stated they spent $500 to $700 per day including fuel and dockage while approximately 25 percent indicated they spent $100 to $200 per day. Of those surveyed, only six to eight percent indicated they had docked previously at either Roanoke Island or Hatteras Island. The economic analysis portion of the study summarized previous work including a 1994 study of the Pirates Cove II-48
80 Big Game tournaments which looked at visitor expenditures on fuel, supplies, lodging, meals, shopping, and entertainment. For the summer tournaments, it was determined that average expenditures per boat per day ranged from $1,100 to $1,500. There were on average six people per boat. For the fall tournaments, expenses per boat per day ranged from $750 to $1,000. In May 2005, Herstine, Dumas and Whitehead (2006) surveyed private (not charter or head boats) recreational boaters utilizing the AIWW in North Carolina. The survey instrument was designed to solicit responses from both transient and local recreational boaters along the AIWW in North Carolina regarding their frequency of use of the AIWW, economic data regarding expenditures while using the AIWW and, the impact that dredging or the lack of dredging of the AIWW and its associated shallow draft inlets would have on their future use of the AIWW. Survey administration began in June 2005 and concluded in late November 2005 at multiple locations from the Virginia North Carolina border in Currituck County to the North Carolina South Carolina border in Brunswick County. The survey administration locations in North Carolina along the AIWW included Coinjock (Currituck), the Dismal Swamp Visitors Center (Currituck), Belhaven (Beaufort), Oriental (Pamlico), Beaufort (Carteret), Morehead City (Carteret), Atlantic Beach (Carteret), Swansboro (Onslow), Scott s Hill (Pender), Wrightsville Beach (New Hanover), Carolina Beach (New Hanover), and Southport (Brunswick). Approximately 1,400 field surveys were collected and 250 mail surveys. Two general categories of economic results were presented, consumer surplus and economic impacts. Consumer surplus estimates measure the value of the AIWW recreational boating experience to the boaters themselves. Economic impacts measure the economic effects of the boaters spending on businesses, employment, wages, and government tax revenues. Consumer surplus estimates were provided for North Carolina resident and non-north Carolina resident (transient) boaters. The changes in consumer surplus resulting from changes in AIWW navigability were also estimated. Economic impacts were calculated for three coastal North Carolina regions (northern, central and southern) and for the state as a whole. Changes in economic impacts resulting from changes in AIWW navigability were estimated. Data from this survey are used in the economic analysis presented below. b) Current Estimate of Private Recreational Boating Value This study focuses on that portion of private recreational boating that uses the ocean inlets of North Carolina. For analysis purposes, this private boating activity is divided into two categories: private boating that has ocean recreational fishing as a primary purpose, and private boating that has non-fishing recreational activity as a primary purpose. For the ocean fishing component of private recreational boating, the number of private boat recreational ocean fishing angler trips taken in North Carolina in 2015 was obtained from the National Marine Fisheries Service (NMFS 2016b). This number include only II-49
81 those private boaters who fish and use an ocean inlet to access the ocean; the number excludes private boat anglers who fish in the AIWW. This total number of statewide angler trips is distributed across counties and inlets in proportion to charter passenger fees paid. Lovell et al. (2013) provided private boater spending data per angler trip in North Carolina in 2011, by spending category. These values were adjusted for inflation to These expenditure data include private boater spending in North Carolina on parking, gasoline, restaurants, groceries, ice, bait, shopping, and ferry. Lovell et al. provide separate spending values for state-resident and non-resident boaters. The percent of non-nc resident private boat anglers was obtained from a NCDMF coastal angler intercept survey conducted in 2015 (NCDMF 2016). Private boater spending on lodging was dropped from the analysis to avoid double-counting with beach tourism spending on lodging, which includes lodging expenditures of all beach area visitors. The analysis assumes 38 average private boat fishing trips per year per angler for NC residents and 12 trips per year for non-nc residents (Herstine et al. 2006). Consumer surplus per private boat angler (not per trip) per year is $90/yr for NC residents and $99/yr for non- NC residents in 2005 (Herstine et al. 2006). These consumer surplus values are adjusted for inflation to 2015 for use in this analysis. For the non-fishing private boating ocean trips, economic impacts per trip and consumer surplus estimates per trip were developed using the same data sources and methodology used for private boaters who fish. The number of non-fishing private boating ocean trips ("N" in the formulas below) was estimated based on the number of fishing private boating trips (NMFS 2016), the percentages of out-of-state resident private boaters by county (NCDMF 2015), and the percentages of NC-resident and out-of-state private boaters who fish (Herstine et al. 2006), according to the following formulas: T = total NC private boat ocean trips (determined by formulas below) F = NC fishing private boat ocean trips (given value from preceding analysis of private boaters who fish) N = NC non-fishing private boat ocean trips (determined by formulas below) R = percentage of total NC private boat trips made by NC residents (given, countyspecific values from NCDMF 2015) 0.06 = percentage of NC private ocean boat trips that fish, NC residents (given, from Herstine et al. 2006) 0.19 = percentage of NC private ocean boat trips that fish, NC non-residents (given, from Herstine et al. 2006) By definition, F = 0.06*R*T *(1-R)*T Hence, T = F / [0.06*R+ 0.19*(1-R)] Thus, N = T - F Estimates of total direct spending by private boaters (both fishing and non-fishing boaters combined) per year by county are presented in Table II-62 for II-50
82 The direct expenditures of private boaters were partitioned by expenditure category (fuel, engine repair, restaurants, shopping, etc.) and entered into county-level economic input-output models to estimate the county-wide economic multiplier effects (IMPLAN Group 2014). The input-output models provided estimates of annual total business sales (also known as economic output or business activity) and employment supported in each county by the expenditures of private boaters. Estimates of total business sales (including multiplier effects) and employment supported by private boating for 2015 and are presented in Table II-62. Private boaters also enjoy "consumer surplus" value during boating trips. Consumer surplus is the value to the recreationist of the recreation experience itself, value beyond the expenditures made in order to gain access to the experience. For example, if a boater would have been willing to pay $300 for a private boating trip but ends up spending only $100, then the consumer surplus is the difference of $200. Herstine et al. (2007) found that North Carolina resident private boaters enjoy an average consumer surplus of $90 per year (not per trip), and non-resident private boaters enjoy consumer surplus of $99 per year. After adjust for inflation to year 2015, these annual per boater consumer surplus values were multiplied by the estimated number of boaters (calculated by dividing the number of private boater trips per year by the average number of trips per boater per year, accounting for differences in trips per boater for NC-residents and non-residents) to obtain estimates of aggregate consumer surplus supported by ocean inlet-using private boating. The aggregate consumer surplus was then allocated to individual counties and inlets in proportion to direct spending. These consumer surplus estimates are presented in Table II-62 for Local, State, and Federal Tax revenue pertaining to private recreational boating for 2015 was also compiled and presented in Table II-62. Local tax revenue consists of sales tax and property tax. State tax revenue includes sales tax, payroll tax, corporate profits tax, and personal income tax. Federal tax revenue includes payroll tax, corporate profits tax, and personal income tax, and excise and import taxes. Region Table II-62. Regional Private Recreational Boating (Fishing and non-fishing) Values County Private Boating: Direct Impact Expenditures (2015) Private Boating: Total Impact Output/Sales/ Business Activity Private Boating: Total Impact Employment (2015) Private Boating: Total Local Tax Revenue Private Boating: Total State Tax Revenue Private Boating: Total Federal Tax Revenue Private Boating: Annual Consumer Surplus (2015) (2015) (2015) (2015) (2015) 1 Brunswick $8,096,145 $15,826, $711,394 $676,644 $1,347,635 $444,417 2a New Hanover $6,818,450 $15,757, $600,102 $578,963 $1,259,790 $334,278 2b Pender $636,932 $965, $56,510 $50,724 $78,837 $31,840 2b Onslow $4,531,687 $6,866, $411,954 $350,110 $560,611 $237,817 2c, 3a Carteret $16,890,990 $34,062, $1,538,620 $1,515,059 $2,724,400 $914,525 3b Hyde $2,118,716 $3,424, $175,915 $163,236 $262,891 $138,434 3b, 4a, 4b Dare $35,983,667 $75,640, $2,737,458 $2,814,916 $6,377,792 $3,352,767 4c Currituck $3,998,185 $7,309, $343,837 $342,535 $620,644 $372,530 Total $79,074,771 $159,853,665 1,997 $6,575,790 $6,492,187 $13,232,600 $5,826,607 II-51
83 4. Value of Coastal Boat Building a) Background and Past Studies In 2012, the U.S. ship and boat building industry included approximately 1600 active companies with 131,400 employees earning over $7.3 billion in wages (USCB 2012). North Carolina coastal boat builders produce vessels ranging from small kayaks and canoes costing a few hundred dollars to large recreational yachts costing several million dollars. North Carolina has a unique brand reputation for building rugged, high-quality, custom sport fishing vessels, "tested in the rough waters of the world-famous sport fishing grounds off the Outer Banks." The cost of land with water access in North Carolina that can be used for building sites is competitive relative to the industry average, and North Carolina's long boat building heritage supports a relatively large workforce with specialized boat building skills and experience. The boat building industry in North Carolina grew rapidly since 1990, with a downturn following the recent recession. Coastal boat builders use the coastal waterways, inlets, and offshore ocean areas to test new boat designs and demonstrate vessel capabilities to potential customers. In Dare County in particular, for builders located in Wanchese and Manteo, "testing vessels in the rough waters off Cape Hatteras" is part of their brand value, and losing access to Oregon Inlet and Hatteras Inlet could have significant impacts on brand value. This study identified 53 boat builders currently operating in the coastal North Carolina region (boat builders located west of Pitt County are not included in this analysis). Boat builders were identified from several sources: NC Dept. of Commerce--AccessNC EDIS Business Search Results, NC Dept. of Commerce--Labor & Economic Analysis Division "Demand Driven Data Delivery System," Builders, North Carolina, the 2012 IMPLAN software database of county-level industry data, county economic development agencies, county Chambers of Commerce member directories, general web searches for "<NC county name> boat builder". b) Current Estimate of Boat Building Values Data on the direct sales of the boat building industry and direct employment by boat builders by county were obtained from the bulleted list of sources above. Direct sales and employment were then allocated to waterway segments and inlets based on proximity. These data are presented in Table II-63 for II-52
84 County-level direct expenditures were then entered into county-level economic inputoutput models to estimate the county-wide economic multiplier effects of the direct expenditures (IMPLAN Group 2014). The input-output models provide estimates of total business sales (also known as economic output or business activity) and employment supported in each county by the direct sales of boat builders. The estimates of total business sales and employment supported are presented in Table II-63 for Local, State, and Federal Tax revenue pertaining to coastal boat building for 2015 was also compiled and presented in Table II-63. Local tax revenue consists of sales tax and property tax. State tax revenue includes sales tax, payroll tax, corporate profits tax, and personal income tax. Federal tax revenue includes payroll tax, corporate profits tax, and personal income tax, and excise and import taxes. Region County Number of Firms Table II-63. Regional Coastal Boat Building Values Boat Building: Direct Impact Sales (2015) Boat Building: Total Impact Output/Sales/ Business Activity (2015) Boat Building: Direct Impact Employment (2015) Boat Building: Total Impact Employment (2015) Boat Building: Total Local Tax Revenue (2015) Boat Building: Total State Tax Revenue (2015) Boat Building: Total Federal Tax Revenue (2015) 1 Brunswick 3 $16,122,642 $24,377, $527,742 $485,598 $1,246,796 2a New Hanover 4 $2,779,766 $5,172, $118,123 $107,232 $288,281 2b Pender 2 $6,949,415 $8,601, $119,620 $115,027 $329,180 2b Onslow 1 $5,559,532 $6,881, $39,806 $92,021 $263,344 2c, 3a Carteret 16 $70,050,102 $105,916, $2,292,950 $2,109,839 $5,417,114 3b Hyde 0 $0 $0 0 0 $0 $0 $0 3b, 4a, 4b Dare 11 $108,410,872 $174,251, $3,433,372 $3,219,478 $9,065,317 4c Currituck 1 $1,389,883 $2,233, $44,018 $41,275 $116,222 Total 38 $211,262,212 $327,436, ,811 $6,575,632 $6,170,470 $16,726, Value of Coastal Marinas a) Background and Past Studies North Carolina's coastal marinas support private boating and charter and head boat fishing. Marinas provide access to waterways and the ocean by providing boat ramps for smaller vessels and "haul out" crane services for larger vessels. Marinas provide fuel, boat slip rentals ("wet slips") and warehouse boat storage ("dry slips"). Marinas also provide "transient slip" space along their docks where boaters making overnight trips along waterways can rent dockage space for the night. Portions of the economic impacts and benefits of marina activity, such as portions of marina fuel sales, wet slip rentals, and transient slip rentals, are captured in the economic impact estimates of the private boating and charter and for-hire fishery sectors described in other sections of this report. Separating the economic impacts of marinas from the economic impacts of the fishing sectors is complex and beyond the scope of this report. Estimates of the economic impacts of marina activity are provided here with the caveat that there is overlap between the marina impact estimates and the estimated impacts of private boating and charter and for-hire fishing. II-53
85 b) Current Estimate of Coastal Marina Values In the 2009 BIMP, the direct sales/output and employment of marinas was based on the list of marinas in the N.C. Wildlife Resources Commission's N.C. Coastal Boating Guide, supplemented with additional marinas discovered in an extensive survey of N.C. marinas conducted in 2008 (Dumas 2009). Dumas (2009) conducted a survey of all coastal North Carolina marinas in to determine the economic impacts of the coastal marina industry in the state. The survey collected information on the numbers of wet slips and dry slips, their rental prices and percentage occupancies, numbers of full and part-time employees, numbers of transient boat visits and fees per visit, number of haul-outs and haul-out fees, and marina operational costs. There were 121 marinas listed in the guide and an additional 182 discovered in the Dumas survey, for a total of 303 marinas reported in the 2009 BIMP report. Data on marina sales and employment collected from the Dumas marina survey were used to estimate sales and employment for all 303 marinas. In the 2009 BIMP, the marinas in several interior coastal counties were aggregated with the marinas in ocean-adjacent counties under the assumption that boats from these interior counties wishing to access the ocean would use the nearest inlet in an ocean-adjacent county. In the 2009 BIMP, Carteret County includes Craven County and Pamlico County. Dare County includes Camden, Chowan, Pasquotank, Perquimans, Tyrrell and Washington Counties. Hyde County includes Pitt and Beaufort Counties. Multiplier effects and taxes association with marina output/sales were not provided in the 2009 BIMP, because the economic impacts of marina use by ocean inlet-accessing vessels are included in the economic impact numbers for commercial, charter, head boat and private boat fishing. Marina direct sales/output and employment were presented for informational purposes only. For the 2016 BIMP, the N.C. Wildlife Resources Commission's 2016 N.C. Coastal Boating Guide lists 132 marinas along the N.C. coast. There is no supplementary marina survey for 2016 to identify additional marinas not included in the Guide, so the total number of N.C. marinas is estimated using the ratio of total marinas to the number of marinas inn the Guide from 2008 (303/121 = 2.504), producing an estimate of 331 coastal N.C. marinas in These 331 marinas are assumed to be distributed across counties in proportion to the distribution of the 132 marinas listed in the 2016 Guide. Of these 331 marinas, 213 are located in the eight coastal counties. Direct marina sales/output and employment in 2015 in each county are based on the 2008 values, scaled in proportion to the change in the number of marinas in each county between 2008 and 2016, and with sales/output adjusted for inflation. Data on the numbers of marinas and estimates of direct marina sales and employment for the eight coastal counties for 2015 are presented in Table II-64. For the 2016 BIMP, marinas are reported by county with no aggregation of counties to provide more detail on marina location. The marina data and estimates are not allocated to particular inlets because it is assumed that a substantial amount of marina business activity would II-54
86 continue in the event of inlet closure--as long as access to the AIWW, sounds and bays were maintained, smaller vessels (less than 30 feet in length) and some larger vessels could still access significant estuarine water areas for recreation and in-shore fishing. However, loss of inlet access would likely cause nearby marinas to lose their many of their for-hire fishery tenants with vessels larger than 30 feet in length, but these impacts are captured in the analysis of the for-hire fishery sector. As was the case in the 2009 BIMP, multiplier effects and taxes association with marina output/sales are not provided in the 2016 BIMP, because the economic impacts of marina use by ocean inlet-accessing vessels are included in the economic impact numbers for commercial, charter, head boat and private boat fishing. Marina direct sales/output and employment are presented for informational purposes only. Region E. Economic Impact Scenarios Table II-64. Regional Coastal Marinas Values County 1. Economic Impacts of Beach Width Loss a) Background and Past Studies Number of Marinas (2015) Marinas: Direct Impact Sales (2015) Marinas: Direct Impact Employment (2015) 1 Brunswick 23 $7,659, a New Hanover 48 $15,891, b Pender 7 $2,308, b Onslow 14 $4,580, c, 3a Carteret 85 $28,140, b Hyde 4 $1,154, b, 4a, 4b Dare 29 $9,647, c Currituck 3 $989, Total 213 $70,372,449 1,586 Beach recreationists may derive more enjoyment from a nourished beach with a wide, gentle slope and low crowding (more space per person) than they would from a narrow, eroded beach, typically with a high escarpment (sand cliff) and high crowding (less space per person). Although researchers have used standard travel cost methodology (Hanemann 1978; Bockstael et al. 1987; Bell and Leeworthy 1990; and Parsons and Kealy 1992) to value beach recreation, until recently "few, if any, travel cost models have been II-55
87 applied specifically to beach nourishment valuation problems" (National Research Council 1995). In addition to the existing travel costs studies, contingent valuation (CV) methodology has been used to value beach recreation (e.g., King 2002), and a few CV studies have examined the incremental value attributable to beach nourishment. McConnell (1977) and Bell (1986) find that the economic value of beach recreation per person increases with increasing beach width. These authors attribute this result to the reduction in crowding associated with wider beaches. Silberman et al. (1992) found that both users and non-users of New Jersey beaches have existence values for non-eroded beaches. Although existing travel cost studies estimate the impacts of changing travel costs on beach visits, and although existing contingent valuation studies estimate the impact of changing beach width on beach recreation value for tourists already on the beach, until recently only one existing study investigates the impact of renourishment on the number of beach visits. Silberman and Klock (1988) find that renourishment of New Jersey beaches in the mid- 1980's increased tourist visits to the renourished beach while decreasing visits to nearby, substitute beaches. The net number of visits to all beaches increased with renourishment. Gopalakrishnan et al. (2016) provide a good review of the recent economic literature on the recreational value of beach nourishment; the discussion below relies heavily on this review. Huang et al. (2007) examine beach nourishment in New Hampshire and Maine via a choice experiment survey. They consider the preservation of a sandy beach that varies from one to four miles. They estimate that each beach mile saved is valued at about $4 annually per person. Huang et al. (2011) combine the same survey data with revealed preference trip frequency data. They find that willingness to pay for an erosion control program that would avoid an annual 10 feet of beach erosion ranges from $22 to $42 per beachgoer. Whitehead et al. (2008a) studied beach recreation demand for southern North Carolina beaches using data from a 2003 survey. The study provided estimates of the changes in recreation demand that might occur with beach nourishment and parking improvements necessary to satisfy the requirements for USACE cost-share. The number of beach trips made by each survey respondent to any of the beaches in the study region in 2003 was elicited by asking how many of the respondents oceanfront beach trips were made to beaches along the southern North Carolina coast from the Beaufort/Morehead City (Carteret County) to the South Carolina border (Brunswick County). The responses include both day and night trips, although most were day trips, as all telephone survey respondents lived within 120 miles of the beach study area. The average annual number of trips per year per respondent was 11. Respondents who planned to take at least one oceanfront beach trip to the southeastern North Carolina coast during 2004 were asked how many trips they intended to take. The average number of planned trips in 2004 with current access and width conditions is 13. Respondents were asked about their II-56
88 perceptions of current beach access and parking quality. Respondents were told that the width of the dry sand beach area from the dune to the ocean at high tide at southeastern North Carolina oceanfront beaches is between 10 and 100 feet with an average of 75 feet Sixty-nine percent of respondents think that the current beach width conditions are either good or excellent. The following beach nourishment policy was then presented to respondents: Suppose a beach nourishment policy is implemented for all southeastern North Carolina oceanfront beaches. Beach nourishment would be performed in each county periodically, at least once every three to five years, for the 50-year life of the project. Periodic nourishment is done to maintain an increased beach width to provide shore protection and recreation benefit. The goal would be to make the average beach width increase by 100 feet The respondents were split on whether beach nourishment is the right beach management option. Forty-four percent of respondents think that adding 100 feet of width to the beaches would be the right amount, 21 percent think that the current beach width is fine, and 18 percent think that people should not alter the width of the beach. Fifty-eight percent of respondents either strongly supported or supported the beach nourishment policy. Eighty-five percent of respondents think that the beach nourishment policy would be an effective means of maintaining beach width. The average number of beach trips with the nourishment policy is 14. Model results indicated that nine beach trips are predicted per season under status quo beach conditions and 10 trips are predicted with increased beach width. The baseline consumer surplus estimates were about $90 per trip; this is an estimate of the value of the recreation experience to the beachgoer. The increase in consumer surplus per trip with the increase in beach width is about $7. An additional average of 100 feet in beach width maintained by periodic beach nourishment every 3 to 5 years increases annual recreation value from $79 to $106.The average beach length in this study is 4.63 miles. The average value per foot of beach width for each mile of beach is $0.17 to $0.23 per mile. The average consumer surplus per-trip estimates in the Whitehead et al. study ($90) are high relative to those in the single-site beach valuation literature. For example, Bin et al. (2005) estimated that the value of a day trip to individual North Carolina beaches ranges from $11 to $80. This may be due to the aggregation of a large number of beaches into a single recreation site (e.g. southeastern NC beaches) in the Whitehead et al. (2008) study. Landry & Liu (2009) use the data from Whitehead et al. (2008) to estimate nonparametric revealed and stated preference models of beach trip frequency. They find that beach width increases recreation trips in only two of six econometric models. Landry & Liu (2011) extend this analysis to several other parametric models and find that the beach width scenario increases recreation trips in three of four models. II-57
89 Pendleton et al. (2012) estimate a travel cost model for Southern California beaches and find that beach visits increase with beach width nonlinearly, and values differ across individual activity categories. This study of west coast beaches will not be pursued further here. Parsons et al. (2013) use beach trip frequency data to estimate the value of reducing beach width by 75% and doubling width for Delaware Bay beaches. Willingness to pay to avoid the loss of beach width is $5 and $13 per trip for day-trippers and overnighters, respectively. The willingness to pay for a doubling of beach width is $3 and $7 per trip for day-trippers and overnighters. Whitehead et al. (2010) examine beach recreation using multiple-site data, exploiting the existing variation in beach width across North Carolina beaches. The value of a 100-feet increase in beach width across all sites in the study area is estimated. The range of annual willingness to pay per beachgoer for the 100-feet increase in width is $136 to $397. The average value per foot of beach width is $0.29 to $0.86 for each mile of beach per beach recreationist. In addition, respondents are estimated to take one extra trip per season as a result of the 100-feet increase in beach width. Bin et al. (2007) considered the economic impacts on beach recreation of a 50 foot beach width reduction at central and southern North Carolina beaches (i.e., Carteret, Onslow, Pender, New Hanover and Brunswick County beaches). The initial and final widths of the beaches considered in the Bin et al. study are presented in Table II-65. II-58
90 Table II-65. Baseline 2004 Beach Widths and Width Losses in the Bin et al. (2007) Analysis County Beach Average After ft loss Percentage Loss In Width Carteret Fort Macon % Carteret Atlantic Beach % Carteret Pine Knoll Shores % Carteret Indian Beach / Salter Path % Carteret Emerald Isle % Onslow-Pender North Topsail Beach % Onslow-Pender Surf City % Onslow-Pender Topsail Beach % New Hanover Wrightsville Beach % New Hanover Carolina Beach % New Hanover Kure Beach % New Hanover Fort Fisher % Brunswick Caswell Beach % Brunswick Oak Island % Brunswick Holden Beach % Brunswick Ocean Isle Beach % Brunswick Sunset Beach % Although not used in the present analysis, Landry and Allen (2016) provide evidence of the effects of beach width on property values for northern North Carolina beaches. Landry and Allen consider the effects of beach width and proximity to shore on the values of houses and vacant lots located in Dare County, NC, in This year was chosen for two reasons. First, good aerial photography data of the beaches exist for this year, and second, no beach renourishment occurred before this year, which allows a separation of the effects of beach width and the effects of expected beach renourishment on house and lot values. Minimum beach width in the dataset was 53 feet, maximum width was 444 feet, and mean width was 160 feet. The results suggest that beach width affects the values of houses and vacant lots that are within 1000 to 2000 feet of the shoreline. House prices decrease by an average of $2.82 per foot of distance from the shoreline. The value of an oceanfront house is on average $61,650 larger than the value of a similar house that is the same distance to the shoreline but is not oceanfront. The value of beach width falls from $824 per house per foot of beach width for oceanfront homes, to $115 per house per foot of beach width for houses located 700 feet from the shoreline, to $43 per house per foot of beach width for houses 1400 feet from ocean. Vacant lot prices decrease by an average of $5.16 per foot of distance from the shoreline. The value of oceanfront lots II-59
91 is on average $99,200 higher than similar lots the same distance to the shoreline that are not oceanfront. b) Scenario Analysis To investigate the potential impacts of beach loss in coastal North Carolina, a scenario was considered in which approximately 50 percent of current beach width is lost due to erosion. This scenario was investigated to determine the potential economic impact of not maintaining the current beach widths in North Carolina. A reduction in beach width would affect primarily beach recreation and shore-based fishing. Because the ocean would not reach structures under a 50 percent beach width loss scenario, no structures would be lost. Some structures might decline in value due to (1) increased risk of loss during storms due to a narrower beach buffers or (2) fewer years remaining until the ocean reaches beach front structures for given beach erosion rates. Marine recreation services would not be significantly affected because they involve use of waterways, estuarine marshes, waves, etc., instead of the beach itself, and these resources would remain intact after the reduction in beach width considered here. It is assumed that the reduction in beach width occurs in the near future. If the reduction were to occur many years in the future, then any impacts would need to be adjusted for population growth, changes in beach recreation and shore fishing participation, trips per household and value per trip, and the present values of the resulting estimates would need to be calculated using an appropriate discount rate. As shown in Table II-66, the range of beach widths considered in the Bin et al. (2007) analysis is similar to the range of beach widths considered in the present 2016 analysis. Beach Width Statistics Table II-66. Beach Width Values Bin et al. (2007) Values (ft) BIMP 2009 Analysis Values (ft) BIMP 2016 Analysis Values (ft) mean max min median A 50-foot beach width reduction from the mean beach width (129.5 feet) in the Bin et al. (2007) study would leave a mean beach width of 79.7 feet. A 50 percent reduction from the mean beach width (178.5 feet) in the present 2016 analysis would leave a mean beach width of feet. In the Bin et al. study the mean loss in width is 47 percent, and the median loss in width is 45 percent, similar to the 50 percent loss in width desired for the present analysis. Therefore, for the purpose of this analysis, it is assumed that the II-60
92 economic impacts of the 50 feet beach width reduction in the Bin et al. study serve as a good approximation of the economic impacts of a 50 percent beach width reduction based on the current 2016 beach width data. Based on the Bin et al. (2007) analysis, a 50 percent reduction in beach width from the baseline widths used in this study would cause an estimated percent reduction in beach trips and beach recreation-related business sales/output and employment. Fewer beach trips are made due to reduced enjoyment of trips resulting from narrower, more crowded and congested beaches. Consumer surplus associated with beach recreation falls by an estimated percent. Reductions in consumer surplus occur due to reduction in beach trips and reductions in satisfaction from remaining trips due to more crowded and congested conditions. Applying these percentage reductions to the estimated baseline beach recreation business sales, employment and consumer surplus values by beach location produces the beach recreation loss estimates presented in Table II-67. Consumer surplus arising from shore fishing would fall by an estimated three percent, as some shore fishing would continue from a narrower, less enjoyable beach, and some shore fishing would move to piers, bridges and jetties that provide substitute, albeit less enjoyable, fishing locations to anglers who prefer fishing from a wider beach. Applying this percentage reduction to the estimated baseline values of shore fishing consumer surplus by beach produces the shore fishing value loss estimates presented in Table II-67. A 50% reduction of beach width equates to a loss of $524 million, 6,074 jobs, and $15.3 million in consumer surplus. II-61
93 Region County Beach Beach Recreation: Total Impact Output/Sales/ Business Activity ( ) Beach Recreation: Total Impact Employment ( ) Table II-67. Beach Recreational Loss and Shore Fishing Loss Estimates Beach Recreation: Annual Consumer Surplus ( ) Shore/Bank Fishing: Annual Consumer Surplus ( ) 50% Beach Width Reduction (based on Bin et. al. 2007) Beach Recreation Loss in Total Impact Output/Sales/ Business Activity ( ) 50% Beach Width Reduction (based on Bin et. al. 2007) Beach Recreation Loss in Total Impact Employment ( ) 50% Beach Width Reduction (based on Bin et. al. 2007) Beach Recreation Loss in Annual Consumer Surplus ( ) 50% Beach Width Reduction (based on Bin et. al. 2007) Shore/Bank Fishing Loss in Annual Consumer Surplus ( ) 4c Currituck Corolla $569,356,701 6,528 $9,473,122 $262,994 $89,502,873 1,026 $1,546,014 $7,890 4a Dare Avon $132,467,215 1,487 $1,890,245 $922,167 $20,823, $308,488 $27,665 4a Dare Buxton $35,764, $510,344 Incl. in Hatteras Island $5,622, $83,288 Incl. in Hatteras Island 4b Dare Duck/Sanderling $277,214,126 3,112 $3,955,716 $49,345 $43,578, $645,573 $1,480 4a Dare Frisco $36,225, $516,915 Incl. in Hatteras Island $5,694, $84,361 Incl. in Hatteras Island 3b Dare Hatteras Island $49,221, $702,362 $4,985,733 $7,737, $114,626 $149,572 3b Dare Hatteras Village $18,931, $270,139 Incl. in Hatteras Island $2,975, $44,087 Incl. in Hatteras Island 4b Dare Kill Devil Hills $233,007,222 2,615 $3,324,904 $560,195 $36,628, $542,624 $16,806 4b Dare Kitty Hawk $96,549,106 1,084 $1,377,711 $60,329 $15,177, $224,842 $1,810 4b Dare Nags Head/Bodie Island $393,410,745 4,416 $5,613,787 $5,490,770 $61,844, $916,170 $164,723 4a Dare Rodanthe/Pea Island $61,091, $871,747 $1,381,108 $9,603, $142,269 $41,433 4a Dare Salvo $56,640, $808,228 $883,384 $8,903, $131,903 $26,502 4b Dare Southern Shores $79,204, $1,130,205 $62,398 $12,450, $184,449 $1,872 4a Dare Waves $39,602, $565,102 Incl. in Salvo. $6,225, $92,225 Incl. in Salvo. 3b Hyde Ocracoke $42,852, $792,153 $81,875 $6,736, $129,279 $2,456 2c Carteret Ft. Macon $3,763, $1,005,603 $2,439,002 $591,559 9 $164,114 $73,170 2c Carteret Atlantic Beach (not incl Ft. Macon) $58,655, $3,512,320 $211,401 $9,220, $573,211 $6,342 2c Carteret Pine Knoll Shores $16,509, $611,291 $220,065 $2,595, $99,763 $6,602 2c Carteret Salter Path / Indian Beach $13,220, $492,298 $63,680 $2,078, $80,343 $1,910 2c Carteret Emerald Isle $205,221,971 2,561 $7,713,156 $573,122 $32,260, $1,258,787 $17,194 2b Onslow North Topsail Beach $38,129, $2,429,707 $1,771,077 $5,993, $396,528 $53,132 2b Pender Topsail Beach $29,754, $1,010,145 $12,928 $4,677, $164,856 $388 2b Pender Surf City $40,876, $2,463,067 $890,431 $6,425, $401,973 $26,713 2a New Hanover Wrightsville Beach $233,470,357 2,781 $15,719,184 $607,596 $36,701, $2,565,371 $18,228 2a New Hanover Carolina Beach $174,792,670 2,087 $11,212,324 $47,401 $27,477, $1,829,851 $1,422 2a New Hanover Kure Beach $57,551, $3,025,882 $607,596 $9,047, $493,824 $18,228 2a New Hanover Ft. Fisher Incl. in Kure Beach. $0 0 $0 Incl. in Kure Beach. 1 Brunswick Bald Head Island $45,046, $758,539 N/A $7,081, $123,793 N/A 1 Brunswick Caswell Beach $13,182, $615,518 Incl. in Oak Island. $2,072, $100,453 Incl. in Oak Island. 1 Brunswick Holden Beach $80,433, $2,335,373 $202,532 $12,644, $381,133 $6,076 1 Brunswick Oak Island $64,807, $1,580,802 $320,179 $10,187, $257,987 $9,605 1 Brunswick Ocean Isle Beach $97,695,619 1,139 $2,383,031 $157,359 $15,357, $388,911 $4,721 1 Brunswick Sunset Beach $41,066, $1,001,702 $56,093 $6,455, $163,478 $1,683 Total $3,335,713,884 38,642 $89,672,622 $22,920,759 $524,374,222 6,074 $14,634,572 $687,623 II-62
94 2. Economic Impacts of Inlet Shoaling To investigate the potential economic impacts of reduced dredging and increased shoaling in selected shallow-draft inlets in North Carolina, a scenario was considered in which six shallow-draft inlets were allowed to shoal to half of their current actual depths (not authorized depths). The six inlets and their authorized, current actual and reduced depths under the scenario are presented in Table II-68. Table II-68. Inlet Shoaling Scenario Depths Region County Inlet Name Authorized Current Actual Reduced Depth Depth Depth Under Scenario 3b Hyde Ocracoke c Carteret Barden c Carteret Bogue b Pender New Topsail a New Hanover Carolina Beach Brunswick Lockwoods Folly Economic impacts would occur in two primary categories, commercial fishing and for-hire (charter and head boat) fishing. A basic assumption used to estimate impacts is that inlets with three and a half feet or less in water depth are unnavigable for all commercial and for-hire fishing vessels, and those inlets with 3.5 to 6 feet in water depth will be unnavigable for many commercial and for-hire fishing vessels greater than 30 feet in length. a) Impacts on Commercial Fishing For commercial fishing vessels, the impacts of reduced inlet depths depend on whether fishing is done inside the barrier islands (e.g., trawling for shrimp, setting and retrieving crab pots) in sounds and waterways or outside the barrier islands in the ocean. The proportion of fishing done inside barrier islands varies along the coast. If selected inlets lose depth but remain open to fish passage, impacts on fishing activity inside the barrier islands may be relatively small. However, because fishing vessels are relatively large and generally require more than four feet of depth, impacts on ocean-going commercial fishing may be significant. If inlets shoal to four feet or less, it is assumed that oceangoing commercial fishing vessels may either (1) go out of business, (2) travel longer distances to other inlets before reaching the ocean (increasing fuel costs, decreasing ocean fishing time, and decreasing profits), or (3) change ports. Detailed cost and operational information is not available for commercial fishing vessels in all locations along the North Carolina coast. As a result, it was not possible to determine precisely II-63
95 what proportion of the vessels at a given port would select each of the three possible courses of action. For the purposes of this analysis, simplifying assumptions were made based on the general types of fishing done at each port and general estimates of commercial fishing vessel travel speeds and fuel requirements. The depth of Ocracoke Inlet (Hyde County) is 5 feet under the shoaling scenario. An estimated 20 percent of commercial fishing vessels using Ocracoke Inlet are greater than 30 feet in length. For the purposes of this analysis, it is assumed that 25 percent of the commercial fishing vessels greater than 30 feet in length go out of business, and 75 percent of these vessels shift operations to the sound or Oregon Inlet and remain in business. The depth of Barden Inlet (Carteret County) is only 3 feet under the shoaling scenario. For the purposes of this analysis, it is assumed that inlet shoaling would result in one third of all commercial fishing vessels based in Harkers Island, Gloucester, and Marshallberg going out of business, with the remaining vessels either relying on sound-based fishing or using Beaufort Inlet (Carteret County) with increased fuel expenses. The depth of Bogue Inlet (Carteret County) is only 2.5 feet under the shoaling scenario. For the purposes of this analysis, it is assumed that inlet shoaling would result in half of all commercial fishing vessels in Swansboro, Cape Carteret, and Cedar Point going out of business and half of the vessels moving to Morehead City where they would operate with profitability similar to that earned in the Bogue Inlet area. The depth of New Topsail Inlet (Pender County) is 4 feet under the shoaling scenario. An estimated 20 percent of the commercial fishing vessels are greater than 30 feet in length. For the purposes of this analysis, it is assumed that half of the commercial fishing vessels greater than 30 feet in length would go out of business under the shoaling scenario and half would move to either Sneads Ferry or Wrightsville Beach (New Hanover County) where they would operate with profitability similar that earned while operating though New Topsail Inlet. The depth of Carolina Beach Inlet (New Hanover County) is 3.5 feet under the shoaling scenario. For the purposes of this analysis, it is assumed that half of all commercial fishing vessels would go out of business under the shoaling scenario and half of the fleet would move operations to the ports of Wrightsville Beach (New Hanover County) or Calabash (Brunswick County) where they would operate with a similar level of profitability. The depth of Lockwood Folly Inlet (Brunswick County) is 2 feet under the shoaling scenario. For the purposes of this analysis, it is assumed that inlet shoaling would result in half of all commercial fishing vessels going out of business and half moving operations to Calabash. It is assumed that those vessels moving to Calabash would be able to operate II-64
96 at a level of profitability similar to that enjoyed when operating in the Lockwood Folly area. Economic impacts of changes in commercial fishing activity in terms of reductions in annual total (including multiplier effects) business sales, commercial fishing employment and other employment are presented in Table II-69. Region County Inlet Name Authorized Depth Table II-69. Shoaling Impacts on Commercial Fishing Current Actual Depth Reduced Depth Under Scenario 3b Hyde Ocracoke c Carteret Barden c Carteret Bogue b 2a Pender New Hanover New Topsail Carolina Beach 1 Brunswick Lockwoods Folly Commercial Fishing Qualitative Impacts Description 1/4 Hyde Co.commercial fishing vessels >= 30 ft out of business; 3/4 of vessels >= 30 ft assumed sound-based or move to Oregon Inlet area lose 1/3 all commercial fishing based in Harkers Island, Gloucester, Marshallberg. ( This area is 16% of Carteret County commercial fishing landed value.) 2/3 remainder assumed sound-based or uses Beaufort Inlet at increased fuel cost 1/2 all vessels out of business, 1/2 move to Morehead 1/2 vessels >= 30 ft out of business, 1/2 vessels >= 30 ft move to either Sneads Ferry or Wilmington/Wrightsville Beach 1/2all vessels out of business, 1/2 move to Wilmington/Wrightsville Beach or Calabash 1/2 all vessels out of business, 1/2 vessels move to Calabash Commercial Fishing Quantitative Impacts Business Output/ Sales Lost Commercial Fishing Quantitative Impacts Captain/Crew Jobs Lost Commercial Fishing Quantitative Impacts Other Jobs Lost $284, $1,607, $1,747, $208, $1,039, $529, b) Impacts on For-Hire Fishing Impacts of inlet shoaling on the for-hire fishery vary by vessel size. For larger vessels, the impacts could be substantial for vessel operating through affected inlets. If inlets shoal to a depth less than 4 feet, it is assumed that all for-hire vessels are affected and will either (1) go out of business, (2) travel longer distances to other inlets before reaching the ocean (increasing fuel costs, decreasing ocean fishing time, and decreasing profits), or (3) change ports. If inlets shoal between 4 and 6 feet, it is assumed that a portion of vessels greater than 30 feet in length will be affected. For Ocracoke Inlet (Hyde County), charter, an estimated 23.5 percent of the charter vessels using the inlet are greater than 30 feet in length. It is assumed that 25 percent of the vessels over 30 feet in length will go out of business, with the remaining 75 percent of vessels over 30 feet in length moving to Oregon Inlet. For Barden Inlet (Carteret County), charter is assumed that 25 percent of all charter vessels using the inlet will go out of business, and75 percent will move to Morehead City. For Bogue Inlet (Carteret County), it is assumed that 25 percent of all charter vessels using the inlet will go out of business, and75 percent will move to Morehead City. Of the three II-65
97 head boat vessels operating in Bogue Inlet, it is assumed that two will go out of business and one will move to Morehead City. For New Topsail Inlet (Pender County), an estimated 17.9 percent of all charter vessels using the inlet are greater than 30 feet in length. It is assumed that one quarter of the charter vessels greater than 30 feet in length go out of business, one-half move to Wrightsville Beach or Sneads Ferry, and one-quarter remain based in Topsail Island but use Masonboro Inlet or New River Inlet, increasing fuel costs by one-third. It is assumed that the one headboat vessel operating in New Topsail Inlet will move to Wrightsville Beach. For Carolina Beach Inlet (New Hanover County), it is assumed that one quarter of all charter vessels go out of business one-half move to Wrightsville Beach or Morehead City, and one-quarter remain based in Carolina Beach, but use Masonboro Inlet, increasing fuel costs by one-third. Of the three head boat vessels operating in Carolina Beach Inlet, it is assumed that two would go out of business and one would move to Wrightsville Beach. For Lockwood Folly Inlet (Brunswick County), it is assumed that one-quarter of all charter vessels based in Holden Beach or Oak Island (includes Town of Oak Island and Caswell Beach) go out of business and three-quarters of the vessels move to Southport or Calabash. Economic impacts of changes in for-hire fishing activity in terms of reductions in annual total (including multiplier effects) business sales, for-hire fishing employment and other employment are presented in Table II-70. It is assumed that for-hire passengers shift trips to other for-hire vessels operating through other inlets in North Carolina and therefore lose a negligible amount of consumer surplus. II-66
98 Region County Inlet Name Authorized Depth Table II-70. Shoaling Impacts on For-Hire Fishing (Charter and Head Boat Fishing Combined) Current Actual Depth Reduced Depth Under Scenario 3b Hyde Ocracoke c Carteret Barden c Carteret Bogue b 2a Pender New Hanover New Topsail Carolina Beach 1 Brunswick Lockwoods Folly For-Hire Fishing Qualitative Impacts Description For-Hire Fishing Quantitative Impacts Vessels 1/4 vessels > 30 ft out of business, 1 vessel out of business, 1 vessel 3/4 vessels > 30ft move to Oregon moves to Oregon Inlet Inlet 1/4 all for-hire vessels out of business, 3/4 all for-hire vessels move to Morehead 1/4 all for-hire vessels out of business, 3/4 all for-hire vessels move to Morehead 1/4 vessels > 30 ft out of business, 1/2 move to Wrightsville Beach or Sneads Ferry, 1/4 use Masonboro Inlet or New River Inlet, increasing fuel costs by 33% 1 vessel out of business, 3 vessels move to Morehead 8 vessels out of business, 19 vessels move to Morehead 2 vessels move to Wrightsville Beach 1/4 all for-hire vessels out of 10 vessels out of business, 17 business, 1/2 move to Wrightsville vessels move to Wrightsville Beach Beach or Morehead, 1/4 use or Morehead, 6 vessels stay in CB Masonboro Inlet, increasing fuel and motor up to Masonboro Inlet costs by 2 hrs/trip or 33% 1/4 all for-hire vessels out of business, 3/4 move to Southport or Calabash 2 vessels out of business, 9 vessels move to Southport or Calabash For-Hire Fishing Quantitative Impacts Business Output/ Sales Lost For-Hire Fishing Quantitative Impacts Captain/Crew Jobs Lost For-Hire Fishing Quantitative Impacts Other Jobs Lost For-Hire Fishing Quantitative Impacts Consumer Surplus Lost $53, $84,998 $88, $127,706 $990, $820,365 $0 0 0 $0 $2,525, $1,258,791 $285, $444,523 II-67
99 c) Impacts on Boat Building Boat builders use the AIWW and coastal inlets to test their boat designs and demonstrate boats to potential customers. Builders of deep-draft boats potentially could be affected by inlet shoaling. However, most deep-draft boat builders are not located near the inlets considered in the inlet shoaling scenario and would therefore suffer negligible impacts. Shoaling of Ocracoke Inlet (Hyde County) would likely have little impact on boat builders located in Washington, NC (Beaufort County), and Belhaven, NC (Beaufort County), who are more dependent on access to the AIWW. Barden Inlet (Carteret County) shoaling may have some impact on deep-draft boat builders located in Harkers Island, Marshallberg, Gloucester (HMG), perhaps one eighth of the deep-draft boat building capacity in Carteret County. If Barden Inlet closes, these builders would likely move construction of deep-draft vessels to Morehead City or Beaufort and convert HMG facilities to shallow-draft vessel construction. The estimated cost of these potential adjustments is unknown but likely small relative to the overall scale of boat building activity in Carteret County. There are no known deep-draft boat builders in the Bogue Inlet area, so it is assumed that the impacts of inlet shoaling on boat building in this area would be zero. Shoaling of New Topsail Inlet would have no impact on the only deep-draft boat builder in Pender County, as the builder currently uses Masonboro Inlet at Wrightsville Beach instead of New Topsail Inlet. Shoaling of Carolina Beach Inlet would have no impact on New Hanover County deepdraft boat builders. These builders use the Cape Fear River and Inlet. Lockwood Folly Inlet shoaling would have no impact on Brunswick County boat builders, as they use the Cape Fear River Inlet. These qualitative impacts on boat builders are summarized in Table II-71. II-68
100 Table II-71. Qualitative Impacts of Shoaling on Boat Builders Region County Inlet Name Authorized Depth Current Actual Depth Reduced Depth Under Scenario 3b Hyde Ocracoke c Carteret Barden c Carteret Bogue New 2b Pender Topsail New Carolina 2a Hanover Beach 1 Brunswick Lockwoods Folly Boat Building Qualitative Impacts Description no impact: builders in Washington and Belhaven not dependent on Ocracoke Inlet some impact to local area, little net impact to county: assume 1/8 Carteret County deepdraft boats built in Hawkers Island, Marshallberg, Gloucester. If Barden Inlet closes, assume they move construction of deep-draft vessels to Morehead or Beaufort, facilities taken-over by shallow-draft builders. no impact: no deep-draft boat builders in this area. no impact: deep-draft builders in Pender Co. use Masonboro Inlet no impact: builders of deep-draft vessels use Cape Fear Inlet no impact: Brunswick builders use Cape Fear Inlet d) Other Impacts The inlet shoaling scenario should have little impact on private boating, as most private boats are less than 30 feet in length and draft less than four feet. As long as boating opportunities are maintained on the AIWW and other inlets are open allowing access to the ocean, impacts on private boating trips, expenditures and consumer surplus should be minimal. The inlet shoaling scenario should have little impact on most marinas, because most vessels using marinas are less than 30 feet in length with shallow drafts. Exceptions to this result would be marinas with larger (greater than 30 feet) for-hire vessels as tenants; however, the impacts of any changes in for-hire fishing activity, including marina use by the for-hire fishing vessels, are considered above under for-hire fishing impacts. An additional impact of Barden Inlet shoaling would likely be decreased tourist activity on Cape Lookout and its lighthouse (part of the Cape Lookout National Seashore). This could result in some loss of transient tourist revenue on Harkers Island. However, these tourists would likely still come to coastal North Carolina, they would simply visit other Carteret County beaches or perhaps other beaches with lighthouses. These qualitative impacts are summarized in Table II-72. II-69
101 Region County Inlet Name Authorized Depth Table II-72. Other Qualitative Impacts of Shoaling Current Actual Depth Reduced Depth Under Scenario 3b Hyde Ocracoke c Carteret Barden c Carteret Bogue b 2a Pender New Hanover New Topsail Carolina Beach 1 Brunswick Lockwoods Folly Private Boating Qualitative Impacts Description Marinas Qualitative Impacts Description little impact on private boating little impact on private boating (most activity at marinas due to shallow private boats draft less than 4 feet) drafts of private boats; impacts on as long as AIWW depth maintained larger for-hire boats captured under For-Hire Fishing Impacts little impact on private boating (most private boats draft less than 4 feet) as long as AIWW depth maintained little impact on private boating (most private boats draft less than 4 feet) as long as AIWW depth maintained little impact on private boating as most private boats draft less than 4 feet little impact on private boating (most private boats draft less than 4 feet) as long as AIWW depth maintained little impact on private boating as long as AIWW depth maintained and Cape Fear, Shallotte, and Little River inlets maintained little impact on private boating activity at marinas due to shallow drafts of private boats; impacts on larger for-hire boats captured under For-Hire Fishing Impacts little impact on private boating activity at marinas due to shallow drafts of private boats; impacts on larger for-hire boats captured under For-Hire Fishing Impacts little impact on private boating activity at marinas due to shallow drafts of private boats; impacts on larger for-hire boats captured under For-Hire Fishing Impacts little impact on private boating activity at marinas due to shallow drafts of private boats; impacts on larger for-hire boats captured under For-Hire Fishing Impacts little impact on private boating activity at marinas due to shallow drafts of private boats; impacts on larger for-hire boats captured under For-Hire Fishing Impacts N/A Other Qualitative Impacts Description Some beach/lighthouse recreation at Cape Lookout shifts to other Carteret County beaches; Harkers Island loses some beach tourist revenue N/A N/A N/A N/A F. Overall Summary of Socio-Economic Value of Beaches and Inlets in North Carolina North Carolina beaches and inlets have tremendous economic value. Beaches and inlets support millions of beach recreationists every year, provide billions in economic value through business and tourism as well as residential and commercial property value, provide ocean access for commercial and recreational fishermen, and support the marina and boat building industries. Beaches and inlets provide a direct source of employment and generate associated jobs in the coastal communities. Citizens of the State and visitors derive considerable benefits from the coastal region. The value of coastal property located in the Ocean Erodible Area at risk in the eight oceanfront counties was $11.73 billion using the 1998 setback factorsand $11.12 billion using the 2012 setback factors (Table II-73). Of the five coastal counties with recent beach maintenance programs (Brunswick, New Hanover, Pender, Onslow, and Carteret), all exhibited a reduction in property at risk between 1998 and Conversely, Dare County and Currituck County which have been absent of beach maintenance activity, exhibited an increase in property value at risk between 1998 and II-70
102 Table II-73. Oceanfront Coastal Counties - Summary of Property at Risk Owner Type 1998 Property At Risk Total Value ($) 2012 Property At Risk Total Value ($) Based on ownership breakdowns of coastal properties at risk in each of the eight coastal counties, it is apparent that the impacts of beach nourishment not only effects coastal residents but have far reaching implications to the rest of North Carolina as well as the US. Non-NC residents own over half of coastal property value at risk in the eight coastal counties equal to approximately $5.9 billion (see Table II-73). However, NC residents experienced the greatest reduction in property value at risk between 1998 and 2012 of approximately $409.6 million (see Table II-73). The direct expenditures generated by the beaches and inlets amount to $2.5 Billion per year. When multiplier effects are added, these numbers rise to $6.1 Billion supporting almost 65,000 jobs. These sectors provide the State of North Carolina with $188.4 million annually in State tax revenue. The recreational consumer surplus resulting from beaches and inlets is over $214 million. Table II-74 summarizes some of the main economic values that have been discussed throughout this section of the report. Table II-74. North Carolina Statewide Summary Difference In Property At Risk Total Value ($) Coastal Resident 2,184,726,105 2,015,436, ,290,089 NC Resident 3,552,741,030 3,143,148, ,592,477 US Resident 5,966,919,481 5,945,429,993-21,489,488 Unknown 20,715,488 20,335, ,470 Total $11,725,102,104 $11,124,349,580 $600,752,524 Sector Direct Impact Expenditures Total Impact Output/Sales/ Business Activity Total Impact Employment Total Local Tax Revenue Total State Tax Revenue Total Federal Tax Revenue Annual Consumer Surplus Beach Recreation ( ) $1,662,190,984 $4,741,454,600 48,718 $155,806,220 $163,107,645 $375,840,980 $89,672,622 Shore and Pier Fishing ( ) $48,995,668 Marine Recreational Services ( ) $11,046,413 $23,202,475 1,929 $880,340 $839,947 $1,790,992 - Commercial Fishing (2015) $59,532,630 $96,617,338 3,462 $1,320,711 $1,921,371 $4,405,610 - Seafood Packing and Processing (2015) $182,090,002 $234,173,385 1,047 $1,929,825 $2,067,701 $5,179,471 - Charter/Head Boat Fishing (2015) $38,375,865 $67,515,681 1,388 $1,618,364 $1,830,175 $4,031,208 $70,367,700 Recreational Boating/Fishing (2015) $79,074,771 $159,853,665 1,997 $6,575,790 $6,492,187 $13,232,600 $5,826,607 Boat Building (2015) $211,262,212 $327,436,125 1,811 $6,575,632 $6,170,470 $16,726,255 - Marinas (2015) $70,372,449-1, Deep Draft Port Activity (2015) $222,081,263 $416,844,855 2,973 $4,291,516 $5,976,508 $22,443,697 - NC TOTALS $2,536,026,589 $6,067,098,124 64,911 $178,998,398 $188,406,004 $443,650,812 $214,862,598 The value of maintaining North Carolina s beaches was investigated through a simulation scenario in which the width of all beaches was reduced by 50 percent. Narrower, more crowded and congested beaches reduce the number of beach trips and the enjoyment per trip. A 50 percent reduction in beach width would reduce beach trips and associated sales/output and employment by an estimated percent. Consumer surplus II-71
103 associated with beach recreation falls by an estimated percent. Annual sales/output supported by beach recreation would fall by an estimated $540 million, employment by 6,300, and consumer surplus by $15.5 million. Narrower beaches also reduce the consumer surplus of recreational fishing from shore by an estimated 3 percent, or $688,000 annually. A second simulation scenario investigated the economic effects of shoaling at six shallow draft inlets (Ocracoke, Barden, Bogue, New Topsail, Carolina Beach, and Lockwoods Folly). The simulation examines shoaling to 50 percent of the current depth at each inlet. Shoaling affects commercial fishing and for-hire (charter and head boat) fishing vessels that accesses the ocean through these inlets. It is assumed that inlets with three and a half feet or less in water depth are unnavigable for all commercial and for-hire fishing vessels, and those inlets with 3.5 to 6 feet in water depth would be unnavigable for commercial and for-hire fishing vessels greater than 30 feet in length. When an inlet becomes unnavigable, a proportion of the affected vessels is allocated to each of three possible outcomes: (1) go out of business, (2) travel longer distances to other inlets before reaching the ocean (increasing fuel costs, decreasing ocean fishing time, and decreasing profits), or (3) move to a different home port. The impacts of the shoaling scenario on the commercial fishing sector include a $5.4 million loss is sales/output and the loss of 324 jobs (including both captain/crew jobs and jobs supported by multiplier effects). Impacts on the charter fishing sector include a reduction of $1.5 million in sales/output, the loss of 59 jobs (including both captain/crew and multiplier effect jobs), and a reduction of $2.1 million in consumer surplus. Head boat fishing sales/output is reduced by $2.5 million, 27 jobs (including both captain/crew and multiplier effects) are lost, and consumer surplus is reduced by $678 thousand. Of course it should be remembered that this analysis did not include all inlets within the State which would greatly increase these losses. For example, based on a 2014 study by Moffatt & Nichol, if Oregon Inlet were not maintained and essentially allowed to close, lost direct impacts to Dare County would total $181.5 million and 1,459 jobs. II-72
104 SECTION 3 DATA COLLECTION AND REFINEMENT
105 III. DATA COLLECTION AND REFINEMENT 2009 Region Development When the original BIMP was created in 2009 the following Regions and sub-regions were developed; a brief review of how the regions were developed and what was included in each Region is provided below. As part of the development of a comprehensive statewide plan for managing the beaches and inlets of North Carolina, DEQ desires that the BIMP divide the coast into multiple management regions. The 326 miles of ocean shoreline and 19 active inlet complexes are simply too diverse for a single management strategy or singular entity to manage. Highly localized individual beach and inlet management is not viable either given that various regions of the coast are too interconnected to ignore the regional relationships of beaches and the neighboring inlets. A truly statewide approach requires recognition of both the diversity and common elements of different segments of shoreline and inlets along the coast. The development of the regions included consideration of the geologic framework, the physical processes (wave exposure, sediment transport, etc.), the geographic layout, sand sources and natural resources, and common sociopolitical concerns. The overall global regions are defined by the geological framework and cape features along the North Carolina coast. The capes and associated cape shoals (Diamond Shoals off Cape Hatteras, Lookout Shoals off Cape Lookout, and Frying Pan Shoals off Cape Fear) are natural breaks in the coastal geomorphology and the sediment transport processes along the coast and thus provide natural break points for the four main regions (Figure III-1). III-1

106 Figure III-1. Four Main Regions and the Capes Further subdivision of the four main regions into localized sub-regions was defined by many datasets including: Local geologic features Developed/undeveloped (both currently undeveloped and regions protected or not to be developed) shoreline reaches Erosion/accretion patterns and rates Potential sediment transport (sediment budgets and transport directions where known) Potential sand sources Dredging considerations Sociopolitical boundaries After overlaying all the above datasets and considering the aspects discussed in the previous subsections, the final determination of management regions and sub-regions for the BIMP were delineated (Figure III-2). III-2

107 Figure III-2. Delineation of BIMP Sub-regions It should be noted that while sociopolitical factors were considered, the physical features and processes were the primary drivers in determining the regions. It is convenient that boundaries appear to closely match existing county boundaries. III-3

108 Region 1 encompasses the coastal portion of Brunswick County from the North Carolina/South Carolina Border to the Brunswick County/New Hanover County line. The Towns of Sunset Beach, Ocean Isle, Holden Beach, Oak Island, Caswell Beach, and Bald Head Island all fall within Region 1. Tubbs Inlet, Shallotte Inlet, Lockwoods Folly Inlet, and Cape Fear Inlet divide the barrier islands. Figure III-3 shows the limits of Region 1. Figure III-3. Region 1 Boundaries III-4

109 Region 2 is composed of three sub-regions (2a, 2b, and 2c) which cover the stretch of coast between the Brunswick County/New Hanover County line (just north of Cape Fear) to just north of the Cape Lookout lighthouse. The first sub-region, called Region 2a, encompasses the coastal portion of New Hanover County plus Rich Inlet, of which the north side falls into Pender County. Fort Fisher, Kure Beach, Carolina Beach, Wrightsville Beach, and Figure Eight Island all fall within Region 2a. Masonboro Island and a portion of Zeke s Island are also included in this region. Carolina Beach Inlet, Masonboro Inlet, Mason Inlet, and Rich Inlet divide the barrier islands. Figure III-4 shows the limits of Region 2a. Figure III-4. Region 2a Boundaries III-5

110 The second sub-region, Region 2b, encompasses the coastal portion of Pender County and a majority of Onslow County, stretching from just north of Rich Inlet to just west of Bear Inlet. Coastal towns in this region include Topsail Beach, Surf City, and North Topsail Beach. Hutaff Island, Onslow Beach, and Brown s Island are also included. Region 2b contains three inlets: New Topsail Inlet, New River Inlet, and Brown s Inlet. Figure III-5 shows the limits of Region 2b. Figure III-5. Region 2b Boundaries III-6

111 The third sub-region, Region 2c, covers the remainder of Onslow County and southern facing shores of Carteret County, stretching from Bear Inlet to just north of the Cape Lookout lighthouse. Towns in this region include Emerald Isle, Indian Beach, Salter Path, Pine Knoll Shores, Atlantic Beach, and Fort Macon. Bear Island, Shackleford Banks, and Cape Lookout are also included. Region 2c has four inlets; Bear Inlet, Bogue Inlet, Beaufort Inlet, and Barden Inlet. Figure III-6 shows the limits of Region 2c. Figure III-6. Region 2c Boundaries III-7

112 Region 3 is composed of two sub-regions (3a and 3b) covering the stretch of coast from north of the Cape Lookout lighthouse to Cape Hatteras just west of Buxton. Region 3 covers the eastern facing shores of Carteret County, the coastal portion of Hyde County, and the southern portion of Dare County to Cape Hatteras. The first sub-region, Region 3a, encompasses the eastern facing shores of Carteret County from just north of the Cape Lookout lighthouse to just south of the town of Portsmouth. This stretch of shoreline is commonly referred to as Cape Lookout National Seashore. It is comprised of Core Banks and Portsmouth Island which are divided by Drum Inlet. Figure III-7 shows the boundaries of Region 3a. Figure III-7. Region 3a Boundaries III-8

113 The second sub-region, Region 3b, stretches from just south of Portsmouth to Cape Hatteras, just west of Buxton, covering a small portion of Carteret County, the entire coastal portion of Hyde County and the southern part of Dare County. The towns of Portsmouth, Ocracoke, and Hatteras are all included in this region. Ocracoke Inlet and Hatteras Inlet separate the various barrier islands. Figure III-8 shows the limits of Region 3b. Figure III-8. Region 3b Boundaries III-9

114 Region 4 is composed of three sub-regions (4a, 4b, and 4c) which cover the stretch of coast between Cape Hatteras at Buxton and the Virginia/North Carolina border. Region 4 covers Dare County and Currituck County. The first sub-region, called Region 4a, encompasses the eastern facing shores of Dare County from Cape Hatteras at Buxton to just north of the town of Rodanthe. The Towns of Buxton, Avon, Salvo, and Rodanthe are included in this region. Region 4a has no inlets. Figure III-9 shows the limits of Region 4a. Figure III-9. Region 4a Boundaries III-10

115 The second sub-region, called Region 4b, stretches from Pea Island to the Dare County/Currituck County border. Pea Island, Bodie Island, Nags Head, Kill Devil Hills, Kitty Hawk, Southern Shores, Duck and Sanderling all fall within Region 4b. Oregon Inlet is the only inlet in this region and the only inlet in all of region 4. Figure III-10 shows the limits of Region 4b. Figure III-10. Region 4b Boundaries III-11

116 The third sub-region, called Region 4c, extends from the Dare County/Currituck County border to the North Carolina/Virginia border. Region 4c includes the area known as Peter s Quarter, Corolla, the Currituck National Wildlife Refuge, and a stretch of land leading north to the Virginia Border. There are no inlets in this region. Figure III-11 shows the limits of Region 4c. Please note that the northernmost area of Region 4c is referred to as NC to VA or Refuge to VA. The area extends from the Wildlife Refuge to the North Carolina/Virginia border, per DCM naming conventions. Figure III-11. Region 4c Boundaries III-12
117 2009 Database Development When the original BIMP database was compiled in 2009 an effort was made to gather information from multiple sources including: federal, state, local municipalities, and universities covering dredging and beach nourishment projects. This data represented a cross-section of agencies and organizations with experience, knowledge, and readily available and published datasets. Federal U.S. Army Corps of Engineers U.S. Geological Survey U.S. Fish and Wildlife Local Municipalities and Contractors Carteret County and Towns Dare County and Towns New Hanover County and Towns Brunswick County and Towns Town of Topsail Beach Town of North Topsail Beach Figure Eight Island Village of Bald Head Coastal Planning & Engineering Olsen Associates, Inc. TI Coastal, PLLC State DEQ-Division of Water Resources DEQ-Division of Coastal Management DEQ-Division of Marine Fisheries DEQ-Division of Water Quality DEQ-Division of Land Resources NC Geological Survey DEQ-Division of Parks and Recreation DEQ-Wildlife Resources Commission DOT-Department of Transportation Universities North Carolina State University University of North Carolina at Chapel Hill Western Carolina University East Carolina University University of North Carolina at Wilmington Duke University These same groups were also contacted during this update to acquire additional data to refine both the dredging and beach nourishment databases. III-13
118 Dredging Overview Dredging and sand bypassing are the primary focus of inlet management in North Carolina. North Carolina is unique in the fact that a number of the inlets within the state are shallow draft inlets (six to 14 ft deep) with only the Cape Fear Inlet (Wilmington Harbor) and Beaufort Inlet (Morehead City Harbor) being deep draft inlets for port navigation. Dredging is vital to the maintenance of transportation routes through state waterways and for providing safe, reliable access to the Atlantic Ocean along the coast. Without the clearing of shoals from navigation channels by dredging, mariners would face serious problems in navigation along the North Carolina coast. Dredging of shallow draft navigation channels supports commercial fisheries and public transportation (ferries, recreational boaters) and helps ensure boater safety (elimination of shoals and inlet dredging can reduce breaking wave hazards). These are significant sources of economic activity for coastal communities. Dredging in North Carolina is performed by the Wilmington District of the USACE, the DWR, the NCDOT Ferry Division, and by private interests. The Wilmington District of the USACE maintains 308 mi of federally mandated channels including the Atlantic Intracoastal Waterway, rivers, small harbors, and seven major inlets along the coast. However, the USACE is under increasing budgetary constraints with regard to its ability to regularly maintain channels and inlets. 1. Dredge Types and Capabilities Different beach and inlet strategies require varying types of equipment and dredging techniques. Dredging equipment can be broadly divided into two categories, mechanical dredges and hydraulic dredges. Mechanical dredges are analogous with land-based excavating machinery and include shovel-type excavators such as clamshells, buckets, ladders, and draglines. These dredges generally are unable to transport dredged material over long distances, lack a means of self-propulsion, and have relatively low production rates. Their main advantage is the ability to operate in tight spaces along docks and jetties. Mechanical dredges can be land based or mounted on barges. Figure III-12 illustrates a typical mechanical dredge with material placed in a bottom dumping barge. III-14
 Hydraulic dredges are characterized by the use of a centrifugal pump that produces a high velocity stream of water in a pipeline")
119 Source: USACE Figure III-12. Typical Mechanical Dredge (Clamshell Bucket with Bottom Dumping Barge) Hydraulic dredges are characterized by the use of a centrifugal pump that produces a high velocity stream of water in a pipeline in which solids are entrained and transported to a discharge area. Hydraulic dredges are further categorized by their method of excavation, method of placement, and the nature of the intake element that is in contact with the material to be dredged. Hopper dredges are the most common hydraulic dredge used offshore, consisting of a self-propelled, ocean-certified vessel that is capable of storing dredged material onboard in hoppers and transporting it to a disposal site (Figure III-13). The material is pumped into the hoppers through a pipe and draghead. The draghead configuration varies depending on the material being dredged but is frequently a trailing suction configuration with a draghead supported by dragarms trailing the ship. The bottom sediment is entrained like a vacuum cleaner by plain suction. The dredged material can be dumped through bottom doors onto the seafloor at a given placement location or some hopper dredges have pump off capabilities where the material can be pumped via pipeline from the hoppers to the shore. Hopper dredges can be readily moved and can operate in wave conditions that are not feasible for other dredge types. Figure III-13. Typical Hopper Dredge Some trailing suction dredges, called sidecasters, do not have hoppers and instead discharge the dredged material through extended, cantilevered arms (Figure III-14). III-15
 through a boom some distance from the channel from which it was removed.")
120 Sidecaster dredges dispose of the dredged material back into the region from which it is dredged. The dredged material is cast off to the side of the dredging vessel (which is following natural deepwater channels) through a boom some distance from the channel from which it was removed. This method allows continuous operation and limited increase in draft during operation since the material is not carried on the vessel as with hopper dredges. Since the dredges are smaller and do not move the material a great distance, dredging is usually required multiple times per year where sidecasters are utilized. Figure III-14. Typical Sidecaster Dredge Pipeline dredges use pipelines to pump material from the location of dredging. The dredging action may be by plain suction, cutterhead, bucket wheel, or dust pan. Cutterheads have a rotating cutter which loosens bottom materials at the suction intake of the pipeline. Different cutters can be employed for various bottom materials. A bucket wheel is essentially as the name suggests; a rotating wheel of buckets which excavates the material. A dustpan received its name from the shape of the suction head, which resembles a dustpan or vacuum cleaner head. Pipeline dredges usually are not selfpropelled and consist of a large centrifugal pump mounted on a specially designed barge. The bottom material is pumped through a suction pipe to the barge and then through a pipeline to the placement area. The pipeline is floated by pontoons and can extend thousands of feet. Booster pumps can be used to achieve increased distances. Pipeline dredges can move large volumes of material in relatively short time. The placement area, however, must be relatively close to the dredge site and the wave and wind conditions must allow for the operation of the dredge and maintaining the pipeline. The most common and most versatile hydraulic dredge is the cutterhead, which is equipped with a rotating cutter (excavator) surrounding the intake of the suction line. (Turner, 1996). A conventional cutterhead dredge is held in position by two spuds at the stern (see Figure III-15). One spud is pushed into the bottom and the dredge is moved in III-16
.")
121 a sideways arc to dredge the channel width using two swing anchors. It can operate continuously and discharge the dredged material directly by pipeline to water, beach, or upland disposal areas. One of its limitations is its inability to work in severe wave climates (even heavier pipeline dredges with special equipment cannot operate in seas greater than 6 feet). A comparison of the various dredge types is presented in Table III-1. Figure III-15. Typical Cutterhead Hydraulic Dredge Dredged material can be placed upland, in-water, or on the beach. One of the fundamental objectives of the BIMP is to advocate best management practices with respect to dredged sediments. Beach quality material should be returned to the beach, utilized to create habitat (non-beach compatible sediments), and all dredge material should remain in the system except if contaminated. Dredged material in the past was often thought of as waste material or dredge spoil and disposed of in the cheapest and quickest manner possible. Current thinking views dredged material along the coast as a resource to potentially restore beaches, build habitat areas through wetland/environmental restoration, and protect shorelines. III-17
122 Factor Table III-1. Comparison of Various Dredge Types Dredge Type Mechanical Sidecaster Hopper Pipeline Common Excavation Method Material Placement Common Use Usage Conditions Common Material Dredged Scooping Into barges In harbors around docks Relatively protected calm areas Consolidated, hard-packed, debris Trailing suction Discharges to side of channel Exposed channels and inlets Relatively rough seas Loosely compacted, coarsegrained Trailing suction Into hoppers which are bottom discharged at disposal site Exposed channels, larger rivers and inlets (mobile so can operate where other traffic is present) Relatively rough seas Heavy sands Suction with cutterhead Pump directly to nearby disposal site, in water or on land In wider channels with deep shoals (lower traffic areas since floating pipeline maybe a navigation obstruction) Relatively calm seas (floating pipeline can break apart) Sediment that can be broken up and mixed with water forming pumping slurry The Wilmington District maintains the USACE s small draft dredging fleet for the Atlantic coast. Currently, this includes operation of three dredges suitable for shallow draft navigation channel and inlet dredging. These specialized dredges are capable of operating in ocean-exposed inlet conditions and shallow draft waters. There are no readily available commercial dredges with the combination of ocean certification and the capability of shallow water operation. This combination is optimal to dredge the shallow inlets along the North Carolina coast due to wave conditions at the inlets. These dredges are also outfitted with specialized trailing suction heads to avoid turtle impacts and allow for nearly year-round operation. Two of the dredges are a small split-hull hopper dredge and is capable of placing sediment in the nearshore littoral zone (sand bypassing) in less than eight feet of water. The remaining USACE dredge is a sidecaster. Dredging of the III-18
123 interior, sheltered channels is primarily accomplished by the USACE through contracts with commercial dredging firms. Dredging Database Update The dredging database has been updated to include new data from 2008 to 2015 as well as fill in gaps in data prior to All values in the dredging database consider projects or parts of projects where sand was not used for beach nourishment specifically, meaning it was instead placed on a disposal island or offshore disposal site. New data gathered for dredge projects from 2008 to 2015 that were performed or contracted out by the U.S. Army Corps of Engineers were downloaded from their website. Information from the DEQ for the State s SDI-5 project provided data for other shallow draft and AIWW projects. In addition two Freedom of Information Act requests were made to receive additional information from the USACE. Some data that was received, in the old database and the update, did not contain costs associated with the project. For these specific projects assumptions were made based on interpolations from similar projects in the same or adjacent years. In cases where there were no projects in the same or adjacent years, a statewide trend of unit cost ($/cy) based on projects with cost data was used. Once all of the data was compiled, summary results for each region were sent to each Town Manager, Administrator, or Planner to confirm that the findings were consistent with what the town had experienced. Dredge projects volumes and costs for the regions are reported based on whether they occurred in shallow or deep draft inlets. Of the 19 inlets located along the North Carolina coast most are shallow draft inlets with congressionally-authorized depths ranging from 6-14 feet. Two deep draft inlets, Cape Fear Inlet and Beaufort Inlet, with federallyauthorized depths greater than 15 feet serve as the entrances to North Carolina s two major ports, Wilmington and Morehead City, respectively. Routine dredging and maintenance of all these inlets is required to support NC s economy from commercial traffic, commercial fishermen, charter fishermen, recreation, and tourism. If an inlet is federally-authorized then it was historically maintained by federal funding, if federal funding was available. NC used to receive substantial federal funding to maintain shallow and deep draft inlets, however federal funding has declined in recent years, especially for shallow draft projects which have received minimal federal funding since When the State of North Carolina realized it could no longer depend on federal government to fund routine dredging of shallow draft inlets, a Shallow Draft Navigation Channel and Lake Dredging Fund was established in This fund is provided by a small percentage of gas tax and boater registration fees. Upon establishment it was stated that State funds must be matched with Local funds. This cost sharing ratio was modified in 2015 to be State-Local with the exception of Hyde County where the cost share is with State-Local based on an existing economic tiering system. III-19
124 In addition, over the last decade, even federal funding for NC s deep draft channels has been decreasing. These port navigation projects are ranked nationally based on thru tonnage and NC s ports have been ranked lower in recent years compared to other ports nationwide. This decreased level of funding has led to less and less achievement of authorized depth and width in these navigation channels. Therefore, it became necessary to discuss setting up a Deep Draft Navigation Channel Dredging and Maintenance Fund to avoid further impact to the ports and the economic effects the ports provide. The general assembly recognized this issue in 2015 with the establishment of a deep draft fund but it has not had any appropriations to date. As part of the results, the need will be explored for a Deep Draft Fund and what amount would be required to sustain it in a later section of the report. Volume and cost data are separated by dredge type (pipeline, hopper, sidecast, Currituck, and other) and project location is summarized for each region over three data ranges: (41 years, entire dataset), (11 years, last decade), and (6 years, recent). The yearly averages of volume and cost were calculated over the entire date ranges, regardless of the number of dredging projects that actually occurred in that time period. Each region was then summarized to produce a statewide summary for volume and cost. All costs in the tables have been converted to 2015 dollars, while some figures may show a comparison of actual year of the project dollars with 2015 dollars. The statewide cost summary is broken down to show contributions from State, Local, and Federal funds-especially with concern to shallow draft projects. These tables and figures will help develop future projections used in a later section of the report. A summary of dredge data is presented in Table III-2. A database of known dredging projects from is located in Appendix C. The project team is very grateful for the level of cooperation and goodwill demonstrated by all who were so willing to provide their data for this effort. The data is the cornerstone upon which the BIMP ultimately rests. III-20
125 Table III-2. Summary of Dredge Data Location Number of Times Dredged Total Amount Dredged (cy) First Year of Record ATLANTIC INTRACOASTAL WATERWAY* ,633, ATLANTIC BEACH CHANNELS, NC 3 130, AVON HARBOR 2 126, BEAUFORT HARBOR 24 1,111, BOGUE INLET AND CHANNELS 90 5,839, CAPE FEAR RIVER , CAPE FEAR RIVER INLET 5 4,850, CAPE LOOKOUT NATIONAL SEASHORE 1 73, CAROLINA BEACH INLET & CHANNELS 153 7,302, CHANNEL FROM BACK SOUND TO LOOKOUT BIGHT , DRUM INLET 7 863, EDENTON HARBOR 1 17, FAR CREEK 5 1,577, HATTERAS INLET , LOCKWOODS FOLLY INLET 86 5,424, LOCKWOODS FOLLY RIVER 36 2,189, MANTEO (SHALLOWBAG BAY)/OREGON INLET ,184, MASONBORO INLET 1 28, MILE HAMMOCK 1 280, MOREHEAD CITY HARBOR 46 37,429, NEW RIVER INLET 138 9,173, NEW TOPSAIL INLET & CHANNELS 97 5,206, OCRACOKE INLET 20 1,023, RODANTHE CHANNEL 4 151, ROLLINSON CHANNEL 14 1,455, SHALLOTTE RIVER 6 219, SILVER LAKE HARBOR 41 3,305, STUMPY POINT BAY 3 444, WATERWAY CONNECTING PAMLICO SOUND AND BEAUFORT HARBOR , WATERWAY CONNECTING SWANQUARTER BAY WITH DEEP BAY 7 1,937, WILMINGTON HARBOR 92 81,072, WRIGHTS CREEK 1 66, *Includes AIWW channels and inlet crossings III-21
126 1. Region 1 Figure III-16 through Figure III-18 show the total, shallow, and deep draft dredging volumes for Region 1 between 1975 and See Figure III-3 for a location map of this region. Shallow projects in this region include Tubbs Inlet, Shallotte River & Inlet, and Lockwoods Folly River & Inlet. All dredging projects associated with AIWW and Inland Waterways can be found in the statewide summary on page III-68. Wilmington Harbor and Cape Fear River & Inlet are the deep draft projects located in this region. A summary of the dredge volume data from the database applicable to Region 1 is presented in Table III-3 to Table III-5 separated by the dredge type over the three date ranges as mentioned previously. Please note that the summary tables have the Wilmington Harbor projects split into 2 groups due to the presence of beach compatible (Cape Fear Inlet) and nonbeach compatible (Wilmington Harbor) material. For Region 1, an average of 2 to 3 million cubic yards of material is dredged each year. The majority of the dredging in Region 1 is associated with the deep draft port projects (90-95%). This trend has been fairly consistent since the mid-70 s with a recent uptick mostly likely due to maintaining the now deeper Wilmington Harbor project. In 2001, the Wilmington Harbor deepening project and channel realignment contributed to the significantly higher volume quantities observed in that year. Figure III-19 shows the relative size of the projects for the region, grouped by whether there was nourishment potential for the material or not. There is a wide range of project size, especially since Region 1 contains both deep and shallow draft inlets. III-22
127 Figure III-16. Summary of Total Dredge Volume Summary - Region 1 ( ) III-23
128 Figure III-17. Summary of Shallow Draft Dredge Volume Region 1 ( ) III-24
129 Figure III-18. Summary of Deep Draft Dredge Volume - Region 1 ( ) III-25
130 Table III-3. Summary of Dredge Volume Data Region 1 ( ) Location Pipeline Hopper Sidecast Currituck Other TOTAL Average Volume (cy) (cy) (cy) (cy) (cy) (cy) (CY / YR) TUBBS INLET SHALLOTTE INLET LOCKWOODS FOLLY INLET - - 4,057,045 1,366,990-5,424, ,294 CAPE FEAR INLET (WILMINGTON HARBOR) 383,230 30,562, ,550,000 36,495, ,133 OVERALL TOTAL (Potential Nourishment) 383,230 30,562,239 4,057,045 1,366,990 5,550,000 41,919,504 1,022,427 LOCKWOODS FOLLY RIVER 270,491-1,282, ,283-2,189,401 53,400 CAPE FEAR RIVER 723,995-56, ,384 19,034 SHALLOTTE RIVER 203, , ,071 5,343 WILMINGTON HARBOR 40,457,804 7,717, ,252,410 49,427,479 1,205,548 OVERALL TOTAL 42,039,306 38,279,504 5,396,061 2,018,558 6,802,410 94,535,839 2,305,752 Table III-4. Summary of Dredge Volume Data - Region 1 ( ) Location Pipeline Hopper Sidecast Currituck Other TOTAL Average Volume (cy) (cy) (cy) (cy) (cy) (cy) (CY / YR) TUBBS INLET SHALLOTTE INLET LOCKWOODS FOLLY INLET - - 1,855,410 50,785-1,906, ,290 CAPE FEAR INLET (WILMINGTON HARBOR) - 9,135, ,550,000 14,685,243 1,335,022 OVERALL TOTAL (Potential Nourishment) - 9,135,243 1,855,410 50,785 5,550,000 16,591,438 1,508,313 LOCKWOODS FOLLY RIVER , ,065 19,642 CAPE FEAR RIVER SHALLOTTE RIVER ,910-1, WILMINGTON HARBOR 12,203, , ,252,410 13,955,830 1,268,712 OVERALL TOTAL 12,203,420 9,635,243 2,071,475 52,695 6,802,410 30,765,243 2,796,840 Table III-5. Summary of Dredge Volume Data - Region 1 ( ) Location Pipeline Hopper Sidecast Currituck Other TOTAL Average Volume (cy) (cy) (cy) (cy) (cy) (cy) (CY / YR) TUBBS INLET SHALLOTTE INLET LOCKWOODS FOLLY INLET ,780 6, ,115 99,186 CAPE FEAR INLET (WILMINGTON HARBOR) - 4,155, ,630,000 8,785,611 1,464,269 OVERALL TOTAL (Potential Nourishment) - 4,155, ,780 6,335 4,630,000 9,380,726 1,563,454 LOCKWOODS FOLLY RIVER CAPE FEAR RIVER SHALLOTTE RIVER ,910-1, WILMINGTON HARBOR 5,731, , ,000 7,015,291 1,169,215 OVERALL TOTAL 5,731,291 4,655, ,780 8,245 5,414,000 16,397,927 2,732,988 III-26
131 Figure III-19. Number of Dredge Project - Region 1 by Project Size Figure III-20 through Figure III-22 show the costs for total, shallow, and deep dredging projects in Region 1, both in the dollars of that year and in the projected 2015 dollars. A summary of the dredge cost data from the database applicable to Region 1 are provided in Table III-6 through Table III-8 separated by the dredge type over the three date ranges as mentioned previously. The costs in the tables are all reported in 2015 dollars. Dredging costs for the region range averaged 9 million dollars historically but have risen to 17 million in recent years, when dredging volumes have remained about the same. This increase in cost is likely due to two items. First, the relative costs for dredging have been steadily increasing over recent years due to dredge plant supply and demand issues as discussed in the unit costs analysis on page III-81. Second, dredging volumes have increased by about 20% in recent years due to the harbor deepening. The higher unit cost of some of the river projects using bucket and barge equipment has also influenced their results. III-27
132 Figure III-20. Total Dredge Cost Data - Region 1 ( ) III-28
133 Figure III-21. Total Shallow Draft Cost Data - Region 1 ( ) III-29
134 Figure III-22. Total Deep Draft Cost Data - Region 1 ( ) III-30
135 Table III-6. Dredging Costs - Region 1 ( ) Location Pipeline Hopper Sidecast Currituck Other TOTAL Average Cost ( 2015 $ ) ( 2015 $ ) ( 2015 $ ) ( 2015 $ ) (2015 $) (2015 $) (2015 $ / YR) TUBBS INLET SHALLOTTE INLET LOCKWOODS FOLLY INLET - - $14,240,633 $5,853,387 - $20,094,020 $490,098 CAPE FEAR INLET (WILMINGTON HARBOR) $1,373,396 $102,282, $35,509,354 $139,165,546 $3,394,282 OVERALL TOTAL (Potential Nourishment) $1,373,396 $102,282,796 $14,240,633 $5,853,387 $35,509,354 $159,259,566 $3,884,380 LOCKWOODS FOLLY RIVER $3,525,115 - $6,968,935 $7,072,924 - $17,566,974 $428,463 CAPE FEAR RIVER $7,937,971 - $811, $8,749,682 $213,407 SHALLOTTE RIVER $1,297, $201,254 - $1,498,759 $36,555 WILMINGTON HARBOR $117,663,354 $51,569, $21,376,658 $190,609,649 $4,649,016 OVERALL TOTAL $131,797,341 $153,852,433 $22,021,278 $13,127,565 $56,886,012 $377,684,630 $9,211,820 Table III-7. Dredging Costs - Region 1 ( ) Location Pipeline Hopper Sidecast Currituck Other TOTAL Average Cost ( 2015 $ ) ( 2015 $ ) ( 2015 $ ) ( 2015 $ ) (2015 $) (2015 $) (2015 $ / YR) TUBBS INLET SHALLOTTE INLET LOCKWOODS FOLLY INLET - - $5,031,560 $241,638 - $5,273,198 $479,382 CAPE FEAR INLET (WILMINGTON HARBOR) - $46,797, $35,509,354 $82,306,696 $7,482,427 OVERALL TOTAL (Potential Nourishment) - $46,797,342 $5,031,560 $241,638 $35,509,354 $87,579,894 $7,961,809 LOCKWOODS FOLLY RIVER - - $524, $524,017 $47,638 CAPE FEAR RIVER SHALLOTTE RIVER $60,454 - $60,454 $5,496 WILMINGTON HARBOR $46,940,600 $2,421, $21,376,658 $70,738,312 $6,430,756 OVERALL TOTAL $46,940,600 $49,218,396 $5,555,576 $302,092 $56,886,012 $158,902,677 $14,445, Region 2 Table III-8. Dredging Costs - Region 1 ( ) Location Pipeline Hopper Sidecast Currituck Other TOTAL Average Cost ( 2015 $ ) ( 2015 $ ) ( 2015 $ ) ( 2015 $ ) (2015 $) (2015 $) (2015 $ / YR) TUBBS INLET SHALLOTTE INLET LOCKWOODS FOLLY INLET - - $1,846,593 $57,500 - $1,904,093 $317,349 CAPE FEAR INLET (WILMINGTON HARBOR) - $30,839, $31,052,255 $61,891,657 $10,315,276 OVERALL TOTAL (Potential Nourishment) - $30,839,402 $1,846,593 $57,500 $31,052,255 $63,795,750 $10,632,625 LOCKWOODS FOLLY RIVER CAPE FEAR RIVER SHALLOTTE RIVER $60,454 - $60,454 $10,076 WILMINGTON HARBOR $21,739,314 $2,421, $17,094,610 $41,254,978 $6,875,830 OVERALL TOTAL $21,739,314 $33,260,455 $1,846,593 $117,954 $48,146,866 $105,111,183 $17,518,530 Figure III-23 shows the total volume dredged in Region 2a between 1975 and See Figure III-4 for a location map of this sub-region. The dredging in Region 2a is only attributed to shallow draft projects in Carolina Beach Inlet, Masonboro Inlet, Mason Inlet, and Rich Inlet. Please recall that dredging projects with beach placement are included in the beach nourishment database and discussion to avoid double counting. A summary of the dredge volume data from the database applicable to Region 2a is presented in Table III-9 through Table III-11 separated by the dredge type over the three date ranges as mentioned previously. The average dredge volume has decreased slightly from 180,000 cy/yr historically to around 122,000 cy/yr in the last five years. Figure III-24 shows the relative size of projects in Region 2a most of the projects in this region are under 250,000 cy, all of these projects were considered to have nourishment potential. III-31
136 Figure III-23. Summary of Shallow Draft Dredge Volume - Region 2a ( ) III-32
137 Table III-9. Summary of Dredge Volume Data - Region 2a ( ) Location Pipeline Hopper Sidecast Currituck Other TOTAL Average Volume (cy) (cy) (cy) (cy) (cy) (cy) (CY / YR) CAROLINA BEACH INLET 61,352-5,577,502 1,725,231-7,364, ,612 MASONBORO INLET , , MASON INLET RICH INLET OVERALL TOTAL (Potential Nourishment) 61,352-5,606,472 1,725,231-7,393, ,318 Table III-10. Summary of Dredge Volume Data - Region 2a ( ) Location Pipeline Hopper Sidecast Currituck Other TOTAL Average Volume (cy) (cy) (cy) (cy) (cy) (cy) (CY / YR) CAROLINA BEACH INLET - - 1,869,110 24,455-1,893, ,142 MASONBORO INLET MASON INLET RICH INLET OVERALL TOTAL (Potential Nourishment) - - 1,869,110 24,455-1,893, ,142 Table III-11. Summary of Dredge Data - Region 2a ( ) Location Pipeline Hopper Sidecast Currituck Other TOTAL Average Volume (cy) (cy) (cy) (cy) (cy) (cy) (CY / YR) CAROLINA BEACH INLET ,850 24, , ,051 MASONBORO INLET MASON INLET RICH INLET OVERALL TOTAL (Potential Nourishment) ,850 24, , ,051 Figure III-24. Number of Dredge Project - Region 2a by Project Size III-33
138 Figure III-25 shows the cost for total dredging projects in Region 2a from 1975 to 2015, in the dollars of that year and the projected 2015 dollars. A summary of the dredge cost data from database applicable to Region 2a are provided in Table III-12 through Table III-14 separated by the dredge type over the three date ranges as mentioned previously. The costs in the tables are all reported in 2015 dollars. The same trend of slight decrease in volume in the region is reflected as the cost has decreased from $740,000/yr historically to around $422,000/yr in the last five years. A possible reason for this decrease is the reduction in federal funding for the shallow draft navigation projects. III-34
139 Figure III-25. Total Dredge Cost Data - Region 2a ( ) III-35
140 Table III-12. Dredging Costs - Region 2a ( ) Location Pipeline Hopper Sidecast Currituck Other TOTAL Average Cost ( 2015 $ ) ( 2015 $ ) ( 2015 $ ) ( 2015 $ ) (2015 $) (2015 $) (2015 $ / YR) CAROLINA BEACH INLET $261,121 - $22,178,165 $7,848,302 - $30,287,588 $738,722 MASONBORO INLET - - $116, $116,675 $2,846 MASON INLET RICH INLET OVERALL TOTAL (Potential Nourishment) $261,121 - $22,294,840 $7,848,302 - $30,404,263 $741,567 Table III-13. Dredging Costs - Region 2a ( ) Location Pipeline Hopper Sidecast Currituck Other TOTAL Average Cost ( 2015 $ ) ( 2015 $ ) ( 2015 $ ) ( 2015 $ ) (2015 $) (2015 $) (2015 $ / YR) CAROLINA BEACH INLET - - $5,555,202 $180,000 - $5,735,202 $521,382 MASONBORO INLET MASON INLET RICH INLET OVERALL TOTAL (Potential Nourishment) - - $5,555,202 $180,000 - $5,735,202 $521,382 Table III-14. Dredging Costs - Region 2a ( ) Location Pipeline Hopper Sidecast Currituck Other TOTAL Average Cost ( 2015 $ ) ( 2015 $ ) ( 2015 $ ) ( 2015 $ ) (2015 $) (2015 $) (2015 $ / YR) CAROLINA BEACH INLET - - $2,354,599 $180,000 - $2,534,599 $422,433 MASONBORO INLET MASON INLET RICH INLET OVERALL TOTAL (Potential Nourishment) - - $2,354,599 $180,000 - $2,534,599 $422,433 Figure III-26 shows the total volume dredged in Region 2b between 1975 and See Figure III-5 for a location map of this sub-region. The dredging in Region 2b is only attributed to shallow draft projects in New Topsail Inlet, New River Inlet, and Brown s Inlet. A summary of the dredge volume data from the database applicable to Region 2b is presented in Table III-15 through Table III-17 separated by the dredge type over the three date ranges as previously mentioned. The average dredge volume has almost been reduced by half from 350,000 cy/yr historically to around 185,000 cy/yr in the last five years. Figure III-27 shows the relative size of projects in Region 2b most of the projects in this region are under 250,000 cy, all of these projects were considered to have nourishment potential. III-36
141 Figure III-26. Summary of Shallow Draft Dredge Volume - Region 2b ( ) III-37
142 Table III-15. Summary of Dredge Volume Data - Region 2b ( ) Location Pipeline Hopper Sidecast Currituck Other TOTAL Average Volume (cy) (cy) (cy) (cy) (cy) (cy) (CY / YR) NEW TOPSAIL INLET 344,531-4,502, ,401-5,206, ,997 NEW RIVER INLET 124,912-8,527, ,973-9,173, ,745 BROWN'S INLET OVERALL TOTAL (Potential Nourishment) 469,443-13,030, ,374-14,380, ,742 Table III-16. Summary of Dredge Volume Data - Region 2b ( ) Location Pipeline Hopper Sidecast Currituck Other TOTAL Average Volume (cy) (cy) (cy) (cy) (cy) (cy) (CY / YR) NEW TOPSAIL INLET - - 1,268, ,268, ,315 NEW RIVER INLET - - 2,566,624 14,445-2,581, ,643 BROWN'S INLET OVERALL TOTAL (Potential Nourishment) - - 3,835,088 14,445-3,849, ,958 Table III-17. Summary of Dredge Volume Data - Region 2b ( ) Location Pipeline Hopper Sidecast Currituck Other TOTAL Average Volume (cy) (cy) (cy) (cy) (cy) (cy) (CY / YR) NEW TOPSAIL INLET , ,955 47,326 NEW RIVER INLET ,950 14, , ,399 BROWN'S INLET OVERALL TOTAL (Potential Nourishment) - - 1,099,905 14,445-1,114, ,725 Figure III-27. Number of Dredge Projects - Region 2b by Project Size III-38
143 Figure III-28 shows the cost for total dredging project in Region 2b from 1975 to 2015, in the dollars of that year and the projected 2015 dollars. A summary of the dredge cost data from the database applicable to Region 2b are provided in Table III-18 through Table III-20 separated by the dredge type over the three date ranges as previously mentioned. The costs in the tables are all reported in 2015 dollars. Following the trend for volume in the region the same trend of reducing costs by more than half from $1.4million/yr historically and $572,000/yr in the last five years. Two reasons are possible for this decrease; the reduction in federal funding for shallow draft inlet projects and the recent locally funded beach nourishment projects using these inlets as sand sources. III-39
144 Figure III-28. Total Dredge Cost Data - Region 2b ( ) III-40
145 Table III-18. Dredging Costs - Region 2b ( ) Location Pipeline Hopper Sidecast Currituck Other TOTAL Average Cost ( 2015 $ ) ( 2015 $ ) ( 2015 $ ) ( 2015 $ ) (2015 $) (2015 $) (2015 $ / YR) NEW TOPSAIL INLET $1,769,056 - $19,788,227 $1,817,046 - $23,374,329 $570,106 NEW RIVER INLET $414,294 - $32,173,154 $2,087,452 - $34,674,900 $845,729 BROWN'S INLET OVERALL TOTAL (Potential Nourishment) $2,183,349 - $51,961,381 $3,904,498 - $58,049,229 $1,415,835 Table III-19. Dredging Costs Region 2b ( ) Location Pipeline Hopper Sidecast Currituck Other TOTAL Average Cost ( 2015 $ ) ( 2015 $ ) ( 2015 $ ) ( 2015 $ ) (2015 $) (2015 $) (2015 $ / YR) NEW TOPSAIL INLET - - $3,528, $3,528,384 $320,762 NEW RIVER INLET - - $7,356,432 $157,500 - $7,513,932 $683,085 BROWN'S INLET OVERALL TOTAL (Potential Nourishment) - - $10,884,816 $157,500 - $11,042,316 $1,003,847 Table III-20. Dredging Costs Region 2b ( ) Location Pipeline Hopper Sidecast Currituck Other TOTAL Average Cost ( 2015 $ ) ( 2015 $ ) ( 2015 $ ) ( 2015 $ ) (2015 $) (2015 $) (2015 $ / YR) NEW TOPSAIL INLET - - $805, $805,499 $134,250 NEW RIVER INLET - - $2,469,399 $157,500 - $2,626,899 $437,817 BROWN'S INLET OVERALL TOTAL (Potential Nourishment) - - $3,274,898 $157,500 - $3,432,398 $572,066 Figure III-29 through Figure III-31 show the total, shallow, and deep draft volumes dredged in Region 2c between 1975 and See Figure III-6 for a location map of this sub-region. The shallow draft projects in this region include Bear Inlet, Bogue Inlet, Barden Inlet, and Atlantic Beach Channels. The deep draft project in this area consists of Morehead City Harbor. Please note that the summary tables have the Morehead City Harbor project split into two groups due to the presence of beach compatible (Beaufort Inlet) and non-beach compatible (Morehead City Harbor) material. A summary of the dredge volume data from the database applicable to Region 2c is presented in Table III-21 through Table III-23 separated by the dredge type over the three date ranges as previously mentioned. The average volume dredged has decreased from 1.1 million cy/yr historically to around 440,000 cy/yr in the last five years. The larger decreases appear to be associated with Morehead City Harbor and Barden Inlet. Figure III-32 shows the relative size of projects in Region 2c grouped by whether there was nourishment potential for the material or not. There is a wide range of project size, especially considering Region 2c contains both deep and shallow draft inlets. III-41
146 Figure III-29. Summary of Total Dredging Volume - Region 2c ( ) III-42
147 Figure III-30. Summary of Shallow Draft Dredge Volume - Region 2c ( ) III-43
148 Figure III-31. Summary of Deep Draft Dredge Volume - Region 2c ( ) III-44
149 Table III-21. Summary of Dredge Volume Data - Region 2c ( ) Location Pipeline Hopper Sidecast Currituck Other TOTAL Average Volume (cy) (cy) (cy) (cy) (cy) (cy) (CY / YR) BEAR INLET BOGUE INLET - - 5,553, ,698-5,839, ,434 BEAUFORT INLET (MOREHEAD CITY HARBOR) BARDEN INLET 1,015,069 19,123, , ,317-20,524, ,586 OVERALL TOTAL (Potential Nourishment) 1,015,069 19,123,327 5,725, ,015-26,363, ,020 BEAUFORT HARBOR 988, ,680-1,111,967 27,121 MOREHEAD CITY HARBOR 15,819, ,020 1,725,229 17,581, ,819 ATLANTIC BEACH CHANNELS 130, ,298 3,178 OVERALL TOTAL 17,952,973 19,123,327 5,725, ,715 1,725,229 45,187,651 1,102,138 Table III-22. Summary of Dredge Volume Data - Region 2c ( ) Location Pipeline Hopper Sidecast Currituck Other TOTAL Average Volume (cy) (cy) (cy) (cy) (cy) (cy) (CY / YR) BEAR INLET BOGUE INLET - - 1,263,779 7,180-1,270, ,542 BEAUFORT INLET (MOREHEAD CITY HARBOR) BARDEN INLET 798,727 3,068, ,867, ,566 OVERALL TOTAL (Potential Nourishment) 798,727 3,068,497 1,263,779 7,180-5,138, ,108 BEAUFORT HARBOR , ,680 11,244 MOREHEAD CITY HARBOR ,020 1,725,229 1,762, ,204 ATLANTIC BEACH CHANNELS OVERALL TOTAL 798,727 3,068,497 1,263, ,880 1,725,229 7,024, ,556 Table III-23. Summary of Dredge Volume Data - Region 2c ( ) Location Pipeline Hopper Sidecast Currituck Other TOTAL Average Volume (cy) (cy) (cy) (cy) (cy) (cy) (CY / YR) BEAR INLET BOGUE INLET , , ,456 BEAUFORT INLET (MOREHEAD CITY HARBOR) BARDEN INLET 725, , , ,167 OVERALL TOTAL (Potential Nourishment) 725, , , ,581, ,622 BEAUFORT HARBOR ,185-58,185 9,698 MOREHEAD CITY HARBOR , , , ,708 ATLANTIC BEACH CHANNELS OVERALL TOTAL 725, , ,734 95, ,229 2,622, ,028 III-45
150 Figure III-32. Number of Dredge Projects - Region 2c by Project Size Figure III-33 through Figure III-35 show the total, shallow, and deep draft costs in Region 2c between 1975 and The costs are shown in the dollars of that year and the projected 2015 dollars. A summary of the dredge cost data from the database applicable to Region 2c is presented in Table III-24 through Table III-26 separated by the dredge type over the three date ranges as previously mentioned. The costs in the tables are all reported in 2015 dollars. Although volume has decreased, the cost has remained fairly consistent over the years ranging between $3.6 million/yr and $4.9 million/yr. Again, the reason for the similar costs with less volume is likely due to the increase in relative dredging costs due to the supply and demand issues described in the unit cost discussion on page III-81. III-46
151 Figure III-33. Total Dredge Cost Data - Region 2c ( ) III-47
152 Figure III-34. Total Shallow Draft Cost Data - Region 2c ( ) III-48
153 Figure III-35. Total Deep Draft Cost Data - Region 2c ( ) III-49
154 Table III-24. Dredging Costs - Region 2c ( ) Location Pipeline Hopper Sidecast Currituck Other TOTAL Average Cost ( 2015 $ ) ( 2015 $ ) ( 2015 $ ) ( 2015 $ ) (2015 $) (2015 $) (2015 $ / YR) BEAR INLET BOGUE INLET - - $23,018,225 $1,243,836 - $24,262,061 $591,758 BEAUFORT INLET (MOREHEAD CITY HARBOR) BARDEN INLET $11,014,698 $70,435,173 $668,528 $1,223,995 - $83,342,394 $2,032,741 OVERALL TOTAL (Potential Nourishment) $11,014,698 $70,435,173 $23,686,754 $2,467,831 - $107,604,455 $2,624,499 BEAUFORT HARBOR $5,194, $975,017 - $6,170,008 $150,488 MOREHEAD CITY HARBOR $66,230, $205,246 $18,064,780 $84,500,056 $2,060,977 ATLANTIC BEACH CHANNELS $846, $846,276 $20,641 OVERALL TOTAL $83,285,996 $70,435,173 $23,686,754 $3,648,093 $18,064,780 $199,120,796 $4,856,605 Table III-25. Dredging Costs - Region 2c ( ) Location Pipeline Hopper Sidecast Currituck Other TOTAL Average Cost ( 2015 $ ) ( 2015 $ ) ( 2015 $ ) ( 2015 $ ) (2015 $) (2015 $) (2015 $ / YR) BEAR INLET BOGUE INLET - - $3,600,693 $78,705 - $3,679,398 $334,491 BEAUFORT INLET (MOREHEAD CITY HARBOR) BARDEN INLET $8,988,199 $7,789, $16,777,445 $1,525,222 OVERALL TOTAL (Potential Nourishment) $8,988,199 $7,789,246 $3,600,693 $78,705 - $20,456,843 $1,859,713 BEAUFORT HARBOR $975,017 - $975,017 $88,638 MOREHEAD CITY HARBOR $205,246 $18,064,780 $18,270,026 $1,660,911 ATLANTIC BEACH CHANNELS OVERALL TOTAL $8,988,199 $7,789,246 $3,600,693 $1,258,968 $18,064,780 $39,701,885 $3,609,262 Table III-26. Dredging Costs - Region 2c ( ) Location Pipeline Hopper Sidecast Currituck Other TOTAL Average Cost ( 2015 $ ) ( 2015 $ ) ( 2015 $ ) ( 2015 $ ) (2015 $) (2015 $) (2015 $ / YR) BEAR INLET BOGUE INLET - - $2,044, $2,044,123 $340,687 BEAUFORT INLET (MOREHEAD CITY HARBOR) BARDEN INLET $7,875,150 $968, $8,843,572 $1,473,929 OVERALL TOTAL (Potential Nourishment) $7,875,150 $968,422 $2,044, $10,887,694 $1,814,616 BEAUFORT HARBOR $614,050 - $614,050 $102,342 MOREHEAD CITY HARBOR $205,246 $15,020,277 $15,225,523 $2,537,587 ATLANTIC BEACH CHANNELS OVERALL TOTAL $7,875,150 $968,422 $2,044,123 $819,296 $15,020,277 $26,727,267 $4,454, Region 3 Figure III-36 shows the total volume dredged in Region 3a between 1975 and See Figure III-7 for a location map of this sub-region. The dredging in Region 3a is only attributed to shallow draft projects in Drum Inlet. A summary of the dredge volume data from the database applicable to Region 3a is presented in Table III-27 through Table III-29 separated by the dredge type over the three date ranges as mentioned previously. No dredging events have occurred in this region in the last ten years. The historic average dredged volume is around 21,000 cy/yr. Figure III-37 shows the relative size of the projects in Region 3a, there have only been a few projects but they range in sizes from 500,000 cy and below. All of these projects were considered to have nourishment potential. III-50
155 Figure III-36. Summary of Shallow Draft Volume Region 3a ( ) III-51
156 Table III-27. Summary of Dredge Volume Data - Region 3a ( ) Location Pipeline Hopper Sidecast Currituck Other TOTAL Average Volume (cy) (cy) (cy) (cy) (cy) (cy) (CY / YR) DRUM INLET 103, , , , ,949 21,072 OVERALL TOTAL (Potential Nourishment) 103, , , , ,949 21,072 Table III-28. Summary of Dredge Volume Data - Region 3a ( ) Location Pipeline Hopper Sidecast Currituck Other TOTAL Average Volume (cy) (cy) (cy) (cy) (cy) (cy) (CY / YR) DRUM INLET OVERALL TOTAL (Potential Nourishment) Table III-29. Summary of Dredge Volume Data - Region 3a ( ) Location Pipeline Hopper Sidecast Currituck Other TOTAL Average Volume (cy) (cy) (cy) (cy) (cy) (cy) (CY / YR) DRUM INLET OVERALL TOTAL (Potential Nourishment) Figure III-37. Number of Dredge Projects - Region 3a by Project Size Figure III-38 shows the cost for total dredging projects in Region 3a from 1975 to 2015, in the cost of that year and the projected 2015 cost. A summary of the dredge cost data from the database applicable to Region 3a are provided in Table III-30 through Table III-32 separated by the dredge type over the three date ranges as previously mentioned. The costs in the tables are all reported in 2015 dollars, again there have been no dredge projects in Drum Inlet in the last 10 years. Based on the historical data the average annual cost for the region is just under $120,000/yr. III-52
157 Figure III-38. Total Dredge Cost Data - Region 3a ( ) III-53
158 Table III-30. Dredging Costs - Region 3a ( ) Location Pipeline Hopper Sidecast Currituck Other TOTAL Average Cost ( 2015 $ ) ( 2015 $ ) ( 2015 $ ) ( 2015 $ ) (2015 $) (2015 $) (2015 $ / YR) DRUM INLET $635,004 - $700,637 $354,004 $3,184,058 $4,873,704 $118,871 OVERALL TOTAL (Potential Nourishment) $635,004 - $700,637 $354,004 $3,184,058 $4,873,704 $118,871 Table III-31. Dredging Costs - Region 3a ( ) Location Pipeline Hopper Sidecast Currituck Other TOTAL Average Cost ( 2015 $ ) ( 2015 $ ) ( 2015 $ ) ( 2015 $ ) (2015 $) (2015 $) (2015 $ / YR) DRUM INLET OVERALL TOTAL (Potential Nourishment) Table III-32. Dredging Costs - Region 3a ( ) Location Pipeline Hopper Sidecast Currituck Other TOTAL Average Cost ( 2015 $ ) ( 2015 $ ) ( 2015 $ ) ( 2015 $ ) (2015 $) (2015 $) (2015 $ / YR) DRUM INLET OVERALL TOTAL (Potential Nourishment) Figure III-39 shows the total volume dredged in Region 3b between 1975 and See Figure III-8 for a location map of this sub-region. The dredging in Region 3b is only attributed to shallow draft projects in Hatteras Inlet, Ocracoke Inlet, Far Creek, Rollinson Channel, and Silver Lake Harbor. Please note that Far Creek, Rollinson Channel, and Silver Lake Harbor are interior soundside channels. The spike in volume in 2008 is attributed to the dredging of the Far Creek interior channels. A summary of the dredge volume data from the database applicable to Region 3b is presented in Table III-33 through Table III-35 separated by the dredge type over the three date ranges as mentioned previously. Dredging volumes in this region have shown a slight increase from about 200,000 cy/yr historically to around 325,000 cy/yr in the last five years. Figure III-40 shows the relative size of the projects in Region 3b, the projects with nourishment potential were generally under 250,000 cy while the larger projects without nourishment potential ranged up to 1 million cy. III-54
159 Figure III-39. Summary of Shallow Draft Volume - Region 3b ( ) III-55
160 Table III-33. Summary of Dredge Volume Data - Region 3b ( ) Location Pipeline Hopper Sidecast Currituck Other TOTAL Average Volume (cy) (cy) (cy) (cy) (cy) (cy) (CY / YR) OCRACOKE INLET - - 1,012,556 10,800-1,023,356 24,960 HATTERAS INLET ,790 31, ,073 18,294 OVERALL TOTAL (Potential Nourishment) - - 1,731,346 42,083-1,773,429 43,254 FAR CREEK 1,577, ,577,905 38,485 ROLLINSON CHANNEL 1,051, ,170 13,180-1,477,981 36,048 SILVER LAKE HARBOR 2,457, , ,305,795 80,629 OVERALL TOTAL 5,087,289-2,992,558 55,263-8,135, ,417 Table III-34. Summary of Dredge Volume Data - Region 3b ( ) Location Pipeline Hopper Sidecast Currituck Other TOTAL Average Volume (cy) (cy) (cy) (cy) (cy) (cy) (CY / YR) OCRACOKE INLET , ,770 42,161 HATTERAS INLET ,070 26, ,323 41,211 OVERALL TOTAL (Potential Nourishment) ,840 26, ,093 83,372 FAR CREEK 854, ,300 77,664 ROLLINSON CHANNEL 450, ,820 13, ,000 74,000 SILVER LAKE HARBOR , ,161 60,287 OVERALL TOTAL 1,304,300-1,904,821 39,433-3,248, ,323 Table III-35. Summary of Dredge Volume Data - Region 3b ( ) Location Pipeline Hopper Sidecast Currituck Other TOTAL Average Volume (cy) (cy) (cy) (cy) (cy) (cy) (CY / YR) OCRACOKE INLET , ,540 61,090 HATTERAS INLET ,030 26, ,283 67,381 OVERALL TOTAL (Potential Nourishment) ,570 26, , ,471 FAR CREEK ROLLINSON CHANNEL 450, ,820 13, , ,667 SILVER LAKE HARBOR , ,620 58,437 OVERALL TOTAL 450,000-1,446,010 39,433-1,935, ,574 III-56
161 Figure III-40. Number of Dredge Projects - Region 3b by Project Size Figure III-41 shows the cost for total dredging projects in Region 3b from 1975 to 2015, in the cost of that year and the projected 2015 cost. A summary of the dredge cost data from the database applicable to Region 3b are provided in Table III-36 through Table III-38 separated by the dredge type over the three date ranges as previously mentioned. The costs in the tables are all reported in 2015 dollars. The average cost trend reflects the observed increase in volume; increasing from $1.2 million/yr historically to $1.5 million/yr in the last five years. III-57
162 Figure III-41. Total Dredge Cost Data - Region 3b ( ) III-58
163 Table III-36. Dredging Costs - Region 3b ( ) Location Pipeline Hopper Sidecast Currituck Other TOTAL Average Cost ( 2015 $ ) ( 2015 $ ) ( 2015 $ ) ( 2015 $ ) (2015 $) (2015 $) (2015 $ / YR) OCRACOKE INLET - - $3,906,682 $37,857 - $3,944,538 $96,208 HATTERAS INLET - - $1,877,528 $660,615 - $2,538,143 $61,906 OVERALL TOTAL (Potential Nourishment) - - $5,784,210 $698,471 - $6,482,681 $158,114 FAR CREEK $12,284, $12,284,771 $299,629 ROLLINSON CHANNEL $8,234,398 - $2,691,358 $176,352 - $11,102,108 $270,783 SILVER LAKE HARBOR $15,837,429 - $3,001, $18,838,845 $459,484 OVERALL TOTAL $36,356,599 - $11,476,984 $874,824 - $48,708,406 $1,188,010 Table III-37. Dredging Costs - Region 3b ( ) Location Pipeline Hopper Sidecast Currituck Other TOTAL Average Cost ( 2015 $ ) ( 2015 $ ) ( 2015 $ ) ( 2015 $ ) (2015 $) (2015 $) (2015 $ / YR) OCRACOKE INLET - - $1,335, $1,335,946 $121,450 HATTERAS INLET - - $1,391,104 $653,737 - $2,044,840 $185,895 OVERALL TOTAL (Potential Nourishment) - - $2,727,049 $653,737 - $3,380,786 $307,344 FAR CREEK $8,438, $8,438,812 $767,165 ROLLINSON CHANNEL $3,581,971 - $1,193,026 $176,352 - $4,951,349 $450,123 SILVER LAKE HARBOR - - $2,083, $2,083,206 $189,382 OVERALL TOTAL $12,020,782 - $6,003,281 $830,089 - $18,854,152 $1,714, Region 4 Table III-38. Dredging Costs - Region 3b ( ) Location Pipeline Hopper Sidecast Currituck Other TOTAL Average Cost ( 2015 $ ) ( 2015 $ ) ( 2015 $ ) ( 2015 $ ) (2015 $) (2015 $) (2015 $ / YR) OCRACOKE INLET - - $1,070, $1,070,672 $178,445 HATTERAS INLET - - $1,295,517 $653,737 - $1,949,254 $324,876 OVERALL TOTAL (Potential Nourishment) - - $2,366,189 $653,737 - $3,019,926 $503,321 FAR CREEK ROLLINSON CHANNEL $3,581,971 - $1,193,026 $176,352 - $4,951,349 $825,225 SILVER LAKE HARBOR - - $1,206, $1,206,840 $201,140 OVERALL TOTAL $3,581,971 - $4,766,055 $830,089 - $9,178,115 $1,529,686 Figure III-42 shows the total volume dredged in Region 4a between 1975 and See Figure III-9 for a location map of this sub-region. The dredging in Region 4a is only attributed to shallow draft projects in Avon Harbor and Rodanthe Channel (soundside channels). A summary of the dredge volume data from the database applicable to Region 4a is presented in Table III-39 through Table III-41 separated by the dredge type over the three date ranges as previously mentioned. Dredging in this region has increased in recent years from 7,000 cy/yr historically to 24,000 cy/yr in the past five years. Figure III-43 shows the relative size of the projects in Region 4a. The few projects that have occurred are considered to not have any nourishment potential and are under 250,000 cy. III-59
164 Figure III-42. Summary of Shallow Draft Volume - Region 4a ( ) III-60
165 Table III-39. Summary of Dredge Volume Data - Region 4a ( ) Location Pipeline Hopper Sidecast Currituck Other TOTAL Average Volume (cy) (cy) (cy) (cy) (cy) (cy) (CY / YR) AVON HARBOR 126, ,877 3,095 RODANTHE CHANNEL ,650-8, ,650 3,699 OVERALL TOTAL 126, ,650-8, ,527 6,793 Table III-40. Summary of Dredge Volume Data - Region 4a ( ) Location Pipeline Hopper Sidecast Currituck Other TOTAL Average Volume (cy) (cy) (cy) (cy) (cy) (cy) (CY / YR) AVON HARBOR RODANTHE CHANNEL ,650-8, ,650 13,786 OVERALL TOTAL ,650-8, ,650 13,786 Table III-41. Summary of Dredge Volume Data - Region 4a ( ) Location Pipeline Hopper Sidecast Currituck Other TOTAL Average Volume (cy) (cy) (cy) (cy) (cy) (cy) (CY / YR) AVON HARBOR RODANTHE CHANNEL , ,650 23,942 OVERALL TOTAL , ,650 23,942 Figure III-43. Number of Dredge Projects Region - 4a by Project Size Figure III-44 shows the cost for total dredging projects in Region 4a from 1975 to 2015, in the cost of that year and the projected 2015 cost. A summary of the dredge cost data from the database applicable to Region 4a are provided in Table III-42 through Table III-44 separated by the dredge type over the three date ranges as previously mentioned. The costs in the tables are all reported in 2015 dollars. Costs have ranged from $40,000/yr to $75,000/yr in the past 5 years, reflecting the increase in volume. III-61
166 Figure III-44. Total Dredge Cost Data - Region 4a ( ) III-62
167 Table III-42. Dredging Costs - Region 4a ( ) Location Pipeline Hopper Sidecast Currituck Other TOTAL Average Cost ( 2015 $ ) ( 2015 $ ) ( 2015 $ ) ( 2015 $ ) (2015 $) (2015 $) (2015 $ / YR) AVON HARBOR $2,383, $2,383,602 $58,137 RODANTHE CHANNEL - - $435,144 - $24,411 $459,555 $11,209 OVERALL TOTAL $2,383,602 - $435,144 - $24,411 $2,843,157 $69,345 Table III-43. Dredging Costs - Region 4a ( ) Location Pipeline Hopper Sidecast Currituck Other TOTAL Average Cost ( 2015 $ ) ( 2015 $ ) ( 2015 $ ) ( 2015 $ ) (2015 $) (2015 $) (2015 $ / YR) AVON HARBOR RODANTHE CHANNEL - - $435,144 - $24,411 $459,555 $41,778 OVERALL TOTAL (Potential Nourishment) - - $435,144 - $24,411 $459,555 $41,778 Table III-44. Dredging Costs - Region 4a ( ) Location Pipeline Hopper Sidecast Currituck Other TOTAL Average Cost ( 2015 $ ) ( 2015 $ ) ( 2015 $ ) ( 2015 $ ) (2015 $) (2015 $) (2015 $ / YR) AVON HARBOR RODANTHE CHANNEL - - $435, $435,144 $72,524 OVERALL TOTAL - - $435, $435,144 $72,524 Figure III-45 shows the total volume dredged in Region 4b between 1975 and See Figure III-10 for a location map of this sub-region. The dredging in Region 4b is only attributed to shallow draft projects in Oregon Inlet, Stumpy Point Bay, and Shallowbag Bay. A summary of the dredge volume data from the database applicable to Region 4b is presented in Table III-45 through Table III-47 separated by the dredge type over the three date ranges as mentioned previously. Volumes dredged in this region has decreased by about half from about 1.1 million cy/yr historically to under 600,000 cy/yr in the past 5 years. Figure III-46 shows the relative size of the projects in Region 4b and are separated as to whether the dredged material did or did not have nourishment potential. The projects vary in size from under 50,000 cy to up to 1 million cy which would be attributed to the larger volumes removed from Oregon Inlet. It should be noted that in FY 16, Dare County, The State, and the USACE have started a program to better maintain Oregon Inlet. The dredging volume for Oregon Inlet alone was 925,622 cy in FY 16. III-63
168 Figure III-45. Summary of Shallow Draft Volume - Region 4b ( ) III-64
169 Table III-45. Summary of Dredge Volume Data - Region 4b ( ) Location Pipeline Hopper Sidecast Currituck Other TOTAL Average Volume (cy) (cy) (cy) (cy) (cy) (cy) (CY / YR) OREGON INLET 994,923 8,898,146 20,899,760 1,466,392-32,259, ,810 OVERALL TOTAL (Potential Nourishment) 994,923 8,898,146 20,899,760 1,466,392-32,259, ,810 STUMPY POINT BAY 444, ,632 10,845 SHALLOWBAG BAY 12,425, ,000 12,925, ,255 OVERALL TOTAL 13,864,993 8,898,146 20,899,760 1,466, ,000 45,629,291 1,112,910 Table III-46. Summary of Dredge Volume Data - Region 4b ( ) Location Pipeline Hopper Sidecast Currituck Other TOTAL Average Volume (cy) (cy) (cy) (cy) (cy) (cy) (CY / YR) OREGON INLET - - 5,638,457 1,028,540-6,666, ,091 OVERALL TOTAL (Potential Nourishment) - - 5,638,457 1,028,540-6,666, ,091 STUMPY POINT BAY 79, ,865 7,260 SHALLOWBAG BAY 30, , ,850 48,259 OVERALL TOTAL 110,715-5,638,457 1,028, ,000 7,277, ,610 Table III-47. Summary of Dredge Volume Data - Region 4b ( ) Location Pipeline Hopper Sidecast Currituck Other TOTAL Average Volume (cy) (cy) (cy) (cy) (cy) (cy) (CY / YR) OREGON INLET - - 2,235, ,035-3,000, ,149 OVERALL TOTAL (Potential Nourishment) - - 2,235, ,035-3,000, ,149 STUMPY POINT BAY 79, ,865 13,311 SHALLOWBAG BAY , ,000 83,333 OVERALL TOTAL 79,865-2,235, , ,000 3,580, ,793 Figure III-46. Number of Dredge Projects - Region 4b by Project Size III-65
170 Figure III-47 shows the cost for total dredging projects in Region 4b from 1975 to 2015, in the cost of that year and the projected 2015 cost. A summary of the dredge costa data from the database applicable to Region 4b are provided in Table III-48 through Table III-50 separated by the dredge type over the three date ranges as previously mentioned. The cost data reflects the change in volume also decreasing by about half from about $7 millon/yr historically and around $3 million/yr in the past five years. This precipitous decrease in volume and costs are attributed to the fact that federal funds for shallow draft projects has been severely cut in recent years. This decrease is also due to the fact that a portion of the Oregon Inlet projects are now included within the beach nourishment database since beach placement has been occurring more frequently as of late. Nonetheless, it should be noted that in FY 16, Dare County, The State, and the USACE have started a program to better maintain Oregon Inlet. The dredging cost for Oregon Inlet alone was $7.9 M in FY 16. III-66
171 Figure III-47. Total Dredge Cost Data Region 4b ( ) III-67
172 Table III-48. Dredging Costs - Region 4b ( ) Location Pipeline Hopper Sidecast Currituck Other TOTAL Average Cost ( 2015 $ ) ( 2015 $ ) ( 2015 $ ) ( 2015 $ ) (2015 $) (2015 $) (2015 $ / YR) OREGON INLET $6,389,602 $62,779,204 $99,393,447 $7,532,588 - $176,094,842 $4,294,996 OVERALL TOTAL (Potential Nourishment) $6,389,602 $62,779,204 $99,393,447 $7,532,588 - $176,094,842 $4,294,996 STUMPY POINT BAY $2,239, $2,239,055 $54,611 SHALLOWBAG BAY $99,409, $4,804,138 $104,213,165 $2,541,785 OVERALL TOTAL $108,037,684 $62,779,204 $99,393,447 $7,532,588 $4,804,138 $282,547,062 $6,891,392 Table III-49. Dredging Costs - Region 4b ( ) Location Pipeline Hopper Sidecast Currituck Other TOTAL Average Cost ( 2015 $ ) ( 2015 $ ) ( 2015 $ ) ( 2015 $ ) (2015 $) (2015 $) (2015 $ / YR) OREGON INLET - - $18,152,023 $4,706,810 - $22,858,833 $2,078,076 OVERALL TOTAL (Potential Nourishment) - - $18,152,023 $4,706,810 - $22,858,833 $2,078,076 STUMPY POINT BAY $669, $669,501 $60,864 SHALLOWBAG BAY $1,354, $4,804,138 $6,158,214 $559,838 OVERALL TOTAL $2,023,577 - $18,152,023 $4,706,810 $4,804,138 $29,686,548 $2,698,777 Table III-50. Dredging Costs - Region 4b ( ) Location Pipeline Hopper Sidecast Currituck Other TOTAL Average Cost ( 2015 $ ) ( 2015 $ ) ( 2015 $ ) ( 2015 $ ) (2015 $) (2015 $) (2015 $ / YR) OREGON INLET - - $7,901,105 $3,485,350 - $11,386,455 $1,897,743 OVERALL TOTAL (Potential Nourishment) - - $7,901,105 $3,485,350 - $11,386,455 $1,897,743 STUMPY POINT BAY $669, $669,501 $111,583 SHALLOWBAG BAY $4,804,138 $4,804,138 $800,690 OVERALL TOTAL $669,501 $0 $7,901,105 $3,485,350 $4,804,138 $16,860,094 $2,810,016 No dredging projects have taken place in Region 4c to date. Therefore, no dredging figures or tables are shown for this sub-region. See Figure III-11 for a location map of this sub-region. 5. Statewide Overall Summary Figure III-48 shows the total volume for shallow draft dredging that occurred statewide from 1975 to Figure III-49 shows the total volume for deep draft dredging that occurred statewide from 1975 to III-68
173 Figure III-48. Summary of Shallow Draft Volume - Statewide ( ) III-69
174 Figure III-49. Summary of Deep Draft Volume - Statewide ( ) III-70
175 Figure III-50 shows the total volume of dredging for the AIWW and Inland Waterways including; Edenton Harbor, Mile Hammock, Wrights Creek, Waterway Connecting Pamlico Sound and Beaufort Harbor, Waterway Connecting Swanquarter Bay with Deep Bay, and Inlet Crossings. The AIWW and Inland Waterways have been separated from other shallow draft projects because at this time these projects are still federally funded and the existing database did not provide enough geographic breakdown of AIWW projects to place into specific regions. A summary of the dredge volume data from the database applicable to AIWW and Inland Waterways is presented in Table III-51 through Table III-53 separated by the dredge type over the three date ranges as previously mentioned. Volumes dredged in the AIWW and Inland Waterways have decreased drastically from around 725,000 cy/yr historically to now under 50,000 cy/yr in the past 5 years. Figure III-51 shows the relative size of the projects across the AIWW and Inland Waterways, these projects are considered to have nourishment potential. The projects range in size up to 1-2 million cubic yards but most are between 100,000 to 500,000 cy. However, please note that AIWW projects that did include beach placement are not included in this database but are included in the beach nourishment database. III-71
176 Figure III-50. Summary of Shallow Draft Volume - AIWW & Inland Waterways ( ) III-72
177 Table III-51. Summary of Dredge Volume Data AIWW & Inland Waterways ( ) Location Pipeline Hopper Sidecast Currituck Other TOTAL Average Volume (cy) (cy) (cy) (cy) (cy) (cy) (CY / YR) INLET CROSSING 5,473, ,473, ,489 ATLANTIC INTERCOASTAL WATERWAY 20,338, , ,936-21,099, ,620 EDENTON HARBOR 17, , MILE HAMMOCK 280, ,000 6,829 WATERWAY CONNECTING PALMICO SOUND 858,867-9,205 7, ,212 21,347 WATERWAY CONNECTING SWANQUARTER BAY 1,249, , ,937,063 47,245 WRIGHTS CREEK 66, ,584 1,624 OVERALL TOTAL (Potential Nourishment) 28,283, , , ,076-29,748, ,571 Table III-52. Summary of Dredge Volume Data - AIWW & Inland Waterways ( ) Location Pipeline Hopper Sidecast Currituck Other TOTAL Average Volume (cy) (cy) (cy) (cy) (cy) (cy) (CY / YR) INLET CROSSING 565, ,822 51,438 ATLANTIC INTERCOASTAL WATERWAY 333, , ,333 30,758 EDENTON HARBOR MILE HAMMOCK WATERWAY CONNECTING PALMICO SOUND WATERWAY CONNECTING SWANQUARTER BAY WRIGHTS CREEK OVERALL TOTAL (Potential Nourishment) 899, , ,155 82,196 Table III-53. Summary of Dredge Volume Data AIWW & Inland Waterways ( ) Location Pipeline Hopper Sidecast Currituck Other TOTAL Average Volume (cy) (cy) (cy) (cy) (cy) (cy) (CY / YR) INLET CROSSING 146, ,104 24,351 ATLANTIC INTERCOASTAL WATERWAY 139, , ,663 23,944 EDENTON HARBOR MILE HAMMOCK WATERWAY CONNECTING PALMICO SOUND WATERWAY CONNECTING SWANQUARTER BAY WRIGHTS CREEK OVERALL TOTAL (Potential Nourishment) 285, , ,767 48,295 III-73
178 Figure III-51. Number of Dredge Projects AIWW & Inland Waterways by Project Size In summary, Figure III-52 shows the picture of total dredging volumes in the state (shallow, deep, and AIWW & Inland Waterways) between 1975 and The dredging volume is then separated out by region in Figure III-53, Region 1 contains Wilmington Harbor and Region 2c Morehead City Harbor which are the deep draft ports in the State. A summary of all the dredge volume data from the database is presented in Table III-54 through Table III-56 separated by region and shallow and deep draft over the three date ranges previously mentioned. Statewide dredging volume has decreased from 6 million cy/yr historically to under 4.5 million cy/yr in the past 5 years. Breaking the statewide trend down to shallow and deep; deep draft volumes have remained constant around 3 million cy/yr while shallow draft volumes have reduced from 3 million cy/yr historically to around 1.5 million cy/yr in the past five years. Again, it is posited that the main reason for these reductions in volume are the reduction in federal funds for both deep and shallow draft projects in NC. As a minor effect, that fact that more of the projects are now included in the beach nourishment database has also affected these results since beneficial use of this dredged material is being promoted more. III-74
179 Figure III-52. Summary of Total Dredge Volume - Statewide ( ) III-75
180 Figure III-53. Summary of Total Dredge Volume by Region ( ) III-76
181 Table III-54. Summary of Statewide Dredging Volumes ( ) Location Shallow Deep Total Average Volume (cy) (cy) (cy) (CY/YR) Region 1 7,832,507 86,703,332 94,535,839 2,305,752 Region 2a 7,393,055-7,393, ,318 Region 2b 14,380,414-14,380, ,742 Region 2c 6,645,789 38,541,862 45,187,651 1,102,138 Region 3a 863, ,949 21,072 Region 3b 8,135,110-8,135, ,417 Region 4a 278, ,527 6,793 Region 4b 45,629,291-45,629,291 1,112,910 AIWW & Inland Waterways 29,748,396-29,748, ,571 StatewideTotal 120,907, ,245, ,152,232 6,003,713 Statewide Average 2,948,952 3,054,761 6,003,713 N/A Table III-55. Summary of Statewide Dredging Volumes ( ) Location Shallow Deep Total Average Volume (cy) (cy) (cy) (CY/YR) Region 1 2,124,170 28,641,073 30,765,243 2,796,840 Region 2a 1,893,565-1,893, ,142 Region 2b 3,849,533-3,849, ,958 Region 2c 1,344,686 5,679,426 7,024, ,556 Region 3a Region 3b 3,248,554-3,248, ,323 Region 4a 151, ,650 13,786 Region 4b 7,277,712-7,277, ,610 AIWW & Inland Waterways 904, ,155 82,196 StatewideTotal 20,794,025 34,320,499 55,114,524 5,010,411 Statewide Average 1,890,366 3,120,045 5,010,411 N/A Table III-56. Summary of Statewide Dredging Volumes ( ) Location Shallow Deep Total Average Volume (cy) (cy) (cy) (CY/YR) Region 1 597,025 15,800,902 16,397,927 2,732,988 Region 2a 732, , ,051 Region 2b 1,114,350-1,114, ,725 Region 2c 656,734 1,965,434 2,622, ,028 Region 3a Region 3b 1,935,443-1,935, ,574 Region 4a 143, ,650 23,942 Region 4b 3,580,760-3,580, ,793 AIWW & Inland Waterways 289, ,767 48,295 StatewideTotal 9,050,034 17,766,336 26,816,370 4,469,395 Statewide Average 1,508,339 2,961,056 4,469,395 N/A III-77
182 Figure III-54 shows the cost breakdown (federal, state, and local funds) for shallow draft projects statewide from 1975 to 2015 in 2015 dollars. Up until the Shallow Draft Navigation Channel and Lake Dredging Fund was established in 2013 all shallow draft projects in the State were paid for by federal funds. After 2013, shallow draft projects have been paid for by State and Local funds, at first the cost share was State-Local, then in 2015 it was changed to be State-Local (with the exception of Hyde County where it is State-Local) based on an existing economic tiering system. Figure III-55 shows the unit cost of shallow draft projects statewide from 1975 to From over 1,000 shallow draft projects in the database 66% contained actual cost data that were used to create this graph. In addition these data points were plotted with 3% and 6% inflation lines to analyze increasing trends in unit cost. The outliers in unit cost would be due to projects that were delayed due to weather. III-78
183 Figure III-54. Total Shallow Draft Cost Data - Statewide ( ) III-79
184 Figure III-55. Shallow Draft Unit Cost - Statewide ( ) III-80
185 Figure III-56 shows the cost for deep draft projects statewide from 1975 to To date deep draft projects are only federally funded, so there is no breakdown of cost on a state and local level like with the shallow draft projects. This figure compares the total federal cost in dollars of that year with total federal cost in 2015 dollars. Figure III-57 shows the unit cost of deep draft projects statewide from 1975 to From 180 deep draft projects in the database 49% contained actual cost data that were used to create this graph. In addition these data points were plotted with 3% and 6% inflation lines to analyze increasing trends in unit cost. Some of the outliers in unit cost would be due to the more costly clamshell and bucket dredge projects that occurred in Wilmington Harbor Anchorage Basin. In comparison, Figure III-58 shows the unit cost of deep draft projects statewide from 1975 to 2015 including the projects where deep draft material was beneficially used. From 201 deep draft projects including those that also had beneficial use 51% contained actual cost data that were used to create this graph. In addition these data points were plotted with 3% and 6% inflation lines to analyze increasing trends in unit cost. When beneficial use projects are incorporated into the deep draft unit cost graph, there are more unit costs that appear above the 6% inflation line. Nonetheless, both graphs show that recent deep draft unit costs are well outpacing any reasonable inflation estimate. Since nearly all deep draft projects are completed by private companies, this rise in unit costs confirms the known supply and demand issues concerning the dredging industry. Needs for dredging and coastal storm damage reduction projects have begun growing at a rapid pace nationally with increased hurricane damage (Katrina, Rita, Sandy, etc.) and the current dredging fleet has not been able to keep pace. III-81
186 Figure III-56. Total Deep Draft Cost Data - Statewide ( ) III-82
187 Figure III-57. Deep Draft Unit Cost - Statewide ( ) III-83
188 Figure III-58. Deep Draft Unit Cost with Beneficial Use ( ) III-84
189 Figure III-59 shows the cost for AIWW and Inland Waterways projects statewide from 1975 to To date AIWW and Inland Waterways are only federally funded, so there is not breakdown of cost on a state and local level like with the other shallow draft projects. This figure compares the total federal cost in dollars of that year with the total federal cost in 2015 dollars. A summary of the dredge cost data from the database applicable to AIWW and Inland Waterways is presented in Table III-57 through Table III-59 separated by the dredge type over the three date ranges as previously mentioned. Cost for AIWW and Inland Waterways has also decreased drastically, reflecting the volume trend, from $5.4 million/yr historically to under $600,000/yr in the past 5 years. Again, this trend shows the effect of decreased federal funding for those projects. III-85
190 Figure III-59. Total Dredge Data - AIWW & Inland Waterways ( ) III-86
191 Table III-57. Dredging Costs - AIWW & Inland Waterways ( ) Location Pipeline Hopper Sidecast Currituck Other TOTAL Average Cost ( 2015 $ ) ( 2015 $ ) ( 2015 $ ) ( 2015 $ ) (2015 $) (2015 $) (2015 $ / YR) INLET CROSSING $47,343, $47,343,905 $1,154,729 ATLANTIC INTERCOASTAL WATERWAY $149,335,376 - $1,486,422 $4,143,876 - $154,965,674 $3,779,651 EDENTON HARBOR $248, $248,737 $6,067 MILE HAMMOCK $2,759, $2,759,796 $67,312 WATERWAY CONNECTING PALMICO SOUND $6,884,849 - $86,850 $56,472 - $7,028,170 $171,419 WATERWAY CONNECTING SWANQUARTER BAY $4,413,813 $2,648, $7,062,311 $172,251 WRIGHTS CREEK $382, $382,028 $9,318 OVERALL TOTAL (Potential Nourishment) $211,368,504 $2,648,498 $1,573,272 $4,200,348 - $219,790,621 $5,360,747 Table III-58. Dredging Costs - AIWW & Inland Waterways ( ) Location Pipeline Hopper Sidecast Currituck Other TOTAL Average Cost ( 2015 $ ) ( 2015 $ ) ( 2015 $ ) ( 2015 $ ) (2015 $) (2015 $) (2015 $ / YR) INLET CROSSING $6,972, $6,972,329 $633,848 ATLANTIC INTERCOASTAL WATERWAY $3,636, $61,773 - $3,697,955 $336,178 EDENTON HARBOR MILE HAMMOCK WATERWAY CONNECTING PALMICO SOUND WATERWAY CONNECTING SWANQUARTER BAY WRIGHTS CREEK OVERALL TOTAL (Potential Nourishment) $10,608, $61,773 - $10,670,284 $970,026 Table III-59. Dredging Costs - AIWW & Inland Waterways ( ) Location Pipeline Hopper Sidecast Currituck Other TOTAL Average Cost ( 2015 $ ) ( 2015 $ ) ( 2015 $ ) ( 2015 $ ) (2015 $) (2015 $) (2015 $ / YR) INLET CROSSING $1,790, $1,790,568 $298,428 ATLANTIC INTERCOASTAL WATERWAY $1,532, $61,773 - $1,594,271 $265,712 EDENTON HARBOR MILE HAMMOCK WATERWAY CONNECTING PALMICO SOUND WATERWAY CONNECTING SWANQUARTER BAY WRIGHTS CREEK OVERALL TOTAL (Potential Nourishment) $3,323, $61,773 - $3,384,839 $564,140 In summary, Figure III-60 shows the graph of total dredging costs in the state (federal, deep, and AIWW & Inland Waterways) between 1975 and The dredging costs is then separated out by region in Figure III-61, where total cost in dollars of that year is compared with total cost. Please recall that Region 1 and Region 2c contain the deep draft ports in the State. Figure III-60 also shows a line depicting the 4 year moving average of total cost of dredging in 2015 dollars which shows a long term average of $25-$30 million. A summary of all the dredge cost data from the database is presented in Table III-60 through Table III-62 separated by region and broken out in shallow (federal, state, local) and deep draft costs over the three date ranges mentioned previously, which confirms the consistent $25-$30 million average spending. Federal spending on shallow draft projects (including the AIWW & Inland Waterways) was historically $17 million/yr (Table III-60). If the Shallow Draft Navigation Channel and Lake Dredging Fund has a projected $19 million/yr in revenue then in theory all shallow draft projects including the AIWW can be sustained by State and Local funding. This will allow some room to improve conditions if the local interests agree to participate and begin maintaining to historical conditions as some are beginning to do (e.g. Oregon Inlet). Deep draft dredging across III-87
192 the state has increased from $12 million/yr historically to $21 million/yr in the past five years while only maintaining the same dredged volumes (Table III-54 - Table III-56) for deeper channel depths. This increasing cost trend shows the need to fund the Deep Draft Navigation Channel Dredging and Maintenance Fund by the state to ensure the ports are maintained. Total statewide dredging spending ranges between $25 million/yr to $30 million/yr. III-88

193 Figure III-60. Total Dredge Cost Data - Statewide ( ) III-89
194 Figure III-61. Summary of Total Dredging Costs by Region ( ) III-90
195 Table III-60. Dredging Costs - Statewide ( ) Shallow Deep Total Average Cost Location Federal State Local (2015 $) (2015 $) (2015 $) (2015 $/ yr) Region 1 $ 38,191,224 $ 514,440 $ 454,090 $ 338,524,877 $ 377,684,630 $ 9,211,820 Region 2a $ 29,343,028 $ 571,418 $ 489,818 - $ 30,404,263 $ 741,567 Region 2b $ 56,692,490 $ 811,343 $ 545,395 - $ 58,049,229 $ 1,415,835 Region 2c $ 29,739,641 $ 200,384 $ 200,384 $ 168,980,388 $ 199,120,796 $ 4,856,605 Region 3a $ 4,873, $ 4,873,704 $ 118,871 Region 3b $ 45,124,573 $ 1,949,541 $ 1,634,291 - $ 48,708,406 $ 1,188,010 Region 4a $ 2,547,286 $ 147,935 $ 147,935 - $ 2,843,157 $ 69,345 Region 4b $ 278,365,020 $ 2,314,018 $ 1,868,023 - $ 282,547,062 $ 6,891,392 AIWW & Inland Waterways $ 219,790, $ 219,790,621 $ 5,360,747 StatewideTotal $ 704,667,587 $ 6,509,079 $ 5,339,936 $ 507,505,265 $ 1,224,021,866 $ 29,854,192 Statewide Average $ 17,187,014 $ 158,758 $ 130,242 $ 12,378,177 $ 29,854,192 N/A Table III-61. Dredging Costs - Statewide ( ) Shallow Deep Total Average Cost Location Federal State Local (2015 $) (2015 $) (2015 $) (2015 $/ yr) Region 1 $ 4,889,139 $ 514,440 $ 454,090 $ 153,045,008 $ 158,902,677 $ 14,445,698 Region 2a $ 4,673,967 $ 571,418 $ 489,818 - $ 5,735,202 $ 521,382 Region 2b $ 9,685,578 $ 811,343 $ 545,395 - $ 11,042,316 $ 1,003,847 Region 2c $ 4,391,679 $ 200,384 $ 200,384 $ 34,909,439 $ 39,701,885 $ 3,609,262 Region 3a Region 3b $ 15,270,320 $ 1,949,541 $ 1,634,291 - $ 18,854,152 $ 1,714,014 Region 4a $ 163,685 $ 147,935 $ 147,935 - $ 459,555 $ 41,778 Region 4b $ 25,504,507 $ 2,314,018 $ 1,868,023 - $ 29,686,548 $ 2,698,777 AIWW & Inland Waterways $ 10,670, $ 10,670,284 $ 970,026 StatewideTotal $ 75,249,159 $ 6,509,079 $ 5,339,936 $ 187,954,447 $ 275,052,620 $ 25,004,784 Statewide Average $ 6,840,833 $ 591,734 $ 485,449 $ 17,086,768 $ 25,004,784 N/A Table III-62. Dredging Costs - Statewide ( ) Shallow Deep Total Average Cost Location Federal State Local (2015 $) (2015 $) (2015 $) (2015 $/ yr) Region 1 $ 996,018 $ 514,440 $ 454,090 $ 103,146,635 $ 105,111,183 $ 17,518,530 Region 2a $ 1,473,364 $ 571,418 $ 489,818 - $ 2,534,599 $ 422,433 Region 2b $ 2,075,660 $ 811,343 $ 545,395 - $ 3,432,398 $ 572,066 Region 2c $ 1,643,355 $ 200,384 $ 200,384 $ 24,683,145 $ 26,727,267 $ 4,454,545 Region 3a Region 3b $ 5,594,282 $ 1,949,541 $ 1,634,291 - $ 9,178,115 $ 1,529,686 Region 4a $ 139,273 $ 147,935 $ 147,935 - $ 435,144 $ 72,524 Region 4b $ 12,678,053 $ 2,314,018 $ 1,868,023 - $ 16,860,094 $ 2,810,016 AIWW & Inland Waterways $ 3,384, $ 3,384,839 $ 564,140 StatewideTotal $ 27,984,845 $ 6,509,079 $ 5,339,936 $ 127,829,780 $ 167,663,639 $ 27,943,940 Statewide Average $ 4,664,141 $ 1,084,846 $ 889,989 $ 21,304,963 $ 27,943,940 N/A III-91
196 Beach Nourishment Overview Beach nourishment is a term that describes a process by which beach compatible sediment is placed on a beach. It involves the transport of the nourishment material (beach fill) from an outside source to the affected area (usually by dredging although upland sediment sources can be utilized by trucking). The two main types of dredges used in beach nourishment projects are the pipeline (cutterhead) dredge and hopper dredge. As described previously, pipeline dredges are typically used when dredging inlets and adjacent waterways due to the low draft of the vessel. The cutter head excavates sand which is feed into a pipe and pumped to the beach where it is then placed by equipment on the beach. An example of this type of project is shown in Figure III-62. The hopper dredge typically excavate sand offshore at relatively deeper depths. The drag arms excavate the sand which is collected in the hopper of the vessel. The vessel then travels nearshore of the placement site where it connects to a pipe on the sea floor. The material is then pumped onshore and placed by equipment on the beach. An example of this type of project is shown in Figure III-63. Beach nourishment adds sand to the beach system thereby widening a beach and advancing the shoreline seaward. Beach nourishment is frequently used as part of a coastal protection scheme. Beach nourishment projects are generally designed and engineered to work like natural beaches, allowing sand to shift in response to changing waves and water levels. Once placed, sand is redistributed gradually by natural processes affecting the beach system. A poorly-designed and/or executed beach nourishment project can result in a severely impacted ecosystem, regardless of how much care is taken to deal with the sustainability of the littoral environment. Once a beach is nourished, it almost always is necessary to periodically renourish (supplement with additional quantities of sediment) on a timescale set by local erosion and storm factors so the beach continues to provide the desired level of protection from the effects of hurricanes and coastal storms and associated recreational benefits, which then translate into regional economic benefits. The USACE Institute for Water Resources did a study in 2001 in which they developed a model identifying the National Economic Development benefit from nourishing a typical beach as $1.6 million. This figure was comprised of storm damage reduction, recreational benefits and associated economic implications, and other benefits such as reduction in maintenance and emergency costs (Robinson, 2001). III-92

")
197 Figure III-62. Cutter Suction Dredge Operation (Oak Island) III-93

")
198 Figure III-63. Hopper Dredge Operation (Bogue Banks) III-94
199 Beach Nourishment Database Update The beach nourishment database has been updated to include new data from 2008 to 2015 as well as fill in data gaps prior to These data were received from several sources to provide a comprehensive summary of the State s nourishment activities. Sources include the U.S. Army Corps of Engineers, Western Carolina s Center for Developed Shorelines, the Carteret County Shore Protection Office, Spencer Rodgers of North Carolina Sea Grant, Tom Jarrett formerly with the USACE, and local towns and municipalities. Some data that was received, in the old database and the update, did not contain costs associated with the project. For these specific projects assumptions were made based on interpolations from similar projects in the same or adjacent years. In cases where there were no projects in the same or adjacent years, a statewide trend of unit cost ($/cy) based on projects where cost data was available was used. Once all of the data was compiled, summary results for each region were sent to each Town Manager, Administrator, or Planner to confirm that the finding were consistent with town records. The database extends over a time period from 1939 through Since beach nourishment didn t occur consistently in North Carolina until 1955, the single event that occurred in 1939 was not included in the summary tables and graphs presented for each region. Volume, distance alongshore nourished (miles of shoreline), and cost were summarized for each nourishment event over three data ranges: (61 years, entire dataset), (11 years, last decade), and (6 years, recent). Each region was then summarized to produce a statewide summary for volume, distance, and cost. The cost figures presented in each of the sections below show both actual year dollars and 2015 dollars. All costs presented in the tables are converted to 2015 dollars. The statewide cost summary was then broken down further to show the proportion of Federal funds and State/Local funds contributed. This cost ratio was also applied to the distance to produce a Federal and State/Local funded distance (miles of shoreline). This was used to help develop future projections. A summary of nourishment data is presented in Table III-63. A database of known nourishment projects from is located in Appendix B. The project team is very grateful for the level of cooperation and goodwill demonstrated by all who were so willing to provide their data for this effort. The data is the cornerstone upon which the BIMP ultimately rests. III-95
200 Table III-63. Summary of Beach Nourishment Data Location First Year of Record Number of Times Nourished Total Volume Nourished (cy) Atlantic Beach/Ft. Macon ,525,228 Bald Head Island ,186,190 Cape Hatteras ,812,000 Cape Lookout ,700 Carolina Beach ,803,048 Caswell Beach ,600 Emerald Isle ,571,214 Figure Eight Island ,113,852 Hatteras Island ,801 Holden Beach ,661,045 Indian Beach/Salter Path ,385,692 Kill Devil Hills ,016 Kitty Hawk ,000 Kure Beach ,964,932 Masonboro Island ,234,686 Nags Head ,800,000 Oak Island ,545,287 Ocean Isle Beach ,479,790 Ocracoke Island ,062 Onslow ,829 Pea Island ,673,228 Pine Knoll Shores ,969,185 Rodanthe ,618,083 Topsail Island ,394,479 Wrightsville Beach ,709, Region 1 Figure III-64 through Figure III-66 show the total volume, distance, and cost for nourishment events that occurred between 1955 and 2015 for Region 1. See Figure III-3 for a location map for this region. There has been a significant increase in large nourishment projects over the recent history. One key year from the figures below is In that year, three (3) major projects occurred including the Wilmington Harbor Deepening project, the Sea Turtle Habitat Restoration project in Oak Island, and the initial Coastal Storm Damage Reduction (CSDR) project for Ocean Isle Beach. These three (3) events accounted for 33% of the total historical nourishment volume and cost for this III-96
201 region. Since then, nourishment has become more frequent and in some cases larger in quantity in efforts to keep up with erosion rates and protect coastal infrastructure. Table III-64 through Table III-66 show the volume, distance nourished, and costs for beach nourishment projects which have taken place in Region 1 over the three date ranges previously mentioned. The annual volume of nourishment projects in this region has increased from 445 kcy/yr over the entire record to 1.07 Mcy/yr since 2005 and 1.16 Mcy/yr since The annual distance nourished in this region has increased from 1.1 mi/yr over the entire record to 2.67 mi/yr since 2005 and 2.59 mi/yr since The annual spending on nourishment projects in this region has increased from $3.8M/yr over the entire record to $11.3M/yr since 2005 and $12.6M/yr since Beaches with the largest increases include Bald Head Island and Ocean Isle Beach while Oak Island has been decreasing recently due to the lack of a long-term local or federal project. The recent increases in costs while distances and volumes have stayed relatively consistent points to increased relative cost due to dredge plant supply/demand issues which are described in more detail on page III-131. III-97
202 Figure III-64. Region 1 Volume Summary III-98
203 Figure III-65. Region 1 Distance Summary III-99
204 Figure III-66. Region 1 Cost Summary III-100
205 Location Table III-64. Beach Nourishment Summary Data Region 1 ( ) First Year of Record Number of Times Nourished Total Volume (cy) Avg Volume (cy/yr) Cumulative Distance (mi) Avg Distance (mi/yr) Total Cost (2015 $) Table III-65. Beach Nourishment Summary Data Region 1 ( ) Table III-66. Beach Nourishment Summary Data Region 1 ( ) Avg Cost (2015 $/YR) Bald Head Island ,186, , $107,175,122 $1,756,969 Caswell Beach ,600 4, $4,012,401 $65,777 Holden Beach ,661,045 76, $29,483,876 $483,342 Oak Island ,545, , $56,412,009 $924,787 Ocean Isle Beach ,479,790 73, $32,981,312 $540,677 TOTAL REGION N/A 90 27,128, , $230,064,720 $3,771,553 Location Number of Times Nourished Total Volume (cy) Avg Volume (cy/yr) Cumulative Avg Distance Distance (mi) (mi/yr) Total Cost (2015 $) Avg Cost (2015 $/YR) Bald Head Island 7 7,081, , $74,750,369 $6,795,488 Caswell Beach 1 123,400 11, $1,287,384 $117,035 Holden Beach 12 1,122, , $11,421,769 $1,038,343 Oak Island 3 1,181, , $14,175,366 $1,288,670 Ocean Isle Beach 10 2,289, , $22,511,338 $2,046,485 TOTAL REGION 33 11,798,725 1,072, $124,146,226 $11,286,021 Location Number of Times Nourished Total Volume (cy) Avg Volume (cy/yr) Cumulative Avg Distance Distance (mi) (mi/yr) Total Cost (2015 $) Avg Cost (2015 $/YR) Bald Head Island 4 4,837, , $50,567,910 $8,427,985 Caswell Beach Holden Beach 6 436,889 72, $5,136,449 $856,075 Oak Island 1 221,773 36, $3,750,000 $625,000 Ocean Isle Beach 6 1,492, , $16,101,436 $2,683,573 TOTAL REGION 17 6,988,510 1,164, $75,555,796 $12,592, Region 2 Figure III-67 through Figure III-69 show the total volume, distance, and cost for nourishment events that occurred between 1955 and 2015 for Region 2a. See Figure III-4 for a location map for this sub-region. This sub-region has been maintained by the CSDR projects in place at Wrightsville Beach, Carolina Beach, and Kure Beach. These projects occur on a rotating cycle and in some years more than one project was constructed. This occurrence accounts for the spikes in each of the figures shown for this sub-region. The CSDR projects have accounted for 73% of the total cost and 66% of the total volume over the entire history for this sub-region. The remaining projects that occurred within this reach were beneficial use of material dredged from adjacent inlets and inlet crossings. III-101
206 Table III-67 through Table III-69 show the volume, distance nourished, and costs for beach nourishment projects which have taken place in Region 2a over the three date ranges previously mentioned. This sub-region has been nourished more frequently over the historical record and this is due to the CSDR projects at Wrightsville Beach, Carolina Beach, and Kure Beach. These three beaches are nourished on a 3 to 4 year cycle depending on the beach. The annual volume of nourishment projects in this region has increased from 817 kcy/yr over the entire record to 839 kcy/yr since 2005 and 968 kcy/yr since The annual distance nourished in this region has increased from 1.47 mi/yr over the entire record to 2.07 mi/yr since 2005 and 2.52 mi/yr since The annual spending on nourishment projects in this region has increased from $4.2M/yr (2015 dollars) over the entire record to $7.6M/yr (2015 dollars) since 2005 and $9.3M/yr (2015 dollars) since Beaches with the largest increases include Carolina Beach, Kure Beach, and Wrightsville Beach, which have a CSDR project in place. The increase in volume and miles from the historical comparison to the last decade (since 2005) was minimal; however, the cost increased significantly. This is another indication of the supply/demand issue with dredge plants driving up costs. III-102
207 Figure III-67. Region 2a Volume Summary III-103
208 Figure III-68. Region 2a Distance Summary III-104
209 Figure III-69. Region 2a Cost Summary III-105
210 Table III-67. Beach Nourishment Summary Data Region 2a ( ) Location Number of Cumulative First Year Total Volume Avg Volume Avg Distance Total Cost Avg Cost Times Distance of Record (cy) (cy/yr) (mi/yr) (2015 $) (2015 $/YR) Nourished (mi) Carolina Beach ,803, , $96,418,168 $1,580,626 Figure Eight Island ,113, , $34,133,617 $559,567 Kure Beach ,964,932 97, $37,794,146 $619,576 Masonboro Island ,234,686 53, $17,180,131 $281,641 Wrightsville Beach ,709, , $69,682,393 $1,142,334 TOTAL REGION N/A ,825, , $255,208,455 $4,183,745 Table III-68. Beach Nourishment Summary Data Region 2a ( ) Location Number of Total Volume Avg Volume Cumulative Avg Distance Total Cost Avg Cost Times (cy) (cy/yr) Distance (mi) (mi/yr) (2015 $) (2015 $/YR) Nourished Carolina Beach 8 2,764, , $25,801,771 $2,345,616 Figure Eight Island 12 2,744, , $16,929,174 $1,539,016 Kure Beach 3 1,267, , $14,004,552 $1,273,141 Masonboro Island 2 699,269 63, $8,350,390 $759,126 Wrightsville Beach 4 1,748, , $19,006,448 $1,727,859 TOTAL REGION 29 9,223, , $84,092,335 $7,644,758 Table III-69. Beach Nourishment Summary Data Region 2a ( ) Location Number of Total Volume Avg Volume Cumulative Avg Distance Total Cost Avg Cost Times (cy) (cy/yr) Distance (mi) (mi/yr) (2015 $) (2015 $/YR) Nourished Carolina Beach 6 2,016, , $21,143,855 $3,523,976 Figure Eight Island 4 1,001, , $5,801,466 $966,911 Kure Beach 2 1,004, , $10,397,427 $1,732,905 Masonboro Island 1 579,269 96, $5,656,037 $942,673 Wrightsville Beach 2 1,207, , $12,911,379 $2,151,897 TOTAL REGION 15 5,809, , $55,910,164 $9,318,361 Figure III-70 through Figure III-72 show the total volume, distance, and cost for nourishment events that occurred between 1955 and 2015 for Region 2b. See Figure III-5 for a location map for this sub-region. The majority of nourishment projects in this subregion that have occurred over the historical record have been small beneficial use of dredge material from adjacent inlets and inlet crossings. However, there has been a significant increase in large nourishment projects over the recent history between 2010 and These projects have occurred in Topsail and North Topsail Beach in efforts to keep up with erosion rate and protect coastal infrastructure and have been locally funded. Table III-70 through Table III-72 show the volume, distance nourished, and costs for beach nourishment projects which have taken place in Region 2b over the three date ranges III-106
211 previously mentioned. The annual volume of nourishment projects in this region has increased from 95 kcy/yr over the entire record to 449 kcy/yr since 2005 and 736 kcy/yr since The annual distance nourished in this region has increased from 0.27 mi/yr over the entire record to 1.29 mi/yr since 2005 and 2.13 mi/yr since The annual spending on nourishment projects in this region has increased from $1.1M/yr (2015 dollars) over the entire record to $5.3M/yr (2015 dollars) since 2005 and $8.6M/yr (2015 dollars) since This region has seen large growth in nourishment volume, distance, and cost by using more of the inlet dredged material as a sand source for locally funded projects. It is interesting to note that unit costs for these projects have not increased as much as other regions. In Looking at the projects, it is apparent that projects in this region have used sand sources which require smaller pipeline (cutter head) dredges. Since more dredging companies have these dredges, supply/demand issues are not as prevalent and competition is increased. III-107
212 Figure III-70. Region 2b Volume Summary III-108
213 Figure III-71. Region 2b Distance Summary III-109
214 Figure III-72. Region 2b Cost Summary III-110
215 Location Table III-70. Beach Nourishment Summary Data Region 2b ( ) First Year of Record Number of Times Nourished Total Volume (cy) Avg Volume (cy/yr) Cumulative Distance (mi) Avg Distance (mi/yr) Total Cost (2015 $) Avg Cost (2015 $/YR) Onslow ,829 6, $3,992,039 $65,443 Topsail Island ,394,479 88, $60,725,395 $995,498 TOTAL REGION N/A 24 5,800,308 95, $64,717,434 $1,060,942 Table III-71. Beach Nourishment Summary Data Region 2b ( ) Location Number of Times Nourished Total Volume (cy) Avg Volume (cy/yr) Cumulative Avg Distance Distance (mi) (mi/yr) Total Cost (2015 $) Avg Cost (2015 $/YR) Onslow 3 304,176 27, $3,213,707 $292,155 Topsail Island 13 4,640, , $54,645,405 $4,967,764 TOTAL REGION 16 4,944, , $57,859,113 $5,259,919 Location Table III-72. Beach Nourishment Summary Data Region 2b ( ) Number of Times Nourished Total Volume (cy) Avg Volume (cy/yr) Cumulative Avg Distance Distance (mi) (mi/yr) Total Cost (2015 $) Avg Cost (2015 $/YR) Onslow 2 180,794 30, $1,964,410 $327,402 Topsail Island 9 4,236, , $49,783,974 $8,297,329 TOTAL REGION 11 4,417, , $51,748,384 $8,624,731 Figure III-73 through Figure III-75 show the total volume, distance, and cost for nourishment events that occurred between 1955 and 2015 for Region 2c. See Figure III-6 for a location map for this sub-region. There has been a significant increase in nourishment projects over the recent history due to the county and towns starting their own locally funded projects in response to the hurricanes of the late 1990 s. Other spikes from the figures are due to the beneficial use of dredge material from Morehead City Harbor from Brandt Island pumpouts (large projects occurring once a decade) which have now transitioned to smaller projects occurring one ever three years. The small projects are primarily beneficial use of dredge material from AIWW crossing projects associated with Bogue Inlet. Over the recent history, larger projects became more prevalent including the Section 933 Projects, the Bogue Banks Restoration Projects, and posthurricane FEMA response projects. After the completion of these projects, the size and frequency of projects have been declining as the island has been transitioning to more of a maintenance mode with its master beach nourishment plan. Table III-73 through Table III-75 show the volume, distance nourished, and costs for beach nourishment projects which have taken place in Region 2c over the three date ranges previously mentioned. The annual volume of nourishment projects in this region has III-111
216 increased from 435 kcy/yr over the entire record to 896 kcy/yr since 2005 and then decreased to 613 kcy/yr since The annual distance nourished in this region has increased from 1.20 mi/yr over the entire record to 3.34 mi/yr since 2005 and then decreased to 2.04 mi/yr since The annual spending on nourishment projects in this region has increased from $3.0M/yr (2015 dollars) over the entire record to $9.0M/yr (2015 dollars) since 2005 and then decreased to $6.8M/yr (2015 dollars) since The decrease noted since 2010 is primarily due to the local towns going into maintenance mode since the large projects were completed in the early to mid 2000 s. The relative costs in this region have not risen too much; however, local projects are more expensive due to the use of various dredge plants and borrow sources further away. III-112
217 Figure III-73. Region 2c Volume Summary III-113
218 Figure III-74. Region 2c Distance Summary III-114
219 Figure III-75. Region 2c Cost Summary III-115
220 Location Table III-73. Beach Nourishment Summary Data Region 2c ( ) First Year of Record Number of Times Nourished Total Volume (cy) Avg Volume (cy/yr) Cumulative Distance (mi) Avg Distance (mi/yr) Total Cost (2015 $) Avg Cost (2015 $/YR) Atlantic Beach/Ft. Macon ,525, , $76,778,190 $1,258,659 Cape Lookout ,700 1, $1,104,855 $18,112 Emerald Isle ,571,214 74, $53,896,860 $883,555 Indian Beach/Salter Path ,385,692 22, $17,929,290 $293,923 Pine Knoll Shores ,969,185 48, $33,838,068 $554,722 TOTAL REGION N/A 43 26,527, , $183,547,263 $3,008,972 Table III-74. Beach Nourishment Summary Data Region 2c ( ) Location Number of Total Volume Avg Volume Cumulative Avg Distance Total Cost Avg Cost Times (cy) (cy/yr) Distance (mi) (mi/yr) (2015 $) (2015 $/YR) Nourished Atlantic Beach/Ft. Macon 5 5,736, , $38,892,489 $3,535,681 Cape Lookout 1 75,700 6, $1,104,855 $100,441 Emerald Isle 6 2,118, , $32,290,260 $2,935,478 Indian Beach/Salter Path 1 298,604 27, $4,530,076 $411,825 Pine Knoll Shores 4 1,623, , $22,365,988 $2,033,272 TOTAL REGION 17 9,851, , $99,183,667 $9,016,697 Table III-75. Beach Nourishment Summary Data Region 2c ( ) Location Number of Total Volume Avg Volume Cumulative Avg Distance Total Cost Avg Cost Times (cy) (cy/yr) Distance (mi) (mi/yr) (2015 $) (2015 $/YR) Nourished Atlantic Beach/Ft. Macon 3 2,604, , $24,434,844 $4,072,474 Cape Lookout Emerald Isle 3 762, , $11,600,730 $1,933,455 Indian Beach/Salter Path Pine Knoll Shores 1 315,221 52, $4,994,906 $832,484 TOTAL REGION 7 3,681, , $41,030,480 $6,838, Region 3 No nourishment projects have taken place in Region 3a because the beach is undeveloped National Seashore. Therefore, no nourishment figures or tables are shown for this subregion. Figure III-76 through Figure III-78 show the total volume, distance, and cost for nourishment events that occurred between 1955 and 2015 for Region 3b. See Figure III-8 for a location map for this sub-region. There have been very few nourishment projects in this sub-region that have occurred over the historical record. Typically these projects have been small beneficial use of dredge material from adjacent inlets. This sub-region has not had any nourishment projects since III-116
221 Table III-76 through Table III-78 show the volume, distance nourished, and costs for beach nourishment projects which have taken place in Region 3b over the three date ranges previously mentioned. Since no new nourishment projects have occurred in sub region 3b, no comparisons could be made. However since 1955, approximately 1.4Mcy of beach placement has been completed at a total cost of $16.2M (2015 dollars) or $266K/yr (2015 dollars). III-117
222 Figure III-76. Region 3a Volume Summary III-118
223 Figure III-77. Region 3a Distance Summary III-119
224 Figure III-78. Region 3a Cost Summary III-120
225 Location Table III-76. Beach Nourishment Summary Data Region 3b ( ) First Year of Record Number of Times Nourished Total Volume (cy) Avg Volume (cy/yr) Cumulative Distance (mi) Avg Distance (mi/yr) Total Cost (2015 $) Table III-77. Beach Nourishment Summary Data Region 3b ( ) Table III-78. Beach Nourishment Summary Data Region 3b ( ) Avg Cost (2015 $/YR) Hatteras Island ,801 14, $11,947,171 $195,855 Ocracoke Island ,062 8, $4,296,870 $70,440 TOTAL REGION N/A 12 1,403,863 23, $16,244,041 $266,296 Location Number of Times Nourished Total Volume (cy) Avg Volume (cy/yr) Cumulative Avg Distance Distance (mi) (mi/yr) Total Cost (2015 $) Avg Cost (2015 $/YR) Hatteras Island Ocracoke Island TOTAL REGION Location Number of Times Nourished Total Volume (cy) Avg Volume (cy/yr) Cumulative Avg Distance Distance (mi) (mi/yr) Total Cost (2015 $) Avg Cost (2015 $/YR) Hatteras Island Ocracoke Island TOTAL REGION Region 4 Figure III-79 through Figure III-81 show the total volume, distance, and cost for nourishment events that occurred between 1955 and 2015 for Region 4a. See Figure III-9 for a location map for this sub-region. There have been very few nourishment projects in this sub-region that have occurred over the historical record. These projects were associated with Cape Hatteras (one large project of approximately 1.3 Mcy) prior to The most recent project occurred in Rodanthe as an emergency project to protect NC-12 in In the near future the Town of Buxton will start construction on its beach nourishment project; however, it is not included in the figures and tables in this section. Table III-79 through Table III-81 show the volume, distance nourished, and costs for beach nourishment projects which have taken place in Region 4a over the three date ranges previously mentioned. Please note that Table III-80 and Table III-81 only includes the one project in Rodanthe. III-121
226 Figure III-79. Region 4a Volume Summary III-122
227 Figure III-80. Region 4a Distance Summary III-123
228 Figure III-81. Region 4a Cost Summary III-124
229 Location Table III-79. Beach Nourishment Summary Data Region 4a ( ) First Year of Record Number of Times Nourished Total Volume (cy) Avg Volume (cy/yr) Cumulative Distance (mi) Avg Distance (mi/yr) Total Cost (2015 $) Table III-80. Beach Nourishment Summary Data Region 4a ( ) Table III-81. Beach Nourishment Summary Data Region 4a ( ) Avg Cost (2015 $/YR) Cape Hatteras ,812,000 29, $27,244,119 $446,625 Rodanthe ,618,083 26, $19,551,603 $320,518 TOTAL REGION N/A 4 3,430,083 56, $46,795,723 $767,143 Location Number of Times Nourished Total Volume (cy) Avg Volume (cy/yr) Cumulative Avg Distance Distance (mi) (mi/yr) Total Cost (2015 $) Avg Cost (2015 $/YR) Cape Hatteras Rodanthe 1 1,618, , $19,551,603 $1,777,418 TOTAL REGION 1 1,618, , $19,551,603 $1,777,418 Location Number of Times Nourished Total Volume (cy) Avg Volume (cy/yr) Cumulative Avg Distance Distance (mi) (mi/yr) Total Cost (2015 $) Avg Cost (2015 $/YR) Cape Hatteras Rodanthe 1 1,618, , $19,551,603 $3,258,601 TOTAL REGION 1 1,618, , $19,551,603 $3,258,601 Figure III-82 through Figure III-84 show the total volume, distance, and cost for nourishment events that occurred between 1955 and 2015 for Region 4b. See Figure III-10 for a location map for this sub-region. In this sub-region, placement along the beach did not start until A majority of these projects were beneficial use of material from Oregon Inlet. More recently the town of Nags Head completed its locally funded beach nourishment project (note spike in 2011). Other towns in this region are currently in the process of starting a local project; however, these projects are not included in the figures and tables presented in this section. Table III-82 through Table III-84 show the volume, distance nourished, and costs for beach nourishment projects which have taken place in Region 4b over the three date ranges previously mentioned. The annual volume of nourishment projects in this region has increased from 240 kcy/yr over the entire record to 666 kcy/yr since 2005 and 863 kcy/yr since The annual distance nourished in this region has increased from 0.44 mi/yr over the entire record to 1.29 mi/yr since 2005 and 1.67 mi/yr since The annual spending on nourishment projects in this region has increased from $1.8M/yr (2015 dollars) over the entire record to $6.6M/yr (2015 dollars) since 2005 and $7.7M/yr (2015 dollars) since The recent trends are consistent due to less maintenance at Oregon Inlet which is offset by the Nags Head nourishment project. These numbers would definitely be increasing if Oregon Inlet maintenance was at historic levels. III-125
230 No nourishment projects have taken place in Region 4c to date. Therefore, no nourishment figures or tables are shown for this sub-region. See Figure III-11 for a location map of this sub-region. III-126
231 Figure III-82. Region 4b Volume Summary III-127
232 Figure III-83. Region 4b Distance Summary III-128
233 Figure III-84. Region 4b Cost Summary III-129
234 Location Table III-82. Beach Nourishment Summary Data Region 4b ( ) First Year of Record Number of Times Nourished Total Volume (cy) Avg Volume (cy/yr) Cumulative Distance (mi) Avg Distance (mi/yr) Total Cost (2015 $) Table III-83. Beach Nourishment Summary Data Region 4b ( ) Table III-84. Beach Nourishment Summary Data Region 4b ( ) Avg Cost (2015 $/YR) Pea Island ,673, , $65,439,912 $1,072,785 Nags Head ,800,000 78, $40,279,605 $660,321 Kitty Hawk ,000 2, $2,331,073 $38,214 Kill Devil Hills , $619,707 $10,159 TOTAL REGION N/A 25 14,654, , $108,670,297 $1,781,480 Location Number of Times Nourished Total Volume (cy) Avg Volume (cy/yr) Cumulative Avg Distance Distance (mi) (mi/yr) Total Cost (2015 $) Avg Cost (2015 $/YR) Pea Island 4 2,728, , $33,682,249 $3,062,023 Nags Head 1 4,600, , $38,567,618 $3,506,147 Kitty Hawk Kill Devil Hills TOTAL REGION 5 7,328, , $72,249,867 $6,568,170 Location Number of Times Nourished Total Volume (cy) Avg Volume (cy/yr) Cumulative Avg Distance Distance (mi) (mi/yr) Total Cost (2015 $) Avg Cost (2015 $/YR) Pea Island 1 580,925 96, $7,386,280 $1,231,047 Nags Head 1 4,600, , $38,567,618 $6,427,936 Kitty Hawk Kill Devil Hills TOTAL REGION 2 5,180, , $45,953,898 $7,658, Statewide Overall Summary Figure III-85 through Figure III-90 show the total volume, distance, total cost, and unit cost for nourishment events that occurred between 1955 and 2015 statewide. The funding source for each project statewide vary between 100% Federal to 100% Local. Some projects had a cost share between Federal and State/Local sources, which varied between individual projects. Projects with an accurate cost breakdown were split based on the percentages provided by each source. A typical cost share split was 66% Federal and 33% State/Local contribution. This cost share ratio was also applied to the distance summary to provide a funded distance. This breakdown is important as it will be utilized for the future projections in another section of this report. Historically, the beach nourishment volume placed statewide has been between 1 Mcy and 2 Mcy (Figure III-85). More recently this has increased to 4 Mcy to 5 Mcy (Figure III-130
235 III-85). The peaks are associated with placement from dredging the deep draft ports as well as the CSDR projects. This volume was placed on average over 10 to 12 miles of shoreline (Figure III-86). This was split evenly between Federal and State/Local at 5 to 6 miles each based on the cost sharing mentioned above (Figure III-87). Most recently, the total statewide beach nourishment costs have reached approximately $50M over the last few years (Figure III-88); the Federal and State/Local share have been split evenly at approximately $25M each over the last few years as well (Figure III-89). The unit costs for each nourishment event with actual cost data was divided into projects greater that 200,000 cy and less than 200,000 cy. These data were plotted with 3% and 6% escalation lines to analyze increasing trends in unit cost. Projects that were greater than 200,000 cy were trending at approximately 6% escalation. Projects that were less than 200,000 cy were trending above approximately 6% escalation. This is primarily due to the high mobilization and demobilization costs that drive the unit price higher for smaller volume projects. Nonetheless, a 6% escalation rate is significantly higher than recent inflation estimates. This again confirms the idea that there is a supply/demand issue with dredging plants capable of completing beach nourishment projects. Table III-82 through Table III-84 show the volume, distance nourished, and costs for beach nourishment projects which have taken place statewide over the three date ranges previously mentioned. The annual volume of nourishment projects statewide has increased from 2.1 Mcy/yr over the entire record to 4.1 Mcy/yr since 2005 and 4.6 Mcy/yr since The annual total distance nourished statewide has increased from 4.6 mi/yr over the entire record to 10.9 mi/yr since 2005 and 11.5 mi/yr since The Federal annual distance nourished statewide has increased from 2.9 mi/yr over the entire record to 6.2 mi/yr since 2005 and has decreased to 5.4 mi/yr since The State/Local annual distance nourished statewide has increased from 1.7 mi/yr over the entire record to 4.7 mi/yr since 2005 and 6.1 mi/yr since The annual total spending on nourishment projects statewide has increased from $14.9M/yr (2015 dollars) over the entire record to $41.6M/yr (2015 dollars) since 2005 and $48.3M/yr (2015 dollars) since The Federal annual spending statewide has increased from $10.1M/yr (2015 dollars) over the entire record to $25.4M/yr since 2005 and has slightly decreased to $25.2M/yr since The State/Local annual spending statewide has increased from $4.8M/yr over the entire record to $16.1M/yr since 2005 and $23.1M/yr since Table III-84 confirms the conclusions from the figures above for the most recent date range. III-131
236 Figure III-85. Statewide Total Volume Summary III-132
237 Figure III-86. Statewide Total Distance Summary III-133
238 Figure III-87. Statewide Federal and State/Local Distance Summary III-134
239 Figure III-88. Statewide Total Cost Summary III-135
240 Figure III-89. Statewide Federal and State/Local Cost Summary III-136
241 Figure III-90. Statewide Unit Cost Summary III-137
242 Region Table III-85. Beach Nourishment Summary Data Statewide ( ) Number of Times Nourished Total Volume Nourished (cy) Cumulative Distance (mi) Federal Cumulative Distance (mi) State/Local Cumulative Distance Total Cost (2015 $) Federal Cost (2015 $) State/Local Cost (2015 $) Region ,128, $230,064,720 $178,097,117 $51,967,603 Region 2a ,825, $257,543,086 $155,760,621 $99,447,835 Region 2b 24 5,800, $64,717,434 $22,880,753 $41,836,682 Region 2c 43 26,527, $183,547,263 $125,072,421 $58,474,842 Region 3b 12 1,403, $16,244,041 $16,244,041 $0 Region 4a 4 3,430, $46,795,723 $46,795,723 $0 Region 4b 25 14,654, $108,670,297 $70,102,679 $38,567,618 STATEWIDE TOTAL ,770, $907,582,564 $614,953,355 $290,294,579 STATEWIDE AVERAGE (/yr) N/A 2,110, $14,878,403 $10,081,203 $4,758,928 Table III-86. Beach Nourishment Summary Data Statewide ( ) Region Number of Total Volume Times (cy) Nourished Cumulative Distance (mi) Federal Cumulative Distance (mi) State/Local Cumulative Distance Total Cost (2015 $) Federal Cost (2015 $) State/Local Cost (2015 $) Region ,798, $124,146,226 $87,704,045 $36,442,180 Region 2a 29 9,223, $84,092,335 $48,328,672 $35,763,663 Region 2b 16 4,944, $57,859,113 $16,022,431 $41,836,682 Region 2c 17 9,851, $99,183,667 $74,647,467 $24,536,201 Region 3b Region 4a 1 1,618, $19,551,603 $19,551,603 $0 Region 4b 5 7,328, $72,249,867 $33,682,249 $38,567,618 STATEWIDE TOTAL ,764, $457,082,811 $279,936,468 $177,146,343 STATEWIDE AVERAGE (/yr) N/A 4,069, $41,552,983 $25,448,770 $16,104,213 Table III-87. Beach Nourishment Summary Data Statewide ( ) Region Number of Times Nourished Total Volume Nourished (cy) Cumulative Distance (mi) Federal Cumulative Distance (mi) State/Local Cumulative Distance Total Cost (2015 $) Federal Cost (2015 $) State/Local Cost (2015 $) Region ,988, $75,555,796 $45,702,984 $29,852,812 Region 2a 15 5,809, $55,910,164 $35,848,559 $20,061,605 Region 2b 11 4,417, $51,748,384 $9,911,702 $41,836,682 Region 2c 7 3,681, $41,030,480 $32,975,928 $8,054,552 Region 3b Region 4a 1 1,618, $19,551,603 $19,551,603 $0 Region 4b 2 5,180, $45,953,898 $7,386,280 $38,567,618 STATEWIDE TOTAL 53 27,696, $289,750,325 $151,377,056 $138,373,269 STATEWIDE AVERAGE (/yr) N/A 4,616, $48,291,721 $25,229,509 $23,062,211 III-138
243 SECTION 4 PROJECTION OF FUNDING NEEDS
, it is becoming")
244 IV. PROJECTIONS OF FUNDING NEEDS One of the overarching goals of this update is to determine the level of funding needed to maintain our state s beaches and inlets. With federal funding becoming less and less certain due to the lowering of federal budgets for beach and inlet projects due the reduction in discretionary spending (see Figure IV-1), it is becoming more and more important that the state and local interests develop a keen understanding of project needs so that accurate projections of funding needs and sustainable funding sources can be developed. This section of the BIMP update outlines estimates for both dredging (inlets) and beach nourishment needs for the State of North Carolina. Figure IV-1. Changes in Federal Spending (USACE, 2016a) A. Dredging Funding Need Projections 1. Historical Data For dredging, it is important to realize that North Carolina has two types of inlet projects that were discussed in great detail in Section III. The state has both shallow and deep draft projects and the funding needs for each are quite different. The shallow draft IV-1
245 projects include both shallow draft inlets and the AIWW / Inland waterways that are separated in the following discussion. Figure IV-2 - Figure IV-5 show the total volumes for shallow draft, AIWW and inland waterways, deep draft and total dredging that occurred statewide from 1975 to 2015, respectively. A summary of all the dredge volume data from the database is presented in Table IV-1 through Table IV-3 separated by region and shallow and deep draft over the three date ranges previously mentioned in the report. From the tables, statewide dredging volume has decreased from 6 million cy/yr historically to under 4.5 million cy/yr in the past 5 years. Breaking the statewide trend down to shallow and deep; deep draft volumes have remained constant around 3 million cy/yr while shallow draft volumes have reduced from 3 million cy/yr historically to around 1.5 million cy/yr in the past five years. Again, it is posited that the main reason for these reductions in volume are the reduction in federal funds for both deep and shallow draft projects in NC. As a minor effect, it is also true that more of the projects are now included in the beach nourishment database since beneficial use of dredged material is being promoted more. Therefore, for the future it is likely that shallow draft dredging volumes will likely increase to meet past maintenance levels if additional funding could be realized; some increases have already been seen in the present year (e.g. Oregon Inlet). The same is also true for deep draft dredging as it is surprising that dredging volumes have not increased with deeper authorized channel depths. This points to less relative dredging than would be expected if historical maintenance levels were also being maintained. IV-2
 Figure IV-3.")
246 Figure IV-2. Summary of Shallow Draft Volume Statewide ( ) Figure IV-3. Summary of Shallow Draft Volume AIWW & Inland Waterways ( ) IV-3
 Figure IV-5.")
247 Figure IV-4. Summary of Deep Draft Volume Statewide ( ) Figure IV-5. Summary of Total Dredge Volume Statewide ( ) IV-4
248 Table IV-1. Summary of Statewide Dredging Volumes ( ) Location Shallow Deep Total Average Volume (cy) (cy) (cy) (CY/YR) Region 1 7,832,507 86,703,332 94,535,839 2,305,752 Region 2a 7,393,055-7,393, ,318 Region 2b 14,380,414-14,380, ,742 Region 2c 6,645,789 38,541,862 45,187,651 1,102,138 Region 3a 863, ,949 21,072 Region 3b 8,135,110-8,135, ,417 Region 4a 278, ,527 6,793 Region 4b 45,629,291-45,629,291 1,112,910 AIWW & Inland Waterways 29,748,396-29,748, ,571 StatewideTotal 120,907, ,245, ,152,232 6,003,713 Statewide Average 2,948,952 3,054,761 6,003,713 N/A Table IV-2. Summary of Statewide Dredging Volumes ( ) Location Shallow Deep Total Average Volume (cy) (cy) (cy) (CY/YR) Region 1 2,124,170 28,641,073 30,765,243 2,796,840 Region 2a 1,893,565-1,893, ,142 Region 2b 3,849,533-3,849, ,958 Region 2c 1,344,686 5,679,426 7,024, ,556 Region 3a Region 3b 3,248,554-3,248, ,323 Region 4a 151, ,650 13,786 Region 4b 7,277,712-7,277, ,610 AIWW & Inland Waterways 904, ,155 82,196 StatewideTotal 20,794,025 34,320,499 55,114,524 5,010,411 Statewide Average 1,890,366 3,120,045 5,010,411 N/A Table IV-3. Summary of Statewide Dredging Volumes ( ) Location Shallow Deep Total Average Volume (cy) (cy) (cy) (CY/YR) Region 1 597,025 15,800,902 16,397,927 2,732,988 Region 2a 732, , ,051 Region 2b 1,114,350-1,114, ,725 Region 2c 656,734 1,965,434 2,622, ,028 Region 3a Region 3b 1,935,443-1,935, ,574 Region 4a 143, ,650 23,942 Region 4b 3,580,760-3,580, ,793 AIWW & Inland Waterways 289, ,767 48,295 StatewideTotal 9,050,034 17,766,336 26,816,370 4,469,395 Statewide Average 1,508,339 2,961,056 4,469,395 N/A IV-5
249 Figure IV-6 shows the cost breakdown (federal, state, and local funds) for shallow draft projects statewide from 1975 to 2015 in 2015 dollars. Up until the Shallow Draft Navigation Channel and Lake Dredging Fund was established in 2013 all shallow draft projects in the State were paid for by federal funds. After 2013, shallow draft projects have been paid for by State and Local funds, at first the cost share was State-Local, then in 2015 it was changed to be State-Local (with the exception of Hyde County where it is State-Local) based on an existing economic tier system. Figure IV-7 shows the cost for deep draft projects statewide from 1975 to To date deep draft projects are only federally funded, so there is no breakdown of cost on a state and local level like with the shallow draft projects. This figure compares the total federal cost in dollars of that year with total federal cost in 2015 dollars. Figure IV-8 shows the cost for AIWW and Inland Waterways projects statewide from 1975 to To date AIWW and Inland Waterways are only federally funded, so there is not breakdown of cost on a state and local level like with the other shallow draft projects. This figure compares the total federal cost in dollars of that year with the total federal cost in 2015 dollars. In summary, Figure IV-9 shows the graph of total dredging costs in the state (federal, deep, and AIWW & Inland Waterways) between 1975 and Figure IV-9 also shows a line depicting the 4 year moving average of total cost of dredging in 2015 dollars which shows a long term average of $25-$30 million. A summary of all the dredge cost data from the database is presented in Table IV-4 through Table IV-6 separated by region and broken out in shallow (federal, state, local) and deep draft costs over the three date ranges mentioned previously, which confirms the consistent $25-$30 million average spending while overall volumes have dropped from 6 million cy/yr to 4.5 million cy/yr. IV-6
 Figure IV-7.")
250 Figure IV-6. Total Shallow Draft Cost Data - Statewide ( ) Figure IV-7. Total Deep Draft Cost Data - Statewide ( ) IV-7
 Figure")
251 Figure IV-8. Total Dredge Data - AIWW & Inland Waterways ( ) Figure IV-9. Total Dredge Cost Data - Statewide ( ) IV-8
252 Table IV-4. Dredging Costs - Statewide ( ) Shallow Deep Total Average Cost Location Federal State Local (2015 $) (2015 $) (2015 $) (2015 $/ yr) Region 1 $ 38,191,224 $ 514,440 $ 454,090 $ 338,524,877 $ 377,684,630 $ 9,211,820 Region 2a $ 29,343,028 $ 571,418 $ 489,818 - $ 30,404,263 $ 741,567 Region 2b $ 56,692,490 $ 811,343 $ 545,395 - $ 58,049,229 $ 1,415,835 Region 2c $ 29,739,641 $ 200,384 $ 200,384 $ 168,980,388 $ 199,120,796 $ 4,856,605 Region 3a $ 4,873, $ 4,873,704 $ 118,871 Region 3b $ 45,124,573 $ 1,949,541 $ 1,634,291 - $ 48,708,406 $ 1,188,010 Region 4a $ 2,547,286 $ 147,935 $ 147,935 - $ 2,843,157 $ 69,345 Region 4b $ 278,365,020 $ 2,314,018 $ 1,868,023 - $ 282,547,062 $ 6,891,392 AIWW & Inland Waterways $ 219,790, $ 219,790,621 $ 5,360,747 StatewideTotal $ 704,667,587 $ 6,509,079 $ 5,339,936 $ 507,505,265 $ 1,224,021,866 $ 29,854,192 Statewide Average $ 17,187,014 $ 158,758 $ 130,242 $ 12,378,177 $ 29,854,192 N/A Table IV-5. Dredging Costs - Statewide ( ) Shallow Deep Total Average Cost Location Federal State Local (2015 $) (2015 $) (2015 $) (2015 $/ yr) Region 1 $ 4,889,139 $ 514,440 $ 454,090 $ 153,045,008 $ 158,902,677 $ 14,445,698 Region 2a $ 4,673,967 $ 571,418 $ 489,818 - $ 5,735,202 $ 521,382 Region 2b $ 9,685,578 $ 811,343 $ 545,395 - $ 11,042,316 $ 1,003,847 Region 2c $ 4,391,679 $ 200,384 $ 200,384 $ 34,909,439 $ 39,701,885 $ 3,609,262 Region 3a Region 3b $ 15,270,320 $ 1,949,541 $ 1,634,291 - $ 18,854,152 $ 1,714,014 Region 4a $ 163,685 $ 147,935 $ 147,935 - $ 459,555 $ 41,778 Region 4b $ 25,504,507 $ 2,314,018 $ 1,868,023 - $ 29,686,548 $ 2,698,777 AIWW & Inland Waterways $ 10,670, $ 10,670,284 $ 970,026 StatewideTotal $ 75,249,159 $ 6,509,079 $ 5,339,936 $ 187,954,447 $ 275,052,620 $ 25,004,784 Statewide Average $ 6,840,833 $ 591,734 $ 485,449 $ 17,086,768 $ 25,004,784 N/A Table IV-6. Dredging Costs - Statewide ( ) Shallow Deep Total Average Cost Location Federal State Local (2015 $) (2015 $) (2015 $) (2015 $/ yr) Region 1 $ 996,018 $ 514,440 $ 454,090 $ 103,146,635 $ 105,111,183 $ 17,518,530 Region 2a $ 1,473,364 $ 571,418 $ 489,818 - $ 2,534,599 $ 422,433 Region 2b $ 2,075,660 $ 811,343 $ 545,395 - $ 3,432,398 $ 572,066 Region 2c $ 1,643,355 $ 200,384 $ 200,384 $ 24,683,145 $ 26,727,267 $ 4,454,545 Region 3a Region 3b $ 5,594,282 $ 1,949,541 $ 1,634,291 - $ 9,178,115 $ 1,529,686 Region 4a $ 139,273 $ 147,935 $ 147,935 - $ 435,144 $ 72,524 Region 4b $ 12,678,053 $ 2,314,018 $ 1,868,023 - $ 16,860,094 $ 2,810,016 AIWW & Inland Waterways $ 3,384, $ 3,384,839 $ 564,140 StatewideTotal $ 27,984,845 $ 6,509,079 $ 5,339,936 $ 127,829,780 $ 167,663,639 $ 27,943,940 Statewide Average $ 4,664,141 $ 1,084,846 $ 889,989 $ 21,304,963 $ 27,943,940 N/A 2. Shallow Draft Funding Needs Projections As shown in Table IV-6, total shallow draft funding is currently (last 5 years) averaging $6.6 million/yr (2015 dollars) for 1.5 Mcy/yr dredged (Table IV-3), while averaging $7.9 million/yr (2015 dollars) for 1.9 Mcy/yr dredged (Table IV-2) over the last decade (Table IV-9

253 IV-5). Over the entire dataset (Table IV-4), shallow draft funding has been averaging $17.5 million/yr (2015 dollars) for roughly 3.0 Mcy/yr dredged (Table IV-1). As can be seen from Figure IV-10 and Figure IV-11, if a 4-yr running average of both the shallow draft and AIWW/inland waterways is computed, the combined peak funding in 2015 dollars would be approximately $23.3 million/yr ($16.25 million/yr shallow draft & $7 million/yr AIWW/inland waterways). Therefore, while current funding levels are quite low ($6.6 million/yr), it is expected that the funding need for shallow draft projects could reach $20 - $25 million/yr if historical maintenance levels were met. Given that the state Shallow Draft Navigation Channel and Lake Dredging Fund has a projected $19 million/yr in revenue, the total funding (with the local cost share included) for shallow draft projects available would be $28.5 million/yr. In conclusion, all shallow draft projects including the AIWW can be sustained by State and Local funding, with room to improve current conditions back to historical levels if the local interests agree to participate and begin maintaining to historical conditions as some are beginning to do (e.g. Oregon Inlet). Figure IV-10. Total Shallow Draft Cost Data - Statewide ( ) With 4-yr Moving Avg. IV-10
254 Figure IV-11. Total Dredge Data - AIWW & Inland Waterways ( ) With 4-yr Moving Avg. 3. Deep Draft Funding Needs Projections As shown in Table IV-6, total deep draft funding is currently (last 5 years) averaging $21.3 million/yr (2015 dollars), while averaging $17.1 million/yr (2015 dollars) over the last decade (Table IV-5). Over the entire dataset (Table IV-4), shallow draft funding has been averaging $12.4 million/yr (2015 dollars). The deep draft dredging volumes have remained relatively the same at roughly 3 million cy/yr (see Table IV-1 through Table IV-3) while the authorized depths have increased. This has led to increased draft restrictions since the dredging volumes have not kept pace with the increase in authorized dredge depths. It should be noted that the deep draft ports within NC have had a difficult time getting adequate funding due to the fact that thru tonnage at NC ports is quite a bit less than other national ports. Figure IV-12 shows that Wilmington and Morehead City have dropped in national rank since This consistent dredging volume combined with the increasing cost trend shows the need for the state to fund the Deep Draft Navigation Channel Dredging and Maintenance Fund to ensure the ports are maintained. IV-11
 After discussions with the USACE, it became apparent that the areas of the deep draft channels which have been the most")
255 Figure IV-12. Comparison of NC Ports to Nearby Ports with National Ranking (USACE, 2016a) After discussions with the USACE, it became apparent that the areas of the deep draft channels which have been the most challenging to maintain authorized depths have been within the ocean bar sections of the Wilmington Harbor and Morehead City Harbor projects where shoaling is a constant issue. Based upon a cursory review of the deep draft projects, the inland sections appear to get adequate funding to maintain these portions of the projects. In order to estimate the deep draft funding need that is currently not being met, the Sand Management Plan (SMP) for Wilmington Harbor (USACE, 2011) and the recently released Dredged Material Management Plan (DMMP) for Morehead City Harbor (USACE, 2016b) were reviewed. Both documents include desired levels of dredging volumes and funding needed to meet project objectives for the ocean bar reaches of the channels. For Wilmington Harbor, the desired level of dredging for the ocean bar reaches is approximately 1.5 million cy every 2 years (level of dredging completed during first cycle of the SMP). The expected cost for this dredging inclusive of design/engineering/construction observations and a conservative contingency is $28.5 million in 2015 dollars. For Morehead City, the DMMP the desired level of dredging is approximately 1.3 million cy every year. The expected cost for this volume of dredging inclusive of design/engineering/construction observations and a conservative IV-12

256 contingency ranges from $7.8 $18.9 million in 2015 dollars depending on disposal method. The desired level of funding need were then plotted versus available funding for these projects since Figure IV-13 shows the results. The results show that a conservative estimate for the deep draft unmet funding need would be $17.5 million/yr based on a 4-yr moving average. The proposed split in the fund would be $10 million/yr for Wilmington Harbor and $7.5 million/yr for Morehead City Harbor. Please recall that the Wilmington Harbor dredging of the ocean bar currently occurs every two years so the fund would need to allow carryover. Lastly, it is important to note that since these funds would be used for the ocean bar channel reaches, it should be a requirement that any time these State funds are used, any beach compatible material that is dredged MUST be placed directly on adjacent beaches to offset any potential effects of the deep draft projects. Figure IV-13. Deep Draft Funding IV-13
257 B. Beach Nourishment Funding Need Projections 1. Historical Data Figure IV-14 through Figure IV-18 show the total volume, distance, total cost, and unit cost for nourishment events that occurred between 1955 and 2015 statewide. The funding source for each project statewide vary between 100% Federal to 100% Local. Some projects had a cost share between Federal and State/Local sources, which varied between individual projects. Projects with an accurate cost breakdown were split based on the percentages provided by each source. A typical cost share split was 66% Federal and 33% State/Local contribution. This cost share ratio was also applied to the distance summary to provide a funded distance. Historically, the beach nourishment volume placed statewide has been between 1Mcy and 2Mcy (Figure IV-14). More recently this has increased to 4Mcy to 5Mcy (Figure IV-14). The peaks are associated with placement from dredging the deep draft ports as well as the CSDR projects. This volume was placed on average over 10 to 12 miles of shoreline (Figure IV-15) in recent years. This was split evenly between Federal and State/Local at 5 to 6 miles each based on the cost sharing mentioned above (Figure IV-16). Most recently, the total statewide beach nourishment costs have reached approximately $50M over the last few years (Figure IV-17), with the Federal and State/Local share split evenly at approximately $25M each over the last few years (Figure IV-18) as well. Table IV-7 through Table IV-9 show the volume, distance nourished, and costs for beach nourishment projects which have taken place statewide over the three date ranges previously mentioned. Table IV-9 confirms the conclusions from the figures above for the most recent date range. IV-14
258 Figure IV-14. Statewide Total Volume Summary Figure IV-15. Statewide Total Distance Summary IV-15
259 Figure IV-16. Statewide Federal and State/Local Distance Summary Figure IV-17. Statewide Total Cost Summary IV-16
260 Figure IV-18. Statewide Federal and State/Local Cost Summary Region Table IV-7. Beach Nourishment Summary Data Statewide ( ) Number of Times Nourished Total Volume Nourished (cy) Cumulative Distance (mi) Federal Cumulative Distance (mi) State/Local Cumulative Distance Total Cost (2015 $) Federal Cost (2015 $) State/Local Cost (2015 $) Region ,128, $230,064,720 $178,097,117 $51,967,603 Region 2a ,825, $255,208,455 $155,760,621 $99,447,835 Region 2b 24 5,800, $64,717,434 $22,880,753 $41,836,682 Region 2c 43 26,527, $183,547,263 $125,072,421 $58,474,842 Region 3b 12 1,403, $16,244,041 $16,244,041 $0 Region 4a 4 3,430, $46,795,723 $46,795,723 $0 Region 4b 25 14,654, $108,670,297 $70,102,679 $38,567,618 STATEWIDE TOTAL ,770, $905,247,933 $614,953,355 $290,294,579 STATEWIDE AVERAGE (/yr) N/A 2,110, $14,840,130 $10,081,203 $4,758,928 IV-17
261 Table IV-8. Beach Nourishment Summary Data Statewide ( ) Region Number of Total Volume Times (cy) Nourished Cumulative Distance (mi) Federal Cumulative Distance (mi) State/Local Cumulative Distance Total Cost (2015 $) Federal Cost (2015 $) State/Local Cost (2015 $) Region ,798, $124,146,226 $87,704,045 $36,442,180 Region 2a 29 9,223, $84,092,335 $48,328,672 $35,763,663 Region 2b 16 4,944, $57,859,113 $16,022,431 $41,836,682 Region 2c 17 9,851, $99,183,667 $74,647,467 $24,536,201 Region 3b Region 4a 1 1,618, $19,551,603 $19,551,603 $0 Region 4b 5 7,328, $72,249,867 $33,682,249 $38,567,618 STATEWIDE TOTAL ,764, $457,082,811 $279,936,468 $177,146,343 STATEWIDE AVERAGE (/yr) N/A 4,069, $41,552,983 $25,448,770 $16,104,213 Table IV-9. Beach Nourishment Summary Data Statewide ( ) Region Number of Times Nourished Total Volume Nourished (cy) Cumulative Distance (mi) Federal Cumulative Distance (mi) State/Local Cumulative Distance Total Cost (2015 $) Federal Cost (2015 $) State/Local Cost (2015 $) Region ,988, $75,555,796 $45,702,984 $29,852,812 Region 2a 15 5,809, $55,910,164 $35,848,559 $20,061,605 Region 2b 11 4,417, $51,748,384 $9,911,702 $41,836,682 Region 2c 7 3,681, $41,030,480 $32,975,928 $8,054,552 Region 3b Region 4a 1 1,618, $19,551,603 $19,551,603 $0 Region 4b 2 5,180, $45,953,898 $7,386,280 $38,567,618 STATEWIDE TOTAL 53 27,696, $289,750,325 $151,377,056 $138,373,269 STATEWIDE AVERAGE (/yr) N/A 4,616, $48,291,721 $25,229,509 $23,062, Beach Nourishment Funding Need Current and Future Based on the above historical data, it can be seen that overall recent beach nourishment funding needs are approximately $50 million/yr with roughly a 50/50 split between federal and state/local funding. This has provided approximately 4.6 million cy/yr of beach nourishment over an average distance of 11 miles/yr (with a number of years approaching 20 miles/yr). In efforts to come up with current and future projections of beach nourishment needs for shoreline management, the 326 miles of total shoreline in North Carolina were classified into managed vs. not managed distances. To come up with the historical total managed shoreline distances, average nourishment distances from projects on record in each region were combined to give a Historical Need for each region. This only includes projects that have been completed up to These distances where then broken down based on the Federal and State/Local cost share associated with each project giving the historical Federal and State/Local managed IV-18

262 shoreline. However, this does not capture projects that have been planned and permitted in 2015 but have not been constructed. Region 4b is an example where known projects are currently permitted, but construction has not commenced. Also, existing projects that historically have been funded in part or in whole by the Federal Government are shifting to fall on the State/Locals to fund if the project is to continue. Region 2c is one location where funding has been shifted to become the responsibility of the State/Local municipalities and this change had to be included to better estimate the current funding cost share going forward. Capturing these two aspects were important to give a better and more accurate understanding of the current beach nourishment funding need for a potential State fund. There are also areas in North Carolina that are developed but are not managed due to either being accretional reaches or having more than adequate beach protection in front of its current infrastructure. However, including these areas would give an idea of what the ultimate potential need could be in the future. Table IV-10 shows the regional and statewide summary of the historical, current, and potential need. The total historical managed shoreline is approximately 74.8 miles with a near 50% split in Federal managed (36.8 mi) and State/Local managed shoreline (38 mi). The total current managed shoreline increases to approximately 85.3 miles which is split 33% Federal managed (28.2 mi) and 66% State/Local managed shoreline (57.1 mi). If all developed shoreline were to be managed at some point in the future, the total potential managed shoreline would increases to mi, which is an extremely conservative estimate. Table IV-10. Managed Shoreline Projections Summary Based on the historical beach nourishment database and a review of existing engineering/environmental studies of past and upcoming projects, an estimate of the renourishment interval for each project and reach was recorded where available. These results and existing data gaps were then sent to each of the towns and municipalities for confirmation of this estimate. Based on the existing available data and the responses, the average statewide renourishment interval was found to be 4.5 years (A little lower than the overall average from the past historical database (74.8 miles managed/11.3 miles IV-19
263 nourished annually since 2010 Table IV-9 = 6.6 years). Nonetheless, it is also true that the historical projects placed considerable volumes in place (4.6 million cy/11.3 miles = 77 cy/ft) and that future projects would likely place lower template volumes ([4.6 million cy/yr]/[74.8 miles/4.5 yr] = 52.4 cy/ft) more frequently. As another check, the $25M annual State/Local cost (50% of $50 million/yr) which funds 38 miles of the historical managed shoreline over the average nourishment interval of 4.5 years, the approximate placement density is approximately 53 cy/lf based on a unit rate of $10.5/cy (taken from Table IV-9 - $48.3 million/4.6 Mcy = $10.50/cy). This confirms the average nourishment interval of 4.5 years is reasonable. Based on Table IV-10, it is also interesting to note that the overall average of 4.5 years is fairly consistent across regions. There are areas of hotspots and locations near inlets with more frequent nourishment intervals (2-3 years), but the overall average of 4.5 years is accurate for preliminary planning purposes. Finally, when plotting the time series of past project volumes and costs, the use of a 4-yr running average appeared to provide the most consistent results. This points to the fact that using a year nourishment interval for most developed shorelines is justified. The increase from the historical need to the current need in State/Local managed shoreline is 38 to 57.1 miles respectively (see Table IV-10) with the addition of the projects mentioned previously that are just coming online and the loss of Federal funding for these projects overall. This equates to a ratio of 1.5 and is applied to the $25M annual State/Local cost. This increases the State/Local funding need to $37.5M for current conditions. This cost was rounded up to $40 million annually as an estimate of the current need. Storm impacts may be an additional $15M to $20M based on cost to replenish a 1 Mcy to 1.5 Mcy loss. Considering a significant storm impacts North Carolina on average once every 4 years, this equates to a potential annual cost of approximately $5M. If a local town has a FEMA engineered beach, this cost could potentially be reimbursed by FEMA at no cost to the state or local municipality. It is also envisioned that this fund would be used to fund upfront planning engineering and environmental studies as the Shallow Draft Navigation and Lake Dredging Fund does. These costs can approach 8-12% of the total construction cost for projects so an estimate of $2.5 - $5M/yr statewide is reasonable. Lastly, if the federal government stops contribution to the CSDR projects, the database shows the increased cost to the State/local share would be approximately $7.5M annually. The combined State/Local beach nourishment contributions varies from $40M to $60M annually. Depending on whether the State wants to fund construction only ($40M), provide some funds for studies and storm recovery ($50M), or include funding for CSDR projects ($60M) assuming that the current CSDR funding will decrease in the future, the current recommendations for the funding need are outlined in Table IV-11 below depending on the State versus Local cost share percentage. IV-20
264 Table IV-11. Current State/Local Beach Nourishment Funding Need Cost Share Cost Share $40 M Total $50 M Total $60 M Total Construction only Construction/ Studies/ Storm Construction/ Studies/ Storm/ CSDR State Local State Local State Local State Local 25% 75% $10 M $30 M $12.5 M $37.5 M $15 M $45 M 33% 67% $13.2 M $26.8 M $16.5 M $33.5 M $19.8 M $40.2 M 50% 50% $20 M $20 M $25 M $ 25 M $30 M $30 M 67% 33% $26.8 M $13.2 M $33.5 M $16.5 M $40.2 M $19.8 M 75% 25% $30 M $10 M $37.5 M $12.5 M $45 M $15 M If a 50/50 split or the current tiering used for the shallow draft funding is followed, the funding need for a State fund for beach nourishment is expected to be $20 - $40.2 million/yr depending on if a buffer for CSDR and storm projects are included. Having a buffer is recommended. As for future projections, if all developed shorelines were to require management in the future, the state/local shoreline distance would be miles (167.3 miles 28.2 miles (current federal) see Table IV-10). The State/Local costs may increase by a ratio of 2.44 (139.1 miles / 57.1 miles) giving an ultimate State/Local funding need of $92M/yr ($37.5M/yr * 2.44) rounded for a total of $95M to $115M (including a buffer for some CSDR and storm funding or upfront engineering/environmental costs). It should be noted that this is the future potential if all developed shoreline were managed, which is extremely conservative due to some known locations in North Carolina being accretional. As for the potential timeline to reach this ultimate future projection, in reviewing the miles of managed shoreline to date (see Figure IV-15), it is apparent that from the mid 1980 s 2000, the average annual miles nourished was ~4 miles/yr and this has increased to miles/yr since 2000 (factor of 3). If that trend were to continue, one would expect that the ultimate need may be reached over the next years (139.5 miles / 4.5 years = 31 miles/yr factor of 3 over current conditions) but again, this would be a conservative estimate. Table IV-12 outlines the state versus local portion for the ultimate future beach nourishment funding need depending on cost share percentage. IV-21
265 Table IV-12. Ultimate Future State/Local Beach Nourishment Funding Need Cost Share Cost Share $95 M Total $105 M Total $115 M Total Construction only Construction/ Studies/ Storm Construction/ Studies/ Storm/ CSDR State Local State Local State Local State Local 25% 75% $23.8 M $71.2 M $26.2 M $78.8 M $28.8 M $86.2 M 33% 67% $31.4 M $63.6 M $ 34.6 M $70.4 M $37.9 M $77.1 M 50% 50% $47.5 M $47.5 M $52.5 M $52.5 M $57.5 M $57.5 M 67% 33% $63.7 M $31.3 M $70.4 M $ 34.6 M $77.1 M $37.9 M 75% 25% $71.3 M $23.7 M $78.8 M $26.2 M $86.2 M $28.8 M If a 50/50 split or the current tiering used for the shallow draft funding is followed, the funding need for a State fund for beach nourishment is expected to be $ $77.1 million/yr depending on if a buffer for CSDR and storm projects are included. A buffer is recommended. IV-22
266 SECTION 5 POTENTIAL FUNDING SOURCES
267 V. POTENTIAL FUNDING SOURCES AND RECOMMENDATIONS FOR NORTH CAROLINA BEACH AND INLET PROJECTS Coastal preservation is an expensive proposition when taken at face value. Individual projects often cost tens of millions of dollars. But when analyzed in the context of the value of the beach and dune system that is being restored, it becomes clear that the return on this substantial investment is significant. The traditional federal approach to determining the cost to benefit ratio includes consideration of storm reduction benefits alone. However, a healthy beach and dune system also benefits the surrounding coastal ecosystem as well as the local, state, and federal economy by providing enhanced tourism and recreational opportunities. U.S. beaches help generate $225 billion a year for the national economy, which exceeds the economies (total GDP) of 150 countries in the world. Beach and dune systems help contribute about $25 billion in federal tax revenue (Houston, 2013). A famous example of the many benefits that beach preservation provides has been documented at Miami Beach. Due to ill-advised beachfront development, the economy of the City of Miami Beach had deteriorated along with its beach and dune system in the 1970 s. Houston and Dean (2013) cite a 1977 issue of Time Magazine, So rapidly has the seven-mile-long island degenerated that it can be fairly described as a seedy backwater of debt-ridden hotels. Since the 1980 federal beach preservation project, Miami Beach tourists contribute $5.7 billion to the economy annually (Houston and Dean, 2013) and for every $1 in annual capitalized cost of the nourishment, the U.S. receives $1,800 annually from international tourism alone (Houston, 2013). Average property values in Miami Beach are now $448 per square foot and a robust dune ecosystem (City of Miami Beach and CMC 2015) has been established. Healthy beach and dune systems provide storm protection to coastal communities, particularly during extreme storms such as landfalling hurricanes. Stronge (2007) reported that restored beach areas which included renourishment projects protected the value of coastal properties from the 2004 hurricanes when Hurricanes Charley, Frances, Ivan and Jeanne all made landfall in Florida in a single hurricane season. The storm protective value has been particularly evident recently during Superstorm Sandy when federal beach projects prevented $1.9 billion in damages from Virginia to New England (USACE, 2012). Because of these documented benefits, some U.S. states, particularly those with federal investment in their coasts, have invested in their beaches. These states have demonstrated a commitment to beach preservation through the creation of dedicated State funding sources to supplement local investment. These states recognize that it is V-1
268 difficult to fund a comprehensive state beach management program without dedicated funding. This Section recommends that North Carolina recognize the economic benefits provided by the state s beaches and create a dedicated state funding source to assist in the funding of shallow and deep draft dredging and beach nourishment projects. This funding and prioritization section is divided into five parts. Subsection A, The Economic Value of North Carolina Beaches, supplements the economic impact assessment found in Section II. Subsection A updates beach visitor data and observations to some other major North Carolina attractions, providing a simple but useful indication of the socioeconomic importance of the state's coastal sandy beaches. Using existing state data, Subsection A also examines and updates the economics on the eight coastal counties as a regional unit, herein designated the Atlantic Coast Economic Development Region which was introduced in BIMP (2009). Subsection B, Evaluation of Existing Beach Preservation Funding Programs, provides a description of the methods currently used to finance beach restoration projects in North Carolina at the federal, state and local level. Examples of other states beach preservation funding models are also described. The two largest dedicated State programs, in New Jersey and Florida, are described in detail with examples from Delaware, Louisiana, Texas, South Carolina, and Virginia also included. The program and use for FEMA engineered beaches will also be documented and explored. Subsection C, "Potential Revenue Sources for Dedicated Beach and Inlet Funding," provides hypothetical scenarios of a variety of potential funding sources for individual beach and inlet funding dedicated programs. The revenue sources include new and existing scenarios, as well as a discussion on the use of user-based revenue sources. Subsection D, State Beach Preservation Grant Application Programs, provides an example of the Florida beach preservation grant application program for consideration once a beach preservation funding source has been dedicated in North Carolina. The section concludes with concise recommendations that the State mandate a dedicated State funding source to fund 50% of the non-federal cost of federal and non-federal beach preservation projects. Three recommended funding sources are provided. Additional recommendations are provided for shallow and deep draft funding. A. Economic Value of North Carolina Coastal Resources This section documents that State beaches and inlets directly benefit the State economy by generating nearly $3 billion in direct visitor spending. The State s eight beachfront counties are a relatively small, moderately populated region where visitors generate a substantial contribution to the State s economy (producing almost $130 million in 2014 V-2
269 State sales taxes, or about 12% of the State s total). The region supports nearly 31,000 visitor-spending-related jobs, ranking this region third in the State for employment generated by visitor expenditures in 2014 (see Table V-2). Summertime beach populations explode and provide a massive visitor-spending-derived injection of business revenues and related tax dollars into the State s economy. In an effort to illustrate the economic importance of beach tourism when compared to other activities, beach tourism is compared with two other well-known recreational activities: the presence in a community of professional football team and a NASCAR racetrack. BIMP (2009) noted that the lack of a single officially designated Economic Development Region (EDR) comprised of all eight coastal counties bordering the Atlantic Ocean makes it difficult to account for the unique coastal economy and the importance of tourism to the State as well as local coastal economies. Consequently, the eight-county region (Atlantic Coast EDR) is updated and compared with the other designated North Carolina economic regions. 1. State Coastal and Beach Tourism North Carolina had an estimated 37 million overnight person-trips during 2014, the sixth highest number of visits among all States (VNC, 2015). For many out of State visitors as well as residents, vacations are not complete without including a trip to North Carolina s beaches. A 2014 annual survey indicated that about 18% (Table V-1) of overnight visitors reported that they participated in beach activities during their trip, making beach activities the third highest activity State-wide. For visitors to North Carolina s coastal region, beach activities had the highest percentage (62%), more than twice the percentage reported for the second highest activity, shopping (27%) (Table V-1). Beaches are the only State (public) natural resource in the top three State-wide activities. Table V-1 compares the top five activities overnight travelers, state-wide or in coastal North Carolina participated in, in the year Table V-1. Top Five Activities 2014: State-wide vs. the Coastal Region (VNC, 2015) NC (State-wide) Coastal Region Visiting Relatives (35%) Beach (62%) Shopping (21%) Shopping (27%) Beach (18%) Visiting Relatives (26%) Visiting Friends (17%) State/National Park (16%) Rural Sightseeing (13%) Fine Dining (16%) Compared to other regions, overnight coastal region visitor parties, on average, spend more per trip than other regional visitors. For example, the 2014 average total trip spending by coastal region visitor parties, including N.C. resident visitors, was an V-3
270 estimated $1,027, nearly 1.5 times the State-wide spending average, $688 (Figure V-1). The average non-resident overnight spending by coastal region visitors, $1,386, was nearly twice that of the non-resident State-wide average, $745 (Figure V-1). Spending by these non-resident visitors, which includes a major N.C. visitor segment strongly influenced by the desire to participate in beach activities, is especially important because their spending pumps new dollars into the State economy. Figure V-1 compares the average total trip spending, by region visited and residency, of North Carolina overnight visitors in Average Total Trip Spending: NC Overnight Visitor Parties All Visitors NC Residents Non-Residents $1,386 $1,027 $688 $745 $557 $644 $596 $619 $548 $702 $663 $721 NC Coastal Piedmont Mountain Figure V Average Total Trip Spending of North Carolina Overnight Visitors (VNC, 2015) Given that more that 60% of North Carolina coastal visitors participated in beach related activities (see Table V-1), it is not surprising that coastal visitation in the Atlantic Coast EDR swells in the summer months. For example, during the month of July 2015, nearly 411,000 people visited the Cape Hatteras National Seashore (NPS, 2016). Due to the visitor demand for beach-related activities, North Carolina beach towns have an astonishing increase in visitor numbers during the spring and summer months. In the Town of Oak Island, the summer population typically swells nearly 1000%, from a permanent population of about 8,700 to a peak seasonal daily population of more than 87,100, with weekly population averaging nearly 39,000 people from June to September (TOI, 2016). In the Greater Topsail Island area, a similar summertime population explosion occurs, swelling the small beach towns of North Topsail Beach, Sneads Ferry, Surf City, and Topsail Beach from a permanent population of about 6,000 to over 61,300 during the course of V-4
271 the summer, more than a ten-fold increase (Tippett, 2015). The influx of day-trippers, seasonal summer residents, and non-resident visitors alike expands the Town of Wrightsville Beach of about 3,000 year-round residents to over 30,000 people during spring and summer weekends (Herstine, 2013). In 2013, the permanent population of Carteret County was 69,602 but, during the summer season, the population more than tripled to 223,310. In 2025, it is projected that the county s permanent population will reach 78,167 but its seasonal population including permanent residents will exceed a quarter million, reaching an estimated 261,988 (CCEDC, 2016). The Outer Banks, a two county area on North Carolina s northeast coast, is one of the most visited regions of the State. According to the ACCESSNC (2016), Currituck County had about 25,072 residents in July 2014 while Dare County had about 35,415. Together, these two Outer Banks counties have a permanent resident population of about 60,100, representing much less than 1% of the 9.9 million North Carolinians. Like other North Carolina coastal communities, everything changes in the summer. In 2005, the effective peak daytime population in Dare County alone surpassed 220,000 during the summer tourist season and it projected to reach about 285,000 by 2020 (DCPCDD, 2011). In effect, Dare County s population grows by at least six times its resident population on a typical summer day. It is also estimated that nearly 14,000 jobs in Dare and Currituck counties are attributable to visitor expenditures during 2014 (see Table V-2). 2. The Economy of Beaches Compared to Other Recreational Activities On an annual basis, visitors to North Carolina s beaches and coastal counties dwarf other well-known, State-funded attractions. During the 2015 regular football season, the NFL s Carolina Panthers averaged 74,056 fans a game at Bank of America Stadium, drawing 592,454 fans over the eight home games (ESPN, 2016). In July 2015 alone, a single summer month, more people visited the beachfront communities on Topsail Island than attended all the Panther home games during the regular 2015 season. And, according to the Outer Banks Chamber of Commerce, more than 7 million people visit the Outer Banks each year, almost 12 times the number of people attending all Panthers games in a year. A similar story can be told comparing beaches to the famed Charlotte (Lowe s) Motor Speedway in the Charlotte suburb of Concord, considered NASCAR s hometown track. During a typical race week, the town of Concord s population can apparently grow from about 56,000 to more than 200,000 people, temporarily making it the third largest city in North Carolina as fans and tourists visit the speedway. By comparison, daily summertime visitors to the Dare County portion of the Outer Banks will typically exceed 220,000, not for a single race weekend, but virtually every day over the course of the summer tourist season. Lane (2013) reported that Hatteras Island can have over 50,000 visitors daily. V-5
272 Likewise, the Greater Topsail Island area alone will reach a summertime population of more than 60,000 (Tippett, 2015) and generally sustains that level each day over the course of the summer. North Carolina s beaches are the linchpin of a gigantic business, drawing more visitors to the State s coastal counties in one summer than the combined draw of the top ten NFL teams over a full season. But the State s beaches are not an NFL franchise or a NASCAR racetrack. The beaches are a natural landscape feature, open to the public at little or no cost. Unlike a football stadium or a NASCAR track, there is no entrance fee for exclusively generating millions in revenue needed to maintain the beach, even at the Cape Hatteras National Seashore beaches. And yet, it is the beach that is the number one tourist destination in the State and an economic engine helping drive the State economy. These same beach visitors generate significant tax revenues in the form of sales taxes, occupancy taxes, and prepared meal taxes that help support the State budget and the coastal counties and communities. $140,000 Dare County Monthly Occupancy Sales, ($ in Thousands) $120,000 $100,000 Thousands $80,000 $60,000 $40,000 $20, Average $0 Jan Feb Mar Apr May Jun Jul Aug Sep Oct Nov Dec Months Figure V-2. Dare County, NC, Monthly Occupancy Receipts (Sales), (EROB, 2016a) The seasonal surge represents a steady and predicable potential revenue source between the months of May and September (Figure V-2). It also demonstrates the substantial economic contribution made by lodging sales driven by coastal tourism demand a potential revenue source that is presently untapped by the State. V-6
273 3. The Atlantic Coast Development Region The economic impacts of beaches and beach-related tourism to the State of North Carolina are not always understood and documented. For example, as of August 2016, there were several tourism related impact studies and reports available through the State s Department of Commerce s (NCDOC) Visit North Carolina 1 website; however, none document the contributions of the ocean beaches to the State s economy. Rather, NCDOC s coastal focus seems to be on funding county level estimations of tourism related economic impacts which includes the 2014 coastal tourism economic data summarized in this section. Coastal tourism is also deemphasized at the regional level within North Carolina. The State has formed seven Economic Development Regions and paired them with seven regional economic development partnerships. The partnerships were created in 1997, under the auspices of a 501 (c)(3) corporation called the North Carolina Partnership for Economic Development (PED, 2008). North Carolina s seven Economic Development Regions were: 1. Piedmont Triad EDR 2. Triangle EDR 3. Carolinas EDR 4. Northeast EDR (includes coastal counties of Currituck, Dare and Hyde) 5. Southeast EDR (includes coastal counties of Brunswick, New Hanover & Pender) 6. Eastern EDR (includes coastal counties of Carteret and Onslow) 7. Advantage West EDR As shown above, the eight coastal counties were not treated as a single economic development region but rather are parsed out among the Northeast, Southeast, and Eastern EDRs. In addition, the EDRs and their partner entities generally focus on traditional economic development activities such as promoting manufacturing and industrial business development. Even within the EDRs bordering the Atlantic coast -- the Northeast, Eastern and Southeast EDRs -- the impact of beach and coastal tourism is not well-studied or emphasized. For example, in the 2003 Economic and Demographic Profile for North Carolina s Eastern Region (MSS, 2003), the economic importance of tourism and visitation related to the beaches in Carteret and Onslow is not mentioned at all. In fact, the word beaches does not appear in the region s annual report. The effect of this organizational structure appears to unintentionally deemphasize the unique 1 Visit North Carolina is public-private organization unit started in October, 2014, and contracted by the North Carolina Department of Commerce to lead North Carolina's tourism marketing programs as part of the Economic Development Partnership of North Carolina. V-7
274 tourism-based economies in the coastal counties and make it difficult to fully analyze, account for, and support investment in this important economic sector. The overnight trip total spending (expenditures) averages of 2014 coastal region visitor parties was discussed previously (see Figure V-1). In addition, the aggregated economic effects (e.g. employment, local tax receipts, etc.) linked to these visitor expenditure averages are reflected in the county level visitor related economic data totals used to illustrate the economic importance of a hypothetical Atlantic Coast Economic Development Region (EDR) (Table V-2). This exercise also allows a comparison to be made between the hypothetical Atlantic Coast EDR and the other established economic development regions in the State (Table V-3). [For this comparison, the eight coastal counties and their visitor economic statistics, were removed (deducted) from the existing (1997) EDRs and moved to the hypothetical Atlantic Coast EDR.] Table V-2. Atlantic Coast (EDR) 2014 Economic Importance of NC Visitor Expenditures (USTA, 2015) Member Counties Expenditure (millions (M)) Payroll (M) Employment State Tax Receipts (M) Local Tax Receipts (M) 2014 Region Population (ACCESSNC) Brunswick $ $ ,190 $22.19 $ ,836 Carteret $ $ ,200 $14.12 $ ,811 Currituck $ $ ,540 $5.96 $ ,976 Dare $1, $ ,300 $47.06 $ ,104 Hyde $33.17 $ $1.51 $1.79 5,676 New Hanover $ $ ,680 $23.82 $ ,298 Onslow $ $ ,750 $11.02 $ ,589 Pender $89.63 $ $4.16 $ ,250 Atlantic Coast Region Total $2, $ ,830 $ $ ,540 V-8
275 Table V-3.Comparison of Atlantic Coast EDR to other NCPED EDRs Economic Importance of NC Visitor Expenditures (USTA, 2015) Eight Economic State Tax Local Tax Expenditures Number of Development Regions Payroll (M) Employment Receipts Receipts (M) Counties (NCPED, 1997) (M) (M) Hypothetical Atlantic Coast EDR (ACEDR) $2, $ ,830 $ $ Advantage West $2, $ ,650 $ $ Carolina $6, $1, ,250 $ $ Global/Eastern $1, $ ,040 $57.01 $ Northeast $ $ ,250 $19.19 $ Southeast $ $ ,950 $45.66 $ Piedmont Triad $2, $ ,590 $ $ Triangle $3, $ ,380 $ $ TOTAL $21, $4, ,940 $1, $ ACEDR as % of Whole 13.30% 11.30% 15.00% 12.30% 21.50% 8.00% ACEDR Ranks 4 th 4 th 3 rd 5 th 2 nd 7 th (Tie) EDR Averages $2, $ ,620 $ $79.53 N/A ACEDR vs. EDR Averages $ $ ,210 -$1.66 $56.95 N/A Here, the significant contribution of the Atlantic Coast EDR to the State s economy is documented (Table V-3): 1. Lightly Populated Region: With a total resident population of 713,540, the Atlantic Coast EDR s eight coastal counties represent just 7.2% of the State s population of 9,943,964. As a region this 2014 population was 298,999 less than the 1,012,539 residents of Mecklenburg County, the State s most populated county (ACCESSNC, 2016). 2. Total Expenditures: In 2014, total visitor expenditures in the Atlantic Coast EDR exceeded $2.8 billion, ranking it 4th compared to other regions overall while exceeding the regional average by more than $167 million for the year. Total visitor expenditures in this EDR accounted for about 13% of the State-wide total, an aggregate comparable to the twenty-three county Advantage West EDR ($3.0 billion) and the twelve-county Piedmont Triad EDR ($2.8 billion). 3. Local Tax Revenues: With a 4 th ranked regional visitor expenditure total, the eight mainly rural counties in an Atlantic Coast EDR generated an estimated $136 million in tourism-oriented local tax revenues in 2014, ranking second only to the powerful twelve-county Carolina EDR. In all, local tax revenues collected in these eight counties constituted 21% of all tourism oriented local tax revenues collected State-wide in State Sales Tax Revenues: Visitor related expenditures in the Atlantic Coast EDR are a significant generator of State sales tax revenues, producing almost V-9
276 $130 million in 2014 for the State coffers, or about 12% of the tourismoriented State s total. Compare this to the 21% of local tax revenue generated (#3 above) to begin to understand the untapped State revenue source available in this region. 5. Payroll: In 2014, the estimated annual payroll total generated by visitor expenditures in the Atlantic Coast EDR ranked 4 th, reaching $556 million. In addition, the region s payroll total exceeded the combined payroll total produced in three EDRs (Global/Eastern, Northeast, and Southeast). 6. Employment: Due to this relatively high total payroll, the Atlantic Coast EDR supports nearly 31 thousand jobs, ranking this region third in the State for employment generated by visitor expenditures in This is close to the Triangle EDR which supports 40 thousand jobs. The economic and fiscal contributions of these unique Atlantic Coast counties to the State economy are critical. There is no other region that is more singularly dependent on one industry (coastal tourism) than the Atlantic Coast EDR. Preserving the single greatest amenity and attraction in the region, the beaches, is essential to the State economy. Consequently, the State should develop a solid, stable and aggressive funding program to support beach preservation and coastal projects, the natural infrastructure that underlies the number one industry in the Atlantic Coast EDR. B. Evaluation of Existing Beach Preservation Funding Programs U.S. beach preservation has historically been funded by either Congress (USACE Shore Protection Projects or sediment dredged from federal channels and placed beneficially on adjacent beaches), or by a combination of State, County, and Local Governments. In the last several decades, communities have experimented with a wide variety of funding models and sources. This section reviews examples of the more traditional funding sources at the federal, State, and local level. Seven different State s beach preservation funding approaches are discussed, followed by an update on North Carolina funding at the State and local levels. Beach preservation project funding can be broken into a federal and non-federal share. Federal projects in North Carolina, for example, have followed a 65% federal and 35% non-federal cost sharing formula. Federal projects must have a local sponsor (a city, county, State, or regional authority), who among other things, is responsible for providing the non-federal cost share to the government. The non-federal share of these projects is often funded by a combination of State and local (county and/or municipal) funds. Nonfederal projects, of course, have 0% federal contribution, placing 100% of the fiscal responsibility at the State and local level. V-10
277 Some States, particularly those with dedicated funding sources, have adopted policies for standard cost share formulas for the non-federal portion of beach projects. For example, New Jersey has established a standard State cost share of 75%. For most federal projects, which have a 65% federal/35% non-federal cost share, the State of New Jersey covers 75% of the non-federal share (35%), or about 26% (Figure V-3). The remainder of the nonfederal share (9%) is the municipality s fiscal responsibility. For non-federal or local projects, the State covers 75% of the total cost (Figure V-3) and the municipal share is 25%. Figure V-3 illustrates an example cost share breakdown in New Jersey for federal and non-federal (local) projects, showing federal, State, and municipal shares of the total project cost. Example "Cost Share" Breakdown: New Jersey 100% 75% 9% 26% 25% 50% 25% 65% 75% 0% Federal projects 0% Non-federal (local) projects Federal Share State Share Municipal Share Figure V-3. Example cost share breakdown: New Jersey 1. Federal Funding Programs BIMP (2009) provided a detailed overview of federal beach project funding programs through the USACE and FEMA. Since 2001, a new federal beach project was authorized in North Carolina by the Water Resources Reform & Development Act of 2014 (WRRDA 14). The project is for a U.S. Army Corps of Engineers Surf City and North Topsail Beach, NC Coastal Storm Damage Reduction Project. The project was authorized for construction but has not yet been funded through the federal appropriations process. The Wilmington District has substantially completed plans and specifications for the project and the local sponsors are motivated to execute the appropriate agreements and begin construction (USACE, 2014). V-11
278 A type of federally funded beach and inlet project not mentioned in BIMP (2009) are federal navigation channel maintenance projects conducted by the USACE. These dredging projects, with funding from the USACE Navigation budget, maintain existing federal channels. When dredged navigation sediments are beach- or nearshore-quality, the USACE, through its Regional Sediment Management (RSM) program, encourages beach or nearshore placement in collaboration with the local community. This practice not only clears waterways for safe navigation, but also provides similar benefits to a communities beach and dune system as a traditional, cost-shared, federal Shore Protection Project. There is no cost to the community when beach or nearshore placement is the least cost option for disposal. This practice is considered a beneficial use of dredged sediment. The largest federal navigation projects in North Carolina are the Wilmington and Morehead City Harbor Projects, both of which place some beach-quality sediment on the adjacent beaches. Another beneficial use federal navigation project in North Carolina is the Atlantic Intracoastal Waterway (AIWW) Inlet Crossings. Sediment that is dredged from areas where tidal inlets intersect the AIWW is placed on adjacent beaches to the benefit of the eroding beaches using 100% Federal navigation funds (i.e., at no additional cost to the communities). These projects occur at Ocean Isle Beach, Holden Beach, North Topsail Beach, and Emerald Isle. Recently, federal funding for so-called shallow draft channels has been reduced, resulting in hazards to navigation at the Inlet Crossing projects mentioned above. The State and local governments have collaborated to dredge some of these areas without federal funding through the use of the Shallow Draft Navigation and Lake Dredging Fund mentioned previously. FEMA Engineered Beach (Permanent Work) and Emergency Work Funding Permanent Work Federal assistance to municipalities affected by a Presidential Declared Disaster are administered by FEMA via authority of the Stafford Act. Funding therefore could be available to reimburse costs associated with replacing beach sand removed by a federallydeclared disaster event. A beach is considered eligible for permanent repair if it is an improved beach and has been routinely maintained prior to the disaster. A beach is considered to be an improved beach if the following criteria apply: the beach was constructed by the placement of imported sand to a designed elevation, width, grain size, and slope V-12
279 the beach has been maintained in accordance with a maintenance program established and adhered to by the applicant involving the periodic renourishment of sand, and the maintenance program preserves the original design To document eligibility of the beach as a designed and maintained facility, the following information from an applicant must be provided to FEMA: All design studies, plans, construction documents and as-builts for the original nourishment All studies, plans, construction documents and as-builts for every renourishment Design documents and specifications, including analysis of grain size Documentation and details of the maintenance plan, including how the need for renourishment is determined and funded; and Pre- and post-storm profile cross-sections of the beach that extend to closure depth The amount of sand eligible for replacement with permanent work funding is limited to the amount lost as a result of the disaster event. Emergency Work Emergency placement of sand on natural or engineered beaches may be eligible when necessary to protect improved property from an immediate threat. An eligible berm may be built to a profile to protect against a storm that has a 20 percent chance of occurring in a given year (6 cy/ft above the 5-yr stillwater level), or to the berm s pre-storm profile, whichever is less. NC Case Studies Numerous NC local communities have gone thru the process to document their locally funded projects as engineered beaches (permanent work) to get federal funding of sand volumes lost during a Presidentially federal declared disaster event. The list of communities include: Topsail Beach, North Topsail Beach, Emerald Isle, Indian Beach/Salter Path, Pine Knoll Shores, and Nags Head. All of these communities have received federal funds to replace sand volumes lost during various hurricanes over the last 15 years. 2. State Funding Programs The federal commitment to beach nourishment began in the late 1960 s when the first federal beach erosion control projects in North Carolina and Florida were authorized by V-13
280 Congress. However, the creation of dedicated beach preservation funds by states did not begin until the 1990 s. Interestingly, the state with the first federal project (NC) does not have a dedicated beach preservation funding source today. East coast states with substantial federal investment in the coast, such as New Jersey, Delaware, and Florida, have dedicated state funding sources that are generated from State revenues. The funds serve to provide a portion of the non-federal share of federal beach preservation projects. These states have demonstrated a commitment to beach preservation through the creation of dedicated state funding sources. It is difficult to fund a comprehensive State beach management program without dedicated funding. These states recognize the economic benefits provided to the state by its beaches. These states have not pushed 100% of the economic burden to the local level, in fact as the following examples show, some municipalities and counties pay nothing for beach preservation thanks to effective, dedicated State funds. This report recommends that North Carolina recognize the economic benefits provided by the state s beaches and create a dedicated state funding source to assist in the funding of federal and non-federal beach preservation projects. This section describes the genesis of several state funding models, the specifics of each model, and the state s method of appropriating funds, if applicable. Particular attention to detail is provided for the New Jersey and Florida models (Table V-4), which represent the two largest dedicated state funds. The discussion begins with anecdotes on the birth of each program, which may have relevance to North Carolina circa The events that transpired in different states leading up to state approval of dedicated beach preservation funding sources had the following similarities: Catalyst to provide inertia Appropriately-appointed, well-rounded political vehicle Advocacy group/coalition to sustain momentum Collaboration with State environmental resource agency Specified funding source to generate known revenue that targets users Defined taxing regions Repeated attempts Expert science and engineering input Educational materials focused on economic benefits If the experience of other states is a harbinger of events in North Carolina, a State dedicated funding source could be near-term possibility. Most of the items on the above list are already in play in North Carolina. As discussed in BIMP (2009) and below, there have been repeated attempts to dedicate a funding source for beach preservation. In recent years, a number of catalysts have provided inertia to the effort including Hurricane V-14
281 Sandy, USACE 50-year projects nearing end of federal participation, and growing concerns over sea level rise. State legislators are interested in a discussion of funding sources as evidenced by this BIMP report authorized by the General Assembly in cooperation with the State environmental resource agency, NCDEQ. NCDEQ has contracted the study to obtain expert science and engineering input. Other states have found success by forming a coalition or working through an existing appointed political vehicle or a beach advocacy group to gain support of elected officials, tourism groups, and influential business leaders with an interest in the coast. Such a political vehicle and State advocacy group already exist in North Carolina in the Coastal Resources Commission (CRC) and the North Carolina Beach, Inlet, and Waterway Association (NCBIWA). It is a recommendation of this report that the State work collaboratively with the CRC and the NCBIWA to educate the public on the economic benefits of beaches to the State. Table V-4 is a summary table of select State funding models for beach preservation describing whether the funding source is dedicated or not, the source of the funds, the % of the State cost share, and the total amount of annual funding generated by the funding source that is used for beach preservation. State Dedicated? Table V-4. State Funding Models for Beach Preservation Source % State Cost Share Annual Funding NJ Yes Real Estate transfer fee 75% $25 M* FL Yes Real Estate transfer fee 50% $30 M* DE Yes State tourist tax (1%) + general bonds 100% $1.5 M + LA Yes (wetlands + beaches) Wetlands Trust Fund variable $13-25 M TX No CEPRA (State sporting goods sales tax) + general fund 75% $5.5 M SC No General Fund variable $30 M # VA No n/a n/a $0 *New Jersey and Florida s State beach advocacy groups are requesting an increase to $50M/yr # One-time allocation in State beach advocacy group requesting a dedicated funding source. a) New Jersey Unless otherwise noted, the following information was obtained from the New Jersey State advocacy group called the Jersey Shore Partnership (M. Walsh, pers comm, 3/13/2015). The need for a dedicated funding source in New Jersey became evident when the devastating Halloween Storm of 1991 caught the State unprepared to respond fiscally and a State senator became impassioned to work toward a dedicated funding source. Partners in the Senator s firm incorporated the Jersey Shore Partnership ( Partnership ) with a mission to guarantee State and federal funding to protect New Jersey s 127 miles of shoreline from storms. V-15
282 The Partnership set out to build a coalition to advocate for a dedicated State funding source. In addition to local politicians and leaders in the tourism industry, industry partners with an interest in infrastructure, such as gas, electric, water, and oil companies, were recruited. The partnership insisted that all four Jersey Shore counties were also a part of the coalition. The Partnership, with this new coalition, engaged the public by conducting public opinion surveys. Academic experts were engaged to educate the public. Educational topics included the importance of fostering the State s $19 billion (B) tourism industry and the need for available State funds to guarantee the non-federal cost share for federal beach nourishment projects. After suggesting several unsuccessful funding strategy proposals, the Partnership decided to advocate for a dedicated fund from existing revenue that was not deposited into or taken from the State s general fund. The State legislature enacted an annual $15 million (M) beach protection fund from the realty transfer fee (Table V-4), which could be compared to the North Carolina land transfer fee. This funding level was subsequently increased to $25M (Table V-4). The Partnership also recognizes opportunity in disaster. After Superstorm Sandy, while pre-mitigation strategies have been popular, the Partnership considered this opportunity to advocate for an increase to the dedicated fund. With sea level rise, potential increased storminess, and development pressures, the Partnership outlined that after 22 years with no increase, $25M had become an insufficient level of funding to adequately maintain the State s beach and dune systems. In partnership with the New Jersey Department of Environmental Protection (DEP), the Partnership launched a public campaign to increase the dedicated funding level to $50M in order to protect the State and federal investment in the beach and dune system. The State cost share in New Jersey is 75% (Table V-4), and the majority of the beach preservation projects in NJ are federal projects, thus a typical federal project is funded according to Figure V-3. b) Florida Florida s beach preservation advocacy group, the Florida Shore & Beach Preservation Association (FSBPA) was organized in 1957 at a meeting of 37 local government and university leaders concerned about the growing problem of beach erosion that had virtually destroyed important resort beaches such as Miami Beach. They recognized that erosion was a Statewide problem that is better handled on a State/regional basis rather than as individual cities and counties (FSBPA website, 2016). The following information was obtained from a past-president of the FSBPA (A. Ten Broek, pers. comm., V-16
283 4/29/2015). By 1980, seven federal beach projects had been authorized in Florida and many other local projects were underway. Without a dedicated fund, the inconsistent, limited funds allocated from the general fund were distributed with priority given to federally-authorized projects. Like the New Jersey strategy, the Floridians found the engagement of State elected officials to be critical. And in the late 1970 s at the urging of the FSBPA, Florida s Governor appointed a Statewide Task Force to address the growing need for long-term beach project funding. The members of the task force included influential business leaders and senior elected officials from all of the coastal regions in the State, even the Panhandle, which did not have beach erosion concerns at the time. This appropriately appointed State vehicle, a strategy similar to New Jersey s, highlights the benefit of Statewide or at least regional concurrence and buy in. The task force report, once published, was looked upon favorably by the Governor and legislators Statewide thanks to the authors reputations, and a bill was quickly drafted and sponsored. Other strategies utilized by the Floridians, similar to those implemented in New Jersey, were a State advocacy group that partnered with the State environmental agency, expert science and engineering input for the legislative recommendations, and education of the media and the public about the tourism and storm protection value of beaches to the State. While it is apparent that State economy relies heavily on beach tourism, the FSBPA has been is skilled at communicating the economic value of Florida beaches to the public. For example, in providing statistics such as, The State invested $44 million in the Beach Program resulting in an average increase in GDP of $2.4 billion per year. This increased the overall collection of State revenues by $237.9 million over the 3-year review period. (FL EDR, 2015). The similarities between the Florida and New Jersey models are striking and carry through to the funding source strategy which called for a dedicated fund from existing revenue that was not deposited into the State s general fund. The funding source was also real estate based, a State-wide excise, called the Florida Documentary Stamp Tax ( doc stamp ) tax levied at a rate of $0.70 per $100. A portion of the doc stamp revenues were disbursed from the Land Acquisition Trust Fund and dedicated to beaches. At the time, the Floridians considered the doc stamp to be a selfadjusting sales tax because in general, property values decreased with distance from the coast. The Florida Legislature enacted a $10M annual dedicated fund in 1998 a portion of the Ecosystem Management & Restoration Trust Fund 2. The fund was increased to $30M in 2 Chapter , Florida Statutes V-17
284 2000 (Table V-4). As in New Jersey, the FSBPA is in the process of advocating for an increase in the annual dedicated fund to $50M in FY16/17 3. The State cost share in Florida is 50% (Table V-4). Since 1998, $626.6M has been appropriated to cost-share with local governments on local and federally authorized projects, with each level of government contributing about one-third of the cost of the entire program. This has resulted in the restoration and subsequent maintenance of over miles, or nearly 56%, of the State s miles of critically eroded beaches. 4 Local contributions to Florida s State program detailed in BIMP (2009) include Tourist Development Tax revenues (occupancy taxes) and Municipal Services Benefit Units (nonad valorem assessments levied in special taxing districts). c) Delaware The State of Delaware also has a modest but meaningful dedicated funding source for beach preservation (Table V-4). Unless otherwise noted, the following information was obtained from an interview with the State resource agency (T. Pratt, pers. comm., 5/1/2015). The State of Delaware is the local sponsor for the federal beach preservation projects in the State, as opposed to the more typical model of a County or Municipality sponsoring the project. Delaware State funding is generated from two sources: State bonds and a portion of the State occupancy tax. One percent of the 8% State occupancy tax is dedicated to beach preservation and is distributed to the Beach Preservation Program of the Department of Natural Resources and Environmental Control (DNREC) 5. Hazinski et al (2015) reported that 2014 DE OT total revenues were about $12.3 M. About $1.5M (12.5% X $12.3 M) is annually allocated to beach preservation (Table V-4). These funds are typically supplemented with State bonds. DNREC applies for additional funds through the annual State Bond Bill. This is an annual law passed to create revenue through bond sales for all State capital infrastructure projects that results in debt service. The State cost share in Delaware is 100% (Table V-4). Municipalities and coastal counties have no fiscal involvement in beach preservation projects Chapter 61, 1, 6102, Delaware Code V-18
285 d) Louisiana Funding for coastal restoration projects in Louisiana is a complicated and potentially voluminous topic that is summarized briefly here. The State created a dedicated funding source in 1989 when the Louisiana Legislature passed R.S. 46: and a subsequent constitutional amendment approved by the citizens of Louisiana. They established the Office of Coastal Restoration and Management (OCRM) and the State s Coastal Wetlands Conservation and Restoration Trust Fund ( Wetlands Trust Fund ) to develop and implement the Coastal Wetlands Conservation and Restoration Plan for Louisiana (NRC, 2006). The trust is funded through a percentage of the State s mineral revenues and varies from $13 million to $25 million annually (Table V-4), depending on oil and gas price and production, as well as leases of State land (G. Grandy, pers. comm., 5/1/2015). Note that this is a State dedicated fund for all coastal restoration projects, some of which include beach preservation. In Louisiana, most coastal restoration projects focus on wetlands, as the fund s nickname implies. Louisiana State funds are used to leverage several different federal funding sources, such as the federal Coastal Wetlands Planning, Protection and Restoration Act (CWPPRA), a multi-agency funded program to research and restore Louisiana s wetlands. In general, most beach preservation projects are funded by State and federal sources, with some funds sourced from private oil companies, at variable cost sharing percentages (G. Grandy, pers. comm., 5/1/2015). e) Texas The Texas funding model was described in detail in BIMP (2009) and is summarized in Table V-4. A noteworthy component of the Texas model is that the funding source is generated from a user-based fee. A portion of the State s parks and wildlife department s dedicated fund, which is generated from a State sales tax on sporting goods, presently funds the State s beach program. f) South Carolina The State of South Carolina does not have a dedicated funding source for beach preservation despite having constructed over 60 projects since 1954 (Kana, 2012), which include two federal beach projects along the Grand Strand (Horry County, Myrtle Beach area) and Folly Beach, SC, as well as numerous non-federal projects. State funding has historically been provided from general revenue in an inconsistent manner. The State legislature appropriated $30M to beaches in 2016 and efforts are underway by the State beach preservation advocacy group, South Carolina Beach Advocates, and others to establish a dedicated funding source. V-19
286 g) Virginia The following information was obtained through an interview with the City of Virginia Beach (P. Roehrs, pers. comm., 4/29/2015). Since 1990, when the Virginia Beach Erosion Commission was disbanded, the State of Virginia has been without a substantial dedicated State funding source for beach preservation. The non-federal cost for beach preservation in the resort community of the City of Virginia Beach is funded through a user-based, 8% occupancy tax levied on hotel rooms in the resort community. This generates a net tax revenue of over $80M annually. The adjacent Virginia community of Sandbridge funds a local (non-federal) beach preservation project through two innovative strategies: Tax Increment Financing (TIF) and a Special Service District (SSD). The State contributed only once to Sandbridge, by forgiving the City the purchase price on beachfront land for use in the initial, 1998 beach restoration contract. The TIF captures the real estate tax revenue on the increase in assessed value beyond the base year - for a special purpose. The base year at Sandbridge began in 1998 at which time the community (1,500 parcels) had a value of $200M. As property values increased (by nearly fivefold in 15 years), the additional tax revenue was dedicated for the specific purpose of the TIF, in this case, beach preservation. The present assessment of the Sandbridge community is generating about $7.5M annually for beach preservation. This is a good example of beach preservation efforts driving community investment and property values, and eventually paying for itself through an iterative feedback loop. Prior to initiation of the project and the TIF, the community was suffering decreases in valuation, homes being lost to erosion, vacant and undevelopable lots, repetitive damage, and roads washing out annually. As a result of the project, erosion was managed, the beach and dune ecosystem has been restored, the community transitioned from septic to a public sanitary sewer system, and national media attention turned to other eroding beaches. The beach preservation SSD of Sandbridge is similar to the municipal service benefit units that have been established in Florida (BIMP, 2009) and the special taxing areas in parts of North Carolina. The SSD is funded by numerous sources including a real estate transfer fee of 6 cents per $100 valuation within the Sandbridge community, parking revenues, a 5% occupancy tax, and a small share of the resort revenues. These SSD collections are then supplemented with revenue from the TIF to fund local beach preservation. V-20
287 h) North Carolina Beach Preservation and Waterway Maintenance Funding BIMP (2009) provided a detailed overview of previous North Carolina beach project funding legislation and outcomes. This included a 2001 study 6 and recommendation by the Committee on Coastal Beach Movement, Beach Renourishment, and Storm Mitigation that the State dedicate a fund for beach preservation in North Carolina. As a result, the General Assembly considered the North Carolina Beach Preservation and Restoration Act in 2001 and again in , which although not adopted, sought to create a dedicated beach preservation funding model. The model included funds from general revenue increasing from $4M in 2004 to $12M in 2006 to provide a State cost share of 90%. Session Law requires a 2016 update to this N.C. Beach and Inlet Management Plan (BIMP), which was originally published in BIMP (2009) made two main recommendations: 1) regional planning and 2) a dedicated State funding source. Since 2011, the State s focus has been on regional planning (DEQ, 2016) with great success. The State also implemented a Shallow Draft Navigation and Lake Dredging Fund. This Section recommends that the State now focus additional attention on the second recommendation, to establish a State dedicated funding source. (1) Water Resources Development Grant Program Funding Overview DEQ s Water Resources Development Grant Program provides cost-share grants to local governments for a number of water resource purposes, including beach preservation. This program serves as the State of North Carolina s State funding vehicle for beach preservation. The program could benefit from a dedicated State funding source. BIMP (2009) provided a detailed overview of the program. Using Figure V-3 as a reference, in North Carolina, the State has historically funded 50% of the non-federal share (half of 35%, or 17.5%), and the local government has been responsible for the remaining 17.5%. For a non-federal beach preservation projects in N.C., the State can fund up to 50% of the cost; however, the actual State contribution has historically ranged between 0 and 30% of the total cost. The majority of State funding for beach preservation in N.C. has been provided for federal projects. (2) Shallow Draft Navigation Channel and Lake Dredging Fund Overview Historically, the Wilmington District Army Corps of Engineers has dredged the AIWW, Manteo/Shallowbag Bay including Oregon Inlet, Hatteras/Rollinson, Silver Lake 6 Authorized by Part II, Section 2.1 (6)(e) of Chapter 395 of the 1999 Session Laws (Regular Session, 1999). 7 HB 418 (2001) and HB 1165 (2003) V-21
288 Harbor/Ocracoke, Lockwoods Folly, Shallotte, Bogue, Carolina Beach, New Topsail, and New River Inlets. In recent years, federal funding has not been available to dredge these shallow draft navigation channels as often as needed. This has created hazards to navigation and public safety concerns. The State, in conjunction with local county and municipal governments, has obtained a long-term memorandum of agreement (MOA) with the USACE that allows the USACE to accept funds toward shallow draft inlet dredging. In November 2013, the State signed the MOA that allows the State and local stakeholders to contribute funds to the USACE for shallow draft inlet maintenance dredging. The other part of the solution is state and locally-funded dredging projects. To that end, the State has started to obtain permits to maintain the navigability of the State s shallow draft inlets independently of the USACE. To provide funding for both Federal and State and local dredging projects, the North Carolina General Assembly established the Shallow Draft Navigation Channel and Lake Dredging Fund 8 ( Fund ) in Revenue sources, which include both an increase in boat registration fees and an excise on motor fuel, are deposited into the North Carolina Wildlife Resources Commission s boating account. The Shallow Draft Navigation Fund utilizes an effective method to calculate the State cost share of non-federal projects. Any project funded by revenue from the Fund must be cost-shared with non-state dollars as follows: 1. The cost-share for dredging projects located, in whole or part, in a development tier one area (i.e., Hyde County) shall be at least one non-state dollar for every three dollars from the Fund (75% State/25% local) 2. The cost-share for dredging projects not located, in whole or part, in a development tier one area (e.g., the 7 coastal counties other than Hyde) shall be at least one non-state dollar for every two dollars from the Fund (2/3 State, 1/3 local) Since implementation of the new Fund, the State provided nearly $4 million to the USACE in FY for maintenance dredging under the MOA and a little over $500,000 to local governments for local dredging projects that were completed in FY In addition, the State awarded $8.5 million in grant contracts for local projects that were active, but not complete by the end of FY Current funding projections state that the fund will soon be generating $19 million/yr. 8 N.C. Statutes, Chapter 143, Section F V-22
289 (3) Local Government Project Funding Approaches in North Carolina In contrast to the States with dedicated beach preservation funding sources, North Carolina is a hotbed of financing experimentation for beach preservation projects. The State government has not shown a strong commitment to beach preservation, as evidenced by the lack of a State funding source and the assortment of local funding models that have arisen as a result. BIMP (2009) stated, without a steady and predictable State contribution, local communities may find it increasingly difficult to plan for and implement shoreline management projects. In fact, for the time being, numerous North Carolina communities have given up on State assistance and have taken to funding projects 100% at the local level. The principal source of local government revenues usually is a property tax on real estate and tangible personal property, and North Carolina is no exception. Like local governments in other States, an optional additional source for North Carolina local tax revenues derived from the real and personal property tax base includes service districts 9 and special assessments 10. A given district can be geographically defined as encompassing an entire municipality or county or as a subarea within these jurisdictions. Once established, the district s governing authority for a municipal service district (MSD) or county service district (CSD) can then generate additional property tax revenue in order to provide extra services for the residents and/or property owners in the special district. Usually for property tax funded service districts, property owners in the district are taxed at a higher rate to fund the additional services and/or improvements. Some North Carolina local coastal governments have established special service districts to specifically generate additional annual revenues to fund beach nourishment and/or other beach projects via property taxes. For example, the Town of Kill Devil Hills in Dare County levies (FY ) an additional property tax at the rate of $.33 in its beach nourishment MSD (TOKDH, 2016) (Table V-5). County or regional level beach commissions are now common in North Carolina to provide technical and fiscal guidance on regional beach preservation strategies. Some version of such commissions exists in Carteret, New Hanover, and Dare Counties, as well as in the Topsail Island Shore Protection Commission (DEQ, 2016). Most North Carolina counties and municipalities now have staff members spending all, or a significant portion, of their time on coastal management. 9 N.C. special services district statutes State that one of the purposes for using MSD or CSD derived revenues could include funding beach erosion control and flood and hurricane protection works (Millonzi, 2011). 10 NC Special assessments can be based on front footage or acreage instead of assessed property values (DCM, 2016). V-23
290 The level of commitment of North Carolina s coastal communities to their beach preservation projects is illustrated not only in their willingness to levy additional taxes to fund the projects, but also to acquire real estate through condemnation. In 2016, three town councils have authorized acquisition by condemnation of beach nourishment easements on certain properties located in Holden Beach, Kitty Hawk, and Kill Devil Hills. Table V-5 provides an overview of the local funding models that have been implemented by municipalities in Dare County alone. V-24
291 Municipality/ Community Duck Kitty Hawk Funding Source County & Local County & Local Kill Devil Hills County & Local Nags Head County & Local Buxton County 0 Table V-5. Local Funding Models implemented in Dare County, NC Fed % State % County % Local % majority Source of County Funds County Beach Nourishment Fund (2% OT) County Beach Nourishment Fund (2% OT) County Beach Nourishment Fund (2% OT) County Beach Nourishment Fund (2% OT) County Beach Nourishment Fund Source(s) of local funds Special obligation bonds to be repaid with: 20% Town's General Fund Municipal Service Districts: 40% by $ % by $0.148) $0.02 townwide ad-valorem tax increase "Beach Nourishment" Municipal Service District: 1st 5-7 $0.12 Special obligation bonds to be repaid with: $0.03 townwide ad valorem tax increase Municipal Service District: $0.33 Special obligation bonds to be repaid with: $0.02 townwide ad valorem tax increase Municipal Service District: $0.16 Beach Nourishment Special Service District: $0.25 V-25
292 North Carolina s local governments have invested substantially in coastal management in the last decade. It is important for the State to continue to encourage formalized coastal management at the local level, while not losing sight of the important State role in beach preservation. C. Potential Revenue Sources for Dedicated Beach and Inlet Funding 1. Shallow Draft Dredging Funding As has been shown previously in Section IV, the current shallow draft fund ($19 million/yr) is adequate to meet both current and future projected needs and should be kept as is. This fund is more than justified given the amount of economic impact provided by the inlets to our State. Based on results from Section II, the inlets in NC provide $651.8 in direct impact, $908.8M in indirect impact, and 13,220 jobs. This approximates a ROI of $34.3/$1 to $47.8/$1 depending on whether economic multiplier effects are considered or not. 2. Deep Draft Dredging Funding Deep draft funding projections from Section IV indicate that the Deep Draft Port fund should be a recurring appropriation of $17.5 million/yr by the legislature as part of its investment to our ports. As discussed previously (Section II), the ports bring an estimated economic impact of $ million (direct) and $ million (indirect) with 2,973 jobs. This approximates a ROI of $12.7/$1 to $23.8/$1 depending on whether economic multiplier effects are considered or not. 3. Beach Nourishment Funding Visitor spending is critical to North Carolina s State economy and the governments of many communities. Tourism-oriented activities generate sales and related jobs for a diverse variety of businesses, as well as provide an important tax base. Other State and local governments have dedicated portions of their tax base to beach preservation funding. Often these revenues are directly (such as occupancy or sales taxes) or indirectly (such as property and transfer excise taxes) related to visitor spending. This section considers possible State funding sources for beach preservation. The sources are not local option taxes, but rather State-level taxes and revenue sources. Projected additional revenue from the eight coastal counties is provided for the reader to understand the percentage of the total State revenue that would hypothetically be generated in this region. V-26
293 The State of North Carolina may elect to adopt a new State-wide tax to generate new revenue. In this case, it is envisioned that the amount projected to be generated annually in the region could be set aside for beach preservation. The revenue generated in the rest of the State would be available for other uses. For example, a new State meals tax would hypothetically be levied across the entire State with only the % generated in the eight coastal counties going into the beach preservation fund. The State of North Carolina may also elect to create a special district that includes the eight coastal counties. In this case, it is envisioned that the total amount projected to be generated annually be set aside for beach preservation. For example, the total revenues from a new seasonal State sales tax levied in only the eight coastal counties would be set aside for beach preservation. In keeping with legislative attempts over the last 15 years (e.g., the North Carolina Beach Preservation and Restoration Act in 2001), hypothetical funding options for the formation of a dedicated beach preservation funding source from State revenues are provided. The benefits provided to the State of North Carolina justify such an investment in the coast. This section begins with a discussion of new revenue sources for beach preservation, then discusses reallocation of existing State resources. Section IV of this report identified a combined State/Local funding need of a $40-60M to support federal and non-federal beach nourishment projects State-wide. Depending on the State cost share, the amount annual appropriation to the proposed beach preservation fund could range from $20 to $40.2M. Please note that a target of roughly $25M/yr was set as a guide but this number could fluctuate based on priorities of the General Assembly. Reallocation of such a large sum may be a fiscal challenge to the State, so this Subsection provides hypothetical scenarios for both generating new revenue by increasing various State tax options and for reallocating existing revenue. The focus is on State taxes and State revenue sources to encourage State investment, which would supplement the substantial local commitment to beach preservation. This Subsection recommends a dedicated State fund from new and/or existing revenue sources that is not deposited into or taken from the State s general fund, but rather allocated directly to a beach preservation fund at a legislatively-mandated annual level. V-27
294 a) Potential New State Tax Scenarios to Support a Dedicated State Beach Preservation Fund 11 This Subsection shows that the private sector and consumers in eight coastal counties are already generating the following estimated taxable values annually: $5.2B in seasonal State taxable sales $1.5B in estimated taxable food service sales $5 B in estimated taxable real estate transfers $1 B in estimated taxable lodging sales $26.4B in estimated non-resident owned taxable property value An increase to the taxes levied on each of these in the eight coastal counties alone could potentially generate projected additional tax revenue as high as: $25M from seasonal 0.5% State sales tax $15.1M from a new 1% State meals tax $10M from an additional land transfer fee of $1/$500 $21.2M from a new 2% State OT $26.4M from a new $0.10 ad valorem tax per $100 of valuation non-resident properties. The source of funding for the dedicated beach preservation fund could potentially be from one or more of these options. All of the options have pros and cons, and will require careful discussions with stakeholders such as small business owners, realtors, and Chambers of Commerce, to name a few. The OT, seasonal sales tax, and out-of-state ad valorem tax options, and to a lesser extent the meals tax option, might be desirable because visitors and out-of-state second home owners would generate the majority of these revenues (i.e., a user-based fee). Whereas the land transfer fee offers a more substantial revenue stream for the small percentage increase. Please remember that these funding options only include the eight oceanfront counties that would benefit from a state fund for beach preservation. However, these funding strategies could be applied statewide if desired to also fund other regional needs. 11 The tax revenue projection scenarios presented in this sub-section were based upon county data as compiled and reported by the NCDOR and may not be consistent with financial data reported in county documents such as a county's Comprehensive Annual Financial Report (CAFR). The following data and discussion are intended solely for information purposes. V-28
295 (1) Hypothetical Increased Seasonal State Sales Tax Examples The eight Atlantic coastal counties generate over $248M in State sales tax revenues between May and September annually (Table V-6). A 0.5% increase in State sales tax would result in an additional $25M in projected State revenue from the eight coastal counties alone during these months where tourism is at its highest. Table V-6 shows the summary of the hypothetical State revenues generated in the eight coastal counties if a new seasonal sales and use tax ("State Sales Tax") is implemented (dollars in thousands). Coastal Counties Table V-6. Hypothetical State Revenues Generated from "State Sales Tax" May-September, 2015* Reported Taxable Sales* Reported Gross Tax Collections* Estimated 2015 Additional Seasonal Tax Revenues If a State Sales Tax Rate Increase of: ($ in thousands) ($ in thousands) ($ in thousands) 0.75% 0.50% 0.25% Brunswick $698,520 $33,219 $5,239 $3,493 $1,746 Carteret $526,304 $24,964 $3,947 $2,632 $1,316 Currituck $311,286 $14,816 $2,335 $1,556 $778 Dare $892,484 $42,463 $6,694 $4,462 $2,231 Hyde $40,003 $1,912 $300 $200 $100 New Hanover $1,749,219 $83,257 $13,119 $8,746 $4,373 Onslow $805,410 $38,356 $6,041 $4,027 $2,014 Pender $191,759 $9,155 $1,438 $46 $479 Totals: $5,214,985 $248,143 $39,112 $25,162 $13,037 *Estimated sum of monthly taxable sales and gross NC sales tax collections for May, June, July, August and September 2015 based on June-October monthly sale tax data reported by NCDOR (2016). A benefit of considering a seasonal increase to State sales tax is that a small increase generates significant revenue. For example, a 0.5% increase in State sales tax would result in an additional $25M in projected State revenue from the eight coastal counties alone. Another plus to this option is that it is a user-based fee capitalizing on the massive visitorspending-derived injection of tax dollars into the State s economy during the months of May through September. A new seasonal sales tax would likely keep pace with the State beach preservation needs over the next five years (Table V-7). A five-year forecast, based on the recent past, suggests that a new seasonal sales tax of 0.5% would generate $34.7M in Table V-7 shows the summary of a forecast of a new seasonal (May-September) in the eight coastal counties based on a seasonal average taxable sales growth rate of 5%*. V-29
296 Table V-7. Forecasts of Seasonal (May-September) State Sales Tax Revenue Seasonal Sales Forecast: New NC Sales Tax Revenues If Incremental Rate Increase of: Forecast Period Taxable Sales ($ in thousands) ($ in thousands) 0.75% 0.50% 0.25% 2016 $5,429,500 $40,721 $27,148 $13, $5,700,975 $42,757 $28,505 $14, $5,986,024 $44,895 $29,930 $14, $6,285,325 $47,140 $31,427 $15, $6,599,591 $49,497 $32,998 $16, $6,929,571 $51,972 $34,648 $17,324 *Based on the average seasonal year over year taxable sales rate growth for NC coastal counties from 2012 through (2) Hypothetical New State Meals Tax Examples The eight coastal counties generate over $1.5B in taxable food service sales (Table V-8). A new 1% State meal tax would result in an additional $15.1M in projected State revenue from the eight coastal counties alone. Table V-8 shows the hypothetical state revenues generated in the eight coastal counties if a State food and beverage ( Meal Tax ) is implemented (dollars in thousands) Table V-8. Hypothetical State Revenues Generated from Meal Tax" Coastal Counties FY Taxable Sales* ($ in thousands) Projected Additional FY Tax Revenues If a New State Meal Tax of: ($ in thousands) 1.00% 0.50% 0.25% Brunswick $193,130 $1,931 $966 $483 Carteret $139,775 $1,398 $699 $349 Currituck $40,482 $405 $202 $101 Dare $196,894 $1,969 $984 $492 Hyde $13,110 $131 $66 $33 New Hanover $569,941 $5,699 $2,850 $1,425 Onslow $57,698 $577 $288 $144 Pender $303,591 $3,036 $1,518 $759 Totals: $1,514,622 $15,146 $7,573 $3,787 * Except for Dare County, sales were based on sales and use tax returns by NC restaurants, cafeterias, grills, etc. (Business Group 306) (NCDOR, 2016). The projected Dare County meal tax revenues are based upon increasing its existing meal tax (EROB, 2016b). V-30
297 A five-year forecast, based on the recent past, suggests that a new State meal tax of 1% would generate $21.5M in 2021 (Table V-9). Table V-9 shows the summary of a forecast of a new State meal tax in the eight coastal counties based on a taxable sales growth rate of 6%*. Table V-9. Forecasts of State Meal Tax Revenue. Meal Tax Forecast: Projected New Tax Revenues If a Meal Tax Rate of: ($ in thousands) FY Forecast Period Taxable Sales* ($ in thousands) 1.00% 0.50% 0.25% $1,605,499 $16,055 $8,027 $4, $1,701,829 $17,018 $8,509 $4, $1,803,939 $18,039 $9,020 $4, $1,912,175 $19,122 $9,561 $4, $2,026,905 $20,269 $10,135 $5, $2,148,520 $21,485 $10,743 $5,371 * Based on the average year over year taxable sales rate growth for the NC Business Group 306 (NCDOR, 2016) in coastal counties from FY through FY , rounded down to 6.0%. (3) Hypothetical Increased Land Transfer Tax Examples The eight coastal counties have nearly $5B in estimated taxable real estate value conveyed annually (Table V-10). An additional 0.5% State land transfer tax would result in a $25.2M in projected State revenue from the eight coastal counties alone. 12 An additional one dollar per transfer value of $500 (equal to the present excise rate) would yield $10M annually. Table V-10 shows the hypothetical state revenues generated in the eight coastal counties if an additional land transfer tax is implemented (dollars in thousands). 12 For a national summary of State real estate transfer fees, see: V-31
298 Table V-10. Hypothetical State Revenues Generated from Additional Land Transfer Tax Coastal Counties Estimated Taxable Values* ($ in thousands) Projected Additional Tax Revenues If Fee of: ($ in thousands) Tax Revenue If One Dollar Per Transfer Value of: ($ in thousands) 1.00% 0.50% 0.25% $1/$250 $1/$500 + $1/$750 Brunswick $1,112,349 $11,123 $5,562 $2,781 $4,449 $2,225 $1,483 Carteret $503,605 $5,036 $2,518 $1,259 $2,014 $1,007 $671 Currituck $320,226 $3,202 $1,601 $801 $1,281 $640 $427 Dare $541,202 $5,412 $2,706 $1,353 $2,165 $1,082 $722 Hyde $20,117 $201 $101 $50 $80 $40 $27 New Hanover $1,561,472 $15,615 $7,807 $3,904 $6,246 $3,123 $2,082 Onslow $654,082 $6,541 $3,270 $1,635 $2,616 $1,308 $872 Pender $325,896 $3,259 $1,629 $815 $1,304 $652 $435 Totals: $5,038,946 $50,389 $25,195 $12,597 $20,156 $10,078 $6,719 *Estimated using reported net proceeds of collected excise taxes (i.e. one dollar on each $500 in real property conveyed, etc.) for a given county during FY (NCDOR, 2016). +The NC current excise (stamp) tax rate is $1 on each $500 on or fractional part of real property conveyed to another person; this is equivalent to a 0.20% tax rate levied on the conveyed values. An additional State land transfer tax would likely keep pace with the State beach preservation needs over the next five years (Table V-11). A five-year forecast, based on the recent past, suggests that an additional State land transfer tax of 0.5% would generate $30M in 2021 or an additional land transfer tax of $1/$500 valuation would generate $12M in Table V-11 shows the summary of a forecast of an additional land transfer tax in the eight coastal counties based on a taxable growth rate of 3%. Table V-11. Forecasts of Increased State Land Transfer Tax Revenue Land Transfer Forecasts: FY Forecast Periods Taxable Values ($ in thousands) Projected Additional Tax Revenues If Fee of: Tax Revenue If One Dollar Per Transfer Value of: ($ in thousands) ($ in thousands) 1.00% 0.50% 0.25% $1/$250 $1/$500 $1/$ $5,190,114 $51,901 $25,951 $12,975 $20,760 $10,380 $6, $5,345,817 $53,458 $26,729 $13,365 $21,383 $10,692 $7, $5,506,192 $55,062 $27,531 $13,765 $22,025 $11,012 $7, $5,671,378 $56,714 $28,357 $14,178 $22,686 $11,343 $7, $5,841,519 $58,415 $29,208 $14,604 $23,366 $11,683 $7, $6,016,765 $60,168 $30,084 $15,042 $24,067 $12,034 $8,022 Based on the median year-over-year taxable growth rate of conveyed values in coastal counties from FY through FY (NCDOR, 2016), rounded down to 3.0%. V-32
299 A flat rate land transfer fee was also considered. Based on North Carolina Assoc. of Realtors, Monthly Market Data Reports, there were 16,275 closings in the eight coastal counties in A $614 flat rate fee would be required on each closing to generate approximately $10M annually, roughly half of the minimum annual beach preservation need for a state fund. (4) Hypothetical New State Occupancy Tax (OT) Examples The eight coastal counties have about $1B in taxable lodging sales (Table V-12). A new 1% State OT would result in an additional $10.6M in projected State revenue from the eight coastal counties alone. Table V-12 shows the hypothetical state revenues generated in the eight coastal counties if a new State occupancy tax (OT) is levied on short-term lodging sales is implemented ( fiscal year dollars in thousands). Table V-12. Hypothetical State Revenues Generated from Occupancy Tax Coastal Counties Taxable Lodging Sales* ($ in thousands) Projected Additional FY Tax Revenues If a New State OT of: ($ in thousands) 1.00% 1.50% 2.00% Brunswick $135,480 $1,355 $2,032 $2,710 Carteret $102,170 $1,022 $1,533 $2,043 Currituck $155,356 $1,554 $2,330 $3,107 Dare $405,802 $4,058 $6,087 $8,116 Hyde $7,115 $71 $107 $142 New Hanover $185,020 $1,850 $2,775 $3,700 Onslow $46,975 $470 $705 $939 Pender $21,885 $219 $328 $438 Totals: $1,059,802 $10,598 $15,897 $21,196 *FY taxable sales reported on sales tax returns by NC hotels, motels, house rentals, etc. (Business Group 708) (NCDOR, 2016). As of 2014, 21 States including South Carolina have levied a State-wide occupancy tax (OT) (Hazinski et al., 2015), but North Carolina is currently (2016) not among those States. A new State occupancy tax would have some difficulty in keeping pace with the State beach preservation needs over the next five years. A five-year forecast, based on the recent past, suggests that a new State occupancy tax of 2% would generate $26.8M in 2021 (Table V-13). Table V-13 shows the summary of a forecast of a new state occupancy tax in the eight coastal counties based on a taxable sales growth rate of 4%. V-33
300 Table V-13. Forecasts of New State Occupancy Tax Revenue FY Forecast Periods OT Forecasts: Taxable Sales ($ in thousands) Projected Tax Revenues If a New NC OT Rate of: ($ in thousands) 1.00% 1.50% 2.00% $1,102,195 $11,022 $16,533 $22, $1,146,283 $11,463 $17,194 $22, $1,192,134 $11,921 $17,882 $23, $1,239,819 $12,398 $18,597 $24, $1,289,412 $12,894 $19,341 $25, $1,340,989 $13,410 $20,115 $26,820 Based on the average year-over-year taxable sales rate growth for the NC Business Group 708 (NCDOR, 2016) in coastal counties from FY through FY , rounded down to 4.0%. (5) Hypothetical New State Ad-Valorem Property Tax on Out-of-State Owners As noted in Section II, the eight coastal counties have over $110B in assessed valuation (Table V-14). Of that, nearly $26.4B is assessed valuation of non-nc resident owned coastal property. A $0.10 ad-valorem tax per $100 of valuation on non-resident (or outof-state owned) properties would result in an additional $26.4M in projected State revenue from the eight coastal counties alone. Table V-14 shows the hypothetical state revenues generated in the eight coastal counties if a new real property (ad-valorem) tax is levied on real property owned by non-residents is implemented (dollars in thousands). V-34
301 Table V-14. Hypothetical State Revenues Generated from Real Property (ad-valorem) Tax Assessed Valuation of Real Projected FY Revenues If a Property in Coastal Counties: New Property Tax Levy Coastal (Per $100 of Valuation): Counties ($ in thousands) All Coastal County Property* Non-Resident Owned Coastal Property $0.05 $0.075 $0.10 ($ in thouands) ($ in thousands) Brunswick $21,725,662 $4,238,731 $2,119 $3,179 $4,239 Carteret $16,785,208 $3,866,808 $1,933 $2,900 $3,867 Currituck $6,817,317 $3,722,798 $1,861 $2,792 $3,723 Dare $14,005,354 $7,538,670 $3,769 $5,654 $7,539 Hyde $1,685,258 $837,578 $419 $628 $838 New Hanover $29,781,013 $3,361,123 $1,681 $2,521 $3,361 Onslow $12,863,257 $2,123,949 $1,062 $1,593 $2,124 Pender $6,651,035 $699,992 $350 $525 $700 Totals: $110,314,104 $26,389,648 $13,195 $19,792 $26,390 *Source: Section II. The column values also includes property owners with residency status that can not be determined; only 0.1% ($161.1M) of the column's grand total. b) Reallocating Existing State Funding Sources for Beach Preservation Previous hypothetical examples considered the generation of new revenue. Here, the reallocation of existing revenue is considered. Specifically, existing State Sales Tax revenues derived from hotel and vacation rentals in the coastal counties could be redirected. A 4.75% State sales tax (in addition to occupancy tax) is already being collected on the short-term leases and rentals of hotel and motel rooms, resort rooms, and vacation homes statewide. The eight coastal counties have about $1B in taxable lodging sales (Table V-15). Reallocation of 50% of existing State sales tax collections revenues from short-term lodging sales in the eight coastal counties alone could provide projected funding as high $25.2M annually. Table V-15 shows the hypothetical scenarios for state revenues derived from short-term lodging sales in NC coastal counties by reallocating 50% or 100% of existing NC sales and use tax collections (dollars in thousands). V-35
302 Table V-15. Hypothetical State Revenues Derived from Reallocating Existing NC Sales and Use Tax Collections Coastal Counties Taxable Lodging Sales* ($ in thousands) Gross Tax Collections ($ in thousands) Projected FY Tax Revenues If a Reallocated Percentage of: ($ in thousands) 100.0% of 4.75% Brunswick $135,480 $6,453 $6,453 $3,226 Carteret $102,170 $4,862 $4,862 $2,431 Currituck $155,356 $7,383 $7,383 $3,692 Dare $405,802 $340 $340 $170 Hyde $7,115 $19,318 $19,318 $9,659 New Hanover $185,020 $8,810 $8,810 $4,405 Onslow $46,975 $2,243 $2,243 $1,122 Pender $21,885 $1,043 $1,043 $522 Totals: $1,059,802 $50,452 $50,453 $25, % of 4.75% (or 2.375%) *FY taxable sales reported for sales tax returns by NC hotels, motels, house rentals, etc. (Business Group 708) (NCDOR, 2016). Since the State already collects this tax, redirecting and dedicating this revenue stream to beach preservation would not require a new or additional tax. However, the State would be committing current general revenues presently in use for other purposes. A reallocation of existing State sales tax collections revenues from short-term lodging sales would likely keep pace with the State beach preservation needs over the next five years. A five-year forecast, based on the recent past, suggests that a reallocation of 50% of existing State sales tax collections revenues from short-term lodging sales would generate $31.8M in 2021 (Table V-16). Table V-16 shows the summary of the forecasts of a reallocated State sales tax from short-term lodging sales in the eight coastal counties based on a taxable sales growth rate of 4%. V-36
303 Table V-16. Forecasts of Reallocated State Sales Tax Revenue FY Forecast Periods Reallocation Forecasts: Taxable Sales Tax Collections ($ in thousands) ($ in thousands) ($ in thousands) % 50.00% $1,102,195 $52,354 $52,354 $26, $1,146,283 $54,448 $54,448 $27, $1,192,134 $56,626 $56,626 $28, $1,239,819 $58,891 $58,891 $29, $1,289,412 $61,247 $61,247 $30, $1,340,989 $63,697 $63,697 $31,848 Preliminary FY forecasts of taxable sales and NC sales tax collections based on 4.75% sale tax rate and lodging sales rate growth of 4.0% in coastal counties. c) Rationale for Utilizing User-Based Revenue Sources Projected Tax Revenue If a Reallocated % of: The use of user-based revenue sources is popular because that the tax is often seen as an impact fee. User-based fees differ from a general tax in that they are incurred by those who benefit from the service provided, in this case beach improvements. Here, beach visitors pay to finance beach preservation, not the entire taxpaying population. For example, the use of the lodging tax revenue is a common user-based model for generating revenue for beach preservation in other States, counties, and municipalities. Here, the use of new or existing lodging tax revenue or a targeted sales tax during the tourist season are considered. These are good examples of user-based fees to fund beach preservation. The revenues are generated within the coastal counties; meaning economic activities within the region would to support beach preservation within the region. Additionally, the beaches along the coast are the prime attraction for summer visitors, who drive hotel/rental sales tax revenues (Figure V-2). These revenue streams are geographically appropriate, sufficient to support beach preservation, and directly related to the beaches that attract the majority of coastal visitors. It is instructive to examine total lodging taxes (sales and OT) in North Carolina as compared to other U.S. urban areas. Typical total lodging taxes in Brunswick County, for example are broken down as follows: V-37

304 State Sales Tax 4.75% County Sales Tax 2% County OT 1% Municipal OT 5% TOTAL TAXES: 12.75% The sum of the occupancy taxes and the other taxes levied on the accommodations, such as sales tax, makes up the combined lodging tax of 12.75%. A range of total lodging taxes is provided for select large U.S. cities including Charlotte (15.25%) and Durham, NC (13.5%) in Table V-17. This tax rate on lodging falls into the lower end of lodging tax rates in large U.S. urban areas (Table V-17). Table V-17 shows the total lodging taxes (sales and OT) in select large U.S. Urban Areas (Modified from Hazinski et al., 2015). An increase to the N.C. OT would shift the position from the left to the right side of the U.S. lodging rates histogram (Figure V-4) and would create a higher OT for southern coastal N.C. as compared to Myrtle Beach, SC (Table V-17), its competitor to the south. Figure V-4 shows a histogram of the frequency of lodging tax rates (combined = OT + other (e.g., sales)) in the 150 largest U.S. cities (Source: Hazinski et al., 2015). Considering potential increases in a regional context, a 1% State OT increase applied to the special district of the eight coastal counties, would increase occupancy taxes in the coastal region to about 13.75%, just above the national median rate. A 1% State-wide OT increase might be less palatable for areas like Charlotte, NC which already has a lodging tax that is nearly 2% greater than the national median rate. However, during the stakeholder meetings, use of occupancy taxes for a state fund was not met with much support. It was felt that since this has been used for making up a portion of the local share in the past that it should be left to the locals to use. Figure V-4. Histogram of the Frequency of Lodging Tax Rates in 150 Largest U.S. Cities V-38
305 Table V-17. Total Lodging Taxes in Large U.S. Urban Areas Large Urban Areas Total Lodging Taxes Kansas City, MO 18.35% Honolulu, HI 13.75% Birmingham, AL 17.50% Charleston, SC 13.50% San Antonio, TX 17.00% Durham, NC 13.50% Atlanta, GA 16.00% Miami, FL 13.00% Virginia Beach, VA 15.50% Myrtle Beach, SC 13.00% Charlotte, NC 15.25% Raleigh, NC 12.75% Long Beach, CA 15.00% Orlando, FL 12.50% New York, NY 14.75% Anchorage, AK 12.00% Washington, DC 14.50% Oceanside, CA 11.50% Jersey City, NJ 14.00% Ft. Lauderdale, FL 11.00% Las Vegas, NV 14.00% Knoxville, TN 10.00% D. Potential Funding Prioritization Options 1. Florida State Beach Preservation Grant Application Program Once a State fund is dedicated to beach preservation, a State funding mechanism must be established. This section provides an updated example from the Florida program, detailing the specific ranking system used to prioritize project funding. State funding is available to Florida counties and municipal governments, community development districts, or special taxing districts for shore protection and preservation activities located on the Gulf of Mexico, Atlantic Ocean, or Straits of Florida. The Florida Department of Environmental Protection s (FDEP) Bureau of Beaches & Coastal Systems evaluates beach erosion problems throughout the State. The funding mechanism for beach preservation projects is the Florida Beach Management Funding Assistance Program (formerly the Beach Erosion Control Program), which was established in 1986 for the purpose of working with local and Federal governmental entities to achieve the protection, preservation and restoration of the coastal sandy beach resources of the State. Eligible activities include beach restoration and nourishment activities, project design and engineering studies, environmental studies and monitoring, inlet management planning, inlet sand transfer, dune restoration and protection activities, and other beach erosion prevention activities. In order to allocate limited beach preservation funds, the State has a detailed application process and ranking methodology that allows for 115 total available points based on 30 criteria (Table V-18). The process is not without its shortcomings, such as criteria that are V-39
306 difficult to quantify or have been challenged by the applicants, noted with a + (A. Reed, pers comm, 10/20/2016). Table V-18. FDEP Criteria Used to Rank Annual Beach Preservation Grant Applications Criteria Points Notes 1 Severity of Erosion + 10 Historic erosion rate calculated by the State 2 Threat to Upland Structures + 10 Modeled by the State 3 Recreational (and Economic) Benefits + 10 Based on % of shoreline that is commercial, recreational, or lodging 4 Congressional Authorization of Project Phase 5 5 USACE Project Agreement 5 Appropriated or pending 6 Availability of FEMA Funding 5 Can't have FEMA and USACE funding* 7 10-Yr Comprehensive Financial Plan 2 Local budgeted funds 8 Designated Funding Source by Referendum 2 Local dedicated source 9 Third Party Funding 2 e.g., outside grants 10 Quarterly Reporting Requirements 2 Compliance with State req. 11 Active Permits 1 State and federal 12 Secured Local Funds 1 Available for immediate use 13 Previous Cost Sharing in Feasibility or Design 1 Past State involvement 14 Enhanced Longevity 3 Aanalysis demonstrates increased renourishment interval 15 Previously Restored Shoreline 5 To continue State support of established projects 16 Release of Appropriation 1 In previous fiscal year 17 Project Performance: Nourishment Interval 8 Based on monitoring data 18 Project Performance: Cost Per Mile Per Year 2 Receive points if below annual State avg 19 Mitigating Inlet Effects + 10 Project bypasses sand to balance sediment budget 20 Innovative Technologies + 3 Based on State committee review 21 Technologies New to Florida 2 Based on State committee review 22 Enhancing Nesting Sea Turtle Refuges + 5 Project in or adj to Archie Carr Nat'l Wildlife Refuge 23 Regionalization local sponsors execute agreement & save $ by contracting jointly 24 Significance: Project Length 10 Longer projects perform better 25 Significance: Construction Phase Projects 1 Shovel ready 26 Significance: Economic Impact 2 Uses calculation in Rule 62B (1)c, FAC 27 Significance: Advanced Placement Loss 5 Dry beach remaining above MHW after storm or last monitoring event 28 Significance: Erosion into Design Profile 1 Most significant erosion problems 29 Significance: Placement Volumes 1 Greater fill volumes rewarded 30 Readiness to Proceed Tie breaker TOTAL 115* +Examples of criteria that have been difficult to implement/score and/or challenged by applicants. *Total does not include criteria 6. V-40
307 The process for a grant application to the FDEP program begins in June of each year with a call for applications, which are submitted to the State by the local governments in early August. The FDEP assesses and ranks the applications using the methodology above during the fall, then submits funding recommendations at the end of October for a Legislative Session that begins the following March (FEDP, 2016). Although a dedicated state funding source exists, not every project can be funded each year. Florida does not have a criterion for prioritizing projects that do not receive funds the previous year. Each project is ranked independently from year to year. This presents a challenge for the projects that are consistently on the bubble or just below the appropriation level. Some proposed adjustments to the present ranking process include giving added emphasis to unfunded projects. Other modifications to the existing ranking process are presently under consideration. 2. Simple Annual Regional Funding Program Another potential option would be to supply annual funding to the regions or counties on a per managed mile basis. This would allow the counties and local towns to have a stable recurring funding stream that would be used to support local projects. Potential benefits of this option are that it is simple and straightforward. It also treats every mile of managed beach the same across the entire state which is also fair to the state of North Carolina tax payer. One could argue that it is not the States responsibility to provide inordinate funding to areas where erosion rates are high or extreme. The onus would then be on the local regions and towns to make the best use of their funds and any shortfalls would have to be made up by local interests. Of course adequate forms and documentation for beach preservation activities would have to be provided back to the State as well as proof of expenditures of matching Local funds for projects, but this approach would remove subjectivity. As the case for any potential State funding, proof of a long-term Local funding source and documentation of adequate maintenance would have to be provided in order to receive funds. As an example, if a $25M state fund is ultimately approved, the simple funding formula would be: $25,000,000 = [0.35(28.2)]xx [xx] = $333333, /mmmmmmmm Projects with federal funding would be: $373, = $111111, /mmmmmmmm V-41
308 E. Funding Program Recommendations It is recommended that North Carolina recognize the economic benefits provided by the State s beaches and inlets and mandate a dedicated State funding source to assist in the funding of federal and non-federal beach preservation projects as well as maintain the Shallow Draft Navigation and Lake Dredging funds and also commit a recurring appropriation to the State s recently created Deep Draft Dredging fund. 1. Shallow Draft Dredging Recommendations As has been shown previously, the current shallow draft fund ($19 million/yr) is adequate to meet both current and future projected needs and should be kept as is. This fund is more than justified given the amount of economic impact provided by the inlets to our State. Based on results from Section II, the inlets in NC provide $651.8M in direct impact, $908.8M in indirect impact, and 13,220 jobs. This approximates a ROI of $34.3/$1 to $47.8/$1 depending on whether economic multiplier effects are considered or not. 2. Deep Draft Dredging Recommendations The Deep Draft Port fund should be a recurring appropriation of $17.5 million/yr by the legislature as part of its investment to our ports. As discussed previously, the ports bring an estimated economic impact of $ million (direct) and $ million (indirect) with 2,973 jobs. This approximates a ROI of $12.7/$1 to $23.8/$1 depending on whether economic multiplier effects are considered or not. 3. Beach Nourishment Recommendations Revenue for the dedicated State fund should not be derived from the State s general fund. Rather, a distinct funding source should be legislatively mandated. The revenues from this distinct source should not be deposited into the State s general fund, but rather allocated directly to a beach preservation fund at a legislatively-mandated annual level. In considering possible State cost share formulas, the bare minimum level of State funding for projects should at least match the level at which federal projects have been funded in the past. The State funds half of the 35% non-federal share of federal beach projects. This translates to 17.5% of the total project cost. So, at a bare minimum, the State should fund the non-federal projects at 17.5%. However, the State of North Carolina can do better. V-42
309 On the other end of the spectrum, the State of Delaware is an example of a 100% State cost share. This is likely outside of the fiscal restraints of the State at this time. More reasonable potential State cost share percentages (ranging from 50 to 75%) and examples of other programs with similar cost share formulas are shown in Table V-19. This Plan recommends that the State develop a policy to fund at least 50% of the non-federal share of all beach preservation projects. Table V-19. Annual Funding Requirements for a Dedicated State Beach Preservation Fund Possible % State Cost Share 50% 66% 75% Annual Funding Need $20 - $30 M Florida $ $40.2 M $30 - $45 M Similar Model In NC (Shallow Draft Navigation Channel and Lake Dredging Fund) New Jersey, Texas Several recommended options are provided for funding sources to generate the necessary revenues to fund the 50% State cost share ($25 M/yr can be raised/lowered depending on General Assembly priorities). These options provide a variety of approaches and allow the General Assembly to weigh the pros and cons. Each recommended funding source will keep pace with the State s beach preservation needs for the foreseeable future. The revenues generated by each funding source are ONLY the revenues generated in the eight coastal counties. If a new State tax were to be implemented Statewide, it is envisioned that ONLY that portion generated in the coastal counties would be deposited into the beach preservation fund. Nonetheless, these funding strategies could be implemented statewide if desired to also fund other regional needs. 1) A single source: a. A new 0.5% seasonal State sales tax, which will generate $25M. b. A new state ad-valorem property tax on property owned by non-nc residents ($0.10/$100), which will generate $26.4M 2) A combined source: a. A new 1% State meals tax, which will generate $15.1M, and b. An additional land transfer fee of $1/$500, which will generate $10M. 3) Reallocation of 50% of existing State sales tax collections revenues from short-term lodging sales, which will generate $25.2 M. V-43
310 Option #1 provides two alternatives for a new single funding source. The first alternative; a new seasonal State sales tax, is a user-based fee capitalizing on the massive visitorspending-derived injection of tax dollars into the State s economy during the months of May through September. While the entire tax paying population will be subjected to the seasonal increase in sales tax, the cost of beach preservation is primarily incurred by beach visitors. The second alternative is a new state ad-valorem property tax on all property within the 8 NC oceanfront counties owned by non-nc residents at $0.10/$100 valuation. Option #2 is a diversified new funding source. A new State meals tax is combined with an additional land transfer fee of $1/$500. This option is partially dependent on the tourismbased economy of beach visitors to the coastal counties and partially dependent on the State real estate market. Option #3 is derived from existing revenues the short-term lodging sales tax. Since the State already collects this tax, redirecting and dedicating this revenue stream to beach preservation would not require a new or additional tax. However, the State would be committing current general revenues presently in use for other purposes. In any case, the development of a state dedicated beach nourishment fund is justified. Even if one were to just consider the economic impact to the counties outside of the eight coastal counties, the State investment of $25 million provides $1.406 billion in economic impact (ROI = $56/$1) and just over 10,000 jobs. If the eight coastal counties are included, the economic effect goes to $1.66 billion direct impact (ROI = $66.5/$1) and $4.74 billion indirect (ROI = $189.9/$1) with 48,718 jobs. For further justification for this level of investment from the State, it should be remembered that a considerable portion of the overall property value of the eight coastal counties is owned by non-coastal NC residents. Approximately $19.2 billion (Section II, Table II-47) of property value is owned by this group. Considering just the barrier island property (Appendix G, Table 25), 38.5% of the properties are owned by non-coastal NC residents. Therefore, protecting this infrastructure benefits all of NC (see Appendix G, Table 26 and Figures). Lastly, since these projects should be viewed as coastal infrastructure projects, NCDOT spending by County was investigated from Roughly $1.17 billion had been spent in Wake, Mecklenburg, Guilford, and Forsyth counties during that time while $778 million had been spent in the eight coastal counties. Given that overall NCDOT investments are approximately $1 million/mile of improvement, an amount that equates to 25 miles of roadway improvements seems to be a reasonable investment especially when considering the return on investment. V-44
311 SECTION 6 FINDINGS AND RECOMMENDATIONS
312 VI. FINDINGS AND RECOMMENDATIONS The beaches and Inlets of North Carolina are vital resources to the state s ecological, economic, and cultural fabric. The State recognized the need to maintain, nurture, and enhance these resources by authorizing the Department of Environmental Quality to develop a beach and inlet management plan in The original BIMP provided the management framework by defining a region based approach to compile historic beach nourishment and dredging activities, leading to the initial identification of funding needs to support beach and inlet management strategies on a region or statewide basis. The study also reinforced the value of the state s beach and inlets in terms of economic impact to the local as well as statewide economies. This update to the BIMP refines the data collected from this region-based approach to better define beach nourishment and dredging volumes and costs, leading to the development of projections of future needs for the state s managed shorelines as well as assessing the ultimate needs for shorelines that are currently unmanaged. These projections serve as the basis for determining the level of funding needed to support the state s beach and inlets. The socio-economic value of these resources was update and enhanced with the additional economic contributions of the state s deep draft ports. A more comprehensive evaluation of potential revenue sources was performed with the intent of establishing a dedicated state beach and inlet preservation fund. A summary of the findings and recommendations for this BIMP update are presented by task effort. A. Socio-Economic Value of State Beaches and Inlets Citizens of the State and visitors derive considerable benefits from the coastal region. Beaches and inlets support millions of beach recreationists every year, provide billions in economic value through business and tourism as well as residential and commercial property value. They also provide a direct source of employment and generate associated jobs in the coastal communities. The economic value of beaches and inlets varies by topic (beach recreation value, fishing value, property value, shipping and industry (deep draft ports), etc.), by date, by geographic coverage area, by methodology used to produce the information, and by degree of technical and peer review. The information also varies in terms of whether the values measured are stock variables or flow variables. The annual direct expenditures generated by the beaches and inlets amounts to $2.5 billion. When multiplier effects are added, these numbers rise to $6.1 billion supporting VI-1
313 almost 65,000 jobs. Total State tax revenue from all of these sectors is $188.4 million/yr. The recreational consumer surplus resulting from beaches and inlets is over $214 million/yr. The following summarizes some of the main economic values that were evaluated. Table VI-1. Economic Impact Summary Direct Impact Expenditures Total Impact Output/Sales/ Business Activity Total Impact Employment Total Local Tax Revenue Total State Tax Revenue Total Federal Tax Revenue Annual Consumer Surplus Beach Recreation ( ) $1,662,190,984 $4,741,454,600 48,718 $155,806,220 $163,107,645 $375,840,980 $89,672,622 Shore and Pier Fishing ( ) $48,995,668 Marine Recreational Services ( ) $11,046,413 $23,202,475 1,929 $880,340 $839,947 $1,790,992 - Commercial Fishing (2015) $59,532,630 $96,617,338 3,462 $1,320,711 $1,921,371 $4,405,610 - Seafood Packing and Processing (2015) $182,090,002 $234,173,385 1,047 $1,929,825 $2,067,701 $5,179,471 - Charter/Head Boat Fishing (2015) $38,375,865 $67,515,681 1,388 $1,618,364 $1,830,175 $4,031,208 $70,367,700 Recreational Boating/Fishing (2015) $79,074,771 $159,853,665 1,997 $6,575,790 $6,492,187 $13,232,600 $5,826,607 Boat Building (2015) $211,262,212 $327,436,125 1,811 $6,575,632 $6,170,470 $16,726,255 - Marinas (2016) $70,372,449-1, Deep Draft Port Activity (2015) $222,081,263 $416,844,855 2,973 $4,291,516 $5,976,508 $22,443,697 - NC TOTALS $2,536,026,589 $6,067,098,124 64,911 $178,998,398 $188,406,004 $443,650,812 $214,862,598 The value of coastal property at risk in the eight oceanfront counties as defined by the Ocean Erodible Area was $11.73 billion using the 1998 setback factors and $11.12 billion using the 2012 setback factors, indicating that beach and inlet management strategies have been effective in reducing risk ($600.8 million reduction). If only the five counties that actively complete nourishment are considered the reduction in risk is even greater at an approximate $818.8 million. Non-NC residents own less than half of the parcels at risk in the eight coastal counties but own more than half of the parcel value at risk. This finding supports the federal participation in beach preservation and restoration activities as those monies protect assets for those citizens who do not live in the state but value this state s resource. The value of maintaining North Carolina s beaches was further illustrated through the economic impact modeling performed. A 50 percent loss in statewide beach widths was estimated to result in a total economic impact loss of $524 million (16 percent loss) and 6,074 jobs (16 percent loss) with consumer surplus beach recreational value declining more than $14 million (16 percent loss) and shore/bank fishing consumer surplus by approximately $687,600 (3 percent loss). The second modeling scenario of 6 inlets (Ocracoke, Barden, Bogue, New Topsail, Carolina Beach, and Lockwoods Folly) shoaling to 50 percent of the current depth resulted in estimated lost commercial fishing business of over $5.4 million, 308 crew jobs, and 16 associated jobs. This scenario also resulted in the calculated loss of almost $4 million in for-hire fishing business, 56 crew jobs and 30 associated jobs. However, it should be noted that this analysis did not include Oregon Inlet which would greatly increase these values. VI-2
314 B. Data Collection and Refinement 1. Dredging Dredging and sand bypassing are the primary focus of inlet management in North Carolina. North Carolina is unique in the fact that a number of the inlets within the state are shallow draft inlets (six to 14 ft deep) with only the Cape Fear Inlet (Wilmington Harbor) and Beaufort Inlet (Morehead City Harbor) being deep draft inlets for port navigation. Dredging is vital to the maintenance of transportation routes through state waterways and for providing safe, reliable access to the Atlantic Ocean along the coast. Dredging of shallow draft navigation channels supports commercial fisheries and public transportation (ferries, recreational boaters). The dredging database was updated to incorporate new data from 2008 to 2015 as well as fill in gaps in data prior to All values in the dredging database consider projects or parts of projects where sand was not used for beach nourishment specifically, material placed on a disposal island or offshore disposal site. Statewide dredging volume has decreased from 6 million cy/yr historically to under 4.5 million cy/yr in the past 5 years. Separating shallow and deep projects in the statewide trends; deep draft volumes have remained constant around 3 million cy/yr while shallow draft volumes have reduced from 3 million cy/yr historically to around 1.5 million cy/yr in the past five years. The primary reason for the reduced dredge volumes is due to a reduction in federal funds for both deep and shallow draft projects in NC. It is probable that shallow draft dredging volumes may increase to achieve past maintenance levels if additional funding could be obtained. Similarly, deep draft dredging volumes have not increased with the deepening of authorized channel depths. This suggests that less relative dredging has occurred with respect to historical maintenance levels. The total cost of dredging in 2015 dollars is $25-$30 million, with federal deep draft spending averaging $21 million annually over the last five years and statewide Shallow Draft Inlet spending averaging $7 million over the same time period. Historically, SDI spending averaged $17.5 million when the AIWW and other shallow draft inlets and channels were routinely dredged to their authorized depth. 2. Beach Nourishment The beach nourishment database was updated to include new data from 2008 to 2015 as well as complete data gaps prior to The database extends over a time period from 1939 through Some data received, in the old database and the update, did not VI-3
315 contain costs associated with the project. For specific projects interpolated costs were developed based on similar projects in adjacent years. In cases where this approach was not supported, a statewide trend of unit cost ($/cy) based on projects where cost data was available was used. Total volumes, distances, and costs (total and average cost/yr) for beach nourishment events that occurred between 1955 and 2015 were summarized for each region as well as statewide. For the statewide assessment, project costs were separate by their federal and state/local cost share component using a cost share breakdown was based on source information where available. In instances where the cost share was not provided, a typical cost share split of 66% Federal and 33% State/Local contribution was applied. Historically, the volume placed statewide has been between 1Mcy and 2Mcy but has increased 4Mcy to 5Mcy over the last five years. The peaks are associated with placement from dredging the deep draft ports as well as the CSDR projects. This volume was placed on average over 10 to 12 miles of shoreline. This was split evenly between Federal and State/Local at 5 to 6 miles each based on the cost sharing breakdown. Most recently, the total statewide cost have reached approximately $50M; with Federal and State/Local share split evenly at approximately $25M each. C. Projection of Funding Needs 1. Dredging The state used to receive substantial federal funding to maintain shallow and deep draft inlets, however federal funding has declined in recent years, especially for shallow draft projects which have received minimal federal funding since In 2013, the state established a Shallow Draft Navigation Channel and Lake Dredging Fund to compensate for the loss of federal funding. Current funding levels for the SDI are quite low ($6.6 million/yr) but funding level may rise to $20 - $25 million/yr if historical maintenance levels are met. The Shallow Draft Navigation Channel and Lake Dredging Fund can support a total funding level (with the local cost share included) of $28.5 million/yr. All shallow draft projects including those associated with the AIWW can be maintained at present levels, with an opportunity to revert back to historical dredge levels with local sponsor participation. Some increases have already been seen in the present year (e.g. Oregon Inlet). Over the last decade, federal funding for NC s deep draft channels has been problematic due to the national ranking of Wilmington and Morehead City ports. This has led to increased draft restrictions since the dredging volumes have not kept pace with the increase in authorized dredge depths. The most challenging sections to maintain authorized depths in the deep draft channels are the ocean bars of the Wilmington Harbor VI-4
316 and Morehead City Harbor projects where shoaling is a constant issue. Dredging of inland sections of deep draft navigation projects appear to receive adequate fund to maintain these portions. The Sand Management Plan (SMP) for Wilmington Harbor and the recently released Dredged Material Management Plan (DMMP) for Morehead City Harbor indicate the desired levels of dredging volumes and funding needed to meet project objectives for the ocean bar reaches of the channels. The General Assembly has recognized the need to maintain the two deep draft navigation projects in the state by establishing a deep draft fund but monies for this fund were not appropriated. Analyses suggest that a conservative funding estimate of $17.5 million/yr (based on a 4 year running average) may be needed to maintain the ocean bars of these deep draft harbor channels. The proposed split in the fund would be $10 million/yr for Wilmington Harbor and $7.5 million/yr for Morehead City Harbor. The ocean bar at Wilmington Harbor is dredged every two years so the fund should accommodate carryover. Since these funds are used to dredge the ocean bar, the use of the funds should stipulate that any beach compatible material dredged MUST be placed directly on adjacent beaches to offset any potential effects of the deep draft projects. 2. Beach Nourishment The total shoreline in North Carolina is 326 miles long and the total historically managed shoreline is approximately 74.8 miles. Currently there is a near 50% split in Federal managed and State/Local managed shoreline. The State/Local share of $25 million annually funds 38 miles of shoreline with an average statewide nourishment interval of 4.5 year at a placement density equals 53 cy/lf at a unit rate of $10.5/cy. To identify the current need, projects that have been planned and permitted but have not been constructed were included. The anticipated future trend of decreasing Federal contribution to existing projects was also identified, with these projects shifting to the State/Local responsibility. The current total managed shoreline increased from 74.8 miles to 85.3 miles with State/Local managed shoreline increasing from 38 to 57.1 miles after accounting for these changes. Applying historic to current managed shoreline ratio of 1.5, the $25 million annual State/Local cost share would increase to $37.5 million for current need. This cost was rounded up to $40 million annually as an estimate of the current need. Storm impacts may be an additional $15M to $20M based on cost to replenish a 1 Mcy to 1.5 Mcy loss. Considering a significant storm impacts North Carolina on average once every 4 years, this equates to a potential annual cost of approximately $5M. If a local town has a FEMA engineered beach, this cost could potentially be reimbursed by FEMA at no cost to the state or local municipality. It is also envisioned that this fund would be VI-5
317 used to fund upfront planning engineering and environmental studies as the Shallow Draft Navigation and Lake Dredging Fund does. These costs can approach 8-12% of the total construction cost for projects so an estimate of $2.5 - $5M/yr statewide is reasonable. Lastly, if the federal government stops contribution to the CSDR projects, the database shows the increased cost to the State/local share would be approximately $7.5M annually. Therefore, the preliminary recommendation for a State/Local beach nourishment fund is $40 million to $60 million annually. Depending on whether the State wants to fund construction only ($40M), provide some funds for studies and storm recovery ($50M), or include funding for CSDR projects ($60M) assuming that the current CSDR funding will decrease in the future, the current recommendations for the funding need are outlined in Table VI-2 below depending on the State versus Local cost share percentage. Cost Share Table VI-2. State/Local Beach Nourishment Funding Need Cost Share $40 M Total $50 M Total $60 M Total Construction only Construction/ Studies/ Storm Construction/ Studies/ Storm/ CSDR State Local State Local State Local State Local 25% 75% $10 M $30 M $12.5 M $37.5 M $15 M $45 M 33% 67% $13.2 M $26.8 M $16.5 M $33.5 M $19.8 M $40.2 M 50% 50% $20 M $20 M $25 M $ 25 M $30 M $30 M 67% 33% $26.8 M $13.2 M $33.5 M $16.5 M $40.2 M $19.8 M 75% 25% $30 M $10 M $37.5 M $12.5 M $45 M $15 M If a 50/50 split or the current tiering used for the shallow draft funding is followed, the funding need for a State fund for beach nourishment is expected to be $20 - $40.2 million/yr depending on if a buffer for CSDR and storm projects are included. A minimum target of $25M annually is recommended for the state beach nourishment fund which would allow for some buffer and a minimum 50/50 cost share between State/Local interests. The ultimate need for beach nourishment and associated funding was projected based the management of all developed shoreline, including those that are currently accretional or have more than adequate beach protection at this time. The total potential managed shoreline would increases to miles. The State/Local costs may increase by a ratio of 2.44 giving an ultimate State/Local funding need of $92 million /yr ($37.5 million/yr * 2.44) for a conservative total of $95 to $115 million (including a buffer for some CSDR and storm funding or upfront engineering/environmental studies). VI-6
318 D. Potential Funding Sources Dedicated Shallow Draft Dredging Fund As has been shown previously, the current shallow draft fund ($19 million/yr) is adequate to meet both current and future projected needs and should be kept as is. This fund is more than justified given the amount of economic impact provided by the inlets to our State. Based on results from Section II, the inlets in NC provide $651.8 million in direct impact, $908.8 million in indirect impact, and 13,220 jobs. This approximates a ROI of $34.3/$1 to $47.8/$1 depending on whether economic multiplier effects are considered or not. Dedicated Deep Draft Dredging Fund The Deep Draft Port fund should be a recurring appropriation of $17.5 million/yr by the legislature as part of its investment in our ports. As a condition of fund use, all beach compatible material must be placed directly on adjacent beaches. As discussed previously, the ports bring an estimated economic impact of $ million (direct) and $ million (indirect) with 2,973 jobs. This approximates a ROI of $12.7/$1 to $23.8/$1 depending on whether economic multiplier effects are considered or not. Dedicated Beach Nourishment Fund The private sector and consumers in eight coastal counties are already generating the following estimated taxable sales annually: $5.2 billion in seasonal State taxable sales $1.5 billion in estimated taxable food service sales $5 B billion estimated taxable real estate transfers $1 billon in estimated taxable lodging sales $26.4 billion in estimated non-resident owned taxable property value An increase to the taxes levied on each of these in the eight coastal counties alone could potentially generate projected additional tax revenue as high as: $25 million from seasonal 0.5% State sales tax $15.1 million from a new 1% State meals tax $10 million from an additional land transfer fee of $1/$500 $21.2 million from a new 2% State OT $26.4 million from a new $0.10 ad-valorem tax per $100 of valuation non-resident properties. VI-7
319 To fund a Statewide beach preservation fund of $25 million annually based on a minimum 50% state cost share of the non-federal share of all beach preservation projects, three preferred revenue options were further refined. 1) A single source: a. A new 0.5% seasonal State sales tax, which will generate $25M. b. A new state ad-valorem property tax on property owned by non-nc residents ($0.10/$100), which will generate $26.4M 2) A combined source: a. A new 1% State meals tax, which will generate $15.1M, and b. An additional land transfer fee of $1/$500, which will generate $10M. 3) Reallocation of 50% of existing State sales tax collections revenues from shortterm lodging sales, which will generate $25.2 M. Each recommended funding source will keep pace with the State s beach preservation needs for the foreseeable future. The revenues generated by each funding source are ONLY the revenues generated in the eight coastal counties. If a new State tax were to be implemented statewide, ONLY that portion generated in the coastal counties would be deposited into the beach preservation fund. These funding strategies could be applied statewide if desired to fund other regional needs. In any case, the development of a state dedicated beach nourishment fund is justified. Even if one were to just consider the economic impact to the counties outside of the eight coastal counties, the investment of $25 million provides $1.406 billion in direct economic impact (ROI = $56/$1) and just over 10,000 jobs. If the eight coastal counties are included, the economic effect goes to $1.66 billion direct impact (ROI = $66.5/$1) and $4.74 billion indirect (ROI = $189.9/$1) with 48,718 jobs. Potential decisions concerning how funding is distributed can range from a simple annual allocation to each Region (County) based on managed beach mileage for local interests to decide how the funds should be allocated to a complex application process where projects and use of funds for approved beach preservation activities should be required. In any case, local interests should provide the State with documentation of their funding sources and proof of adequately maintaining their beach in order to receive State funds. E. Recommendations The current trend indicates that the scope and costs associated with beach nourishment and dredging projects in the state will continue to increase in the foreseeable future. Federal participation in beach nourishment and dredging projects has waned over the past decade as the federal government transfers the burden to the state and local sponsors. The State of North Carolina has been actively supporting its shallow draft inlet VI-8
320 dredging projects with the development of a dedicated Shallow Draft Navigation and Lake Dredging Fund which is projected to cover both current and future needs. Companion dedicated deep draft dredging and beach nourishment funds are needed. A recurring appropriation from general funds of $17.5 million/yr is recommended for the deep draft dredging fund with the condition that all beach compatible material must be placed directly on adjacent beaches. To support beach nourishment projects a State fund of a minimum of $25 million annually is recommended. There are three preferred options to generate revenue for the beach preservation fund including single and combined source new taxes or the reallocation of existing state sales tax within the eight coastal counties. The selection of the appropriate revenue source shall be made by the General Assembly with input from stakeholders in the eight coastal counties. The BIMP is a living document and therefore future updates to the plan should continue review beach nourishment and dredging projections so that the state can adjust strategy, policy, and funding sources as required to continue to support these vital resources. VI-9


")

321 4700 Falls of Neuse, Suite 300, Raleigh, NC P: (919)
NORTH CAROLINA BEACH AND INLET UPDATE MANAGEMENT PLAN FINAL REPORT DECEMBER 2016
 NORTH CAROLINA BEACH AND INLET MANAGEMENT PLAN UPDATE FINAL REPORT DECEMBER 2016 EXECUTIVE SUMMARY North Carolina s oceanfront beaches and active tidal inlets play a dominant role in promulgating the state
BEACH AND INLET MANAGEMENT PLAN (BIMP)
") 2016 BEACH AND INLET MANAGEMENT PLAN (BIMP) Statewide Plan to Best Manage Critical Beach and Inlet Resources Baseline Plan (2009) Collect Physical and Economic Data and Identify Gaps Define Beach/Inlet
2016 BEACH AND INLET MANAGEMENT PLAN (BIMP) Statewide Plan to Best Manage Critical Beach and Inlet Resources Baseline Plan (2009) Collect Physical and Economic Data and Identify Gaps Define Beach/Inlet
BOCA RATON INLET MANAGEMENT STUDY IMPLEMENTATION PLAN CERTIFICATE OF ADOPTION
 BOCA RATON INLET MANAGEMENT STUDY IMPLEMENTATION PLAN CERTIFICATE OF ADOPTION WHEREAS the Department of Environmental Protection, in partnership with the City of Boca Raton. has sponsored a study of the
APPENDIX G FUNDING APPENDIX A APPENDIX B APPENDIX C APPENDIX D APPENDIX E APPENDIX F APPENDIX G FUNDING SEDIMENT ANALYSIS CRYSTAL BALL ANALYSIS
 APPENDIX A WAVE & SEDIMENT MODELS APPENDIX B SEDIMENT ANALYSIS APPENDIX G FUNDING APPENDIX C CRYSTAL BALL ANALYSIS APPENDIX D SBEACH ANALYSIS APPENDIX E GENESIS ANALYSIS APPENDIX F PREFERRED ALTERNATIVE
FINAL INTEGRATED GENERAL REEVALUATION REPORT AND SUPPLEMENTAL ENVIRONMENTAL IMPACT STATEMENT ADDENDUM
 FINAL INTEGRATED GENERAL REEVALUATION REPORT AND SUPPLEMENTAL ENVIRONMENTAL IMPACT STATEMENT BREVARD COUNTY, FLORIDA HURRICANE AND STORM DAMAGE REDUCTION PROJECT MARCH 2014 U.S. Army Corps of Engineers
Position Statement on a 2018 Water Resources Development Act (WRDA)
") Position Statement on a 2018 Water Resources Development Act (WRDA) In order to maintain the safety and resilience of our nation s coastlines, Congress must continue a twoyear cycle for passing Water Resource
Position Statement on a 2018 Water Resources Development Act (WRDA) In order to maintain the safety and resilience of our nation s coastlines, Congress must continue a twoyear cycle for passing Water Resource
Fiscal Analysis Long-Term Average Annual Oceanfront Erosion Rate Update Study Draft Erosion Rates and Amendments to 15A NCAC 7H.
 Fiscal Analysis 2011 Long-Term Average Annual Oceanfront Erosion Rate Update Study 2011 Draft Erosion Rates and Amendments to 15A NCAC 7H.0304(1)(a) Prepared by Ken Richardson Senior Environmental Specialist
GENERAL ASSEMBLY OF NORTH CAROLINA SESSION 2001 SESSION LAW HOUSE BILL 698
 GENERAL ASSEMBLY OF NORTH CAROLINA SESSION 2001 SESSION LAW 2001-381 HOUSE BILL 698 AN ACT TO REPEAL THE CARTERET COUNTY OCCUPANCY TAX LAW AND TO AUTHORIZE CARTERET COUNTY TO LEVY A NEW OCCUPANCY AND TOURISM
Town of North Topsail Beach
 Daniel Tuman, Mayor Tom Leonard, Mayor Pro Tem Aldermen: Suzanne Gray Don Harte Richard Macartney Richard Peters Town of North Topsail Beach Stuart Turille Town Manager Carin Z. Faulkner, MPA Town Clerk
GOAL 1: Protect coastal resources and human life and limit public expenditures in areas that are subject to destruction by natural disasters..
 GOALS, OBJECTIVES, AND POLICIES GOAL 1: Protect coastal resources and human life and limit public expenditures in areas that are subject to destruction by natural disasters.. OBJECTIVE 1.1: The City will
Appendix G UPDATE OF THE ECONOMIC BENEFITS OF THE DISTRICT S WATERWAYS IN VOLUSIA COUNTY
 Appendix G UPDATE OF THE ECONOMIC BENEFITS OF THE DISTRICT S WATERWAYS IN VOLUSIA COUNTY TABLE OF CONTENTS Section Page I INTRODUCTION... G-1 Summary of Findings... G-2 The Intracoastal Waterway... G-3
CAPTIVA ISLAND EMERGENCY MAINTENANCE PLAN. December, 1998
 CAPTIVA ISLAND EMERGENCY MAINTENANCE PLAN December, 1998 Contents Introduction... 4 Purpose... 4 Initial Restoration and Renourishment Design... 4 Emergency Maintenance Criteria... 5 Storm Damage and Response...
BEACH MANAGEMENT PROGRAM SUSTAINABILITY
 Florida Shore and Beach Preservation Association 55 th Annual Conference September 14-16, 2011 - Miami Beach, FL BEACH MANAGEMENT PROGRAM SUSTAINABILITY Christopher G. Creed, P.E. ccreed@olsen-associates.com
Re: Town of Ocean Isle Beach Terminal Groin Scoping Comments: Corps Action ID#: SAW
 October 19, 2012 Emily B. Hughes Project Manager US Army Corps of Engineers 69 Darlington Avenue Wilmington, NC 28403-1343 Re: Town of Ocean Isle Beach Terminal Groin Scoping Comments: Corps Action ID#:
Appendix E UPDATE OF THE ECONOMIC BENEFITS OF THE DISTRICT S WATERWAYS IN ST. JOHNS COUNTY
 Appendix E UPDATE OF THE ECONOMIC BENEFITS OF THE DISTRICT S WATERWAYS IN ST. JOHNS COUNTY Section TABLE OF CONTENTS Page I INTRODUCTION... E-1 Summary of Findings... E-2 The Intracoastal Waterway... E-3
Fiscal Analysis. Repeal of High Hazard Flood AEC Amendments to 15A NCAC 7H.0304(2) and 15A NCAC 7K Prepared by
 and 15A NCAC 7K Prepared by") Fiscal Analysis Repeal of High Hazard Flood AEC Amendments to 15A NCAC 7H.0304(2) and 15A NCAC 7K.0213 Prepared by Mike Lopazanski NC Division of Coastal Management (252) 808-2808 Ext. 223 September 17,
Fiscal Analysis Repeal of High Hazard Flood AEC Amendments to 15A NCAC 7H.0304(2) and 15A NCAC 7K.0213 Prepared by Mike Lopazanski NC Division of Coastal Management (252) 808-2808 Ext. 223 September 17,
Appendix M UPDATE OF THE ECONOMIC BENEFITS OF THE DISTRICT S WATERWAYS IN BROWARD COUNTY
 Appendix M UPDATE OF THE ECONOMIC BENEFITS OF THE DISTRICT S WATERWAYS IN BROWARD COUNTY TABLE OF CONTENTS Section Page I INTRODUCTION... M-1 Summary of Findings... M-2 The Intracoastal Waterway... M-3
PALM BEACH COUNTY BOARD OF COUNTY COMMISSIONERS AGENDA ITEM SUMMARY. Environmental Resources Management Environmental Resources Management
 '-/F-:L PALM BEACH COUNTY BOARD OF COUNTY COMMISSIONERS AGENDA ITEM SUMMARY Agenda Item: Meeting Date: February 7, 2012 ( ) Consent ( ) Workshop Department Submitted By: Submitted For: Environmental Resources
GENERAL ASSEMBLY OF NORTH CAROLINA SESSION 2005 SESSION LAW SENATE BILL 1431
 GENERAL ASSEMBLY OF NORTH CAROLINA SESSION 2005 SESSION LAW 2006-167 SENATE BILL 1431 AN ACT (1) TO AUTHORIZE THE TOWN OF BURGAW TO LEVY A ROOM OCCUPANCY AND TOURISM DEVELOPMENT TAX; AND (2) TO CREATE
Appendix L UPDATE OF THE ECONOMIC BENEFITS OF THE DISTRICT S WATERWAYS IN PALM BEACH COUNTY
 Appendix L UPDATE OF THE ECONOMIC BENEFITS OF THE DISTRICT S WATERWAYS IN PALM BEACH COUNTY TABLE OF CONTENTS Section Page I INTRODUCTION... L-1 Summary of Findings... L-2 The Intracoastal Waterway...
GENERAL ASSEMBLY OF NORTH CAROLINA SESSION 2001 SESSION LAW HOUSE BILL 1707
 GENERAL ASSEMBLY OF NORTH CAROLINA SESSION 2001 SESSION LAW 2002-138 HOUSE BILL 1707 AN ACT TO PROVIDE TOURISM DEVELOPMENT FOR THE NEW HANOVER COUNTY BEACH TOWNS, TO PROVIDE FOR THE ESTABLISHMENT OF A
Recreational Boater Willingness to Pay for an Atlantic Intracoastal Waterway Dredging. and Maintenance Program 1. John C.
 Recreational Boater Willingness to Pay for an Atlantic Intracoastal Waterway Dredging and Maintenance Program 1 John C. Whitehead Department of Economics Appalachian State University Boone, North Carolina
Crediting Adaptation Strategies through the National Flood Insurance Program s Community Rating System Coordinator s Manual
 Crediting Adaptation Strategies through the National Flood Insurance Program s Community Rating System Coordinator s Manual W. Thomas Hawkins, Adjunct Faculty, University of Florida, Levin College of Law
CHAPTER 3. Corps Civil Works Missions
 CHAPTER 3 Corps Civil Works Missions 3-1. Purpose and Authorities. Federal interest in water resources development is established by law. Within the larger Federal interest in water resource development,
Did not work at home: Less than 5 minutes Estimate Estimate Estimate
 Economics Traditionally, the Economics Element focused on data and analysis related to unemployment, employment by industry, and labor force characteristics of a community. For the 2015 Comprehensive Plan,
COASTAL HAZARD MITIGATION TOOLS AND TECHNIQUES
 COASTAL HAZARD MITIGATION TOOLS AND TECHNIQUES Beach Nourishment Responsible Agency/Party: Mitigation for: Management Effort: Federal and/or State sponsored projects Long- and short-term erosion Flood
Captiva Island, Florida Beach Comprehensive Management and Emergency Response Plan. Prepared for: Captiva Erosion Prevention District
 Captiva Island, Florida Beach Comprehensive Management and Emergency Response Plan Prepared for: Captiva Erosion Prevention District Board of Commissioners: Jim Boyle, Chairman Doris Holzheimer, Vice Chairman
Investor Meetings March 2008
 Investor Meetings March 2008 Safe Harbor This presentation may contain "forward-looking" statements as defined in Section 27A of the Securities Act of 1933 (the "Securities Act"), Section 21E of the Securities
Addressing Long-Term Shoreline Management in North and South Carolina. Jim London London & Associates and Clemson University
 Addressing Long-Term Shoreline Management in North and South Carolina Jim London London & Associates and Clemson University The Loyal Opposition That Polar Vortex Thing SC Beachfront Management Act of
OBJECTIVE C9 - Levels of Protection for the West Indian Manatees
 OBJECTIVE C9 - Levels of Protection for the West Indian Manatees Protect the West Indian Manatees and increase boating safety within Broward County s waterways. Restrict access and activities in designated
Coastal Counties Economic Overview
 Coastal Counties Economic Overview LEGISLATIVE MANDATE SECTION 14.22.(c) The Department of Commerce shall study and provide an executive summary of readily available economic data related to the 20 coastal
Western Dredging Association Eastern Chapter Annual Meeting Infrastructure Strategy Overview and P3/P4 Review
 Western Dredging Association Eastern Chapter Annual Meeting Infrastructure Strategy Overview and P3/P4 Review Edward J Hecker Senior Policy Advisor Institute for Water Resources US Army Corps of Engineers
Options for Funding Beach Management Activities. Christopher Layton, MPA, ICMA-CM Town Manager
 Options for Funding Christopher Layton, MPA, ICMA-CM Town Manager Options for Funding Beach Management Activities Federal Funding State Funding Local Funding Local Option Sales Tax County Occupancy Tax
September 8, RE: Application for Planned Unit Development and Special Exemption Permit by Bluff Point Holdings LLC
 September 8, 2011 Northumberland County Board of Supervisors P.O. Box 129 Heathsville, VA 22473 RE: Application for Planned Unit Development and Special Exemption Permit by Bluff Point Holdings LLC Dear
FINAL INTEGRATED GENERAL REEVALUATION REPORT AND ENVIRONMENTAL IMPACT STATEMENT SHORE PROTECTION
 FINAL INTEGRATED GENERAL REEVALUATION REPORT AND ENVIRONMENTAL IMPACT STATEMENT SHORE PROTECTION WEST ONSLOW BEACH AND NEW RIVER INLET (TOPSAIL BEACH) NORTH CAROLINA February 2009 Revised April 2009 US
CRS UNIFORM MINIMUM CREDIT NORTH CAROLINA
 CRS UNIFORM MINIMUM CREDIT NORTH CAROLINA SUMMARY The Community Rating System (CRS) provides Uniform Minimum Credit (UMC) for certain state laws, regulations, and standards that support floodplain management
NORTH CAROLINA EMERGENCY MANAGEMENT
 NORTH CAROLINA EMERGENCY MANAGEMENT NC Association of Municipal Clerks Friday, August 18, 2017 Atlantic Beach, NC Presenters: Mary Glasscock & Brian Snell NCEM PA PUBLIC ASSISTANCE PROGRAM Emergency Work
STAFF REPORT - HARBOR DISTRICT MEETING July 26, 2018
 COMMISSIONERS 1 st Division Larry Doss 2 nd Division Greg Dale 3 rd Division Stephen Kullmann 4 th Division Richard Marks 5 th Division Patrick Higgins TO: FROM: Humboldt Bay Harbor, Recreation and Conservation
North Atlantic Coast Comprehensive Study: Resilient Adaption to Increasing Risk
 North Atlantic Coast Comprehensive Study: Resilient Adaption to Increasing Risk U.S. Army Corps of Engineers Coastal Storm Risk Management Planning Center of Expertise Amy M. Guise, USACE 21 November 2013
Agenda Item B.8 CONSENT CALENDAR Meeting Date: May 19, 2015
 Agenda Item B.8 CONSENT CALENDAR Meeting Date: May 19, 2015 TO: FROM: CONTACT: SUBJECT: Mayor and Councilmembers Jennifer Carman, Planning and Environmental Review Director Anne Wells, Advance Planning
COMMON QUESTIONS & ANSWERS CONNECTICUT RESERVE NOMINATION PUBLIC MEETING
 QUESTION: What is the National Estuarine Research Reserve System? ANSWER: The National Estuarine Research Reserve System (https://coast.noaa.gov/nerrs/) is a network of protected areas representative of
DPP = Draft Proposed Outer Continental Shelf (OCS) Oil & Gas Leasing Program for (REVISIT)
 Oil & Gas Leasing Program for (REVISIT)") DPP = Draft Proposed Outer Continental Shelf (OCS) Oil & Gas Leasing Program for 2017 2022 (REVISIT) Point #1. BOEM = Bureau of Ocean Energy Management & DOI = Department of the Interior, i.e., the Administration.
DPP = Draft Proposed Outer Continental Shelf (OCS) Oil & Gas Leasing Program for 2017 2022 (REVISIT) Point #1. BOEM = Bureau of Ocean Energy Management & DOI = Department of the Interior, i.e., the Administration.
Water Resources Development Plan
 North Carolina Department of Environmental Quality Division of Water Resources Water Resources Development Plan Fiscal Years 20172022 July 1, 2016 Water Resources Development Plan Fiscal Years 2017 2022
H 7250 S T A T E O F R H O D E I S L A N D
 LC00 01 -- H 0 S T A T E O F R H O D E I S L A N D IN GENERAL ASSEMBLY JANUARY SESSION, A.D. 01 A N A C T RELATING TO WATERS AND NAVIGATION -- THE OFFSHORE OIL AND GAS DRILLING AND EXPLORATION ACTIVITIES
Project Identification Current Construction Phase Funding and Sources Adequacy of Funding
 Department: Report Date: October 1, 2016 Department of Environmental Quality Project Identification Current Construction Phase Funding and Sources Adequacy of Funding Comments Projected Completion Will
FUNDING OPTIONS FOR THE TEXAS COASTAL RESILIENCY MASTER PLAN
 FUNDING OPTIONS FOR THE TEXAS COASTAL RESILIENCY MASTER PLAN The General Land Office is responsible for managing the Texas coastline, from the beach to nearshore waters and out to 10.3 miles into the Gulf
Great Lakes Navigation System Five-Year Development Plan. Great Lakes System
 Great Lakes Navigation System Five-Year Development Plan Great Lakes System Great Lakes and Ohio River Division FY07 FY12 December 2006 Executive Summary Purpose of the Five Year Development Plan The Five
Economic Damages of Hurricane Gustav to Seafood Processors and Dealers, Marinas, and Livebait Dealers in Coastal Mississippi
 Bulletin 1190 April 2011 Economic Damages of Hurricane Gustav to Seafood Processors and Dealers, Marinas, and Livebait Dealers in Coastal Mississippi Mississippi AgriculturAl & Forestry experiment station
Attachment B. King County Flood Control Zone District Work Program
 Attachment B King County Flood Control Zone District Work Program The King County Flood Control Zone District work program is comprised of two major categories: Programmatic Work Program o Flood Preparedness,
Presentation to the LRC Study Committee on Property Insurance Rate Making. By the. North Carolina Rate Bureau. December 1, 2011
 Presentation to the LRC Study Committee on Property Insurance Rate Making By the North Carolina Rate Bureau December 1, 2011 1 Purpose The purpose of this presentation is to inform, educate, provide facts
ASBPA PARTNERING COMMITTEE S GUIDANCE ON INCORPORATING SURFING CONCERNS INTO PLANNING AND DESIGN OF FEDERAL SHORE PROTECTION AND NAVIGATION PROJECTS
 ASBPA PARTNERING COMMITTEE S GUIDANCE ON INCORPORATING SURFING CONCERNS INTO PLANNING AND DESIGN OF FEDERAL SHORE PROTECTION AND NAVIGATION PROJECTS PURPOSE This document is intended to succinctly outline
Port of San Francisco SUMMARY San Francisco's 7.5 mile northern and eastern waterfront has given the city a colorful and vital maritime legacy,
 Port of San Francisco SUMMARY San Francisco's 7.5 mile northern and eastern waterfront has given the city a colorful and vital maritime legacy, primarily related to the shipping industry. However, in recent
THE NEW YORK STATE PARK SYSTEM:
 THE NEW YORK STATE PARK SYSTEM: AN ECONOMIC ASSET TO THE EMPIRE STATE James Heintz, Robert Pollin & Heidi Garrett-Peltier Political Economy Research Institute University of Massachusetts, Amherst March
Factors Influencing Perceptions of Climate and Weather Effects on Property Ownership
 Factors Influencing Perceptions of Climate and Weather Effects on Property Ownership Huili Hao¹, Patrick Long¹, and Scott Curtis 12 1. 1. Center for Sustainability: Tourism, Natural Resources, and the
Public Notice. Proposed anchor structures, dredging, and discharge at the Enbridge Line 5 pipeline in the Straits of Mackinac, Michigan
 US Army Corps of Engineers Detroit District Public Notice Applicant: Enbridge Pipelines (Lakehead), LLC In Reply Refer To: Corps File No. LRE-2010-00463-56-N18 Date: January 29, 2019 Expires: February
Distribution Restriction Statement Approved for public release; distribution is unlimited.
 CECW-PR Regulation No. 1165-2-130 Department of the Army U.S. Army Corps of Engineers Washington, DC 20314-1000 Water Resources Policies and Authorities FEDERAL PARTICIPATION IN SHORE PROTECTION Distribution
The Fiscal Impact of Beaches in California
 The Fiscal Impact of Beaches in California A Report Commissioned by The California Department of Boating and Waterways by Philip King, Ph.D Public Research Institute San Francisco State University September
Marin County Flood Control and Water Conservation District FLOOD CONTROL ZONE 5 ADVISORY BOARD MAY 15, 2014 STAFF REPORT
 FLOOD CONTROL ZONE 5 ADVISORY BOARD MAY 15, 2014 STAFF REPORT Item 1. Approval of Meeting Minutes for February 10, 2014 Recommended Action: Approve minutes. Item 2. Open Time for Items not on the Agenda
DEPARTMENT OF THE ARMY OFFICE OF THE CHIEF OF ENGINEERS WASHINGTON, D.C
 DEPARTMENT OF THE ARMY OFFICE OF THE CHIEF OF ENGINEERS WASHINGTON, D.C. 20310-2600 REPLY TO ATTENTION OF CECW-P (1105-2-10a) 0 2 JUN 2003 THE SECRETARY OF THE ARMY 1. I submit for transmission to Congress
TAX LEVY A. TAX AT A GLANCE B. TAX LEVY SOURCES VIII-1
 A. TAX AT A GLANCE TAX LEVY The maximum allowable levy for 2018 is $101.6 million. For 2018 the levy will be $72.0 million. The estimated millage rate is $0.1358. The 2018 levy will be used for: o General
House Appropriations Committee on Capital. Proposed Special Provisions for H.B. 1030, 2016 Appropriations Act
 House Appropriations Committee on Capital Proposed Special Provisions for H.B. 00, 0 Appropriations Act May, 0 GENERAL ASSEMBLY OF NORTH CAROLINA SPECIAL PROVISIONS HOUSE APPROPRIATIONS, CAPITAL REPORT
BOARD OF COUNTY COMMISSIONERS AGENDA ITEM SUMMARY
 8C3 ADDITIONAL ITEM BOARD OF COUNTY COMMISSIONERS AGENDA ITEM SUMMARY PLACEMENT: DEPARTMENTAL PRESET: 11:45 AM TITLE: CONSIDER APPROVAL OF CONTRACT FOR THE BATHTUB BEACH/SAILFISH POINT BEACH PROJECT AND
- Wanda Thornton (Accomack County) provided opening remarks - COL Olsen, US Army Corps of Engineers (USACE)
 provided opening remarks - COL Olsen, US Army Corps of Engineers (USACE)") Eastern Shore Navigation Partnership Meeting Welcome - Wanda Thornton (Accomack County) provided opening remarks - COL Olsen, US Army Corps of Engineers (USACE) o Provided state of the Corps as affected
Eastern Shore Navigation Partnership Meeting Welcome - Wanda Thornton (Accomack County) provided opening remarks - COL Olsen, US Army Corps of Engineers (USACE) o Provided state of the Corps as affected
Community Incentives for Nature-Based Flood Solutions
 Community Incentives for Nature-Based Flood Solutions A GUIDE TO FEMA S COMMUNITY RATING SYSTEM FOR CONSERVATION PRACTITIONERS The Federal Emergency Management Agency (FEMA) uses a Community Rating System
RESTORE ACT Direct Component Multiyear Plan Matrix Department of the Treasury OMB Approval No Applicant Name:
 RESTORE ACT Direct Component Multiyear Plan Matrix Department of the Treasury OMB Approval No. 1505-0250 Applicant Name: Manatee County 1. MULTIYEAR PLAN VERSION (INITIAL OR AMENDMENT NUMBER): Initial
TABLE OF CONTENTS. Introduction to the Economic Development Element 1
 TABLE OF CONTENTS Section Page Introduction to the Economic Development Element 1 Purpose of the Economic Development Element 1 Economic Factors Affecting the City 1 Scope and Content of the Economic Development
Worldwide, capture fisheries are already fully,
 U.S. Army Corps of Engineers Regulation of Offshore Aquaculture Worldwide, capture fisheries are already fully, or near fully, exploited, but seafood demand continues to increase with a growing global
Distribution Restriction Statement Approved for public release; distribution is unlimited.
 CECW-PA Engineer Regulation 1165-2-122 Department of the Army U.S. Army Corps of Engineers Washington, DC 20314-1000 Water Resource Policies and Authorities STUDIES OF HARBOR OR INLAND HARBOR PROJECTS
ADMINISTRATIVE APPEAL DECISION RICHARD S. PACULA JURISDICTIONAL DETERMINATION NUMBER WILMINGTON DISTRICT
 ADMINISTRATIVE APPEAL DECISION RICHARD S. PACULA JURISDICTIONAL DETERMINATION NUMBER 200100717 WILMINGTON DISTRICT Review Officer: Arthur L. Middleton, U.S. Army Corps of Engineers (USACE), South Atlantic
DEPARTMENT OF THE ARMY U. S. Army Corps of Engineers CECW-CP Washington, DC APPENDIX F CONTINUING AUTHORITIES PROGRAM TABLE OF CONTENTS
 ER-1105-2-100 DEPARTMENT OF THE ARMY U. S. Army Corps of Engineers CECW-CP Washington, DC 20314-1000 Regulation 31 January 2007 ER 1105-2-100 APPENDIX F CONTINUING AUTHORITIES PROGRAM TABLE OF CONTENTS
Pinellas County Capital Improvement Program, FY2011 Through FY2016 INTRODUCTION AND BACKGROUND
 Introduction to the Six-Year Capital Improvement Program (CIP) The Pinellas County Capital Improvement Program (CIP) is a comprehensive six-year plan of proposed capital projects, intended to identify
Volusia County Floodplain Management Plan 2012
 Volusia County Floodplain Management Plan 2012 Introduction The National Flood Insurance Program (NFIP) provides federally supported flood insurance in communities that regulate development in floodplains.
U.S. Army Corps of Engineers Navigation Program Update
 U.S. Army Corps of Engineers Navigation Program Update For Waterways Council, Inc. Jeffrey A. McKee Chief, Navigation Branch US Army Corps of Engineers March 14, 2016 US Army Corps of Engineers 1 Corps
Minutes Educational Advisory Committee (EAC) 15 October :00-4:00 pm
 15 October :00-4:00 pm") Minutes Educational Advisory Committee (EAC) 15 October 2018-2:00-4:00 pm In Attendance: Ken Fisher, Forestry Willie Lantz, Agriculture Greg Rouse, Recreation Gary Shafer, Property Owner Bob Sutton, Property
Minutes Educational Advisory Committee (EAC) 15 October 2018-2:00-4:00 pm In Attendance: Ken Fisher, Forestry Willie Lantz, Agriculture Greg Rouse, Recreation Gary Shafer, Property Owner Bob Sutton, Property
Delaware River Basin Commission s Role in Flood Loss Reduction Efforts
 Delaware River Basin Commission s Role in Flood Loss Reduction Efforts There is a strong need to reduce flood vulnerability and damages in the Delaware River Basin. This paper presents the ongoing role
Coastal Works Review
 Coastal Works Review MM CB Ltd Proposed Shoreline Modification and Excavation of an Access Channel and Flushing Inlets for an Inland Boat Marina and Swimming Lagoon. CAYMAN BRAC Block: 95B Parcels: 25,
APPENDIX C ECONOMIC ANALYSIS OF STORM DAMAGE REDUCTION WITH RECREATION BENEFITS SEGMENT II
 APPENDIX C ECONOMIC ANALYSIS OF STORM DAMAGE REDUCTION WITH RECREATION BENEFITS SEGMENT II APPENDIX C ECONOMIC ANALYSIS OF STORM DAMAGE REDUCTION WITH RECREATION BENEFITS SEGMENT II TABLE OF CONTENTS INTRODUCTION...
FY 2007 FEDERAL FUNDING FOR BEACH PROJECTS AND STUDIES
 CA Coastal Sediment Master Plan $300,000 $300,000 $300,000 Carpinteria, CA $0 $0 $200,000 Coast of CA, South Coast Region (LA County) $0 $200,000 $0 Imperial Beach Silver Strand, CA $0 $0 $167,000 Ocean
ST. AUGUSTINE PORT, WATERWAY & BEACH DISTRICT MINUTES OF REGULAR MEETING. Tuesday, November 18, 2014
 ST. AUGUSTINE PORT, WATERWAY & BEACH DISTRICT MINUTES OF REGULAR MEETING Tuesday, November 18, 2014 The regular meeting of the St. Augustine Port, Waterway & Beach District was held at the St. Augustine
Future Directions for Civil Works Project Delivery and Partnership
 Future Directions for Civil Works Project Delivery and Partnership Becky Moyer Chief, Planning & Policy Southwestern Division 3 March 2016 US Army Corps of Engineers Future of the Texas Coast Shared Visioning
Barry Island and Docks (2)
") Barry Island and Docks (2) Draft Recommendations: Long Term Plan It has been assumed that the structures associated with Barry Docks will be maintained and upgraded in the long term, but this is subject
Barry Island and Docks (2) Draft Recommendations: Long Term Plan It has been assumed that the structures associated with Barry Docks will be maintained and upgraded in the long term, but this is subject
Proposed Report 1 DEPARTMENT OF THE ARMY CHIEF OF ENGINEERS 2600 ARMY PENTAGON WASHINGTON, DC
 Proposed Report 1 REPLY TO ATTENTION OF DEPARTMENT OF THE ARMY CHIEF OF ENGINEERS 2600 ARMY PENTAGON WASHINGTON, DC 20310-2600 DAEN THE SECRETARY OF THE ARMY 1. I submit for transmission to Congress my
Capital Construction and Debt Service
 Capital Construction and Debt Service The Capital Construction portion of this section includes an overview and summary of appropriations and expenditures for the design, construction, and repair of major
Issue Paper 3: Michigan s Great Lakes Bottomlands and Wind Energy
 Issue Paper 3: Michigan s Great Lakes Bottomlands and Wind Energy Development of offshore wind energy in Michigan requires placement of wind turbines on or over the bottomlands 1 within the state-owned
ECONOMIC IMPACT OF DANIA CUTOFF CANAL DREDGING
 ECONOMIC IMPACT OF DANIA CUTOFF CANAL DREDGING FINAL REPORT Prepared by: THOMAS J. MURRAY & ASSOCIATES, INC. September 14, 2015 On behalf of FLORIDA INLAND NAVIGATION DISTRICT Contact Person and Project
19A NCAC 02D.0532 Toll Operations. Establishment of tolls for all ferry routes except those designated by NC statute as free.
 FISCAL NOTE Rule Citation: Rule Topic: NCDOT Division: Staff Contact: 19A NCAC 02D.0531 Free Operations 19A NCAC 02D.0532 Toll Operations Establishment of tolls for all ferry routes except those designated
HOW PLANNING FOR SEA LEVEL RISE CREATES FLOOD INSURANCE REDUCTIONS: THE GEORGIA CONTEXT. Hunter Jones 1 I. INTRODUCTION
 HOW PLANNING FOR SEA LEVEL RISE CREATES FLOOD INSURANCE REDUCTIONS: THE GEORGIA CONTEXT Hunter Jones 1 I. INTRODUCTION Flood insurance rates are rising for homeowners. One way local governments can create
Update of Project Benefits
 Update of Project Benefits February 2014 Contents 1. Introduction 1 2. Purpose of the Revaluation Study 2 3. Original Project Benefits 2 4. Update of Residential Structure Benefits 3 5. Update of Non Residential
Executive Summary 1/3/2018
 Executive Summary 1/3/2018 EXECUTIVE SUMMARY This comprehensive plan was prepared by the City of Langley in accordance with Section 36.70A.070 of the Growth Management Act (GMA). The plan guides future
ADMINISTRA TIVE APPEAL DECISION RUDOLPH AND ROSEANN KRAUSE FILE NUMBER (LP-CR) JACKSONVILLE DISTRICT
 JACKSONVILLE DISTRICT") ADMINISTRA TIVE APPEAL DECISION RUDOLPH AND ROSEANN KRAUSE FILE NUMBER 2002 8023 (LP-CR) JACKSONVILLE DISTRICT Review Officer: Arthur L. Middleton, US Army Corps of Engineers (USACE), South Atlantic Division
ADMINISTRA TIVE APPEAL DECISION RUDOLPH AND ROSEANN KRAUSE FILE NUMBER 2002 8023 (LP-CR) JACKSONVILLE DISTRICT Review Officer: Arthur L. Middleton, US Army Corps of Engineers (USACE), South Atlantic Division
The FY 2012 Budget. California Marine and Navigation Conference. Gary A. Loew Chief, Programs Integration Division Civil Works Directorate, HQUSACE
 The FY 2012 Budget California Marine and Navigation Conference Gary A. Loew Chief, Programs Integration Division Civil Works Directorate, HQUSACE March 24, 2011 US Army Corps of Engineers BUILDING STRONG
BRIEFINGS October 2008
 BRIEFINGS October 2008 106 N. Bronough St. P. O. Box 10209 Tallahassee, FL 32302 (850) 222-5052 FAX (850) 222-7476 Voter Guide to the Proposed Constitutional Tax Amendments on the November 4, 2008 Ballot
HOUSE APPROPRIATIONS COMMITTEE AGRICULTURE AND NATURAL AND ECONOMIC RESOURCES REPORT. House Bill May 12, 2016
 HOUSE APPROPRIATIONS COMMITTEE ON AGRICULTURE AND NATURAL AND ECONOMIC RESOURCES REPORT ON THE CONTINUATION AND EXPANSION BUDGETS House Bill 1030 May 12, 2016 Department of Agriculture and Consumer Services
G318 Local Mitigation Planning Workshop. Module 2: Risk Assessment. Visual 2.0
 G318 Local Mitigation Planning Workshop Module 2: Risk Assessment Visual 2.0 Unit 1 Risk Assessment Visual 2.1 Risk Assessment Process that collects information and assigns values to risks to: Identify
Detailed Analysis of THE RESTORE ACT
 Detailed Analysis of THE RESTORE ACT Resources and Ecosystem Sustainability, Tourist Opportunities, and Revived Economies of the Gulf Coast States Act of 2012 Authors: Megan Herzog & Jay Austin UPDATED:
EAST CONTRA COSTA COUNTY HCP / NCCP MITIGATION FEE AUDIT DRAFT REPORT AND NEXUS STUDY. Prepared For: Prepared By:
 EAST CONTRA COSTA COUNTY HCP / NCCP MITIGATION FEE AUDIT AND NEXUS STUDY DRAFT REPORT Prepared For: East Contra Costa County Habitat Conservancy Prepared By: Robert D. Spencer, Urban Economics Sally E.
Goals, Objectives and Policies
 Goals, Objectives and Policies NATURAL DISASTER PLANNING GOAL ONE: PINELLAS COUNTY WILL PROTECT HUMAN LIFE, PRIVATE PROPERTY AND PUBLIC INVESTMENT FROM THE EFFECTS OF HURRICANES AND OTHER NATURAL DISASTERS
INTRODUCTION INTRODUCTION 1
 INTRODUCTION The provides a blueprint for the future growth and development of the City in the coming decade. The Comprehensive Plan is long-range in scope and represents a comprehensive update of the
Capital Construction and Debt Service
 Capital Construction and Debt Service The Capital Construction portion of this section includes an overview and summary of appropriations and expenditures for the design, construction and repair of major
Recommendations on President s Aid to Negotiations Environmental Impact Assessments
 Recommendations on President s Aid to Negotiations Environmental Impact Assessments ISSUE Relevant text from PRESIDENT S AID TO NEGOTIATIONS (PAN) PROPOSED EDITS RATIONALE SUPPORT (where applicable) 1.