Economic Impact Group, LLC.
|
|
|
- Griselda Flowers
- 5 years ago
- Views:
Transcription

1 Tracking Your Region s Economic Performance Dr. Alfie Meek Economic Impact Group, LLC. June 3,
2 8:30 9:00 9:00 9:30 9:30 10:00 10: : :15 10:45 10:45 12:00 12:00 1:00 1:00 2:30 2:30 2:45 2:45 4:00 Introduction Economic Indicators Data Sources & Tracking Break Data Issues The Math! Lunch Building an index Break Building an index (cont.) Agenda 2
3 What is an Index? A statistical measure of change in an economy or market. It has its own calculation methodology and is usually expressed in terms of a change from a base value. Therefore, the percentage change is more important than the actual numeric value. Introduction 3
4 What is an Economic o Index? A measure of the alternating waves of economic expansion and contraction (a.k.a. business cycle ) in an economy. Leading Index Coincident (Current) Index Lagging Index Other types of indices? Innovation Index Entrepreneur or Small Business Index Introduction 4
")


5 What is a dashboard? d Provides at-a-glance views of Key Performance Indicators (KPIs) relevant to a particular objective or business process. Can be broken down according to role and are either strategic, analytical, operational, or informational. Analytical & Informational dashboards often include more context, comparisons, and history, along with subtler performance evaluators. Introduction 5
6 Why ydoa an Economic o Index? Reflects the direction of current and future economic activity in a given area. A gauge of where an economy has been, where it is, and where it is headed. Gain an understanding of what drives the local economy. Introduction 6
7 Economic Indicators 7
8 National a Leading Coincident (current) Lagging Local Leading Coincident (current) Lagging Economic Indicators 8
9 Criteria: Economic significance Statistical adequacy Timing at recessions and revivals Conformity to historical business cycles Smoothness Timeliness Economic Indicators 9 Source: Victor Zarnowitz, Business Cycles: Theory, History, Indicators, and Forecasting.
10 U.S. US Leading Economic o Index Average weekly hours, manufacturing Average weekly initial claims for unemployment insurance Manufacturers new orders, consumer goods and materials Vendor performance, slower deliveries diffusion index Manufacturers new orders, non-defense capital goods National Economic Indicators 10
11 U.S. US Leading Economic o Index (cont.) o Building permits Stock prices, 500 common stocks Money supply (M2) Interest rate spread, 10-yr. Treasury bond less federal funds Index of Consumer Expectations National Economic Indicators 11
12 U.S. US Current (Coincident) Economic o Index Employees on nonagricultural payrolls Personal income less transfer payments Industrial production Manufacturing and trade sales National Economic Indicators 12
13 U.S. Lagging g Economic Index Average duration of unemployment Inventories to sales ratio, manufacturing and trade Labor cost per unit of output, manufacturing Average prime rate Commercial and industrial i loans Consumer installment credit to personal income ratio Consumer price index for services National Economic Indicators 13
14 Possible Leading Economic o Indicators: Initial unemployment claims New residential building permits (single family) Number Value New automobile registrations Stock index Consumer expectations (proxy) Manufacturing average weekly hours (proxy) Local Economic Indicators 14
15 Possible Coincident Economic o Indicators Retail sales Durable goods Sales tax receipts Hotel/Motel tax receipts Domestic airport passengers Employment Household Establishment Consumer confidence (proxy) Local Economic Indicators 15
16 Possible Lagging g Economic o Indicators Average duration of unemployment benefits Prime rate Bankruptcies Unemployment rate Local Economic Indicators 16
17 Data Sources & Tracking 17
18 Internal data a Local government data State/Federal government data Non-government public data Private data Data Sources/Tracking 18
19 Your organization a o may have developed d some internal indicators and/or variables that track some aspect of the local economy. Number of new businesses Customer/client calls Procurement appeals Internal Data 19
20 Tax collections o Income tax collections Sales tax collections Hotel/Motel tax collections Building permits Business licenses Local Government Data 20
21 State: Sa State Labor Department county level labor force, weekly hours, initial claims, duration of unemployment, etc. Auto registrations Federal: CPI ( Bankruptcies Administrative Office of U.S. District Courts State/Federal Government Data 21
22 Bloomberg Stock Indexes & interest rates ( Freelunch ( Conference Board Consumer Confidence ( Public Data 22
23 Data aavendors dos Example: Economy.com s Data Buffet ( Private Data 23
24 Break 15 minutes 24
25 Data Issues 25
26 Availability/Timeliness ab Seasonality Trading day adjustments Inflation Data Issues 26
27 The number one requirement for an economic indicator is that it is available in a timely manner. The best variables for an economic index are: 1. monthly series that t are 2. available with short lags and are 3. not subject to large revisions Data Issues Availability 27
28 Most economic data contain seasonal patterns. The seasonal pattern must be removed before any underlying economic trend can be identified. For monthly data, seasonal adjustment procedures estimate effects that occur in the same calendar month with similar magnitude and direction from year to year. Data Issues - Seasonality 28
29 Examples: Retail sales Christmas, back-to-school Construction Northeast in January Note: Seasonal adjustment does NOT account for anomalies in the data. Seasonal factors are estimates based on present and past experience. Future data may show a different seasonal pattern. Data Issues - Seasonality 29
30 Example: Sales Tax Revenue $15 $14 $13 (Millions) $12 $11 $10 $9 $8 Jan Feb Mar Apr May Jun Jul Aug Sep Oct Nov Dec. Actual Sales Tax SA Sales Tax 30
31 Y = C + S + T + I (additive) Y = C S T I (multiplicative) C = Trend cycle S = Seasonality index T = Trading day index I = Irregular component You can use the Census X-13 ARIMA Seasonal Adjustment Program which can be found here: / / / / Data Issues - Seasonality 31
32 Recurring effects associated with individual days of the week are called trading-day d effects. Calendar months are of different lengths and begin on different days In a 28 day month, each day is represented exactly 4 times. However, in a 30 day month, two days are represented 5 times. Some economic data might be impacted by the presence of an additional weekend or weekday. Data Issues Trading Days 32
33 For example, building permit offices are usually closed on Saturday and Sunday. Thus, the number of building permits issued in a given month is likely to be higher if the month contains a surplus of weekdays and lower if the month contains a surplus of weekend days. Data Issues Trading Days 33
34 1,500 1,450 1,400 1,350 1,300 1,250 1,200 1,150 1,100 1,050 Example: Building Permits 1,000 Jan Feb Mar Apr May Jun Jul Aug Sep Oct Nov Dec. Actual Permits SA Permits SA & TDA Permits 34
35 Example: Sales Tax Collections: [Actual data / (seasonal factor x trading day factor)] = Seasonally Adjusted Data Month Actual Seasonal Factor Trading Day Factor Adjusted Data November $11,545, $12,685,323 December $13,751, $12,491,019 Data Issues Trading Days 35
36 Economic o data a reported in dollars ($) has an inflation component As with seasonality, and trading day influences, inflation must be removed before any underlying economic trend can be identified. Data Issues - Inflation 36
37 Example: Sales Tax Revenue $15 $14 $13 (Millions) $12 $11 $10 $9 $8 Jan Feb Mar Apr May Jun Jul Aug Sep Oct Nov Dec. Nominal Sales Tax SA & TDA Nominal Sales Tax Real SA Sales Tax 37
38 Example: Sales Tax Revenue $15 $14 $13 $12 (Millions) $11 $10 $9 $8 $7 $ Nominal Sales Tax SA & TDA Nominal Sales Tax Real SA Sales Tax 38
39 Which inflation number do you use? Consumer Price Index Personal Consumption Expenditures Price Index p// / / _ nipa.cfm Table GDP deflator Table Data Issues - Inflation 39
40 How do you convert nominal data a into inflation-adjusted data? Base year index: [Nominal data / (price index B / 100)] = Constant Data B Where B is the base year index for the current period. To change the base year: [Nominal data / (price index B / price index N )] = Constant Data N Where B is the base year index for the current period and N is the base year index for the new base year. Data Issues - Inflation 40
41 Nominal GDP Deflator Real GDP Real GDP Year GDP (2009 = 100) (2009 $s) (2013 $s) 2007 $14, $14, $15, $14, $14, $15, $14, $14, $15, $14, $14, $15, $15, $15, $16, $16, $15, $16, $16, $15, $16, [Nominal data / (price index B / 100)] = Constant Data B [14, / (97.3/100)] = 14, Inflation Adjustment Example 41
42 Nominal GDP Deflator Real GDP Real GDP Year GDP (2009 = 100) (2009 $s) (2013 $s) 2007 $14, $14, $15, $14, $14, $15, $14, $14, $15, $14, $14, $15, $15, $15, $16, $16, $15, $16, $16, $15, $16, [Nominal data / (price index B / price index N )] = Constant Data N [14, / (97.3/106.6)] = 15, Inflation Adjustment Example 42
43 The Math 43
44 1. Calculate a month-to-month o o changes 2. Standardize the changes to remove volatility 3. Sum the changes Optional: equalize the leading & lagging index 4. Compute the index using symmetric change 5. Re-base the index The Math 5 Steps 44
45 Step 1: Calculate month-to-month changes If the variable is not already in a percent change form, use a symmetric alternative to the conventional percent change formula. ensures symmetrical treatment of positive and negative changes e.g., when a one percent increase is followed by a one percent decrease, the variable has returned to its original value. Use simple arithmetic differences if the variable is: already in a percent change form is an interest rate contains zero or negative values The Math Step 1 45
46 Data 100 Conventional Percent Change Symmetric Percent Change % + 9.5% % - 9.5% % - 5.1% % 5.3% +51% 5.1% The Math Step 1: Example 46
47 Symmetric percent change: x t = 200 * (X t X t-1 )/(X t + X t-1 ) The Math Step 1 47
48 Step 2: Standardize to remove volatility Compute the standard deviation of the changes of each variable (v x ) Invert each standard deviation (w x = 1/v x ) Sum the inverted standard deviations (k = w x ) Re-state the inverted standard deviations so that they sum to 1 (r x = 1/k * w x ) The adjusted change in each variable is the month-to-month change multiplied by the corresponding component standardization factor (m t = r x * x t ) The Math Step 2 48
49 Var. 1 Chg. Standardized Chg. (M t ) Jan 7.02 v x = 0.11 Feb Mar Apr w x = 1/v x 0.22 May 4.30 = Jun Jul k = w x 0.41 Aug Sep r x = w x /k 0.75 Oct = Nov Dec x.0156 = The Math Step 2: Example 49
50 Step 3: Sum the changes Sum the adjusted d changes for each component (i t = m t ) For the coincident index, no further adjustment For the leading and lagging indexes.... Each it is multiplied by an index standardization factor f f is the ratio of the standard deviation of the percent changes for the coincident index to the standard deviation of the percent changes of the composite indexes. f lead = (v coin /v lead ) f lag = (v coin /v lag ) The Math Step 3 50
51 Var. 1 Var. 2 Var. 3 Var. 4 Sum (i t ) Jan Feb Mar Apr May Jun Jul Aug Sep Oct Nov Dec The Math Step 3: Example 51
52 Step 4: Compute the index using symmetric change Make the first month index value 100 I 1 = 100 Use the symmetric change for the following months I 2 = I 1 * (200 + i 2 )/(200 - i 2 ) I 3 = I 2 * (200 + i 3 )/(200 i 3 ) etc. The Math Step 4 52
53 Sum (i t ) Index Formula: Jan Feb = 100 * {[200 + (-.55)] / [200 (-.55)]} Mar = * {[200 + (.35)] / [200 (.35)]} Apr May Jun Jul Aug Sep Oct Nov Dec The Math Step 4: Example 53
54 Step 5: Re-base the index Take the average of the index for the 12 months of the base year. b y = ( I ty )/12 Divide each I t by b y and then multiply by 100 Re-based Index = I tr I tr = (I t /b y ) * 100 The Math Step 5 54
55 Lunch 55
56 Building an Index 56
57 First, deal with the data a issues: s Seasonality Trading day adjustments Inflation Download the raw data file from: Download the seasonal factors file from: Data Issues 57
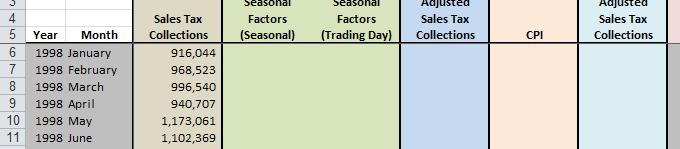
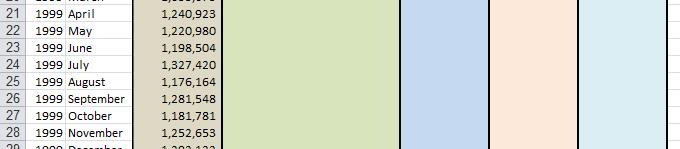
58 Raw Unadjusted Data 58


59 Seasonal & Trading Day Adjustment Import the seasonal factors and the trading day factors into the data file. Seasonal & Trading Factors 59
 Do this for all four variables Seasonally Adjusted Data")
60 Seasonal & Trading Day Adjustment Use the formula to get the adjusted data: Data / (SF * TDF) Do this for all four variables Seasonally Adjusted Data 60


61 Inflation Adjustment Import the CPI data. Inflation 61

 or SAD /")
 Completely")
62 Inflation Adjustment Use the formula to adjust for inflation: SAD / (CPI/100) or SAD / (CPI/CPI average of new base year) Completely Adjusted Data 62


63 Step 1: Calculate month-to-month changes using the symmetric percent change formula: x t = 200 * (X t X t-1 )/(X t + X t-1 ) Do this for all four variables Building an Index Step 1 63


64 w x Step 2: Standardize the changes to remove volatility by computing the inverted standard deviation for each variables symmetrical percent change where: standard deviation is v x then invert so that w x = 1/v x For this exercise, calculate the standard deviation through January 2013 using function. Building an Index Step 2 64
65 k w x r x w x r x w x r x w x r x sum of r x Step 2: Continue to remove volatility by: Sum the inverted standard deviations (k = w x ) Re-state the inverted standard deviations so that they sum to 1 (r x = 1/k * w x ) Building an Index Step 2 65


 Do this for all four variables Building")
66 k Step 2: Continue to remove w x r x volatility by: x t Calculating the adjusted change m t in each variable by multiplying the the month-to-month change by the corresponding component standardization di i factor (m t = r x * x t ) Do this for all four variables Building an Index Step 2 66
67 Break 15 minutes 67
68 i t m t m t m t m t Step 3: Sum the adjusted percent changes (i t = m t ) Building an Index Step 3 68
69 I t Step 4: Compute the index Make the first month index value 100 I 1 = 100 Use the symmetric change for the following months I 2 = I 1 * (200 + i 2 )/(200 - i 2 ) Building an Index Step 4 69
70 b y Itr Step 5: Re-base the index Take the average of the index for the 12 months of the base year. b y = ( I ty )/12 Divide each I t by b y and then multiply by 100 Re-based index = I tr I tr = (I t /b y ) * 100 Building an Index Step 5 70
71 Complete Current Index 71

72 Complete Current Index 72
73 1. Every month, check for recent revisions to the previous months data. 2. Every yy year, check for major benchmark revisions to previous years data. 3. Every year, add 12 more months to the inverted standard deviation calculation. 4. Every two years, update the seasonal and trading day factors. Index Maintenance 73
74 Innovation o Index Small Business Index Entrepreneurship Index Other Types of Indexes 74
75 Alfie Meek, Ph.D. Economic Impact Group, LLC. ( LOCI Fiscal Analysis Model ( Phone: Questions? 75
FOR RELEASE: 10:00 A.M. ET, Thursday, May 20, 2010
 FOR RELEASE: 10:00 A.M. ET, Thursday, May 20, 2010 The Conference Board U.S. Business Cycle Indicators SM THE CONFERENCE BOARD LEADING ECONOMIC INDEX (LEI) FOR THE UNITED STATES AND RELATED COMPOSITE ECONOMIC
The Conference Board U.S. Business Cycle Indicators SM U.S. LEADING ECONOMIC INDICATORS AND RELATED COMPOSITE INDEXES FOR APRIL 2008
 Brussels Copenhagen Frankfurt Hong Kong London Mexico City New Delhi Ottawa New York Chicago San Francisco Washington FOR RELEASE: 10:00 A.M. ET, MONDAY, May 19, 2008 The Conference Board U.S. Business
The Conference Board U.S. Business Cycle Indicators SM U.S. LEADING ECONOMIC INDICATORS AND RELATED COMPOSITE INDEXES FOR MAY 2007
 Brussels Copenhagen Frankfurt Hong Kong London Mexico City New Delhi Ottawa New York Chicago San Francisco Washington FOR RELEASE: 10:00 A.M. ET, THURSDAY, JUNE 21, 2007 The Conference Board U.S. Business
The Conference Board U.S. Business Cycle Indicators SM U.S. LEADING ECONOMIC INDICATORS AND RELATED COMPOSITE INDEXES FOR JANUARY 2008
 Brussels Copenhagen Frankfurt Hong Kong London Mexico City New Delhi Ottawa New York Chicago San Francisco Washington FOR RELEASE: 10:00 A.M. ET, THURSDAY, February 21, 2008 The Conference Board U.S. Business
The Conference Board U.S. Business Cycle Indicators SM U.S. LEADING ECONOMIC INDICATORS AND RELATED COMPOSITE INDEXES FOR NOVEMBER 2007
 Brussels Copenhagen Frankfurt Hong Kong London Mexico City New Delhi Ottawa New York Chicago San Francisco Washington FOR RELEASE: 10:00 A.M. ET, THURSDAY, December 20, 2007 The Conference Board U.S. Business
The Conference Board U.S. Business Cycle Indicators SM U.S. LEADING ECONOMIC INDICATORS AND RELATED COMPOSITE INDEXES FOR JULY 2008
 Brussels Copenhagen Frankfurt Hong Kong London Mexico City New Delhi Ottawa New York Chicago San Francisco Washington FOR RELEASE: 10:00 A.M. ET, Thursday, August 21, 2008 The Conference Board U.S. Business
FOR RELEASE: 10:00 A.M. ET, Friday, December 17, 2010
 FOR RELEASE: 10:00 A.M. ET, Friday, December 17, 2010 The Conference Board U.S. Business Cycle Indicators SM THE CONFERENCE BOARD LEADING ECONOMIC INDEX (LEI) FOR THE UNITED STATES AND RELATED COMPOSITE
FOR RELEASE: 10:00 A.M. ET, Thursday, October 21, 2010
 FOR RELEASE: 10:00 A.M. ET, Thursday, October 21, 2010 The Conference Board U.S. Business Cycle Indicators SM THE CONFERENCE BOARD LEADING ECONOMIC INDEX (LEI) FOR THE UNITED STATES AND RELATED COMPOSITE
For more information, please visit our website at or contact us at
 FOR RELEASE: 9:30 A.M. ET, WEDNESDAY, DECEMBER 17, 2008 The Conference Board France Business Cycle Indicators SM FRANCE LEADING ECONOMIC INDICATORS AND RELATED COMPOSITE INDEXES FOR OCTOBER 2008 Next month's
THE CONFERENCE BOARD LEADING ECONOMIC INDEX (LEI) FOR FRANCE AND RELATED COMPOSITE ECONOMIC INDEXES FOR JANUARY
 FOR FRANCE AND RELATED COMPOSITE ECONOMIC INDEXES FOR JANUARY") FOR RELEASE: 10:00 A.M. CET, TUESDAY, MARCH 17, 2009 The Conference Board France Business Cycle Indicators SM THE CONFERENCE BOARD LEADING ECONOMIC INDEX (LEI) FOR FRANCE AND RELATED COMPOSITE ECONOMIC
FOR RELEASE: 10:00 A.M. CET, TUESDAY, MARCH 17, 2009 The Conference Board France Business Cycle Indicators SM THE CONFERENCE BOARD LEADING ECONOMIC INDEX (LEI) FOR FRANCE AND RELATED COMPOSITE ECONOMIC
THE CONFERENCE BOARD LEADING ECONOMIC INDEX (LEI) FOR FRANCE AND RELATED COMPOSITE ECONOMIC INDEXES FOR FEBRUARY
 FOR FRANCE AND RELATED COMPOSITE ECONOMIC INDEXES FOR FEBRUARY") FOR RELEASE: 10:00 A.M. CET, WEDNESDAY, APRIL 22, 2009 The Conference Board France Business Cycle Indicators SM THE CONFERENCE BOARD LEADING ECONOMIC INDEX (LEI) FOR FRANCE AND RELATED COMPOSITE ECONOMIC
FOR RELEASE: 10:00 A.M. CET, WEDNESDAY, APRIL 22, 2009 The Conference Board France Business Cycle Indicators SM THE CONFERENCE BOARD LEADING ECONOMIC INDEX (LEI) FOR FRANCE AND RELATED COMPOSITE ECONOMIC
CBER Indexes for Nevada and Southern Nevada
 CBER Indexes for Nevada and Southern Nevada Published June 23, 2017 Stephen M. Miller, PhD, Director Nicolas Prada, Graduate Research Assistant Summary of CBER s Nevada Indexes Coincident Index (March)
The next release is scheduled for April 20, 2017, Thursday at 10 A.M. ET. FOR RELEASE: 10:00 A.M. ET, Friday, March 17, 2017
 FOR RELEASE: 10:00 A.M. ET, Friday, March 17, 2017 The Conference Board U.S. Business Cycle Indicators SM THE CONFERENCE BOARD LEADING ECONOMIC INDEX (LEI) FOR THE UNITED STATES AND RELATED COMPOSITE ECONOMIC
Leading Economic Indicator Nebraska
 Nebraska Monthly Economic Indicators: December 20, 2017 Prepared by the UNL College of Business Administration, Bureau of Business Research Author: Dr. Eric Thompson Leading Economic Indicator...1 Coincident
Figure 1: Change in LEI-N August 2018
 Nebraska Monthly Economic Indicators: September 26, 2018 Prepared by the UNL College of Business, Bureau of Business Research Author: Dr. Eric Thompson Leading Economic Indicator...1 Coincident Economic
THE CONFERENCE BOARD LEADING ECONOMIC INDEX (LEI) FOR FRANCE AND RELATED COMPOSITE ECONOMIC INDEXES FOR MAY
 FOR FRANCE AND RELATED COMPOSITE ECONOMIC INDEXES FOR MAY") FOR RELEASE: 10:00 A.M. (PARIS TIME), MONDAY, JULY 19, 2010 The Conference Board France Business Cycle Indicators SM THE CONFERENCE BOARD LEADING ECONOMIC INDEX (LEI) FOR FRANCE AND RELATED COMPOSITE ECONOMIC
FOR RELEASE: 10:00 A.M. (PARIS TIME), MONDAY, JULY 19, 2010 The Conference Board France Business Cycle Indicators SM THE CONFERENCE BOARD LEADING ECONOMIC INDEX (LEI) FOR FRANCE AND RELATED COMPOSITE ECONOMIC
CBER Indexes for Nevada and Southern Nevada
 CBER Indexes for Nevada and Southern Nevada Published March 24, 2016 Stephen M. Miller, PhD, Director Jinju Lee, Economic Analyst Summary of CBER s Nevada Indexes Coincident Index Leading Index Mo. to
The next release is scheduled for January 25, 2018, Thursday at 10 A.M. ET. FOR RELEASE: 10:00 A.M. ET, Thursday, December 21, 2017
 FOR RELEASE: 10:00 A.M. ET, Thursday, December 21, 2017 The Conference Board U.S. Business Cycle Indicators SM THE CONFERENCE BOARD LEADING ECONOMIC INDEX (LEI) FOR THE UNITED STATES AND RELATED COMPOSITE
The next release is scheduled for July 21, 2016, Thursday at 10 A.M. ET. FOR RELEASE: 10:00 A.M. ET, Thursday, June 23, 2016
 FOR RELEASE: 10:00 A.M. ET, Thursday, June 23, 2016 The Conference Board U.S. Business Cycle Indicators SM THE CONFERENCE BOARD LEADING ECONOMIC INDEX (LEI) FOR THE UNITED STATES AND RELATED COMPOSITE
The next release is scheduled for December 21, 2017, Thursday at 10 A.M. ET. FOR RELEASE: 10:00 A.M. ET, Monday, November 20, 2017
 FOR RELEASE: 10:00 A.M. ET, Monday, November 20, 2017 The Conference Board U.S. Business Cycle Indicators SM THE CONFERENCE BOARD LEADING ECONOMIC INDEX (LEI) FOR THE UNITED STATES AND RELATED COMPOSITE
CBER Economic Indexes for Nevada and Southern Nevada
 CBER Economic Indexes for Nevada and Southern Nevada Published December 19, 2017 Stephen M. Miller, PhD, Director Nicolas Prada, M.A., Graduate Research Assistant Summary of CBER s Nevada Indexes Coincident
The next release is scheduled for April 18, 2019, Thursday at 10 A.M. ET. FOR RELEASE: 10:00 A.M. ET, Thursday, March 21, 2019
 FOR RELEASE: 10:00 A.M. ET, Thursday, March 21, 2019 The Conference Board U.S. Business Cycle Indicators SM THE CONFERENCE BOARD LEADING ECONOMIC INDEX (LEI) FOR THE UNITED STATES AND RELATED COMPOSITE
The next release is scheduled for February 21, 2019, Thursday at 10 A.M. ET. FOR RELEASE: 10:00 A.M. ET, Thursday, January 24, 2019
 FOR RELEASE: 10:00 A.M. ET, Thursday, January 24, 2019 The Conference Board U.S. Business Cycle Indicators SM THE CONFERENCE BOARD LEADING ECONOMIC INDEX (LEI) FOR THE UNITED STATES AND RELATED COMPOSITE
The next release is scheduled for July 20, 2017, Thursday at 10 A.M. ET. FOR RELEASE: 10:00 A.M. ET, Thursday, June 22, 2017
 FOR RELEASE: 10:00 A.M. ET, Thursday, June 22, 2017 The Conference Board U.S. Business Cycle Indicators SM THE CONFERENCE BOARD LEADING ECONOMIC INDEX (LEI) FOR THE UNITED STATES AND RELATED COMPOSITE
The next release is scheduled for January 24, 2019, Thursday at 10 A.M. ET. FOR RELEASE: 10:00 A.M. ET, Thursday, December 20, 2018
 FOR RELEASE: 10:00 A.M. ET, Thursday, December 20, 2018 The Conference Board U.S. Business Cycle Indicators SM THE CONFERENCE BOARD LEADING ECONOMIC INDEX (LEI) FOR THE UNITED STATES AND RELATED COMPOSITE
The next release is scheduled for March 17, 2017, Friday at 10 A.M. ET. FOR RELEASE: 10:00 A.M. ET, Friday, February 17, 2017
 FOR RELEASE: 10:00 A.M. ET, Friday, February 17, 2017 The Conference Board U.S. Business Cycle Indicators SM THE CONFERENCE BOARD LEADING ECONOMIC INDEX (LEI) FOR THE UNITED STATES AND RELATED COMPOSITE
Leading Economic Indicator Nebraska
 Nebraska Monthly Economic Indicators: September 20, 2017 Prepared by the UNL College of Business Administration, Bureau of Business Research Author: Dr. Eric Thompson Leading Economic Indicator...1 Coincident
FOR RELEASE: 10:00 A.M. AEST, THURSDAY, APRIL 30, 2009
 FOR RELEASE: 10:00 A.M. AEST, THURSDAY, APRIL 30, 2009 The Conference Board Australia Business Cycle Indicators SM THE CONFERENCE BOARD LEADING ECONOMIC INDEX (LEI) FOR AUSTRALIA AND RELATED COMPOSITE
The Conference Board Australia Business Cycle Indicators SM AUSTRALIA LEADING ECONOMIC INDICATORS AND RELATED COMPOSITE INDEXES FOR MAY 2006
 Brussels Copenhagen Frankfurt Hong Kong London Mexico City New Delhi Ottawa New York Chicago San Francisco Washington FOR RELEASE: 8:00 P.M. ET, TUESDAY, JULY 25, 2006 The Conference Board Australia Business
FOR RELEASE: 10:00 A.M. (PARIS TIME), MONDAY, DECEMBER 19, 2011
, MONDAY, DECEMBER 19, 2011") FOR RELEASE: 10:00 A.M. (PARIS TIME), MONDAY, DECEMBER 19, 2011 The Conference Board France Business Cycle Indicators SM THE CONFERENCE BOARD LEADING ECONOMIC INDEX (LEI) FOR FRANCE AND RELATED COMPOSITE
FOR RELEASE: 10:00 A.M. (PARIS TIME), MONDAY, DECEMBER 19, 2011 The Conference Board France Business Cycle Indicators SM THE CONFERENCE BOARD LEADING ECONOMIC INDEX (LEI) FOR FRANCE AND RELATED COMPOSITE
FOR RELEASE: 10:00 A.M. ET, Thursday, February 21, 2019
 FOR RELEASE: 10:00 A.M. ET, Thursday, February 21, 2019 The Conference Board U.S. Business Cycle Indicators SM THE CONFERENCE BOARD LEADING ECONOMIC INDEX (LEI) FOR THE UNITED STATES AND RELATED COMPOSITE
Leading Economic Indicator Nebraska
 Nebraska Monthly Economic Indicators: July 29, 2016 Prepared by the UNL College of Business Administration, Department of Economics Authors: Dr. Eric Thompson, Dr. William Walstad Leading Economic Indicator...1
CBER Economic Indexes for Nevada and Southern Nevada
 CBER Economic Indexes for Nevada and Southern Nevada Published November 14, 2018 Stephen M. Miller, PhD, Director Hasara Rathnasekara, Graduate Research Assistant Summary of CBER s Nevada Indexes Coincident
The Conference Board Korea Business Cycle Indicators SM KOREA LEADING ECONOMIC INDICATORS AND RELATED COMPOSITE INDEXES FOR JULY 2005
 Brussels Copenhagen Frankfurt Hong Kong London Mexico City New Delhi Ottawa New York Chicago San Francisco Washington FOR RELEASE: 9:00 P.M. ET, TUESDAY, SEPTEMBER 13, 2005 The Conference Board Korea Business
Leading Economic Indicator Nebraska
 Nebraska Monthly Economic Indicators: June 17, 2016 Prepared by the UNL College of Business Administration, Department of Economics Authors: Dr. Eric Thompson, Dr. William Walstad Leading Economic Indicator...1
The Conference Board Australia Business Cycle Indicators SM AUSTRALIA LEADING ECONOMIC INDICATORS AND RELATED COMPOSITE INDEXES FOR SEPTEMBER 2008
 FOR RELEASE: 6:00 P.M. ET, MONDAY, NOVEMBER 24, 2008 The Conference Board Australia Business Cycle Indicators SM AUSTRALIA LEADING ECONOMIC INDICATORS AND RELATED COMPOSITE INDEXES FOR SEPTEMBER 2008 The
For more information, please visit our website at or contact us at
 FOR RELEASE: 10:00 A.M. AEST, FRIDAY, JANUARY 29, 2010 The Conference Board Australia Business Cycle Indicators SM THE CONFERENCE BOARD LEADING ECONOMIC INDEX (LEI) FOR AUSTRALIA AND RELATED COMPOSITE
The Role of Composite Indexes in Tracking the Business Cycle
 Trusted Insights for Business Worldwide The Role of Composite Indexes in Tracking the Business Cycle INTERNATIONAL SEMINAR ON EARLY WARNING AND BUSINESS CYCLE INDICATORS 14 December 29, Scheveningen, The
XML Publisher Balance Sheet Vision Operations (USA) Feb-02
 Feb-02") Page:1 Apr-01 May-01 Jun-01 Jul-01 ASSETS Current Assets Cash and Short Term Investments 15,862,304 51,998,607 9,198,226 Accounts Receivable - Net of Allowance 2,560,786
Page:1 Apr-01 May-01 Jun-01 Jul-01 ASSETS Current Assets Cash and Short Term Investments 15,862,304 51,998,607 9,198,226 Accounts Receivable - Net of Allowance 2,560,786
Leading Economic Indicator Nebraska
 Nebraska Monthly Economic Indicators: August 19, 2016 Prepared by the UNL College of Business Administration, Department of Economics Authors: Dr. Eric Thompson, Dr. William Walstad Leading Economic Indicator...1
FOR RELEASE: 10:00 A.M. AEST, TUESDAY, JULY 28, 2009
 FOR RELEASE: 10:00 A.M. AEST, TUESDAY, JULY 28, 2009 The Conference Board Australia Business Cycle Indicators SM THE CONFERENCE BOARD LEADING ECONOMIC INDEX (LEI) FOR AUSTRALIA AND RELATED COMPOSITE ECONOMIC
The next release is scheduled for July 19, 2018, Thursday at 10 A.M. ET. FOR RELEASE: 10:00 A.M. ET, Thursday, June 21, 2018
 FOR RELEASE: 10:00 A.M. ET, Thursday, June 21, 2018 The Conference Board U.S. Business Cycle Indicators SM THE CONFERENCE BOARD LEADING ECONOMIC INDEX (LEI) FOR THE UNITED STATES AND RELATED COMPOSITE
The next release is scheduled for Monday, July 13, 2009 at 10:00 A.M. (CET) In the U.S. July 13, 2009 at 4:00 A.M. (ET)
 In the U.S. July 13, 2009 at 4:00 A.M. (ET)") FOR RELEASE: 10:00 A.M. CET, WEDNESDAY, JUNE 17, 2009 The Conference Board Spain Business Cycle Indicators SM THE CONFERENCE BOARD LEADING ECONOMIC INDEX TM (LEI) FOR SPAIN AND RELATED COMPOSITE INDEXES
FOR RELEASE: 10:00 A.M. CET, WEDNESDAY, JUNE 17, 2009 The Conference Board Spain Business Cycle Indicators SM THE CONFERENCE BOARD LEADING ECONOMIC INDEX TM (LEI) FOR SPAIN AND RELATED COMPOSITE INDEXES
Leading Economic Indicator Nebraska
 Nebraska Monthly Economic Indicators: June 21, 2017 Prepared by the UNL College of Business Administration, Bureau of Business Research Author: Dr. Eric Thompson Leading Economic Indicator...1 Coincident
Leading Economic Indicator Nebraska
 Jan 12 Feb 12 Mar 12 Apr 12 May 12 Jun 12 Jul 12 Nebraska Monthly Economic Indicators: February 17, 2012 Prepared by the UNL College of Business Administration, Department of Economics Authors: Dr. Eric
Leading Economic Indicator Nebraska
 Nebraska Monthly Economic Indicators: July 24, 2015 Prepared by the UNL College of Business Administration, Department of Economics Authors: Dr. Eric Thompson, Dr. William Walstad Leading Economic Indicator...1
Leading Economic Indicator Nebraska
 Nebraska Monthly Economic Indicators: January 17, 2014 Prepared by the UNL College of Business Administration, Department of Economics Authors: Dr. Eric Thompson, Dr. William Walstad Graduate Research
Leading Economic Indicator Nebraska
 Nebraska Monthly Economic Indicators: October 24, 2018 Prepared by the UNL College of Business, Bureau of Business Research Author: Dr. Eric Thompson Leading Economic Indicator...1 Coincident Economic
Decline in Economic Activity Larger Than Advance GDP Estimate February 27, 2009
 Northern Trust Global Economic Research 5 South LaSalle Chicago, Illinois 663 northerntrust.com Asha G. Bangalore agb3@ntrs.com Decline in Economic Activity Larger Than Advance GDP Estimate February 27,
Consumer confidence and economic climate indicators continue to increase
 %/3mma Business and Consumer Surveys July 2017 28 July 2017 Consumer confidence and economic climate indicators continue to increase The Consumer confidence indicator increased in July, resuming the positive
CBER Economic Indexes for Nevada and Southern Nevada
 CBER Economic Indexes for Nevada and Southern Nevada Published February 9, 2018 Stephen M. Miller, PhD, Director Marshall Krakauer, Graduate Research Assistant Summary of CBER s Nevada Indexes Coincident
Consumer confidence and economic climate indicators increase
 %/3mma Business and Consumer Surveys March 2017 March, 30 th 2017 Consumer confidence and economic climate indicators increase The Consumer confidence indicator increased between September and March, resuming
The Federal Reserve has set the target range for the federal
 NationalEconomicTrends October Monetary Policy Stance: The View from Consumption Spending The Federal Reserve has set the target range for the federal funds at to 5 percent and intends to keep this near
FOR RELEASE: 10:00 A.M. (MADRID TIME), TUESDAY, DECEMBER 15, 2009
, TUESDAY, DECEMBER 15, 2009") FOR RELEASE: 10:00 A.M. (MADRID TIME), TUESDAY, DECEMBER 15, 2009 The Conference Board Spain Business Cycle Indicators SM THE CONFERENCE BOARD LEADING ECONOMIC INDEX TM (LEI) FOR SPAIN AND RELATED COMPOSITE
FOR RELEASE: 10:00 A.M. (MADRID TIME), TUESDAY, DECEMBER 15, 2009 The Conference Board Spain Business Cycle Indicators SM THE CONFERENCE BOARD LEADING ECONOMIC INDEX TM (LEI) FOR SPAIN AND RELATED COMPOSITE
The next release is scheduled for Thursday, March 26, 2009 at 10:00 A.M. (CET) In New York Thursday, March 26, 2009 at 5:00 A.M.
 In New York Thursday, March 26, 2009 at 5:00 A.M.") FOR RELEASE: 10:00 A.M. CET, THURSDAY, FEBRUARY 26, 2009 The Conference Board Euro Area Business Cycle Indicators SM THE CONFERENCE BOARD LEADING ECONOMIC INDEX TM (LEI) FOR THE EURO AREA AND RELATED COMPOSITE
FOR RELEASE: 10:00 A.M. CET, THURSDAY, FEBRUARY 26, 2009 The Conference Board Euro Area Business Cycle Indicators SM THE CONFERENCE BOARD LEADING ECONOMIC INDEX TM (LEI) FOR THE EURO AREA AND RELATED COMPOSITE
For more information, please visit our website at or contact
 FOR RELEASE: 10:00 A.M. KST, FRIDAY, DECEMBER 10, 2010 The Conference Board Korea Business Cycle Indicators SM THE CONFERENCE BOARD LEADING ECONOMIC INDEX (LEI) FOR KOREA AND RELATED COMPOSITE ECONOMIC
THE CONFERENCE BOARD LEADING ECONOMIC INDEX (LEI) FOR THE EURO AREA AND RELATED COMPOSITE ECONOMIC INDEXES FOR JUNE
 FOR THE EURO AREA AND RELATED COMPOSITE ECONOMIC INDEXES FOR JUNE") FOR RELEASE: 10:00 A.M. (BRUSSELS TIME), MONDAY, JULY 26, 2010 The Conference Board Euro Area Business Cycle Indicators SM THE CONFERENCE BOARD LEADING ECONOMIC INDEX (LEI) FOR THE EURO AREA AND RELATED
FOR RELEASE: 10:00 A.M. (BRUSSELS TIME), MONDAY, JULY 26, 2010 The Conference Board Euro Area Business Cycle Indicators SM THE CONFERENCE BOARD LEADING ECONOMIC INDEX (LEI) FOR THE EURO AREA AND RELATED
FOR RELEASE: 10:00 A.M. AEST, THURSDAY, AUGUST 26, 2010
 FOR RELEASE: 10:00 A.M. AEST, THURSDAY, AUGUST 26, 2010 The Conference Board Australia Business Cycle Indicators SM THE CONFERENCE BOARD LEADING ECONOMIC INDEX (LEI) FOR AUSTRALIA AND RELATED COMPOSITE
Nonfarm Payroll Employment
 PRESIDENT'S REPORT TO THE BOARD OF DIRECTORS, FEDERAL RESERVE BANK OF BOSTON Current Economic Developments - June 10, 2004 Data released since your last Directors' meeting show the economy continues to
MOST RECENT 3-MO. trend TYPICAL range EXTREME range. Typical Typical. Typical Typical
 CURRENT AS OF JUNE 29, 2018 Economic indicators dashboard MOST RECENT 3-MO. trend TYPICAL range EXTREME range Market Volatility (CBOE VIX) SEE HISTORICAL DETAILS 4 10 Yr. U.S. Treasury Yield SEE HISTORICAL
FOR RELEASE: 10:00 A.M. (LONDON TIME), THURSDAY, SEPTEMBER 10, 2009
, THURSDAY, SEPTEMBER 10, 2009") FOR RELEASE: 10:00 A.M. (LONDON TIME), THURSDAY, SEPTEMBER 10, 2009 The Conference Board The U.K. Business Cycle Indicators SM THE CONFERENCE BOARD LEADING ECONOMIC INDEX (LEI) FOR THE UNITED KINGDOM AND
FOR RELEASE: 10:00 A.M. (LONDON TIME), THURSDAY, SEPTEMBER 10, 2009 The Conference Board The U.K. Business Cycle Indicators SM THE CONFERENCE BOARD LEADING ECONOMIC INDEX (LEI) FOR THE UNITED KINGDOM AND
FOR RELEASE: 10:00 A.M. KST, WEDNESDAY, JUNE 17, 2009
 FOR RELEASE: 10:00 A.M. KST, WEDNESDAY, JUNE 17, 2009 The Conference Board Korea Business Cycle Indicators SM THE CONFERENCE BOARD LEADING ECONOMIC INDEX (LEI) FOR KOREA AND RELATED COMPOSITE ECONOMIC
FOR RELEASE: 10:00 A.M. (BRUSSELS TIME), MONDAY, SEPTEMBER 27, 2010
, MONDAY, SEPTEMBER 27, 2010") FOR RELEASE: 10:00 A.M. (BRUSSELS TIME), MONDAY, SEPTEMBER 27, 2010 The Conference Board Euro Area Business Cycle Indicators SM THE CONFERENCE BOARD LEADING ECONOMIC INDEX (LEI) FOR THE EURO AREA AND RELATED
FOR RELEASE: 10:00 A.M. (BRUSSELS TIME), MONDAY, SEPTEMBER 27, 2010 The Conference Board Euro Area Business Cycle Indicators SM THE CONFERENCE BOARD LEADING ECONOMIC INDEX (LEI) FOR THE EURO AREA AND RELATED
Leading Economic Indicator Nebraska
 Nebraska Monthly Economic Indicators: August 15, 2014 Prepared by the UNL College of Business Administration, Department of Economics Authors: Dr. Eric Thompson, Dr. William Walstad Graduate Research Assistants:
NationalEconomicTrends
 NationalEconomicTrends August 1999 Historical CPI Inflation Under Current Calculation Methods During the 1990s, a much-discussed topic among policymakers and in financial markets has been the possibility
The next release is scheduled for Monday, November 23, 2009 at 11:00 A.M. (ET) In Mexico Monday, November 23, 2009 at 10:00 A.M.
 In Mexico Monday, November 23, 2009 at 10:00 A.M.") FOR RELEASE: 10:00 A.M. (CST), THURSDAY, OCTOBER 29, 2009 The Conference Board Mexico Business Cycle Indicators SM THE CONFERENCE BOARD LEADING ECONOMIC INDEX (LEI) FOR MEXICO AND RELATED COMPOSITE ECONOMIC
FOR RELEASE: 10:00 A.M. (CST), THURSDAY, OCTOBER 29, 2009 The Conference Board Mexico Business Cycle Indicators SM THE CONFERENCE BOARD LEADING ECONOMIC INDEX (LEI) FOR MEXICO AND RELATED COMPOSITE ECONOMIC
HANDBOOK OF CYCLICAL INDICATORS
 HANDBOOK OF CYCLICAL INDICATORS A Supplement To The Business Conditions Digest BUREAU OF ECONOMIC ANALYSIS George Jaszi, Director Allan H. Young, Deputy Director Beatrice N. Vaccara, Associate Director
FOR RELEASE: 10:00 A.M. KOR, WEDNESDAY, MARCH 11, 2009
 FOR RELEASE: 10:00 A.M. KOR, WEDNESDAY, MARCH 11, 2009 The Conference Board Korea Business Cycle Indicators SM THE CONFERENCE BOARD LEADING ECONOMIC INDEX (LEI) FOR KOREA AND RELATED COMPOSITE ECONOMIC
Looking at a Variety of Municipal Valuation Metrics
 Looking at a Variety of Municipal Valuation Metrics Muni vs. Treasuries, Corporates YEAR MUNI - TREASURY RATIO YEAR MUNI - CORPORATE RATIO 200% 80% 175% 150% 75% 70% 65% 125% Average Ratio 0% 75% 50% 60%
Business Cycle Index July 2010
 Business Cycle Index July 2010 Bureau of Trade and Economic Indices, Ministry of Commerce, Tel. 0 2507 5805, Fax. 0 2507 5806, www.price.moc.go.th Thailand economic still expansion. Medium-run Leading
ctrends Nominal Vs. Real Wage Growth Growth of Wages Percent Change From Year Ago August 1997
 ctrends August 1997 Nominal Vs. Real Wage Growth Nominal wages, measured by nonfarm compensation per hour, grew at an average annual rate of 5.5 percent between 1947 and 1973 and 6 percent between 1973
Lafayette. September: Economic Performance Index. Third Quarter Highlight. For 20 consecutive months, the EPI has been lower than the
 Lafayette Economic Performance Index Third Quarter 2016 September: 99.97 The Lafayette Economic Performance Index (EPI) tracks the pulse of the local economy. Like any index, it combines multiple data
The relatively slow growth of employment has
 NationalEconomicTrends August Please go to researchstlouisfedorg/publications/net for important information about your subscription Labor s Share The relatively slow growth of employment has been a prominent
Power Accountants Association Annual Meeting Potential Impacts from Oct 2015 Rate Change
 Power Accountants Association Annual Meeting Potential Impacts from Oct 2015 Rate Change Material Provided by: Chris Mitchell Chris Mitchell Management Consultants (CMMC) mail@chrismitchellmc.com 5/14/2015
Economic Activity Index ( GDB-EAI ) For the month of May 2013 G O V E R N M E N T D E V E L O P M E N T B A N K F O R P U E R T O R I C O
 For the month of May 2013 G O V E R N M E N T D E V E L O P M E N T B A N K F O R P U E R T O R I C O") Economic Activity Index ( GDB-EAI ) For the month of May 2013 General Commentary May 2013 GDB-EAI for the month of May registered a 3.4% year-over-year ( YOY ) reduction May 2013 EAI was 126.7, a 3.4%
Economic Activity Index ( GDB-EAI ) For the month of May 2013 General Commentary May 2013 GDB-EAI for the month of May registered a 3.4% year-over-year ( YOY ) reduction May 2013 EAI was 126.7, a 3.4%
CORRECTED RELEASE: 10:00 A.M. (BEIJING TIME), TUESDAY, JUNE 29, 2010
, TUESDAY, JUNE 29, 2010") CORRECTED RELEASE: 10:00 A.M. (BEIJING TIME), TUESDAY, JUNE 29, 2010 The Conference Board China Business Cycle Indicators SM THE CONFERENCE BOARD LEADING ECONOMIC INDEX (LEI) FOR CHINA AND RELATED COMPOSITE
CORRECTED RELEASE: 10:00 A.M. (BEIJING TIME), TUESDAY, JUNE 29, 2010 The Conference Board China Business Cycle Indicators SM THE CONFERENCE BOARD LEADING ECONOMIC INDEX (LEI) FOR CHINA AND RELATED COMPOSITE
NationalEconomicTrends
 NationalEconomicTrends August 001 The Switch to NAICS Measuring economic activity when the composition and quality of goods and services being produced is rapidly changing presents a perpetual challenge.
Economic Indicators For Manufacturing Executives
 Economic Indicators For Manufacturing Executives Valuable Data for a Complex World Presented by: Cliff Waldman Chief Economist, MAPI Foundation cwaldman@mapi.net Today s Presentation The Value of Economic
On October 4, 2006, President Bush signed the
 NationalEconomicTrends December Political Economy of State Homeland Security Grants On October,, President Bush signed the Department of Homeland Security (DHS) Appro pri - ations Act for fiscal year 7
NationalEconomicTrends
 NationalEconomicTrends January 00 Stag-nations Economic growth in the United States has slowed substantially since the days of rapid expansion during the mid to late 1990s. According to preliminary estimates,
With the tax filing season in full swing, these summary
 NationalEconomicTrends March Income Taxes: Who Pays and How Much? With the tax filing season in full swing, these summary figures may provide some perspective on the issue of who is paying federal individual
The chorus from Travis s 1947 song about the
 NationalEconomicTrends December 7 What Do You Get for Sixteen Tons? You load sixteen tons, and what do you get? Another day older and deeper in debt Merle Travis The chorus from Travis s 197 song about
December Employment Report: Further Deterioration of Labor Market Conditions January 9, 2009
 Northern Trust Global Economic Research 50 South LaSalle Chicago, Illinois 60603 northerntrust.com Asha G. Bangalore agb3@ntrs.com December Employment Report: Further Deterioration of Labor Market Conditions
FOR RELEASE: 10:00 A.M. (MUMBAI TIME), NOVEMBER 24, 2015
, NOVEMBER 24, 2015") FOR RELEASE: 10:00 A.M. (MUMBAI TIME), NOVEMBER 24, 2015 The Conference Board India Business Cycle Indicators SM THE CONFERENCE BOARD LEADING ECONOMIC INDEX (LEI) FOR INDIA AND RELATED COMPOSITE ECONOMIC
FOR RELEASE: 10:00 A.M. (MUMBAI TIME), NOVEMBER 24, 2015 The Conference Board India Business Cycle Indicators SM THE CONFERENCE BOARD LEADING ECONOMIC INDEX (LEI) FOR INDIA AND RELATED COMPOSITE ECONOMIC
NationalEconomicTrends
 NationalEconomicTrends January 000 The Economic Outlook for 000: Bulls on Parade? The heartening U.S. economic performance during the past four years has seemingly benefited everyone except those in the
 Robert D. Cruz, PhD, Chief Economist Miami-Dade County 305-375-1879 cruzr1@miamidade.gov www.miamidade.gov/economicdevelopment Department of Regulatory and Economic Resources Page 1 Local economic indicators
For more information, please visit our website at or contact us at
 FOR RELEASE: 10:00 A.M. JST, WEDNESDAY, JANUARY 13, 2010 The Conference Board Japan Business Cycle Indicators SM THE CONFERENCE BOARD LEADING ECONOMIC INDEX TM (LEI) FOR JAPAN AND RELATED COMPOSITE ECONOMIC
The Conference Board Japan Business Cycle Indicators SM JAPAN LEADING ECONOMIC INDICATORS AND RELATED COMPOSITE INDEXES FOR APRIL 2005
 Brussels Copenhagen Frankfurt Hong Kong London Mexico City New Delhi Ottawa New York Chicago San Francisco Washington FOR RELEASE: 9:00 P.M. ET, THURSDAY, JUNE 9, 2005 The Conference Board Japan Business
FOR RELEASE: 10:00 A.M. (BERLIN TIME), WEDNESDAY, NOVEMBER 18, 2009
, WEDNESDAY, NOVEMBER 18, 2009") FOR RELEASE: 10:00 A.M. (BERLIN TIME), WEDNESDAY, NOVEMBER 18, 2009 The Conference Board Germany Business Cycle Indicators SM THE CONFERENCE BOARD LEADING ECONOMIC INDEX TM (LEI) FOR GERMANY AND RELATED
FOR RELEASE: 10:00 A.M. (BERLIN TIME), WEDNESDAY, NOVEMBER 18, 2009 The Conference Board Germany Business Cycle Indicators SM THE CONFERENCE BOARD LEADING ECONOMIC INDEX TM (LEI) FOR GERMANY AND RELATED
THE CONFERENCE BOARD LEADING ECONOMIC INDEX (LEI) FOR GERMANY AND RELATED COMPOSITE ECONOMIC INDEXES FOR FEBRUARY
 FOR GERMANY AND RELATED COMPOSITE ECONOMIC INDEXES FOR FEBRUARY") FOR RELEASE: 10:00 A.M. (BERLIN TIME), THURSDAY, APRIL 22, 2010 The Conference Board Germany Business Cycle Indicators SM THE CONFERENCE BOARD LEADING ECONOMIC INDEX (LEI) FOR GERMANY AND RELATED COMPOSITE
FOR RELEASE: 10:00 A.M. (BERLIN TIME), THURSDAY, APRIL 22, 2010 The Conference Board Germany Business Cycle Indicators SM THE CONFERENCE BOARD LEADING ECONOMIC INDEX (LEI) FOR GERMANY AND RELATED COMPOSITE
There has been considerable discussion of the possibility
 NationalEconomicTrends February Housing and the R Word There has been considerable discussion of the possibility that ongoing troubles in the housing market could push the economy into recession 1 But
Factor Leave Accruals. Accruing Vacation and Sick Leave
 Factor Leave Accruals Accruing Vacation and Sick Leave Factor Leave Accruals As part of the transition of non-exempt employees to biweekly pay, the UC Office of the President also requires standardization
Revised October 17, 2016
 Revised October 17, 2016 60 ISM Manufacturing Purchasing Managers Index (September 2015 September 2016) 58 56 54 52 50 48 46 44 42 Sept-15 Oct Nov Dec Jan-16 Feb Mar Apr May Jun Jul Aug Sept Purchasing
Composite Coincident and Leading Economic Indexes
 Composite Coincident and Leading Economic Indexes This article presents the method of construction of the Coincident Economic Index (CEI) and Leading Economic Index (LEI) and the use of the indices as
REAL EARNINGS DECEMBER 2018
 Transmission of material in this release is embargoed until 8:30 a.m. (EST), Friday, January 11, 2019 USDL-19-0019 Technical Information: (202) 691-6555 cesinfo@bls.gov www.bls.gov/ces Media Contact: (202)
Camarines Sur Consumer Price Index
 Inflation Rates (in Percent) Camarines Sur Consumer Price Index SR No. - 50 JULY Inflation rate in Camarines Sur increases to 6.4 percent in April The provincial headline inflation rate in Camarines Sur
SmallBizU WORKSHEET 1: REQUIRED START-UP FUNDS. Online elearning Classroom. Item Required Amount ($) Fixed Assets. 1 -Buildings $ 2 -Land $
 Fixed Assets. 1 -Buildings $ 2 -Land $") WORKSHEET 1: REQUIRED START-UP FUNDS Item Required Amount () Fixed Assets 1 -Buildings 2 -Land 3 -Initial Inventory 4 -Equipment 5 -Furniture and Fixtures 6 -Vehicles 7 Total Fixed Assets Working Capital
WORKSHEET 1: REQUIRED START-UP FUNDS Item Required Amount () Fixed Assets 1 -Buildings 2 -Land 3 -Initial Inventory 4 -Equipment 5 -Furniture and Fixtures 6 -Vehicles 7 Total Fixed Assets Working Capital
REAL EARNINGS AUGUST 2018
 Transmission of material in this release is embargoed until 8:30 a.m. (EDT), Thursday, September 13, 2018 USDL-18-1454 Technical Information: (202) 691-6555 cesinfo@bls.gov www.bls.gov/ces Media Contact:
FOR RELEASE: 10:00 A.M. (BEIJING TIME), NOVEMBER 20, 2015
, NOVEMBER 20, 2015") FOR RELEASE: 10:00 A.M. (BEIJING TIME), NOVEMBER 20, 2015 The Conference Board China Business Cycle Indicators SM THE CONFERENCE BOARD LEADING ECONOMIC INDEX (LEI) FOR CHINA AND RELATED COMPOSITE ECONOMIC
FOR RELEASE: 10:00 A.M. (BEIJING TIME), NOVEMBER 20, 2015 The Conference Board China Business Cycle Indicators SM THE CONFERENCE BOARD LEADING ECONOMIC INDEX (LEI) FOR CHINA AND RELATED COMPOSITE ECONOMIC
THE CONFERENCE BOARD LEADING ECONOMIC INDEX (LEI) FOR GERMANY AND RELATED COMPOSITE ECONOMIC INDEXES FOR JANUARY
 FOR GERMANY AND RELATED COMPOSITE ECONOMIC INDEXES FOR JANUARY") FOR RELEASE: 10:00 A.M. (BERLIN TIME), WEDNESDAY, MARCH 24, 2010 The Conference Board Germany Business Cycle Indicators SM THE CONFERENCE BOARD LEADING ECONOMIC INDEX (LEI) FOR GERMANY AND RELATED COMPOSITE
FOR RELEASE: 10:00 A.M. (BERLIN TIME), WEDNESDAY, MARCH 24, 2010 The Conference Board Germany Business Cycle Indicators SM THE CONFERENCE BOARD LEADING ECONOMIC INDEX (LEI) FOR GERMANY AND RELATED COMPOSITE