Measures of Location and Variability
|
|
|
- Ernest Sutton
- 5 years ago
- Views:
Transcription
1 Measures of Locatio ad Variability Sprig, 2009
2 Skill set: You should kow the defiitios of the major measures of locatio (mea, media, mode, geometric mea) ad variability (stadard deviatio, variace, stadard error of the mea, skewess ad kurtosis). You should kow: Set of Observatios Descriptive Statistic x i xi + c cx i Mea x x + c cx Variace s 2 s 2 cs Stadard deviatio s s cs c Meas the absolute value of c. You should be able to use Stata to graph histograms ad box plots. You should kow how to use the help meu.
3 Outlie Scales of measuremet Page 1 Measures of Locatio Mea Page 2 Media Page 7 Mode Page 9 Geometric Mea Page 10 Properties of Meas Page 15 Stata commads used: Dropdow meus Page 25 log usig describe (des) summarize (sum) geerate (ge) codebook label display (di) list ameas Measures of spread or variability Rage Page 30 Percetiles Page 30 Iterquartile rage Page 32 Variace Page 33 Stadard deviatio Page 34 Stadard error of the mea Page 34 Kurtosis Page 35 Skewess Page 35 Defiitio of whiskers Page 36 Drop dow meus Box Plots Page 38 Dataset used: weight.dta
4 Scales used with data: Four scales are used with variables: omial, ordial, iterval ad ratio. omial - the variable has o order, just category ames Geder (male, female) ad hypertesive (yes, o) are examples ordial - the variable ca be rak ordered but there is o cosistet distace betwee the categories Icome scaled as low, medium ad high is a example. We kow that someoe i the category low has a smaller icome tha someoe i the category high but we do t kow how much smaller. Is the distace betwee low ad medium the same as the distace betwee medium ad high? We just kow the order ot the differece or distace betwee categories. iterval ad ratio - both of these are scales of equally spaced uits (i.e. cosistet distaces) like height i iches. A differece betwee the two scales is that variables o the ratio scale have a zero poit that ca be iterpreted as there is oe of the quatity beig measured but variables o the iterval scale do ot have such a zero poit. Height is o the ratio scale ad 0 iches tall meas there is o height. The Celsius scale is o the iterval scale but ot the ratio scale. Zero degrees Celsius does ot mea there is o heat. I order to be o the ratio scale, the ratio of two umbers has to make sese. A perso 140 cm tall is twice as tall as oe 70 cm tall. A ove at 300 degrees Celsius is ot twice as hot as oe at 150 degrees Celsius. Measures of locatio: We will cosider several measures of locatio. The mea, which we cosider first, is the most commoly used measure of locatio. Page -1-

5 x, x, x,..., x x Mea: If the sample cosists of poits 1 2 3, the the mea ( ) is defied as x xi i= = = x + x + x + + x This is just the arithmetic mea of the values. I order to calculate a mea, the variable has to be at least o the iterval scale. We will create ad use the small data set smalldbp.dta with the diastolic blood pressures of 10 people to illustrate meas. We will follow the steps i the picture below. 1) We click o the log butto which opes the Begi loggig Stata output meu. 2) We select the folder i which we wish to save our log file (i.e. Chapter2"). 3) We tell Stata we wat a log type of log file rather tha the smcl type of log file. 4) We give our log file a ame (smalldbp.log) 5) We save our log file to Chapter2" 6) The results of 1-5. Page -2-

6 6). log usig "W:\WP51\Biometry\AAAABiostatFall2007\Data\Chapter2\smalldbp.log" log: W:\WP51\Biometry\AAAABiostatFall2007\Data\Chapter2\smalldbp.log log type: text opeed o: 29 Aug 2007, 18:49:36 log o (text) tells you that you have a log file ruig ad that it is text as opposed to smcl We are goig to eter our data usig the data editor. Eterig data here is just like eterig data i Excel. (1) I click o the data editor butto (the highlighted butto below) ad that brigs up the Data Editor meu. I the just type i a ID variable ad 10 diastolic blood pressures (DBP). (2) I preserve the data so I wo t lose it ad (3) close the data editor because Stata wo t let me type o the commad lie if the data editor is ope I the Itroductio to Stata hadout I show you how to use the dropdow meus to give the variables ames other tha var1 ad var2 ad to give the variables descriptive Page -3-
7 labels. Here I am just goig to type i the appropriate commads o the commad lie. - preserve. reame var1 id. label variable id "Uique Idetifier". reame var2 dbp. label variable dbp "Diastolic Blood Pressure i mm Hg". des Cotais data obs: 10 vars: 2 size: 60 (99.9% of memory free) storage display value variable ame type format label variable label id byte %8.0g Uique Idetifier dbp byte %8.0g Diastolic Blood Pressure i mm Hg Sorted by: Note: dataset has chaged sice last saved des is short for describe. The mea diastolic pressure of these 10 people is: x 10 x i i= 1 = = = = It is customary to write the value for the mea to oe more decimal place tha the origial data. The origial DBP s are itegers so I report the mea of the DBP s as We usually report the stadard deviatio to two decimal places beyod the origial data (7.51). Page -4-
8 The easy way to get the mea is to just type i sum dbp or for more iformatio type sum dbp, det where sum is short for summarize ad det is short for detail. The results are below.. sum dbp Variable Obs Mea Std. Dev. Mi Max dbp sum dbp,det Diastolic Blood Pressure i mm Hg Percetiles Smallest 1% % % Obs 10 25% Sum of Wgt % 91 Mea 90 Largest Std. Dev % % Variace % Skewess % Kurtosis To use dropdow meus to do the same thig see the back of this hadout. Graph #1 based o origial set of 10 DBP values. Page -5-
9 The mea ca be thought of as the ceter of gravity (if you have weights of equal size hagig off each sample poit, the mea would be the balace poit.). Advatages of usig the mea: it uses all the observatios i the sample each sample has a uique mea A disadvatage of usig the mea is that it is sesitive to extreme values (ad the smaller the sample, the more impact the extreme values have). Below I create a ew variable which is equal to the old variable dbp except the value 99 is chaged to 130 (we ll call this set of 10 values the ewdbp). Note that this chages the mea of the sample from 90.0 to 93.1 (see graph below to uderstad how the ceter of gravity has chaged just by chagig oe value).. ge ewdbp = dbp ge is short for geerate. replace ewdbp = 130 if dbp == 99 (1 real chage made). sum ewdbp Variable Obs Mea Std. Dev. Mi Max ewdbp Graph #2 is based o the set of 10 DBP values with 99 replaced by 130. Page -6-
10 Notice that the mea is pulled from 90.0 to 93.1 (i.e. the mea is pulled toward the outlyig value).. save smalldbp.dta file smalldbp.dta saved. log close log: W:\WP51\Biometry\AAAABiostatFall2007\Data\Chapter2\smalldbp.log log type: text closed o: 29 Aug 2007, 20:29:53 The largest value for baselie cholesterol i the dataset weight.dta is 412. Try chagig that to 1500 ad comparig the mea of the origial sample with the mea of the chaged sample. Notice that there are 10,273 participats with baselie cholesterol values but there are 10,355 participats i the dataset. The way to create the ew DBP variable with dropdow meus is give at the back of the hadout. Whe we study the Cetral Limit Theorem, we will fid that the mea has some ice properties that allow us to get cofidece itervals ad do hypothesis testig. The type of data eeded to calculate a mea is iterval (i.e. you have to have the ability to divide ad still have a legitimate observatio). So we calculate meas for variables such as age ad diastolic blood pressure (i.e. cotiuous variables). Media: If the sample cotais a odd umber of observatios, the media is the middle observatio provided the sample is ordered from smallest to largest. If the sample cotais a eve umber of observatios, the media is the average of the two middle observatios give that the sample is ordered from smallest to largest. You ca see that this defiitio makes the media such that a equal umber of poits are greater tha or equal to ad less tha or equal to the media. A advatage for the media over the mea is that the media is ot sesitive to extreme values. Notice that both the variable dbp ad the variable ewdbp have the same media, but ot the same mea. The media is the 50 th percetile. Media Mea dbp ewdbp Page -7-
11 . sum(dbp),det (origial set of 10 values for DBP) Diastolic Blood Pressure (dbp) Percetiles Smallest 1% % % Obs 10 25% Sum of Wgt % 91 Mea 90 Largest Std. Dev % % Variace % Skewess % Kurtosis Note that i the Stata output below the 50th percetile is the media ad that although the largest value chages from 100 to 130 the media remais the same.. sum(ewdbp),det New versio of DBP with 99 chaged to Percetiles Smallest 1% % % Obs 10 25% Sum of Wgt % 91 Mea 93.1 Largest Std. Dev % % Variace % Skewess % Kurtosis Aother advatage for the media is that each sample has a uique media. A disadvatage for the media is that it does ot utilize all the data i the sample. I order to obtai a media, the data has to be o at least the ordial scale (i.e. you ca order the observatios). Whe should we use the mea ad whe should we use the media? The cartoo below sort of gives the correct aswer. Page -8-

12 Mode: The mode is the most frequetly occurrig value i a set of observatios. A disadvatage for the mode is that ot all samples have a mode ad some samples have multiple modes. Sample 1 = {1,2,3,4,5,6,7,8,9,10} has o mode. Sample 2 = {1,1,1,2,3,4,4,4,5} has modes 1 ad 4. Sample 3 = {M, F, F, F, M, M, M, F, F, F} has mode F where M = male ad F = female. The mode ca be calculated with data o the omial scale (i.e. all you have to be able to do is categorize each observatio). The mode will ot come up agai i this course uless it is i a discussio of a bimodal distributio because it is ot ameable to mathematical maipulatio. Thigs about logs you have probably log sice forgotte. log here ca be to ay base (i.e., ) log e log 10 1) log(a) is defied oly if a > 0. 2) log(ab) = log(a) + log(b) 3) log(a/b) = log(a) - log(b) 4) log( a k ) = k log( a ) Page -9-
13 Geometric mea: x, x, x,..., x x g If the sample is the the geometric mea ( ) is defied as x = x x x x g (This is the th root of the product of sample elemets) 1 g This ca also be writte as x = ( x x x x ) or as log( x ) g i = = 1 log( x ) i The geometric mea turs up whe doig such thigs as dilutio assays. So usig our ewly remembered facts about logs we have the followig: log( x ) = log ( x x x x ) g = log( x x x x ) = log( x ) + log( x ) + log( x ) + log( x ) log( x ) i i = = 1 So we have that the mea of the logs is the log of the mea. Roser gives a good example of the use of the geometric mea o pages 14 ad 15, Table 2.4. Page -10-
14 The geometric mea is more appropriate tha the arithmetic mea i the followig circumstaces: 1) Whe losses/gais ca best be expressed as a percetage rather tha a fixed value. 2) Whe rapid growth is ivolved, as i the developmet of a bacterial or viral populatio. 3) Whe the data spa several orders of magitude as with a cocetratio of pollutats. Take from Commo Errors i Statistics 2 d editio by Good ad Hardi. The most commoly used of the above measures of locatio is the mea with the media secod because it is used i o-parametric aalyses. Questio: Why would the CMS (Ceter for Medicare ad Medicaid Services) preset the geometric mea to summarize the legth of hospital stay. Note that this does t fit ay of the reasos give above. It has to do with trasformed data. Below is a small study of the legth of hospital stay for 25 patiets. The dataset used is hospital.dta which is a file that is also used i the Itroductio to Stata. hospital.dta is o the class website. Page -11-
15 The distributio of a variable is said to be symmetric if the pieces o either side of the ceter poit are mirror images. Otherwise the distributio is described as skewed. If the distributio is symmetric the skewess value give i the detailed versio of the commad summarize is zero. The variable legth of hospital stay is skewed to the right (also described as positively skewed). Notice that the skewess value is 2.2. A positive skewess value (i.e. value > 0) idicates that the skewess is to the right (see the histogram of hospital stay above). A egative skewess value idicates the distributio is skewed to the left. Idividuals who have much loger hospital stays tha most of the other patiets is very commo for legth of stay data.. sum stay,det Legth of hospital stay i days Percetiles Smallest 1% 3 3 5% % 3 3 Obs 25 25% 5 4 Sum of Wgt % 8 Mea 8.6 Largest Std. Dev % % Variace % Skewess % Kurtosis This is a case where the value 30 days is probably correct so we ca t just set it to missig. Oe thig that we ca do is trasform the data to brig the 30 days closer to the rest of the data. Oe of the trasformatios which will brig i the larger values is the atural (i.e. base e) logarithmic trasformatio (log to base 10 will also brig i the more distat data). To get the log trasformatio we simply geerate a ew variable that is equal to log base e of the variable stay.. ge logofstay = log(stay). label variable logofstay "The atural logarithm of the variable legth of hospital stay" You ca also use l(stay) to get the log base e of stay. To get the log base 10 you use log10(stay). The thigs about logs that we ve probably log sice forgotte are true regardless of the base. Notice i the histogram below that the log trasformatio has pulled the largest value i earer the other values. Page -12-

16 Histogram 2 above is the graph of the atural logarithm of the variable stay, so the log of the geometric mea of stay will equal the arithmetic mea of the variable logofstay.. ameas stay Variable Type Obs Mea [95% Cof. Iterval] stay Arithmetic Geometric Harmoic ameas logstay Variable Type Obs Mea [95% Cof. Iterval] logstay Arithmetic Geometric Harmoic di log( ) Or the atilog of the arithmetic mea of the variable logstay is the geometric mea of the variable stay.. di exp( ) The atilog i this case is the iverse of the log fuctio which is the expoetial e x e = fuctio (i.e. where ). Page -13-
17 So what does the log trasformatio do? If the ratios of two pairs of poits are equal the o the log scale the distace betwee the two members of a pair is the same for both pairs = 1 10 so 10 1 log = log but 10 1 log( 10) log( 100) = log = log = log( 1) log( 10) So we have. di log(10/100) di log(1/10) di log(1) - log(10) di log(10) - log(100) So istead of havig 1 ad 10, 9 uits apart while 10 ad 100 are 90 uits apart both are 2.3 uits apart o the atural log scale. So the short aswer to why CMS presets the geometric mea is to lesse the ifluece of outlyig values. Page -14-
18 Properties of meas: Property 1: Sometimes we wish to rescale the elemets of our sample. For example, we may have collected the weight of our participats i pouds ad ow we are goig to publish our paper i a joural that requires the weight to be reported i grams. The data file we are usig is weight.dta. I double (left) clicked o the data set weight which was stored o the W drive ad the file opeed i Stata. I the use statemet below from the W to weight.dta gives the path to fid the data set. Whe we ope a data set i this fashio, Stata will store ay log file we create i the same folder where the dataset was stored. Page -15-
19 There are several properties that I would like you to otice about the file above: 1) The file is sorted by the variable weight. This meas if I list the variable weight, the smallest weight will be listed first ad the largest weight will be listed last. 2) Each variable has a variable label describig the data the variable cotais. 3) The categorical variables have value labels. Notice i the descriptio above that the umber of observatios is give as 10,355 but the summary of weight below says there are 10,341 values for weight.. sum weight Variable Obs Mea Std. Dev. Mi Max weight If I use the commad codebook, we ca see that there are 14 missig values for weight.. codebook weight weight Weight (lbs) at Baselie type: umeric (float) rage: [54,392] uits: 1 uique values: 262 missig.: 14/10355 mea: std. dev: percetiles: 10% 25% 50% 75% 90% We kow that 1 poud = grams. So let us create a ew variable called wtigms that is the baselie weight i grams.. ge wtigms = weight* (14 missig values geerated). label variable wtigms Weight i grams Note that wtigms is missig 14 values because weight is missig 14 values (i.e. missig = missig). Stata uses the period to represet missig data. Page -16-
20 Below I used the commad list to list the values of weight ad wtigms for the last 19 participats (whe the data is ordered by weight) which icludes the 14 people with missig values for wtigms. oobs asks that Stata ot to umber the rows.. list id weight wtigms if weight >= 364,oobs id weight wtigms I have listed the last 19 observatios for weight. The periods represet missig data. Sice the missig data is listed last, we kow that Stata cosiders missig values to be larger tha ay other values. The other thig to otice is that = = etc. Below we see that the mea of the wtigms variable is times the mea of the weight variable.. sum weight Variable Obs Mea Std. Dev. Mi Max weight sum wtigms Variable Obs Mea Std. Dev. Mi Max wtigms di * The di above stads for display. The * says multiply times That is, I m usig Stata like it is a calculator. Page -17-
21 This shows that if c is a costat (here ), the samplecx 1, cx 2, cx 3,..., cx cx x x 1, x 2, x 3,... x (wtigms) has mea where is the mea of the sample (weight). That is, you ca obtai the mea of a sample ad the multiply by the costat or you ca multiply each elemet by the costat ad the get the mea. Property 2: Sample x1+ c, x2 + c, x3 + c,..., x + c has mea x + c if the sample has mea ad is a costat. x 1, x 2, x 3,..., x x c This says you ca add (or subtract) a fixed value to each of the origial values ad the get the mea or you ca get the mea of the origial values ad the add (or subtract) the fixed value. You will fid later whe doig regressio that people sometimes ceter their data by subtractig the mea of the variable from each of the origial observatios. So istead of puttig the origial variable i the regressio equatio, the variable they use is the origial variable mius its mea. So let s take a look at what happes whe you add a fixed value to each elemet of a sample. Let us take the variable chol (this is the baselie cholesterol from the dataset weight.dta) ad add 50 to the baselie value for each of the10273 people who have a baselie value (i.e. 82 people have missig listed for the baselie value of cholesterol ad missig + 50 = missig).. sum chol,det Lipid BL Cholesterol Percetiles Smallest 1% % % Obs % Sum of Wgt % 223 Mea Largest Std. Dev % % Variace % Skewess % Kurtosis ge cholplus = chol + 50 (82 missig values geerated). label variable cholplus50 "Baselie cholesterol + 50 mg/dl" Soapbox momet: I recommed always labelig your variables. You thik you ll remember how the variable is defied, but whe you come back to the data six moths later you may fid that you ve forgotte. Page -18-
22 . sum cholplus50,det Baselie cholesterol + 50 mg/dl Percetiles Smallest 1% % % Obs % Sum of Wgt % 273 Mea Largest Std. Dev % % Variace % Skewess % Kurtosis So we ca see that addig 50 to each baselie value shifts all of the percetiles, the mea, the miimum ad the maximum up by 50 poits. Notice that the stadard deviatio ad the variace (which we will defie o later) remai uchaged (this is because they refer to shape, while the mea ad percetiles etc. refer to positio). The skewess ad kurtosis (to be defied later) also remai the same because the oly thig we ve doe is to shift the curve up 50 poits. See the graphs o the ext 2 pages. Below is the codebook for both chol ad cholplus50.. codebook chol cholplus chol Lipid BL Cholesterol type: umeric (float) rage: [130,412] uits:.1 uique values: 326 missig.: 82/10355 mea: std. dev: percetiles: 10% 25% 50% 75% 90% cholplus50 Baselie cholesterol + 50 mg/dl type: umeric (float) rage: [180,462] uits:.1 uique values: 326 missig.: 82/10355 mea: std. dev: percetiles: 10% 25% 50% 75% 90% Page -19-
23 Below I have created a histogram for each of chol ad cholplus50. You ca see that the two histograms below are the same shape. The lower oe is just shifted 50 mg/dl to the right. Origial Baselie Cholesterol Frequecy Baselie Cholesterol mg/dl Baselie Cholesterol + 50 Frequecy Baselie Cholesterol mg/dl + 50 mg/dl Page -20-
24 Box ad whisker plots: The lie i the middle of the box is the media or 50th percetile. The bottom of the box is the 25 th percetile ad the top of the box is the 75 th percetile. The height of the box (i.e. from 25 th to 75 th percetile) is called the iterquartile rage ad it is a measure of variability. Lipid BL Cholesterol Box ad Whisker Plot Upper whisker Lower whisker 75 th percetile 50 th percetile 25 th percetile Addig a costat chages locatio but ot variability Cholesterol for baselie ad baselie Lipid BL Cholesterol Baselie cholesterol + 50 mg/dl The box plot above shows eve more clearly that the distributio is just shifted up without chagig the relatioship of the various pieces. So what I ve worked hard to show is that addig a fixed umber to each uit of a sample chages the locatio of the distributio but leaves the shape uchaged. We will discover that multiplyig each uit of a sample by a fixed umber chages the shape of the distributio. Page -21-
25 Now go back to multiplyig the origial values by some costat We ll geerate a ew variable which we obtai by multiplyig each of the origial baselie cholesterol values by 2.. ge cholx2 = 2*chol (82 missig values geerated). label variable cholx2 "Baselie cholesterol times 2 mg/dl" Notice below that almost all of the values produced by the summarize commad are multiplied by 2. There are three exceptios. The variace is multiplied by 4 = 2 2 (we will later lear the variace = SD 2, where SD = stadard deviatio) ad the skewess ad kurtosis are the same as they were for baselie cholesterol (as opposed to beig multiplied by 2). We ll discuss skewess ad kurtosis later.. sum cholx2,det Baselie cholesterol times 2 mg/dl Percetiles Smallest 1% % % Obs % Sum of Wgt % 446 Mea Largest Std. Dev % % Variace % Skewess % Kurtosis sum chol,det Lipid BL Cholesterol Percetiles Smallest 1% % % Obs % Sum of Wgt % 223 Mea Largest Std. Dev % % Variace % Skewess % Kurtosis I have created a histogram for each of baselie cholesterol ad baselie cholesterol times 2. I order to compare the 2 graphs they eed to be o the same scale. Notice that the smallest value for cholesterol is 130 mg/dl ad the largest for cholesterol times Page -22-
26 2 is 824 mg/dl. So I will select the x-axis scale as 125(100)825 for both versios of cholesterol. 125(100)825 says label the x-axis startig with the smallest value (i.e. 125) ad the goig up by uits of 100 util you reach 825. Frequecy Baselie cholesterol mg/dl Frequecy Baselie cholesterol mg/dl times 2 Page -23-
27 Baselie cholesterol ad baselie cholesterol times 2 mg/dl Lipid BL Cholesterol Baselie cholesterol times 2 mg/dl Lookig at the graphs o the previous page ad above we see that multiplyig by 2 has chaged ot oly the locatio (mea) but also the shape. The cholesterol times 2 is much more spread out (we ll come back to these graphs whe we discuss measures of variability). So we ve leared that addig to the elemets of a sample chages oly the locatio but multiplyig chages both the locatio ad the shape. We kow that we ca measure locatio usig the mea ad media, but we do t yet kow how to idicate (other tha graphically) that the shape has chaged. Page -24-

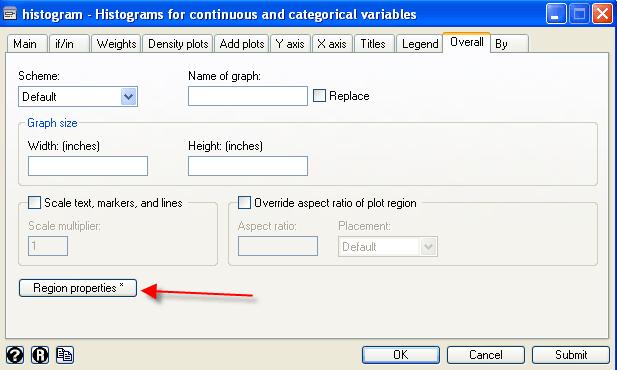
28 Meus to get meas: Click o Submit to ru the commad but leave the meu up so you ca make chages as eeded. Click OK just to ru the commad. Click o? to brig up the help meu for summarize. Click o R to clear the etries i the meu. Page -25-


29 How to chage the values of a variable.. replace chol = 1500 if chol == 412 (1 real chage made) Page -26-

30 How to get geometric, arithmetic ad harmoic meas. Page -27-


31 How to get a histogram. Page -28-

32 Frequecy cholplus50 Page -29-
33 Measures of spread or variability: Rage: rage = largest value - smallest value Note that codebook gives the rage as a iterval. Statisticias ted to use the defiitio as give so that the rage is a sigle umber Advatage: This is the simplest measure of spread. Disadvatage Very sesitive to extreme values The rage for the baselie cholesterol is = 282. If we chage the largest value (412) to 550, the the rage becomes = 420 Oe of the problems with the rage is there is a tedecy for larger samples, to have larger rages. How does addig 50 to the variable cholesterol or multiplyig by 2 chage the rage. The rage for the baselie cholesterol is = 282. The rage for the cholesterol + 50 = = 282. So these two variables with the same shape also have the same rage. The rage for cholesterol times 2 = = 564 = 2 times the rage of baselie cholesterol. The rage for cholesterol times 2 is twice that of the origial cholesterol. We ca see that i the histograms ad the box-ad-whisker plots i the Chapter 2 Part 1 hadout. Percetiles: Roser says that ituitively, the p th percetile is the value V p such that p percet of the sample poits are less tha or equal to You will also see percetiles called quatiles. Quartiles are the Quitiles are the Deciles are the th th th 25, 50, 75 th th th th 20, 40, 60, 80 10, 20, 30, 40, K, 90. The media is the 50 th percetile. V p percetiles percetiles percetiles th th th th th Page -30-
34 Below we ca see the chage i the 25 th, 50 th ad 75 th percetiles as you add a costat (here 50) to the origial cholesterol or multiply the origial cholesterol by a costat (here 2). Percet Cholesterol Cholesterol + 50 Cholesterol x 2 25% = x 2 = % = x 2 = % = x 2 = 483 Page -31-
35 Iterquartile rage: Iterquartile rage = value of the 75 th percetile - value of the 25 th percetile As we saw i the last hadout, the iterquartile rage is the height of the box i the box plot graph. Notice below that the values of baselie cholesterol cluster together whereas the values of baselie cholesterol times 2 are much more spread out. We would like to be able to describe this variability i a way that uses all of the data as opposed to the rage ad iterquartile rage which use oly 2 of the values i the dataset. We ll call this ew statistic the variace. Page -32-
36 Variace: A first guess at a defiitio for variace might be guess() 1 = ( x x) i= 1 This defiitio uses all of the observatios i the sample. It also seems reasoable to use the distace of each observatio from the mea as a measure of how spread out the values are. The problem is that this sum is always equal to zero. i A secod guess might be guess( 2) = x x i= 1 This secod guess solves the problem of the sum addig to zero ad it is scaled the same as the origial data. However, this secod guess has two problems: (1) is that the absolute value is mathematically itractable ad (2) this sum gets larger as the sample size gets larger. The secod problem could be dealt with by dividig the sum by the size of the sample, amely. Guess umber 3 is to square the differece because the square is easier to deal with mathematically tha the absolute value ad it prevets the sum from beig zero as the absolute value did. If we also divide by, the we have provided a correctio for the sample size (i.e. we adjusted the sum of squares so that the sum does t icrease just because the sample size icreases). i guess() 3 = i= 1 ( x x) i 2 The problem with this estimate, which we wo t uderstad util we lear about biased ad ubiased estimators, is that o the average it is too small (this meas if we took a large umber of repeated samples of size from a give populatio ad averaged all of the variaces from these samples, the average would be smaller tha the true variace 1 of the populatio). To solve this problem we divide by rather tha. What we have t stated before is that the sample estimate for the variace is iteded to Page -33-
37 estimate the variace of the populatio from which the sample was draw. So the variace ( s 2 ) is defied as follows: s ( xi x) = 1 2 i= 1 2 The variace of each of the baselie cholesterol ad the baselie cholesterol + 50 is The variace of the cholesterol times 2 = (i.e. 2 2 baselie cholesterol variace). Notice that the variace is ot i the same uits as the origial data (i.e. mg 2 /dl 2 versus mg/dl). See the Stata output o page 2. Stadard deviatio: The oly problem left with the above defiitio is that the variace is ot i the same uits as the origial data. This ca be solved by takig the square root of the variace. The square root of the variace is called the stadard deviatio ad is deoted by s. We take the o-egative square root so $ 0. s s = ( xi x) 2 i= 1 1 Stadard Error of the Mea: The stadard error of the mea, deoted either SEM or SE is the stadard deviatio divided by the square root of or SE = s The SE is goig to come i hady whe we get to cofidece itervals ad the Cetral Limit Theorem. Small preview: The stadard deviatio ( ) tells us about the spread for s Page -34-

38 a sigle sample. The stadard error (SE) is actually the stadard deviatio of the distributio of all sample meas from samples of size. Notice that the size of the SE is depedet upo the size of the sample. Kurtosis: The kurtosis of a distributio describes its peakedess relative to the legth ad size of its tails. The kurtosis of the ormal distributio is 3. Distributios with values of kurtosis higher tha 3 ted to have sharp peaks ad log taperig tails (see the histogram of triglycerides ). Values lower tha 3 idicate distributios that are relatively flat with short tails. Users of SAS eed to be aware that the value that SAS gives for kurtosis is Stata s value mius 3 (i.e. the ormal distributio will have a kurtosis of 3 accordig to Stata ad 0 accordig to SAS). There are at least two differet defiitios of kurtosis ad SAS ad Stata have just selected differet defiitios. Kurtosis = 17.6 Skewess = 1.8 Skewess: A symmetric distributio is oe that you ca fold over at the mea ad the two halves will coicide. A symmetric distributio (e.g. the ormal distributio) will have a skewess of zero. Those distributios that are skewed to the right, like triglycerides, have a positive umber for skewess. Those skewed to the left will have a egative umber for skewess. Page -35-
39 The directio of the skewess goes with the side the loger tail is o. So the triglycerides graph above is said to be skewed to the right. Lipid BL Triglycerides ,000 1,500 How to tell the graph is skewed whe usig a box plot: The 50 th percetile lie is ot i the ceter of the box. This is hard to see but the media lie is a little below the middle if the box. The whiskers are ot the same legth. Ad, of course, that log strig of poits outside the upper whisker with o similar strig outside the lower whisker. Defiitio of the whiskers. First order the uits of the sample i ascedig order (smallest to largest). xp [ ] x[ 25] Let deote the pth percetile. So is the 25 th percetile. x[ 25 ] x[ 75 ] x[ 50] The box exteds from to. The lie i the middle is. Defie U = x[ 75] ( x[ 75] x[ 25]) ad L= x[ 25] 15. ( x[ 75] x[ 25]) Page -36-
40 Notice that if the whiskers were defied by U ad L, the the legth of the upper ad lower whiskers would always be the same. After we ve looked at a buch of examples you ll kow the upper ad lower whiskers are ot always the same legth. The legth depeds o the upper ad lower adjacet values defied below. The otatio x () i idicates that the x' s are ordered from smallest to largest. If there xs ' x ( ) are, the 1 is the smallest ad x ( ) is the largest. The upper adjacet value (i.e. the upper whisker) is defied as the x () i such that x U ad x > U (i.e. is just iside or o U). () i ( i+1) x () i The lower adjacet value (i.e. the lower whisker) is defied as the x () i such that x() i L ad x( i 1) < L (i.e. x () i is just iside or o L). Notice that Roser refers to poits outside the whiskers as outlyig values. The upper ad lower adjacet values (defied above) are a creatio of Joh Tukey (Exploratory Data Aalysis, 1977). Page -37-


41 Joh Tukey - Statisticia He died at 85 i 2000 Coied the Word 'Software' ad the word bit for biary digit. Tukey used the term software three decades before the foudig of microsoft. Joh Wilder Tukey was oe of the most ifluetial statisticias of the last 50 years ad a wide-ragig thiker. Mr. Tukey developed importat theories about how to aalyze data ad compute series of umbers quickly. He spet decades as both a professor at Priceto Uiversity ad a researcher at AT&T's Bell Laboratories, ad his ideas cotiue to be a part of both doctoral statistics courses ad high school math classes. I 1973, Presidet Richard M. Nixo awarded him the Natioal Medal of Sciece. Take i part from the New York Times Obituary. How to graph a box plot I the meu above click o box plot ad you will get the meu o the right. There are a lot of facy thigs you ca do but just puttig trig i the variables widow gets you the graph a couple of pages up. Page -38-
42
 Twitter: @Owe134866 www.mathsfreeresourcelibrary.com Prior Kowledge Check 1) State whether each variable is qualitative or quatitative: a) Car colour Qualitative b) Miles travelled by a cyclist c) Favourite
A random variable is a variable whose value is a numerical outcome of a random phenomenon.
 The Practice of Statistics, d ed ates, Moore, ad Stares Itroductio We are ofte more iterested i the umber of times a give outcome ca occur tha i the possible outcomes themselves For example, if we toss
These characteristics are expressed in terms of statistical properties which are estimated from the sample data.
 0. Key Statistical Measures of Data Four pricipal features which characterize a set of observatios o a radom variable are: (i) the cetral tedecy or the value aroud which all other values are buched, (ii)
Lecture 4: Probability (continued)
") Lecture 4: Probability (cotiued) Desity Curves We ve defied probabilities for discrete variables (such as coi tossig). Probabilities for cotiuous or measuremet variables also are evaluated usig relative
Lecture 4: Probability (cotiued) Desity Curves We ve defied probabilities for discrete variables (such as coi tossig). Probabilities for cotiuous or measuremet variables also are evaluated usig relative
Estimating Proportions with Confidence
 Aoucemets: Discussio today is review for midterm, o credit. You may atted more tha oe discussio sectio. Brig sheets of otes ad calculator to midterm. We will provide Scatro form. Homework: (Due Wed Chapter
Today: Finish Chapter 9 (Sections 9.6 to 9.8 and 9.9 Lesson 3)
") Today: Fiish Chapter 9 (Sectios 9.6 to 9.8 ad 9.9 Lesso 3) ANNOUNCEMENTS: Quiz #7 begis after class today, eds Moday at 3pm. Quiz #8 will begi ext Friday ad ed at 10am Moday (day of fial). There will be
Today: Fiish Chapter 9 (Sectios 9.6 to 9.8 ad 9.9 Lesso 3) ANNOUNCEMENTS: Quiz #7 begis after class today, eds Moday at 3pm. Quiz #8 will begi ext Friday ad ed at 10am Moday (day of fial). There will be
Lecture 4: Parameter Estimation and Confidence Intervals. GENOME 560 Doug Fowler, GS
 Lecture 4: Parameter Estimatio ad Cofidece Itervals GENOME 560 Doug Fowler, GS (dfowler@uw.edu) 1 Review: Probability Distributios Discrete: Biomial distributio Hypergeometric distributio Poisso distributio
Confidence Intervals. CI for a population mean (σ is known and n > 30 or the variable is normally distributed in the.
 Cofidece Itervals A cofidece iterval is a iterval whose purpose is to estimate a parameter (a umber that could, i theory, be calculated from the populatio, if measuremets were available for the whole populatio).
Inferential Statistics and Probability a Holistic Approach. Inference Process. Inference Process. Chapter 8 Slides. Maurice Geraghty,
 Iferetial Statistics ad Probability a Holistic Approach Chapter 8 Poit Estimatio ad Cofidece Itervals This Course Material by Maurice Geraghty is licesed uder a Creative Commos Attributio-ShareAlike 4.0
. (The calculated sample mean is symbolized by x.)
") Stat 40, sectio 5.4 The Cetral Limit Theorem otes by Tim Pilachowski If you have t doe it yet, go to the Stat 40 page ad dowload the hadout 5.4 supplemet Cetral Limit Theorem. The homework (both practice
Stat 40, sectio 5.4 The Cetral Limit Theorem otes by Tim Pilachowski If you have t doe it yet, go to the Stat 40 page ad dowload the hadout 5.4 supplemet Cetral Limit Theorem. The homework (both practice
Statistics for Economics & Business
 Statistics for Ecoomics & Busiess Cofidece Iterval Estimatio Learig Objectives I this chapter, you lear: To costruct ad iterpret cofidece iterval estimates for the mea ad the proportio How to determie
Chapter 8. Confidence Interval Estimation. Copyright 2015, 2012, 2009 Pearson Education, Inc. Chapter 8, Slide 1
 Chapter 8 Cofidece Iterval Estimatio Copyright 2015, 2012, 2009 Pearso Educatio, Ic. Chapter 8, Slide 1 Learig Objectives I this chapter, you lear: To costruct ad iterpret cofidece iterval estimates for
Topic-7. Large Sample Estimation
 Topic-7 Large Sample Estimatio TYPES OF INFERENCE Ò Estimatio: É Estimatig or predictig the value of the parameter É What is (are) the most likely values of m or p? Ò Hypothesis Testig: É Decidig about
Basic formula for confidence intervals. Formulas for estimating population variance Normal Uniform Proportion
 Basic formula for the Chi-square test (Observed - Expected ) Expected Basic formula for cofidece itervals sˆ x ± Z ' Sample size adjustmet for fiite populatio (N * ) (N + - 1) Formulas for estimatig populatio
point estimator a random variable (like P or X) whose values are used to estimate a population parameter
 whose values are used to estimate a population parameter") Estimatio We have oted that the pollig problem which attempts to estimate the proportio p of Successes i some populatio ad the measuremet problem which attempts to estimate the mea value µ of some quatity
Estimatio We have oted that the pollig problem which attempts to estimate the proportio p of Successes i some populatio ad the measuremet problem which attempts to estimate the mea value µ of some quatity
ST 305: Exam 2 Fall 2014
 ST 305: Exam Fall 014 By hadig i this completed exam, I state that I have either give or received assistace from aother perso durig the exam period. I have used o resources other tha the exam itself ad
Sampling Distributions and Estimation
 Cotets 40 Samplig Distributios ad Estimatio 40.1 Samplig Distributios 40. Iterval Estimatio for the Variace 13 Learig outcomes You will lear about the distributios which are created whe a populatio is
Limits of sequences. Contents 1. Introduction 2 2. Some notation for sequences The behaviour of infinite sequences 3
 Limits of sequeces I this uit, we recall what is meat by a simple sequece, ad itroduce ifiite sequeces. We explai what it meas for two sequeces to be the same, ad what is meat by the -th term of a sequece.
14.30 Introduction to Statistical Methods in Economics Spring 2009
 MIT OpeCourseWare http://ocwmitedu 430 Itroductio to Statistical Methods i Ecoomics Sprig 009 For iformatio about citig these materials or our Terms of Use, visit: http://ocwmitedu/terms 430 Itroductio
1 Random Variables and Key Statistics
 Review of Statistics 1 Radom Variables ad Key Statistics Radom Variable: A radom variable is a variable that takes o differet umerical values from a sample space determied by chace (probability distributio,
Models of Asset Pricing
 APPENDIX 1 TO CHAPTER 4 Models of Asset Pricig I this appedix, we first examie why diversificatio, the holdig of may risky assets i a portfolio, reduces the overall risk a ivestor faces. The we will see
AY Term 2 Mock Examination
 AY 206-7 Term 2 Mock Examiatio Date / Start Time Course Group Istructor 24 March 207 / 2 PM to 3:00 PM QF302 Ivestmet ad Fiacial Data Aalysis G Christopher Tig INSTRUCTIONS TO STUDENTS. This mock examiatio
BASIC STATISTICS ECOE 1323
 BASIC STATISTICS ECOE 33 SPRING 007 FINAL EXAM NAME: ID NUMBER: INSTRUCTIONS:. Write your ame ad studet ID.. You have hours 3. This eam must be your ow work etirely. You caot talk to or share iformatio
Outline. Plotting discrete-time signals. Sampling Process. Discrete-Time Signal Representations Important D-T Signals Digital Signals
 Outlie Discrete-Time Sigals-Itroductio. Plottig discrete-time sigals. Samplig Process. Discrete-Time Sigal Represetatios Importat D-T Sigals Digital Sigals Discrete-Time Sigals-Itroductio The time variable
Models of Asset Pricing
 APPENDIX 1 TO CHAPTER4 Models of Asset Pricig I this appedix, we first examie why diversificatio, the holdig of may risky assets i a portfolio, reduces the overall risk a ivestor faces. The we will see
Combining imperfect data, and an introduction to data assimilation Ross Bannister, NCEO, September 2010
 Combiig imperfect data, ad a itroductio to data assimilatio Ross Baister, NCEO, September 00 rbaister@readigacuk The probability desity fuctio (PDF prob that x lies betwee x ad x + dx p (x restrictio o
Standard Deviations for Normal Sampling Distributions are: For proportions For means _
 Sectio 9.2 Cofidece Itervals for Proportios We will lear to use a sample to say somethig about the world at large. This process (statistical iferece) is based o our uderstadig of samplig models, ad will
CHAPTER 2 PRICING OF BONDS
 CHAPTER 2 PRICING OF BONDS CHAPTER SUARY This chapter will focus o the time value of moey ad how to calculate the price of a bod. Whe pricig a bod it is ecessary to estimate the expected cash flows ad
B = A x z
 114 Block 3 Erdeky == Begi 6.3 ============================================================== 1 / 8 / 2008 1 Correspodig Areas uder a ormal curve ad the stadard ormal curve are equal. Below: Area B = Area
Using Math to Understand Our World Project 5 Building Up Savings And Debt
 Usig Math to Uderstad Our World Project 5 Buildig Up Savigs Ad Debt Note: You will have to had i aswers to all umbered questios i the Project Descriptio See the What to Had I sheet for additioal materials
Math 124: Lecture for Week 10 of 17
 What we will do toight 1 Lecture for of 17 David Meredith Departmet of Mathematics Sa Fracisco State Uiversity 2 3 4 April 8, 2008 5 6 II Take the midterm. At the ed aswer the followig questio: To be revealed
Non-Inferiority Logrank Tests
 Chapter 706 No-Iferiority Lograk Tests Itroductio This module computes the sample size ad power for o-iferiority tests uder the assumptio of proportioal hazards. Accrual time ad follow-up time are icluded
Introduction to Probability and Statistics Chapter 7
 Itroductio to Probability ad Statistics Chapter 7 Ammar M. Sarha, asarha@mathstat.dal.ca Departmet of Mathematics ad Statistics, Dalhousie Uiversity Fall Semester 008 Chapter 7 Statistical Itervals Based
Models of Asset Pricing
 4 Appedix 1 to Chapter Models of Asset Pricig I this appedix, we first examie why diversificatio, the holdig of may risky assets i a portfolio, reduces the overall risk a ivestor faces. The we will see
1 Estimating sensitivities
 Copyright c 27 by Karl Sigma 1 Estimatig sesitivities Whe estimatig the Greeks, such as the, the geeral problem ivolves a radom variable Y = Y (α) (such as a discouted payoff) that depeds o a parameter
Lecture 5: Sampling Distribution
 Lecture 5: Samplig Distributio Readigs: Sectios 5.5, 5.6 Itroductio Parameter: describes populatio Statistic: describes the sample; samplig variability Samplig distributio of a statistic: A probability
CHAPTER 8 Estimating with Confidence
 CHAPTER 8 Estimatig with Cofidece 8.2 Estimatig a Populatio Proportio The Practice of Statistics, 5th Editio Stares, Tabor, Yates, Moore Bedford Freema Worth Publishers Estimatig a Populatio Proportio
An Empirical Study of the Behaviour of the Sample Kurtosis in Samples from Symmetric Stable Distributions
 A Empirical Study of the Behaviour of the Sample Kurtosis i Samples from Symmetric Stable Distributios J. Marti va Zyl Departmet of Actuarial Sciece ad Mathematical Statistics, Uiversity of the Free State,
STRAND: FINANCE. Unit 3 Loans and Mortgages TEXT. Contents. Section. 3.1 Annual Percentage Rate (APR) 3.2 APR for Repayment of Loans
 3.2 APR for Repayment of Loans") CMM Subject Support Strad: FINANCE Uit 3 Loas ad Mortgages: Text m e p STRAND: FINANCE Uit 3 Loas ad Mortgages TEXT Cotets Sectio 3.1 Aual Percetage Rate (APR) 3.2 APR for Repaymet of Loas 3.3 Credit Purchases
CMM Subject Support Strad: FINANCE Uit 3 Loas ad Mortgages: Text m e p STRAND: FINANCE Uit 3 Loas ad Mortgages TEXT Cotets Sectio 3.1 Aual Percetage Rate (APR) 3.2 APR for Repaymet of Loas 3.3 Credit Purchases
Chapter 5: Sequences and Series
 Chapter 5: Sequeces ad Series 1. Sequeces 2. Arithmetic ad Geometric Sequeces 3. Summatio Notatio 4. Arithmetic Series 5. Geometric Series 6. Mortgage Paymets LESSON 1 SEQUENCES I Commo Core Algebra I,
5. Best Unbiased Estimators
 Best Ubiased Estimators http://www.math.uah.edu/stat/poit/ubiased.xhtml 1 of 7 7/16/2009 6:13 AM Virtual Laboratories > 7. Poit Estimatio > 1 2 3 4 5 6 5. Best Ubiased Estimators Basic Theory Cosider agai
Anomaly Correction by Optimal Trading Frequency
 Aomaly Correctio by Optimal Tradig Frequecy Yiqiao Yi Columbia Uiversity September 9, 206 Abstract Uder the assumptio that security prices follow radom walk, we look at price versus differet movig averages.
Section 3.3 Exercises Part A Simplify the following. 1. (3m 2 ) 5 2. x 7 x 11
 5 2. x 7 x 11") 123 Sectio 3.3 Exercises Part A Simplify the followig. 1. (3m 2 ) 5 2. x 7 x 11 3. f 12 4. t 8 t 5 f 5 5. 3-4 6. 3x 7 4x 7. 3z 5 12z 3 8. 17 0 9. (g 8 ) -2 10. 14d 3 21d 7 11. (2m 2 5 g 8 ) 7 12. 5x 2
123 Sectio 3.3 Exercises Part A Simplify the followig. 1. (3m 2 ) 5 2. x 7 x 11 3. f 12 4. t 8 t 5 f 5 5. 3-4 6. 3x 7 4x 7. 3z 5 12z 3 8. 17 0 9. (g 8 ) -2 10. 14d 3 21d 7 11. (2m 2 5 g 8 ) 7 12. 5x 2
SCHOOL OF ACCOUNTING AND BUSINESS BSc. (APPLIED ACCOUNTING) GENERAL / SPECIAL DEGREE PROGRAMME
 GENERAL / SPECIAL DEGREE PROGRAMME") All Right Reserved No. of Pages - 10 No of Questios - 08 SCHOOL OF ACCOUNTING AND BUSINESS BSc. (APPLIED ACCOUNTING) GENERAL / SPECIAL DEGREE PROGRAMME YEAR I SEMESTER I (Group B) END SEMESTER EXAMINATION
All Right Reserved No. of Pages - 10 No of Questios - 08 SCHOOL OF ACCOUNTING AND BUSINESS BSc. (APPLIED ACCOUNTING) GENERAL / SPECIAL DEGREE PROGRAMME YEAR I SEMESTER I (Group B) END SEMESTER EXAMINATION
A point estimate is the value of a statistic that estimates the value of a parameter.
 Chapter 9 Estimatig the Value of a Parameter Chapter 9.1 Estimatig a Populatio Proportio Objective A : Poit Estimate A poit estimate is the value of a statistic that estimates the value of a parameter.
APPLICATION OF GEOMETRIC SEQUENCES AND SERIES: COMPOUND INTEREST AND ANNUITIES
 APPLICATION OF GEOMETRIC SEQUENCES AND SERIES: COMPOUND INTEREST AND ANNUITIES Example: Brado s Problem Brado, who is ow sixtee, would like to be a poker champio some day. At the age of twety-oe, he would
Notes on Expected Revenue from Auctions
 Notes o Epected Reveue from Auctios Professor Bergstrom These otes spell out some of the mathematical details about first ad secod price sealed bid auctios that were discussed i Thursday s lecture You
Appendix 1 to Chapter 5
 Appedix 1 to Chapter 5 Models of Asset Pricig I Chapter 4, we saw that the retur o a asset (such as a bod) measures how much we gai from holdig that asset. Whe we make a decisio to buy a asset, we are
Chapter 8: Estimation of Mean & Proportion. Introduction
 Chapter 8: Estimatio of Mea & Proportio 8.1 Estimatio, Poit Estimate, ad Iterval Estimate 8.2 Estimatio of a Populatio Mea: σ Kow 8.3 Estimatio of a Populatio Mea: σ Not Kow 8.4 Estimatio of a Populatio
of Asset Pricing R e = expected return
 Appedix 1 to Chapter 5 Models of Asset Pricig EXPECTED RETURN I Chapter 4, we saw that the retur o a asset (such as a bod) measures how much we gai from holdig that asset. Whe we make a decisio to buy
BIOSTATS 540 Fall Estimation Page 1 of 72. Unit 6. Estimation. Use at least twelve observations in constructing a confidence interval
 BIOSTATS 540 Fall 015 6. Estimatio Page 1 of 7 Uit 6. Estimatio Use at least twelve observatios i costructig a cofidece iterval - Gerald va Belle What is the mea of the blood pressures of all the studets
1 Estimating the uncertainty attached to a sample mean: s 2 vs.
 Political Sciece 100a/200a Fall 2001 Cofidece itervals ad hypothesis testig, Part I 1 1 Estimatig the ucertaity attached to a sample mea: s 2 vs. σ 2 Recall the problem of descriptive iferece: We wat to
5 Statistical Inference
 5 Statistical Iferece 5.1 Trasitio from Probability Theory to Statistical Iferece 1. We have ow more or less fiished the probability sectio of the course - we ow tur attetio to statistical iferece. I statistical
of Asset Pricing APPENDIX 1 TO CHAPTER EXPECTED RETURN APPLICATION Expected Return
 APPENDIX 1 TO CHAPTER 5 Models of Asset Pricig I Chapter 4, we saw that the retur o a asset (such as a bod) measures how much we gai from holdig that asset. Whe we make a decisio to buy a asset, we are
Class Sessions 2, 3, and 4: The Time Value of Money
 Class Sessios 2, 3, ad 4: The Time Value of Moey Associated Readig: Text Chapter 3 ad your calculator s maual. Summary Moey is a promise by a Bak to pay to the Bearer o demad a sum of well, moey! Oe risk
ISBN Copyright 2015 The Continental Press, Inc.
 TABLE OF CONTENTS Itroductio 3 Format of Books 4 Suggestios for Use 7 Aotated Aswer Key ad Extesio Activities 9 Reproducible Tool Set 183 ISBN 978-0-8454-7897-4 Copyright 2015 The Cotietal Press, Ic. Exceptig
Binomial Model. Stock Price Dynamics. The Key Idea Riskless Hedge
 Biomial Model Stock Price Dyamics The value of a optio at maturity depeds o the price of the uderlyig stock at maturity. The value of the optio today depeds o the expected value of the optio at maturity
Sampling Distributions & Estimators
 API-209 TF Sessio 2 Teddy Svoroos September 18, 2015 Samplig Distributios & Estimators I. Estimators The Importace of Samplig Radomly Three Properties of Estimators 1. Ubiased 2. Cosistet 3. Efficiet I
We learned: $100 cash today is preferred over $100 a year from now
 Recap from Last Week Time Value of Moey We leared: $ cash today is preferred over $ a year from ow there is time value of moey i the form of willigess of baks, busiesses, ad people to pay iterest for its
Parametric Density Estimation: Maximum Likelihood Estimation
 Parametric Desity stimatio: Maimum Likelihood stimatio C6 Today Itroductio to desity estimatio Maimum Likelihood stimatio Itroducto Bayesia Decisio Theory i previous lectures tells us how to desig a optimal
DESCRIPTION OF MATHEMATICAL MODELS USED IN RATING ACTIVITIES
 July 2014, Frakfurt am Mai. DESCRIPTION OF MATHEMATICAL MODELS USED IN RATING ACTIVITIES This documet outlies priciples ad key assumptios uderlyig the ratig models ad methodologies of Ratig-Agetur Expert
DOWLING COLLEGE: School of Education Department of Educational Administration, Leadership, and Technology
 1. Doe 2. Doe 3. Doe 4. Doe DOWLING COLLEGE: School of Educatio Departmet of Educatioal Admiistratio, Leadership, ad Techology 5. Calculate meas ad stadard deviatios for per capita icome ad total reveues
CHAPTER 8: CONFIDENCE INTERVAL ESTIMATES for Means and Proportions
 CHAPTER 8: CONFIDENCE INTERVAL ESTIMATES for Meas ad Proportios Itroductio: I this chapter we wat to fid out the value of a parameter for a populatio. We do t kow the value of this parameter for the etire
Department of Mathematics, S.R.K.R. Engineering College, Bhimavaram, A.P., India 2
 Skewess Corrected Cotrol charts for two Iverted Models R. Subba Rao* 1, Pushpa Latha Mamidi 2, M.S. Ravi Kumar 3 1 Departmet of Mathematics, S.R.K.R. Egieerig College, Bhimavaram, A.P., Idia 2 Departmet
MATH : EXAM 2 REVIEW. A = P 1 + AP R ) ny
 ny") MATH 1030-008: EXAM 2 REVIEW Origially, I was havig you all memorize the basic compoud iterest formula. I ow wat you to memorize the geeral compoud iterest formula. This formula, whe = 1, is the same as
MATH 1030-008: EXAM 2 REVIEW Origially, I was havig you all memorize the basic compoud iterest formula. I ow wat you to memorize the geeral compoud iterest formula. This formula, whe = 1, is the same as
CHAPTER 8: CONFIDENCE INTERVAL ESTIMATES for Means and Proportions
 CHAPTER 8: CONFIDENCE INTERVAL ESTIMATES for Meas ad Proportios Itroductio: We wat to kow the value of a parameter for a populatio. We do t kow the value of this parameter for the etire populatio because
Chapter 4 - Consumer. Household Demand and Supply. Solving the max-utility problem. Working out consumer responses. The response function
 Almost essetial Cosumer: Optimisatio Chapter 4 - Cosumer Osa 2: Household ad supply Cosumer: Welfare Useful, but optioal Firm: Optimisatio Household Demad ad Supply MICROECONOMICS Priciples ad Aalysis
18.S096 Problem Set 5 Fall 2013 Volatility Modeling Due Date: 10/29/2013
 18.S096 Problem Set 5 Fall 2013 Volatility Modelig Due Date: 10/29/2013 1. Sample Estimators of Diffusio Process Volatility ad Drift Let {X t } be the price of a fiacial security that follows a geometric
Unbiased estimators Estimators
 19 Ubiased estimators I Chapter 17 we saw that a dataset ca be modeled as a realizatio of a radom sample from a probability distributio ad that quatities of iterest correspod to features of the model distributio.
CAPITAL PROJECT SCREENING AND SELECTION
 CAPITAL PROJECT SCREEIG AD SELECTIO Before studyig the three measures of ivestmet attractiveess, we will review a simple method that is commoly used to scree capital ivestmets. Oe of the primary cocers
SOLUTION QUANTITATIVE TOOLS IN BUSINESS NOV 2011
 SOLUTION QUANTITATIVE TOOLS IN BUSINESS NOV 0 (i) Populatio: Collectio of all possible idividual uits (persos, objects, experimetal outcome whose characteristics are to be studied) Sample: A part of populatio
ii. Interval estimation:
 1 Types of estimatio: i. Poit estimatio: Example (1) Cosider the sample observatios 17,3,5,1,18,6,16,10 X 8 X i i1 8 17 3 5 118 6 16 10 8 116 8 14.5 14.5 is a poit estimate for usig the estimator X ad
Confidence Intervals Introduction
 Cofidece Itervals Itroductio A poit estimate provides o iformatio about the precisio ad reliability of estimatio. For example, the sample mea X is a poit estimate of the populatio mea μ but because of
x satisfying all regularity conditions. Then
 AMS570.01 Practice Midterm Exam Sprig, 018 Name: ID: Sigature: Istructio: This is a close book exam. You are allowed oe-page 8x11 formula sheet (-sided). No cellphoe or calculator or computer is allowed.
LESSON #66 - SEQUENCES COMMON CORE ALGEBRA II
 LESSON #66 - SEQUENCES COMMON CORE ALGEBRA II I Commo Core Algebra I, you studied sequeces, which are ordered lists of umbers. Sequeces are extremely importat i mathematics, both theoretical ad applied.
I. Measures of Central Tendency: -Allow us to summarize an entire data set with a single value (the midpoint).
.") I. Meaure of Cetral Tedecy: -Allow u to ummarize a etire data et with a igle value (the midpoit.. Mode : The value (core that occur mot ofte i a data et. -Mo x Sample mode -Mo Populatio mode. Media : the
I. Meaure of Cetral Tedecy: -Allow u to ummarize a etire data et with a igle value (the midpoit.. Mode : The value (core that occur mot ofte i a data et. -Mo x Sample mode -Mo Populatio mode. Media : the
Setting up records for customers and suppliers
 3 Settig up records for customers ad suppliers this chapter covers... The term Customers meas people to whom a busiess sells o credit. I other words, the goods or services are supplied straightaway ad
4.5 Generalized likelihood ratio test
 4.5 Geeralized likelihood ratio test A assumptio that is used i the Athlete Biological Passport is that haemoglobi varies equally i all athletes. We wish to test this assumptio o a sample of k athletes.
When you click on Unit V in your course, you will see a TO DO LIST to assist you in starting your course.
 UNIT V STUDY GUIDE Percet Notatio Course Learig Outcomes for Uit V Upo completio of this uit, studets should be able to: 1. Write three kids of otatio for a percet. 2. Covert betwee percet otatio ad decimal
A New Constructive Proof of Graham's Theorem and More New Classes of Functionally Complete Functions
 A New Costructive Proof of Graham's Theorem ad More New Classes of Fuctioally Complete Fuctios Azhou Yag, Ph.D. Zhu-qi Lu, Ph.D. Abstract A -valued two-variable truth fuctio is called fuctioally complete,
0.1 Valuation Formula:
 0. Valuatio Formula: 0.. Case of Geeral Trees: q = er S S S 3 S q = er S S 4 S 5 S 4 q 3 = er S 3 S 6 S 7 S 6 Therefore, f (3) = e r [q 3 f (7) + ( q 3 ) f (6)] f () = e r [q f (5) + ( q ) f (4)] = f ()
1. Suppose X is a variable that follows the normal distribution with known standard deviation σ = 0.3 but unknown mean µ.
 Chapter 9 Exercises Suppose X is a variable that follows the ormal distributio with kow stadard deviatio σ = 03 but ukow mea µ (a) Costruct a 95% cofidece iterval for µ if a radom sample of = 6 observatios
Chpt 5. Discrete Probability Distributions. 5-3 Mean, Variance, Standard Deviation, and Expectation
 Chpt 5 Discrete Probability Distributios 5-3 Mea, Variace, Stadard Deviatio, ad Expectatio 1/23 Homework p252 Applyig the Cocepts Exercises p253 1-19 2/23 Objective Fid the mea, variace, stadard deviatio,
The material in this chapter is motivated by Experiment 9.
 Chapter 5 Optimal Auctios The material i this chapter is motivated by Experimet 9. We wish to aalyze the decisio of a seller who sets a reserve price whe auctioig off a item to a group of bidders. We begi
ECON 5350 Class Notes Maximum Likelihood Estimation
 ECON 5350 Class Notes Maximum Likelihood Estimatio 1 Maximum Likelihood Estimatio Example #1. Cosider the radom sample {X 1 = 0.5, X 2 = 2.0, X 3 = 10.0, X 4 = 1.5, X 5 = 7.0} geerated from a expoetial
INTERVAL GAMES. and player 2 selects 1, then player 2 would give player 1 a payoff of, 1) = 0.
 = 0.") INTERVAL GAMES ANTHONY MENDES Let I ad I 2 be itervals of real umbers. A iterval game is played i this way: player secretly selects x I ad player 2 secretly ad idepedetly selects y I 2. After x ad y are
INTERVAL GAMES ANTHONY MENDES Let I ad I 2 be itervals of real umbers. A iterval game is played i this way: player secretly selects x I ad player 2 secretly ad idepedetly selects y I 2. After x ad y are
Chapter 10 - Lecture 2 The independent two sample t-test and. confidence interval
 Assumptios Idepedet Samples - ukow σ 1, σ - 30 or m 30 - Upooled case Idepedet Samples - ukow σ 1, σ - 30 or m 30 - Pooled case Idepedet samples - Pooled variace - Large samples Chapter 10 - Lecture The
Lecture 5 Point Es/mator and Sampling Distribu/on
 Lecture 5 Poit Es/mator ad Samplig Distribu/o Fall 03 Prof. Yao Xie, yao.xie@isye.gatech.edu H. Milto Stewart School of Idustrial Systems & Egieerig Georgia Tech Road map Poit Es/ma/o Cofidece Iterval
r i = a i + b i f b i = Cov[r i, f] The only parameters to be estimated for this model are a i 's, b i 's, σe 2 i
![r i = a i + b i f b i = Cov[r i, f] The only parameters to be estimated for this model are a i 's, b i 's, σe 2 i](/thumbs/77/75183590.jpg "r i = a i + b i f b i = Cov[r i, f] The only parameters to be estimated for this model are a i 's, b i 's, σe 2 i") The iformatio required by the mea-variace approach is substatial whe the umber of assets is large; there are mea values, variaces, ad )/2 covariaces - a total of 2 + )/2 parameters. Sigle-factor model:
The iformatio required by the mea-variace approach is substatial whe the umber of assets is large; there are mea values, variaces, ad )/2 covariaces - a total of 2 + )/2 parameters. Sigle-factor model:
Overlapping Generations
 Eco. 53a all 996 C. Sims. troductio Overlappig Geeratios We wat to study how asset markets allow idividuals, motivated by the eed to provide icome for their retiremet years, to fiace capital accumulatio
1 The Power of Compounding
 1 The Power of Compoudig 1.1 Simple vs Compoud Iterest You deposit $1,000 i a bak that pays 5% iterest each year. At the ed of the year you will have eared $50. The bak seds you a check for $50 dollars.
Annual compounding, revisited
 Sectio 1.: No-aual compouded iterest MATH 105: Cotemporary Mathematics Uiversity of Louisville August 2, 2017 Compoudig geeralized 2 / 15 Aual compoudig, revisited The idea behid aual compoudig is that
Topic 14: Maximum Likelihood Estimation
 Toic 4: November, 009 As before, we begi with a samle X = (X,, X of radom variables chose accordig to oe of a family of robabilities P θ I additio, f(x θ, x = (x,, x will be used to deote the desity fuctio
Online appendices from Counterparty Risk and Credit Value Adjustment a continuing challenge for global financial markets by Jon Gregory
 Olie appedices from Couterparty Risk ad Credit Value Adjustmet a APPENDIX 8A: Formulas for EE, PFE ad EPE for a ormal distributio Cosider a ormal distributio with mea (expected future value) ad stadard
Monetary Economics: Problem Set #5 Solutions
 Moetary Ecoomics oblem Set #5 Moetary Ecoomics: oblem Set #5 Solutios This problem set is marked out of 1 poits. The weight give to each part is idicated below. Please cotact me asap if you have ay questios.
Calculation of the Annual Equivalent Rate (AER)
") Appedix to Code of Coduct for the Advertisig of Iterest Bearig Accouts. (31/1/0) Calculatio of the Aual Equivalet Rate (AER) a) The most geeral case of the calculatio is the rate of iterest which, if applied
Appedix to Code of Coduct for the Advertisig of Iterest Bearig Accouts. (31/1/0) Calculatio of the Aual Equivalet Rate (AER) a) The most geeral case of the calculatio is the rate of iterest which, if applied
Chapter 8 Interval Estimation. Estimation Concepts. General Form of a Confidence Interval
 Chapter 8 Iterval Estimatio Estimatio Cocepts Usually ca't take a cesus, so we must make decisios based o sample data It imperative that we take the risk of samplig error ito accout whe we iterpret sample
CAPITAL ASSET PRICING MODEL
 CAPITAL ASSET PRICING MODEL RETURN. Retur i respect of a observatio is give by the followig formula R = (P P 0 ) + D P 0 Where R = Retur from the ivestmet durig this period P 0 = Curret market price P
 43. A 000 par value 5-year bod with 8.0% semiaual coupos was bought to yield 7.5% covertible semiaually. Determie the amout of premium amortized i the 6 th coupo paymet. (A).00 (B).08 (C).5 (D).5 (E).34
CHAPTER 8 CONFIDENCE INTERVALS
 CHAPTER 8 CONFIDENCE INTERVALS Cofidece Itervals is our first topic i iferetial statistics. I this chapter, we use sample data to estimate a ukow populatio parameter: either populatio mea (µ) or populatio