Financial Times Series. Lecture 6
|
|
|
- Claire Preston
- 5 years ago
- Views:
Transcription
1 Financial Times Series Lecture 6
2 Extensions of the GARCH There are numerous extensions of the GARCH Among the more well known are EGARCH (Nelson 1991) and GJR (Glosten et al 1993) Both models allow for volatility skewness or leverage effects and are available in matlab econometrics
3 EGARCH E means exponential and the model for the conditional variance may be written lnσ 2 t = ω + α r t 1 + γr t βlnσ σ t 1 t 1 The parameter γ accounts for skewness We fit the model to the N225 data without the extreme event

4 EGARCH vs. GARCH

5 Devolatization with EGARCH p-value of Ljung-Box is
6 GJR The Glosten-Jagannathan-Runkle GARCH may be written as σ t 2 = ω + α + φi t 1 r t βσ t 1 2 where I t 1 = 0 if r t 1 0 and I t 1 = 1 if r t 1 < 0, so that the parameter φ accounts for skewness
7 GJR philosophy Bad news gives higher volatility than good news Captures leverage effect

8 GJR fit (N225 without extreme event)

9 Devolatization with GJR p-value for Ljung-Box is
10 Comparison For the N225 without the tsunami there does not seem to be an improvement, at least not in devolatizing properties, using the more advanced models On the other hand, we have not yet used a statistical test procedure to compare the models Below we try the three models for NASDAQ data and look at a statistical test for comparing the models

11 NASDAQ returns
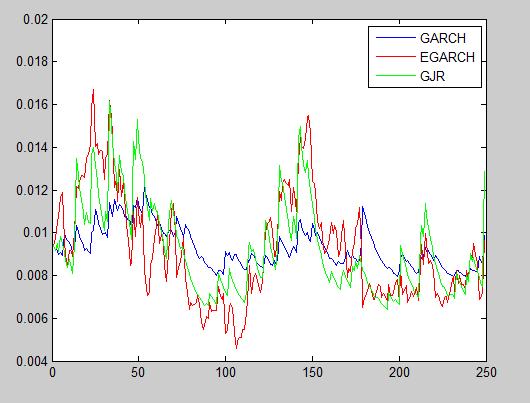
12 Volatility fits
13 Devolatization of NASDAQ Ljung-Box p-value for GARCH is Ljung-Box p-value for EGARCH is Ljung-Box p-value for GJR is
14 Evaluating predictions We may us squared returns as a proxy and compute MSE:s as 1 T T t=1 r t 2 σ t 2 2 For the NASDAQ data, we get , and for the GARCH, EGARCH and GJR respectively
15 Evaluating predictions Another way of evaluating predictions, again with squared returns as proxy, is to regress squared returns on squared volatility predictions and hope for a slope close to one and R 2 1 For the GARCH, EGARCH and GJR we have slopes , and and R-squares , and which is not so satistisfactory, however it can be shown theoretically that for a GARCH(1,1) that R-squares close to one are highly unlikely
16 Squared returns is a noisy proxy What if we instead use realized variance over 30 days and compare to 30 day squared volatility forecasts? The 30 day realized variance for is given by t+29 i=t r i 2
17 Squared returns is a noisy proxy Our 30 day volatility predictions will just be the sums of the daily volatility estimates of the past 30 days Using the 30 day framework, we get, for the GARCH, EGARCH and GJR slopes 2.37(!), and 1.06 and R-squares , and which is more satisfactory, but the slope for the GARCH is not reasonable
18 Diebold-Mariano If we choose a loss function and a proxy, there is a test proposed by Diebold and Mariano (1995) for evaluating if one prediction method is significantly better than another The null hypothesis is that both methods have the same accuracy
19 Diebold-Mariano Define d t = L ε At L ε Bt where L denotes the loss function ε At and ε Bt denote the prediction errors from method A and B, respectively The test statistic is d LRV/T ~N(0,1) where LRV = Var d t + 2 Cov d t, d t j j=1
20 Diebold-Mariano Note that you have to keep track of which error is to the left and to the right of the minus sign in order to tell which method is better A DM test using L x = x 2, i.e. squared loss, is available at matlab central It also accounts for the length of the forecast horizon
21 Diebold-Mariano For our three models of 30 day NASDAQ volatility, the observed values of test statistic are for GJR vs. EGARCH, for GJR vs. GARCH and for EGARCH vs. GARCH. So, p-values are , and At 0.05 signicance level, no model is significantly better than the other, but of course this decision depends on the choice of loss function
22 Applications of volatility models Depending on their predictive ability, volatility models may be useful in option pricing and risk management We may replace the constant volatility in B-S with time series volatility and simulate price trajectories of underlying assets in order to price options
23 Option pricing Under a GARCH model we simulate stock prices starting from P 0 up to a terminal price P T using P t = P t 1 exp r 0.5σ t 2 + ε t where r is the risk-free interest rate, ε t = σ t z t for i.i.d. z t ~N(0,1) and σ t 2 = ω + αε t βσ t 1 2
24 Option pricing Simulating lots of paths we may price options using averages of pay-off functions Assume, for example, that we want to price an asian call option with pay-off max 1 T T t=1 P t K, 0
25 Option pricing Using N price paths, the simulated price will be given by e rt 1 N N j=1 max 1 T T t=1 P jt K, 0
26 GARCH vs. B-S prices Setting ω = , α =, 0.05 β = 0.85, P 0 = 50, T = 30, r = 0.015/365, the B-S variance equal to the unconditional variance of the GARCH and using paths yields Strike K Black-Scholes GARCH
27 For more on GARCH in pricing Check out the work of Jin-Chuan Duan Matlab codes available!
28 VaR One of the most common notions in financial risk management is that of Value at Risk (VaR) VaR may be used to determine the amount of regulatory capital to set aside for different types of risks For a given collection of assets we may define the loss variable L and VaR as VaR α = inf x: P L > x 1 α
29 VaR Typically α = 0.95 or α = 0.99 The distribution function of the loss variable is typically not known, but we could simulate losses under some assumptions or use time-series models We will focus on VaR for log-returns r t+1 starting from the information available at time t
30 VaR and B-S In the Black-Scholes framework, we have r t+1 ~N μ t+1, σ t+1 so that VaR α = μ t+1 + σ t+1 z α Note that VaR expressed in this way is an (approximate) percentage and to state VaR in dollar amount the percentage should be multiplied with dollar amount outstanding
31 VaR and RiskMetrics In the RiskMetrics framework it is assumed that r t F t 1 ~N 0, σ t with (IGARCH) σ t 2 = 1 λ r t λσ t 1 2 This gives the time scaling property that the kday VaR is k times the one-day VaR
32 RiskMetrics example Under the RiskMetrics model the α = 0.95 one-day VaR at time t is just 1.65σ t+1 Using the scaling property the α = 0.95 k-day VaR is 1.65 kσ t+1 If the zero mean property or IGARCH assumption does not hold the time-scaling property will also fail to hold
33 RiskMetrics Another appealing property of the RiskMetrics framework is that if VaR 1 and VaR 2 are the values at risk for two positions under the special IGARCH model, it holds that the total value at risk is VaR = VaR VaR ρ 12 VaR 1 VaR 2 where ρ 12 is the correlation between the returns
34 Example Fitting the RiskMetrics model to OMXS30 data (last year) yields a L-B p-value of for devolatized returns For N225 (last year) we get a L-B p-value of , so we try compute VaR for these data

35 RiskMetrics one day 95% VaR
36 VaR time series model Assuming a general time series model, we have r t = φ 0 + p i=1 φ i r t i + a t a t = σ t z t q j=1 θ j a t j u σ t 2 = ω + α i a t i 2 i=1 v + β i σ t i 2 i=1
37 VaR time series model We get one-day ahead predictions as rt(1) = φ 0 + φ i r t+1 i p i=1 q j=1 θ j a t+1 j σ t 2 (1) = ω + α i a t+1 i 2 u i=1 v + β i σ t+1 i 2 i=1
38 VaR time series model If we assume z t ~N(0,1) and hence r t+1 F t ~N rt 1, σ t (1) we may get the α = 0.95 one-day VaR at time t as rt σ t (1) For an arbitrary WN-distribution, F, we have rt 1 + F 1 (0.05)σ t (1)
, we get (OMXS30")
39 VaR time series model With z t ~N(0,1), we get (OMXS30 data)
40 Expected Shortfall Given that the VaR is exceeded, one may wonder how bad this can be The average of VaR α :s, where 0 < α < α is the expected shortfall corresponding to VaR α ES α = 1 α α 1 VaR α dα
41 Numerical approximation For an arbitrary α we may approximate ES with e.g., 1 N N i=1 VaR α+ 1 α i 1 /N
42 ES for GARCH based VaR with normal WN Here α = 0,95 and N = 5000

43 ES for GARCH based VaR with t_8 WN Here α = 0,95 and N = 5000
Financial Times Series. Lecture 8
 Financial Times Series Lecture 8 Nobel Prize Robert Engle got the Nobel Prize in Economics in 2003 for the ARCH model which he introduced in 1982 It turns out that in many applications there will be many
Amath 546/Econ 589 Univariate GARCH Models: Advanced Topics
 Amath 546/Econ 589 Univariate GARCH Models: Advanced Topics Eric Zivot April 29, 2013 Lecture Outline The Leverage Effect Asymmetric GARCH Models Forecasts from Asymmetric GARCH Models GARCH Models with
Financial Econometrics
 Financial Econometrics Volatility Gerald P. Dwyer Trinity College, Dublin January 2013 GPD (TCD) Volatility 01/13 1 / 37 Squared log returns for CRSP daily GPD (TCD) Volatility 01/13 2 / 37 Absolute value
Conditional Heteroscedasticity
 1 Conditional Heteroscedasticity May 30, 2010 Junhui Qian 1 Introduction ARMA(p,q) models dictate that the conditional mean of a time series depends on past observations of the time series and the past
The University of Chicago, Booth School of Business Business 41202, Spring Quarter 2009, Mr. Ruey S. Tsay. Solutions to Final Exam
 The University of Chicago, Booth School of Business Business 41202, Spring Quarter 2009, Mr. Ruey S. Tsay Solutions to Final Exam Problem A: (42 pts) Answer briefly the following questions. 1. Questions
Graduate School of Business, University of Chicago Business 41202, Spring Quarter 2007, Mr. Ruey S. Tsay. Solutions to Final Exam
 Graduate School of Business, University of Chicago Business 41202, Spring Quarter 2007, Mr. Ruey S. Tsay Solutions to Final Exam Problem A: (30 pts) Answer briefly the following questions. 1. Suppose that
ARCH and GARCH models
 ARCH and GARCH models Fulvio Corsi SNS Pisa 5 Dic 2011 Fulvio Corsi ARCH and () GARCH models SNS Pisa 5 Dic 2011 1 / 21 Asset prices S&P 500 index from 1982 to 2009 1600 1400 1200 1000 800 600 400 200
The University of Chicago, Booth School of Business Business 41202, Spring Quarter 2017, Mr. Ruey S. Tsay. Solutions to Final Exam
 The University of Chicago, Booth School of Business Business 41202, Spring Quarter 2017, Mr. Ruey S. Tsay Solutions to Final Exam Problem A: (40 points) Answer briefly the following questions. 1. Describe
Financial Econometrics Jeffrey R. Russell. Midterm 2014 Suggested Solutions. TA: B. B. Deng
 Financial Econometrics Jeffrey R. Russell Midterm 2014 Suggested Solutions TA: B. B. Deng Unless otherwise stated, e t is iid N(0,s 2 ) 1. (12 points) Consider the three series y1, y2, y3, and y4. Match
Indian Institute of Management Calcutta. Working Paper Series. WPS No. 797 March Implied Volatility and Predictability of GARCH Models
 Indian Institute of Management Calcutta Working Paper Series WPS No. 797 March 2017 Implied Volatility and Predictability of GARCH Models Vivek Rajvanshi Assistant Professor, Indian Institute of Management
Financial Econometrics Lecture 5: Modelling Volatility and Correlation
 Financial Econometrics Lecture 5: Modelling Volatility and Correlation Dayong Zhang Research Institute of Economics and Management Autumn, 2011 Learning Outcomes Discuss the special features of financial
FINANCIAL ECONOMETRICS AND EMPIRICAL FINANCE MODULE 2
 MSc. Finance/CLEFIN 2017/2018 Edition FINANCIAL ECONOMETRICS AND EMPIRICAL FINANCE MODULE 2 Midterm Exam Solutions June 2018 Time Allowed: 1 hour and 15 minutes Please answer all the questions by writing
12. Conditional heteroscedastic models (ARCH) MA6622, Ernesto Mordecki, CityU, HK, 2006.
 MA6622, Ernesto Mordecki, CityU, HK, 2006.") 12. Conditional heteroscedastic models (ARCH) MA6622, Ernesto Mordecki, CityU, HK, 2006. References for this Lecture: Robert F. Engle. Autoregressive Conditional Heteroscedasticity with Estimates of Variance
12. Conditional heteroscedastic models (ARCH) MA6622, Ernesto Mordecki, CityU, HK, 2006. References for this Lecture: Robert F. Engle. Autoregressive Conditional Heteroscedasticity with Estimates of Variance
Market Risk Prediction under Long Memory: When VaR is Higher than Expected
 Market Risk Prediction under Long Memory: When VaR is Higher than Expected Harald Kinateder Niklas Wagner DekaBank Chair in Finance and Financial Control Passau University 19th International AFIR Colloquium
Booth School of Business, University of Chicago Business 41202, Spring Quarter 2010, Mr. Ruey S. Tsay. Solutions to Midterm
 Booth School of Business, University of Chicago Business 41202, Spring Quarter 2010, Mr. Ruey S. Tsay Solutions to Midterm Problem A: (30 pts) Answer briefly the following questions. Each question has
FINANCIAL ECONOMETRICS PROF. MASSIMO GUIDOLIN
 Massimo Guidolin Massimo.Guidolin@unibocconi.it Dept. of Finance FINANCIAL ECONOMETRICS PROF. MASSIMO GUIDOLIN SECOND PART, LECTURE 1: VOLATILITY MODELS ARCH AND GARCH OVERVIEW 1) Stepwise Distribution
Volatility Forecasting Performance at Multiple Horizons
 Volatility Forecasting Performance at Multiple Horizons For the degree of Master of Science in Financial Economics at Erasmus School of Economics, Erasmus University Rotterdam Author: Sharon Vijn Supervisor:
Booth School of Business, University of Chicago Business 41202, Spring Quarter 2012, Mr. Ruey S. Tsay. Solutions to Midterm
 Booth School of Business, University of Chicago Business 41202, Spring Quarter 2012, Mr. Ruey S. Tsay Solutions to Midterm Problem A: (34 pts) Answer briefly the following questions. Each question has
Booth School of Business, University of Chicago Business 41202, Spring Quarter 2016, Mr. Ruey S. Tsay. Solutions to Midterm
 Booth School of Business, University of Chicago Business 41202, Spring Quarter 2016, Mr. Ruey S. Tsay Solutions to Midterm Problem A: (30 pts) Answer briefly the following questions. Each question has
Financial Risk Management
 Financial Risk Management Professor: Thierry Roncalli Evry University Assistant: Enareta Kurtbegu Evry University Tutorial exercices #4 1 Correlation and copulas 1. The bivariate Gaussian copula is given
The University of Chicago, Booth School of Business Business 41202, Spring Quarter 2011, Mr. Ruey S. Tsay. Solutions to Final Exam.
 The University of Chicago, Booth School of Business Business 41202, Spring Quarter 2011, Mr. Ruey S. Tsay Solutions to Final Exam Problem A: (32 pts) Answer briefly the following questions. 1. Suppose
Booth School of Business, University of Chicago Business 41202, Spring Quarter 2014, Mr. Ruey S. Tsay. Solutions to Midterm
 Booth School of Business, University of Chicago Business 41202, Spring Quarter 2014, Mr. Ruey S. Tsay Solutions to Midterm Problem A: (30 pts) Answer briefly the following questions. Each question has
Forecasting Value at Risk in the Swedish stock market an investigation of GARCH volatility models
 Forecasting Value at Risk in the Swedish stock market an investigation of GARCH volatility models Joel Nilsson Bachelor thesis Supervisor: Lars Forsberg Spring 2015 Abstract The purpose of this thesis
Assicurazioni Generali: An Option Pricing Case with NAGARCH
 Assicurazioni Generali: An Option Pricing Case with NAGARCH Assicurazioni Generali: Business Snapshot Find our latest analyses and trade ideas on bsic.it Assicurazioni Generali SpA is an Italy-based insurance
Research Article The Volatility of the Index of Shanghai Stock Market Research Based on ARCH and Its Extended Forms
 Discrete Dynamics in Nature and Society Volume 2009, Article ID 743685, 9 pages doi:10.1155/2009/743685 Research Article The Volatility of the Index of Shanghai Stock Market Research Based on ARCH and
Testing the volatility term structure using option hedging criteria
 esting the volatility term structure using option hedging criteria March 1998 Robert F. Engle Joshua V. Rosenberg Department of Economics Department of Finance University of California, San Diego NYU -
The University of Chicago, Booth School of Business Business 41202, Spring Quarter 2010, Mr. Ruey S. Tsay Solutions to Final Exam
 The University of Chicago, Booth School of Business Business 410, Spring Quarter 010, Mr. Ruey S. Tsay Solutions to Final Exam Problem A: (4 pts) Answer briefly the following questions. 1. Questions 1
Lecture 5a: ARCH Models
 Lecture 5a: ARCH Models 1 2 Big Picture 1. We use ARMA model for the conditional mean 2. We use ARCH model for the conditional variance 3. ARMA and ARCH model can be used together to describe both conditional
Forecasting the Volatility in Financial Assets using Conditional Variance Models
 LUND UNIVERSITY MASTER S THESIS Forecasting the Volatility in Financial Assets using Conditional Variance Models Authors: Hugo Hultman Jesper Swanson Supervisor: Dag Rydorff DEPARTMENT OF ECONOMICS SEMINAR
GARCH Options in Incomplete Markets
 GARCH Options in Incomplete Markets Giovanni Barone-Adesi 1, Robert Engle 2, and Loriano Mancini 1 1 Institute of Finance, University of Lugano, Via Buffi 13, CH-69 Lugano Switzerland Tel: +41 ()91 912
Financial Econometrics
 Financial Econometrics Value at Risk Gerald P. Dwyer Trinity College, Dublin January 2016 Outline 1 Value at Risk Introduction VaR RiskMetrics TM Summary Risk What do we mean by risk? Dictionary: possibility
GARCH vs. Traditional Methods of Estimating Value-at-Risk (VaR) of the Philippine Bond Market
 of the Philippine Bond Market") GARCH vs. Traditional Methods of Estimating Value-at-Risk (VaR) of the Philippine Bond Market INTRODUCTION Value-at-Risk (VaR) Value-at-Risk (VaR) summarizes the worst loss over a target horizon that
GARCH vs. Traditional Methods of Estimating Value-at-Risk (VaR) of the Philippine Bond Market INTRODUCTION Value-at-Risk (VaR) Value-at-Risk (VaR) summarizes the worst loss over a target horizon that
Forecasting Volatility of Hang Seng Index and its Application on Reserving for Investment Guarantees. Herbert Tak-wah Chan Derrick Wing-hong Fung
 Forecasting Volatility of Hang Seng Index and its Application on Reserving for Investment Guarantees Herbert Tak-wah Chan Derrick Wing-hong Fung This presentation represents the view of the presenters
GARCH Models. Instructor: G. William Schwert
 APS 425 Fall 2015 GARCH Models Instructor: G. William Schwert 585-275-2470 schwert@schwert.ssb.rochester.edu Autocorrelated Heteroskedasticity Suppose you have regression residuals Mean = 0, not autocorrelated
Lecture 5: Univariate Volatility
 Lecture 5: Univariate Volatility Modellig, ARCH and GARCH Prof. Massimo Guidolin 20192 Financial Econometrics Spring 2015 Overview Stepwise Distribution Modeling Approach Three Key Facts to Remember Volatility
Volatility Analysis of Nepalese Stock Market
 The Journal of Nepalese Business Studies Vol. V No. 1 Dec. 008 Volatility Analysis of Nepalese Stock Market Surya Bahadur G.C. Abstract Modeling and forecasting volatility of capital markets has been important
Short-selling constraints and stock-return volatility: empirical evidence from the German stock market
 Short-selling constraints and stock-return volatility: empirical evidence from the German stock market Martin Bohl, Gerrit Reher, Bernd Wilfling Westfälische Wilhelms-Universität Münster Contents 1. Introduction
Forecasting Volatility of USD/MUR Exchange Rate using a GARCH (1,1) model with GED and Student s-t errors
 model with GED and Student s-t errors") UNIVERSITY OF MAURITIUS RESEARCH JOURNAL Volume 17 2011 University of Mauritius, Réduit, Mauritius Research Week 2009/2010 Forecasting Volatility of USD/MUR Exchange Rate using a GARCH (1,1) model with
UNIVERSITY OF MAURITIUS RESEARCH JOURNAL Volume 17 2011 University of Mauritius, Réduit, Mauritius Research Week 2009/2010 Forecasting Volatility of USD/MUR Exchange Rate using a GARCH (1,1) model with
Lecture Note 9 of Bus 41914, Spring Multivariate Volatility Models ChicagoBooth
 Lecture Note 9 of Bus 41914, Spring 2017. Multivariate Volatility Models ChicagoBooth Reference: Chapter 7 of the textbook Estimation: use the MTS package with commands: EWMAvol, marchtest, BEKK11, dccpre,
Modelling Stock Returns Volatility on Uganda Securities Exchange
 Applied Mathematical Sciences, Vol. 8, 2014, no. 104, 5173-5184 HIKARI Ltd, www.m-hikari.com http://dx.doi.org/10.12988/ams.2014.46394 Modelling Stock Returns Volatility on Uganda Securities Exchange Jalira
GARCH Options in Incomplete Markets
 GARCH Options in Incomplete Markets Giovanni Barone-Adesi a, Robert Engle b and Loriano Mancini a a Institute of Finance, University of Lugano, Switzerland b Dept. of Finance, Leonard Stern School of Business,
Center for Economic Institutions Working Paper Series
 Center for Economic Institutions Working Paper Series CEI Working Paper Series, No. 25-12 "GARCH Options in Incomplete Markets" Giovanni Barone-Adesi Robert Engle Loriano Mancini Center for Economic Institutions
The Great Moderation Flattens Fat Tails: Disappearing Leptokurtosis
 The Great Moderation Flattens Fat Tails: Disappearing Leptokurtosis WenShwo Fang Department of Economics Feng Chia University 100 WenHwa Road, Taichung, TAIWAN Stephen M. Miller* College of Business University
Lecture Note of Bus 41202, Spring 2008: More Volatility Models. Mr. Ruey Tsay
 Lecture Note of Bus 41202, Spring 2008: More Volatility Models. Mr. Ruey Tsay The EGARCH model Asymmetry in responses to + & returns: g(ɛ t ) = θɛ t + γ[ ɛ t E( ɛ t )], with E[g(ɛ t )] = 0. To see asymmetry
Implied Volatility v/s Realized Volatility: A Forecasting Dimension
 4 Implied Volatility v/s Realized Volatility: A Forecasting Dimension 4.1 Introduction Modelling and predicting financial market volatility has played an important role for market participants as it enables
Study on Dynamic Risk Measurement Based on ARMA-GJR-AL Model
 Applied and Computational Mathematics 5; 4(3): 6- Published online April 3, 5 (http://www.sciencepublishinggroup.com/j/acm) doi:.648/j.acm.543.3 ISSN: 38-565 (Print); ISSN: 38-563 (Online) Study on Dynamic
City, University of London Institutional Repository
 City Research Online City, University of London Institutional Repository Citation: Pilbeam, K. & Langeland, K. N. (2014). Forecasting exchange rate volatility: GARCH models versus implied volatility forecasts.
Dependence Structure and Extreme Comovements in International Equity and Bond Markets
 Dependence Structure and Extreme Comovements in International Equity and Bond Markets René Garcia Edhec Business School, Université de Montréal, CIRANO and CIREQ Georges Tsafack Suffolk University Measuring
Bayesian Estimation of the Markov-Switching GARCH(1,1) Model with Student-t Innovations
 Model with Student-t Innovations") Bayesian Estimation of the Markov-Switching GARCH(1,1) Model with Student-t Innovations Department of Quantitative Economics, Switzerland david.ardia@unifr.ch R/Rmetrics User and Developer Workshop, Meielisalp,
Bayesian Estimation of the Markov-Switching GARCH(1,1) Model with Student-t Innovations Department of Quantitative Economics, Switzerland david.ardia@unifr.ch R/Rmetrics User and Developer Workshop, Meielisalp,
The Fundamental Review of the Trading Book: from VaR to ES
 The Fundamental Review of the Trading Book: from VaR to ES Chiara Benazzoli Simon Rabanser Francesco Cordoni Marcus Cordi Gennaro Cibelli University of Verona Ph. D. Modelling Week Finance Group (UniVr)
The histogram should resemble the uniform density, the mean should be close to 0.5, and the standard deviation should be close to 1/ 12 =
 Chapter 19 Monte Carlo Valuation Question 19.1 The histogram should resemble the uniform density, the mean should be close to.5, and the standard deviation should be close to 1/ 1 =.887. Question 19. The
Course information FN3142 Quantitative finance
 Course information 015 16 FN314 Quantitative finance This course is aimed at students interested in obtaining a thorough grounding in market finance and related empirical methods. Prerequisite If taken
Graduate School of Business, University of Chicago Business 41202, Spring Quarter 2007, Mr. Ruey S. Tsay. Midterm
 Graduate School of Business, University of Chicago Business 41202, Spring Quarter 2007, Mr. Ruey S. Tsay Midterm GSB Honor Code: I pledge my honor that I have not violated the Honor Code during this examination.
Internet Appendix for Asymmetry in Stock Comovements: An Entropy Approach
 Internet Appendix for Asymmetry in Stock Comovements: An Entropy Approach Lei Jiang Tsinghua University Ke Wu Renmin University of China Guofu Zhou Washington University in St. Louis August 2017 Jiang,
Estimating Value at Risk of Portfolio: Skewed-EWMA Forecasting via Copula
 Estimating Value at Risk of Portfolio: Skewed-EWMA Forecasting via Copula Zudi LU Dept of Maths & Stats Curtin University of Technology (coauthor: Shi LI, PICC Asset Management Co.) Talk outline Why important?
ROBUST VOLATILITY FORECASTS IN THE PRESENCE OF STRUCTURAL BREAKS
 DEPARTMENT OF ECONOMICS UNIVERSITY OF CYPRUS ROBUST VOLATILITY FORECASTS IN THE PRESENCE OF STRUCTURAL BREAKS Elena Andreou, Eric Ghysels and Constantinos Kourouyiannis Discussion Paper 08-2012 P.O. Box
Fin285a:Computer Simulations and Risk Assessment Section 7.1 Modeling Volatility: basic models Daníelson, ,
 Fin285a:Computer Simulations and Risk Assessment Section 7.1 Modeling Volatility: basic models Daníelson, 2.1-2.3, 2.7-2.8 Overview Moving average model Exponentially weighted moving average (EWMA) GARCH
Two hours. To be supplied by the Examinations Office: Mathematical Formula Tables and Statistical Tables THE UNIVERSITY OF MANCHESTER
 Two hours MATH20802 To be supplied by the Examinations Office: Mathematical Formula Tables and Statistical Tables THE UNIVERSITY OF MANCHESTER STATISTICAL METHODS Answer any FOUR of the SIX questions.
Cross-Sectional Distribution of GARCH Coefficients across S&P 500 Constituents : Time-Variation over the Period
 Cahier de recherche/working Paper 13-13 Cross-Sectional Distribution of GARCH Coefficients across S&P 500 Constituents : Time-Variation over the Period 2000-2012 David Ardia Lennart F. Hoogerheide Mai/May
IEOR E4602: Quantitative Risk Management
 IEOR E4602: Quantitative Risk Management Basic Concepts and Techniques of Risk Management Martin Haugh Department of Industrial Engineering and Operations Research Columbia University Email: martin.b.haugh@gmail.com
FE570 Financial Markets and Trading. Stevens Institute of Technology
 FE570 Financial Markets and Trading Lecture 6. Volatility Models and (Ref. Joel Hasbrouck - Empirical Market Microstructure ) Steve Yang Stevens Institute of Technology 10/02/2012 Outline 1 Volatility
Forecasting Volatility of Wind Power Production
 Forecasting Volatility of Wind Power Production Zhiwei Shen and Matthias Ritter Department of Agricultural Economics Humboldt-Universität zu Berlin July 18, 2015 Zhiwei Shen Forecasting Volatility of Wind
Analyzing Oil Futures with a Dynamic Nelson-Siegel Model
 Analyzing Oil Futures with a Dynamic Nelson-Siegel Model NIELS STRANGE HANSEN & ASGER LUNDE DEPARTMENT OF ECONOMICS AND BUSINESS, BUSINESS AND SOCIAL SCIENCES, AARHUS UNIVERSITY AND CENTER FOR RESEARCH
Lecture 6: Univariate Volatility
 Lecture 6: Univariate Volatility Modelling, ARCH and GARCH Prof. Massimo Guidolin 20192 Financial Econometrics Spring 2017 Overview Stepwise Distribution Modeling Approach Three Key Facts to Remember Volatility
Lecture 2: Stochastic Discount Factor
 Lecture 2: Stochastic Discount Factor Simon Gilchrist Boston Univerity and NBER EC 745 Fall, 2013 Stochastic Discount Factor (SDF) A stochastic discount factor is a stochastic process {M t,t+s } such that
Volatility Forecasting on the Stockholm Stock Exchange
 Volatility Forecasting on the Stockholm Stock Exchange Paper within: Authors: Tutors: Civilekonom examensarbete/master thesis in Business Administration (30hp), Finance track Gustafsson, Robert Quinones,
ANALYZING VALUE AT RISK AND EXPECTED SHORTFALL METHODS: THE USE OF PARAMETRIC, NON-PARAMETRIC, AND SEMI-PARAMETRIC MODELS
 ANALYZING VALUE AT RISK AND EXPECTED SHORTFALL METHODS: THE USE OF PARAMETRIC, NON-PARAMETRIC, AND SEMI-PARAMETRIC MODELS by Xinxin Huang A Thesis Submitted to the Faculty of Graduate Studies The University
Is the Potential for International Diversification Disappearing? A Dynamic Copula Approach
 Is the Potential for International Diversification Disappearing? A Dynamic Copula Approach Peter Christoffersen University of Toronto Vihang Errunza McGill University Kris Jacobs University of Houston
Downside Risk: Implications for Financial Management Robert Engle NYU Stern School of Business Carlos III, May 24,2004
 Downside Risk: Implications for Financial Management Robert Engle NYU Stern School of Business Carlos III, May 24,2004 WHAT IS ARCH? Autoregressive Conditional Heteroskedasticity Predictive (conditional)
Lecture 9: Markov and Regime
 Lecture 9: Markov and Regime Switching Models Prof. Massimo Guidolin 20192 Financial Econometrics Spring 2017 Overview Motivation Deterministic vs. Endogeneous, Stochastic Switching Dummy Regressiom Switching
INTERTEMPORAL ASSET ALLOCATION: THEORY
 INTERTEMPORAL ASSET ALLOCATION: THEORY Multi-Period Model The agent acts as a price-taker in asset markets and then chooses today s consumption and asset shares to maximise lifetime utility. This multi-period
The University of Chicago, Booth School of Business Business 41202, Spring Quarter 2012, Mr. Ruey S. Tsay. Solutions to Final Exam
 The University of Chicago, Booth School of Business Business 41202, Spring Quarter 2012, Mr. Ruey S. Tsay Solutions to Final Exam Problem A: (40 points) Answer briefly the following questions. 1. Consider
Combining State-Dependent Forecasts of Equity Risk Premium
 Combining State-Dependent Forecasts of Equity Risk Premium Daniel de Almeida, Ana-Maria Fuertes and Luiz Koodi Hotta Universidad Carlos III de Madrid September 15, 216 Almeida, Fuertes and Hotta (UC3M)
Forecasting Stock Index Futures Price Volatility: Linear vs. Nonlinear Models
 The Financial Review 37 (2002) 93--104 Forecasting Stock Index Futures Price Volatility: Linear vs. Nonlinear Models Mohammad Najand Old Dominion University Abstract The study examines the relative ability
Modelling stock index volatility
 Modelling stock index volatility Răduță Mihaela-Camelia * Abstract In this paper I compared seven volatility models in terms of their ability to describe the conditional variance. The models are compared
UNIVERSITÀ DEGLI STUDI DI PADOVA. Dipartimento di Scienze Economiche Marco Fanno
 UNIVERSITÀ DEGLI STUDI DI PADOVA Dipartimento di Scienze Economiche Marco Fanno MODELING AND FORECASTING REALIZED RANGE VOLATILITY MASSIMILIANO CAPORIN University of Padova GABRIEL G. VELO University of
Predicting Inflation without Predictive Regressions
 Predicting Inflation without Predictive Regressions Liuren Wu Baruch College, City University of New York Joint work with Jian Hua 6th Annual Conference of the Society for Financial Econometrics June 12-14,
Lecture 8: Markov and Regime
 Lecture 8: Markov and Regime Switching Models Prof. Massimo Guidolin 20192 Financial Econometrics Spring 2016 Overview Motivation Deterministic vs. Endogeneous, Stochastic Switching Dummy Regressiom Switching
Graduate School of Business, University of Chicago Business 41202, Spring Quarter 2007, Mr. Ruey S. Tsay. Final Exam
 Graduate School of Business, University of Chicago Business 41202, Spring Quarter 2007, Mr. Ruey S. Tsay Final Exam GSB Honor Code: I pledge my honor that I have not violated the Honor Code during this
Amath 546/Econ 589 Univariate GARCH Models
 Amath 546/Econ 589 Univariate GARCH Models Eric Zivot April 24, 2013 Lecture Outline Conditional vs. Unconditional Risk Measures Empirical regularities of asset returns Engle s ARCH model Testing for ARCH
Structural GARCH: The Volatility-Leverage Connection
 Structural GARCH: The Volatility-Leverage Connection Robert Engle 1 Emil Siriwardane 1 1 NYU Stern School of Business MFM Macroeconomic Fragility Fall 2013 Meeting Leverage and Equity Volatility I Crisis
Forecasting Canadian Equity Volatility: the information content of the MVX Index
 Forecasting Canadian Equity Volatility: the information content of the MVX Index by Hendrik Heng Bachelor of Science (Computer Science), University of New South Wales, 2005 Mingying Li Bachelor of Economics,
THE INFORMATION CONTENT OF IMPLIED VOLATILITY IN AGRICULTURAL COMMODITY MARKETS. Pierre Giot 1
 THE INFORMATION CONTENT OF IMPLIED VOLATILITY IN AGRICULTURAL COMMODITY MARKETS Pierre Giot 1 May 2002 Abstract In this paper we compare the incremental information content of lagged implied volatility
Lecture Note of Bus 41202, Spring 2017: More Volatility Models. Mr. Ruey Tsay
 Lecture Note of Bus 41202, Spring 2017: More Volatility Models. Mr. Ruey Tsay Package Note: We use fgarch to estimate most volatility models, but will discuss the package rugarch later, which can be used
Week 2 Quantitative Analysis of Financial Markets Hypothesis Testing and Confidence Intervals
 Week 2 Quantitative Analysis of Financial Markets Hypothesis Testing and Confidence Intervals Christopher Ting http://www.mysmu.edu/faculty/christophert/ Christopher Ting : christopherting@smu.edu.sg :
MATH3075/3975 FINANCIAL MATHEMATICS TUTORIAL PROBLEMS
 MATH307/37 FINANCIAL MATHEMATICS TUTORIAL PROBLEMS School of Mathematics and Statistics Semester, 04 Tutorial problems should be used to test your mathematical skills and understanding of the lecture material.
Final Exam Suggested Solutions
 University of Washington Fall 003 Department of Economics Eric Zivot Economics 483 Final Exam Suggested Solutions This is a closed book and closed note exam. However, you are allowed one page of handwritten
FINA 695 Assignment 1 Simon Foucher
 Answer the following questions. Show your work. Due in the class on March 29. (postponed 1 week) You are expected to do the assignment on your own. Please do not take help from others. 1. (a) The current
Modelling Returns: the CER and the CAPM
 Modelling Returns: the CER and the CAPM Carlo Favero Favero () Modelling Returns: the CER and the CAPM 1 / 20 Econometric Modelling of Financial Returns Financial data are mostly observational data: they
Modelling of Long-Term Risk
 Modelling of Long-Term Risk Roger Kaufmann Swiss Life roger.kaufmann@swisslife.ch 15th International AFIR Colloquium 6-9 September 2005, Zurich c 2005 (R. Kaufmann, Swiss Life) Contents A. Basel II B.
Equity correlations implied by index options: estimation and model uncertainty analysis
 1/18 : estimation and model analysis, EDHEC Business School (joint work with Rama COT) Modeling and managing financial risks Paris, 10 13 January 2011 2/18 Outline 1 2 of multi-asset models Solution to
Practical example of an Economic Scenario Generator
 Practical example of an Economic Scenario Generator Martin Schenk Actuarial & Insurance Solutions SAV 7 March 2014 Agenda Introduction Deterministic vs. stochastic approach Mathematical model Application
Eco504 Spring 2010 C. Sims FINAL EXAM. β t 1 2 φτ2 t subject to (1)
") Eco54 Spring 21 C. Sims FINAL EXAM There are three questions that will be equally weighted in grading. Since you may find some questions take longer to answer than others, and partial credit will be given
Eco54 Spring 21 C. Sims FINAL EXAM There are three questions that will be equally weighted in grading. Since you may find some questions take longer to answer than others, and partial credit will be given
Chapter 5 Univariate time-series analysis. () Chapter 5 Univariate time-series analysis 1 / 29
 Chapter 5 Univariate time-series analysis 1 / 29") Chapter 5 Univariate time-series analysis () Chapter 5 Univariate time-series analysis 1 / 29 Time-Series Time-series is a sequence fx 1, x 2,..., x T g or fx t g, t = 1,..., T, where t is an index denoting
Chapter 5 Univariate time-series analysis () Chapter 5 Univariate time-series analysis 1 / 29 Time-Series Time-series is a sequence fx 1, x 2,..., x T g or fx t g, t = 1,..., T, where t is an index denoting
Are Stocks Really Less Volatile in the Long Run?
 Introduction, JF 2009 (forth) Presented by: Esben Hedegaard NYUStern October 5, 2009 Outline Introduction 1 Introduction Measures of Variance Some Numbers 2 Numerical Illustration Estimation 3 Predictive
Changing Probability Measures in GARCH Option Pricing Models
 Changing Probability Measures in GARCH Option Pricing Models Wenjun Zhang Department of Mathematical Sciences School of Engineering, Computer and Mathematical Sciences Auckland University of Technology
EKONOMIHÖGSKOLAN Lunds Universitet. The model confidence set choosing between models
 EKONOMIHÖGSKOLAN Lunds Universitet The model confidence set choosing between models Kandidatuppsats i nationalekonomi Av: Jeanette Johansson Handledare: Hossein Asgharian Datum: 8 Oktober, 005 Abstract
Risk Reward Optimisation for Long-Run Investors: an Empirical Analysis
 GoBack Risk Reward Optimisation for Long-Run Investors: an Empirical Analysis M. Gilli University of Geneva and Swiss Finance Institute E. Schumann University of Geneva AFIR / LIFE Colloquium 2009 München,
The Forecasting Ability of GARCH Models for the Crisis: Evidence from S&P500 Index Volatility
 The Lahore Journal of Business 1:1 (Summer 2012): pp. 37 58 The Forecasting Ability of GARCH Models for the 2003 07 Crisis: Evidence from S&P500 Index Volatility Mahreen Mahmud Abstract This article studies