EQUITY MARKET INFORMATION 2. Warrants listed on the JSE Main Board...
|
|
|
- Moses Lynch
- 6 years ago
- Views:
Transcription
1 CONTENTS EQUITY MARKET INFORMATION 2 Warrants listed on the JSE Main Board... EQUITY MARKET INFORMATION 3-4 Information Includes JSE at a Glance, Market Statistics, World Markets, Top Ten Companies, New Capital Raised and Specialist Securities.... EQUITY DERIVATIVES 5-7 Summary of Equities Derivatives, 6 Months Statistics: Trading Statistics, Number of contracts, Milestones Achieved, Traded value, Open Interest and Graphs, Monthly comparison.... COMMODITY DERIVATIVES 8 Monthly Comparison... FTSE/JSE STATISTICS 9-13 Information Includes FTSE/JSE Graphs, Market Capitalisation by Sector, Sectoral Information and FTSE/JSE Index Statistics.... FTSE/JSE AFRICA INDEX SERIES CONSTITUENTS Information of changes in weightings as at the last day of the month.... WARRANTS INFORMATION Information includes Alpha Code, Style, Issuer, Underlying Security, Cover ratio, Strike price, Expiry date and type.... SECURITIES INFORMATION Information includes share capital, dividends for past 3 years, Dividends for current year (pre-listings dividends excluded), monthly volume, value, trades, highest and lowest prices, month-end closing price, days traded. Current year s volume, value, trades, highest and lowest prices traded. Previous year s volume, value, trades, highest and lowest prices traded and other payments.... NOTES ON COMPANIES Where rights issues, capital issues, sub-divisions of shares, reduction of capital, consolidation of capital, repayments of capital, withdrawals from the official list, change of name or changes of classifications have taken place, these appear under the names of the individual companies listed alphabetically. Special situations are also included.... EQUITY MARKET INFORMATION 55 Information includes Rights Issues, Newly listed companies and Delisted companies.... ADVERTISING & SUBSCRIPTION INFORMATION The JSE Limited does not exercise any editorial power over advertisements placed in this Bulletin by third parties. Therefore the JSE accepts no responsibility for, or liability in relation to, any advertisement placed in this Bulletin by any third party. The copyright and other rights in the information contained in this Bulletin are held exclusively by the JSE, save that the rights in any advertisements are held by the relevant advertiser. The rights of the JSE and the advertisers are fully reserved in respect of any unauthorised reproduction, publication, adaptation, broadcasting, public performance or other communication to the public of the information contained in this Bulletin. The JSE is the registered proprietor in South Africa of the JSE trademark and logos.


2 EQUITY MARKET INFORMATION WARRANTS LISTED ON JSE MAIN BOARD November 2013 YEAR TO DATE - DAILY MOVEMENT OF VOLUME TRADED AND NUMBER OF TRADES LISTINGS AND TRADING TRADING BY ICB SECTOR -12 MONTHS PERIOD 2
3 JSE AT A GLANCE EQUITIES November 2013 Year to date Number of Trades 3,005,486 36,520,375 Equity Volume traded 5,381,309,690 60,086,710,724 Equity Turnover value (R million) 323,064 3,743,326 Equity Total Market Capitalisation (R billion) 10,281 10,281 Total Money Raised (R million) 2,614 70,348 Liquidity % New Domestic & Foreign companies listed 2 11 Number of Companies listed Number of Securities listed Number of Trading days Total value of Kruger coins purchased R2,325,840 R41,194,545 MARKET STATISTICS EQUITY MARKET INFORMATION New companies listed includes both Domestic and Foreign Listings TOP TEN COMPANIES FOR THE MONTH Top 10 by Market Cap as at Month end *Prices Companies Market Cap (RMil) Volume (Mil) Value (R Mil) No. Shares (Mil) High Low Close British AM. Tobacco PLC 1,098, ,243 2,026 57,200 53,300 54,223 SABMiller PLC 881, ,952 1,671 53,988 51,698 52,749 Glencore Xstrata PLC 691, ,927 13,263 5,500 4,967 5,214 BHP Billiton PLC 665, ,586 2,136 33,041 30,078 31,175 Compagnie Fin Richemont 545, ,437 5,220 10,572 10,010 10,449 Naspers Ltd -N- 404, , ,947 90,335 97,288 MTN Group Ltd 371, ,177 1,873 20,234 18,906 19,828 Sasol Ltd 327, , ,098 49,100 50,410 Anglo American PLC 318, ,814 1,405 26,059 21,889 22,641 Standard Bank Group Ltd 195, ,139 1,619 12,750 11,903 12,065 Top 10 by Volume *Prices Companies Volume (Mil) Market Cap (R Mil) Value (R Mil) No. Shares (Mil) High Low Close Firstrand Limited ,619 8,239 5,638 3,586 3,185 3,381 African Bank Investments Limited ,165 3, ,817 1,200 1,246 Old Mutual PLC ,580 4,306 4,897 3,389 3,164 3,320 Steinhoff International Holdings Limited ,988 5,170 1,905 4,188 3,801 4,042 Glencore Xstrata PLC ,554 5,927 13,263 5,500 4,967 5,214 Redefine Properties Limited ,328 1,004 2,936 1, Compagnie Fin Richemont ,438 9,437 5,220 10,572 10,010 10,449 Reinet Investments Soc Anon 89 37,797 1,760 1,959 2,055 1,882 1,929 MTN Group Ltd 87 71,431 17,177 1,873 20,234 18,906 19,828 Aspen Pharmacare Holdings Ltd ,816 21, ,948 24,917 26,263 Top 10 by Value *Prices Companies Value (RMil) Market Cap (R Mil) Volume (Mil) No. Shares (Mil) High Low Close Naspers Ltd -N- 26, , ,947 90,335 97,288 Aspen Pharmacare Holdings Ltd 21, , ,948 24,917 26,263 Sasol Limited 19, , ,098 49,100 50,410 MTN Group Ltd 17, , ,873 20,234 18,906 19,828 BHP Billiton PLC 15, , ,136 33,041 30,078 31,175 Anglo American PLC 12, , ,405 26,059 21,889 22,641 SABMiller PLC 9, , ,671 53,988 51,698 52,749 Compagnie Fin Richemont 9, , ,220 10,572 10,010 10,449 Firstrand Limited 8, , ,638 3,586 3,185 3,381 Standard Bank Group Ltd 7, , ,619 12,750 11,903 12,065 * Prices in cents per share: High = Highest of the month, Low = Lowest of the month, Close = Closing value as at Month end 3
4 EQUITY MARKET INFORMATION NEW CAPITAL RAISED BY INDUSTRIES MARKET STATISTICS November 2013 November 2012 No. of shares Capital Raised (R) No. of shares Capital Raised (R) Oil & Gas 131,400 29,644,230 35,241,612 43,939,272 Basic Materials 309,898,562 65,017, ,466, ,259,143 Industrials 923,325 13,870,762 8,899, ,954,084 Consumer Goods 68,676,677 1,606,332,953 13,886, ,476,844 Health Care 1,421,200 35,535, ,811 15,589,518 Consumer Sevices 396,659 12,587,270 1,046,714 33,002,987 Telecommunications , ,801 Financials 195,994, ,827, ,831,314 3,664,454,261 Technology 38,529,866 3,419,988 64,969 3,033,923 Alt X 40,271, ,762,504 1,907,556,715 89,411,204 Total 656,243,781 2,613,998,727 2,305,259,648 4,604,591,038 Variances in totals may occur from month to month MARKET STATISTICS Trades Volume Value Nov 2013 Oct 2013 Nov 2013 Oct 2013 Nov 2013 Oct 2013 TOTAL 3,005,486 3,228,665 5,381,309,690 4,788,152, ,063,570, ,129,196,849 Average 143, , ,252, ,180,523 15,383,979,567 14,701,269,428 High 192, , ,169, ,735,496 29,972,524,683 18,586,180,616 High Date 13/11/ /10/ /11/ /10/ /11/ /10/2013 Low 97, , ,685, ,865,100 10,759,134,926 11,927,176,337 Low Date 29/11/ /10/ /11/ /10/ /11/ /10/2013 WORLD MARKETS Nov Nov % Nov Nov % Nov Nov % FTSE/JSE Top 40 40, , Frankfurt (DAX) 9, , Toronto (Comp.) 13, , Amsterdam Hong Kong 23, , Toronto (Gold) Brussels 2, , Paris (CAC 40) 4, , Zurich(SPI) 7, , Dow Jones 16, , Singapore 3, , Silver($) FTSE 100 6, , Sydney 5, , Platinum(PM)($) 1, , Tokyo 15, , Gold (PM Fix)($) 1, , Source: Inet-Bridge SPECIALIST SECURITIES 4 Sector name Volume Value Trades No of Instruments Full JSE M/Cap Corporate Debt 2,573,941 24,766, ,991,952,274 Exchange Traded Funds 99,983,517 4,255,650,301 10, ,118,294,426 Exchange Traded Notes 2,150,432 70,975, ,610,475,192 Investment Products 91,283,871 5,560,327,696 4, ,793,602,684 Kruger Rands 174 2,325, Other Securities 20,573,127 1,285,976, ,488,970,732 Preference Shares 9,707, ,104,267 5, ,475,695,118 Warrants 185,558,785 43,198,481 2, ,304,000,000
5 6 MONTHS TRADING IN EQUITIES DERIVATIVES June July August September October November No of Contracts Futures Total 24,250,123 4,636,484 7,410,013 24,364,825 12,663,129 10,625,150 Daily Avg 1,154, , ,858 1,218, , ,960 Options Total 1,365,376 1,034,101 1,851,832 1,391,788 23,021,736 11,749,173 Daily Avg 65,018 44,961 88,182 69,589 1,000, ,484 No of Deals Futures Total 286, , , , , ,737 Daily Avg 13,632 11,631 10,231 11,529 10,152 10,273 Options Total 1,448 1,444 2,351 2,485 1,513 1,335 Daily Avg Traded Value Futures Total 659,494,164, ,076,789, ,292,452, ,887,786, ,449,937, ,738,472,003 Daily Avg 31,404,484,034 14,177,251,697 15,061,545,334 33,044,389,314 13,932,605,995 14,463,736,762 Options Total 2,716,103, ,234,601, ,039,659, ,290,229,926 71,771,209,557 62,183,693,271 Daily Avg 129,338,280 14,314,547,903 5,620,936,153 6,564,511,496 3,120,487,372 2,961,128,251 Premium Traded Options Total 2,716,103,879 3,157,812,734 2,985,366,327 2,756,158,830 1,670,418,640 1,496,333,799 Daily Avg 129,338, ,296, ,160, ,807,942 72,626,897 71,253,990 Open Interest Futures Total 11,909,681 12,174,295 14,078,411 14,964,691 14,419,096 17,208,610 Options Total 2,681,009 3,018,408 3,865,576 2,769,171 9,454,026 9,959,765 EQUITY DERIVATIVES NUMBER OF CONTRACTS Index Futures Single Stock Futures Can-Do Futures Dividend Futures IDX Futures IDX Dividend Futures Metal Futures Commodity Futures ADX Futures Futures TOTAL FUTURES Index Options Single Stock Options Can-Do Options Commodity Options TOTAL OPTIONS TOTAL June July August September October November 2,274,031 1,037, ,330 2,059, , ,747 5,390, , ,741 3,942,449 1,624,862 1,463, , ,739 1,245,670 2,441,755 1,225, ,401 2,897, , ,269 3,584,234 1,824,986 1,821,337 7,314,131 1,011,462 2,056,099 6,454,880 3,859,236 2,976,013 5,985, ,517 1,865,277 5,851,200 3,186,540 2,722, ,329 3,490 4,570 11,061 23,315 18, , ,472 6, ,696 24,250,123 4,636,484 7,410,013 24,364,825 12,663,129 10,625, , , , , , , , ,184 1,277, , , ,814 71,590 47,924 89, ,065 22,198, , ,365,376 1,034,101 1,851,832 1,391,788 23,021,736 1,124,023 25,615,499 5,670,585 48,542,515 25,756,613 35,684,865 11,749,173 MILESTONE ACHIEVED Index Futures Single Stock Futures Can-do Futures Dividend Futures Metal Futures Index Options Single Stock Options Can-do Options IDX Futures Commodity Futures Commodity Options ADX Futures Futures Contracts Month Value Month 2,909,127 Mar'08 702,925,703,555 Jun'08 121,341,791 Sep '08 60,180,087,535 Sep '08 5,346,977 Jan '10 13,502,430,244 Mar'13 4,394,596 Jun '11 295,810,186 Nov'10 15,437 Dec '06 72,508,214 Dec '06 1,973,445 Mar '09 26,381,656,762 Jan '08 3,178,928 Jan '08 1,259,465,220 Aug '08 3,808,964 Mar'13 683,009,682 Jul ' 08 7,314,131 Jun'13 1,805,791,928 Jun'13 23,315 Oct' 13 1,176,189,657 Oct' Oct' 12 2,314,143 Jan'12 153,696 Nov'13 13,629,229 Nov'13 5

6 EQUITY DERIVATIVES TRADED VALUE Index Futures Single Stock Futures Can-Do Futures Dividend Futures IDX Futures IDX Dividend Futures Metal Futures Commodity Futures ADX Futures Futures TOTAL FUTURES Index Options Single Stock Options Can-Do Options Commodity Options TOTAL OPTIONS TOTAL June July August September October November 623,620,462, ,282,245, ,041,942, ,894,867, ,736,189, ,171,983,681 24,731,343,184 7,141,737,237 7,979,586,713 23,861,107,738 10,770,005,093 10,623,632,150 8,400,651,795 2,813,123,513 10,817,153,924 19,798,036,260 9,368,585,746 5,231,917,061 2,660,591 98, ,723 14,030,725 46,711,213 1,496,637 1,805,791, ,575, ,312,094 2,104,655,393 1,351,132, ,515, ,710 33,456 36, ,762 63,611 43, ,035, ,862, ,030,074 1,213,281,955 1,176,189, ,254,949 22, ,946 27,966 1,569,516 1,060,282 13,629, ,494,164, ,076,789, ,292,452, ,887,786, ,449,937, ,738,472,003 2,316,264,199 2,843,442,823 2,421,906,486 2,300,336,022 1,354,607,646 1,210,482, ,124, ,205, ,346, ,612, ,632, ,748, ,710,741 62,094, ,113, ,210, ,116,977 65,102,523 4,800 69, ,304-2,716,103,879 3,157,812,734 2,985,366,327 2,756,158,830 1,670,418,640 1,496,333, ,210,268, ,234,601, ,277,818, ,643,945, ,120,356, ,234,805,802 OPEN INTEREST Index Futures Single Stock Futures Can-Do Futures Dividend Futures IDX Futures IDX Dividend Futures Metal Futures Commodity Futures ADX Futures Futures TOTAL FUTURES Index Options Single Stock Options Can-Do Options Commodity Options TOTAL OPTIONS TOTAL June July August September October November 374, , , , , ,332 2,970,729 2,845,718 3,006,515 2,991,221 2,410,907 2,159, ,342 1,111,304 1,397,434 1,716,268 1,003,892 1,559,693 2,165,127 2,098,041 2,143,517 2,776,679 1,586,772 1,586,772 3,042,879 3,028,451 3,724,686 3,690,269 4,667,321 5,823,253 3,042,879 2,690,440 3,376,586 3,379,314 4,317,652 5,498, ,365 3,019 2,505 3,778 4,335 4, ,392 24, ,205 12,233,179 12,174,295 14,078,411 14,964,691 14,419,096 17,208, , ,518 1,047, , ,427 1,031,402 1,644,908 1,952,676 2,650,703 1,707,721 2,175,621 2,564, , , , ,237 6,318,946 6,363, ,681,009 3,018,408 3,865,576 2,769,171 9,454,026 9,959,765 14,914,188 15,192,703 17,943,987 17,733,862 23,873,122 27,168,375 The total number of contracts traded for the month of November 6

7 MARKET STATISTICS Nov 2013 Oct 2013 % Change Nov 2012 % Change Year on Year Futures Trades African Derivatives Can Do Futures Dividend Futures 11,903 10, , Index Futures 188, , , Single Stock Futures 14,900 13, , International Dividend Futures International Derivative Futures Total 216, , , Options Trades Can Do Options Index Options , Single Stock Options Dividend Options Total 1,335 1, , Futures Contracts African Derivatives 153,696 6,011 2, Can Do Futures 593,401 1,225, , Dividend Futures 1,821,337 1,824, , Index Futures 875, , , Single Stock Futures 1,463,507 1,624, ,073, International Dividend Futures 2,722,506 3,186, , International Derivative Futures 2,976,013 3,859, , Total 10,606,207 12,639, ,896, Options Contracts Can Do Options 201,215 22,198, , Index Options 176, , , Single Stock Options 745, , , Dividend Options Total 1,124,023 23,021, ,579, Futures Turnover value(r 000) African Derivatives 13,629 1,060 1, Can Do Futures 5,231,917 9,368, ,548, Dividend Futures 1,497 46, , Index Futures 286,171, ,736, ,212, Single Stock Futures 10,623,632 10,770, ,259, International Dividend Futures International Derivative Futures 804,515 1,351, , Total 302,847, ,273, ,300, Options Turnover value(r 000) Can Do Options 65, , , Index Options 1,210,483 1,354, ,774, Single Stock Options 220, , , Dividend Options Total 1,496,335 1,670, ,026, Futures Open Interest African Derivatives 151,205 24, Can Do Futures 1,559,693 1,003, , Dividend Futures 1,970,239 1,586, ,124, Index Futures 425, , , Single Stock Futures 2,159,907 2,410, ,134, International Dividend Futures 5,498,157 4,317, ,026, International Derivative Futures 5,823,253 4,667, ,309, Options Open Interest Can Do Options 6,363,517 6,318, ,780 2, Index Options 1,031, , ,049, Single Stock Options 2,564,814 2,175, ,467, EQUITY DERIVATIVES MARKET INFORMATION Data disclaimer To the extent allowed by law, JSE Limited (the JSE) does not (expressly, tacitly or impliedly) guarantee or warrant the availability, sequence, accuracy, completeness, reliability or any other aspect of any of the below data (Data), or that any Data is up to date. To the extent allowed by law, neither the JSE nor any of its directors, officers, employees, contractors, agents or representatives are liable in any way to the reader or to any other natural or juristic person (Person) for any loss or damage as a result of (i) the display of any Data on this website, or (ii) any Data being unavailable on this website at any time and for any reason, or (iii) any delay, inaccuracy, error, or omission in relation to any Data, or (iv) any actions taken or not taken by or on behalf of any Person in reliance on any Data. The JSE is entitled to terminate the display of any Data at any time, without notice and without liability to any Person. 7
8 COMMODITY DERIVATIVES MARKET INFORMATION 8 MARKET STATISTICS Nov 2013 Oct 2013 % Change Nov 2012 % Change Year on Year Futures Trades 10 Ton White Maize Future Ton Yellow Maize Future Corn Crude Oil Copper Gold Silver Platinum Sorghum Mini Soya Bean (25t) 985 1, , CBOT Soybean CBOT Soybean Meal CBOT Soybean Wheat Cape Wheat CBOT Soybean Oil Brent Crude Oil Quanto Copper Quanto Corn Quanto Gold Quanto Cotton Quanto Natural Gas Quanto Palladium Quanto Coffee Quanto KCBT Hard Red Winter Wheat Futures Platinum Quanto Silver Quanto Sugar#11 Quanto Soya Bean Future (50t) Suns 1,190 1, Wheat 2,928 2, , Wheat Commodity Cando 2 White Maize 11,581 9, , White Maize Commodity Cando Yellow Maize 5,293 5, , Yellow Maize Commodity Cando Total 23,905 20, , Options Trades Corn Crude Oil Gold Platinum Mini Soya Bean (25t) Sorghum CBOT Soybean Suns Soya Bean Future (50t) Wheat White Maize 2,073 1, , New Crop White Maize Options 1 - Yellow Maize Total 3,168 2, , Futures Volume 10 Ton White Maize Future Ton Yellow Maize Future Corn 12,729 4, , Crude Oil 726 1, Copper Gold , Silver Platinum Sorghum Mini Soya Bean (25t) 19,131 15, , CBOT Soybean CBOT Soybean Meal CBOT Soybean Wheat Cape Wheat CBOT Soybean Oil Brent Crude Oil Quanto Copper Quanto , Gold Quanto Cotton Quanto 16,683 20, Corn Quanto Coffee Quanto KCBT Hard Red Winter Wheat Futures , Platinum Quanto , Palladium Quanto Silver Quanto Sugar#11 Quanto Natural Gas Quanto Soya Bean Future (50t) 3,055 2, Suns 8,395 7, , Wheat 63,723 25, , Wheat Commodity Cando 2,000 White Maize 67,620 47, , White Maize Commodity Cando 230 Yellow Maize 36,550 34, , Yellow Maize Commodity Cando 200 Total 234, , , Options Volume Corn Crude Oil Gold Platinum Mini Soya Bean (25t) 1, , Soya Bean Future (50t) 1, Sorghum CBOT Soybean Suns 1, Wheat 2,370 1, , White Maize 18,556 12, , New Crop White Maize 4 - Yellow Maize 8,325 8, , Total 32,444 24, , Futures Value (R 000) 10 Ton White Maize Future 3,634 2, Ton Yellow Maize Future Corn 2,205, , ,151, Crude Oil 71, , , Copper 1,710 7, , Gold 33,100 66, , Silver 6,894 8, , Platinum 34,097 23, , Sorghum 15,225 11, , Mini Soya Bean (25t) 2,999,801 2,196, ,804, CBOT Soybean 202, , , CBOT Soybean Meal , , CBOT Soybean Wheat 64,556 48, , KCBT Hard Red Winter Wheat 119,256 51, , Cape Wheat 15, , CBOT Soybean Oil 2, , Brent Crude Oil Quanto 8,915 1, , Copper Quanto 11,992 5, , Coffee Quanto 5,006 2, Gold Quanto 31,575 35, , Cotton Quanto 650, , Platinum Quanto 30,416 56, ,909 1, Palladium Quanto 2, Silver Quanto 1,320 1, Natural Gas Quanto Corn Quanto Soya Bean Future (50t) 838, , Sugar #11 Quanto 1,803 1, Suns 2,323,113 1,943, ,254, Wheat 11,392,306 4,470, ,328, Wheat Commodity Cando 356, White Maize 15,923,842 10,966, ,879, White Maize Commodity Cando 57, Yellow Maize 8,484,516 7,467, ,464, Yellow Maize Commodity Cando 50, Total 45,948,025 29,968, ,940, Options Value (R 000) Corn , Crude Oil Gold Platinum Mini Soya Bean (25t) 2,344 3, , Soya Bean Future (50t) 10,367 8, Sorghum CBOT Soybean Suns 10,733 9, , Wheat 8,769 3, , White Maize 179, , , New Crop White Maize Options 17 - Yellow Maize 72,281 89, , Total 284, , , Open Interest Futures 10 Ton White Maize Future Ton Yellow Maize Future Corn 2,833 4, , Crude Oil Copper Gold Silver Platinum 992 1, Sorghum Mini Soya Bean (25t) 4,097 9, , CBOT Soybean CBOT Soybean Meal CBOT Soybean Wheat 2,408 2,408-2, KCBT Hard Red Winter Wheat Cape Wheat CBOT Soybean Oil Brent Crude Oil Quanto Copper Quanto Coffee Quanto Corn Quanto Gold Quanto Cotton Quanto 2,061 1, Platinum Quanto Palladium Quanto Silver Quanto Sugar #11 Quanto Natural Gas Quanto Soya Bean (50t) 2,965 2, Suns 2,790 3, , Wheat 22,009 19, , Wheat Commodity Cando 2,000 White Maize 20,730 22, , White Maize Commodity Cando 200 Yellow Maize 14,928 15, , Yellow Maize Commodity Cando 200 Options Corn , Crude Oil Gold Platinum Mini Soya Bean (25t) 4 1, , Soya Bean (50t) 2,112 1, Sorghum CBOT Soybean Suns 1,810 1, Wheat 1,304 3, , White Maize 20,165 25, , Yellow Maize 12,863 10, , Data disclaimer To the extent allowed by law, JSE Limited (the JSE) does not (expressly, tacitly or impliedly) guarantee or warrant the availability, sequence, accuracy, completeness, reliability or any other aspect of any of the below data (Data), or that any Data is up to date. To the extent allowed by law, neither the JSE nor any of its directors, officers, employees, contractors, agents or representatives are liable in any way to the reader or to any other natural or juristic person (Person) for any loss or damage as a result of (i) the display of any Data on this website, or (ii) any Data being unavailable on this website at any time and for any reason, or (iii) any delay, inaccuracy, error, or omission in relation to any Data, or (iv) any actions taken or not taken by or on behalf of any Person in reliance on any Data. The JSE is entitled to terminate the display of any Data at any time, without notice and without liability to any Person.


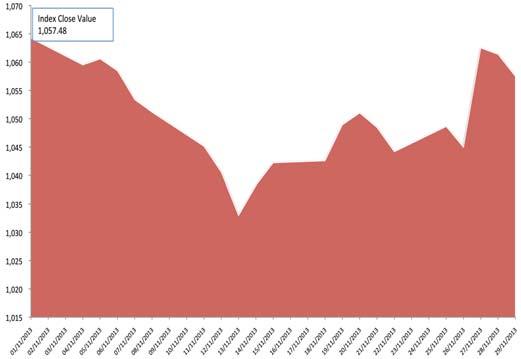
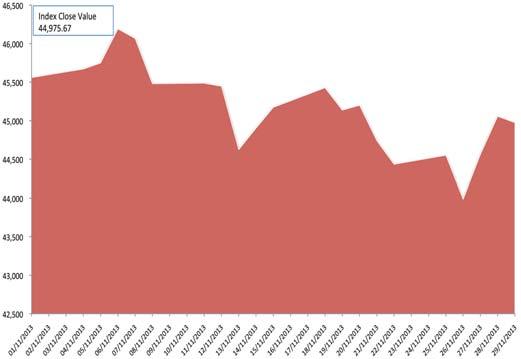
9 J253- SA Listed Property Daily Movement for November 2013 J863-Real Estate Development & Services Daily Movement for November 2013 FTSE/JSE AFRICA INDEX SERIES J857- Life Insurance Daily Movement for November 2013 J203 - All Share Index Daily Movement for November 2013 OVERALL MARKET AND SECTORAL INFORMATION J258-SA Resources Daily Movement for November 2013 J580 - Financials Daily Movement for November
10 OVERALL MARKET AND SECTORAL INFORMATION 10 FTSE/JSE AFRICA INDEX SERIES MARKET CAPITALISATION BY SECTOR (R MILLION) FOR 29 NOVEMBER 2013 Sectors Full JSE Market Cap % of Index Constituents Only % of JSE Total All Share Capped All Share Shareholder Weighted All Share Top Capped Top Shareholder Weighted Top Mid Cap Small Cap Fledgling SA Listed Property Capped Property SA Industrials SA Resources Development Capital Venture Capital Alternative Exchange BEE Board Oil & Gas Basic Materials Chemicals Forestry & Paper Industrial Metals & Mining Mining Coal , Diamonds & Gemstones General Mining Gold Mining Platinum & Precious Metals , Industrials Construction & Materials General Industrials Electronic & Electrical Equipment Industrial Engineering Industrial Transportation Support Services Consumer Goods Automobiles & Parts Beverages Food Producers Household Goods & Home Construction Leisure Goods Personal Goods Tobacco Health Care Health Care Equipment & Services Pharmaceuticals & Biotechnology Consumer Services Food & Drug Retailers General Retailers Media Travel & Leisure Telecommunications Fixed Line Telecommunications Mobile Telecommunications Financials Banks Nonlife Insurance Life Insurance Real Estate Investment & Services Real Estate Investment Trusts Financial Services Technology Software & Computer Services Technology Hardware & Equipment Additional Warrants Investment Products Corporate Debt Preference Shares Exchange Traded Funds Exchange Traded Notes Other Securities
11 FTSE/JSE AFRICA INDEX SERIES Industry / Economic Group Super Sector Sector Sub Sector Number of Instruments(Million) Dividend Yield Earnings Yield PE Ratio Total JSE Sectors Nr 239, Main Board 201, Oil & Gas Oil & Gas Oil & Gas Prod Int. Oil & Gas 8, Basic Materials Industrials Chemicals Basic Resources Chemicals Spec. Chemicals Forest & paper Forestry Paper 1, Industr. Metals & Min Aluminium Nom-ferr Metals Iron & Steel 1, Mining Coal 6, Diamonds & Gems 1, Gen Mining 21, Gold 7, Plat & Prec. Met 6, Construction & Materials Constr & Mat Build Mat & Fix 1, Heavy Contr. 3, Gen Indust Cont & Pack 1, Div Indust 3, Electro & electr Equip Electr Comp & eq 1, Electro Equipm Industr. Eng Comm Veh & Tru Industr mach Ind Transp Del Service Marine Tranp Transp serv 1, Trucking Supp serv Buss Supp Serv 2, Bus Train & empl agen Fin Admin Ind Supp OVERALL MARKET & SECTORAL INFORMATION Consumer Goods Health Care Automobiles & Parts Aut & Parts Auto parts Food & Beverage Beverage Brewers 1, Dist & Vint 1, Food Prod Farm & Fish 1, Food Prod 1, Personal & Household Goods Housh Goods & Home Const Furnish 1, Home Contr. Leisu Goods Cons. Electro Pers goods Cloth & access 6, Tobacco Tobacco 2, Health Care Health Equio & ser Healthc Prov 3, Pham & Biotech Pharmac 1,
12 OVERALL MARKET & SECTORAL INFORMATION FTSE/JSE AFRICA INDEX SERIES Industry / Economic Group Super Sector Sector Sub Sector Number of Instruments(Million) Dividend Yield Earnings Yield PE Ratio Consumer Services Retail Media Travel & Leisure Food & drug Ret Drug Ret Food Ret & Whole 1, Gen Retail Appar Retail 1, Broad Retail 1, Home Imp Ret 1, Spec Cons Serv Spec Retail Media Trav & leis Telecommunications Telecommunications Fixed Line Tel Financials Technology Banks Insurance Real Estate Financial Services Broadcast & ent Publishing Airlines Gambling 1, Hotels Rest & Bars Travel & Tour 1, Fixed Line Tel Mobile Telecomm. Mobile Telecom 4, Banks Nonlife Ins Life Ins Banks 10, Prop & Casual Ins Life Ins 9, Real Estate Investment & Serv Real Estate Holding & Dev 6, Real Estate Investment Trusts Industrial & Office REITs 1, Retail REITs 5, Diversified REITs 8, Specialty REITs Fin Services Investment Instruments Equity inv Instr. Technology Asset man 2, Cons Fin 1, Spec Finance 3, Inv serv 2, Equity inv Instr 5, Softw & Comp Serv Comp Serv 4, Tech hardw & eq Comp hardw Venture Capital Market Board Development Capital Market Board Alternative Exchange 37, BEE Board Additional Asset Backed Securities Warrants Warrants 12, Inv. Prod Inv. Prod 8, Debt Corp Debt Corp Debt Pref Shares Pref Shares Exchange Traded Products ETF ETF 2, Exchange Traded Notes Exchange Traded Notes 2, Other Other Sec Other Sec
13 MOVEMENTS BY SECTOR FTSE/JSE AFRICA INDEX SERIES November 2013 Year To date Index Names Date High Date Low Close D/Y E/Y High Low All Share 07 46, ,963 44, ,286 37,718 JSE Socially Responsible Investment 07 19, ,699 19, ,921 16,329 Capped All Share 07 23, ,263 22, ,427 19,116 Shareholder Weighted All Share 07 9, ,402 9, ,829 8,071 Shareholder Weighted Top , ,445 8, ,883 7,161 Capped Top , ,708 21, ,894 17,517 Top , ,175 40, ,474 33,157 Mid Cap 07 60, ,545 59, ,553 51,995 Small Cap 07 51, ,439 49, ,031 40,915 Fledgling 07 6, ,151 6, ,368 5,489 Industrial , ,965 52, ,831 40,403 Financial and Industrial , ,908 55, ,084 43,943 Resource , ,738 50, ,197 41,498 Shariah All Share 07 4, ,792 3, ,082 3,167 RAFI , ,636 8, ,205 7,425 Altx Oil & Gas 18 39, ,419 38, ,425 27,419 Basic Materials 07 29, ,896 26, ,065 22,180 Chemicals 07 24, ,939 23, ,301 16,538 Forestry & Paper 06 29, ,624 28, ,922 17,458 Industrial Metals & Mining 07 24, ,627 22, , Mining 07 32, ,109 30, ,882 24,896 Gold Mining 15 1, ,124 1, ,335 1,123 Platinum & Precious Metals General Mining 07 9, ,450 8, ,496 7,085 Industrials 07 44, ,397 43, ,539 37,678 Construction & Materials General Industrials Electronic & Electrical Equipment 04 22, ,129 21, ,037 19,385 Industrial Engineering 11 86, ,803 86, ,706 72,160 Industrial Transportation Support Services 01 2, ,503 2, ,931 2,180 Consumer Goods 07 56, ,835 56, ,796 40,786 Automobiles & Parts 04 9, ,315 8, ,241 7,079 Beverages Food Producers 01 71, ,401 69, ,450 66,144 Household Goods & Home Construction Personal Goods 28 1, ,001 1, , Health Care 01 78, ,988 75, ,375 53,802 Health Care Equipment & Services 01 86, ,744 85, ,769 65,784 Pharmaceuticals & Biotechnology 04 28, ,984 27, ,739 17,097 Consumer Services 29 10, ,918 10, ,331 8,896 Food & Drug Retailers 06 9, ,754 9, ,089 7,856 General Retailers 01 67, ,696 62, ,131 54,608 Media Travel & Leisure 04 5, ,473 5, ,880 4,665 Telecommunication 06 9, ,096 9, ,655 8,330 Fixed Line Telecommunications Mobile Telecommunications Financials 01 33, ,096 32, ,783 26,736 Financial , ,038 12, ,804 10,382 Banks 01 58, ,539 55, ,910 45,732 NonLife Insurance 04 50, ,448 47, ,894 42,614 Life Insurance 07 32, ,113 32, ,979 25,578 Real Estate Development & Services 01 1, ,030 1, , General Financial 29 3, ,102 3, ,220 2,574 Equity Investment Instruments 07 3, ,200 3, ,470 2,611 Technology 04 45, ,564 44, ,350 31,392 Software & Computer Services SA Resources 07 29, ,622 27, ,775 22,692 SA Listed Property Capped Property Property Unit Trust Property Loan Stock 01 2, ,911 1, ,248 1,749 Dividend OVERALL MARKET AND SECTORAL INFORMATION 13
14 OVERALL MARKET AND SECTORAL INFORMATION CONSTITUENTS AS AT MONTH END (R MILLIONS) FTSE/JSE AFRICA INDEX SERIES Code Security Free FTSE Free Float JSE Full Float Mkt Cap. Mkt Cap. J200 Top 40 ANG Anglogold Ashanti 100% 51,657 54,520 GFI Gold Fields 100% 30,125 31,375 IMP Impala Platinum Hlds 82% 61,175 74,759 AMS Anglo American Platinum 22% 23, ,682 AGL Anglo American 94% 299, ,211 ARI African Rainbow Minerals Ltd 36% 14,541 40,570 ASR Assore Ltd 24% 12,873 53,637 INL Investec Ltd 86% 17,325 20,145 NED Nedbank Group 39% 41, ,521 SBK Standard Bank Group 75% 145, ,275 BGA Barclays Africa Group Ltd 38% 43, ,294 GRT Growthpoint Prop Ltd 92% 41,835 46,541 CFR Compagnie Financiere Richemont AG 96% 523, ,438 SAB SABMiller 59% 517, ,419 SOL Sasol 85% 275, ,539 TBS Tiger Brands 83% 44,805 54,455 MDC Mediclinic International 50% 30,185 60,368 SHP Shoprite 76% 77, ,031 FSR Firstrand Limited 52% 98, ,619 IPL Imperial Holdings 83% 36,797 44,332 BVT Bidvest Group 82% 68,798 84,055 APN Aspen Pharmacare Holdings 67% 80, ,816 RMH RMB Holdings 52% 34,627 66,590 NPN Naspers 94% 380, ,661 MTN MTN Group 95% 354, ,431 BIL BHP Billiton 100% 665, ,956 WHL Woolworths Holdings 87% 53,789 62,658 TRU Truworths International 91% 33,878 37,573 SHF Steinhoff International Holdings 100% 73,975 76,988 SLM Sanlam 90% 97, ,297 ITU Intu Properties Plc 70% 36,214 52,101 OML Old Mutual 96% 155, ,580 DSY Discovery Ltd 50% 23,945 48,232 MSM Massmart Holdings 50% 15,462 31,177 REM Remgro 100% 93,599 93,599 EXX Exxaro Resources 36% 18,078 50,247 INP Investec PLC 100% 43,500 43,755 KIO Kumba Iron Ore 18% 22, ,158 MND Mondi Ltd 100% 19,876 19,877 MNP Mondi Plc 100% 61,946 61,946 BTI British American Tobacco PLC 14% 153,795 1,098,803 VOD Vodacom Group 22% 39, ,263 4,916,331 7,342,494 J201 Mid Cap 797,031 1,111,124 J202 Small Cap 160, ,084 J203 All Share 5,874,251 8,688,702 J257 SA Industrials 3,238,341 5,187,240 J258 SA Resources 1,517,883 1,816,233 J259 Dividend+ 1,805,343 3,484,336 14
15 CONSTITUENTS AS AT MONTH END (R MILLIONS) FTSE/JSE AFRICA INDEX SERIES Code Security Free FTSE Free Float JSE Full Float Mkt Cap. Mkt Cap. J211 Industrial 25 CFR Compagnie Financiere Richemont AG 96% 523, ,438 SAB SABMiller 59% 517, ,419 TBS Tiger Brands 83% 44,805 54,455 NPK Nampak 85% 23,140 27,392 MDC Mediclinic International 50% 30,185 60,368 TFG The Foschini Group Ltd 80% 18,283 22,854 PIK Pick N Pay Stores 46% 10,917 23,732 SHP Shoprite 76% 77, ,031 MPC Mr Price Group 92% 35,529 38,933 IPL Imperial Holdings 83% 36,797 44,332 BVT Bidvest Group 82% 68,798 84,055 APN Aspen Pharmacare Holdings 67% 80, ,816 NPN Naspers 94% 380, ,661 MTN MTN Group 95% 354, ,431 NTC Netcare 100% 36,516 36,581 WHL Woolworths Holdings 87% 53,789 62,658 TRU Truworths International 91% 33,878 37,573 SHF Steinhoff International Holdings 100% 73,975 76,988 MSM Massmart Holdings 50% 15,462 31,177 REM Remgro 100% 93,599 93,599 KIO Kumba Iron Ore 18% 22, ,158 MND Mondi Ltd 100% 19,876 19,877 MNP Mondi Plc 100% 61,946 61,946 BTI British American Tobacco PLC 14% 153,795 1,098,803 VOD Vodacom Group 22% 39, ,263 LHC Life Healthcare Group Holdings 88% 37,603 42,731 2,845,331 4,652,272 OVERALL MARKET AND SECTORAL INFORMATION J212 Financial 15 INL Investec Ltd 86% 17,325 20,145 NED Nedbank Group 39% 41, ,521 SBK Standard Bank Group 75% 145, ,275 BGA Barclays Africa Group Ltd 38% 43, ,294 MMI MMI Holdings 65% 26,505 40,768 GRT Growthpoint Prop Ltd 92% 41,835 46,541 FSR Firstrand Limited 52% 98, ,619 RMH RMB Holdings 52% 34,627 66,590 SLM Sanlam 90% 97, ,297 ITU Intu Properties Plc 70% 36,214 52,101 OML Old Mutual 96% 155, ,580 DSY Discovery Ltd 50% 23,945 48,232 INP Investec PLC 100% 43,500 43,755 REI Reinet Investments 75% 28,348 37,797 CCO Capital & Counties Properties PLC 30% 12,427 41,619 RMI Rand Merchant Insurance Holdings Ltd 47% 18,853 40, ,855 1,317,246 J213 Financial and Industrial 30 INL Investec Ltd 86% 17,325 20,145 NED Nedbank Group 39% 41, ,521 SBK Standard Bank Group 75% 145, ,275 BGA Barclays Africa Group Ltd 38% 43, ,294 GRT Growthpoint Prop Ltd 92% 41,835 46,541 CFR Compagnie Financiere Richemont AG 96% 523, ,438 SAB SABMiller 59% 517, ,419 TBS Tiger Brands 83% 44,805 54,455 MDC Mediclinic International 50% 30,185 60,368 SHP Shoprite 76% 77, ,031 FSR Firstrand Limited 52% 98, ,619 IPL Imperial Holdings 83% 36,797 44,332 15
16 OVERALL MARKET AND SECTORAL INFORMATION CONSTITUENTS AS AT MONTH END (R MILLIONS) FTSE/JSE AFRICA INDEX SERIES Code Security Free FTSE Free Float JSE Full Float Mkt Cap. Mkt Cap. BVT Bidvest Group 82% 68,798 84,055 APN Aspen Pharmacare Holdings 67% 80, ,816 RMH RMB Holdings 52% 34,627 66,590 NPN Naspers 94% 380, ,661 MTN MTN Group 95% 354, ,431 WHL Woolworths Holdings 87% 53,789 62,658 TRU Truworths International 91% 33,878 37,573 SHF Steinhoff International Holdings 100% 73,975 76,988 SLM Sanlam 90% 97, ,297 ITU Intu Properties Plc 70% 36,214 52,101 OML Old Mutual 96% 155, ,580 DSY Discovery Ltd 50% 23,945 48,232 REM Remgro 100% 93,599 93,599 INP Investec PLC 100% 43,500 43,755 KIO Kumba Iron Ore 18% 22, ,158 MND Mondi Ltd 100% 19,876 19,877 MNP Mondi Plc 100% 61,946 61,946 BTI British American Tobacco PLC 14% 153,795 1,098,803 VOD Vodacom Group 22% 39, ,263 RMI Rand Merchant Insurance Holdings Ltd 47% 18,853 40,114 3,466,456 5,625,935 J537 General Retailers JDG JD Group 50% 3,266 6,532 CMH Combined Motor Hldgs Ltd 30% 470 1,582 CSB Cashbuild Ltd 81% 3,303 4,078 TFG The Foschini Group Ltd 80% 18,283 22,854 MPC Mr Price Group 92% 35,529 38,933 WHL Woolworths Holdings 87% 53,789 62,658 ADH Advtech 88% 2,482 2,823 TRU Truworths International 91% 33,878 37,573 MSM Massmart Holdings 50% 15,462 31,177 LEW Lewis Group 90% 5,740 6,378 HSP Holdsport 60% 1,191 1, , ,572 J835 Banks NED Nedbank Group 39% 41, ,521 SBK Standard Bank Group 75% 145, ,275 BGA Barclays Africa Group Ltd 38% 43, ,294 FSR Firstrand Limited 52% 98, ,619 RMH RMB Holdings 52% 34,627 66,590 CPI Capitec Bank Hldgs Ltd 53% 12,067 22, , ,243 J135 Chemicals AFE AECI 91% 13,857 15,227 OMN Omnia Holdings Ltd 91% 12,851 14,122 AFX African Oxygen 40% 2,751 6,878 29,459 36,227 J153 Platinum & Precious Metals IMP Impala Platinum Hlds 82% 61,175 74,759 NHM Northam Platinum 69% 10,916 15,303 AMS Anglo American Platinum 22% 23, ,682 LON Lonmin PLC 76% 22,422 29,627 AQP Aquarius Platinum 31% 1,104 3,556 RBP Royal Bafokeng Platinum 30% 2,966 9, , ,893 16
17 CONSTITUENTS AS AT MONTH END (R MILLIONS) FTSE/JSE AFRICA INDEX SERIES Code Security Free FTSE Free Float JSE Full Float Mkt Cap. Mkt Cap. J154 General Mining AGL Anglo American 94% 299, ,211 ARI African Rainbow Minerals Ltd 36% 14,541 40,570 ASR Assore Ltd 24% 12,873 53,637 MRF Merafe Resources 49% 886 1,821 PET Petmin Ltd. 50% 565 1,131 BIL BHP Billiton 100% 665, , ,937 1,081,325 J173 Forestry & Paper YRK York Timber Holdings 43% 508 1,183 SAP Sappi 100% 16,549 16,682 MND Mondi Ltd 100% 19,876 19,877 MNP Mondi Plc 100% 61,946 61,946 98,879 99,687 J175 Industrial Metals & Mining PAM Palabora Mining 26% 1,452 5,583 ACL ArcelorMittal South Africa Ltd 36% 6,565 18,236 KIO Kumba Iron Ore 18% 22, ,158 30, ,977 OVERALL MARKET AND SECTORAL INFORMATION J177 Mining DRD DRD Gold 100% 1,563 1,565 ANG Anglogold Ashanti 100% 51,657 54,520 HAR Harmony 86% 11,035 12,843 GFI Gold Fields 100% 30,125 31,375 IMP Impala Platinum Hlds 82% 61,175 74,759 NHM Northam Platinum 69% 10,916 15,303 AMS Anglo American Platinum 22% 23, ,682 AGL Anglo American 94% 299, ,211 ARI African Rainbow Minerals Ltd 36% 14,541 40,570 ASR Assore Ltd 24% 12,873 53,637 MRF Merafe Resources 49% 886 1,821 LON Lonmin PLC 76% 22,422 29,627 PET Petmin Ltd. 50% 565 1,131 BIL BHP Billiton 100% 665, ,956 EXX Exxaro Resources 36% 18,078 50,247 AQP Aquarius Platinum 31% 1,104 3,556 CZA Coal of Africa 30% 425 1,415 PAN Pan African Resource 84% 3,463 4,168 RBP Royal Bafokeng Platinum 30% 2,966 9,965 SGL Sibanye Gold 100% 9,272 9,343 1,242,048 1,488,694 J231 Venture Capital LAB Labat Africa 67% SLO SOUTHERN ELECTRICITY CO 20% 4 19 JDH John Daniel Holdings 44%
18 OVERALL MARKET AND SECTORAL INFORMATION CONSTITUENTS AS AT MONTH END (R MILLIONS) FTSE/JSE AFRICA INDEX SERIES Code Security Free FTSE Free Float JSE Full Float Mkt Cap. Mkt Cap. J232 Alternative Exchange BEG Beige Holdings 20% ISA ISA Holdings 32% ADW African Dawn Capital 66% SVB Silverbridge Holdings 30% 8 28 FWX Foneworx Holdings 36% MNY MoneyWeb Holdings 20% STA Stratcorp 30% 4 12 CMO Chrometco 26% 8 31 OAS Oasis Crescent Property Fund 86% WEA W G Wearne 44% PSV PSV Holdings Ltd. 40% GDN Gooderson Leisure Corp 22% IPS IPSA Group 20% WKF Workforce Holdings 16% ACE ACCENTUATE 66% MSA M&S Holdings Ltd 25% NUT Nutritional Holdings 85% RAR Rare Holdings 25% AET Alert Steel Holdings 37% FGL Finbond Group Ltd 30% 535 1,785 ANS Ansys 66% IWE INTERWASTE HOLDINGS 41% BWI B&W INSTRUMENTATION AND ELEC 40% HUG Huge Group Ltd 30% ILE IMBALIE BEAUTY LTD 48% RBA RBA Holdings 50% BSS BSI Steel LTD 17% CSP Chemical Specialities 32% VUN Vunani Ltd 30% TCS Total Client Services 62% 5 8 POY Poynting Holdings 16% MSP MAS Real Estate Inc 57% 823 1,444 UBU Ububele Holdings Ltd 50% BCK Blackstar Group 50% MRI Mine Restoration Investments 37% TOR Torre Industrial Holdings 80% ROC Rockcastle Global Real Estate Co Ltd 35% 2,079 5,940 GAM Global Asset Management Ltd 28% ,974 14,956 J235 Construction & Materials MUR Murray & Roberts 92% 11,743 12,764 GRF Group Five/South Africa 69% 3,051 4,468 PPC PPC Ltd 75% 14,211 18,948 WBO Wilson Bayly Holmes-Ovcon 75% 7,667 10,222 AEG Aveng 100% 11,504 11,504 RBX Raubex Group 68% 2,987 4,424 SSK Stefanutti & Bressan Holding 67% 1,260 1,881 52,423 64,211 J255 Property Unit Trust CPL Capital Property Fund 83% 13,938 16,793 FPT Fountainhead Property Trust 55% 4,668 8,488 SYC Sycom Property Fund 73% 3,740 5,123 SAC SA Corporate Real Estate Fund 91% 7,117 7,821 EMI Emira Property Fund 87% 6,297 7,116 35,761 45,341 18
19 CONSTITUENTS AS AT MONTH END (R MILLIONS) FTSE/JSE AFRICA INDEX SERIES Code Security Free FTSE Free Float JSE Full Float Mkt Cap. Mkt Cap. J256 Property Loan Stock OCT Octodec Investments 65% 1,463 2,251 PMM Premium Properties 57% 1,629 2,856 AWA Arrowhead Properties (A) 100% 1,455 1,498 AWB Arrowhead Properties (B) 100% 1,443 1,485 DLT Delta Property Fund 88% 2,749 3,186 8,739 11,277 J272 General Industrials BAW Barloworld 91% 19,876 21,904 NPK Nampak 85% 23,140 27,392 BVT Bidvest Group 82% 68,798 84,055 KAP KAP Industrial Holdings Ltd 39% 3,190 8,212 REM Remgro 100% 93,599 93,599 EQS Eqstra Holdings 87% 2,817 3,237 MPT Mpact Ltd 100% 4,593 4, , ,980 J275 Industrial Engineering HDC Hudaco Industries 98% 3,456 3,540 IVT Invicta Holdings 36% 3,113 8,654 BEL Bell Equipment 31% 599 1,947 HWN Howden Africa Holdings 45% 1,227 2,728 MDI Master Drilling Group Limited 31% 481 1,552 8,876 18,422 OVERALL MARKET AND SECTORAL INFORMATION J277 Industrial Transportation GND Grindrod 60% 9,415 15,590 TRE Trencor Ltd 94% 11,405 12,147 IPL Imperial Holdings 83% 36,797 44,332 SPG Super Group 93% 7,622 8,196 65,239 80,264 J279 Support Services ADR Adcorp Holdings 100% 2,984 2,990 MFL Metrofile Holdings 61% 1,230 2,032 4,214 5,021 J335 Automobiles & Parts MTA Metair Investments Ord 58% 3,341 5,795 3,341 5,795 J353 Beverages SAB SABMiller 59% 517, ,419 CVH Capevin Holdings Ltd 65% 4,319 6, , ,064 J357 Food Producers AVI AVI 89% 17,645 19,882 OCE Oceana Group 30% 3,092 10,400 TBS Tiger Brands 83% 44,805 54,455 TON Tongaat Hulett 99% 12,615 12,760 RCL RCL Foods 24% 2,591 10,850 ILV Illovo Sugar 50% 6,331 12,780 AFR Afgri Ltd 89% 2,196 2,478 ARL Astral Foods Ltd 91% 4,252 4,634 PFG Pioneer Food Group 56% 11,782 21,135 CLR Clover Industries Ltd 71% 2,254 3, , ,549 19
20 OVERALL MARKET AND SECTORAL INFORMATION CONSTITUENTS AS AT MONTH END (R MILLIONS) FTSE/JSE AFRICA INDEX SERIES Code Security Free FTSE Free Float JSE Full Float Mkt Cap. Mkt Cap. J453 Health Care Equipment & Services MDC Mediclinic International 50% 30,185 60,368 NTC Netcare 100% 36,516 36,581 LHC Life Healthcare Group Holdings 88% 37,603 42, , ,679 J457 Pharmaceuticals & Biotechnology APN Aspen Pharmacare Holdings 67% 80, ,816 LHG Litha Healthcare Group Ltd 30% 457 1,567 AIP Adcock Ingram Holdings 85% 10,374 12,294 90, ,677 J500 Oil & Gas SOL Sasol 85% 275, , , ,539 J533 Food & Drug Retailers PIK Pick N Pay Stores 46% 10,917 23,732 SHP Shoprite 76% 77, ,031 CLS Clicks Group Ltd 94% 16,258 17,296 SPP The Spar Group 100% 22,407 22, , ,564 J555 Media KGM Kagiso Media Ltd 49% 1,834 3,751 NPN Naspers 94% 380, ,661 TMG Times Media Group Ltd 84% 2,135 2, , ,954 J575 Travel & Leisure SUI Sun International Ltd 81% 8,736 10,785 CLH City Lodge Hotels 74% 4,162 5,674 FBR Famous Brands 62% 6,034 9,732 SUR Spur Corp 85% 2,490 2,929 21,422 29,120 J653 Fixed Line Telecommunications TKG Telkom SA SOC 59% 8,305 13,957 8,305 13,957 J657 Mobile Telecommunications MTN MTN Group 95% 354, ,431 BLU Blue Label Telecoms Ltd. 55% 3,168 5,760 VOD Vodacom Group 22% 39, , , ,454 J853 Nonlife Insurance SNT Santam 29% 6,441 22,348 6,441 22,348 J857 Life Insurance LBH Liberty Hldgs. 36% 12,694 35,289 MMI MMI Holdings 65% 26,505 40,768 SLM Sanlam 90% 97, ,297 OML Old Mutual 96% 155, ,580 DSY Discovery Ltd 50% 23,945 48, , ,165 20
21 CONSTITUENTS AS AT MONTH END (R MILLIONS) FTSE/JSE AFRICA INDEX SERIES Code Security Free FTSE Free Float JSE Full Float Mkt Cap. Mkt Cap. J863 Real Estate Development & Services OCT Octodec Investments 65% 1,463 2,251 PMM Premium Properties 57% 1,629 2,856 NEP New Europe Property Investment Plc 52% 7,541 15,542 CCO Capital & Counties Properties PLC 30% 12,427 41,619 AWA Arrowhead Properties (A) 100% 1,455 1,498 AWB Arrowhead Properties (B) 100% 1,443 1,485 DLT Delta Property Fund 88% 2,749 3,186 RPL Redefine International PLC 62% 5,486 8,848 34,193 77,287 J867 Real Estate Investment Trusts GRT Growthpoint Prop Ltd 92% 41,835 46,541 HYP Hyprop Investments Ltd 86% 15,576 18,112 CPL Capital Property Fund 83% 13,938 16,793 FPT Fountainhead Property Trust 55% 4,668 8,488 SYC Sycom Property Fund 73% 3,740 5,123 SAC SA Corporate Real Estate Fund 91% 7,117 7,821 ITU Intu Properties Plc 70% 36,214 52,101 RDF Redefine Properties 98% 27,762 28,328 ACP Acucap Properties Limited 87% 7,012 8,131 RES Resilient Prop Inc Fd 79% 12,308 15,785 EMI Emira Property Fund 87% 6,297 7,116 VKE Vukile Property Fund 93% 7,059 8,041 HPA Hospitality Property A 89% 1,979 2,223 HPB Hospitality Property B 86% FFA Fortress Income Fund Ltd. (A) 68% 3,113 5,017 IPF Investec Property Fund ltd 46% 2,145 4,663 REB Rebosis Property Fund 88% 3,670 4, , ,513 OVERALL MARKET AND SECTORAL INFORMATION J877 General Financial INL Investec Ltd 86% 17,325 20,145 BAT Brait SE 63% 17,551 27,803 ABL African Bank Invest 84% 15,711 10,165 PGR Peregrine Holdings 67% 2,175 3,247 INP Investec PLC 100% 43,500 43,755 CML Coronation Fund Managers 80% 23,227 29,033 JSE JSE 100% 7,715 7,715 ZED Zeder Investments 58% 2,462 4,254 GPL Grand Parade Investments Ltd 65% 1,397 2,138 TCP Transaction Capital 26% 1,149 4, , ,659 J898 Equity Investment Instruments HCI Hosken Cons Invest 44% 7,659 16,422 BRN Brimstone Investment Corp N 39% 1,471 3,780 PGL Pallinghurst Resources 87% 1,654 1,901 REI Reinet Investments 75% 28,348 37,797 RMI Rand Merchant Insurance Holdings Ltd 47% 18,853 40,114 57, ,014 21
22 OVERALL MARKET AND SECTORAL INFORMATION CONSTITUENTS AS AT MONTH END (R MILLIONS) FTSE/JSE AFRICA INDEX SERIES Code Security Free FTSE Free Float JSE Full Float Mkt Cap. Mkt Cap. J953 Software & Computer Services DTC Datatec 92% 9,622 10,499 EOH EOH Holdings Ltd. 88% 7,794 8,857 BCX Business Connexion Group 89% 2,054 2,308 19,470 21,664 22
23 MARKET STATISTICS Instrument Call or Put Style Type Issuer Underlying Expiry Date Cover Strike Price per or note Security/Bond Ratio Share (cents) ABLSBB C American Vanilla STANDARD BANK OF SOUTH AFRICA LD ABL 07/01/ ,866 ABLSBB C American Vanilla STANDARD BANK OF SOUTH AFRICA LD ABL 07/01/ ,866 ABLSBC C American Vanilla STANDARD BANK OF SOUTH AFRICA LD ABL 07/01/ ,493 ABLSBC C American Vanilla STANDARD BANK OF SOUTH AFRICA LD ABL 07/01/ ,493 ABLSBD C American Vanilla STANDARD BANK OF SOUTH AFRICA LD ABL 04/03/ ,306 ABLSBD C American Vanilla STANDARD BANK OF SOUTH AFRICA LD ABL 04/03/ ,306 ABLSBE C American Vanilla STANDARD BANK OF SOUTH AFRICA LD ABL 01/07/ ,350 AGLSBA C American Vanilla STANDARD BANK OF SOUTH AFRICA LD AGL 04/02/ ,500 AGLSBB C American Vanilla STANDARD BANK OF SOUTH AFRICA LD AGL 02/04/ ,000 AGLSBC C American Vanilla STANDARD BANK OF SOUTH AFRICA LD AGL 01/07/ ,500 AGLSBO C American Vanilla STANDARD BANK OF SOUTH AFRICA LD AGL 03/12/ ,000 AGLSBS P European Vanilla STANDARD BANK OF SOUTH AFRICA LD AGL 07/01/ ,000 AGLSBT P European Vanilla STANDARD BANK OF SOUTH AFRICA LD AGL 04/03/ ,000 AMSSBF C American Vanilla STANDARD BANK OF SOUTH AFRICA LD AMS 03/12/ ,000 AMSSBG C American Vanilla STANDARD BANK OF SOUTH AFRICA LD AMS 07/01/ ,000 AMSSBH C American Vanilla STANDARD BANK OF SOUTH AFRICA LD AMS 07/05/ ,000 ANGSBF C American Vanilla STANDARD BANK OF SOUTH AFRICA LD ANG 03/12/ ,000 ANGSBG C American Vanilla STANDARD BANK OF SOUTH AFRICA LD ANG 03/12/ ,500 ANGSBH C American Vanilla STANDARD BANK OF SOUTH AFRICA LD ANG 07/01/ ,000 ANGSBI C American Vanilla STANDARD BANK OF SOUTH AFRICA LD ANG 04/02/ ,500 ANGSBJ C American Vanilla STANDARD BANK OF SOUTH AFRICA LD ANG 07/05/ ,500 ANGSBL C American Vanilla STANDARD BANK OF SOUTH AFRICA LD ANG 07/05/ ,500 ANGSBP P European Vanilla STANDARD BANK OF SOUTH AFRICA LD ANG 04/03/ ,500 ASASBJ C American Vanilla STANDARD BANK OF SOUTH AFRICA LD BGA 07/01/ ,226 ASASBJ C American Vanilla STANDARD BANK OF SOUTH AFRICA LD BGA 07/01/ ,226 ASASBT P European Vanilla STANDARD BANK OF SOUTH AFRICA LD BGA 07/01/ ,323 ASASBT P European Vanilla STANDARD BANK OF SOUTH AFRICA LD BGA 07/01/ ,323 BGASBA C American Vanilla STANDARD BANK OF SOUTH AFRICA LD BGA 04/03/ ,274 BGASBA C American Vanilla STANDARD BANK OF SOUTH AFRICA LD BGA 04/03/ ,274 BGASBB C American Vanilla STANDARD BANK OF SOUTH AFRICA LD BGA 01/07/ ,000 BGASBP P European Vanilla STANDARD BANK OF SOUTH AFRICA LD BGA 07/05/ ,702 BGASBP P European Vanilla STANDARD BANK OF SOUTH AFRICA LD BGA 07/05/ ,702 BILSBE C American Vanilla STANDARD BANK OF SOUTH AFRICA LD BIL 03/12/ ,500 BILSBF C American Vanilla STANDARD BANK OF SOUTH AFRICA LD BIL 02/04/ ,000 BILSBP P European Vanilla STANDARD BANK OF SOUTH AFRICA LD BIL 04/02/ ,000 BILSBQ P European Vanilla STANDARD BANK OF SOUTH AFRICA LD BIL 07/05/ ,000 BILSBZ P European Vanilla STANDARD BANK OF SOUTH AFRICA LD BIL 07/01/ ,500 CFRSBG C American Vanilla STANDARD BANK OF SOUTH AFRICA LD CFR 07/01/ ,800 CFRSBH C American Vanilla STANDARD BANK OF SOUTH AFRICA LD CFR 04/02/ ,000 CFRSBI C American Vanilla STANDARD BANK OF SOUTH AFRICA LD CFR 01/07/ ,500 CFRSBQ P European Vanilla STANDARD BANK OF SOUTH AFRICA LD CFR 03/12/ ,650 CFRSBR P European Vanilla STANDARD BANK OF SOUTH AFRICA LD CFR 04/02/ ,800 CFRSBS P European Vanilla STANDARD BANK OF SOUTH AFRICA LD CFR 07/05/ ,500 ESPIBA P European Index INVESTEC BANK LTD TOPI 27/10/ ,068 EXXSBH C American Vanilla STANDARD BANK OF SOUTH AFRICA LD EXX 07/01/ ,000 EXXSBI C American Vanilla STANDARD BANK OF SOUTH AFRICA LD EXX 02/04/ ,500 EXXSBJ C American Vanilla STANDARD BANK OF SOUTH AFRICA LD EXX 01/07/ ,000 FSRSBA C American Vanilla STANDARD BANK OF SOUTH AFRICA LD FSR 01/07/ ,600 FSRSBM C American Vanilla STANDARD BANK OF SOUTH AFRICA LD FSR 07/01/ ,300 FSRSBN C American Vanilla STANDARD BANK OF SOUTH AFRICA LD FSR 04/02/ ,950 FSRSBO C American Vanilla STANDARD BANK OF SOUTH AFRICA LD FSR 07/05/ ,600 FSRSBY P European Vanilla STANDARD BANK OF SOUTH AFRICA LD FSR 07/01/ ,000 FSRSBZ P European Vanilla STANDARD BANK OF SOUTH AFRICA LD FSR 07/05/ ,200 GFISBA C American Vanilla STANDARD BANK OF SOUTH AFRICA LD GFI 03/12/ ,000 GFISBB C American Vanilla STANDARD BANK OF SOUTH AFRICA LD GFI 03/12/ ,600 GFISBC C American Vanilla STANDARD BANK OF SOUTH AFRICA LD GFI 07/01/ ,000 GFISBD C American Vanilla STANDARD BANK OF SOUTH AFRICA LD GFI 02/04/ ,200 GFISBE C American Vanilla STANDARD BANK OF SOUTH AFRICA LD GFI 01/07/ ,500 GFISBP P European Vanilla STANDARD BANK OF SOUTH AFRICA LD GFI 04/02/ ,800 WARRANTS INFORMATION 23
24 WARRANTS INFORMATION 24 MARKET STATISTICS Instrument Call or Put Style Type Issuer Underlying Expiry Date Cover Strike Price per or note Security/Bond Ratio Share (cents) GLDSBD C American Vanilla STANDARD BANK OF SOUTH AFRICA LD GLD 03/12/ ,000 GLDSBE C American Vanilla STANDARD BANK OF SOUTH AFRICA LD GLD 07/05/ ,000 GRTIVC C European Vanilla INVESTEC BANK LTD GRT 24/07/ GRTIVC C European Vanilla INVESTEC BANK LTD GRT 24/07/ ,226 GRTIVC C European Vanilla INVESTEC BANK LTD GRT 24/07/ ,502 GRTIVE C European Vanilla INVESTEC BANK LTD GRT 15/03/ ,850 GRTSBA C American Vanilla STANDARD BANK OF SOUTH AFRICA LD GRT 04/02/ ,600 HARSBA C American Vanilla STANDARD BANK OF SOUTH AFRICA LD HAR 03/12/ ,000 HARSBB C American Vanilla STANDARD BANK OF SOUTH AFRICA LD HAR 07/01/ ,500 HARSBC C American Vanilla STANDARD BANK OF SOUTH AFRICA LD HAR 07/01/ ,900 HARSBD C American Vanilla STANDARD BANK OF SOUTH AFRICA LD HAR 07/05/ ,700 HARSBE C American Vanilla STANDARD BANK OF SOUTH AFRICA LD HAR 01/07/ ,150 HARSBO C American Vanilla STANDARD BANK OF SOUTH AFRICA LD HAR 03/12/ ,000 HARSBP P European Vanilla STANDARD BANK OF SOUTH AFRICA LD HAR 04/02/ ,800 HYPIVC C European Vanilla INVESTEC BANK LTD HYP 24/07/ ,771 HYPIVC C European Vanilla INVESTEC BANK LTD HYP 24/07/ ,771 HYPIVC C European Vanilla INVESTEC BANK LTD HYP 24/07/ ,937 HYPIVC C European Vanilla INVESTEC BANK LTD HYP 24/07/ ,975 IMPSBF C American Vanilla STANDARD BANK OF SOUTH AFRICA LD IMP 03/12/ ,500 IMPSBG C American Vanilla STANDARD BANK OF SOUTH AFRICA LD IMP 07/01/ ,500 IMPSBH C American Vanilla STANDARD BANK OF SOUTH AFRICA LD IMP 02/04/ ,500 IMPSBR P European Vanilla STANDARD BANK OF SOUTH AFRICA LD IMP 07/01/ ,500 IMPSBS P European Vanilla STANDARD BANK OF SOUTH AFRICA LD IMP 07/05/ ,500 IPFIVA C European Vanilla INVESTEC BANK LTD IPF 19/07/ IPFIVA C European Vanilla INVESTEC BANK LTD IPF 19/07/ IPFIVA C European Vanilla INVESTEC BANK LTD IPF 19/07/ IPFIVA C European Vanilla INVESTEC BANK LTD IPF 19/07/ KIOSBG C American Vanilla STANDARD BANK OF SOUTH AFRICA LD KIO 07/01/ ,000 KIOSBH C American Vanilla STANDARD BANK OF SOUTH AFRICA LD KIO 04/03/ ,000 KIOSBI C American Vanilla STANDARD BANK OF SOUTH AFRICA LD KIO 07/05/ ,000 KIOSBJ C American Vanilla STANDARD BANK OF SOUTH AFRICA LD KIO 01/07/ ,500 MPCSBB C American Vanilla STANDARD BANK OF SOUTH AFRICA LD MPC 04/03/ ,000 MPCSBC C American Vanilla STANDARD BANK OF SOUTH AFRICA LD MPC 07/05/ ,000 MPCSBP P European Vanilla STANDARD BANK OF SOUTH AFRICA LD MPC 07/01/ ,500 MPCSBQ P European Vanilla STANDARD BANK OF SOUTH AFRICA LD MPC 07/05/ ,500 MTNSBB C American Vanilla STANDARD BANK OF SOUTH AFRICA LD MTN 03/12/ ,500 MTNSBC C American Vanilla STANDARD BANK OF SOUTH AFRICA LD MTN 04/03/ ,000 MTNSBD C American Vanilla STANDARD BANK OF SOUTH AFRICA LD MTN 01/07/ ,000 MTNSBP P European Vanilla STANDARD BANK OF SOUTH AFRICA LD MTN 04/03/ ,500 MTNSBQ P European Vanilla STANDARD BANK OF SOUTH AFRICA LD MTN 01/07/ ,500 MTNSBZ P European Vanilla STANDARD BANK OF SOUTH AFRICA LD MTN 07/01/ ,500 NEDSBI C American Vanilla STANDARD BANK OF SOUTH AFRICA LD NED 03/12/ ,000 NEDSBJ C American Vanilla STANDARD BANK OF SOUTH AFRICA LD NED 04/03/ ,000 NPNSBH C American Vanilla STANDARD BANK OF SOUTH AFRICA LD NPN 07/01/ ,000 NPNSBI C American Vanilla STANDARD BANK OF SOUTH AFRICA LD NPN 04/02/ ,000 NPNSBJ C American Vanilla STANDARD BANK OF SOUTH AFRICA LD NPN 04/03/ ,000 NPNSBL C American Vanilla STANDARD BANK OF SOUTH AFRICA LD NPN 07/05/ ,500 NPNSBT P European Vanilla STANDARD BANK OF SOUTH AFRICA LD NPN 07/01/ ,500 NPNSBU P European Vanilla STANDARD BANK OF SOUTH AFRICA LD NPN 04/02/ ,500 NPNSBV P European Vanilla STANDARD BANK OF SOUTH AFRICA LD NPN 04/03/ ,000 NPNSBW P European Vanilla STANDARD BANK OF SOUTH AFRICA LD NPN 07/05/ ,000 OMLSBJ C American Vanilla STANDARD BANK OF SOUTH AFRICA LD OML 04/02/ ,900 OMLSBL C American Vanilla STANDARD BANK OF SOUTH AFRICA LD OML 07/05/ ,500 OMLSBP P European Vanilla STANDARD BANK OF SOUTH AFRICA LD OML 04/02/ ,850 OMLSBQ P European Vanilla STANDARD BANK OF SOUTH AFRICA LD OML 07/05/ ,000 PLASBA C American Vanilla STANDARD BANK OF SOUTH AFRICA LD NGPLT 07/01/ ,500 RDFIVD C European Vanilla INVESTEC BANK LTD RDF 21/05/ RDFSBA C American Vanilla STANDARD BANK OF SOUTH AFRICA LD RDF 04/02/ ,000 SBKSBE C American Vanilla STANDARD BANK OF SOUTH AFRICA LD SBK 07/01/ ,000
25 MARKET STATISTICS Instrument Call or Put Style Type Issuer Underlying Expiry Date Cover Strike Price per or note Security/Bond Ratio Share (cents) SBKSBF C American Vanilla STANDARD BANK OF SOUTH AFRICA LD SBK 07/05/ ,500 SGLSBB C American Vanilla STANDARD BANK OF SOUTH AFRICA LD SGL 03/12/ ,000 SGLSBC C American Vanilla STANDARD BANK OF SOUTH AFRICA LD SGL 07/01/ SGLSBD C American Vanilla STANDARD BANK OF SOUTH AFRICA LD SGL 02/04/ ,100 SGLSBE C American Vanilla STANDARD BANK OF SOUTH AFRICA LD SGL 07/05/ ,550 SHFSBA C American Vanilla STANDARD BANK OF SOUTH AFRICA LD SHF 01/07/ ,400 SHPSBB C American Vanilla STANDARD BANK OF SOUTH AFRICA LD SHP 04/02/ ,000 SHPSBC C American Vanilla STANDARD BANK OF SOUTH AFRICA LD SHP 04/03/ ,500 SHPSBD C American Vanilla STANDARD BANK OF SOUTH AFRICA LD SHP 01/07/ ,500 SHPSBX P European Vanilla STANDARD BANK OF SOUTH AFRICA LD SHP 07/01/ ,500 SHPSBY P European Vanilla STANDARD BANK OF SOUTH AFRICA LD SHP 07/05/ ,000 SOLSBF C American Vanilla STANDARD BANK OF SOUTH AFRICA LD SOL 07/01/ ,000 SOLSBG C American Vanilla STANDARD BANK OF SOUTH AFRICA LD SOL 04/02/ ,000 SOLSBH C American Vanilla STANDARD BANK OF SOUTH AFRICA LD SOL 04/03/ ,000 SOLSBI C American Vanilla STANDARD BANK OF SOUTH AFRICA LD SOL 07/05/ ,000 SOLSBU P European Vanilla STANDARD BANK OF SOUTH AFRICA LD SOL 04/03/ ,000 SOLSBV P European Vanilla STANDARD BANK OF SOUTH AFRICA LD SOL 07/05/ ,500 SYCIVC C European Vanilla INVESTEC BANK LTD SYC 24/07/ SYCIVC C European Vanilla INVESTEC BANK LTD SYC 24/07/ SYCIVC C European Vanilla INVESTEC BANK LTD SYC 24/07/ SYCIVC C European Vanilla INVESTEC BANK LTD SYC 24/07/ SYCVIC C European Vanilla INVESTEC BANK LTD SYC 24/07/ TFGSBC C American Vanilla STANDARD BANK OF SOUTH AFRICA LD TFG 04/02/ ,500 TFGSBD C American Vanilla STANDARD BANK OF SOUTH AFRICA LD TFG 07/05/ ,500 TFGSBE C American Vanilla STANDARD BANK OF SOUTH AFRICA LD TFG 01/07/ ,000 TOPSBD C European Index STANDARD BANK OF SOUTH AFRICA LD TOPI 07/01/ ,000 TOPSBI C European Index STANDARD BANK OF SOUTH AFRICA LD TOPI 07/05/ ,000 TOPSBJ C European Index STANDARD BANK OF SOUTH AFRICA LD TOPI 07/05/ ,000 TOPSBP P European Index STANDARD BANK OF SOUTH AFRICA LD TOPI 07/05/ ,500 TOPSBS P European Index STANDARD BANK OF SOUTH AFRICA LD TOPI 07/01/ ,500 TOPSBT P European Index STANDARD BANK OF SOUTH AFRICA LD TOPI 04/02/ ,000 TOPSBZ P European Index STANDARD BANK OF SOUTH AFRICA LD TOPI 07/05/ ,000 VODSBA C American Vanilla STANDARD BANK OF SOUTH AFRICA LD VOD 07/01/ ,500 VODSBB C American Vanilla STANDARD BANK OF SOUTH AFRICA LD VOD 02/04/ ,500 WHLSBB C American Vanilla STANDARD BANK OF SOUTH AFRICA LD WHL 04/02/ ,400 WHLSBC C American Vanilla STANDARD BANK OF SOUTH AFRICA LD WHL 07/05/ ,000 WHLSBP P European Vanilla STANDARD BANK OF SOUTH AFRICA LD WHL 07/01/ ,250 WHLSBQ P European Vanilla STANDARD BANK OF SOUTH AFRICA LD WHL 07/05/ ,100 WARRANTS INFORMATION KEY NOTES DB IB SB NB AB Deutsche Bank Investec Bank Standard Bank of S. A. Ltd Nedbank Group Limited ABSA Group SE INDEX TOPI Single Equity Issues Index Warrants Top 40 Index 25
26 2010 PAYMENTS 2011 PAYMENTS 2012 PAYMENTS 2013 PAYMENTS (YEAR TO DATE) TRADING STATISTICS FOR NOVEMBER 2013 TRADING STATISTICS 2013 TO NOVEMBER TRADING STATISTICS 2012 SECURITIES INFORMATION ISSUED NATURE OF SHARES PAY PAY OTHER HIGH HIGH LOW LOW CLOSE DAYS VOLUME VALUE HIGH LOW VOLUME VALUE HIGH LOW SECURITY BUSINESS (000 S) DIV CAP DIV CAP DIV CAP DIV AMT DATE DIV AMT DATE PAY VOLUME PRICE DATE PRICE DATE PRICE DEALS TRADE VALUE (000 s) (R000 s) PRICE PRICE (000 s) (R000 s) PRICE PRICE SHARE CODE 1time Holdings Ltd 1TM Airlines 280, ,460 35, ABSA Bank Ltd Pref ABSP Pref Shares 4,945 6, , , F /04I /09 64,041 82, , , ,996,912 1, ,708 93,500 77,000 1, ,980 93,000 85,399 Accentuate Limited ACE Build Mat & Fix 122, ,795, ,997,025 5,530 4, ,854 3, Acucap Properties Ltd ACP Diversified REITs 183, IT 08/ ,140,046 4, , ,431 2, ,672,107 66,209 3,068,025 5,805 3,980 45,274 1,945,334 5,050 3,780 Adaptit Holdings Limited ADI Comp Serv 111, F /09 3,983, ,012,757 29,135 86, ,746 12, Adcock Ingram Hldgs Ltd AIP Pharmac 175, F /01 I /07 18,158,309 7, , ,005 8, ,247,869, ,032 10,490,842 7,250 5, ,370 6,797,962 6,630 5,100 Adcorp Holdings Limited ADR Bus Train & empl agen 91, F 68 02/09 1,848,741 3, , ,250 1, ,448,710 26, ,316 3,800 2,634 28, ,031 3,299 2,500 Adrenna Property Grp Ltd ANA Real Estate Holding & Dev 55, , ,688 2, , ADvTECH Ltd ADH Spec Cons Serv 421, F /04 I /09 28,021, ,526, , , , , AECI Limited AFE Spec. Chemicals 128, F /04 I /09 6,701,530 12, , ,874 7, ,128,260 44,614 4,812,082 12,857 7,901 38,793 3,229,110 9,980 7,294 AECI Limited 5,5% Pref AFEP Pref Shares 3, I / , , , , , ,749 1, Afgri Limited AFR Farm & Fish 375, I /04 F /11 13,588, , ,708, , , , , Africa Cellular Towers ATR Telecom equip 370, , African & Over Ent Ltd AOO Appar Retail 1, , , , , ,600 1, ,750 1,550 African & Over Ent Ltd -N AON Appar Retail 10, ,137 1, , , , , ,829 1,900 1,600 African & Over Ent Ltd P AOVP Appar Retail I 54 07/01 I 6 07/01 1, ,150 1, F 6 24/06 African Bank Inv Ltd ABL Cons Fin 815, SC 18/ ,487,061 1, , ,246 42, ,015,911,997 1,655,050 33,813,695 3,319 1,200 1,167,133 40,116,677 4,065 2,825 African Bank Inv Ltd NPL ABLN Cons Fin 685, ,417, , ,522,872, ,418 1,522, African Bank Inv Ltd Pref ABLP Pref Shares 13, I /06 351,910 6, , , ,950,337 4, ,198 7,500 6,100 3, ,263 9,000 7,340 African Dawn Capital Ltd ADW Cons Fin 508,184 38,101, ,842, ,842 12, ,799 32, African Eagle Res plc AEA Nom-ferr Metals 694,014 1,101, ,891 14,009 1, ,071 1, African Media Ent Ltd AME Broadcast & ent 8, F /07 23,437 7, , , ,848, ,633 8,200 5,406 2, ,227 6,000 4,501 African Oxygen Limited AFX Spec. Chemicals 342, F /04 I /10 2,815,877 2, , ,006 1, ,879,135 44, ,594 2,680 1,798 46, ,409 2,470 1,600 African Rainbow Min Ltd ARI Gen Mining 216, F /09 8,655,638 20, , ,743 28, ,614,197, ,201 18,579,082 20,884 14, ,510 17,405,453 19,780 13,902 Afrimat Limited AFT Build Mat & Fix 143, F 17 03/06 2,893,229 1, , , ,962,786 27, ,193 1, , , AfroCentric Inv Corp Ltd ACT Healthc Prov 397, ,463, ,755,779 38, , ,319 97, AfroCentric Inv Corp Pf ACTP Healthc Prov 16, ,550 1, , , , ,205 1,732 1,360 1,783 18,687 1, AH-Vest Limited AHL Food Prod 101, , Alert Steel Holdings Ltd AET Home Imp Ret 52,000 F /01 45, ,529 3,222 4, ,545 9, Alex Forbes Eq Hldgs Ltd AFP Other Sec 236, IT 07/ ,348,065 1, , , ,851,621 41, ,328 1,735 1,150 56, ,588 1, IT 24/ Alliance Mining Corp Ltd ALM Software 108,512 Allied Elec Corp Pref ATNP Electr Comp & eq 249, F 51 01/07 7,611,615 2, , ,349 1, ,968,664 77,555 1,625,449 2,420 1,800 66,635 1,508,974 2,510 2,048 Allied Electronics Corp ATN Electr Comp & eq 105, F 51 01/07 627,323 2, , , ,791,502 7, ,939 2,500 1,526 12, ,602 2,585 2,069 Amalgamated Elec Corp Ltd AER Electro Equipm 77, F /07 1,317, ,402,988 52, , ,845 8, Andulela Inv Hldgs Ltd AND Equity inv Instr 87,645 15, , , Anglo American Plat Ltd AMS Plat & Prec. Met 269,682 1, ,601,973 44, , ,300 33, ,318,279,991 96,710 36,600,602 50,899 27,318 73,179 34,382,402 59,850 35,874 Anglo American plc AGL Gen Mining 1,405, F /04 I /09 54,358,013 26, , ,641 69, ,813,897, , ,889,573 29,145 18, , ,144,609 35,005 23,076 Anglogold Ashanti Ltd ANG Gold 402, F /03 I /06 23,882,964 16, , ,552 47, ,602,406, ,387 69,565,672 27,048 11, ,597 99,050,502 36,500 25,199 Annuity Properties Ltd ANP Diversified REITs 232, I /07 IT 01/ ,823, ,636,309 17,269 96, ,002 53, Ansys Limited ANS Electro Equipm 164,867 2,736, ,191 29,625 7, ,669 10, Aquarius Platinum Ltd AQP Plat & Prec. Met 472, ,676, , ,466, , ,275 1, ,481 1,543,454 2, ARB Holdings Limited ARH Electr Comp & eq 235, F /09 IS 09/ , ,104,917 12,464 60, ,899 73, ArcelorMittal SA Limited ACL Iron & Steel 445, ,706,382 4, , ,091 8, ,961, ,009 4,136,863 4,559 2, ,068 6,186,876 7,065 2,517 Ardor SA Ltd ARD Real Estate Holding & Dev 2,037 Argent Industrial Ltd ART Div Indust 96, F /10 4,220, ,712,026 23, , , , Arrowhead Properties A AWA Real Estate Holding & Dev 212, IT 11/ ,334, , ,543, , , , , IT 03/06 15 IT 09/09 15 Arrowhead Properties B AWB Real Estate Holding & Dev 212, IT 11/ ,350, , ,422,373 66, , , , IT 03/ IT 09/ Ascendis Health Ltd ASC Pharmac 229,736 6,524,463 1, , ,050 7, ,311,541 6,524 68,312 1,130 1,000 Ascension Prop Ltd A AIA Diversified REITs 308, IT 04/ ,658, ,321,463 82, , ,417 50, IT 16/09 19 Ascension Prop Ltd B AIB Diversified REITs 376, IT 04/ ,646, ,887,792 61, , ,622 64, IT 16/ Aspen Pharmacare Hldgs Ltd APN Pharmac 456, F /10 CR 14/ ,114,904 27, , ,263 69, ,852,370, ,546 71,519,831 27,978 15, ,772 31,937,876 17,029 9,574 Assore Ltd ASR Gen Mining 139,607 1, I /03 F /09 1,250,248 42, , ,420 19, ,678,871 23,172 8,389,300 44,900 27,195 30,317 8,892,148 41,995 20,505 Astral Foods Ltd ARL Farm & Fish 42, F /01 3,084,672 11, , ,995 3, ,249,260 21,609 2,033,722 11,454 8,460 25,674 2,933,033 13,298 9,258 Astrapak Limited APK Cont & Pack 135, ,777, ,083,381 53, , , , Astrapak Limited Pref APKP Pref Shares 1, F /04 I /10IS 22/ ,374 7, , , ,471, ,233 8,590 7, ,960 9,200 8,210 Atlatsa Resources Corp ATL Plat & Prec. Met 201,793 1,140, ,356,330 10,676 29, ,940 15, Attacq Limited ATT Real Estate Holding & Dev 614,696 55,398,311 1, , ,650 2, ,457,909 66,109 1,075,155 1,700 1,600 Austro Group Ltd ASO Industr mach 395, ,056, ,289, , , ,689 14, Aveng Group Limited AEG Heavy Contr. 389, ,522,103 3, , ,951 10, ,900, ,684 9,504,701 3,834 2, ,097 11,350,733 4,276 2,560 AVI Ltd AVI Food Prod 344, I /04 F /10 22,449,225 6, , ,764 17, ,274,878, ,514 12,556,645 6,200 5, ,620 14,999,579 6,338 3,843 Awethu Breweries Ltd AWT Brewers 84, , ,337 9, , B&W Instrument & Elec Ld BWI Heavy Contr. 212, ,792, ,060,148 26,519 8, ,678 7, Barclays Africa Grp Ltd BGA Banks 847, F /04 I /09 IS 25/ ,830,223 15, , ,600 52, ,550,503, ,599 62,089,466 17,315 12, ,047 64,231,404 16,620 13,220 Barloworld Ltd BAW Div Indust 231, F /01 I /06 21,672,743 10, , ,478 26, ,067,678, ,378 17,295,288 10,190 7, ,295 23,116,376 10,492 6,700 Barworld Ltd 6%Pref BAWP Pref Shares I /05 F / Basil Read Holdings Ltd BSR Heavy Contr. 131, IS 24/ ,109, , ,254,093 41, ,056 1, , ,794 1, Bauba Platinum Limited BAU Plat & Prec. Met 123, , ,409 8,295 7, ,369 6, BEE - Sasol Limited SOLBE1 Int. Oil & Gas 2,839 1, , I /04 F /10 17,491 39, , , ,407, ,266 39,000 28, ,536 29,502 24,501 Beige Holdings Limited BEG Pers Products 1,631, ,027, ,289 37,419 1, ,759 10, Bell Equipment Ltd BEL Comm Veh & Tru 95,031 F 34 15/04 1,085,858 2, , , ,397,995 7, ,093 2,950 1,949 7, ,821 2,650 1,590 BettaBeta CIS BGreen BGREEN Exchange Traded Funds 7, I /01 F /04 23,102 1, , , ,775 1,019 16,546 1,811 1,477 1,675 25,716 1,681 1,410 I /07 I /10 BettaBeta Eq Wted Top 40 BBET40 Exchange Traded Funds 3, I /01 F /04IT 22/ ,112 4, , , ,216,476 1,587 67,706 4,800 3, ,908 4,317 3,495 I /07 I /10 BHP Billiton plc BIL Gen Mining 2,136, I /03F /09 49,496,306 33, , ,175 65, ,585,504, , ,446,640 33,041 24, , ,079,867 30,138 21,921 Bidvest Ltd BVT Div Indust 327, I /04 F /09 17,315,552 27, , ,630 61, ,495,158, ,431 52,406,954 27,263 21, ,523 39,476,862 21,994 15,407 Bioscience Brands Ltd BIO Food Prod 2,911, , , BK One Limited Pref BK1P Pref Shares 20,102 12, , ,689 16,903 1, Blackstar Group SE BCK Equity inv Instr 82, F /06 I /11 2,830,205 1, , , ,062,914 17, ,053 1,200 1,082 34, ,903 1, Blue Financial Services BFS Cons Fin 8,229, ,104 6, ,314 33, Blue Label Telecoms Ltd BLU Mobile Telecom 674, F /09 12,133, , ,265, ,592 1,623, ,319 1,344, BNP Paribas Arbitrage01 ZA001 Exchange Traded Notes 20 BNP Paribas Arbitrage02 ZA002 Exchange Traded Notes 500,000 SECURITIES INFORMATION DIVIDEND FOOTNOTES F = Final dividend (current year) I = Interim dividend + = See Company Information Totals for shares traded, value and deals for Current month and Range for 2006 may vary due to correction trades Closing price but no high/low for month indicates last price in preceeding month Buyers/sellers price given as closing price, but no high low indicates either (a) no sales in current month, but no buyers and sellers prices, Or (b) Historical buyers and sellers prices only
27 2010 PAYMENTS 2011 PAYMENTS 2012 PAYMENTS 2013 PAYMENTS (YEAR TO DATE) TRADING STATISTICS FOR NOVEMBER 2013 TRADING STATISTICS 2013 TO NOVEMBER TRADING STATISTICS 2012 SECURITIES INFORMATION ISSUED NATURE OF SHARES PAY PAY OTHER HIGH HIGH LOW LOW CLOSE DAYS VOLUME VALUE HIGH LOW VOLUME VALUE HIGH LOW SECURITY BUSINESS (000 S) DIV CAP DIV CAP DIV CAP DIV AMT DATE DIV AMT DATE PAY VOLUME PRICE DATE PRICE DATE PRICE DEALS TRADE VALUE (000 s) (R000 s) PRICE PRICE (000 s) (R000 s) PRICE PRICE SHARE CODE BNP Paribas Arbitrage03 ZA003 Exchange Traded Notes 20 BNP Paribas Arbitrage07 ZA007 Exchange Traded Notes 500, ,317 3, BNP Paribas Arbitrage08 ZA008 Exchange Traded Notes 5 BNP Paribas Arbitrage09 ZA009 Exchange Traded Notes 50,000 BNP Paribas Arbitrage10 ZA010 Exchange Traded Notes 50,000 BNP Paribas Arbitrage12 ZA012 Exchange Traded Notes 75,000 BNP Paribas Arbitrage13 ZA013 Exchange Traded Notes 50,000 BNP Paribas Arbitrage14 ZA014 Exchange Traded Notes 150,000 BNP Paribas Arbitrage15 ZA015 Exchange Traded Notes 20,000 BNP Paribas Arbitrage16 ZA016 Exchange Traded Notes 25,000 BNP Paribas Arbitrage17 ZA017 Exchange Traded Notes 20,000 BNP Paribas Arbitrage18 ZA018 Exchange Traded Notes 20,000 BNP Paribas Arbitrage20 ZA020 Exchange Traded Notes 25,000 BNP Paribas Arbitrage21 ZA021 Exchange Traded Notes 10,000 BNP Paribas Arbitrage22 ZA022 Exchange Traded Notes 15,000 BNP Paribas Arbitrage23 ZA023 Exchange Traded Notes 10,000 BNP Paribas Arbitrage24 ZA024 Exchange Traded Notes 10,000 BNP Paribas Arbitrage25 ZA025 Exchange Traded Notes 10, BNP Paribas Arbitrage26 ZA026 Exchange Traded Notes 10,000 BNP Paribas Arbitrage27 ZA027 Exchange Traded Notes 10,000 BNP Paribas Arbitrage28 ZA028 Exchange Traded Notes 100,000 BNP Paribas Arbitrage29 ZA029 Exchange Traded Notes 60, , BNP Paribas Arbitrage30 ZA030 Exchange Traded Notes 40, BNP Paribas Arbitrage31 ZA031 Exchange Traded Notes 50, BNP Paribas Arbitrage32 ZA032 Exchange Traded Notes 40, ,412 1,412 BNP Paribas Arbitrage33 ZA033 Exchange Traded Notes 20,000 BNP Paribas Arbitrage34 ZA034 Exchange Traded Notes 20,000 BNP Paribas Arbitrage35 ZA035 Exchange Traded Notes 30,000 BNP Paribas Arbitrage36 ZA036 Exchange Traded Notes 15,000 Bonatla Property Hldgs BNT Real Estate Holding & Dev 508,102 Bowler Metcalf Ltd BCF Cont & Pack 88, I /04 F /10 1,147, ,897,747 11,903 94, , , Brait SE BAT Inv serv 513, SC 05/ ,485,236 5, , ,413 5, ,316, ,298 4,138,031 5,500 3, ,887 3,954,204 3,899 1,964 BRAIT SE Pref BATP Pref Shares 20, F /06 153,667 10, , , ,147,647 2, ,966 11,425 9, ,426 11,399 10,250 Brian Porter Ld 5,5%Pref POTP Pref Shares Brikor Ltd BIK Build Mat & Fix 645, , , Brimstone Inv Corp Ltd BRT Equity inv Instr 46, F 25 22/04 8,835 1, , , ,087 8, ,656 1,500 1,100 8,680 78,204 1, Brimstone Inv Corp Ltd-N BRN Equity inv Instr 267, F 25 22/04 664,246 1, , , ,325,784 13, ,873 1,420 1,110 42, ,671 1, British American Tob plc BTI Tobacco 2,026,452 1, , , F /05 I /09 11,274,001 57, , ,223 28, ,243,345, , ,721,813 57,200 42, , ,019,354 47,592 35,366 BSI Steel Limited BSS Iron & Steel 719, ,815, ,106,264 25,199 14, ,042 19, Buildmax Ltd BDM Coal 181, ,199, ,478,189 14,001 34, ,367 68, Business Connexion Grp Ltd BCX Comp Serv 404, F /01 33,144, , ,184, , , , , Cadiz Hldgs Ltd CDZ Inv serv 252, F /07 2,107, ,378,749 28,130 36, , , Cafca Limited CAC Electr Comp & eq 30, Calgro M3 Hldgs Ltd CGR Heavy Contr. 127,100 3,257, ,219,700 43, , , , Capevin Holdings Ltd CVH Dist & Vint 880, I /04 F /09 6,037, ,531, ,541 1,965, , , Capital Property Fund CPL Industrial & Office REITs 1,606, IT 25/ ,800,680 1, ,045 6, ,569, ,188 5,822,059 1, ,068 4,637,455 1, IT 26/ Capital&Counties Prop plc CCO Real Estate Holding & Dev 756, SC 20/ ,630,319 5, , ,500 4, ,444, ,348 5,304,858 5,771 3, ,465 3,607,908 3,600 2,109 SC 25/ Capitec Bank Hldgs Ltd CPI Banks 115, F /04 I /10 2,263,621 21, , ,900 7, ,525,299 45,195 8,878,813 22,250 17,700 31,893 6,238,203 23,200 17,401 Capitec Bank Hldgs Pref CPIP Pref Shares 2, F /03 I /09 54,121 7, , , ,075, ,284 8,875 7, ,546 9,900 8,400 Cargo Carriers Ltd CRG Trucking 20, F 17 18/06 25,035 2, , , , ,264 2,100 1, , Cashbuild Ltd CSB Home Imp Ret 25, I /04 F /10 527,903 16, , ,188 1, ,910,514 17,109 2,252,201 16,473 11,350 10,882 1,529,657 16,872 10,600 Caxton CTP Publish 6%Pf CATP Publishing F /10 15, ,600 14, ,600 14,000 Caxton CTP Publish Print CAT Publishing 467, F /10 1,395,542 2, , , ,067,323 18, ,553 2,500 1,619 29, ,314 1,820 1,402 Central Rand Gold Ltd CRD Gold 31,993 38, ,417 27,607 4, ,314 8, Chemical Spec Ltd Pref CSPP Build Mat & Fix 536,931 Chemical Specialities Ld CSP Build Mat & Fix 1,073,862 5,905, ,859,355 85,490 33, ,371 59, Chrometco Ltd CMO Gen Mining 204, , ,738 7,024 1, ,668 3, City Lodge Hotels Ltd CLH Hotels 43, I /03 F /09 597,117 13, , ,150 1, ,895,509 11,206 1,325,088 14,210 10,085 13,302 1,121,009 11,389 7,014 Clicks Group Ltd CLS Drug Ret 268, F /01 I /07 14,400,166 6, , ,446 14, ,839, ,145 15,106,914 6,828 5, ,454 16,298,657 6,795 3,934 Clientele Ltd CLI Life Ins 328, F /09 144,874 1, , , ,923,339 6,829 84,207 1, , ,027 1,250 1,011 Clover Industries Ltd CLR Food Prod 182, I /04 F /10 7,284,145 1, , ,740 2, ,068,300 81,575 1,381,132 1,950 1,580 59, ,057 1,800 1,130 Coal of Africa Ltd CZA Coal 1,048,369 2,976, ,988, , , , , Comair Limited COM Airlines 489, I /03 F /10 39,315, , ,473,716 75, , ,042 54, Combined Motor Hldgs Ltd CMH Spec Retail 109, F /06 1,073,516 1, , , ,346,381 11, ,920 1,550 1,160 10, ,303 1, Command Holdings Limited CMA Buss Supp Serv 132,250 Compagnie Fin Richemont CFR Cloth & access 5,220, F /09 91,635,015 10, , ,449 39, ,436,571,122 1,439, ,394,306 10,572 6,684 2,344, ,297,582 6,945 4,081 Compu Clearing Outs Ltd CCL Comp Serv 42, F /10 153, ,919 1,099 4, , Conduit Capital Ltd CND Spec Finance 256, ,369, ,624,561 78, , ,729 47, Cons Infrastructure Grp Ltd CIL Electr Comp & eq 130,999 F /06 CR 10/ ,519,041 2, , , ,367,734 25, ,784 2,400 1,600 38, ,099 1, Control Instruments Grp CNL Auto parts 139,437 F /04 301, ,820 41,151 45, ,304 35, Convergenet Holdings Ltd CVN Comp Serv 1,009, ,754, ,187, ,332 73, ,431 32, Coronation Fund Mngrs Ld CML Asset man 349, I /06 11,559,645 8, , ,300 17, ,383, ,745 11,307,391 8,599 4, ,595 4,058,120 4,233 2,270 Corwil Investments Ltd CRW Equity inv Instr 3,900 Country Bird Hldgs Ltd CBH Farm & Fish 202, ,097, ,391,048 12,486 44, ,241 95, Crookes Brothers Ltd CKS Farm & Fish 12, SC 15/ ,185 6, , , , ,646 7,000 5,200 4, ,488 6,000 3,350 Cullinan Hldgs 5,5%Pref CULP Pref Shares F /02 I / Cullinan Holdings Ltd CUL Travel & Tour 800, F /01 121, ,970 1,020 1, ,418 3, Curro Holdings Limited COH Spec Cons Serv 294, ,286 2, , , ,549,276 19, ,492 2,250 1,379 13, ,946 2, Datacentrix Holdings Ltd DCT Comp Serv 205, F /05 I /11 2,559, ,877,128 54, , , , Datatec Ltd DTC Comp Serv 196, CR 15/ ,404,459 5, , ,342 5, ,428,453 54,188 2,873,857 6,138 4,555 67,803 3,268,866 5,768 4,080 DB DBGAIN ETN 27MAY2016 DBGAN1 Exchange Traded Notes 1,000 DB DBGAIN IND 29JULY2016 DBGAN2 Inv. Prod 1,000 DB DBGAN3 IND 22NOV2016 DBGAN3 Inv. Prod 1,000 DB GLOBE 22FEB2018 DBGLB1 Inv. Prod 10 DB HAVEN 22FEB2018 DBHVN1 Inv. Prod 10 DB MSCIAF ETN 05JUL2021 DBAFRI Exchange Traded Notes 20, , , , , ,722 9,156 7, ,081 7,732 5,463 DB MSCICH ETN 05JUL2021 DBCHIN Exchange Traded Notes 20, ,506 4, , , ,098,309 2,646 92,269 4,111 3, ,347 3,208 2,496 DB MSCIEM ETN 05JUL2021 DBEMER Exchange Traded Notes 20, ,198 4, , , ,638, ,377 4,210 3, ,430 3,599 2,900 Db x-trackers Col in USA DBXUS Exchange Traded Funds 63, F /01 I /07 IT 25/ ,905,829 1, , , ,904,480 67,313 1,049,381 1,858 1,135 12, ,801 1, IT 24/ Db x-trackers Col in Wld DBXWD Exchange Traded Funds 90, F /01 I /07 IT 25/ ,585,974 1, , , ,707,613 67, ,627 1,695 1,150 22, ,456 1, IT 24/ Db x-trackers DJ eu ST 50 DBXEU Exchange Traded Funds 25, F /01 I /07 IT 25/ ,745,799 4, , , ,443,571 21, ,781 4,400 2,990 15, ,950 3,059 2,058 IT 23/ Db x-trackers FTSE 100 DBXUK Exchange Traded Funds 5, F /01 I /07IT 31/ ,063 11, , , ,878,756 1, ,523 11,233 8, ,317 8,429 6,835 Db x-trackers MSCI Japan DBXJP Exchange Traded Funds 45, F /01 I /07 IT 24/ ,466, ,574,311 35, , ,076 69, Delrand Resources Ltd DRN Diamonds & Gems 53,735 25, , ,237 2, SECURITIES INFORMATION 28 DIVIDEND FOOTNOTES F = Final dividend (current year) I = Interim dividend + = See Company Information Totals for shares traded, value and deals for Current month and Range for 2006 may vary due to correction trades Closing price but no high/low for month indicates last price in preceeding month Buyers/sellers price given as closing price, but no high low indicates either (a) no sales in current month, but no buyers and sellers prices, Or (b) Historical buyers and sellers prices only. 29
28 2010 PAYMENTS 2011 PAYMENTS 2012 PAYMENTS 2013 PAYMENTS (YEAR TO DATE) TRADING STATISTICS FOR NOVEMBER 2013 TRADING STATISTICS 2013 TO NOVEMBER TRADING STATISTICS 2012 SECURITIES INFORMATION ISSUED NATURE OF SHARES PAY PAY OTHER HIGH HIGH LOW LOW CLOSE DAYS VOLUME VALUE HIGH LOW VOLUME VALUE HIGH LOW SECURITY BUSINESS (000 S) DIV CAP DIV CAP DIV CAP DIV AMT DATE DIV AMT DATE PAY VOLUME PRICE DATE PRICE DATE PRICE DEALS TRADE VALUE (000 s) (R000 s) PRICE PRICE (000 s) (R000 s) PRICE PRICE SHARE CODE Delta EMD Ltd DTA Spec. Chemicals 49, F /03 219, ,400,192 5,022 28, ,145 45, Delta Property Fund Ltd DLT Real Estate Holding & Dev 366,262 IT 27/ ,875, ,396,995 87, ,410 1, , , IT 25/ Diamondcorp plc DMC Diamonds & Gems 276, , ,197 4,000 4, Digicore Holdings Limited DGC Electro Equipm 247, ,862, ,598,810 77, , , , Dipula Income Fund A DIA Diversified REITs 153, IT 24/ ,427 1, , ,136,373 12, ,328 1, ,836 89,865 1, Dipula Income Fund B DIB Diversified REITs 156, IT 24/ ,357, ,125,434 19, ,905 1, , , Discovery Ltd DSY Life Ins 591, I 51 25/03 F /10 15,467,829 8, , ,149 27, ,270,358, ,363 26,463,919 10,000 6, ,607 14,274,964 6,242 4,307 Discovery Ltd B pref DSBP Pref Shares 8, I /03 F /09 42,937 11, , , ,595,964 1, ,098 12,000 10,500 1, ,934 12,000 10,500 Distell Group Ltd DST Dist & Vint 203, I /03 F /09 697,633 14, , , ,863,547 6, ,024 14,400 10,150 4, ,207 11,021 7,055 Distr and Warehousing DAW Build Mat & Fix 241,843 7,089, ,891,946 20, ,599 1, , , Don Group Ltd DON Hotels 294,485 9,773, ,064,446 78,433 15, ,973 9, Dorbyl Ltd DLV Auto parts 34, CP 18/ ,644 17, Dorbyl Ltd 5%Pref DLVP Pref Shares CP 18/ Dorbyl Ltd 5,5%Pref DLP1 Pref Shares 1, CP 18/ DRD Gold Ltd DRD Gold 385, I /03 F /10 11,685, , ,073, ,168 1,132, ,083 1,376, Eastern Platinum Ltd EPS Plat & Prec. Met 928,188 1,904, ,188,830 31,221 35, ,965 72, Efficient Group Ltd EFG Asset man 53, , ,736 11,420 16, ,096 2, ELB Group Ltd ELR Ind Supp 33, I /04 F 51 28/10 49,090 4, , , ,150,957 6, ,305 4,551 2,800 10, ,866 3,290 2,000 Ellies Holdings Ltd ELI Electr Comp & eq 303, ,197, , ,959, ,727 1,634,868 1, , , Emira Property Fund EMI Diversified REITs 492, IT 11/ ,430,658 1, , ,445 3, ,576, ,218 2,688,980 1,629 1, ,294 2,610,830 1,494 1,180 IT 16/ EOH Holdings Ltd EOH Comp Serv 109, F /10 6,202,350 8, , ,093 4, ,853,613 37,689 2,276,171 8,500 3,699 29,119 1,006,344 3,950 2,761 Eqstra Holdings Ltd EQS Div Indust 411, F /09 11,186, , ,494, , , , , erafi Overall SA Index RAFISA Exchange Traded Funds 2, I /01 I /01IT 23/ ,529 4, , , ,415, ,844 4,532 3,000 5, ,162 4,000 3,235 I /04 I /04IT 24/ I /07 I /07IT 23/ I /10 I /10IT 22/ I /10 erafi SA Financial 15 RAFFIN Exchange Traded Funds I /01 I /01IT 23/ ,712 3, , , , ,518 4,006 3, ,799 3,318 2,429 I /04 I /07IT 24/ I /07 I /10IT 23/ I /10 IT 22/ erafi SA Industrial 25 RAFIND Exchange Traded Funds I /01 I /01IT 23/ ,392 5, , , , ,395 5,145 4, ,413 4,153 3,382 I /04 I /04IT 24/ I /07 I /10IT 23/ I /10 I /10IT 22/ erafi SA Resource 20 RAFRES Exchange Traded Funds I /01 I /01IT 23/ ,351 3, , , , ,463 3,500 2, ,721 3,315 2,730 I /04 I /04IT 24/ I /04 I /07IT 23/ I /07 I /10IT 22/ I /10 Erbacon Inv Hldgs Ltd ERB Heavy Contr. 732, , ,350 1, Esorfranki Limited ESR Heavy Contr. 395, ,572, , ,402, , , ,753 94, Evraz Highveld Steel & Van EHS Iron & Steel 99, ,958 1, , , ,883,180 3,476 57,018 2,450 1,105 2,010 51,689 4,133 1,001 Exxaro Resources Ltd EXX Coal 358, F /04 I /09 27,131,950 15, , ,031 37, ,016,958, ,885 32,588,219 18,249 13, ,057 44,232,858 21,495 14,505 Fairvest Property Hldgs FVT Retail REITs 359, IT 29/ ,915, ,017,837 41,755 56, ,546 10, IT 14/10 6 Famous Brands Ltd FBR Rest & Bars 99, F /07 2,236,231 10, , ,806 2, ,231,951 34,343 3,137,060 10,399 6,950 19,105 1,163,873 7,570 4,284 Faritec Holdings Ltd FRT Comp Serv 1,891,545 Ferrum Crescent Limited FCR Iron & Steel 377,216 84, ,275 1, Finbond Group Ltd FGL Cons Fin 605,025 12,978, , ,960, , , ,819 25, Firestone Energy Limited FSE Coal 3,549,699 26,070, ,869, ,953 10, ,356 18, Firestone Energy Ltd Opt FSEO1 Coal 42, , First Uranium Corp FUU Nom-ferr Metals 238, CP 18/ , ,558 9,437 2, ,879 16, Firstrand Ltd FSR Banks 5,637, I /04 F /10 245,930,686 3, , ,381 82, ,239,168,590 2,941,597 91,126,378 3,649 2,598 3,264,966 85,549,727 3,133 2,074 Firstrand Ltd B Pref FSRP Pref Shares 45, I /02 F /08 582,259 9, , , ,909,631 9, ,842 9,950 8,402 8, ,806 10,300 8,980 Foneworx Holdings Ltd FWX Telecom equip 136, F /10 614, ,460,904 20,461 44, ,776 23, Foord Compass Ltd Deb FCPD Corp Debt 308, SC 11/ ,573, ,766,470 24, , , , IT 11/ SC 05/ IT 05/08 30 Forbes & Manhatt Coal Corp FMC Coal 35,070 1,333, ,535,410 1,416 4, ,712 1, Fortress Inc Fund Ltd A FFA Diversified REITs 347, IT 11/ ,800,713 1, , ,445 1, ,187, ,904 1,565,350 1,699 1,375 90,598 1,252,155 1,610 1,230 IT 09/ Fortress Inc Fund Ltd B FFB Diversified REITs 347, IT 11/ ,106, ,614,762 12, , ,507 51, IT 09/ Foschini Ltd 6,5%Pref TFGP Pref Shares I /03 F / Fountainhead Prop Trust FPT Retail REITs 1,162, IT 03/ ,475, , ,935, ,202 4,372,685 1, ,158 3,597, IT 04/ Gijima Group Limited GIJ Comp Serv 198, ,016, ,857, ,112 20, ,130 74, Giyani Gold Corporation GIY Gold 54,729 Glencore Xstrata plc GLN Gen Mining 13,263, ,767,259 5, , ,214 35, ,926,645, ,767 5,926,645 5,500 4,967 Global Asset Mngment Ltd GAM Spec Finance 44,699 37, , GoGlobal Properties Ltd GGP Real Estate Holding & Dev 500 Gold Commodity-Linker ETN SBAG1 Exchange Traded Notes 1, , , , , ,842 17,680 13, ,920 18,303 14,069 Gold Fields Ltd GFI Gold 770, F /03 48,404,621 4, , ,072 51, ,130,917, ,814 52,408,653 11,029 3, ,850 62,933,644 13,288 9,551 Gold One Int Ltd GDO Gold 1,421, , ,265,047 35,954 86, ,465 90, Goliath Gold Mining Ltd GGM Gen Mining 147, , ,900,828 5,536 14, ,525 47, Gooderson Leisure Corp GDN Hotels 125, F /07 331, ,613 1, ,904 3, Grand Parade Inv Ltd GPL Spec Finance 460, F 15 30/09 15,307, , ,822, , , , , Great Basin Gold Ltd GBG Gold 552, ,088 63,219 1, Grindrod Ltd GND Marine Tranp 600, F /03 I 17 30/09 12,110,270 2, , ,595 6, ,962, ,236 3,715,168 2,645 1, ,690 2,380,166 1,585 1,270 Grindrod Ltd Pref GNDP Pref Shares 7, F /03 I /09 169,144 8, , , ,829,555 1, ,766 9,400 8,501 1, ,329 10,010 9,000 Group Five Ltd GRF Heavy Contr. 111, I 32 22/04 F 35 30/09 3,333,299 4, , ,000 4, ,230,919 51,338 1,967,892 4,607 2,700 41,331 1,041,228 3,195 2,100 Growthpoint Prop Ltd GRT Diversified REITs 1,935, I /03 F /09IT 25/ ,655,636 2, , ,404 25, ,852,774,778 1,167,684 29,956,770 3,094 2, ,657 20,006,845 2,776 1,866 IT 23/ Harmony GM Co Ltd HAR Gold 435, I /03 25,172,433 3, , ,948 26, ,540, ,939 17,595,094 7,598 2, ,029 31,495,999 10,182 6,410 Holdsport Limited HSP Appar Retail 43, F /06 857,663 5, , ,600 1, ,588,289 16, ,477 5,398 4,110 25,554 1,106,458 5,100 3,680 Hosken Cons Inv Ltd HCI Equity inv Instr 119, F 84 24/06 1,221,369 15, , ,700 3, ,180,885 25,384 2,967,978 15,543 9,600 25,135 2,223,381 10,272 7,912 Hospitality Prop Fund A HPA Specialty REITs 137, IT 18/ ,074,217 1, , , ,218,793 32, ,267 1,908 1,450 30, ,207 1,640 1,140 IT 16/ Hospitality Prop Fund B HPB Specialty REITs 137, IT 18/ ,480, ,138,211 47, , , , IT 16/ Howden Africa Hldgs Ltd HWN Industr mach 65, F /05 I /10 586,010 4, , , ,061,211 10, ,689 4,649 2,436 15, ,128 3,000 1,301 Hudaco Industries Ltd HDC Industr mach 34, F /03 I /08 564,940 10, , , ,696,912 14,905 1,415,009 12,395 8,232 10,193 1,088,441 13,240 8,290 Huge Group Ltd HUG Telecom equip 100,512 2,199, ,567,704 8,798 4, ,694 5, Hulamin Ltd HLM Aluminium 319,268 4,444, ,313,414 66, ,411 10, , , Hwange Colliery Ltd HWA Coal 101,334 1, , , SECURITIES INFORMATION 30 DIVIDEND FOOTNOTES F = Final dividend (current year) I = Interim dividend + = See Company Information Totals for shares traded, value and deals for Current month and Range for 2006 may vary due to correction trades Closing price but no high/low for month indicates last price in preceeding month Buyers/sellers price given as closing price, but no high low indicates either (a) no sales in current month, but no buyers and sellers prices, Or (b) Historical buyers and sellers prices only. 31
29 2010 PAYMENTS 2011 PAYMENTS 2012 PAYMENTS 2013 PAYMENTS (YEAR TO DATE) TRADING STATISTICS FOR NOVEMBER 2013 TRADING STATISTICS 2013 TO NOVEMBER TRADING STATISTICS 2012 SECURITIES INFORMATION ISSUED NATURE OF SHARES PAY PAY OTHER HIGH HIGH LOW LOW CLOSE DAYS VOLUME VALUE HIGH LOW VOLUME VALUE HIGH LOW SECURITY BUSINESS (000 S) DIV CAP DIV CAP DIV CAP DIV AMT DATE DIV AMT DATE PAY VOLUME PRICE DATE PRICE DATE PRICE DEALS TRADE VALUE (000 s) (R000 s) PRICE PRICE (000 s) (R000 s) PRICE PRICE SHARE CODE Hyprop Inv Ltd HYP Retail REITs 243, IT 25/ ,348,077 7, , ,450 6, ,414,457, ,285 7,546,310 8,400 6,652 81,613 5,151,283 7,558 5,313 IT 30/ IB GOLDEN ETN OCT17 GOLDEN Exchange Traded Notes 2,778 2,116 16, , , , ,465 17,800 10, ,630 17,480 16,464 IB SWX40 TRI ETN OCT17 SWXTRI Exchange Traded Notes 5, , , , , ,366 12,693 10, ,121 10,069 IB TOP40 TRI ETN OCT17 TOPTRI Exchange Traded Notes 12, , , , , ,884 5,152 4,166 1,955 79,679 4,263 3,995 IL REDEEMABLEPREF1 MAR17 ILRP1 Pref Shares 246 I /10 1, , , , ,035, , , ,041 Iliad Africa Ltd ILA Ind Supp 138, F 20 22/04 5,255, ,356,356 40, , , , Illovo Sugar Ltd ILV Food Prod 460, CR 07/ ,180,226 3, , ,775 6, ,856,805 88,029 2,811,514 3,952 2,700 58,605 1,630,409 3,240 2,276 CR 08/07 61 Imbalie Beauty Limited ILE Pers Products 345,548 1,061, ,541 17,278 3, ,423 4, Impala Platinum Hldgs Ltd Cnv IMPCB Plat & Prec. Met 267 IT 21/ , , , ,957, ,923 1,000, ,000 Impala Platinum Hlgs Ltd IMP Plat & Prec. Met 632, I /03 F 51 23/09 52,695,273 13, , ,825 70, ,746,938, ,262 76,962,864 17,600 8, ,712 74,741,298 18,083 12,347 Imperial Holdings Ltd IPL Transp serv 209, I /04 F /09 14,972,355 21, , ,115 45, ,085,002, ,046 46,047,086 23,342 18, ,630 39,196,405 21,849 12,376 Imperial Holdings Pref IPLP Pref Shares 4, I /04 F /09 202,689 8, , , ,315,692 1,067 91,468 9,200 8, ,070 10,000 8,635 Indequity Group Ltd IDQ Prop & Casual Ins 12,515 51, , , , Infrasors Holdings Ltd IRA Gen Mining 185, , , ,230 48, ,139 9, Ingenuity Property Inv ING Real Estate Holding & Dev 1,200, ,809, ,701,824 12,734 10, ,644 4, Insimbi Ref & Alloy Sup ISB Nom-ferr Metals 260, , ,119 8,978 5, ,049 9, Interwaste Hldgs Ltd IWE Waste & disp Serv 395,978 1,412, ,595,549 16,664 15, ,820 15, Intu Properties plc ITU Retail REITs 973, SC 04/ ,495,071 5, , ,350 19, ,490,958, ,899 11,556,472 5,617 4, ,911 9,713,314 5,130 3,826 SC 04/ SC 19/ Investec Australia Prop Fd IAP Real Estate Holding & Dev 134,685 26,526,105 1, , , ,629,712 31, ,534 1,150 1,000 Investec Bank Ltd Pref INLP Pref Shares 15, F /06 224,522 9, , , ,048,569 2, ,907 9,650 8,700 4, ,006 10,100 8,850 Investec Ltd INL Inv serv 282, F /08 12,756,965 7, , ,120 26, ,092, ,183 14,477,911 7,700 5, ,459 11,751,158 5,950 4,060 Investec Ltd Pref INPR Pref Shares 32, F /06 306,754 8, , , ,884,987 6, ,224 9,000 8,036 5, ,665 9,499 8,175 Investec plc INP Inv serv 608, F /08 F /08 26,885,251 7, , ,186 41, ,885,222, ,983 19,787,021 7,278 5, ,754 19,284,949 5,890 4,091 Investec plc Pref INPP Pref Shares 15, F /06 396,658 7, , , ,341,440 2, ,247 7,900 4,610 3, ,693 4,875 3,800 Investec plc Pref (Rand) INPPR Pref Shares 2, F /06 20,728 9, , , ,990, ,987 10,050 9, ,129 10,900 9,400 Investec Property Fund Ltd IPF Diversified REITs 317, F /06 IT 18/ ,497,098 1, , ,470 1, ,667,562 43, ,491 1,869 1,401 30, ,143 1,900 1,060 Invicta Hldgs Ltd pref IVTP Pref Shares 7,500 F /07 47,923 10, , , ,893,536 1, ,913 10,925 9, ,250 10,800 10,400 Invicta Holdings Ltd IVT Industr mach 74, F /07 1,143,682 11, , ,550 2, ,051,706 10,779 1,053,560 11,801 8,000 12, ,436 9,000 4,926 IPSA Group plc IPS Conv Electricity 107,504 55, ,607 1, ,167 2, ISA Holdings Limited ISA Comp Serv 192, F /07 801, ,064 18,357 11, ,324 12, Italtile Ltd ITE Home Imp Ret 1,033, I /03 F /09 IS 09/ ,600, ,225,962 45, ,623 1, , , Jasco Electron Hldgs Ltd JSC Electr Comp & eq 146, ,769, ,341,544 22,659 25, ,584 40, JD Group Ltd JDG Home Imp Ret 229, I /04 F /10 6,561,780 3, , ,848 7, ,699, ,293 4,926,652 4,700 2, ,052 6,013,922 5,300 4,020 JD Group Ltd Conv JDGCB Home Imp Ret , IT 20/ , , , ,106, ,038 1,060, , ,949 1,085, ,999 John Daniel Holdings Ltd JDH Spec Finance 440,406 3,183, ,211 14,630 1, ,592 1, JSE Ltd JSE Inv serv 86, F /05 4,435,133 9, , ,880 3, ,257,127 54,233 4,189,036 9,070 6,728 61,677 4,627,013 8,451 6,644 Jubilee Platinum plc JBL Plat & Prec. Met 385,265 3,847, ,578,176 54,091 68, ,251 52, Kagiso Media Ltd KGM Broadcast & ent 134, I /03 F 34 14/10 2,843,324 2, , ,797 1, ,544,192 32, ,313 2,988 2,050 18, ,598 2,450 1,737 KAP Industrial Hldgs Ltd KAP Div Indust 2,346, F /10 26,969, ,331, ,935 1,317, , , Kaydav Group Ltd KDV Build Mat & Fix 172, CR 22/04 7 7, ,913 4,212 4, ,502 2, Keaton Energy Hldgs Ltd KEH Coal 191,663 1,717, ,211,741 12,822 24, ,013 52, Kelly Group Ltd KEL Bus Train & empl agen 100, , ,105 6,781 12, ,114 51, Kibo Mining plc KBO Gen Mining 141,117 3, , , Kruger Rand KR Kruger Rands 165 1,430, ,340, ,340, ,281, ,022 1,600,000 1,225, ,832 1,620,000 1,252,500 Kruger Rand Half KRHT Kruger Rands 4 720, , , , , , , ,000 Kruger Rand Quarter KRQT Kruger Rands 4 352, , , , , , , ,000 Kruger Rand Tenth KRTT Kruger Rands 1 160, , , , , , , ,999 Kumba Iron Ore Ltd KIO Iron & Steel 322,086 2, , , F /03I /08 11,902,255 45, , ,790 60, ,912,442, ,889 58,476,006 61,955 38, ,497 67,097,110 59,950 45,675 Labat Africa Ltd LAB Electro Equipm 200, , ,641 4, , Lewis Group Ltd LEW Home Imp Ret 98, I /01 F /07 7,059,526 7, , ,504 9, ,068,072 96,947 6,121,434 7,498 5,035 77,206 5,605,007 8,284 6,550 Liberty Hldgs 11c Pref LBHP Pref Shares 15, I /07 84, ,800 1,040 1, , Liberty Holdings Ltd LBH Life Ins 286, F /04 I /09 IS 02/ ,383,882 12, , ,330 17, ,403,312 92,081 10,973,665 13,965 10,843 88,194 8,166,124 11,601 7,816 Life Healthc Grp Hldgs Ltd LHC Healthc Prov 1,042, I /06 52,964,417 4, , ,100 30, ,121,037, ,522 25,438,650 4,300 3, ,008 27,898,118 3,570 2,021 Litha Healthcare Grp Ltd LHG Pharmac 559,635 7,064, , ,445, , , , , London Fin Inv Group plc LNF Asset man 30, I /04 242, ,360,411 1,551 5, ,426 6, Lonmin plc LON Plat & Prec. Met 568, ,440,530 5, , ,211 15, ,087,640, ,002 15,991,314 5,909 3, ,970 19,963,571 13,600 3,522 M&S Holdings Ltd MSA Bus Train & empl agen 155,182 F /11 1,781, ,793,139 10,358 10, ,074 4, MacquarieSA EL Pref EXX1 MAQP1 Pref Shares 13 F /03 I /10 1 1,007, ,007, ,007, , ,047,647 1,000,000 Marshall Monteagle plc MMP Ind Supp 35, F /03 I /07 26, ,077 3,006 21, ,724 23, MAS Real Estate Inc. MSP Real Estate Holding & Dev 72, SC 01/ ,153 2, , , ,508 3,026 42,374 2,150 1, ,673 1,181 1,015 SC 19/ Masonite Africa Ltd MAS Build Mat & Fix 7,132 33,844 3, , , ,062, ,718 3,600 2, ,369 3,990 3,002 Massmart Holdings Ltd MSM Broad Retail 217, F /03 I /09 7,625,190 16, , ,360 23, ,157,521,714 91,205 16,083,405 20,800 14,235 73,320 12,619,028 19,241 15,652 Master Drilling Grp Ltd MDI Industr mach 148, ,428 1, , , ,373,298 19, ,087 1, Mazor Group Ltd MZR Build Mat & Fix 121, F /06 1,034, ,288,563 5,192 9, ,169 12, Mediclinic Internat Ltd MDC Healthc Prov 826, F /06 23,641,200 7, , ,300 31, ,699,967, ,746 21,716,546 7,839 5, ,864 10,441,347 5,500 3,275 Merafe Resources Ltd MRF Gen Mining 2,494, ,812, ,753, , , , , Metair Investments Ltd MTA Auto parts 152, F /04 2,215,466 3, , ,799 1, ,754,109 34,004 1,208,351 4,081 3,126 42,041 1,115,022 3,350 1,960 Metmar Ltd MML Nom-ferr Metals 267, ,748, ,476,859 39,473 59, , , Metrofile Holdings Ltd MFL Buss Supp Serv 423, I /04 F /10 8,681, ,363,325 48, , , , Micromega Holdings Ltd MMG Buss Supp Serv 115, ,042 1, ,773,684 6,492 24,686 2, ,278 12, Mine Restoration Inv Ltd MRI Industr mach 470,508 21,784, ,549,716 94,529 14, ,684 15, Miranda Mineral Hldgs Ld MMH Gen Mining 649,048 49,712, ,486, ,531 29, ,081 8, Mix Telematics Ltd MIX Buss Supp Serv 773, F /07 2,106, ,164,138 64, , ,854 86, MMI Holdings Limited MMI Life Ins 1,569, , I /04 F /10 48,847,564 2, , ,597 26, ,207,113, ,543 15,393,175 2,700 1, ,248 14,688,173 2,232 1,645 Mondi Ltd MND Paper 118, F /05 I /09 6,783,687 18, , ,800 19, ,145,146,334 97,465 13,318,877 18,300 9, ,415 7,955,784 9,500 5,670 Mondi plc MNP Paper 367, F /05 I /09 10,746,246 18, , ,868 18, ,818,265, ,723 21,397,981 18,318 9, ,946 15,871,983 9,525 5,776 Money Web Holdings Ltd MNY Publishing 107, , ,210 1,923 1, ,441 1, Morvest Business Grp Ltd MOR Buss Supp Serv 880, F 1 28/10 3,986, , ,322 22, ,484 27, Mpact Limited MPT Cont & Pack 163, F /04 I /09 6,148,839 2, , ,800 4, ,439,376 90,805 2,194,980 2,819 1, ,356 1,873,038 2,010 1,400 Mr Price Group Ltd MPC Appar Retail 251, F /06 19,131,983 15, , ,500 30, ,946,486, ,055 32,740,071 15,854 11, ,536 41,766,541 14,656 8,050 MTN Group Ltd MTN Mobile Telecom 1,873, F /04 I /09 87,146,488 20, , ,828 93, ,176,831,278 1,398, ,401,342 20,498 15,679 1,720, ,171,084 17,955 12,700 Murray & Roberts Hldgs MUR Heavy Contr. 444, ,130,925 3, , ,870 15, ,304, ,097 10,183,699 3,165 2, ,565 9,116,669 3,195 2,015 Mustek Ltd MST Comp hardw 108, F 17 07/10 905, ,759,577 21, , , , Nampak Ltd NPK Cont & Pack 697, F /01 I /07 40,198,566 3, , ,925 25, ,362,593, ,702 15,201,560 3,957 2, ,389 8,697,805 3,330 2,150 Nampak Ltd 6%Pref NPKP Pref Shares I /01 F / Nampak Ltd 6,5%Pref NPP1 Pref Shares I /01 F / Naspers Ltd -N- NPN Broadcast & ent 415, F /09 28,133,236 97, , ,288 98, ,420,022, , ,252,488 98,000 53, , ,540,163 57,168 35,001 NB ANGLO STUB 10APR2014 NBKIO2 Inv. Prod 12,000 22,356 17, , , ,669, ,398 17,387 13,501 Nedbank Group Ltd NED Banks 510, F /04 I /09 9,742,931 21, , ,070 27, ,031,699, ,616 39,245,618 21,925 16, ,910 32,543,739 19,120 14,125 Nedbank Ltd Pref NBKP Pref Shares 358, F /03 I /09 5,231,388 1, ,139,073 69, ,097 1, , ,137 1,150 1,022 Net 1 UEPS Tech Inc NT1 Fin Admin 58, ,306 12, , , ,992,351 5, ,159 12,999 4,211 5, ,995 8,600 3,000 Netcare Limited NTC Healthc Prov 1,476, F /02 I /07 63,156,388 2, , ,478 24, ,538,397, ,567 15,005,273 2,560 1, ,439 13,883,849 1,983 1,296 Netcare Limited Pref NTCP Pref Shares 6, I /05 F /11 215,758 8, , ,355 1, ,184,303 1, ,242 9,200 8,001 3, ,717 9,800 8,700 New Europe Prop Inv plc NEP Real Estate Holding & Dev 195, SC 08/ ,338,732 8, , ,949 1, ,293,251 36,805 2,495,313 8,499 5,100 28,871 1,157,844 5,450 3,200 SECURITIES INFORMATION 32 DIVIDEND FOOTNOTES F = Final dividend (current year) I = Interim dividend + = See Company Information Totals for shares traded, value and deals for Current month and Range for 2006 may vary due to correction trades Closing price but no high/low for month indicates last price in preceeding month Buyers/sellers price given as closing price, but no high low indicates either (a) no sales in current month, but no buyers and sellers prices, Or (b) Historical buyers and sellers prices only. 33
30 2010 PAYMENTS 2011 PAYMENTS 2012 PAYMENTS 2013 PAYMENTS (YEAR TO DATE) TRADING STATISTICS FOR NOVEMBER 2013 TRADING STATISTICS 2013 TO NOVEMBER TRADING STATISTICS 2012 SECURITIES INFORMATION ISSUED NATURE OF SHARES PAY PAY OTHER HIGH HIGH LOW LOW CLOSE DAYS VOLUME VALUE HIGH LOW VOLUME VALUE HIGH LOW SECURITY BUSINESS (000 S) DIV CAP DIV CAP DIV CAP DIV AMT DATE DIV AMT DATE PAY VOLUME PRICE DATE PRICE DATE PRICE DEALS TRADE VALUE (000 s) (R000 s) PRICE PRICE (000 s) (R000 s) PRICE PRICE SHARE CODE SC 30/ New Gold Issuer Ltd GLD Exchange Traded Funds 139,636 6,406,660 13, , ,274 1, ,752, ,197 21,510,174 14,800 11, ,853 13,647,067 16,000 12,074 New Gold Platinum ETF NGPLT Exchange Traded Funds 86,000 13,408,902 15, , ,998 1, ,916,790, ,196 14,800,026 16,300 13,100 New Rand NRD Exchange Traded Funds 3, I /10 IT 31/ ,321 3, , , , ,006 3,567 2,694 1,778 48,532 2,917 2,249 NEWFUNDS EQUITY MOM ETF NFEMOM Exchange Traded Funds 1, I /01 I /04IT 23/ ,598 2, , , , ,680 4,198 1,845 1,784 34,045 1,994 1,537 I /07 I /10IT 24/ IT 23/ IT 22/ NEWFUNDS GOVI ETF NFGOVI Exchange Traded Funds 1,000 26,409 4, , , ,135,942 1,116 48,170 4,573 4,099 2,039 87,114 6,163 3,739 NEWFUNDS ILBI ETF NFILBI Exchange Traded Funds 1,000 74,507 5, , , ,961, ,288 5,665 5,063 1,839 96,913 5,375 4,570 Newfunds MAPPS Growth MAPPSG Exchange Traded Funds 1, I /01 I /01IT 23/ ,039 1, , , , ,642 1,592 1,300 1,918 25,937 1,410 1,144 I /01 I /04IT 24/ I /04 I /07IT 23/ I /07 I /07IT 31/ I /10 I /10IT 22/ I /10 Newfunds MAPPS Protect MAPPSP Exchange Traded Funds 1, F /01 I /01IT 23/ ,808 2, , , ,780, ,296 2,792 2,529 2,032 52,766 2,642 2,196 I /01 I /04IT 24/ I /04 I /07IT 23/ I /07 I /07IT 31/ I /10 I /10IT 22/ I /10 NEWFUNDS NEWSA INDEX NEWFSA Exchange Traded Funds 1, I /01 I /01IT 23/ , , , , ,025 4,575 3,734 1,995 75,413 3,868 3,119 I /04 I /04IT 24/ I /07 I /07IT 23/ I /10 I /10IT 22/ NEWFUNDS SHARIA TOP40 NFSH40 Exchange Traded Funds 5, I /01 I /04 176, ,730 2,885 10, ,775 15, I /04 I /07 I /07 I /10 I /10 NEWFUNDS SWIX 40 ETF NFSWIX Exchange Traded Funds 1, I /01 I /01IT 23/ ,134 1, , , ,251, ,792 1,276 1,014 1,970 20,145 1, I /01 I /04IT 24/ I /04 I /07IT 23/ I /07 I /10IT 22/ I /10 I /10 NEWFUNDS TRACI 3-M ETF NFTRCI Exchange Traded Funds 3,825 2,730,838 1, , , ,581,190 4,288 75,824 1, ,908 32,196 1,774 1,634 NEWWAVE EURO ETN 12MAR42 NEWEUR Exchange Traded Notes , , , , ,403 1, , NEWWAVE GBP ETN 12MAR42 NEWGBP Exchange Traded Notes IT 09/09 2 2,813 1, , , , ,887 1,670 1, ,417 1,338 NEWWAVE INDEXETN 13JUN22 NEWBCI Exchange Traded Notes 1 NEWWAVE PLAT ETN 12MAR42 NEWPLT Exchange Traded Notes ,730 14, , , ,508,782 2, ,143 16,000 12,960 1, ,359 19,800 11,390 NEWWAVE SLV ETN 12MAR42 NEWSLV Exchange Traded Notes 6,554 1,054, ,189,656 8,261 19, ,568 11, NEWWAVE USD ETN 12MAR42 NEWUSD Exchange Traded Notes 1, ,716 1, , , ,359,331 2,740 26,324 1, ,466 37, Nictus Ltd NCS Broad Retail 66, , , , Niveus Investments Ltd NIV Equity inv Instr 114,132 SC 12/ ,707,953 2, , , ,776,302 20, ,180 2, , ,822 2, Northam Platinum Ltd NHM Plat & Prec. Met 382, ,629,663 4, , ,000 12, ,542, ,549 7,508,082 4,390 3, ,637 7,276,391 3,870 2,251 Northam Platinum Ltd NPL NHMN Plat & Prec. Met 15,000 3,214, , ,543,597 3,214 2, Nu-World Hldgs Ltd NWL Cons. Electro 22, ,272 2, , , ,016,925 1,162 21,536 2,100 1,600 1,911 35,091 2,299 1,503 Nutritional Holdings Ltd NUT Pharmac 1,997,368 26,119, , ,193 6, ,370 13, Oando plc OAO Int. Oil & Gas 6,822, F /08 529, ,069 40,709 30, ,751 5, Oasis Crescent Prop Fund OAS Retail REITs 44, SC 03/ ,022 1, , , ,502 2,304 30,752 1,400 1,290 4,653 59,947 1,385 1,217 SC 03/ SC 03/ IT 03/ IT 03/ IT 03/ Oceana Group Ltd OCE Farm & Fish 119, F /01 I 85 01/07 1,814,357 8, , ,701 2, ,028,949 18,319 1,514,460 9,876 6,505 14, ,664 7,391 4,201 Octodec Invest Ltd OCT Real Estate Holding & Dev 108, I /05 F /11 IT 20/ ,350,233 2, , , ,908,372 20, ,164 2,600 1,815 33, ,613 2,125 1,000 IT 18/ Old Mutual plc OML Life Ins 4,896, F /05 I /10 131,376,774 3, , ,320 51, ,306,394,186 1,768,965 51,771,280 3,389 2,465 2,396,662 48,826,846 2,500 1,710 Omnia Holdings Ltd OMN Spec. Chemicals 67, I /01 F /07 3,828,322 21, , ,000 4, ,694,227 32,076 5,602,334 21,500 13,745 33,299 3,616,911 14,683 8,454 Onelogix Group Ltd OLG Transp serv 231, I /04 F /10 1,165, ,396,644 31,415 88, ,723 25, Orion Real Estate Ltd ORE Real Estate Holding & Dev 630, , ,715 1, , Osiris Properties Int Ltd OPI Real Estate Holding & Dev 664 1, ,555 1, , Palabora Mining Co Ltd PAM Nom-ferr Metals 48, , ,970 11, , , ,064,669 15,047 1,618,447 11,950 9,700 13,726 1,592,100 16,385 7,250 PaladiumCommodity-Linker SBAPD1 Exchange Traded Notes 500 4,926 21, , , ,022, ,431 22,020 16, ,398 17,000 13,093 Pallinghurst Res Ltd PGL Equity inv Instr 760,453 7,273, ,835, , , , , Pamodzi Gold Limited PZG Gold 93,545 Pan African Resource plc PAN Gold 1,827, ,628, , ,022, ,094 1,499, ,877 1,342, Peregrine Holdings Limited PGR Asset man 206, F /07 IS 29/ ,217,964 1, , ,570 3, ,918,133 77, ,478 1,590 1,030 38, ,017 1, Petmin Ltd PET Gen Mining 576, F /11 2,200, ,550, , , , , Phumelela Game Leisure PHM Gambling 77, I /05 F 51 28/10 661,949 1, , , ,746,601 20, ,575 29, , ,377 1, Pik n Pay Holdings Ltd PWK Food Ret & Whole 527, F /06 4,470,862 2, , ,186 3, ,825,099 98,868 1,818,245 2,213 1, ,092 2,604,717 2,170 1,756 Pik n Pay Stores Ltd PIK Food Ret & Whole 480, F /06 14,994,907 5, , ,940 17, ,781, ,058 9,484,693 5,005 3, ,769 10,646,509 4,790 3,989 Pinnacle Point Group Ltd PNG Real Estate Holding & Dev 8,311,122 Pinnacle Tech Hldgs Ltd PNC Comp hardw 170, F /11 6,957,589 2, , ,420 3, ,493,060 71,577 1,619,420 2,724 1,822 74,462 1,148,531 1,861 1,055 Pioneer Foods Group Ltd PFG Food Prod 231, F /02 I /07 5,285,204 9, , ,145 4, ,596,991 33,128 2,578,441 9,490 6,500 48,840 2,783,648 7,050 5,025 Platfields Limited PLL Plat & Prec. Met 789, , ,670 2, PlatinumCommodity-Linker SBAPL1 Exchange Traded Notes 2, ,105 12, , , ,998,640 1, ,539 14,266 11,231 2, ,508 13,490 9,897 Poynting Hldgs Ltd POY Telecom equip 94, , ,456 8,259 10, ,884 4, PPC Limited PPC Build Mat & Fix 605, F /01 I /06 19,357,710 3, , ,130 11, ,622, ,526 8,263,481 3,680 2, ,887 8,943,081 3,650 2,410 PrefEx Securities PREFEX Exchange Traded Funds 21, F /03 F /03 IT 06/ ,167,679 1, , ,656,067 5,050 51,683 1, ,638 50,977 1,150 1,061 F /03 I /06 IT 05/ I /06 I /09IT 11/ I /09 Premium Properties Ltd PMM Real Estate Holding & Dev 156, F /05 I /11 IT 20/ ,048,983 1, , , ,489,065 22, ,384 2,269 1,600 39, ,127 1,875 1,400 IT 18/ Prescient Limited PCT Asset man 1,598, SC 05/ ,099, ,423,670 53,841 54, ,078 55, Primeserv Group Ltd PMV Bus Train & empl agen 132, , ,460 7,440 2, ,622 2, PropTrax SAPY PTXSPY Exchange Traded Funds 2, IT 21/ ,283 5, , , ,534,918 1,288 66,254 5,870 4,600 6, ,803 5,200 3,870 IT 21/ IT 21/ IT 16/ IT 16/ IT 22/ IT 22/ IT 18/ IT 18/ PropTrax TEN PTXTEN Exchange Traded Funds 9, IT 21/ ,043,545 1, , , ,853,010 9, ,736 1,750 1,330 6,600 88,612 1,510 1,153 IT 21/ SECURITIES INFORMATION 34 DIVIDEND FOOTNOTES F = Final dividend (current year) I = Interim dividend + = See Company Information Totals for shares traded, value and deals for Current month and Range for 2006 may vary due to correction trades Closing price but no high/low for month indicates last price in preceeding month Buyers/sellers price given as closing price, but no high low indicates either (a) no sales in current month, but no buyers and sellers prices, Or (b) Historical buyers and sellers prices only. 35
31 2010 PAYMENTS 2011 PAYMENTS 2012 PAYMENTS 2013 PAYMENTS (YEAR TO DATE) TRADING STATISTICS FOR NOVEMBER 2013 TRADING STATISTICS 2013 TO NOVEMBER TRADING STATISTICS 2012 SECURITIES INFORMATION ISSUED NATURE OF SHARES PAY PAY OTHER HIGH HIGH LOW LOW CLOSE DAYS VOLUME VALUE HIGH LOW VOLUME VALUE HIGH LOW SECURITY BUSINESS (000 S) DIV CAP DIV CAP DIV CAP DIV AMT DATE DIV AMT DATE PAY VOLUME PRICE DATE PRICE DATE PRICE DEALS TRADE VALUE (000 s) (R000 s) PRICE PRICE (000 s) (R000 s) PRICE PRICE SHARE CODE IT 16/ IT 16/ IT 22/ IT 22/ IT 18/ IT 18/ Protech Khuthele Hldgs PKH Heavy Contr. 362, ,767, ,400,519 39,277 20, ,819 31, PSG Financial Serv Pref PGFP Pref Shares 17, I /03 I /09 288,162 7, , , ,402,826 2, ,393 8,900 7,550 2, ,499 9,325 8,470 PSG Group Ltd PSG Inv serv 207, F 78 13/05 I /11 1,056,862 8, , ,764 1, ,960,642 21,825 1,453,553 8,500 5,880 19,681 1,161,842 7,332 4,470 PSV Holdings Ltd PSV Industr mach 272, , ,094 74,905 15, ,220 6, Purple Capital Ltd PPE Inv serv 822,905 5,309, ,227,797 47,638 9, ,999 10, Putprop Ltd PPR Real Estate Holding & Dev 28, I /04 F /10 10, , , ,575 9, Quantum Prop Group Ltd QPG Real Estate Holding & Dev 152, Rand Merchant Ins Hldgs Ltd RMI Equity inv Instr 1,485, I /04 F /10 23,844,429 2, , ,700 13, ,425, ,708 9,626,907 2,883 2, ,152 7,107,168 2,363 1,345 Randgold & Expl Co Ltd RNG Gold 74, , ,104 6,270 13, ,182 5, Rare Holdings Ltd RAR Ind Supp 17,888 1,421, ,021 33,642 2, ,587 4, Raubex Group Ltd RBX Heavy Contr. 185, F /06 4,239,164 2, , ,380 4, ,487,465 70,067 1,519,903 2,520 1,600 54, ,933 1,800 1,250 RBA Holdings Ltd RBA Home Contr. 614,876 31,984, ,230, ,290 35, ,208 19, RCL Foods Limited RCL Farm & Fish 625, ,718,267 1, , , ,721,586 41, ,022 1,900 1,400 26, ,575 1,599 1,249 Rebosis Property Fund Ltd REB Diversified REITs 373, IT 22/ ,714,355 1, , ,198 2, ,679,213 91,061 1,091,198 1,425 1,052 85, ,725 1, RECM and Calibre Limited RACP Pref Shares 45, ,160 1, , , ,068,534 8,510 86,335 3, ,989 38,977 1, Redefine International P.L.C RPL Real Estate Holding & Dev 1,057,158 F /11 28,549, , ,756,099 33, , Redefine Properties Ltd RDF Diversified REITs 2,935, IT 27/ ,891,015 1, , ,003,895,566 1,295,188 12,810,864 1, ,997 8,546,283 1, IT 25/11 35 Reinet Inv Soc Anon REI Equity inv Instr 1,959,413 89,374,865 2, , ,929 23, ,760,094, ,454 9,154,294 2,091 1, ,168 9,322,610 1,750 1,333 Remgro Ltd REM Div Indust 481, I /04 F /11 13,991,309 20, , ,455 31, ,737,450, ,460 42,726,694 20,784 15, ,987 29,982,412 15,999 11,865 Resilient Prop Inc Fund RES Retail REITs 293, IT 04/ ,620,830 5, , ,381 5, ,159,942 71,416 3,817,684 6,120 4,670 69,623 3,012,986 5,600 3,427 IT 02/ Resource Generation Ltd RSG Coal 569,396 Reunert Ltd RLO Electr Comp & eq 201, F /01 I /06 6,266,814 7, , ,873 9, ,243,062 89,459 6,480,092 8,791 6,200 95,994 6,839,219 8,170 6,286 Rex Trueform Cl Co -N- RTN Appar Retail 17, , , ,815 9, ,157 1,700 1,599 Rex Trueform Cloth Co Ld RTO Appar Retail 2, , ,950 1, ,950 1,695 Rex Trueform Ltd 6%Pref RTOP Pref Shares I /01 F / RMB Coal ETN 05MAY2016 COLRMB Exchange Traded Notes , , , , ,689 67,539 53, ,292 85,497 58,951 RMB Holdings Ltd RMH Banks 1,411, I /04 F /10 28,965,151 5, , ,717 28, ,361,386, ,687 17,156,619 5,034 3, ,081 14,070,516 4,195 2,700 RMB Inflation X RMBINF Exchange Traded Funds 26, IT 07/ ,383,854 1, , , ,386,574 60,487 1,104,529 2,000 1,711 34, ,423 2,057 1,618 IT 09/04 6 IT 02/ IT 07/ RMB Mid Cap ETF RMBMID Exchange Traded Funds 18, I /01 I /04IT 02/ , ,290,635 6,185 43,535 5, ,408 5,695 5,079 F /07 I /10IT 07/ RMB Oil ETN 08DEC2015 OILRMB Exchange Traded Notes , , , , ,751 97,963 65, ,846 76,400 55,967 RMB Top 40 ETF RMBT40 Exchange Traded Funds 18, I /01 I /01 1,072,542 4, , , ,348,927 13, ,598 4,288 3,331 4, ,085 3,615 2,818 I /04 F /07 F /07 I /10 I /10 Rockcastle Global Real Estate Co Ltd ROC Real Estate Holding & Dev 440,000 I /03 F /10 1,722,468 1, , , ,407,180 32, ,394 1,500 1,088 4,060 39,188 1, Rockwell Diamonds Inc RDI Diamonds & Gems 50, , ,464 1,123 2, , Rolfes Technology Hldgs RLF Spec. Chemicals 108, I /03 F /10 1,865, ,857,595 31, ,527 1, , , Royal Bafokeng Platinum Ltd RBP Plat & Prec. Met 166,082 3,839,387 6, , ,000 2, ,065,659 35,284 1,992,620 6,499 4,201 24,516 1,352,273 6,749 4,374 SA Corp Real Estate Fund SAC Retail REITs 1,980, IT 25/ ,555, , ,197, ,284 2,916, ,401 3,151, IT 30/ SABLE PLATINUM LTD SLP Plat & Prec. Met 192, , ,102 6,844 5, ,937 6, SABMiller plc SAB Brewers 1,670, F /08 18,856,052 53, , ,749 46, ,952,466, , ,609,062 53,988 39, , ,313,635 40,360 27,984 Sabvest Ltd SBV Equity inv Instr 17, F 20 25/03 I 18 26/08 5,990 2, , , ,790 1,115 16,512 2,100 1, , Sabvest Ltd -N- SVN Equity inv Instr 29, F 20 25/03 I 18 26/ , , , ,792 2,256 29,554 2,050 1, ,738 1, Sacoil Holdings Ltd SCL Int. Oil & Gas 956,119 32,809, ,551, ,212 98, , , Sanlam Limited SLM Life Ins 2,100, F /04 IS 29/ ,877,409 5, , ,157 55, ,336,286,083 1,172,494 55,061,591 5,518 4,051 1,162,264 41,131,253 4,550 2,831 Santam Limited SNT Prop & Casual Ins 119, F /03 I /09 424,154 19, , ,725 2, ,389,298 12,345 2,347,478 21,901 16,696 11,894 1,994,560 20,112 13,950 Santova Logistics Ltd SNV Marine Tranp 136,459 F /07 11,580, ,047,422 80,595 83, ,374 22, Sanyati Holdings Ltd SAN Heavy Contr. 450, ,456 24, Sappi Ltd SAP Paper 541,446 36,675,905 3, , ,081 25, ,115,718, ,982 10,813,006 3,429 2, ,787 10,644,498 3,136 2,221 Sasfin Hldgs Ltd Pref SFNP Pref Shares 1, I /04 F /10 49,154 7, , , ,689, ,253 8,435 7, ,155 9,250 8,075 Sasfin Holdings Ltd SFN Inv serv 32, I 51 15/04 F /10 223,752 4, , , ,763,082 5, ,877 4,984 3,275 2,960 91,756 3,577 2,800 Sasol Limited SOL Int. Oil & Gas 649,750 1, , , I /04 F /10 38,038,009 52, , , , ,264,522, , ,761,386 52,098 36, , ,444,330 41,150 33,321 Satrix 40 Portfolio STX40 Exchange Traded Funds 213, F /01 F /01IT 22/ ,052,780 4, , ,028 1, ,134, ,632 6,387,682 4,150 3, ,751 3,541,277 3,513 2,883 F /01 I /04IT 22/ I /04 I /07IT 19/ I /07 I /07IT 19/ I /10 I /10IT 12/ I /10 IT 12/ IT 16/ IT 16/ Satrix DIVI Plus Portfolio STXDIV Exchange Traded Funds 882, F /01 F /01IT 22/ ,303, ,133, , , , , I /04 I /07IT 22/ I /10 I /10IT 19/ IT 19/ IT 12/ IT 12/ IT 16/ IT 16/ Satrix FINI Portfolio STXFIN Exchange Traded Funds 65, F /01 F /01IT 22/ ,054 1, , , ,748,464 11, ,797 1,324 1,037 30, ,625 1, F /01 I /04IT 22/ I /07 I /07IT 19/ I /07 I /10IT 19/ I /10 IT 12/ IT 12/ IT 16/ IT 16/ Satrix INDI Portfolio STXIND Exchange Traded Funds 26, F /01 F /01IT 22/ ,459,511 5, , , ,846,271 17, ,111 5,309 4,069 25, ,495 4,120 2,226 I /04 I /04IT 19/ I /07 I /07IT 12/ I /10 I /10IT 12/ I /10 IT 16/ IT 16/ Satrix RAFI 40 Portfolio STXRAF Exchange Traded Funds 87, F /01 F /01IT 11/ ,465,933 1, , , ,346,268 21, ,196 1, , , I /04 I /05IT 12/ I /05 I /06IT 12/ I /06 I /06IT 12/ SECURITIES INFORMATION 36 DIVIDEND FOOTNOTES F = Final dividend (current year) I = Interim dividend + = See Company Information Totals for shares traded, value and deals for Current month and Range for 2006 may vary due to correction trades Closing price but no high/low for month indicates last price in preceeding month Buyers/sellers price given as closing price, but no high low indicates either (a) no sales in current month, but no buyers and sellers prices, Or (b) Historical buyers and sellers prices only. 37
32 2010 PAYMENTS 2011 PAYMENTS 2012 PAYMENTS 2013 PAYMENTS (YEAR TO DATE) TRADING STATISTICS FOR NOVEMBER 2013 TRADING STATISTICS 2013 TO NOVEMBER TRADING STATISTICS 2012 SECURITIES INFORMATION ISSUED NATURE OF SHARES PAY PAY OTHER HIGH HIGH LOW LOW CLOSE DAYS VOLUME VALUE HIGH LOW VOLUME VALUE HIGH LOW SECURITY BUSINESS (000 S) DIV CAP DIV CAP DIV CAP DIV AMT DATE DIV AMT DATE PAY VOLUME PRICE DATE PRICE DATE PRICE DEALS TRADE VALUE (000 s) (R000 s) PRICE PRICE (000 s) (R000 s) PRICE PRICE SHARE CODE I /09 I /09IT 09/ I /10 I /10IT 04/ I /10 I /11 I /11 Satrix RESI Portfolio STXRES Exchange Traded Funds 9, F /01 I /04IT 22/ ,184 5, , , ,924,141 11, ,962 5,600 4,067 10, ,732 5,700 4,501 I /04 I /07IT 22/ I /10 I /10IT 19/ IT 19/ IT 12/ IT 12/ IT 16/ IT 16/ Satrix SWIX Top 40 Portfolio STXSWX Exchange Traded Funds 34, F /01 F /01IT 22/ ,550,516 1, ,454,941 19, ,772 1, , , F /01 I /04IT 22/ I /04 I /07IT 19/ I /07 I /07IT 12/ I /10 I /10IT 12/ I /10 IT 16/ IT 16/ SB Copper ETN SBACOP Exchange Traded Notes 10, , , , ,177 1,047 12,899 1,354 1,000 1,494 18,198 1,291 1,074 SB Corn ETN SBACRN Exchange Traded Notes 5,000 3,277 1, , , , ,388 1, ,744 1, SB Wheat ETN SBAWHT Exchange Traded Notes 5,000 11,310 1, , , , ,483 1,189 1, ,073 1, SB WTI Oil ETN SBAOIL Exchange Traded Notes 10,000 6,810 1, , , , ,648 2,191 1, ,273 1,652 1,284 SBA Commodity Index ETN SBACI Exchange Traded Notes 10,000 8,718 1, , , , ,419 1, ,238 1,031 SBAfricaEquity Index ETN SBAEI Exchange Traded Notes 20,000 38,679 1, , , ,524 1,901 19,890 1, ,621 4, Sea Kay Holdings Ltd SKY Heavy Contr. 488, ,889 1, Seardel Inv Corp -N- SRN Cloth & access 411,233 9,479, ,436,200 12,470 36, ,790 2, Seardel Inv Corp Ltd SER Cloth & access 645,520 6,056, ,980,703 18,914 44, ,379 29, Securedata Holdings Ltd SDH Comp Serv 246, ,988, ,643 78,509 24, ,449 10, Sekunjalo Inv Ltd SKJ Spec Finance 489,339 1,538, ,671 17,954 9, ,253 10, Sentula Mining Ltd SNU Gen Mining 586,559 20,676, ,571, , , , , Sephaku Holdings Ltd SEP Gen Mining 188,999 6,598, ,374,674 36, , ,149 41, Sherbourne Capital Ltd SHB Software 781, ,340 1, ,665 31, Shoprite 2nd 5%Pref SHP3 Pref Shares F /03 I / Shoprite 3rd 5%Pref SHP4 Pref Shares F /03 I / Shoprite 5%Pref SHP2 Pref Shares F /03 I / Shoprite 6%Pref SHP1 Pref Shares F /03 I / Shoprite Holdings Ltd SHP Food Ret & Whole 570, I /03 F /09 27,730,313 18, , ,882 56, ,949,442, ,390 88,221,979 20,716 15, ,383 67,119,329 20,590 12,477 Shoprite Investments Limited SHPCB Food Ret & Whole , IT 03/ ,024 1,200, ,160, ,160, ,012, ,485 1,330,000 1,120, ,104,495 1,280,000 1,080,000 IT 03/ Sibanye Gold Limited SGL Gold 735,079 I /10 36,183,731 1, , ,271 18, ,129,126 1,013,458 11,743,219 1, Silverbridge Holdings SVB Software 34, , ,584 1,886 1, SilverCommodity-Linker ETN SBAS1 Exchange Traded Notes 500 5,262 16, , , , ,561 22,310 13, ,229 27,774 16,355 Soapstone Investments CB DMCCB Diamonds & Gems 4 IT 16/ South African Coal Mining SAH Coal 452, , , South Ocean Holdings Ltd SOH Electr Comp & eq 156, ,945, ,853,595 20,995 30, ,726 35, Southern Electricity Co SLO Conv Electricity 54, , ,926 1, Southern View Finance Ltd SVF Cons Fin 22,397 Sovereign Food Inv Ltd SOV Farm & Fish 76,376 F /06 398, ,213,221 23, , ,104 79, Spanjaard Limited SPA Spec. Chemicals 8, F /05 I /11 7, , , Spur Corporation Ltd SUR Rest & Bars 97, I /04 F /10 2,267,240 3, , ,000 1, ,185,279 23, ,352 3,475 2,260 23, ,013 2,600 1,500 Square One Solutions Grp SQE Comp Serv 44,394 Standard Bank Group Ltd SBK Banks 1,618, I /09 SC 22/ ,897,725 12, , ,065 65, ,139,022, , ,643,078 12,845 10, , ,232,076 12,030 9,876 Standard Bank Group Pref SBPP Pref Shares 52, F /04 I /09 779,559 9, , , ,787,197 11,210 1,050,260 10,080 8,690 9, ,957 10,550 9,600 STANLIB SA Property ETF STPROP Exchange Traded Funds 1,386 I /07 I /10 IT 12/ ,380 5, , , ,161, ,568 5,873 4,562 IT 12/ CP 12/ CP 11/ IT 11/ STANLIB SWIX 40 Fund STANSX Exchange Traded Funds 296, F /01 I /04 IT 11/ , ,510 5,756 45, ,515 73, I /04 I /07 IT 11/ I /10 I /10 IT 12/ IT 12/ CP 12/ IT 12/ IT 12/ IT 11/ IT 11/ STANLIB Top 40 Fund STAN40 Exchange Traded Funds 12, I /01 I /01 IT 11/ ,679 4, , , , ,549 4,140 3, ,053 3,540 2,890 I /04 I /04 IT 12/ I /07 I /07 IT 12/ I /10 I /10 CP 12/ IT 11/ Std Bank Group 6,5%Pref SBKP Pref Shares 8, F /04 I /09 60, ,536 1,590 1, , Stefanuti Stck Hldgs Ltd SSK Heavy Contr. 188, ,144,010 1, , ,279,188 49, ,403 1, , ,240 1, Steinhoff Int Hldgs Ltd SHF Furnish 1,904, ,335,073 4, , ,042 51, ,170,174,349 1,392,579 40,501,659 4,188 2,212 1,262,466 33,391,586 3,080 2,289 Steinhoff Inv Hldgs Pref SHFF Pref Shares 15, I /04 F /10 192,405 8, , , ,112,910 7, ,809 8,975 7,100 3, ,328 9,625 8,650 Stella Vista Tech Ltd SLL Electr Comp & eq 198,591 1,572, ,165 10, , Sterling Waterford CCN SPV CBN013 Exchange Traded Notes 290 1, ,300 1, ,000 7,000 Stratcorp Ltd STA Inv serv 206, , Sun International Ltd SUI Gambling 114, I /03 F /09 3,922,307 10, , ,450 4, ,501,867 48,101 4,804,413 11,427 9,150 33,889 2,902,024 10,017 7,601 Super Group Ltd SPG Transp serv 315,334 9,680,460 2, , ,599 6, ,495, ,398 2,781,412 2,699 1, ,231 2,893,292 1,685 1,057 Sycom Property Fund SYC Retail REITs 200, IT 08/ ,170,767 2, , ,560 1, ,968,373 60,525 1,602,692 3,270 2,232 45,689 1,182,932 3,050 2,260 Synergy Inc Fund Ltd A L/U SGA Retail REITs 47, IT 25/ , ,558,796 4,147 42,930 1, , ,656 1, IT 23/ Synergy Inc Fund Ltd B L/U SGB Retail REITs 106, IT 25/ , ,032,992 10,441 70, , , IT 23/ Taste Hldgs Ltd TAS Appar Retail 197, F /07 4,920, ,270,929 31, , ,083 72, Tawana Resources NL TAW Diamonds & Gems 1,220,629 1,221, ,809 4, Telemaster Holdings Ltd TLM Fixed Line Tel 42, F /01 I /04 182, , ,207 1, I /07 I /10 Telkom SA SOC Ltd TKG Fixed Line Tel 520, ,198,415 2, , ,680 13, ,181, ,184 5,051,840 2,944 1, ,313 8,716,832 2,975 1,491 The Foschini Group Limited TFG Appar Retail 225, I /01 F /07 26,257,331 11, , ,150 43, ,745,489, ,197 42,240,498 14,737 9, ,348 26,936,353 14,678 10,351 The Spar Group Ltd SPP Food Ret & Whole 173, I /06 9,652,937 13, , ,000 23, ,236,390, ,712 14,277,940 13,335 10, ,889 12,772,959 13,185 10,600 The Waterberg Coal Co Ltd WCC Coal 130, , , , Tiger Brands Ltd TBS Food Prod 191, F /01 I /07 16,869,400 31, , ,429 44, ,992,381, ,235 41,240,199 33,750 27, ,555 39,530,491 32,795 23,592 Times Media Group Ltd TMG Publishing 127,077 2,536,506 2, , ,000 1, ,205,213 44, ,050 2,300 1,330 18, ,745 1,450 1,150 Tongaat Hulett Ltd TON Food Prod 108, I /01 F /07 4,545,433 12, , ,744 8, ,551,465 55,600 7,195,085 14,940 11,365 42,440 5,293,788 14,700 9,976 Torre Industrial Hldgs Ltd TOR Ind Supp 180,316 F /07 2,489, ,836,821 74, , ,786 8, SECURITIES INFORMATION 38 DIVIDEND FOOTNOTES F = Final dividend (current year) I = Interim dividend + = See Company Information Totals for shares traded, value and deals for Current month and Range for 2006 may vary due to correction trades Closing price but no high/low for month indicates last price in preceeding month Buyers/sellers price given as closing price, but no high low indicates either (a) no sales in current month, but no buyers and sellers prices, Or (b) Historical buyers and sellers prices only. 39
33 2010 PAYMENTS 2011 PAYMENTS 2012 PAYMENTS 2013 PAYMENTS (YEAR TO DATE) TRADING STATISTICS FOR NOVEMBER 2013 TRADING STATISTICS 2013 TO NOVEMBER TRADING STATISTICS 2012 SECURITIES INFORMATION ISSUED NATURE OF SHARES PAY PAY OTHER HIGH HIGH LOW LOW CLOSE DAYS VOLUME VALUE HIGH LOW VOLUME VALUE HIGH LOW SECURITY BUSINESS (000 S) DIV CAP DIV CAP DIV CAP DIV AMT DATE DIV AMT DATE PAY VOLUME PRICE DATE PRICE DATE PRICE DEALS TRADE VALUE (000 s) (R000 s) PRICE PRICE (000 s) (R000 s) PRICE PRICE SHARE CODE Total Client Services Ld TCS Comp Serv 390,135 5,705, ,710 14, ,040 1, Tower Property Fund Ltd TWR Diversified REITs 113, , ,877,223 4,662 41,244 1, Tradehold Ltd TDH Real Estate Holding & Dev 138,567 F /06 453,196 1, , , ,101,840 4,897 45,874 1, ,714 33, Trans Hex Group Ltd TSX Diamonds & Gems 106,051 1,286, ,492,752 18,973 64, ,130 80, Transaction Capital Ltd TCP Spec Finance 582, I 9 10/06 6,395, ,912,639 38, , , , Transpaco Ltd TPC Cont & Pack 33, I /03 F /09 201,884 1, , , ,420,384 1,998 34,804 2,000 1,510 1,692 29,230 1,990 1,500 Trematon Capital Inv Ltd TMT Equity inv Instr 180, F /02 204, ,832 2,559 6, ,947 6, Trencor Ltd TRE Transp serv 177, F /03 I /09 IS 29/ ,428,521 7, , ,860 2, ,245,854 41,892 2,817,451 7,989 5,310 50,438 2,450,614 6,382 3,700 Trustco Group Hldgs Ltd TTO Spec Finance 772, ,475, ,053, , , , , Truworths Int Ltd TRU Appar Retail 463, I /03 F /09 30,811,253 9, , ,101 46, ,623,217, ,727 41,967,948 11,736 7, ,329 28,843,267 10,930 7,300 Tsogo Sun Holdings Ltd TSH Gambling 1,182, F /06 4,521,561 3, , ,630 2, ,071,685 54,223 1,378,869 3,139 2,120 48, ,995 2,559 1,650 Ububele Holdings Ltd UBU Food Prod 178, , ,891 33,343 16, ,046 7, Value Group Ltd VLE Transp serv 198, I /01 F /07 692, ,560,866 8,590 50, , , Verimark Holdings Ltd VMK Broad Retail 114, , ,137 5,637 4, ,257 25, Village Main Reef GM Co VIL Gold 1,040, ,479, ,977, , , , , Vividend Income Fund Ltd VIF Diversified REITs 267, IT 29/ ,391, , ,848,273 91, , , , IT 18/11 23 Vodacom Group Ltd VOD Mobile Telecom 1,487, F /07 41,598,931 12, , ,182 69, ,086,710, ,910 58,735,236 12,988 10, ,969 54,879,149 12,515 8,823 Vukile Property Fund Ltd VKE Retail REITs 478, F /06 F /06 CP 03/ ,148,777 1, , ,681 2, ,783, ,036 2,495,344 2,075 1, ,264 3,106,609 1,991 1,440 CP 03/ IT 24/ Vunani Ltd VUN Inv serv 105, , ,475 3,943 6, ,875 3, Vunani Prop Inv Fund Ltd VPF Diversified REITs 169, IT 25/ ,908,771 1, ,449,879 29, ,315 1, , ,223 1, IT 23/ Wescoal Holdings Ltd WSL Coal 187,187 F /08 5,090, ,219,588 47,105 62, ,090 30, Wesizwe Platinum Ltd WEZ Plat & Prec. Met 1,627,827 6,928, ,533, ,333 70, , , WG Wearne Ltd WEA Build Mat & Fix 276,393 1,217, ,573 8,100 1, ,131 1, Wilderness Holdings Ltd WIL Travel & Tour 231, F /06 14, ,371 18,736 55, ,770 74, William Tell Holdings Ltd WTL Build Mat & Fix 125, ,727 3, Wilson Bayly Hlm-Ovc Ltd WBO Heavy Contr. 66, I /04 F /10 2,429,580 18, , ,488 8, ,627,536 31,689 4,908,316 18,490 14,000 28,545 3,762,305 15,785 10,388 Winhold Ltd WNH Ind Supp 126, ,316, ,572 14,937 11, ,413 24, Witwatersrand Cons Gold WGR Gold 34,490 10,699 1, ,962 1,264 13,209 2, ,467 42,688 4,500 1,500 Woolworths Holdings Ltd WHL Broad Retail 846, I /03 F /09 68,443,143 7, , ,401 61, ,941,021, ,498 61,150,087 8,185 5, ,326 42,051,756 7,300 3,900 Workforce Holdings Ltd WKF Bus Train & empl agen 240, York Timber Holdings Ltd YRK Forestry 331,241 1,432, ,367,230 27,564 98, ,421 69, ZCI Limited ZCI Nom-ferr Metals 55,678 6, , , ,630 1, Zeder Inv Ltd ZED Spec Finance 980, F 4 06/05 31,516, , ,031, , , , , Zshares Govi ZGOVI Exchange Traded Funds 8, ,312 1, , , ,286,675 35, ,362 1,220 1,072 11, ,148 1,198 1,022 Zurich Insurance Co SA ZSA Prop & Casual Ins 12, F /03 I /09 39,455 26, , , ,258, ,249 27,000 23, ,736 25,500 21,300 AB LP BCA3-24JANUARY2017 LPBCA3 Inv. Prod 41 AB LP BCA4-07 MARCH 2017 LPBCA4 Inv. Prod 33 AB LP BCP7-17 July2017 LPBCP7 Inv. Prod 33 AB LP BRO01-23MAR2016 LPBR01 Other Sec 42 AB LP BRO02-18MAY2016 LPBRO2 Other Sec 45 AB LP DEP1-6 Sept 2016 LPDEP1 Other Sec 40 AB LP DM01-23MAR2017 LPDM01 Other Sec 88 AB LP DM03-12APRIL2017 LPDM03 Other Sec 63 AB LP WA01-11NOV2015 LPWA01 Other Sec 25 AB LP WA02-21DEC2015 LPWA02 Other Sec 8 AB LP WA03-23MAR2016 LPWA03 Other Sec 101 AB LP WA04-18MAY2016 LPWA04 Other Sec 46 AB LP WA05-04APRIL2016 LPWA05 Other Sec 52 AB LP WA06-20 JUNE 2016 LPWA06 Other Sec 80 AB LP WA08-20 JUNE 2016 LPWA08 Other Sec ,931 26,045 26,045 AB LP WA09-21Nov2016 LPWA09 Other Sec 20 AB LP WO01-18MAY2016 LPWO01 Other Sec 23 AB LP WO02-14 June 2016 LPWO02 Other Sec 31 AB LP WO03-17AUG2016 LPWO03 Other Sec 16 AB LP WO04-21Nov2017 LPWO04 Other Sec 44 AB LP WO05-03 May 2018 LPWO05 Other Sec 14 AB LSI RESET COMM 10MAY15 ABBB01 Other Sec , , ,607 AB LSI SW 16-14MAY2018 ABSW16 Other Sec 19 AB LSI SW 20-12JULY2019 ABSW20 Other Sec 19 ABLP BCA2-05 DEC 2016 LPBCA2 Inv. Prod 31 ABLP BCP2-05 DEC 2016 LPBCP2 Inv. Prod 22 ABLPBCA1-30October2017 LPBCA1 Other Sec ,821 25,311 25,311 ABLPBCA5-28 MARCH 2017 LPBCA5 Inv. Prod 22 ABLPBCA6-23 MAY 2017 LPBCA6 Inv. Prod 45 ABLPBCP1-30October2017 LPBCP1 Other Sec 12 ABLPBCP4-28 MARCH 2017 LPBCP4 Inv. Prod 29 ABLPBCP6-23 MAY 2017 LPBCP6 Inv. Prod 85 ABLPBCP8-21 AUGUST 2017 LPBCP8 Other Sec 30 ABLPBCP9-NOVEMBER 2017 LPBCP9 Inv. Prod 34 ABLPWA07-23 AUGUST 2016 LPWA07 Other Sec 61 ABLSICPITOP405DEC2012 ABCT01 Other Sec , , ,799 BNP Paribas Arbitrage37 ZA037 Inv. Prod 40,000 BNP Paribas Arbitrage38 ZA038 Inv. Prod 20,000 BNP Paribas Arbitrage39 ZA039 Inv. Prod 10,000 BNP Paribas Arbitrage40 ZA040 Inv. Prod 50,000 BNP Paribas Arbitrage42 ZA042 Inv. Prod 20,000 BNP Paribas Arbitrage43 ZA043 Inv. Prod 50,000 BNP Paribas Arbitrage44 ZA044 Inv. Prod 50,000 BNP Paribas Arbitrage45 ZA045 Inv. Prod , ,906 BNP Paribas Arbitrage46 ZA046 Inv. Prod 10,000 BNP Paribas Arbitrage47 ZA047 Inv. Prod 100,000 BNP Paribas Arbitrage48 ZA048 Inv. Prod 50,000 BNP Paribas Arbitrage49 ZA049 Inv. Prod 53,031 BNP Paribas Arbitrage50 ZA050 Inv. Prod 30,221 BNP Paribas Arbitrage51 ZA051 Inv. Prod 10,555 BNP Paribas Arbitrage52 ZA052 Inv. Prod 29,185 BNP Paribas Arbitrage53 ZA053 Inv. Prod 27,115 BNP Paribas Arbitrage54 ZA054 Inv. Prod 11,422 BNP Paribas Arbitrage55 ZA055 Inv. Prod 10,546 BNP Paribas Arbitrage56 ZA056 Inv. Prod 16,977 BNP Paribas Arbitrage57 ZA057 Inv. Prod 8,631 BNP Paribas Arbitrage58 ZA058 Inv. Prod 8,200 BNP Paribas Arbitrage59 ZA059 Inv. Prod 8,887 BNP Paribas Arbitrage60 ZA060 Inv. Prod 2,671 BNP Paribas Arbitrage61 ZA061 Inv. Prod 40,000 SECURITIES INFORMATION 40 DIVIDEND FOOTNOTES F = Final dividend (current year) I = Interim dividend + = See Company Information Totals for shares traded, value and deals for Current month and Range for 2006 may vary due to correction trades Closing price but no high/low for month indicates last price in preceeding month Buyers/sellers price given as closing price, but no high low indicates either (a) no sales in current month, but no buyers and sellers prices, Or (b) Historical buyers and sellers prices only. 41
34 2010 PAYMENTS 2011 PAYMENTS 2012 PAYMENTS 2013 PAYMENTS (YEAR TO DATE) TRADING STATISTICS FOR NOVEMBER 2013 TRADING STATISTICS 2013 TO NOVEMBER TRADING STATISTICS 2012 SECURITIES INFORMATION ISSUED NATURE OF SHARES PAY PAY OTHER HIGH HIGH LOW LOW CLOSE DAYS VOLUME VALUE HIGH LOW VOLUME VALUE HIGH LOW SECURITY BUSINESS (000 S) DIV CAP DIV CAP DIV CAP DIV AMT DATE DIV AMT DATE PAY VOLUME PRICE DATE PRICE DATE PRICE DEALS TRADE VALUE (000 s) (R000 s) PRICE PRICE (000 s) (R000 s) PRICE PRICE SHARE CODE BNP Paribas Arbitrage62 ZA062 Inv. Prod 70,000 BNP Paribas Arbitrage63 ZA063 Inv. Prod 13,022 BNP Paribas Arbitrage64 ZA064 Inv. Prod 200 DB STUBAGLI 05MAY2014 DBAGLI Inv. Prod 15,000 85,920 9, , ,143, ,143 9,948 9,007 DB STUBAGLJ 05MAY2014 DBAGLJ Inv. Prod 15,000 8,857,774 18, , , ,484,994,497 9,533 1,600,453 18,225 15,536 DB STUBAGLK 05MAY2014 DBAGLK Inv. Prod 30,000 8,523,034 16, , ,474,567,512 52,041 8,665,248 16,835 15,902 DB STUBAGLL 05MAY2014 DBAGLL Inv. Prod 30,000 7,960,514 8, , ,058,823 16,520 1,673,095 9,151 8,976 DB STUBNPNJ 05FEB2014 DBNPNJ Other Sec 10,000 IT 23/ ,873,746 9, , ,047,335 8, ,332 13,800 7,175 DB STUBNPNK 05AUG2014 DBNPNK Inv. Prod 10, ,612 13, , , ,384, ,385 13,557 13,557 DB STUBNPNL 05FEB2014 DBNPNL Other Sec 10,000 12,351,315 10, , , ,068,423 12, ,068 10,771 7,657 DB TOP 3150CF 0002 JAN14 TOPDWF Inv. Prod 3, ,747 1, DB TOP 32500CM 0002 JUL13 TOPDWM Inv. Prod 3, ,028 57,409 1, ,723 29, DB TOP 3550CG 0002 FEB14 TOPDWG Inv. Prod 3,000 62,400 1, , , ,688 1, DB TOP 3650CH 0002 FEB14 TOPDWH Inv. Prod 3, ,630 1, ,573,166 6,456 30,319 1, DB TOP 3750CI 0002 APR14 TOPDWI Inv. Prod 3,000 2,983, ,767,170 7,377 29, DB TOP 3950CJ 0002 MAY14 TOPDWJ Inv. Prod 3,000 3,187, ,053,156 3,188 5, DB TOP 4200PS 0002 FEB14 TOPDWS Inv. Prod 3,000 13,267, ,868,855 14,148 35, DB TOP 4300PV 0002 MAY14 TOPDWV Inv. Prod 3, DB TOP 4400PU 0002 APR14 TOPDWU Inv. Prod 3,000 10, , DB TOP 4600PW 0002 MAY14 TOPDWW Inv. Prod 3,000 1,110 IB AGLR158CHL1:1JUL14 AGLIHL Inv. Prod 1,400 I /09 31,710 10, , , ,608, ,588 10,700 6,927 IB AGRICOM- ONE MAY 2015 AGRIBA Other Sec , , , , ,199 1,006, ,740 IB BILR210CHK1:1JUL14 BILIHK Inv. Prod 1,000 F /09 42,050 11, , , ,690, ,342 11,751 8,534 IB BTI R385CHC1:1JUL14 BTIIHC Inv. Prod ,736 IB CFR 6900CHB1:1JUL14 CFRIHB Inv. Prod 2,600 F /09 4,690 3, , , , ,677 3,961 3,311 IB EUR50 AUTOCALL3 JUL16 EURIIB Inv. Prod , , , ,614 IB GRT CVD 1:1APR22 GRTIVD Inv. Prod 11, , , , , ,007 1, ,699 1,100 IB GRT 1850CVE1:1MAR28 GRTIVE Inv. Prod 1,000 1, , , IB GRT517BC1:1 JUL19 GRTIVC Inv. Prod , , , , ,300 2, ,266 2,234 IB HYP BC 1:1 JUL16 HYPIVC Inv. Prod , , , , ,308 6, ,744 6,052 IB IPF CVA1:1JUL16 IPFIVA Inv. Prod 150 5,000 1, , , , ,263 1, , IB IPF CVB 1:1APR22 IPFIVB Inv. Prod 40 1, IB IPLR157CHE1:1JUL14 IPLIHE Inv. Prod 350 F /09 6, ,169 7,608 6,719 IB KIOR353CHC1:1JUL14 KIOIHC Inv. Prod 140 I /08 43,333 10, , ,226, ,648 14,567 4,680 IB MTN R129CHJ 1:1MAY14 MTNIHJ Inv. Prod 1,900 I /09 83,521 7, , , ,152, ,602 7,654 4,390 IB NPNR596CHB1:1JUL14 NPNIHB Inv. Prod 500 F /09 17,172 39, , , ,270, ,214 40,798 29,990 IB RDF 720CHF 1:1JAN14 RDFIHF Inv. Prod 1,250 IT 27/ , , , IB RDF R714.69CVD1:1MAY24 RDFIVD Inv. Prod 1,500 37, , , IB REMR145CHI1:1JUL14 REMIHI Inv. Prod 340 F /11 48,872 6, , , ,029, ,370 6,777 4,821 IB SBK 8900CHG1:1FEB14 SBKIHG Inv. Prod 1,200 F /04 I / , , , , ,117 3,953 2,120 IB SHP R132CHF 1:1MAY14 SHPIHF Inv. Prod 650 F /09 49,430 6, , , ,599, ,561 6,450 3,393 IB SOL R308CHJ 1:1MAY14 SOLIHJ Inv. Prod 550 F /10 42,340 22, , , ,763, ,828 22,000 12,153 IB SP500 ACCELERAT APR14 ESPIBR Inv. Prod 11 2,062, ,998 1,872,826 1,616,938 IB SP500 AUTOCALL5 JUL18 SPXIIE Inv. Prod ,145 IB SP500 DIGITAL + SEP14 ESPIBU Inv. Prod 5 1,525,820 IB SP500 GEAR GROW JAN16 ESPIBZ Inv. Prod 4 1 1,366, ,366, ,409, , ,855 1,366,430 1,052, ,053,319 1,007,888 IB SP500DIGITALPLUSAPR17 ESPIBD Inv. Prod ,900 IB SYC CBV 1:1JUL16 SYCIVB Inv. Prod 5,000 2, ,586 2,244 IB SYC BC 1:1JUL19 SYCIVC Inv. Prod , , , , ,250 2,250 IB TOP40 FENCEGRTH JUN14 ESPIBQ Inv. Prod 11 1,513, ,449 1,475,183 1,228, ,039 1,039,410 1,039,410 IB TOP40 GEAR GROW DEC14 ESPIBT Inv. Prod 5 1,449, ,324 1,408,251 1,266, ,338 1,250,504 1,020,000 IB TOP40 PROTECTOR JUN14 ESPIBS Inv. Prod ,301, ,301, ,313, , ,301,752 1,301,752 IB VKE850CVA1:1MAY24 VKEIVA Inv. Prod 400 1, IB VOD 8300CHA1:1MAY14 VODIHA Inv. Prod 700 F /07 63,630 4, , , ,697, ,459 5,050 2,246 IBTOP40GEARGROW027APR15 ESPIBV Inv. Prod 5 1,465, ,557 1,426,261 1,280, ,205,000 1,042,001 IBTOP40GEARGROW0330SEP15 ESPIBW Inv. Prod 1 6 1,326, ,310, ,324, , ,371 1,326,233 1,150, ,150, ,681 IBTOP40GEARGROW0427OCT16 ESPIBA Inv. Prod ,100, ,075, ,097, , ,195 1,100,818 1,009,352 IBTOP40GEARGROW0430SEP15 ESPIBX Inv. Prod 0 7,017,933 IBTOP40GEARGROW0516MAR17 ESPIBB Inv. Prod ,010, , , , ,010, ,604 NB ABL 850CIH 1:1NOV14 ABLNIH Inv. Prod 100,000 24,000 1, , , NB ACL1746CIJ 1:1OCT14 ACLNIJ Inv. Prod 100,000 1,700 2, , , , ,553 2,327 NB AGLR172.82CNH1:1OCT14 AGLNNH Inv. Prod 100,000 1,200 10, , , , ,338 8,527 NB ANGLO STUB 15JUL 2014 NBAGL Inv. Prod 15, ,588 10, , , ,586,406 6, ,889 10,484 7,180 NB ANGLO STUB 18JUL2013 NBAGL5 Inv. Prod 15,000 7,798 6, ,577 10,300 6,471 10,590 1,068,570 11,500 8,286 NB ANGLO STUB6 19JUL2013 NBAGL6 Inv. Prod 15,000 NB ANGLO STUB7 19JUL2013 NBAGL7 Inv. Prod 15, ,864 6,863 NB ANGLO STUB8 19JUL2013 NBAGL8 Inv. Prod 15,000 6,479 1,230,970 19,001 17,069 NB BGA 7875CIH 1:1OCT14 BGANIH Inv. Prod 100,000 IS 25/ ,148 8, , , ,149, ,216 8,444 6,409 NB BILR211.50CNG1:1OCT14 BILNNG Inv. Prod 100,000 12,551 NB BVTR130.50CIJ 1:1OCT14 BVTNIJ Inv. Prod 100, , , , , ,637 13,480 NB CFR 5082CIF 1:1OCT14 CFRNIF Inv. Prod 100, , , , , ,866 5,866 NB FSR 1603CIJ 1:1APR14 FSRNIJ Inv. Prod 100,000 F /10 7,000 1, , , , ,855 1,222 NB FSR 2492CNI 1:1OCT14 FSRNNI Inv. Prod 100,000 1,203 NB GFI 3241CIJ 1:1APR14 GFINIJ Inv. Prod 100,000 25,674 1, , , , ,500 3,056 1,045 NB GFI 3293CNH 1:1OCT14 GFINNH Inv. Prod 100,000 1,417 NB HAR 1634CIJ 1:1OCT14 HARNIJ Inv. Prod 100,000 NB IMP 8871CNG1:1OCT14 IMPNNG Inv. Prod 100,000 1,000 6, , , , ,103 5,960 NB INL 3370CIG 1:1OCT14 INLNIG Inv. Prod 100,000 4,094 NB INP 3140CIJ 1:1APR14 INPNIJ Inv. Prod 100,000 F /08 F /08 4, ,974 3,463 NB INP 4371CNI1:1OCT14 INPNNI Inv. Prod 100,000 3,007 NB KIOR241.00CII1:1OCT14 KIONII Inv. Prod 100,000 19,249 NB MND 5950CIH 1:1APR14 MNDNIH Inv. Prod 100,000 I /09 11,056 NB MNP 5975CIH 1:1APR14 MNPNIH Inv. Prod 100,000 I /09 11, ,522 7,395 NB MTN 8170CIJ 1:1APR14 MTNNIJ Inv. Prod 100,000 I /09 12, ,410 9,372 NB MTNR143.25CNL 1:1OCT14 MTNNNL Inv. Prod 100,000 7,547 NB MUR 1520CIH 1:1NOV14 MURNIH Inv. Prod 100,000 1,512 NB OML 1560CIK 1:1OCT14 OMLNIK Inv. Prod 100,000 1, ,806 1,806 NB PIK 2065CIJ 1:1OCT14 PIKNIJ Inv. Prod 100, , , , , ,910 2,810 NB REI 973CIF 1:1OCT14 REINIF Inv. Prod 100,000 7,952 1, , , , ,131 1,020 NB RMH 2442CIJ 1:1OCT14 RMHNIJ Inv. Prod 100,000 2,555 NB SAB R234.57CIJ 1:1APR14 SABNIJ Inv. Prod 100,000 F /08 30, ,811 30,959 24,907 NB SAP 1305CIK 1:1APR14 SAPNIK Inv. Prod 100,000 20,131 2, , , , ,821 2,040 1,101 NB SBK 5751CIN 1:1APR14 SBKNIN Inv. Prod 100,000 I /09 6, ,225 5,984 NB SBK 8772CNIK1:1JAN14 SBKNNM Inv. Prod 100,000 F /04 I /09 5,000 3, , , , ,063 4,224 2,840 NB SBK 9000CNN 1:1OCT14 SBKNNN Inv. Prod 100,000 4,365 NB SHF 1910CIJ 1:1OCT14 SHFNIJ Inv. Prod 100,000 25,484 2, , , , ,379 2,023 NB SHP 8705CII 1:1OCT14 SHPNII Inv. Prod 100,000 10,105 NB SLM 2284CIJ 1:1APR14 SLMNIJ Inv. Prod 100,000 F /04 IS 29/ , ,011 3,078 2,159 NB SOLR361.50CNG1:1OCT14 SOLNNG Inv. Prod 100,000 18, ,480 19,480 SECURITIES INFORMATION 42 DIVIDEND FOOTNOTES F = Final dividend (current year) I = Interim dividend + = See Company Information Totals for shares traded, value and deals for Current month and Range for 2006 may vary due to correction trades Closing price but no high/low for month indicates last price in preceeding month Buyers/sellers price given as closing price, but no high low indicates either (a) no sales in current month, but no buyers and sellers prices, Or (b) Historical buyers and sellers prices only. 43
35 2010 PAYMENTS 2011 PAYMENTS 2012 PAYMENTS 2013 PAYMENTS (YEAR TO DATE) TRADING STATISTICS FOR NOVEMBER 2013 TRADING STATISTICS 2013 TO NOVEMBER TRADING STATISTICS 2012 SECURITIES INFORMATION ISSUED NATURE OF SHARES PAY PAY OTHER HIGH HIGH LOW LOW CLOSE DAYS VOLUME VALUE HIGH LOW VOLUME VALUE HIGH LOW SECURITY BUSINESS (000 S) DIV CAP DIV CAP DIV CAP DIV AMT DATE DIV AMT DATE PAY VOLUME PRICE DATE PRICE DATE PRICE DEALS TRADE VALUE (000 s) (R000 s) PRICE PRICE (000 s) (R000 s) PRICE PRICE SHARE CODE NB SPP 6225CIJ 1:1OCT14 SPPNIJ Inv. Prod 100,000 7,376 NB STX 1708CIJ 1:1APR14 STXNIJ Inv. Prod 100,000 I /07 I /07IT 12/ ,394 I /07 I /10IT 12/ I /10 I /10IT 16/ IT 16/ NB STX 2869CNG 1:1OCT14 STXNNG Inv. Prod 100,000 1,458 NB TBS R148.55CIJ 1:1OCT14 TBSNIJ Inv. Prod 100,000 2,600 16, , , , ,600 16,400 NB TRU 4645CIH 1:1NOV14 TRUNIH Inv. Prod 100,000 4,069 NB VOD 5420CIE 1:1APR14 VODNIE Inv. Prod 100,000 F /07 19,000 7, , , ,374, ,604 7,403 5,877 NB VOD 8535CNH 1:1OCT14 VODNNH Inv. Prod 100,000 10,500 4, , , , ,278 4,854 4,050 NB WHL 3697CII 1:1NOV14 WHLNII Inv. Prod 100,000 26,031 4, , , ,046, ,047 4,047 3,815 NBAGLR114.64CII1:1APR14 AGLNII Inv. Prod 100,000 I /09 11, ,988 9,005 NBAMSR212.CIJ 1:1OCT14 AMSNIJ Inv. Prod 100,000 3,000 21, , , , ,556 20,362 NBANG 9725CIJ 1:1APR14 ANGNIJ Inv. Prod 100,000 I /06 NBAPN R139.74CIH 1:1NOV14 APNNIH Inv. Prod 100,000 6,088 15, , , , ,173 12,870 NBBILR132.14CIJ1:1APR14 BILNIJ Inv. Prod 100,000 F /09 18, ,340 15,720 NBBVTR103.85CII1:1OCT13 BVTNII Inv. Prod 100,000 I /04 F / ,781 16,293 11, ,251 11,632 NBIMP 6360CIN1:1APR14 IMPNIN Inv. Prod 100,000 F 51 23/09 5, ,149 4,175 NBKIOEXXSTUB10 24JAN2014 NBEXX1 Inv. Prod 3, ,123 19, , , ,350,967 2, ,532 21,400 7,286 NBMTN R133.85CNI 1:1JAN14 MTNNNK Inv. Prod 100,000 F /04 I /09 6, ,275 6,500 4,326 NBNPNR474.25CIJ 1:1OCT14 NPNNIJ Inv. Prod 100,000 54,111 NBSOLR194.00CIJ 1:1APR14 SOLNIJ Inv. Prod 100,000 F /10 31, ,569 31,569 SB ABL 1180CTJ 1:1JUL14 ABLSTJ Inv. Prod 25,000 62, , , SB ABL 1306CD 5.97:1MAR14 ABLSBD Warrants 100,000 7,368, ,845,065 12,116 3, SB ABL 1350CE 6:1JUL14 ABLSBE Warrants 100, SB ABL 1493CC 5.97:1JAN14 ABLSBC Warrants 100,000 1,093, ,938 30,685 4, SB ABL 1866CB 7.46:1JAN14 ABLSBB Warrants 100,000 20, ,298 1, SB ABL 2300CTI 1:1MAY14 ABLSTI Inv. Prod 25,000 I /06 41, ,200 1,166 3, SB AGL R140CTH 1:1JUL14 AGLSTH Inv. Prod 25,000 I /09 4,577 12, , , , ,716 9,000 SB AGL R200PS 55:1JAN14 AGLSBS Warrants 100,000 30, ,700 6,689 1, SB AGL R215CA 70:1FEB14 AGLSBA Warrants 100, , ,574 5,885 1, SB AGL R220PT 50:1MAR14 AGLSBT Warrants 100, , ,060 2, SB AGL R245CC 65:1JUL14 AGLSBC Warrants 100, SB AGL R250CO 75:1DEC13 AGLSBO Warrants 100, , ,755 48,868 7, SB AGL R260CB 85:1APR14 AGLSBB Warrants 100,000 7,655, ,768,206 16,114 3, SB AMS R210CTH 1:1JUL14 AMSSTH Inv. Prod 25, , , , , ,850 20,792 SB AMS R310CG 120:1JAN14 AMSSBG Warrants 100, ,711 1, SB AMS R380CF 130:1DEC13 AMSSBF Warrants 100,000 1,290, ,204 10,337 2, SB AMS R440CH 160:1MAY14 AMSSBH Warrants 100,000 1,827, ,268 5,448 1, SB ANG R105CTI 1:1JUL14 ANGSTI Inv. Prod 25,000 4, ,924 3,132 SB ANG R135PP 50:1MAR14 ANGSBP Warrants 100,000 6,519, ,088,254 19,130 4, SB ANG R145CI 65:1FEB14 ANGSBI Warrants 100,000 2,873, ,096 33,083 7, SB ANG R145CJ 55:1MAY14 ANGSBJ Warrants 100,000 1,787, ,920 2, SB ANG R150CTH 1:1MAY14 ANGSTH Inv. Prod 25,000 I /06 18,250 3, , , , ,416 5,600 1,150 SB ANG R170CH 70:1JAN14 ANGSBH Warrants 100,000 2,558, ,089 40,949 5, SB ANG R175CL 55:1MAY14 ANGSBL Warrants 100,000 3,756, ,195 3, SB ANG R185CG 70:1DEC13 ANGSBG Warrants 100,000 3, , SB ANG R220CF 65:1DEC13 ANGSBF Warrants 100, , ,300 20,279 2, SB BGA R150CB 25:1JUL14 BGASBB Warrants 100, SB BIL R220CTJ 1:1OCT14 BILSTJ Inv. Prod 25,000 7,449 13, , , , ,452 13,232 9,618 SB BIL R235PZ 65:1JAN14 BILSBZ Warrants 100, ,424 1, SB BIL R270PP 90:1FEB14 BILSBP Warrants 100,000 1,395, ,200 6,473 1, SB BIL R285CE 80:1DEC13 BILSBE Warrants 100, , ,217 25,284 7, SB BIL R290PQ 70:1MAY14 BILSBQ Warrants 100,000 4,204, ,055,598 4,205 1, SB BIL R320CF 90:1APR14 BILSBF Warrants 100,000 8,003, ,408,623 22,066 5, SB BTI R340CTB 1:1MAY14 BTISTB Inv. Prod 25,000 F /05 I /09 1,152 24, , , , ,069 24,455 15,962 SB CFR 6650PQ 20:1DEC13 CFRSBQ Warrants 100, ,941 1, SB CFR 7500CTH 1:1OCT14 CFRSTH Inv. Prod 25, , , , , ,887 3,483 SB CFR 7800CG 25:1JAN14 CFRSBG Warrants 100, ,401 9, SB CFR 8800PR 30:1FEB14 CFRSBR Warrants 100, , ,920 5, SB CFR 9500PS 25:1MAY14 CFRSBS Warrants 100,000 58, , SB CFR R100CH 30:1FEB14 CFRSBH Warrants 100, , ,796 31,883 11, SB CFR R115CI 30:1JUL14 CFRSBI Warrants 100, SB EXX R125CTH 1:1OCT14 EXXSTH Inv. Prod 25,000 4,170 4, , , , ,634 4,220 SB EXX R150CH 50:1JAN14 EXXSBH Warrants 100, , ,352 10,937 3, SB EXX R150CJ 50:1JUL14 EXXSBJ Warrants 100, SB EXX R175CI 60:1APR14 EXXSBI Warrants 100,000 10,337, ,490,995 29,386 6, SB FSR 2300CTH 1:1MAY14 FSRSTH Inv. Prod 25,000 F /10 124,020 1, , , ,400, ,218 1, SB FSR 2950CN 8:1FEB14 FSRSBN Warrants 100, , ,472 34,095 13, SB FSR 3000PY 9:1JAN14 FSRSBY Warrants 100,000 1,462, ,659 6,174 1, SB FSR 3200PZ 8:1MAY14 FSRSBZ Warrants 100,000 2, SB FSR 3300CM 10:1JAN14 FSRSBM Warrants 100,000 2,393, ,665 28,536 4, SB FSR 3600CA 8:1JUL14 FSRSBA Warrants 100, SB FSR 3600CO 9:1MAY14 FSRSBO Warrants 100,000 9,432, ,364,854 9,529 2, SB GFI 3600CTJ 1:1JUL14 GFISTJ Inv. Prod 25,000 25,263 1, , , , SB GFI 4500CE 20:1JUL14 GFISBE Warrants 100, SB GFI 5000CTI 1:1MAY14 GFISTI Inv. Prod 25, , , ,335 2, SB GFI 5200CD20:1APR14 GFISBD Warrants 100,000 1,637, ,643 10,349 2, SB GFI 5800PP 25:1FEB14 GFISBP Warrants 100, , ,487 3,586 1, SB GFI 6000CC 25:1JAN14 GFISBC Warrants 100,000 1,872, ,677 29,706 4, SB GFI 6600CB 30:1DEC13 GFISBB Warrants 100, , ,067 24,440 2, SB GFI 7000CA 25:1DEC13 GFISBA Warrants 100, , SB GLD R140CE 25:1MAY14 GLDSBE Warrants 100, , ,360 1, SB GLD R150CD 30:1DEC13 GLDSBD Warrants 100, ,788 1, SB GND 1850CTH 1:1OCT14 GNDSTH Inv. Prod 25,000 5, , SB GRT 2600CA 8:1FEB14 GRTSBA Warrants 100, , , SB HAR 2700CTI 1:1JUL14 HARSTI Inv. Prod 25,000 42,950 1, , , SB HAR 3150CE 15:1JUL14 HARSBE Warrants 100,000 50, , SB HAR 3700CD 20:1MAY14 HARSBD Warrants 100,000 1,642, ,396 3, SB HAR 3800PP 20:1FEB14 HARSBP Warrants 100,000 18, ,740 6,245 2, SB HAR 3900CC 20:1JAN14 HARSBC Warrants 100,000 1,299, ,506 35,302 7, SB HAR 4500CB 25:1JAN14 HARSBB Warrants 100, , SB HAR 4800CTH 1:1MAY14 HARSTH Inv. Prod 25,000 I /03 34, , ,087 2, SB HAR 5000CA 25:1DEC13 HARSBA Warrants 100,000 13,683 1, SB HAR 6000CO 25:1DEC13 HARSBO Warrants 100,000 19,598 1, SB IMP 7000CTH 1:1JUL14 IMPSTH Inv. Prod 25,000 F 51 23/09 3,092 6, , , , ,407 4,606 SB IMP R105CG 40:1JAN14 IMPSBG Warrants 100, , ,884 14,825 4, SB IMP R115PR 40:1JAN14 IMPSBR Warrants 100, , ,595 3, SB IMP R115PS 30:1MAY14 IMPSBS Warrants 100, , , SECURITIES INFORMATION 44 DIVIDEND FOOTNOTES F = Final dividend (current year) I = Interim dividend + = See Company Information Totals for shares traded, value and deals for Current month and Range for 2006 may vary due to correction trades Closing price but no high/low for month indicates last price in preceeding month Buyers/sellers price given as closing price, but no high low indicates either (a) no sales in current month, but no buyers and sellers prices, Or (b) Historical buyers and sellers prices only. 45
36 2010 PAYMENTS 2011 PAYMENTS 2012 PAYMENTS 2013 PAYMENTS (YEAR TO DATE) TRADING STATISTICS FOR NOVEMBER 2013 TRADING STATISTICS 2013 TO NOVEMBER TRADING STATISTICS 2012 SECURITIES INFORMATION ISSUED NATURE OF SHARES PAY PAY OTHER HIGH HIGH LOW LOW CLOSE DAYS VOLUME VALUE HIGH LOW VOLUME VALUE HIGH LOW SECURITY BUSINESS (000 S) DIV CAP DIV CAP DIV CAP DIV AMT DATE DIV AMT DATE PAY VOLUME PRICE DATE PRICE DATE PRICE DEALS TRADE VALUE (000 s) (R000 s) PRICE PRICE (000 s) (R000 s) PRICE PRICE SHARE CODE SB IMP R125CH 50:1APR14 IMPSBH Warrants 100,000 5,475, ,139,061 9,800 3, SB IMP R135CF 50:1DEC13 IMPSBF Warrants 100, , ,466 22,603 2, SB INP 4750CTH 1:1MAY14 INPSTH Inv. Prod 25,000 F /08 F /08 8,500 2, , , , ,873 2,046 SB KIO R335CTH 1:1JUL14 KIOSTH Inv. Prod 25,000 I /08 6,966 14, , , , ,465 18,500 9,900 SB KIO R425CJ 100:1JUL14 KIOSBJ Warrants 100, , , SB KIO R440CTG 1:1MAY14 KIOSTG Inv. Prod 25,000 F /03I /08 17,056 7, , , ,023, ,918 25,262 4,543 SB KIO R460CI 110:1MAY14 KIOSBI Warrants 100,000 9,142, ,206,662 9,142 2, SB KIO R480CH 160:1MAR14 KIOSBH Warrants 100,000 7,084, ,019,099 22,664 4, SB KIO R490CG 160:1JAN14 KIOSBG Warrants 100, , ,825 43,100 8, SB MPC R125PP 40:1JAN14 MPCSBP Warrants 100, SB MPC R135PQ 30:1MAY14 MPCSBQ Warrants 100, , ,452 1, SB MPC R140CB 35:1MAR14 MPCSBB Warrants 100, SB MPC R170CC 35:1MAY14 MPCSBC Warrants 100, , , SB MTN R125CTH 1:1MAY14 MTNSTH Inv. Prod 25,000 I /09 13,619 8, , , ,052, ,642 8,525 5,700 SB MTN R155PZ 45:1JAN14 MTNSBZ Warrants 100, ,618 1, SB MTN R175CB 50:1DEC13 MTNSBB Warrants 100,000 73, ,900 40,847 13, SB MTN R185PP 45:1MAR14 MTNSBP Warrants 100,000 1,244, ,617 4,705 1, SB MTN R185PQ 50:1JUL14 MTNSBQ Warrants 100, SB MTN R210CC 50:1MAR14 MTNSBC Warrants 100,000 7,187, ,503,446 27,685 6, SB MTN R210CD 50:1JUL14 MTNSBD Warrants 100, SB NED R200CI 55:1DEC13 NEDSBI Warrants 100,000 7, ,960 4,505 1, SB NED R200CJ 50:1MAR14 NEDSBJ Warrants 100, , ,420 1, SB NPN R1025CL 240:1MAY14 NPNSBL Warrants 100,000 2,977, ,573 2, SB NPN R575PT 160:1JAN14 NPNSBT Warrants 100, ,394 1, SB NPN R640CH 220:1JAN14 NPNSBH Warrants 100,000 3, ,832 13,563 7, SB NPN R675PU 200:1FEB14 NPNSBU Warrants 100, ,093 1, SB NPN R700CTH 1:1OCT14 NPNSTH Inv. Prod 25,000 2,269 35, , , , ,345 35,961 30,565 SB NPN R750CI 260:1FEB14 NPNSBI Warrants 100,000 20, ,700 6,453 3, SB NPN R800PV 240:1MAR14 NPNSBV Warrants 100, , SB NPN R900CJ 260:1MAR14 NPNSBJ Warrants 100,000 4,873, ,996,235 44,270 20, SB NPN R900PW 250:1MAY14 NPNSBW Warrants 100, , , SB OIL R985CD 250:1JUL14 OILSBD Inv. Prod 100,000 SB OML 2100CTH 1:1MAY14 OMLSTH Inv. Prod 25,000 I /10 3,856 1, , , , ,913 1, SB OML 2850PP 7:1FEB14 OMLSBP Warrants 100, , ,750 3, SB OML 2900CJ 9:1FEB14 OMLSBJ Warrants 100,000 31, ,505 4,975 1, SB OML 3000PQ 7:1MAY14 OMLSBQ Warrants 100, SB OML 3500CL 7:1MAY14 OMLSBL Warrants 100, , , SB PLA R145CA 40:1JAN14 PLASBA Warrants 100,000 60, , SB PPC 2300CTI 1:1OCT14 PPCSTI Inv. Prod 25,000 69,576 1, , , , ,259 1,046 SB RDF 1000CA 3:1FEB14 RDFSBA Warrants 100, SB RDF 750CTD 1:1OCT14 RDFSTD Inv. Prod 25,000 IT 25/ , ,237, , SB SBK R120CE 30:1JAN14 SBKSBE Warrants 100,000 1,276, ,174 14,360 3, SB SBK R135CF 25:1MAY14 SBKSBF Warrants 100,000 97, , SB SGL 1000CB 6:1DEC13 SGLSBB Warrants 100,000 6, ,005 10,212 1, SB SGL 1100CD 6:1APR14 SGLSBD Warrants 100,000 1,565, ,920 13,659 5, SB SGL 1550CE 7:1MAY14 SGLSBE Warrants 100,000 3,664, ,092,355 3,664 1, SB SGL 750CC 4:1JAN14 SGLSBC Warrants 100, ,749 7, SB SHF 4400CA 10:1JUL14 SHFSBA Warrants 100, SB SHP R160PY 35:1MAY14 SHPSBY Warrants 100, , , SB SHP R165PX 45:1JAN14 SHPSBX Warrants 100,000 3,250, ,640 14,253 2, SB SHP R175CC 50:1MAR14 SHPSBC Warrants 100,000 4,030, ,444,641 17,509 6, SB SHP R190CB 55:1FEB14 SHPSBB Warrants 100,000 2,653, ,717 41,483 7, SB SHP R195CD 45:1JUL14 SHPSBD Warrants 100,000 12, , SB SOL R350CTI 1:1SEP14 SOLSTI Inv. Prod 25,000 F /10 3,740 19, , , , ,086 19,401 16,426 SB SOL R410CF 100:1JAN14 SOLSBF Warrants 100, ,446 3, SB SOL R420CG 200:1FEB14 SOLSBG Warrants 100, , ,980 4,377 1, SB SOL R440PU 110:1MAR14 SOLSBU Warrants 100, , ,301 1, SB SOL R485PV 100:1MAY14 SOLSBV Warrants 100, , , SB SOL R490CH 120:1MAR14 SOLSBH Warrants 100, , ,106 15,786 5, SB SOL R550CI 110:1MAY14 SOLSBI Warrants 100,000 53, , SB TFG R105CC 30:1FEB14 TFGSBC Warrants 100, , ,642 7,093 2, SB TFG R110CE 25:1JUL14 TFGSBE Warrants 100, SB TFG R125CD 30:1MAY14 TFGSBD Warrants 100,000 11,821, ,741,511 11,822 1, SB USD 1000CJ 2:1JUL14 USDSCJ Inv. Prod 100,000 SB VESRESETSWIX4015AUG18 SBSW24 Other Sec 17 SB VOD R115CA 30:1JAN14 VODSBA Warrants 100,000 6,793, ,851,986 55,578 14, SB VOD R125CB 30:1APR14 VODSBB Warrants 100,000 5,438, ,367,853 11,329 2, SB WHL 6400CB 25:1FEB14 WHLSBB Warrants 100, , ,769 7,642 2, SB WHL 7100PQ 20:1MAY14 WHLSBQ Warrants 100,000 73, , SB WHL 7250PP 20:1JAN14 WHLSBP Warrants 100,000 1,455, ,023 6,868 2, SB WHL 8000CC 25:1MAY14 WHLSBC Warrants 100,000 3,104, ,746 3, SBASA R133PT33.31:1JAN14 ASASBT Warrants 100, SBASAR152CJ38.06:1JAN14 ASASBJ Warrants 100, ,428 5, SBBGA R157PP66.61:1MAY14 BGASBP Warrants 100, , , SBBGAR142CA38.06:1MAR14 BGASBA Warrants 100,000 6,338, ,445,186 11,179 3, SBTOP30000CI000100MAY14 TOPSBI Inv. Prod 100,000 18,052 10, , , ,811, ,537 10,409 5,485 SBTOP32500CKA0001DEC13 TOPSKA Inv. Prod 50, ,206 5, SBTOP32500PS0002JAN14 TOPSBS Inv. Prod 100, ,506 22, SBTOP35000PT0002FEB14 TOPSBT Inv. Prod 100, , ,868 14,020 2, SBTOP36000CD0002JAN14 TOPSBD Inv. Prod 100, , ,425 23,642 8, SBTOP37500PP0002MAY14 TOPSBP Inv. Prod 100,000 10,343, ,677,220 13,979 3, SBTOP38000CKB0001SEP14 TOPSKB Inv. Prod 50,000 13, , SBTOP39000CE0001MAR14 TOPSBE Inv. Prod 100,000 35, ,600 2,948 1, SBTOP42000PZ000100MAY14 TOPSBZ Inv. Prod 100,000 21,876 3, , , , ,576 8,304 2,422 SBTOP43000CJ0002MAY14 TOPSBJ Inv. Prod 100,000 14,324, ,032,231 14,325 3, SBTOP43000PKV0001SEP14 TOPSKV Inv. Prod 50,000 2,207, ,610 2, SBVES RESETTOP40 11MAY18 SBTPV8 Other Sec ,105 SBVESRESETSWX4011DEC15 SBSW14 Other Sec 3 SBVESRESETTOP4018NOV16 SBTPV7 Other Sec ,167 SI GRT 1225CJ 1:1OCT14 GRTSIJ Inv. Prod 25,000 31,198 1, , , , ,427 1,248 SI RDF 480CI 1:1SEP14 RDFSII Inv. Prod 25,000 IT 25/ , ,162, , SI SGL 370CB 1:1JUL14 SGLSIB Inv. Prod 25,000 I / SI SGL 650CA 1:1MAY14 SGLSIA Inv. Prod 25,000 I /10 32, ,008 1,217 5,731 3, SECURITIES INFORMATION 46 DIVIDEND FOOTNOTES F = Final dividend (current year) I = Interim dividend + = See Company Information Totals for shares traded, value and deals for Current month and Range for 2006 may vary due to correction trades Closing price but no high/low for month indicates last price in preceeding month Buyers/sellers price given as closing price, but no high low indicates either (a) no sales in current month, but no buyers and sellers prices, Or (b) Historical buyers and sellers prices only. 47
37 COMPANY INFORMATION COMPANY INFORMATION For all companies registered outside the common monetary area the issued and authorised capitals is shown in rand based on the appropriate exchange rate ruling at the time. KEY TO ABBREVIATIONS Cap. Iss = Capitalisation Issue Reduc. Of cap. = Reduction of capital Rts. Iss. = Rights Issue Consol. = Consolidation of shares C.D.O. = Closing date of offer Sub. Di. = Sub-division of shares (splits) Prelim. = Preliminary announcement L.D.T. = Last day to trade DETAILS LDT Record date Paydate/ Issue date AFRICAN BANK INVESTMENTS (Formerly BAOBAB SOLID GROWTH) (Formerly THETA GROUP) SC - Scrip Dividend: ABL shares for every 1000 ABL shares held OR 06/07/ /14/ /18/ cents per share held RT - Rights / Claw Back Offer: 84 ABLN shares for every 100 ABL shares held 11/08/ /15/2013 AFRICAN EAGLE RESOURCES PLC PV - Par Value Change: from 1 to 0.1 cents per share on 2013/06/25 06/24/ /01/2013 AG INDUSTRIES (Formerly AFRICA GLASS INDUSTRIES) TE - Termination: 2013/08/27 AGI has requested that the JSE terminate its listing on the JSE. ALERT STEEL HOLDINGS OL - Odd Lot Offer: The odd lot offer will be implemented by way of a specific repurchase of 01/04/ /11/ /14/2013 shares by the company. Shareholders may elect to sell or retain their shares. Those who do not make an election, will be automatically purchased by AET. UO - Unconditional Offer: Unconditional offer by Cannistraro Investments 282 Proprietary 08/23/ /30/ /02/2013 Limited to all the other shareholders of Alert Steel for a purchase consideration of cents per Alert Steel ordinary share. ALLIED TECHNOLOGIES SA - Scheme of Arrangement: See UO for details 08/08/ /16/ /19/2013 UO - Unconditional Offer: 2.22 ATNP shares for every 1 ALT share held OR 4750 cents per 08/08/ /16/ /19/2013 share held Part of Scheme of Arrangement. The aggregate Share Consideration will be limited to a maximum of 50% of the aggregate Scheme Consideration. CP - Capital Payment: 4750 cents per share held 08/08/ /16/ /19/2013 SU - Suspension: 2013/08/12 Part of Scheme of Arrangement TE - Termination: 2013/08/20 Part of Scheme of Arrangement TE - Termination: 2013/07/02 Scheme of Arrangement ANDULELA INVESTMENT HOLDINGS (Formerly DNR Capital Limited) (Formerly INDEPENDENT FINANCIAL SERVICES LTD) (Formerly VIERFONTEIN COLLIERY) PV - Par Value Change: from 1 to 0 cents per share on 2013/02/11 CO - Consolidation of Instruments: 1 AND share for every 50 AND shares held 04/19/ /26/ /29/2013 ASPEN PHARMACARE HOLDINGS (Formerly ASPEN HEALTHCARE HOLDINGS) (Formerly MEDHOLD) CR - Capital Reduction: 26 cents per share held 10/04/ /11/ /14/2013 BARCLAYS AFRICA GROUP (Formerly ABSA GROUP) (Formerly AMALGAMATED BANKS OF SOUTH AFRICA) NC - Name Change: 2013/08/02 08/01/ /08/ /12/2013 BIOSCIENCE BRANDS (Formerly WELLCO HEALTH) SU - Suspension: 2013/09/18 Liquidation BLACKSTAR GROUP SE CO - Consolidation of Instruments: 1 BCK share for every 250 BCK shares held 06/21/ /28/ /01/2013 SD - Subdivision: 250 BCK shares for every 1 BCK share held 06/21/ /28/ /01/2013 NC - Name Change: 2013/06/24 06/21/ /28/ /01/2013 BLUE FINANCIAL SERVICES SU - Suspension: 2013/06/26 Late submission of financial results BRAIT SE (Formerly BRAIT S.A.) (Formerly BRAIT S.A. SOCIETE ANONYME) (Formerly BRAIT S.E. SOCIETAS EUROPEA) (Formerly TOLUX S A) SC - Scrip Dividend: BAT shares for every 100 BAT shares held OR cents 07/26/ /02/ /05/2013 per share held BRIKOR (Formerly BRICKOR) SU - Suspension: 2013/07/31 Provisional Liquidation 48
38 COMPANY INFORMATION DETAILS LDT Record date Paydate/ Issue date BUSINESS CONNEXION GROUP SA - Scheme of Arrangement: See CP for details. 09/27/ /04/ /07/2013 CP - Capital Payment: 95 cents per share held 09/27/ /04/ /07/2013 SU - Suspension: 2013/09/30 Scheme of Arrangement TE - Termination: 2013/10/08 Scheme of Arrangement CAPE EMPOWERMENT (Formerly CONLOG HOLDINGS) (Formerly DYNAMIC CABLES RSA) (Formerly LOG-TEK HOLDINGS) SA - Scheme of Arrangement: See UO for details. Shareholders may also reject the cash offer 05/03/ /10/ /13/2013 and Ascension B unit offer and retain their Cape Empowerment shares in an unlisted company once the company delists. UO - Unconditional Offer: 1 AIB share for every 5 CAP shares held OR 36 cents per share held 05/03/ /10/ /13/2013 Part of the Scheme of Arrangement. Shareholders may also reject the cash offer and Ascension B unit offer and retain their Cape Empowerment shares in an unlisted company once the company delists. SC - Scrip Dividend: 1 AIB share for every 5 CAP shares held OR 36 cents per share held 05/03/ /10/ /13/2013 SU - Suspension: 2013/05/06 Scheme of Arrangement TE - Termination: 2013/05/14 Scheme of Arrangement COMPANY INFORMATION CAPITAL & COUNTIES PROPERTIES PLC SC - Scrip Dividend: 1 CCO share for every CCO shares held OR cents 05/17/ /24/ /20/2013 per share held PV - Par Value Change: from NPV to 25 cents per share on 2013/08/15 SC - Scrip Dividend: 1 CCO share for every CCO shares held OR 6.63 cents 08/23/ /30/ /25/2013 per share held CENTRAL RAND GOLD CO - Consolidation of Instruments: 1 CRD share for every 50 CRD shares held 06/07/ /14/ /18/2013 PV - Par Value Change: from to 1 cents per share on 2013/06/13 CHEMICAL SPECIALITIES RT - Rights / Claw Back Offer: 50 CSPN shares for every 100 CSP shares held 10/25/ /01/2013 TU - Take-up Rights Offer: 1 CSPP share for every 1 CSPN share held (NilPL) 11/15/ /22/2013 SU - Suspension: 2013/11/18 Expiry of NPL (NilPL) TE - Termination: 2013/11/25 Expiry of NPL (NilPL) CHROMETCO PV - Par Value Change: from to 0 cent per share on 2013/05/20 CIPLA MEDPRO SOUTH AFRICA (Formerly ENALENI PHARMACEUTICALS) SA - Scheme of Arrangement: See CP for details. 07/05/ /12/ /15/2013 CP - Capital Payment: 1000 cents per share held 07/05/ /12/ /15/2013 SU - Suspension: 2013/07/08 Scheme of Arrangement TE - Termination: 2013/07/16 Scheme of Arrangement CLOVER INDUSTRIES (Formerly CLOVER INDUSTRIES ) (Including PS) CM - Full Redemption: cents per share held (PS) 05/24/ /31/ /03/2013 SU - Suspension: 2013/05/27 Final redemption (PS) TE - Termination: 2013/06/04 Final redemption (PS) CONSOLIDATED INFRASTRUCTURE GRP (Formerly BUILDWORKS GROUP) PV - Par Value Change: from 0.01 to 0 cent per share on 2013/05/27 OL - Odd Lot Offer: An odd-lot offer to odd-lot holders (holding less than 100 shares) - Capital 05/31/ /07/ /10/2013 OL - Odd Lot Offer: An odd-lot offer to odd-lot holders (holding less than 100 shares) - 05/31/ /07/ /10/2013 From retained earnings CR - Capital Reduction: 612 cents per share held 05/31/ /07/ /10/2013 OL - Odd Lot Offer: An odd-lot offer to odd-lot holders (holding less than 100 shares) - 05/31/ /07/ /10/2013 Capital and retain earnings CONVERGENET HOLDINGS (Formerly VESTA TECHNOLOGY HOLDINGS) (Formerly VESTOR INVESTMENTS) PV - Par Value Change: from 0.1 to 0 cent per share on 2013/02/28 CROOKES BROTHERS SC - Scrip Dividend: CKS shares for every 100 CKS shares held OR cents 07/05/ /12/ /15/2013 per share held CURRO HOLDINGS (Including NilPL) RT - Rights / Claw Back Offer: 21 COHN shares for every 100 COH shares held 04/05/ /12/2013 TU - Take-up Rights Offer: 1 COH share for every 1 COHN share held (NilPL) 05/03/ /10/2013 SU - Suspension: 2013/05/06 Expiry of NPL (NilPL) TE - Termination: 2013/05/13 Expiry of NPL (NilPL) 49
39 DETAILS LDT Record date Paydate/ Issue date COMPANY INFORMATION CROOKES BROTHERS SC - Scrip Dividend: CKS shares for every 100 CKS shares held OR cents 07/05/ /12/ /15/2013 per share held DATATEC CR - Capital Reduction: 83 cents per share held 07/05/ /12/ /15/2013 CR - Capital Reduction: 80 cents per share held 11/22/ /29/ /02/2013 DELTA EMD (Formerly DELTA ELECTRICAL INDUSTRIES) PV - Par Value Change: from 9 to 0 cents per share on 2013/07/08 DELTA PROPERTY FUND (Formerly DELTA PRO FUND) (Including NilPL) RT - Rights / Claw Back Offer: DLTN shares for every 100 DLT shares held 04/05/ /12/2013 TU - Take-up Rights Offer: 1 DLT share for every 1 DLTN share held (NilPL) 04/25/ /03/2013 SU - Suspension: 2013/04/26 Expiry of NPL (NilPL) TE - Termination: 2013/05/06 Expiry of NPL (NilPL) DIAMONDCORP PLC PV - Par Value Change: from 3 to 0.1 cents per share on 2013/07/04 DISCOVERY (Formerly DISCOVERY HOLDINGS) NC - Name Change: 2013/02/11 (PS) 02/08/ /15/ /18/2013 DORBYL (Including PS) CF - Conditional Offer: 110 cents per share held The offer is unconditional (PS) 02/08/ /15/ /18/2013 CF - Conditional Offer: 85 cents per share held The offer is unconditional 02/08/ /15/ /18/2013 CF - Conditional Offer: OR 100 cents per share held The offer is unconditional (PS) 02/08/ /15/ /18/2013 CP - Capital Payment: 110 cents per share held (PS) 02/08/ /15/ /18/2013 CP - Capital Payment: 85 cents per share held 02/08/ /15/ /18/2013 CP - Capital Payment: 100 cents per share held (PS) 02/08/ /15/ /18/2013 ELB GROUP (Formerly EDWARD L.BATEMAN) (Including PS) CM - Full Redemption: 200 cents per share held (PS) 05/03/ /10/ /13/2013 SU - Suspension: 2013/05/06 Full Redemption (PS) TE - Termination: 2013/05/14 Full Redemption (PS) ELLIES HOLDINGS PV - Par Value Change: from to 0 cent per share on 2013/05/15 EQSTRA HOLDINGS PV - Par Value Change: from 0.1 to 0 cent per share on 2013/05/17 ERBACON INVESTMENT HOLDINGS SU - Suspension: 2013/06/20 Business rescue proceedings by its major operating subsidiary. FAIRVEST PROPERTY HOLDINGS PV - Par Value Change: from 2 to 0 cent per share on 2013/04/25 FIRESTONE ENERGY SU - Suspension: 2013/03/15 Pending discussions for completion of restated investment agreement with Ariona. SL - Suspension Lifted: 2013/05/28 FIRST URANIUM CORPORATION CP - Capital Payment: cents per share held 03/08/ /15/ /18/2013 FOORD COMPASS (Formerly COMPASS PROPERTY HOLDINGS) SC - Scrip Dividend: FCPD shares for every 100 FCPD shares held OR cents 02/01/ /08/ /11/2013 per share held (Deb) SC - Scrip Dividend: FCPD shares for every 100 FCPD shares held OR 25.5 cents 07/26/ /02/ /05/2013 per share held (Deb) GIJIMA GROUP (Formerly ADVANCED SOFTWARE TECHNOLOGIES - ABRAXAS) (Formerly AST GROUP) (Formerly GIJIMA AST GROUP) PV - Par Value Change: from 0.1 to 0 cent per share on 2013/05/20 RT - Rights / Claw Back Offer: GIJN shares for every 100 GIJ shares held 05/24/ /31/2013 TU - Take-up Rights Offer: 1 GIJ share for every 1 GIJN share held (NilPL) 06/13/ /21/2013 SU - Suspension: 2013/06/14 Expiry of NPL (NilPL) TE - Termination: 2013/06/24 Expiry of NPL (NilPL) CO - Consolidation of Instruments: 1 GIJ share for every 20 GIJ shares held 07/12/ /19/ /22/2013 GOLD FIELDS (Formerly DRIEFONTEIN CONSOLIDATED) UB - Unbundling: 1 SGL share for every 1 GFI share held 02/08/ /15/2013 GROWTHPOINT PROPERTIES NC - Name Change: 2013/08/02 08/01/ /08/ /12/2013 PV - Par Value Change: from 2505 to 0 cents per share on 2013/08/02 08/01/ /08/2013 HARDWARE WAREHOUSE SA - Scheme of Arrangement: See CP for details 02/15/ /22/ /25/2013 CP - Capital Payment: 114 cents per share held 02/15/ /22/ /25/2013 SU - Suspension: 2013/02/18 Scheme of Arrangement TE - Termination: 2013/02/26 Scheme of Arrangement 50 HYPROP INVESTMENTS PV - Par Value Change: from 494 to 0 cents per share on 2013/07/24
40 DETAILS LDT Record date Paydate/ Issue date IFA HOTELS AND RESORTS PV - Par Value Change: from 1 to 0 cents per share on 2013/06/24 SA - Scheme of Arrangement: See CP for details 08/30/ /06/ /09/2013 CP - Capital Payment: 20 cents per share held 08/30/ /06/ /09/2013 SU - Suspension: 2013/09/02 Scheme of Arrangement TE - Termination: 2013/09/10 Scheme of Arrangement ILLOVO SUGAR (Formerly C G SMITH SUGAR) CR - Capital Reduction: 61 cents per share held 06/28/ /05/ /08/2013 INFRASORS HOLDINGS CF - Conditional Offer: 65 cents per share held The Initial Offer has been extended and 06/28/ /05/ /08/2013 Afrimat has also decided to increase the offer consideration INTU PROPERTIES PLC (Formerly CAPITAL SHOPPING CENTRES GROUP PLC) (Formerly LIBERTY INTERNATIONAL PLC) NC - Name Change: 2013/02/18 02/15/ /22/ /25/2013 SC - Scrip Dividend: ITU shares for every 100 ITU shares held OR cents per share held 04/19/ /26/ /04/2013 SC - Scrip Dividend: ITU shares for every 100 ITU shares held OR cents per share held 04/19/ /26/ /04/2013 SC - Scrip Dividend: ITU shares for every 100 ITU shares held OR cents per share held 10/11/ /18/ /19/2013 NC - Name Change: 2013/11/15 11/14/ /21/ /22/2013 COMPANY INFORMATION INVESTEC PROPERTY FUND NC - Name Change: 2013/11/18 11/15/ /22/ /25/2013 PV - Par Value Change: from 1000 to 0 cents per share on 2013/11/18 JCI (Formerly CONSOLIDATED AFRICAN MINES) (Formerly JCI2) TE - Termination: 2013/04/16 Non compliance of JSE Listings Requirements (concerning timeous publication of IFRS compliant financial statements). JD GROUP PV - Par Value Change: from 5 to 0 cent per share on 2013/02/28 KAP INDUSTRIAL HOLDINGS (Formerly KAP INTERNATIONAL HOLDINGS) (Formerly KOLOSUS HOLDINGS) NC - Name Change: 2013/01/07 01/04/ /11/ /14/2013 KAYDAV GROUP (Formerly TRADWISE GROUP) CR - Capital Reduction: 7 cents per share held 04/12/ /19/ /22/2013 KIBO MINING PLC CO - Consolidation of Instruments: 1 KBO share for every 15 KBO shares held 03/22/ /02/ /03/2013 LONRHO PLC (Formerly LONRHO AFRICA PLC) SA - Scheme of Arrangement: See CP for details 07/18/ /25/ /26/2013 CP - Capital Payment: cents per share held 07/18/ /25/ /02/2013 SU - Suspension: 2013/07/19 Scheme of Arrangement TE - Termination: 2013/08/05 Scheme of Arrangement MAS REAL ESTATE INC (Formerly MAS PLC) NC - Name Change: 2013/01/07 01/04/ /11/ /14/2013 SC - Scrip Dividend: MSP shares for every 100 MSP shares held OR cents 01/18/ /25/ /01/2013 per share held SC - Scrip Dividend: MSP shares for every 100 MSP shares held OR cents 07/05/ /12/ /19/2013 per share held MEDICLINIC INTERNATIONAL (Formerly MEDI-CLINIC CORPORATION) PV - Par Value Change: from 10 to 0 cent per share on 2013/01/16 MICROMEGA HOLDINGS (Formerly FINANCIAL INSOURCING SPECIALISTS) (Formerly LEGACY VENTURES) CI - Capitalisation Issue: 14 shares for every 100 MMG shares held 10/25/ /01/ /04/2013 MIX TELEMATICS (Formerly TELIMATRIX) PV - Par Value Change: from to 0 cent per share on 2013/04/08 MOBILE INDUSTRIES TE - Termination: 2013/07/16 Failure to comply with the Listings Requirements. Shareholders will remain in an unlisted company. MONDI (Formerly Magenta plc) OL - Odd Lot Offer: Second record date. Shareholders who are odd lot holders on the first 05/31/ /07/ /24/2013 and second record date will be entitled to participate in the odd lot offer. Odd lot holders wishing to retain their MND shares may elect to do so. MONDI PLC OL - Odd Lot Offer: Second record date. Shareholders who are odd lot holders on the first and 05/31/ /07/ /24/2013 second record date will be entitled to participate in the odd lot offer. Odd lot holders wishing to retain their MND shares may elect to do so. MUVONI TECHNOLOGY GROUP (Formerly IDECO GROUP) (Formerly IDECO GROUP) SA - Scheme of Arrangement: See CP for details 07/19/ /26/ /29/2013 CP - Capital Payment: 20 cents per share held 07/19/ /26/ /29/2013 SU - Suspension: 2013/07/22 Scheme of Arrangement TE - Termination: 2013/07/30 Scheme of Arrangement 51
41 DETAILS LDT Record date Paydate/ Issue date COMPANY INFORMATION MUSTEK PV - Par Value Change: from 0.8 to 0 cent per share on 2013/01/28 MVELASERVE SA - Scheme of Arrangement: See CP for details 11/01/ /08/ /11/2013 CP - Capital Payment: 920 cents per share held 11/01/ /08/ /11/2013 SU - Suspension: 2013/11/04 Scheme of Arrangement TE - Termination: 2013/11/12 Scheme of Arrangement NEW AFRICA INVESTMENT (Including Nord) UO - Unconditional Offer: cents per share held Shareholders may elect to receive 59.48cps 01/11/ /18/ /21/2013 PLUS a portion of the potential agterskot which will be payable as and when the cash claim is determined; OR cps with no agterskot. TE - Termination: 2013/01/30 Section 124 of the Companies Act NEW BOND CAPITAL (Formerly MVELAPHANDA GROUP) SA - Scheme of Arrangement: See CV for details 05/24/ /31/ /03/2013 CV - Conversion of Instruments: 1.12 BCK shares for every 100 NBC shares held 05/24/ /31/ /03/2013 SU - Suspension: 2013/05/27 Scheme of Arrangement TE - Termination: 2013/06/04 Scheme of Arrangement NEW EUROPE PROPERTY INVESTMENTS PLC (Formerly NEW EUROPE PROP INV PLC ) SC - Scrip Dividend: NEP shares for every 100 NEP shares held OR cents per 03/20/ /28/ /08/2013 share held RT - Rights / Claw Back Offer: NEPN shares for every 100 NEP shares held 06/28/ /05/2013 TU - Take-up Rights Offer: 1 NEP share for every 1 NEPN share held (NilPL) 07/19/ /26/2013 SU - Suspension: 2013/07/22 Expiry of NPL (NilPL) TE - Termination: 2013/07/29 Expiry of NPL (NilPL) SC - Scrip Dividend: NEP shares for every 100 NEP shares held OR cents per 09/13/ /20/ /30/2013 share held NIVEUS INVESTMENTS (Formerly NIVEUS INVESTMENTS) SC - Scrip Dividend: 1 NIV share for every 70 NIV shares held OR 15.3 cents per share held 08/01/ /08/ /12/2013 NORTHAM PLATINUM PV - Par Value Change: from 1 to 0 cent per share on 2013/01/23 RT - Rights / Claw Back Offer: NHMN shares for every 100 NHM shares held 11/08/ /15/2013 OANDO PLC (Including NilPL) SU - Suspension: 2013/01/31 Expiry of NPL (NilPL) SL - Suspension Lifted: 2013/02/06 (NilPL) TU - Take-up Rights Offer: 1 OAO share for every 1 OAON share held (NilPL) 02/13/ /20/2013 SU - Suspension: 2013/02/14 Expiry of NPL (NilPL) TE - Termination: 2013/02/21 Expiry of NPL (NilPL) OASIS CRESCENT PROPERTY FUND (Including PL) SC - Scrip Dividend: 2.24 OAS shares for every 100 OAS shares held OR cents per 05/24/ /31/ /03/2013 share held (PL) SC - Scrip Dividend: 0.3 OAS shares for every 100 OAS shares held OR cents per 05/24/ /31/ /03/2013 share held (PL) SC - Scrip Dividend: 0.21 OAS shares for every 100 OAS shares held OR cents per 05/24/ /31/ /03/2013 share held (PL) ONELOGIX GROUP (Formerly VENMIL) PV - Par Value Change: from 1 to 0 cents per share on 2013/10/22 PAN AFRICAN RESOURCES PLC (Including NilPL) TU - Take-up Rights Offer: 1 PAN share for every 1 PANN share held (NilPL) 01/04/ /11/2013 SU - Suspension: 2013/01/07 Expiry of NPL (NilPL) TE - Termination: 2013/01/14 Expiry of NPL (NilPL) PLATFIELDS (Formerly PLATFIELDS) SU - Suspension: 2013/07/01 Failure to submit the provisional report temeously. PRESCIENT (Formerly PBT GROUP) (Formerly WOOLTRU) SC - Scrip Dividend: PCT shares for every 100 PCT shares held OR cents per 07/26/ /02/ /05/2013 share held QUANTUM PROPERTY GROUP (Formerly ANBEECO INVESTMENT HOLDINGS) SU - Suspension: 2013/02/20 The instrument unsuspended due to the charge code being amended. QUEENSGATE HOTELS & LEISURE (Formerly CYBERHOST) TE - Termination: 2013/02/18 Winding up order RACEC GROUP SA - Scheme of Arrangement: See CP for details 10/25/ /01/ /04/2013 CP - Capital Payment: 20 cents per share held 10/25/ /01/ /04/2013 SU - Suspension: 2013/10/28 See CP for details. Scheme of Arrangement TE - Termination: 2013/11/05 Scheme of Arrangement 52 RAINBOW CHICKEN (Including NilPL) RT - Rights / Claw Back Offer: 80 RBWN shares for every 100 RBW shares held 02/01/ /08/2013 TU - Take-up Rights Offer: 1 RBW share for every 1 RBWN share held (NilPL) 02/22/ /01/2013 SU - Suspension: 2013/02/25 Expiry of NPL (NilPL) TE - Termination: 2013/03/04 Expiry of NPL (NilPL)
42 DETAILS LDT Record date Paydate/ Issue date RBA HOLDINGS PV - Par Value Change: from to 0 cent per share on 2013/05/29 RT - Rights / Claw Back Offer: RBAN shares for every 100 RBA shares held 06/13/ /21/2013 TU - Take-up Rights Offer: 1 RBA share for every 1 RBAN share held (NilPL) 07/05/ /12/2013 SU - Suspension: 2013/07/08 Expiry of NPL (NilPL) TE - Termination: 2013/07/15 Expiry of NPL (NilPL) RCL FOODS (Formerly RAINBOW CHICKEN) NC - Name Change: 2013/09/02 08/30/ /06/ /09/2013 REBOSIS PROPERTY FUND (Including NilPL) RT - Rights / Claw Back Offer: REBN shares for every 100 REB shares held 01/04/ /11/2013 TU - Take-up Rights Offer: 1 REB share for every 1 REBN share held (NilPL) 01/25/ /01/2013 SU - Suspension: 2013/01/28 Expiry of NPL (NilPL) TE - Termination: 2013/02/04 Expiry of NPL (NilPL) REDEFINE PROPERTIES (Formerly REDEFINE INCOME FUND) PV - Par Value Change: from to 0 cent per share on 2013/04/04 UB - Unbundling: 1 RPL share for every 1 RIN share held 1 cents per share held 10/25/ /01/ /04/2013 SU - Suspension: 2013/10/28 Unbundling TE - Termination: 2013/11/04 Unbundling COMPANY INFORMATION REMGRO PV - Par Value Change: from 1 to 0 cent per share on 2013/01/17 REUNERT PV - Par Value Change: from 10 to 0 cent per share on 2013/05/24 CM - Full Redemption: 200 cents per share held (PS) 06/21/ /28/ /01/2013 SU - Suspension: 2013/06/24 Full Redemption (PS) TE - Termination: 2013/07/02 Full Redemption (PS) RGT SMART MARKET INTELLIGENCE (Formerly RGT SMART MARKERT INTELLIGENCE) PV - Par Value Change: from 1 to 0 cents per share on 2013/06/06 SA - Scheme of Arrangement: See CP for details 07/19/ /26/2013 CP - Capital Payment: 10 cents per share held 07/19/ /26/ /29/2013 SU - Suspension: 2013/07/22 Scheme of Arrangement TE - Termination: 2013/07/30 Scheme of Arrangement SABLE HOLDINGS SA - Scheme of Arrangement: See CP for details. Shareholders may elect to hold shares 08/23/ /30/ /02/2013 in an unlisted company. CP - Capital Payment: 2800 cents per share held 08/23/ /30/ /02/2013 SU - Suspension: 2013/08/26 Scheme of Arrangement TE - Termination: 2013/09/03 Scheme of Arrangement. The delisting is subject to the offer becoming unconditional on or before 30 September SACOIL HOLDINGS (Formerly MANGA-CHEM PRODUCTS) (Formerly SA MINERAL RESOURCES CORP) SU - Suspension: 2013/05/31 Resignation of Directors and application of suspension to trading of shares on AIM and the JSE SL - Suspension Lifted: 2013/10/14 SALLIES (Formerly THE SOUTH AFRICAN LAND AND EXPLORATION COMPANY) TE - Termination: 2013/01/02 Debentures mature (Deb) SANYATI HOLDINGS SU - Suspension: 2013/02/20 The instrument unsuspended due to the charge code being amended. SEA KAY HOLDINGS SU - Suspension: 2013/03/20 The suspended was lifted in error due a bug in the system. SEARDEL INVESTMENT CORPORATION (Formerly SEARDEL INVESTMENT CORPORATION LD) (Formerly SEARDEL INVESTMENT CORPORATION) PV - Par Value Change: from 25 to 0 cents per share on 2013/09/30 SHERBOURNE CAPITAL (Formerly IFCA TECHNOLOGIES) SU - Suspension: 2013/03/05 Subsequent to the Arkein acquisition not being successfully completed SIMMER AND JACK MINES TE - Termination: 2013/04/16 Company's failure to inject viable assets SOVEREIGN FOOD INVESTMENTS PV - Par Value Change: from 1 to 0 cent per share on 2013/05/02 STANDARD BANK GROUP (Formerly STANDARD BANK INVESTMENT CORP LTD) SC - Scrip Dividend: SBK shares for every 100 SBK shares held OR cents per 04/12/ /19/ /22/2013 share held SYCOM PROPERTY FUND (Including NilPL) RT - Rights / Claw Back Offer: SYCN shares for every 100 SYC shares held (PL) 04/19/ /26/2013 TU - Take-up Rights Offer: 1 SYC share for every 1 SYCN share held (NilPL) 05/17/ /24/2013 SU - Suspension: 2013/05/20 Expiry of NPL (NilPL) TE - Termination: 2013/05/27 Expiry of NPL (NilPL) 53
43 DETAILS LDT Record date Paydate/ Issue date COMPANY INFORMATION THABEX (Formerly THABEX EXPLORATION) TE - Termination: 2013/07/09 Failure to comply with the Listings Requirements THE SPAR GROUP PV - Par Value Change: from 0.06 to 0 cent per share on 2013/02/06 TIMES MEDIA GROUP OL - Odd Lot Offer: Specific Repurchase. Shares will be repurchased by a wholly owned 04/12/ /19/ /22/2013 subsidiary of the company, therefore the odd lot consideration will no longer constitute a dividend. URANIUM ONE INC (Formerly SXR URANIUM ONE INC) SA - Scheme of Arrangement: See CP for details 10/11/ /18/ /21/2013 CP - Capital Payment: 2736 cents per share held 10/11/ /18/ /21/2013 SU - Suspension: 2013/10/14 Scheme of Arrangement TE - Termination: 2013/10/22 Scheme of Arrangement VIVIDEND INCOME FUND (Including NilPL) RT - Rights / Claw Back Offer: VIFN shares for every 100 VIF shares held 05/03/ /10/2013 TU - Take-up Rights Offer: 1 VIF share for every 1 VIFN share held (NilPL) 05/24/ /31/2013 SU - Suspension: 2013/05/27 Expiry of NPL (NilPL) TE - Termination: 2013/06/03 Expiry of NPL (NilPL) VUKILE PROPERTY FUND OL - Odd Lot Offer: Odd lot holders may sell their odd lot holding for the cash consideration 05/24/ /31/ /03/2013 OR elect to retain their odd lot holdings cents in respect of the share portion of the linked unit acquired (i.e.10 cents/r5.00 times the offer price of R19.79 per linked unit); and the balance in respect of the debenture portion of the linked unit acquired. The net dividend portion per share acquired by the company pursuant to the the odd-lot offer is cents per share(being, the offer price in respect of the share portion of the linked unit (39.58 cents per share) less the amount of contributed tax capital (13 cents per share)) for shareholders exempt from paying dividends withholding tax. In this instance, the full offer price of cents per share will be received by such shareholders in respect of the odd-lot share repurchased under the odd-lot offer. CP - Capital Payment: 13 cents per share held 05/24/ /31/ /03/2013 CP - Capital Payment: cents per share held 05/24/ /31/ /03/2013 PV - Par Value Change: from 501 to 491 cents per share on 2013/06/12 VUNANI PROPERTY INVESTMENT FUND (Formerly VUNANI PROPERTY INVESTMENT F) RT - Rights / Claw Back Offer: VPFN shares for every 100 VPF shares held 07/26/ /02/2013 TU - Take-up Rights Offer: 1 VPF share for every 1 VPFN share held (NilPL) 08/16/ /23/2013 SU - Suspension: 2013/08/19 Expiry of NPL (NilPL) TE - Termination: 2013/08/26 Expiry of NPL (NilPL) WESCOAL HOLDINGS PV - Par Value Change: from 0.1 to 0 cents per share on 2013/07/12 WESIZWE PLATINUM PV - Par Value Change: from to 0 cent per share on 2013/02/14 WITWATERSRAND CONS GOLD RESOURCES PV - Par Value Change: from 1 to 0 cent per share on 2013/03/04 ZAPTRONIX SU - Suspension: 2013/01/02 Failure to submit a provisional report TE - Termination: 2013/04/30 Failure to appoint a Designated Adviser, failure to publish financial results for the year ended 31 August 2012; and failure to have the required audit committee composition. Note: any concerns or queries regarding the above information should be forwarded to the JSE Corporate Actions department at corporateactions@jse.co.za. 54
44 NEW LISTINGS FOR THE YEAR 2013 MARKET STATISTICS Company Code Date No. of shares Price Capital Raised (R) Sector Sibanye Gold Limited SGL 11/02/ ,684, Cap Intro Gold Mining GoGlobal Properties Ltd GGP 29/04/ , Cap Intro Real Estate Holdings & Development Giyani Gold Corporation GIY 26/06/ ,728,578 0 Cap Intro Gold Mining Tower Property Fund Ltd TWR 19/07/ ,359, Cap Intro Diversified REIT's The Waterberg Coal Company Ltd WCC 30/09/ ,776,313 0 Cap Intro Coal Southern View Finance Ltd SVF 01/10/2013 3,355, Cap Intro Consumer Finance Attacq Limited ATT 14/10/ ,570, Cap Intro Real Estate Holdings & Development Investec Australia Property Fund IAP 23/10/ ,000,000 0 Cap Intro Real Estate Holdings & Development Redefine International PLC RPL 28/10/2013 1,057,157, Cap Intro Real Estate Holdings & Development Glencore Xstrata plc GLN 13/11/ ,263,405,466 0 Cap Intro General Mining Ascendis Health Ltd ASC 22/11/ ,735, Cap Intro Pharmaceuticals EQUITY MARKET INFORMATION DE-LISTINGS YEAR TO DATE 2013 Company Date Code Reason Sector Sallies Limited 02/01/2013 SALD Maturity General Mining New Africa Investment Ltd 30/01/2013 NAI Setion 124 of the Company Act Publishing Queensgate Hotels & Leisure Limited 18/02/2013 QHL Winding Up Hotels Hardware Warehouse Limited 26/02/2013 HWW Scheme of Arrangement Home Improvement Retailers Jci Ltd 16/04/2013 JCD Non compliance of JSE listings requirements Gold Mining Simmer & Jack Mines 16/04/2013 SIM Failure to acquire viable assets Gold Mining Zaptronix Ltd 30/04/2013 ZPT Failure to comply with listings requirements Electronic Equipment Cape Empowerment Limited 14/05/2013 CAP Scheme of Arrangement Equity Investment Instruments New Bond Capital Ltd 04/06/2013 NBC Scheme of Arrangement Equity Investment Instruments Amalgamated Appliances Holdings Ltd 02/07/2013 AMA Failure to comply with listings requirements Consumer Electronics Thabex Limited 09/07/2013 TBX Failure to comply with listings requirements Diamond & Gemstones Mobile Industries Limited 16/07/2013 MOB Scheme of Arrangement Transportation Services Cipla Medpro SA Ltd 16/07/2013 CMP Scheme of Arrangement Pharmaceutical Lonrho plc 05/08/2013 LAF Scheme of Arrangement Industrial Suppliers Allied Technologies Ltd 20/08/2013 ALT Scheme of Arrangement Mobile Telecommunications AG Industries Limited 27/08/2013 AGI Director's request the JSE to terminate its listings Building Materials & Fixtures Sable Holdings Ltd 03/09/2013 SBL Scheme of Arrangement Real Estate Holdings & Development IFA Hotels and Resorts 10/09/2013 IFH Scheme of Arrangement Hotels Business Connexion Group A 08/10/2013 BCA Scheme of Arrangement Computer Services Uranium One Inc 22/10/2013 UUU Scheme of Arrangement General Mining Redefine Prop International Ltd 04/11/2013 RIN Unbundling Real Estate Holdings & Development Racec Group Ltd 05/11/2013 RAC Scheme of Arrangement Heavy Construction Mvelaserve Limited 12/11/2013 MVS Scheme of Arrangement Business Support Services RIGHTS ISSUES YEAR TO DATE 2013 Company Code Date Shares Price Capital (cents) Raised (R) Pan African Resource plc PAN 07/01/ ,071, ,136,614 Rebosis Property Fund Ltd REB 28/01/ ,035,718 1, ,000,042 Rainbow Chicken Ltd RBW 25/02/ ,964,802 1,420 3,932,900,188 Delta Property Fund Ltd DLT 26/04/ ,047, ,000,000,000 Curro Holdings Limited COH 06/05/ ,489,948 1, ,879,376 Sycom Property Fund SYC 20/05/ ,027,523 2, ,000,002 Vividend Income Fund Ltd VIF 27/05/ ,813, ,390,729 55


45 MONTHLY BULLETIN ADVERTISING BOOKING FORM 56
EQUITY MARKET INFORMATION 2. Warrants listed on the JSE Main Board... EQUITY MARKET INFORMATION 3-4
 CONTENTS EQUITY MARKET INFORMATION 2 Warrants listed on the JSE Main Board...... EQUITY MARKET INFORMATION 3-4 Information Includes JSE at a Glance, Market Statistics, World Markets, Top Ten Companies,
EQUITY MARKET INFORMATION 2. Warrants listed on the JSE Main Board...
 CONTENTS EQUITY MARKET INFORMATION 2 Warrants listed on the JSE Main Board... EQUITY MARKET INFORMATION 3-4 Information Includes JSE at a Glance, Market Statistics, World Markets, Top Ten Companies, New
EQUITY MARKET INFORMATION 2. Warrants listed on the JSE Main Board...
 CONTENTS EQUITY MARKET INFORMATION 2 Warrants listed on the JSE Main Board... EQUITY MARKET INFORMATION 3-4 Information Includes JSE at a Glance, Market Statistics, World Markets, Top Ten Companies, New
EQUITY MARKET INFORMATION 2. Warrants listed on the JSE Main Board...
 CONTENTS EQUITY MARKET INFORMATION 2 Warrants listed on the JSE Main Board... EQUITY MARKET INFORMATION 3-4 Information Includes JSE at a Glance, Market Statistics, World Markets, Top Ten Companies, New
FTSE/ JSE Africa Index Series - Quarterly Review
 FTSE/ JSE Africa Index Series - Quarterly Review 12 September 2012 The FTSE/JSE Advisory Committee met today (12 September 2012) to approve the quarterly changes to the FTSE/JSE Index series. All constituent,
The portfolio compliance process implemented by STANLIB consists of, but is not limited to, the following elements:
 STANLIB Multi-Manager Real Return Fund CERTIFICATE OF COMPLIANCE WITH REGARD TO REGULATION 28 OF THE PENSION FUNDS ACT, NO. 24 OF 1956, AS AT 31 May 2012: Scope This compliance certificate is compiled
COMMODITY DERIVATIVES 8. FTSE/JSE AFRICA INDEX SERIES CONSTITUENTS Information of changes in weightings as at the last day of the month
 CONTENTS EQUITY MARKET INFORMATION Warrants listed on the JSE Main Board 2.. EQUITY MARKET INFORMATION Information includes JSE at Glance, Market Statistics, World Markets, 34 Top Ten Companies, New Capital
FTSE/ JSE Africa Index Series - Quarterly Review
 FTSE/ JSE Africa Index Series - Quarterly Review 02 March 2016 The FTSE/JSE Advisory Committee met today (02 March 2016) to approve the quarterly changes to the FTSE/JSE Index series. All constituent,
Presented by Mike Adsetts
 Presented by Mike Adsetts Agenda Multi management 101 Market performances Portfolio structures and performances Multi management 101 Multi management 200 The principles Setting the scene 12 months 150
Key market performance drivers
 Key market performance drivers Monthly charts June 2013 1 manager of managers Market returns concentration June 2013 (one month) One month to June 2013 1 BAT 18.3% 29 RBX 4.2% 59 SAC 1.3% 87 GRF -1.7%
DOW JONES JSE ALL SHARE S&P JSE RESOURCES
 05 December 2014 www.privatewealth.sanlam.co.za INDEX PTS % INDEX / COMMODITY PTS % DOW JONES 17900-13 -0.07 JSE ALL SHARE 49393-465 -0.93 S&P 500 2072-2 -0.12 JSE RESOURCES 43380-694 -1.58 NASDAQ COMPOSITE
Netwerk24 & Sanlam. itrade with a MILLION Competition. Terms and Conditions
 Netwerk24 & Sanlam itrade with a MILLION Competition Challenge start and end date: Terms and Conditions 1. The challenge starts on Monday 3 September 2018 and ends on Friday 30 November 2018. Registration
DOW JONES JSE ALL SHARE S&P JSE RESOURCES
 06 February 2015 www.privatewealth.sanlam.co.za INDEX PTS % INDEX / COMMODITY PTS % DOW JONES 17885 212 1.20 JSE ALL SHARE 51689 58 0.11 S&P 500 2063 21 1.03 JSE RESOURCES 43866-350 -0.79 NASDAQ COMPOSITE
Indexation at the Core
 Indexation at the Core Behind the name change: Core and Satellite Approach to Portfolio Construction Active approach Core-Satellite approach Index approach Combines best of both worlds Seeks to outperform
FTSE/ JSE Africa Index Series - Quarterly Review
 FTSE/ JSE Africa Index Series - Quarterly Review 1 March 2017 All constituent, sector, free float and shares in issue changes will be applied after the close of business on Friday, 17 March 2017 and will
Weekly Technical Report 18 July 2016
 Weekly Technical Report 18 July 2016 Contents (ctrl+click to follow link): SP 500 ; Top 40 Chart ; Currency ; Charts of Interest ; Relative Rotation Graph ; Sector Analysis ; Weekly Perfomances SP500 above
FTSE JSE INDUSTRIALS NIKKEI GOLD AT 07H
 02 September 2014 www.privatewealth.sanlam.co.za INDEX PTS % INDEX / COMMODITY PTS % DOW JONES closed for public holiday JSE ALL SHARE 51114 155 0.30 S&P 500 closed for public holiday JSE RESOURCES 56157-240
Key market performance drivers. Monthly charts to 31 March 2018
 Key market performance drivers Monthly charts to 31 March 2018 Market concentration One-year returns ending: March-18 February-18 January-18 NASPERS NASPERS NASPERS STANDARD BANK GROUP LTD STANDARD BANK
Weekly Technical Report 3 October 2016
 Weekly Technical Report 3 October 2016 Contents (ctrl+click to follow link): SP 500 ; Top 40 Chart ; Currency ; Commodities ; Charts of Interest ; Relative Rotation Graph ; Sector Analysis ; Weekly Perfomances
FTSE/ JSE Africa Index Series - Quarterly Review
 FTSE/ JSE Africa Index Series - Quarterly Review 03 September 2014 The FTSE/JSE Advisory Committee met today (03 September 2014) to approve the quarterly changes to the FTSE/JSE Index series. All constituent,
DOW JONES JSE ALL SHARE S&P JSE RESOURCES
 29 January 2015 www.privatewealth.sanlam.co.za INDEX PTS % INDEX / COMMODITY PTS % DOW JONES 17191-196 -1.13 JSE ALL SHARE 51201 489 0.97 S&P 500 2002-27 -1.35 JSE RESOURCES 41493 204 0.50 NASDAQ COMPOSITE
Understanding Exchange Traded Funds (ETFs) Investment Solutions for Retail Investors
 Investment Solutions for Retail Investors") Understanding Exchange Traded Funds (ETFs) Investment Solutions for Retail Investors Become A Titan of Wealth Creation Seminar Nelspruit 30 th July 2014 Mike Brown Managing Director etfsa.co.za What Are
Understanding Exchange Traded Funds (ETFs) Investment Solutions for Retail Investors Become A Titan of Wealth Creation Seminar Nelspruit 30 th July 2014 Mike Brown Managing Director etfsa.co.za What Are
JSE LIMITED GEN- General Index Change Advice June 2015 Quarterly Review ICA
 JSE LIMITED GEN- General Index Change Advice 20150622 June 2015 Quarterly Review ICA JSER 201506030043A GEN- General Index Change Advice 20150622 June 2015 Quarterly Review ICA FTSE/ JSE Africa Index Series
The New World of Investing in Exchange Traded Products (ETPs)
") The New World of Investing in Exchange Traded Products (ETPs) Presentation at: JSE / Investec / etfsa.co.za ETP Seminar 26 th February 2013 Mike Brown Managing Director etfsa.co.za Agenda What are Exchange
The New World of Investing in Exchange Traded Products (ETPs) Presentation at: JSE / Investec / etfsa.co.za ETP Seminar 26 th February 2013 Mike Brown Managing Director etfsa.co.za Agenda What are Exchange
Weekly Technical Report 26 September 2016
 Weekly Technical Report 26 September 2016 Contents (ctrl+click to follow link): SP 500 ; Top 40 Chart ; Currency ; Commodities ; Charts of Interest ; Relative Rotation Graph ; Sector Analysis ; Weekly
THIRD SUPPLEMENT ETF OVER THE FTSE / JSE MID CAP INDEX
 THIS SUPPLEMENT CONTAINS IMPORTANT INFORMATION ABOUT RAND MERCHANT BANK AND THE RMB MID CAP ETF ( RMBMIDCAP) AND SHOULD BE READ CAREFULLY BEFORE INVESTING. IF YOU HAVE ANY QUESTIONS ABOUT THE CONTENTS
Key market performance drivers
 Key market performance drivers Monthly charts September 2016 1 Market returns concentration One-year returns ending: September-16 August-16 July-16 NASPERS NASPERS NASPERS SIBANYE GOLD LTD SIBANYE GOLD
Key market performance drivers
 Key market performance drivers Monthly charts September 2017 1 Market returns concentration One-year returns ending: September-17 August-17 July-17 NASPERS NASPERS NASPERS ANGLO ANGLO ANGLO STANDARD BANK
Building Up Your Wealth Through Investment In Exchange Traded Products (ETPs)
") Building Up Your Wealth Through Investment In Exchange Traded Products (ETPs) Women s Investment Seminar JSE, 17 th August 2013 Mike Brown Managing Director etfsa.co.za Agenda What are Exchange Traded
Building Up Your Wealth Through Investment In Exchange Traded Products (ETPs) Women s Investment Seminar JSE, 17 th August 2013 Mike Brown Managing Director etfsa.co.za Agenda What are Exchange Traded
SPDR S&P Emerging Middle East & Africa ETF (GAF) Summary. Description. Historical prices (1 year) DIAMONDS* RATINGS* ETFG RISK RATING 6.
 Summary. Description. Historical prices (1 year) DIAMONDS* RATINGS* ETFG RISK RATING 6.") SPDR S&P Emerging Middle East & Africa ETF (GAF) Tearsheet as of 11:58 am, April 28, 2014. Summary RATINGS* DIAMONDS* ETFG RISK RATING 6.51 ETFG REWARD RATING 7.47 Description SPDR S&P Emerging Middle
SPDR S&P Emerging Middle East & Africa ETF (GAF) Tearsheet as of 11:58 am, April 28, 2014. Summary RATINGS* DIAMONDS* ETFG RISK RATING 6.51 ETFG REWARD RATING 7.47 Description SPDR S&P Emerging Middle
FTSE/ JSE Africa Index Series - Quarterly Review
 FTSE/ JSE Africa Index Series - Quarterly Review 30 August 2017 All constituent, sector, free float and shares in issue changes will be applied after the close of business on Friday, 15 September 2017
The World of ETFs: Diversification, Transparency, Low Cost and Access to All Asset Classes
 The World of ETFs: Diversification, Transparency, Low Cost and Access to All Asset Classes FSP Invest Protect & Prosper Symposium 20 th October 2012 Mike Brown Managing Director etfsa.co.za Agenda What
United States Europe Hong Kong. Local. Japan 13 OCTOBER 2016 DAILY INVESTMENT UPDATE
 13 DAILY INVESTMENT UPDATE United States Europe Hong Kong The S&P 500 and the Dow Jones ended Wednesday's session with small gains as expectations for timing on a rate hike were largely unchanged after
Introduction to Exchange Traded Products (ETPs)
") Introduction to Exchange Traded Products (ETPs) Presentation at: Investor Club / Stokvels Education Seminar - JSE 16 th April 2013 Mike Brown Managing Director etfsa.co.za Agenda What are Exchange Traded
Introduction to Exchange Traded Products (ETPs) Presentation at: Investor Club / Stokvels Education Seminar - JSE 16 th April 2013 Mike Brown Managing Director etfsa.co.za Agenda What are Exchange Traded
Exchange Traded Funds (ETFs) Investment Seminar
 Investment Seminar") Exchange Traded Funds (ETFs) Investment Seminar JSE 15 March 2016 Mike Brown Managing Director etfsa.co.za Agenda What are ETFs and how do they work? Benefits of ETFs. Using ETFs in a discretionary portfolio.
Exchange Traded Funds (ETFs) Investment Seminar JSE 15 March 2016 Mike Brown Managing Director etfsa.co.za Agenda What are ETFs and how do they work? Benefits of ETFs. Using ETFs in a discretionary portfolio.
Stock Select Monthly January 2017
 Stock Select Monthly January 2017 Risk Factor Top 40 up 4.62% this year Invest in one of our portfolios In this edition: o not have the time to actively manage your portfolio? Let us do it for you. ETF
Notes from the FTSE/JSE Advisory Committee Meeting held on Thursday, 2 March 2017
 To: From: Market Participants FTSE/JSE Date: 16 March 2017 Subject: 1. Background Notes from the FTSE/JSE Advisory Committee Meeting held on Thursday, 2 March 2017 The FTSE/JSE Advisory Committee (AC)
1m % ytd % 1m % ytd % Exp. Prev. 5d %
 MORNING DIGEST Global overview Selected indices clientcare@privatewealth.sanlam.co.za South African indices Close Previous 1d % d % Top 97, 93, -,3-1, -, 1, All Share 7,7 7, -,7-1, -, 1,1 Resource 1 3,
9:00 EUR French Flash Services PMI Aug m % ytd % 1m % ytd %
 MORNING DIGEST Global overview Selected indices South African indices Previous 5d % 1m % Top 95, 9575,9 -,5,7 1, 1, All Share 557,3 557,5,,3,75 1,9 Resource 1 3533, 39,5, -, 1, 9,11 Industrial 5 75, 75,7,
Investing in ETFs. etfsa.co.za Seminar JSE Ltd. Mike Brown Managing Director etfsa.co.za. 31 August 2017
 Investing in ETFs Mike Brown Managing Director etfsa.co.za etfsa.co.za Seminar JSE Ltd 31 August 2017 Agenda What are ETFs? What is an index? How ETFs operate as passive index trackers. Investing for Investor
1m % ytd % 1m % ytd %
 MORNING DIGEST Global overview Selected indices South African indices Previous 5d % 1m % Top 5139,9 99, 1,7,7,9 1,1 All Share 535,3 5577,3 1,,3 -,7 11, Resource 1 355,7 35,9 1,1 3,71, 11, Industrial 5
FTSE/ JSE Africa Index Series - Quarterly Review
 FTSE/ JSE Africa Index Series - Quarterly Review 31 May 2017 All constituent, sector, free float and shares in issue changes will be applied after the close of business on Thursday, 15 June 2017 and will
FTSE PAPER. Global Index Standards, Emerging Market Partnerships
 FTSE PAPER Global Standards, Emerging Market Partnerships Global Standards, Emerging Market Partnerships Introduction FTSE s Emerging and Frontier market indices are used by market participants worldwide
ETFs as an Investment Vehicle
 ETFs as an Investment Vehicle Mike Brown Managing Director etfsa.co.za etfsa.co.za Seminar JSE Ltd 29 March 2017 Agenda What are ETFs? What is an index? How ETFs operate as passive index trackers. Investing
FTSE/JSE Africa Index Series All Share Factor Indices Review
 FTSE/JSE Africa Index Series All Share Factor Indices Review 14 September 2018 The following changes will be made to the FTSE/JSE All Share Factor Indices after close of business on Friday, 21 September
Investor update
 www.ppc.co.za Investor update 21 & 22 September 2011 1 Presentation outline 1. Introduction 2. Trading statement released 20 September 2011 3. Product strategy 4. Cement pricing 5. Rest of Africa strategy
FTSE/ JSE Africa Index Series - Quarterly Review
 FTSE/ JSE Africa Index Series - Quarterly Review 5 December 2018 All constituent, sector, free float and shares in issue changes will be applied after the close of business on Friday, 21 December 2018
AMENDMENTS TO THE QUARTERLY REVIEW OF TRADING LIQUIDITY RATING, EXCHANGE MARKET
 JSE EQUITIES MARKET NOTICE Number: 064 (replacement of Market Notice: 060) : 14 June 2010 AMENDMENTS TO THE QUARTERLY REVIEW OF TRADING LIQUIDITY RATING, EXCHANGE MARKET SIZE () BANDINGS, SEGMENT AND SECTOR
Standard Bank Namibia Funds Financial Statements
 Standard Bank Namibia Funds Financial Statements Registration number: STANLIB Namibia Unit Trust Management Company Limited Reg. No. 98/043 Annual Financial Statements For The Year Ended 31 December Contents
Growth and Strategies of Large and Leading Firms - Top 50 firms on the Johannesburg Stock Exchange (JSE) 1
 1") Working Paper 17/2017 Growth and Strategies of Large and Leading Firms - Top 50 firms on the Johannesburg Stock Exchange (JSE) 1 Teboho Bosiu, Nicholas Nhundu, Anthea Paelo, Mmamoletji Oniccah Thosago
Working Paper 17/2017 Growth and Strategies of Large and Leading Firms - Top 50 firms on the Johannesburg Stock Exchange (JSE) 1 Teboho Bosiu, Nicholas Nhundu, Anthea Paelo, Mmamoletji Oniccah Thosago
20 December 2009 Updated on 30 August 2011 Updated on 30 September 2012 Updated on 21 August Investec Bank Limited
 ONE HUNDRED AND SEVENTH SUPPLEMENT to the Warrant and Note Programme Offering Circular dated 20 December 2009 Updated on 30 August 2011 Updated on 30 September 2012 Updated on 21 August 2013 Investec Bank
JUST US Large Cap Diversified Index (JULCD) Calculation Methodology
 Calculation Methodology") JUST US Large Cap Diversified Index (JULCD) Calculation Methodology June 2018 Table of Contents 1 About JUST Capital... 3 2 Important References... 4 3 JUST US Large Cap Diversified Index (JULCD) Summary...
JUST US Large Cap Diversified Index (JULCD) Calculation Methodology June 2018 Table of Contents 1 About JUST Capital... 3 2 Important References... 4 3 JUST US Large Cap Diversified Index (JULCD) Summary...
SII Changes. FF Changes. Large Cap ANH 3 6 ANH (0.29%) NPN (0.23%) NPN (22.71%) 0.91%
 NPN (0.23%) NPN (22.71%) 0.91%") To: Market Participants From: FTSE/JSE Date: 18 December 2018 Subject: Notes from the FTSE/JSE Advisory Committee Meeting held on Thursday, 6 December 2018 1. Background The FTSE/JSE Advisory Committee
To: Market Participants From: FTSE/JSE Date: 18 December 2018 Subject: Notes from the FTSE/JSE Advisory Committee Meeting held on Thursday, 6 December 2018 1. Background The FTSE/JSE Advisory Committee
Namibia Unit Trust Fund. Annual Financial Statements
 Namibia Unit Trust Fund Annual Financial Statements for the year ended 31 December Contents General information 1 Approval of Annual Financial Statements 2 Independent Auditor s Report 3 Standard Bank
Building a Legacy List. Grow. Lead
 Building a Legacy List. Grow. Lead Mpho Ledwaba Disclaimer This presentation is intended to provide general information regarding the [the basics of Shares and Investing], and is not intended to, nor does
THE EMPOWERMENT ENDOWMENT A study of trusts and foundations established from South Africa s black economic empowerment transactions
 RESEARCH REPORT June 2017 THE EMPOWERMENT ENDOWMENT A study of trusts and foundations established from South Africa s black economic empowerment transactions Launch presentation Stuart Theobald, head of
Company Name CAPE Ratio (x) Return (%, 2012) Woolworths Mr Price Aspen Imperial Richemont
 Return (%, 2012) Woolworths Mr Price Aspen Imperial Richemont") Last year, the JSE rallied 34% over the last year and a half, and the market continues to hit new highs this year. This is at severe odds with the state of both the global and South African economy. In
Last year, the JSE rallied 34% over the last year and a half, and the market continues to hit new highs this year. This is at severe odds with the state of both the global and South African economy. In
STANLIB Namibia Unit Trust Management Company Limited and Standard Bank Namibia Funds Financial Statements
 STANLIB Namibia Unit Trust Management Company Limited and Standard Bank Namibia Funds Financial Statements Annual Financial Statements for the year ended 31 December 2012 Registration number: 98/043 Contents
DAILY MARKET COMMENTARY
 20 August 2018 7:39 AM DAILY MARKET COMMENTARY 20 August 2018 Fixed Income and Interest Rates Currencies Commodities Equities LDT JSE performance Economics *Foreign flows Economic calendar #Contacts Click
RISK AND MARKET VOLATILITY. Truly Understanding and Managing It
 RISK AND MARKET VOLATILITY Truly Understanding and Managing It MetAM Ameer Amod Ameer initially qualified as an engineer Lecturing at Technikon's Joined investment industry in 2002 He spent two years at
Key market performance drivers. Monthly charts to 30 September 2018
 Key market performance drivers Monthly charts to 30 September 2018 Market concentration One-year Capped SWIX contributions ending September 2018 Source: StatPro, Power BI and Momentum Investments Active
20 December 2009 Updated on 30 August 2011 Updated on 30 September 2012 Updated on 21 August Investec Bank Limited
 ONE HUNDRED AND THIRTY FIFTH SUPPLEMENT to the Warrant and Note Programme Offering Circular dated 20 December 2009 Updated on 30 August 2011 Updated on 30 September 2012 Updated on 21 August 2013 Investec
Equity Risk Service Q3/2017. Estimating Betas for JSE-Listed Companies and Indices
 Equity Risk Service Q3/2017 Estimating Betas for JSE-Listed Companies and Indices prepared by The African Institute of Financial Markets and Risk Management (AIFMRM) Contents 1 Introduction 4 2 The Basics
Investec Wealth Accelerator
 Investec Wealth Accelerator Presentation 10 May 2018 What is the Investec Wealth Accelerator Equity Structured Product ( ESP )? A 3 year and 8 months equity investment linked to the performance of the
THE IMPACT OF THE RAND ON THE VALUE OF THE JOHANNESBURG STOCK EXCHANGE. G.D.I. Barr and B.S. Kantor 1
 THE IMPACT OF THE RAND ON THE VALUE OF THE JOHANNESBURG STOCK EXCHANGE G.D.I. Barr and B.S. Kantor 1 Abstract The relationship between the foreign exchange value of the rand and the Johannesburg Stock
Sanlam Employee Benefits
 Sanlam Employee Benefits Sanlam Plus Pension & Provident Preservation monthly investment fact sheets March 2017 Sanlam Plus Pension & Provident Preservation March 2017 Member Investment Selection Menu
Noble PP Balanced Fund of Funds CERTIFICATE OF COMPLIANCE WITH REGARD TO REGULATION 28 OF THE PENSION FUNDS ACT, NO. 24 OF 1956, AS AT 31 July 2012:
 Noble PP Balanced Fund of Funds CERTIFICATE OF COMPLIANCE WITH REGARD TO REGULATION 28 OF THE PENSION FUNDS ACT, NO. 24 OF 1956, AS AT 31 July 2012: Scope This compliance certificate is compiled solely
DAILY MARKET COMMENTARY
 18 January 2019 7:54 AM DAILY MARKET COMMENTARY 18 January 2019 Fixed Income and Interest Rates Currencies Commodities Equities LDT JSE performance Economics *Foreign flows Economic calendar #Contacts
Equity Risk Service Q1/2018. Estimating Betas for JSE-Listed Companies and Indices
 Equity Risk Service Q1/2018 Estimating Betas for JSE-Listed Companies and Indices prepared by The African Institute of Financial Markets and Risk Management (AIFMRM) Contents 1 Introduction 4 2 The Basics
DAILY MARKET COMMENTARY
 17 August 2018 7:37 AM DAILY MARKET COMMENTARY 17 August 2018 Fixed Income and Interest Rates Currencies Commodities Equities LDT JSE performance Economics *Foreign flows Economic calendar #Contacts Click
Industry Classification Benchmark (ICB)
") Methodology overview Effective January 1, 2019 Industry Classification Benchmark (ICB) ICB is a single standard that defines the market With approximately 100,000 securities classified worldwide, we provide
Methodology overview Effective January 1, 2019 Industry Classification Benchmark (ICB) ICB is a single standard that defines the market With approximately 100,000 securities classified worldwide, we provide
Market timing on the JSE using exchange rate fluctuations
 Market M Ward* timing and on RC the JSE Terblanche using exchange rate fluctuations Market timing on the JSE using exchange rate fluctuations ABSTRACT Conventional market timing is the process of switching
SEMI-ANNUAL FUND REPORT
 SEMI-ANNUAL FUND REPORT FOR THE 6 MONTHS ENDED 31 DECEMBER 2018 Is it over yet? The years 2016 to 2017 represented periods of steady growth for South African investors. Sadly 2018 was very different, proving
Weekly Market Report. South African Equity Markets. JSE All Share - Daily Chart. JSE All Share - Weekly Gainers & Losers. Top 10 New 52 Week Lows
 Johannesburg 31B Impala Road Chislehurston Sandton +27(0) 11 290 7800 Durban Unit 8, 8 Richefond Circle, Ridgeview, Umhlanga Ridge, 4319 +27(0) 31 584 6491 Cape Town Unit 11, Lonsdale Building, 7 Lonsdale
Main Market Factsheet
 Table : Main - UK Listed Companies: New Issues (IPOs) Equity and Fixed Interest New companies Issue Market Cap at New Money Company/ Issue type/ price admission ( m) raised Date Security Business sector
February 2015 Newsletter ( )
") February 2015 Newsletter (01-02-2015) In this newsletter we will go through a few of our twitter ideas this week. As well as look at the top 15 most watched (on your watchlist) shares on how-to-trade.co.za.
February 2015 Newsletter (01-02-2015) In this newsletter we will go through a few of our twitter ideas this week. As well as look at the top 15 most watched (on your watchlist) shares on how-to-trade.co.za.
TRANSPARENCY IN CORPORATE REPORTING ASSESSING SOUTH AFRICAN COMPANIES
 TRANSPARENCY IN CORPORATE REPORTING ASSESSING SOUTH AFRICAN COMPANIES This report was produced by Corruption Watch as part of a project led by the Transparency International Secretariat with funding from
DAILY MARKET COMMENTARY
 DAILY MARKET COMMENTARY 10 September 2018 10 September 2018 8:33 AM Fixed Income and Interest Rates Currencies Commodities Equities LDT JSE performance Economics *Foreign flows Economic calendar #Contacts
NewFunds Risk Premia ETFs
 NewFunds Risk Premia ETFs NewFunds Value Equity ETF NewFunds Low Volatility ETF NewFunds Equity Momentum ETF Mike Brown Managing Director etfsa.co.za NewFunds Value Equity Exchange Traded Fund (NF Value)
JANUARY 2013 etfsa.co.za MONTHLY SOUTH AFRICAN ETF, ETN AND INDEX TRACKING PRODUCT PERFORMANCE SURVEY
 JANUARY 2013 etfsa.co.za MONTHLY SOUTH AFRICAN ETF, ETN AND INDEX TRACKING PRODUCT PERFORMANCE SURVEY Mike Brown, Managing Director, etfsa.co.za The Monthly Performance Survey for the period ended 31 st
Asset Allocation and Fee Breakdown. December 2015
 Asset Allocation and Fee Breakdown December 2015 SA - Multi Asset - High 31 December 2015 70% 60% 50% 40% 30% 20% Investec Opportunity Coronation Balanced Plus Allan Gray Balanced Nedgroup Investments
Corporate and municipal governance survey 2009 South Africa Listed entities by major grouping
 Foord Compass Ltd Listed JSE No response Declined Additional Trustco Group Holdings Ltd Listed BOAF No response No response Africa Board 1Time Holdings Ltd Listed JSE No response No response Alternative
Letter to our Shareholders
 Selective Empowerment Investments LTD July 2017 Newsletter Letter to our Shareholders The SEI Companies are currently going through a process that could see them being among the biggest empowerment companies
Portfolio watch: what fund managers have bought and sold
 07 Ap ril 2 01 5 PSG Casc ad es - Piete rma ritz b urg 03 3 3 47 2 62 0 wa rre n. fo rbes @ ps g.c o.z a w ww.ps g. co. za/cascad es/ 7 April 2015 The Nikkei Index traded near a two-week high on Tuesday
June Market Statistics. Fact sheets are located within the Statistics section. UK Markets Analysis
 June 211 Market Statistics Table 1: Main - UK listed companies: new issues June 211 Equity and Fixed Interest New companies Market Issue value at Money Broker to issue / Company/ Issue type/ price issue
Weekly Market Report. South African Equity Markets. JSE All Share - Daily Chart. JSE All Share - Weekly Gainers & Losers. Top 10 New 52 Week Lows
 Johannesburg 31B Impala Road Chislehurston Sandton +27(0) 11 290 7800 Durban Unit 8, 8 Richefond Circle, Ridgeview, Umhlanga Ridge, 4319 +27(0) 31 584 6491 Cape Town Unit 11, Lonsdale Building, 7 Lonsdale
Martin Pring s Data Disk Contents
 Martin Pring s Data Disk Contents Please note that the ASCII format disk is identical to the MetaStock version but any comments referring to MetaStock, such as updating an plotting, layouts etc., do not
Statistical Report June SGX The Asian Gateway
 Statistical Report June 2012 SGX The Asian Gateway SGX Monthly Market Statistics June 2012 SGX Statistics At A Glance May 2012 Jun 2012 Number of Trading Days (Securities) 22 21 Securities market Turnover
Market Statistics Report January 2016
 Market Statistics Report January 216 Singapore Exchange SGX Monthly Market Statistics January 216 SGX Statistics At A Glance Dec 215 Jan 216 Number of Trading Days (Securities) 22 2 Securities Market Turnover
QUARTERLY REPORT TO MEMBERS 2nd Quarter 2011
 QUARTERLY REPORT TO MEMBERS 2nd Quarter 211 This is your first-quarter report for the year 211 on the Media24 Retirement Fund and its performance. We have shown the performance of the Media24 portfolios
Hedging Inflation with Equities
 Summary Investors have in the past addressed the threat of inflation via asset allocation. For example, investors might overweight asset classes such as commodities, real estate and TIPs and underweight
Deutsche Börse Indices Market Consultation Considered Methodology Change for MDAX, SDAX and TecDAX. 26 th January, 2018
 Deutsche Börse Indices Market Consultation Considered Methodology Change for MDAX, SDAX and TecDAX 26 th January, 2018 1. Introduction Deutsche Börse Market Consultation - Public - 26.01.2018 Deutsche
Investec Global Gold I Acc GBP
 Fund Summary Quick Stats Citi Code AEE1 FE Crown Rating Price Date 13/07/2018 ISIN Code SEDOL Code GB00B1XFGM25 B1XFGM2 Morningstar Analyst Rating Mid Price 123.63p (+0.60p) S&P Capital IQ Grading Bid
INTRODUCTION TO CFDs
 What we ll cover: - Understanding what a CFD is. - Advantages of Forex CFDs and how they can magnify potential profits. LET S GET GOING. CFD STANDS FOR CONTRACT FOR DIFFERENCE. CFDS ARE A FLEXIBLE ALTERNATIVE
Weekly Market Report. South African Equity Markets. JSE All Share - Weekly Gainers & Losers. JSE All Share - Daily Chart. Top 10 New 52 Week Highs
 Johannesburg 31B Impala Road Chislehurston Sandton +27(0) 11 290 7800 Durban Unit 8, 8 Richefond Circle, Ridgeview, Umhlanga Ridge, 4319 +27(0) 31 584 6491 Cape Town Unit 11, Lonsdale Building, 7 Lonsdale
DAILY MARKET COMMENTARY
 DAILY MARKET COMMENTARY 20 June 2017 7:30 AM For any queries, please contact: Reezwana Sumad ReezwanaS@Nedbank.co.za Charts of the day Currencies Commodities Fixed income & interest rates Equities Equity
Weekly Market Report. South African Equity Markets. JSE All Share - Daily Chart. JSE All Share - Weekly Gainers & Losers. Top 10 New 52 Week Lows
 Johannesburg 31B Impala Road Chislehurston Sandton +27(0) 11 290 7800 Durban Unit 8, 8 Richefond Circle, Ridgeview, Umhlanga Ridge, 4319 +27(0) 31 584 6491 Cape Town Unit 11, Lonsdale Building, 7 Lonsdale
Market Statistics Report October SGX The Asian Gateway
 Market Statistics Report October 2014 SGX The Asian Gateway SGX Monthly Market Statistics October 2014 SGX Statistics At A Glance Sep 2014 Oct 2014 Number of Trading Days (Securities) 22 21 Securities
ANGLO AMERICAN PLC; BHP BILLTON PLC; MTN GROUP LIMITED; OLD MUTUAL PLC; SABMILLER PLC; SASOL LIMITED
 INVESTEC BANK LIMITED ISSUE OF EQUITY STRUCTURED PRODUCTS (ESP) Investec Equity Structured Products (ESP): Commencement Date: 27 June 2011 Reference Index FTSE/JSE Top 40 Index Strike Price 28, 004.00
INTERIM RESULTS FOR THE SIX MONTHS ENDED 31 DECEMBER 2008
 INTERIM RESULTS FOR THE SIX MONTHS ENDED 31 DECEMBER 2008 Forward looking statements Certain statements contained in this document including, without limitation, those concerning the economic outlook for