Intraday Trading Technique
|
|
|
- Delphia McDaniel
- 6 years ago
- Views:
Transcription
1 Intraday Trading Technique 1. Download video lecture with live intraday trade proof from below link 2. Free intraday trading gann angle calculator For product query, call Chennai / Intraday trade using gann angle principle In my book on Gann Method though I have explained various principles of W.D.Gann s method and its application on the stock market but the one which inspired me a lot is Gann angle principle. The Gann angle is defined as the set of trend lines drawn from an individual price point or from different price points (i.e. high, low, and midpoint) in order to identify the supports and resistances of a future price move. At this stage, do not worry much about this definition. It will become simpler as you proceed to the next part of this article. The next big thing about the gann angle trend lines are that they are drawn at a particular angle with respect to the X-axis or to the time line. This concludes the basic formation of gann angle trend lines. Now let me explain this concept with the help of an example. Say I wish to draw a trend line at 1X1 (read it one by one ) gann angle. This means my trend line is a straight line drawn in the price time chart which makes an
2 angle 45 degree with the X-axis. You must ask me that how I have derived the 45 degree. Quite simple! This is a trend line drawn assuming 1 unit of price change happens with 1 unit of time change. If I will plot 1 unit of price change with respect to 1 unit of time change in a semi log scale and measure the angle with the help of a protractor I will get the angular measurement as 45 degrees. For making an intraday trade decision we need a point to make buy or sell entry. We need a stop loss point and couple of target points. Though this job can be done with any guess work but we need perfection. The perfection will be achieved only through the mathematical calculation which is accepted by the market. W.D.Gann has given us 11 different trend lines which will guide us in making a trade decision. These trend lines are drawn based on the geometrical angle proportion in X and Y axis. For example the 2X1 (2 by 1) trend line is drawn assuming the 2 unit of price raise or fall happens in 1 unit of time. This trend line makes geometrical angle of degrees with X-axis when drawn from a lower price point and projected towards the higher price points. Similarly this trend line will make degrees with respect to x axis when it will be drawn from a higher price point and project towards the lower price point. This is the mathematical logic available in origin shifting, parallel line algorithm.
3 Now the 11 sets of trend lines from a lower price point towards the higher price point are as follows 1X1, 1X2, 2X1, 1X3, 3X1, 1X4, 4X1, 1X8, 8X1, 1X16 and 16X1. The geometrical angle made by these trend lines with the X axis in an up move corresponding to 2X1= degrees, 1X2= degrees, 1X1= 45 degrees, 1X3= degrees, 3X1= degrees, 4X1= 75 degrees, 1X4= 15 degrees, 8X1= 82.5 degrees, 1X8= 7.5 degrees, 1X16= 3.75 degrees, 16X1= degrees. The geometrical angle made by these trend lines with the X axis in a down move corresponding to 1X2= degrees, 2X1= degrees, 1X1= 45 degrees,3x1= degrees,1x3= degrees,1x4= 75 degrees,4x1= 15 degrees, 1X8= 82.5 degrees,8x1= 7.5 degrees, 16X1= 3.75 degrees,1x16= degrees. Gann Formula for calculating the support and resistance: In gann study the 180 degree is considered as factor 1. This is because between the sun rise to sun set the solar motion happens approximately 180 degrees and it is considered as 1 day time. The 2 nd universal concept accepted by the financial analysts is that the supports are always calculated in a falling trend and it used to be calculated from the high.
4 The 3 rd universal concept accepted by the financial analysts is that the resistances are always calculated in a falling trend and it used to be calculated from the low. Gann formula for calculating the support and resistance is as follows: a. Support = (square root of (high)- Degree factor)^2 b. Resistance = (square root of (low) + Degree factor)^2 Trading Rules as per gann and as modified by me (Soumya Ranjan Panda Author of this article) a. The 3rd support or resistance of any price move is important (as per W.D.Gann). b. In intraday trade 45 degree support break (1X1 support) will favor sellers and 45 degree resistance (1X1 resistance) break will support the buyers. Provided the annual volatility of the trading instrument must be higher than 50% (as per my own research ) c. In low volatile or medium volatile market (i.e. the annual volatility of the trading instrument is less than 50 %) the (1X4= 15 degree) resistance and (4X1=15 degree) support must be utilized for long and short entry provided no congestion or entry error should be present in the calculated price. (as per my own research ) d. If sell entry price at 15 degree or at 45 degree greater than buy entry price at 15 degree or 45 degree price
5 point then it is considered as error and rectified by changing calculation procedure from the high and low to mid point of high and low. This says that instead of calculating the supports down from high and up from low you can calculate the same from the mid point of high and low (as per my own research ) e. If the price unit of the trading instrument is a 4 digit number then between the buy entry and sell entry price at least 5 unit difference is required to take unbiased decision as per this principle or else it is considered as congestion and it is rectified by changing the high and low to mid point. (as per my own research ) f. If the price unit of the trading instrument is a 3 digit number then between the buy entry and sell entry price at least 3.5 unit difference is required to take unbiased decision as per this principle or else it is considered as congestion and it is rectified by changing the high and low to mid point. (as per my own research ) g. If the price unit of the trading instrument is a 2 digit or single digit number then it must be converted to 4 digit number by the way of multiplying it with 10 or 100 or even with 1000 and the resistances and supports will be derived from the 4 digit number. And the results need to be dividing by the multiplier to reconvert it back to its original form. (as per my own research )
6 h. The smallest time interval in which you can identify the high and low is 5 minuets after the opening bell or the highest time interval you can consider is the 1 st 15 minute after the opening bell. Any auction period must be ignored. Like now in Indian market 9 a.m. to 9 :15 is considered as call auction period. Hence the data from 9 a.m. to 9:15 a.m. must be ignored (as per my own research ) i. If any trade of yours triggers the stop loss or trailing stop loss then do not reenter the trade in the same direction again. As a day trader speculation is my profession and I will follow these calculations like religious testimony. Example: on 11 th November 2010 SBI between 9:15 to 9:30 a.m. made high at 9:16 a.m. low at 9:27 a.m. below given the intraday chart for your reference.
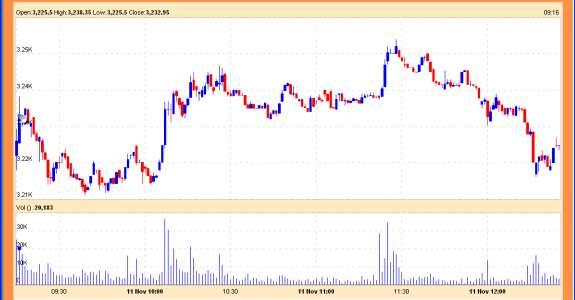
7
8 Below given are the calculation of resistances and supports for reference. Low High Degree Degree Factor Resistance Degree Factor 16X X X X X X X X X X X X X X X X X X X X X X (You can download a ready made free to use gann angle calculator from our web site from the following link The paid calculator which is given along with the master course validates more number of logical conditions and infuses more number of gann principles in the decision making so as to give you greater success in intraday trade.) As per the above discussion and calculation procedure we have made the calculation of resistances and supports. As per the current volatility condition we are being advised to buy the stock at or sell at This is violating the point D trade principle and considered as an entry error henceforth we will change the high and low to its mid point and do the calculation from the mid point the
9 mid point of and is The modified calculation table is as follows. Low High Degree Degree Factor Resistance Degree Factor 16X X X X X X X X X X X X X X X X X X X X X X As per the modified calculation we are advised to buy at for final target and sell at for final target of Trade outcome: 1. At 9:34 a.m. We got a chance to sell at 3217 and kept out stop loss at this as per our calculation. Upon achieving the 1 st target we trail to stop loss to , then upon crossing the 2 nd target we trail the stop loss to Unfortunately after touching the low 3211 at 9:39 a.m. the trailing stop loss triggered at and we just bagged less then +3 points. 2. Considering our short trade adventure is wrong and as per the last protocol set in the trade rule we waited for the to come which we have got a chance at 10:07 a.m. and achieved till 3254 till 11:27 a.m. which is close near to our 45 degree target point.
10 If you are not quick in changing the stop loss also it will not dampen your trade performance. In this case if my shell stop loss triggered at I will accept close near to 18.9 point loss and be a buyer at this point keeping the stop at and aim for the last target 3281 with some logical trailing stop loss. This concept works in commodity, currency as well as in stocks. However the limitation of this article is that it does not discuss all the trading rules and conditions which are being researched by me. In the gann master course the supplied software uses all the extended set of logics.
11 Day trading using Gann Angle dynamic approach: if we will make use of the volatility along with the gann angle then this concept will become dynamic and it will produce great result. All the above process that I have explained in the earlier section will remain same only additional parameter daily volatility will be used with the gann angle. In this method, we will calculate the daily volatility based on the past 10 days last trade price of any instrument. 1. Daily volatility calculation: a. Take past 10 days last trade price of any stock or index. b. Calculate the absolute return by using the natural logarithm function LN(). You will get 9 data points. Formula: Absolute return = LN (Current price/ Previous price) c. Calculate the square absolute return for all 9 data points. d.calculate the average of absolute return and square absolute return. e. Calculate variance. Formula: Variance = square absolute return (absolute return) 2 f. Calculate daily volatility percentage. Formula: Daily Volatility percentage = square root of (variance) X 100. From the daily volatility percentage, we understood in the coming day the stock or index whose daily volatility percentage was calculated as per the above process would fluctuate to the extent of daily volatility percentage.
12 I have taken the state bank of India 12 October to 25 October 2011 to predict the intraday level for next trading session using the gann angle and the volatility. a. I have calculated the daily volatility as explained above for sbi. Date LTP-SBI Absolute return Square absolute return 12-Oct Oct E Oct E Oct E Oct E Oct Oct Oct E Oct Oct Average Variance Daily Volatility % Above calculation says the daily volatility is %. Hence, the stock has the probability to fluctuate by % in the coming day. Base on the above conclusion I will see a price fluctuation of (i.e x /100) rupee in the sbi counter in future trading session. Hence my expected high is = my expected low is = Now in order to get the buy sell level in the gap up opening with uptrend I will use the as low and
13 as high in the gann angle tool and follow all its rules to derive the targets. Using the above price points I observe that the trading rule d is being violated, hence I have done the changes in the data point to (i.e. midpoint of the above data points) and derive the following levels for the future trading session. Low High Degree Degree Factor Resistance Degree Factor support 16X X X X X X X X X X X X X X X X X X X X X X In the future trading session which follows the 25 th october 2011 any gap up opening above and below , if the price cross over then I will buy sbi for optimum target of 1898 and any gap up opening and price below 1849 I will sell for target Similarly, to get the buy sell levels in the gap down opening and downtrend I will use the as high and as low in gann angle tool and derive the targets. Using the above price points I observe that the trading rule d is being violated, hence I have done the changes in
14 the data point to (i.e. midpoint of the above data points) and derive the following levels for the future trading session. Degree Degree Factor Low High Resistance Degree Factor support 16X X X X X X X X X X X X X X X X X X X X X X In the future trading session which follows the 25 th october 2011 any gap down opening above and below , if the price cross over then I will buy sbi for optimum target of and any gap down opening and price below I will sell for target If the price in future day may have a gap up opening above or below or gap down opening below or above then the
15 above calculation will not solve our requirement then we need to take the opening price of that day into account for calculation of volatility. We will use the opening price with projected high and opening price with projected low in gann angle tool to derive the entry levels. Say SBI open at 1870 on the future trading day which follows the 25 th october 2011 then in the volatility calculation replace the with 1870 and calculated the new volatility and expected high and low. The new data points will be as follows Date LTP-SBI Absolute return Square absolute return 12-Oct Oct E Oct E Oct E Oct E Oct Oct Oct E Oct Oct Average Variance Daily Volatility % Expected high Expected low New trading levels in uptrend will be as given below. Since the opening is gap up the uptrend, calculation will be followed for trade decision. In this case, the downtrend level calculation is not required.
16 Degree Degree Factor Low High Resistance Degree Factor support 16X X X X X X X X X X X X X X X X X X X X X X Trend termination point: Gann angle also helps us in identifying the trend and the trend termination. 1 X 4 or the 4 X 1 angle price point cross over is known as the preliminary trend confirmation points for uptrend or downtrend. However, the 1 X 1 angle price resistance crossover signals the strong up trend break out and the 1 X 1 angle price support break considered as strong down trend break out. In gann angle concept we assume all the trend action will terminate at 1 X 16 or 16 X 1 angle price point. Dynamic gann square of nine principles: Using the volatility we can make any gann method dynamic. In gann square of nine principle, we need to derive the uptrend price points in the wheel by adding the step to the lowest number and each higher number in the wheel will be its preceding number added with the step. Similarly the downtrend price points will be calculated by subtracting the
17 step from the highest number. Step is nothing but the high to low price difference divided by 81 for square of nine wheel. While using the gann square of nine for deriving the short-term investment decision I found the principle yields good result. However when applying the same concept in the intraday trade I did not get the desired result which I was expecting from the method. This is the reason why I have thought of to introduce the volatility in this method. Now the key question is how the volatility will find a place in this method. As I have explained before the daily volatility, percentage is the expected price fluctuation. Hence, now we will take the expected price fluctuation to derive the steps. Consider the same example of SBI given in page 105. The daily volatility percentage is , expected price range is Rs 28.12, and the last trade price is Step will be 28.12/81= Seed number will be this will be the 1 st number in the square of nine wheel. Second number will be 1 st number added with Likewise the 81 st number will be 80 th number added with the and this must be equal to =

18 Dynamic gann square of twelve principles: The way i have done the square of nine dynamic in the same way I will make the square of 12 dynamic. I will use the daily volatility percentage to find the price range for the day followed with I will calculate the steps by dividing the price range with 144. The seed number in the uptrend will be the last trade price added with the step and the 144 th number will be 143 rd number added with the step. However do remember the square of 12 wheel is a different from the square of nine wheel in many aspects the arrangement of numbers are also different. The downtrend price points will be calculated by the way of subtracting the step from the last trade price. While using Dynamic Square of nine or dynamic square of twelve wheels keep a close eye on the annual volatility percentage. Annual volatility is nothing but the daily volatility multiplied with square root of 365. If the annual volatility is above 40% use the square of twelve wheel else use the dynamic square of 9 for making the intraday trade decision.
19 You can buy w.d. gann course with 34 intraday trade technique along with intraday gann trading software useful for stock, index, commodity, and currency at Rs Detail of the course you will find from the following link For product related enquiry, you can contact /
Trends. Define the term Trend Explain why Trend is important Identify Primary, Secondary, and Short-Term trends
 Trends Define the term Trend Explain why Trend is important Identify Primary, Secondary, and Short-Term trends 1 What is a Trend? Uptrend Prices rise and fall in Trends Trend is defined as: Up (Rising)
One-year trade mentoring program Trade Mentoring Program six ways of support 1-year post-sale
 Smart Trader One-year trade mentoring program After selling a product to you our duty does not stop there. Post-sale-support we believe is the key point of your and our satisfaction. Hence we have brought
2.0. Learning to Profit from Futures Trading with an Unfair Advantage! Income Generating Strategies Essential Trading Tips & Market Insights
 2.0 Learning to Profit from Futures Trading with an Unfair Advantage! Income Generating Strategies Essential Trading Tips & Market Insights Income Generating Strategies Essential Trading Tips & Market
Introduction to the Gann Analysis Techniques
 Introduction to the Gann Analysis Techniques A Member of the Investment Data Services group of companies Bank House Chambers 44 Stockport Road Romiley Stockport SK6 3AG Telephone: 0161 285 4488 Fax: 0161
Binary Options Trading Strategies How to Become a Successful Trader?
 Binary Options Trading Strategies or How to Become a Successful Trader? Brought to You by: 1. Successful Binary Options Trading Strategy Successful binary options traders approach the market with three
STEP. Establish Short-Term Trend & Retracements. What is a trend?
 Establish Short-Term Trend & Retracements STEP 3 In Step Three, you will establish Short- Term Trend and Retracements on daily charts. By defining the trend and retracement, you will gain knowledge that
Resistance to support
 1 2 2.3.3.1 Resistance to support In this example price is clearly consolidated and we can expect a breakout at some time in the future. This breakout could be short or it could be long. 3 2.3.3.1 Resistance
Time value of money-concepts and Calculations Prof. Bikash Mohanty Department of Chemical Engineering Indian Institute of Technology, Roorkee
 Time value of money-concepts and Calculations Prof. Bikash Mohanty Department of Chemical Engineering Indian Institute of Technology, Roorkee Lecture 04 Compounding Techniques- 1&2 Welcome to the lecture
Figure 3.6 Swing High
 Swing Highs and Lows A swing high is simply any turning point where rising price changes to falling price. I define a swing high (SH) as a price bar high, preceded by two lower highs (LH) and followed
The Best Gann Fan Trading Strategy
 The Best Gann Fan Trading Strategy The best Gann fan trading strategy is a complex support and resistance trading strategy that uses diagonal support and resistance levels. Unlike the traditional horizontal
Word for the day: Basic concepts of trends
 Word for the day: Basic concepts of trends The concept of trend is the cornerstone of the technical approach of analyzing financial markets. The purpose of the tools used by a chartist (trend lines, support
(Refer Slide Time: 00:55)
") Engineering Economic Analysis Professor Dr. Pradeep K Jha Department of Mechanical and Industrial Engineering Indian Institute of Technology Roorkee Lecture 11 Economic Equivalence: Meaning and Principles
Engineering Economic Analysis Professor Dr. Pradeep K Jha Department of Mechanical and Industrial Engineering Indian Institute of Technology Roorkee Lecture 11 Economic Equivalence: Meaning and Principles
PSYCHOLOGY OF FOREX TRADING EBOOK 05. GFtrade Inc
 PSYCHOLOGY OF FOREX TRADING EBOOK 05 02 Psychology of Forex Trading Psychology is the study of all aspects of behavior and mental processes. It s basically how our brain works, how our memory is organized
An Introduction to Long and Short Entry Gap Trading. Leroy Rushing
 An Introduction to Long and Short Entry Gap Trading Leroy Rushing Key Points: The stock market is volatile; be prepared to lose trades As a beginning day trader, start with very low risk tolerance and
Managerial Accounting Prof. Dr. Varadraj Bapat Department School of Management Indian Institute of Technology, Bombay
 Managerial Accounting Prof. Dr. Varadraj Bapat Department School of Management Indian Institute of Technology, Bombay Lecture - 30 Budgeting and Standard Costing In our last session, we had discussed about
On a chart, price moves THE VELOCITY SYSTEM
 ADVACED Strategies THE VELOCITY SYSTEM TABLE 1 TEST-SAMPLE PERFORMACE SUMMARY FOR LEAST SQUARES VELOCITY SYSTEM The initial sample test period produced the following results using the optimized parameter
Optimization Prof. A. Goswami Department of Mathematics Indian Institute of Technology, Kharagpur. Lecture - 18 PERT
 Optimization Prof. A. Goswami Department of Mathematics Indian Institute of Technology, Kharagpur Lecture - 18 PERT (Refer Slide Time: 00:56) In the last class we completed the C P M critical path analysis
Swing Trading Strategies that Work
 Swing Trading Strategies that Work Jesse Livermore, one of the greatest traders who ever lived once said that the big money is made in the big swings of the market. In this regard, Livermore successfully
I Always Come Back To This One Method
 I Always Come Back To This One Method I can attribute my largest and most consistent gains to this very method of trading, It always work and never fails although I ve been known to still screw it up once
Technical analysis & Charting The Foundation of technical analysis is the Chart.
 Technical analysis & Charting The Foundation of technical analysis is the Chart. Charts Mainly there are 2 types of charts 1. Line Chart 2. Candlestick Chart Line charts A chart shown below is the Line
Market Mastery Protégé Program Method 1 Part 1
 Method 1 Part 1 Slide 2: Welcome back to the Market Mastery Protégé Program. This is Method 1. Slide 3: Method 1: understand how to trade Method 1 including identifying set up conditions, when to enter
ASX Schools Sharemarket Game
 The ASX charts When you spend time discovering a company s story and looking at company numbers you are using what is called fundamental analysis. Many people who invest in the sharemarket use fundamental
very High Probability High Risk/Reward Ratio Risk Management Capital Efficiency
 First, I look for Stocks and ETF s (Exchange Trades Funds) to TRADE, this is different than a long term Buy and Hold investment strategy. The typical time that I hold each Stock or ETF is one month to
Test Your Chapter 1 Knowledge
 Self-Test Answers Test Your Chapter 1 Knowledge 1. Which is the preferred chart type in LOCKIT? The preferred chart type in LOCKIT is the candle chart because candle patterns are part of the decision-making
INTRADAY EMISSIONS TRADING. How to trade volatility breakouts profitably.
 TIPS. 15 SKYSCRAPER. ICC Tower, Hong Kong. The todays tallest building in Hong Kong on the scale of 484 metres high. I NCLUDES VIDEO INTRADAY EMISSIONS TRADING. How to trade volatility breakouts profitably.
Penny Stock Guide. Copyright 2017 StocksUnder1.org, All Rights Reserved.
 Penny Stock Guide Disclaimer The information provided is not to be considered as a recommendation to buy certain stocks and is provided solely as an information resource to help traders make their own
Free signal generator for traders
 Free signal generator for traders Trader s Bulletin Pivot Point Trading Strategy 1. Just download the FREE tool 2. Key in a few numbers 3. And follow the simple techniques by Mark Rose To make money from
Less Stress With The JM Internal Band
 CHARTING Simplicity And Strategy Less Stress With The JM Internal Band Here s a trading strategy that helps you sleep soundly and prepares you for the market the following morning. by Koos van der Merwe
OSCILLATORS. TradeSmart Education Center
 OSCILLATORS TradeSmart Education Center TABLE OF CONTENTS Oscillators Bollinger Bands... Commodity Channel Index.. Fast Stochastic... KST (Short term, Intermediate term, Long term) MACD... Momentum Relative
(Refer Slide Time: 2:56)
") Depreciation, Alternate Investment and Profitability Analysis. Professor Dr. Bikash Mohanty. Department of Chemical Engineering. Indian Institute of Technology, Roorkee. Lecture-5. Depreciation Sum of
Depreciation, Alternate Investment and Profitability Analysis. Professor Dr. Bikash Mohanty. Department of Chemical Engineering. Indian Institute of Technology, Roorkee. Lecture-5. Depreciation Sum of
The Truth About Fibonacci. Trading
 The Truth About Fibonacci Trading 2 The Truth About Fibonacci Trading The truth about Fibonacci levels is that they are useful (like all trading indicators). They do not work as a standalone system of
The 2 nd Order Polynomial Next Bar Forecast System Working Paper August 2004 Copyright 2004 Dennis Meyers
 The 2 nd Order Polynomial Next Bar Forecast System Working Paper August 2004 Copyright 2004 Dennis Meyers In a previous paper we examined a trading system, called The Next Bar Forecast System. That system
Popular Exit Strategies The Good, the Bad, and the Ugly
 Popular Exit Strategies The Good, the Bad, and the Ugly A webcast presentation for the Market Technicians Association Presented by Chuck LeBeau Director of Analytics www.smartstops.net What we intend to
Data Analysis and Statistical Methods Statistics 651
 Data Analysis and Statistical Methods Statistics 651 http://www.stat.tamu.edu/~suhasini/teaching.html Lecture 10 (MWF) Checking for normality of the data using the QQplot Suhasini Subba Rao Review of previous
Class 7: Moving Averages & Indicators. Quick Review
 Today s Class Moving Averages Class 7: Moving Averages & Indicators 3 Key Ways to use Moving Averages Intro To Indicators 2 Indicators Strength of Lines Quick Review Great for establishing point of Support
Biostatistics and Design of Experiments Prof. Mukesh Doble Department of Biotechnology Indian Institute of Technology, Madras
 Biostatistics and Design of Experiments Prof. Mukesh Doble Department of Biotechnology Indian Institute of Technology, Madras Lecture - 05 Normal Distribution So far we have looked at discrete distributions
Chapter 6: Supply and Demand with Income in the Form of Endowments
 Chapter 6: Supply and Demand with Income in the Form of Endowments 6.1: Introduction This chapter and the next contain almost identical analyses concerning the supply and demand implied by different kinds
TRADING STRATEGY SERIES LEARN HOW TO SPOT OPPORTUNITIES IN VOLATILE MARKETS fpmarkets.com.au
 1 TRADING STRATEGY SERIES LEARN HOW TO SPOT OPPORTUNITIES IN VOLATILE MARKETS This educational material does not constitute financial product advice and does not take into account your investment objectives,
A handbook of the basics
 Primer Market Analysis United States 14 May 2013 A handbook of the basics Market Analysis Technical Handbook We cover the basics of Trend, Momentum and other technical indicators and methods. Stephen Suttmeier,
INTERMEDIATE EDUCATION GUIDE
 INTERMEDIATE EDUCATION GUIDE CONTENTS Key Chart Patterns That Every Trader Needs To Know Continution Patterns Reversal Patterns Statistical Indicators Support And Resistance Fibonacci Retracement Moving
VARIABILITY: Range Variance Standard Deviation
 VARIABILITY: Range Variance Standard Deviation Measures of Variability Describe the extent to which scores in a distribution differ from each other. Distance Between the Locations of Scores in Three Distributions
Magic Line Trading System. A Simple, Easy-To-Learn Price-Action Trading Strategy
 Magic Line Trading System A Simple, Easy-To-Learn Price-Action Trading Strategy 1. Disclaimer... 3 2. Introduction... 4 3. Trading as a career... 6 4. Getting started... 8 5. Setting up your charts...
Experts for Trailing MT4 created by Yorik /
 Experts for Trailing MT4 created by Yorik / yorik@list.ru EAs first published 13/09/2007 at Hhttp://codebase.mql4.com/ru/1101 What it is and what it's for Below you can find descriptions of a number of
The Strategies Working Best in Today s E-Mini Market
 The Strategies Working Best in Today s E-Mini Market Todd Mitchell Craig Hill Legal Disclaimer No claim is made by Trading Concepts, Inc. that the trading strategies shown here will result in profits and
Chapter 5: Summarizing Data: Measures of Variation
 Chapter 5: Introduction One aspect of most sets of data is that the values are not all alike; indeed, the extent to which they are unalike, or vary among themselves, is of basic importance in statistics.
SUPPLEMENTARY LESSON 1 DISCOVER HOW THE WORLD REALLY WORKS ASX Schools Sharemarket Game THE ASX CHARTS
 SUPPLEMENTARY LESSON 1 THE ASX CHARTS DISCOVER HOW THE WORLD REALLY WORKS 2015 ASX Schools Sharemarket Game The ASX charts When you spend time discovering a company s story and looking at company numbers
NEWSLETTER SWING TRADING. 28 Feb Intelligent Analysis to point your decisions in the right direction
 NEWSLETTER 28 Feb 2018 Intelligent Analysis to point your decisions in the right direction SWING TRADING Newsletter contains index, stocks and sector recommendations along with market outlook. It also
DAILY DAY TRADING PLAN
 DAILY DAY TRADING PLAN Gatherplace will be used to place all of your trades. You will be using the 5 minute chart for the trade setup and the 1 minute chart for your entry, stop and trailing stop.you will
MLC at Boise State Logarithms Activity 6 Week #8
 Logarithms Activity 6 Week #8 In this week s activity, you will continue to look at the relationship between logarithmic functions, exponential functions and rates of return. Today you will use investing
Compass FX
 SYNERGY Trading Method Disclaimer Unique experiences and past performances do not guarantee future results. Trading in the off-exchange Foreign Exchange market (Forex) is very speculative in nature, involves
The Master Trader Counter-Trend Trade Set-Ups
 The Master Trader Counter-Trend Trade Set-Ups Trading Concepts, Inc. The Master Trader Counter-Trend Trade Set-Ups By Todd Mitchell Copyright 2014 by Trading Concepts, Inc. All Rights Reserved This training
WHS FutureStation - Guide LiveStatistics
 WHS FutureStation - Guide LiveStatistics LiveStatistics is a paying module for the WHS FutureStation trading platform. This guide is intended to give the reader a flavour of the phenomenal possibilities
THE TRUTH ABOUT FIBONACCI TRADING
 PRESENTS THE TRUTH ABOUT FIBONACCI TRADING ALL TRADING INFORMATION REVEALED 1 INTRODUCTION The truth about Fibonacci levels is that they are useful (like all trading indicators). They do not work as a
Tips for Traders 6/8/ :17:00 AM How I Set Stops and Profit Targets
 Tips for Traders 6/8/2009 10:17:00 AM How I Set Stops and Profit Targets The US dollar has been in a freefall against the Canadian dollar. Although I have a long-term core position in this currency pair,
Intraday Open Pivot Setup
 Intraday Open Pivot Setup The logistics of this plan are relatively simple and take less than two minutes to process from collection of the previous session s history data to the order entrance. Once the
Trading Lessons from the Intraday Frame (study)
") 1 Daily "Idealized Trades" Report Trading Lessons from the Intraday Frame (study) 1 2018 TheoTrade LLC. All rights reserved. 2 Trading Lessons from the Intraday Frame (1-mi) 2 2018 TheoTrade LLC. All rights
1 Daily "Idealized Trades" Report Trading Lessons from the Intraday Frame (study) 1 2018 TheoTrade LLC. All rights reserved. 2 Trading Lessons from the Intraday Frame (1-mi) 2 2018 TheoTrade LLC. All rights
Knowing When to Buy or Sell a Stock
 Knowing When to Buy or Sell a Stock Overview Review & Market direction Driving forces of market change Support & Resistance Basic Charting Review & Market Direction How many directions can a stock s price
SCEPTRE TRADING A COURSE IN DAY AND SWING TRADING
 SCEPTRE TRADING A COURSE IN DAY AND SWING TRADING STOCK PRICE CHARACTERISTICS AND TRADING TECHNIQUES INTRODUCTION Overview of where we re going this week during the course Why use technical analysis to
Page 1 of 96 Order your Copy Now Understanding Chart Patterns
 Page 1 of 96 Page 2 of 96 Preface... 5 Who should Read this book... 6 Acknowledgement... 7 Chapter 1. Introduction... 8 Chapter 2. Understanding Charts Convention used in the book. 11 Chapter 3. Moving
.. /-!"::- '..- ( \.- - '-/../ '
 ....'-/ -!"::- ' ( \.-../ ' /- Triple Shot Forex Trading System The term "Day Trading" usually refers to the act of buying and selling a financial instrument within the same day. In the Forex market, a
Time value of money-concepts and Calculations Prof. Bikash Mohanty Department of Chemical Engineering Indian Institute of Technology, Roorkee
 Time value of money-concepts and Calculations Prof. Bikash Mohanty Department of Chemical Engineering Indian Institute of Technology, Roorkee Lecture 08 Present Value Welcome to the lecture series on Time
The Gann Analysis Rule Book
 2006 Gann Managament Ltd. All Rights Reserved. Gann Management Limited is authorised and Regulated by the Financial Services Authority The Gann Analysis Rule Book A Man Who Never Changes His Mind Will
Trading With Price Action Alone
 Trading With Price Action Alone The very premise of technical analysis, based on the efficient market hypothesis, is that all the information about a financial product or market is reflected in its price.
Square Timer v3.5.x Users Guide
 Square Timer v3.5.x Users Guide The Square Timer program, also called SQT, is a very useful program for the purpose of time/price squaring. W. D. Gann determined decades ago that there was a mathematical
David vs Goliath. How small traders can Benefit from the Big Players. coverstory. Gernot Daum
 David vs Goliath How small traders can Benefit from the Big Players What does a trader need to complete his trades in a disciplined way? Confidence! And how can he get that? By knowing what he is doing
Global Financial Management
 Global Financial Management Bond Valuation Copyright 24. All Worldwide Rights Reserved. See Credits for permissions. Latest Revision: August 23, 24. Bonds Bonds are securities that establish a creditor
Williams Percent Range
 Williams Percent Range (Williams %R or %R) By Marcille Grapa www.surefiretradingchallenge.com RISK DISCLOSURE STATEMENT / DISCLAIMER AGREEMENT Trading any financial market involves risk. This report and
Homework Assignment #1 - Based on the MTAEF Glossary of Technical Terms
 Homework Assignment #1 - Based on the MTAEF Glossary of Technical Terms Each block of 3 question is preceded by 5 technical terms. Fill in the blank and make the statement complete. There is only one correct
Stock Market Basics Series
 Stock Market Basics Series HOW DO I TRADE STOCKS.COM Copyright 2012 Stock Market Basics Series THE STOCHASTIC OSCILLATOR A Little Background The Stochastic Oscillator was developed by the late George Lane
JOURNAL NEW GANN SWING CHARTIST DYNAMIC FIBONACCI CHANNELS ROBERT KRAUSZ'S. Volume 1, Issue 2. ell, we have survived
 ROERT KRUSZ'S JOURNL Volume 1, Issue 2 NEW GNN SWING HRTIST DNMI IONI HNNELS TM TM W ell, we have survived the first issue, and we are late with the second issue because I was working with some bankers
Darvas Trading - Defining the Trend
 Daryl Guppy In Association With www.nicolasdarvastrading.com Darvas Trading - Defining the Trend with Volatility 22 Hibernia Cres, Brinkin, Box 40043, Casuarina, Northern Territory, Australia, 0811 Phone
The Robust Repeated Median Velocity System Working Paper October 2005 Copyright 2004 Dennis Meyers
 The Robust Repeated Median Velocity System Working Paper October 2005 Copyright 2004 Dennis Meyers In a previous article we examined a trading system that used the velocity of prices fit by a Least Squares
MY RULES: 5 MINUTE INTRADAY TRADING SYSTEM ADDITIONAL GUIDELINES/ISSUES TO CONSIDER
 MY RULES: 5 MINUTE INTRADAY TRADING SYSTEM ADDITIONAL GUIDELINES/ISSUES TO CONSIDER 7. ADDITIONAL ISSUES TO CONSIDER: Adapted from Original developer Phillip Nel 4ed Oct 2007 7.1 Look for activities on
Education Pack. Options 21
 Education Pack Options 21 What does the free education pack contain?... 3 Who is this information aimed at?... 3 Can I share it with my friends?... 3 What is an option?... 4 Definition of an option...
UNIT 16 BREAK EVEN ANALYSIS
 UNIT 16 BREAK EVEN ANALYSIS Structure 16.0 Objectives 16.1 Introduction 16.2 Break Even Analysis 16.3 Break Even Point 16.4 Impact of Changes in Sales Price, Volume, Variable Costs and on Profits 16.5
FUTURES CONTRACTS AND FUTURES OPTION CONTRACTS
 CLIENT SERVICE AGREEMENT Halifax New Zealand Limited Client Service Agreement Product Disclosure Statement for FUTURES CONTRACTS AND FUTURES OPTION CONTRACTS Halifax New Zealand Limited Financial Services
Lecture 9, Part 2. Graphical Patterns Analysis. Continuation Patterns
 Lecture 9, Part 2 Graphical Patterns Analysis Continuation Patterns The graphical configurations we would look into are called continuation patterns. Such models usually mean that the period of price stagnation
How To Read Charts Like A Pro Your guide to reading stock charts!
 How To Read Charts Like A Pro Your guide to reading stock charts! Courtesy of Swing-Trade-Stocks.com You may distribute this book FREELY or use it as part of a commercial package as long as this page and
Part 2: ASX charts - more charting tools. OHLC / Bar chart
 Part 2: ASX charts - more charting tools OHLC / Bar chart A bar chart simply takes the information from the day's trading and plots that information on a single vertical 'bar'. A tab on the left side of
FINANCIAL MANAGEMENT ( PART-2 ) NET PRESENT VALUE
 NET PRESENT VALUE") FINANCIAL MANAGEMENT ( PART-2 ) NET PRESENT VALUE 1. INTRODUCTION Dear students, welcome to the lecture series on financial management. Today in this lecture, we shall learn the techniques of evaluation
FINANCIAL MANAGEMENT ( PART-2 ) NET PRESENT VALUE 1. INTRODUCTION Dear students, welcome to the lecture series on financial management. Today in this lecture, we shall learn the techniques of evaluation
DAY TRADING GUIDE TRADE ON EVERY MOVE CATCH ME IF YOU CAN.
 DAY TRADING GUIDE TRADE ON EVERY MOVE CATCH ME IF YOU CAN. RISK WARNING PAST PERFORMANCE DOES NOT INDICATE FUTURE RESULTS. TRADE WITH STRICT MINIMAL MONEY MANAGEMENT TO AVOID PSYCHOLOGICAL EMOTION WHILE
Technical Analysis Workshop Series. Session Two
 Technical Analysis Workshop eries ession Two DICLOURE & DICLAIMER This research material has been prepared by NU Invest. NU Invest specifically prohibits the redistribution of this material in whole or
(Refer Slide Time: 0:50)
") Depreciation, Alternate Investment and Profitability Analysis. Professor Dr. Bikash Mohanty. Department of Chemical Engineering. Indian Institute of Technology, Roorkee. Lecture-3. Declining Balance Method.
Depreciation, Alternate Investment and Profitability Analysis. Professor Dr. Bikash Mohanty. Department of Chemical Engineering. Indian Institute of Technology, Roorkee. Lecture-3. Declining Balance Method.
Free Forex Midnight Setup Strategy
 Free Forex Midnight Setup Strategy User s Guide Reviewed and recommended by Rita Lasker www.ritalasker.com Read this There are lots of different strategies on the market. We test most of them and want
Losing When Good Trade Goes Bad
 Webinar 21 Feb 2017 (futures.io) Losing When Good Trade Goes Bad Al Brooks How to Trade Forex Price Action Part Video #54 Brooks Trading Course BrooksTradingCourse.com BrooksPriceAction.com Main Points
Combining Rsi With Rsi
 Working Two Stop Levels Combining Rsi With Rsi Optimization and stop-losses can help you minimize risks and give you better returns. channels, and so forth should be kept to a minimum. DAVID GOLDIN ou
Relative Rotation Graphs (RRG Charts)
") Relative Rotation Graphs (RRG Charts) Introduction Relative Rotation Graphs or RRGs, as they are commonly called, are a unique visualization tool for relative strength analysis. Chartists can use RRGs
Relative Rotation Graphs (RRG Charts) Introduction Relative Rotation Graphs or RRGs, as they are commonly called, are a unique visualization tool for relative strength analysis. Chartists can use RRGs
Introduction to Population Modeling
 Introduction to Population Modeling In addition to estimating the size of a population, it is often beneficial to estimate how the population size changes over time. Ecologists often uses models to create
For Valued Subscribers Only..
 HIGH PROBABILITY FOREX PRICE PATTERNS For Valued Subscribers Only.. ( Profitable Forex Price Patterns Which Are Simple To Use & Proven To Deliver High Probability Results Even For Complete Newbies Starting
Technology. We believe in the smart employment of: Hardware Data Relay (Internet) Communication Visualization tools Data feed
 Communication Visualization tools Data feed") Technology We believe in the smart employment of: Hardware Data Relay (Internet) Communication Visualization tools Data feed Order performance Software Exchange Automation Reporting techniques Together
Technology We believe in the smart employment of: Hardware Data Relay (Internet) Communication Visualization tools Data feed Order performance Software Exchange Automation Reporting techniques Together
always searching, never finding!
 March 29, 2015 Random Rambling Ruminations of a Relic Part 3 in a Continuing Series A trading plan what is it and why is it important? Ask 10 traders this question and get twenty answers. In a previous
Level I Learning Objectives by chapter (2017)
") Level I Learning Objectives by chapter (2017) 1. The Basic Principle of Technical Analysis: The Trend Define what is meant by a trend in Technical Analysis Explain why determining the trend is important
Level I Learning Objectives by chapter (2017) 1. The Basic Principle of Technical Analysis: The Trend Define what is meant by a trend in Technical Analysis Explain why determining the trend is important
JOURNAL INTRODUCING THE HPO ROBERT KRAUSZ'S. Volume 2, Issue 2. ear Trader,
 ROBERT KRAUSZ'S JOURNAL INTRODUCING THE HPO TM ear Trader, D First, I would like to introduce myself. My name is Thom Hartle (www.thomhartle.com) and I have put together this latest issue of the FT Journal.
STRATEGIES WITH OPTIONS
 MÄLARDALEN UNIVERSITY PROJECT DEPARTMENT OF MATHEMATICS AND PHYSICS ANALYTICAL FINANCE I, MT1410 TEACHER: JAN RÖMAN 2003-10-21 STRATEGIES WITH OPTIONS GROUP 3: MAGNUS SÖDERHOLTZ MAZYAR ROSTAMI SABAHUDIN
How I 2X My Portfolio in 2 Week with Almost ZERO Risk? A Simple Step-by-Step Guide to Doubling Your Money in the Shortest Time Frame SAFELY!
 How I 2X My Portfolio in 2 Week with Almost ZERO Risk? A Simple Step-by-Step Guide to Doubling Your Money in the Shortest Time Frame SAFELY! WILLIAM TAN www.forexstrategieswork.com Hey Profit Taker, And
Copyright by Profits Run, Inc. Published by: Profits Run, Inc Beck Rd Unit F1. Wixom, MI
 DISCLAIMER: Stock, forex, futures, and options trading is not appropriate for everyone. There is a substantial risk of loss associated with trading these markets. Losses can and will occur. No system or
Trading Lessons from the Intraday Frame (study)
") 1 Daily "Idealized Trades" Report Trading Lessons from the Intraday Frame (study) 1 2018 TheoTrade LLC. All rights reserved. 2 Trading Lessons from the Intraday Frame (1-mi) 2 2018 TheoTrade LLC. All rights
1 Daily "Idealized Trades" Report Trading Lessons from the Intraday Frame (study) 1 2018 TheoTrade LLC. All rights reserved. 2 Trading Lessons from the Intraday Frame (1-mi) 2 2018 TheoTrade LLC. All rights
USER GUIDE. How To Get The Most Out Of Your Daily Cryptocurrency Trading Signals
 USER GUIDE How To Get The Most Out Of Your Daily Cryptocurrency Trading Signals Getting Started Thank you for subscribing to Signal Profits daily crypto trading signals. If you haven t already, make sure
END OF DAY DATA CORPORATION. Scanning the Market. using Stock Filter. Randal Harisch 2/27/2011
 END OF DAY DATA CORPORATION Scanning the Market using Stock Filter Randal Harisch 2/27/2011 EOD's Stock Filter tool quickly searches your database, identifying stocks meeting your criteria. The results
SWITCHBACK (FOREX) V1.4
 V1.4") SWITCHBACK (FOREX) V1.4 User Manual This manual describes all the parameters in the ctrader cbot. Please read the Switchback Strategy Document for an explanation on how it all works. Last Updated 11/11/2017
SWITCHBACK (FOREX) V1.4 User Manual This manual describes all the parameters in the ctrader cbot. Please read the Switchback Strategy Document for an explanation on how it all works. Last Updated 11/11/2017