Square Timer v3.5.x Users Guide
|
|
|
- Nathan Harrington
- 5 years ago
- Views:
Transcription


1 Square Timer v3.5.x Users Guide The Square Timer program, also called SQT, is a very useful program for the purpose of time/price squaring. W. D. Gann determined decades ago that there was a mathematical relationship found between the prices found at tops and bottoms. It has been reported that he took advantage of this knowledge to make many of his fantastic market forecasts (and trades). What is well known today as the Gann Wheel (a.k.a. Square of Nine) allows the chart analyst/trader to quickly square time and price from any point on the chart. Normally, this is done off the price from tops and bottoms clearly identified. Time and price squaring is exactly what it sounds like. For example, if the starting point is the price low of a bottom, a proper square from this point on your chart would be 1 unit of time for 1 unit of price. So if you forward into the future 5 units of time, you would also go out 5 units of price to get the correct time and price squaring of that bottom low. In the Grains, such as Corn, Soybeans and Wheat for instance, it can be said that one unit of time is one day and that one unit of price is one cent. How we are able to determine the correct price unit/time unit ratio is based on 90-degree squaring. Why 90-degrees? Because a true square is made up of 90-degree angles of equal size. Assuming our perfect square originates from the bottom left corner, price would be measured vertically (Y-Axis) and time would be measured horizontally (X-Axis). This is in complete agreement with how price charts are made. Suppose then that we move up the Y-Axis (price) to point (A) as seen on the square above. This would then correspond with a point along the X-Axis (time) of the same length from our starting point (left bottom corner) to maintain a perfect square. It should be noted that most price charts are not squared unless you purposely created them that way. So you cannot simply draw a square on your price chart in order to
2 determine the time-to-price relationships. You must first determine what the time-to-price relationship is (1 day to 1 cent or some fraction/multiple thereof). For many this can be a bit complicated and time consuming. Note that most use computer charts these days on computer screens that are not square themselves. Such screens display in dimensions such as 800x600 or 1024x768. As you can see, these are not square dimensions. So when you think you are seeing a square on the computer screen, you are actually seeing a rectangle as far as its dimensions are concerned. That square on the computer screen will have more pixels horizontally than it does vertically. A perfect square on your screen will look like a rectangle due to the non-squared nature of computer displays. Therefore, when discussing time and price squaring, we are dealing more with mathematical relationships of price rather than some visual geometric shape for viewing. Back to the Square Diagram Note from the square diagram on the previous page that if you keep this 1:1 ratio of time to price (perfect square) as you move along one axis or the other, that you will eventually end up at the exact opposite corner of the square itself. And of course each division of the square you see in this example (i.e. A, B) is the end of its own square at each point of division. To go from the left-bottom corner to the right-top corner is an exact 45-degree angle. If this angle were any other degree from corner to corner, you would no longer have a square but a rectangle. This 45-degree line will always mark the exact time/price relationship along both axis lines. It will maintain a 1:1 relationship of time and price as you either move up or down this 45-degree line. Suppose that the bottom left corner of this square is a bottom with the low price of 249 in Corn. If we performed 90-degree squaring on this price we would arrive at about 265. This would come out to 16 days and 16 cents (or points). You can verify this with your Gann Wheel, as you will see in the next section.

3 Gann Wheel of Square of Nine If you were using the Square of Nine (aka Gann Wheel) such as the one partially shown above, you would start by locating the starting price on the wheel. Here you see 249 located. In this example, it is stated that we are starting from a bottom in Corn with a price of 249. So what we want to do is to find the price in Corn that is 90-degrees bullish from that low. Simply move clock-wise around the wheel by 90-degrees. As you know, a wheel or complete circle is 360-degrees. So if you want to find 90-degrees on the Gann Wheel, simply go around the wheel one-quarter of the way as shown above. The result of a 90-degree bullish move in Corn from 249 comes out to be 265. Note, however, that halfway to 90-degrees is 45-degrees. You can see the wheel above is highlighted every 45-degrees. So if you wanted to know what price a 45-degree bullish move would be, you can quickly see this to be 257. The Gann Wheel is excellent for quickly figuring out support and resistance levels based on 45, 90, 135, 180, 225, 270, 315 and 360-degrees from any price top or bottom. But there are other support and resistance levels that are not easy to figure out using the Gann Wheel.


4 Whenever you are solving for support or resistance using the Gann Wheel, you are solving for a static price level. A static price level is one that does not change over time. For example, we have already determined that a 90-degree bullish move from 249 comes out to 265. No matter when in time we calculate this, 90-degrees up from 249 will always be 265. It does not change. However, there is support and resistance levels that you will want to know about that are not static at all but are in fact dynamic. Dynamic support and resistance levels change with time. The reason for this is that these levels are not horizontal but instead are sloping levels. Below is an example of a price chart where a series of 90-degree squares have been overlaid. The static resistance levels are the horizontal lines that represent the top of each of these squares as marked by 90 and 180. As you move across the chart, you see that those levels are static, they do not change value. However, notice that within each square we have placed two sloping lines, each from corner to corner like a big X in a box. It has long been found that price will often react to these sloping lines as you can see is the case with Soybean prices on the chart above. Note that as you move from left to right (time), these price levels will change. This is why they are considered dynamic levels. Where static price levels remain constant over time and easy to watch for when prices near them at any time, you must know the number of price bars in time from your starting point to the new high in order to determine resistance when dealing with dynamic levels. In the example above, we can count that from the bottom low in Soybeans the top high found resistance at the dynamic level 6 price bars later. This can a daily chart, a weekly chart, a monthly chart, it does not matter.
5 Clearly solving for these dynamic levels is not something you can easily do with a Gann Wheel. However, it is very easy to do with the Square Timer! The example above is of a daily chart of Soybeans. On March 15, 2010 Soybeans made a bottom low at days have passed since then and you want to know what the resistance levels are for today based on the 90-degree square. Today is March 23, 2010 and the high is Start by entering the starting price (in this example it would be the bottom low of 3/15/2010 in Soybeans) into the box marked PRICE (1). The next thing you need to tell SQT is the distance in TIME from the starting price that you wish to calculate resistance prices for. There are two ways you can do this. One, and only if this is a DAILY price chart, you can enter the Start Date (2) and the End Date (3) and let SQT fill in the Days/Bars box (4) for you. So for daily price charts you do not need to count the bars. However, for all other time frames you cannot use Start Date and End Date but instead must count the bars. It is very important to remember this.
6 The next thing you must tell SQT is whether you are solving for RESISTANCE or SUPPORT. If the price you entered in the PRICE box is a TOP/HIGH, then you are solving for support as prices are moving down from that top. If the price you entered is a BOTTOM/LOW price, then you are solving for resistance as prices are moving up from that bottom. The price we entered for our example here is a bottom/low price so we are solving for resistance. When solving for resistance (prices rising), we want to tell SQT that the DIRECTION is bullish (6). Now that we have entered the Starting Price and how far we are in time from that starting price by either entering a Start/End date or the number of bars, and we have indicated the direction of the move, we must now decide on what DEGREES to calculate for. As you saw earlier with the Gann Wheel example, you can solve for any increment of degrees you want, such as 45, 90, 180, etc. The most common is 45 and 90 degrees for short-term moves (daily), 90 and 180 for weekly. However, you are not bound to these commonly used square values and can use whichever you find to work well. In this example, we are using 90-degree squares and so indicate this in the DEGREE box (6). This is the minimum information you need to enter into SQT to start calculating your resistance levels. Simply click on the Calculate button to make the calculation. The results will show up in the box marked Support/Resistance Results. From top to bottom in this list will be each resistance level that is above your Starting Price. If the price level listed is not followed by ***, then it is a dynamic value. If the price is marked with ***, then it is a static level that never changes over time. Each *** in this example represents the top of each 90-degree square as they are stacked one upon the other from bottom to top. While the *** values will not change as they are static and not dependant on the number of bars in time, the values that are dynamic (are not marked with *** ) will change if you change the Days/Bars value or the Start/End Dates. For day 6 from our starting low, we can see that there is dynamic resistance at 977 (7). With our high of day 6 being , this high price bar has reached this resistance level. Do not expect the price to be exact. With each level shown here to be 6 cents or more apart, the high here is only two ticks (1/2 cent) from the calculated resistance level. So this is clearly on the money.
7 As we have just calculated for resistance levels based on 90-degree price squaring, we can also get some time information as well using SQT. If you want to know how many points in price is the height of the 90-degree square for this particular example in Soybeans, you can quickly see this in the boxes under P for Price (8). The width of each 90-degree square in this calculation can be found under T for Time (9). So for this example, each 90-degree square represents a bullish price move of points and 31 bars (days for our example since we are doing this for the Daily time frame). You always find the complete dimensions of any square in degrees you calculate for listed beside the 90-Degrees (P) and the (T). The 45-Degrees (P) represent the amount in price for half the square price-wise. The time (T) is the same for both. If this calculation is done for DAILY prices, which is the case for our example here, then we can also use the information indicated in the box found under the Start/End date boxes (10). Here you can see the date where time is halfway and at the end of the square calculated. Reversals often occur halfway and at the end of squares, so these dates are worth keeping an eye on.
8 Now let s take a look at the other items available within SQT. Also in the Solution are you will see a list of boxes under PRICE marked 45, 90, 135, 180, 225 and 270-degrees. To explain what these values are I will need to give you a bit more insight about the calculation of degrees. Mathematically, if you perform time/price squaring calculations for a 45-degree square, you take a value and get the square-root for which you would add.25 before re-squaring. You add.5 for 90-degrees, 1 for 180-degrees, etc. As you can see from our SQT demonstration here listed for 90-degrees (11), it is the same value you see listed in the Support/Resistance Results for the first 90-degree square static level ( *** ). But as you move down this Results list to the next *** which represents the top of the next 90-degree square up in price, it is slightly different than the 180-degree value listed at (11). This divergence gets larger as you continue to each higher 90-degree square level up.


9 The reason for this is that calculating for 90-degrees (or any other degree) and them simply adding the height of each square does not come out exactly as if you simply had calculated a square equal to the total of all the smaller degree squares. For instance, calculating for 90-degrees for our example produces a square with the height of points. Logically you may think then that a 180-degree square would be the same as two 90-degree squares stacked ( = points). However, calculating for a 180-degree square for our example actually produces a square with a height of points. While very close, it is not exact. Therefore, the further away from the Starting Price you go the larger the discrepancy between the two methods. If you are calculating for 270-degrees, calculate for 270-degrees and not for 90 times 3 squares. They are not the same. So the values you see listed at (11) are the actual static price levels for calculating 45, 90, 135, 180, 225 and 270-degrees directly. You will want to keep your eye on these levels when calculating from major bottoms or tops.
10 And finally, we come to the bottom of the SQT in the box labeled Price Location on Gann Wheel. Recall the Gann Wheel example earlier in this guide. The highlighted areas that represented the 90, 180, 270 and 360 (0) locations on the wheel is called the Cardinal Cross. It is just a big + on the wheel. Within SQT, these values are in the boxes marked C/C. The highlighted values that are found halfway between each 90-degree Cardinal Cross value is called the diagonal cross. On the SQT, this value is found in the box marked M/P for mid-point, referring to being mid-way from each C/C level to the next. Because these levels are very important to watch for important support and resistance, they are provided here at the bottom of the SQT. Using our Soybeans example, we can see that coming from a price low of , the next M/P level is 931 and then the next C/C level is 946. Values are also provided that are halfway between these as well, such as and Not as important but worth keeping an eye on. If you want to know what the next C/C or M/P price level is from any value at all, just enter that value in the Starting Price box and click on Calculate. It is that easy. Let s try that now.

11 Say that price is currently trading at 178 and moving lower. This is a bear trend and you want to know what the next C/C and M/P support levels are. On the Gann Wheel, solving for lower prices requires moving around the wheel counterclockwise. We would start at 178 on the Wheel and note the next C/C value immediately as 176. As you continue to move counter-clockwise around the wheel, you note you have to skip down a cycle to get the correct value. Clearly moving down from 176 would not end up at 225, but instead, 169 being the next M/P value. Continue to the cardinal cross and you find the C/C value to be 163. Now watch how easy this is with SQT.
12 We enter our Starting price (13) of 178. Next we enter the Direction as Bear for downward values. Be sure that there is a value in Degrees, although it will not be part of the calculation. It does not matter what degree you enter. Just do not leave it empty. Next, click on the Calculate button and you will get the C/C and M/P values. As you can see, SQT correctly calculated the Cardinal Cross and other main SQ9 values around 178 (example on next page.)


13 Compare the above calculations with what you would find on the Gann Wheel (Square of Nine or SQ9) show below.
14 Advantages of the Square Timer Program over Gann Wheel By now the advantages should be quite obvious. But we will go over them anyway. The Gann Wheel requires you to manually calculate by way of spot and count to get your needed resistance values. For example, if we are looking at a top at the price of 221 in Corn and prices are declining, we would then have to locate 221 on the Wheel and then count backwards (usually counter-clockwise although some wheels may go the other way) to find the 45 and 90-degree price levels. Noting that 221 is 3 from the Cardinal number of 218, we would go back to the Corner price of 211 and add 3 (214) for our 45- degree value, and then 3 from the prior Cardinal of 204 (207) for our 90-degree value. Now you will want to get the internal resistance values within those squares as well. Have fun! Or you can simply type 221 in the SQT program, set it for Bear (means prices are moving down and you want to calculate for support levels), and set the degree to 45, 90 or whatever you are calculating for. The SQT program will display all your price levels for the settings you have provided automatically and quickly. You can even print them out for your trading reference. You can tell the SQT program how many days out into the future you want to calculate for so that you can have this information in advance or simply calculate for each day to note what resistance/support is for the day. The SQT program also provides you with the neighboring Cardinal and Corner values as found on the SQ9 or Gann Wheel for the value you have entered, as already demonstrated. Let s look at some more examples of using the SQT program on price bottoms and tops.

15 On the right side of the example above you can see a price chart. Please note that the SQT program does not display charts. It is included here to demonstrate graphically. Notice on the daily chart of Wheat provided that on 5/13/05 I have a price value of And since this is a BOTTOM price, my interest is in upward resistance prices as price rises. Therefore, I set the DIRECTION of the SQT program to BULL. Notice that I am calculating for 45-degree squares. Recall that I prefer to start with 45- degrees when working with the daily time frame. In the PRICE box I entered , as that is the bottom price from where I am calculating. The START DATE box I enter the date of the bottom low associated with my PRICE. Now I can enter any future END DATE that I choose to calculate levels for. So for my day-to-day use, I may enter the date of the current day (or tomorrow s date if preparing the night before) and then watch the market to see if price stops at one of the levels and reverses. Do not expect EXACT matches of the daily price tops and bottoms to these calculated levels. A small offset is to be expected at times although I have often seen exact hits. If you look at the daily price chart provided, I have graphically applied 45-degree squares from the 5/13 bottom upward. You can even see the internal resistance angles of each square, which is really nice. The charting program used for this is called Previsions Charting. It includes this SQT program in a graphical way, such as you see shown above next to SQT. This is another software product from ProfitMax Trading Inc.
16 At some point price finds resistance and forms a top. We can see this happened on 5/31/05. With 5/31/05 in the END DATE box, you can see that our top price of 351 was at the 351-price level calculated by SQT. In the Support/Resistance Levels box of SQT you will notice that some prices are followed by ***. This value will never change for the current degree setting no matter how many days out in the future you calculate for using the current price. This is because those *** prices represent the horizontal tops and bottoms of the squares themselves. The price levels listed between the *** levels are your INTERNAL levels within the squares that change each day as they are ascending/descending angles. These INTERNAL levels are where this program really shines over trying to calculate them using the SQ9 or Wheel. The SQT program is also providing us with additional information you may find useful. You immediately can see the 45, 90, 135, 180, 225 and 270-degree price levels in the SOLUTION display area. In addition, you are provided the actual height in PRICE of a single 45 or 90-degree square. This is found under the (P). Under (T) for TIME is the time width of the squares for the values you entered. For Wheat from its 5/13 low the time width of the squares are 18 days. Recall that earlier I stated that a change in trend was highly probable at the end of each square. Therefore, about 18 days from 5/13 (approximately) you would be on the lookout for a possible trend change or at least a minor correction. The second most probable location in time is ½ the width of the square, about 9 days from our 5/13 low. The third probable would be ¼ of the width of the square for minor swings. Dividing further would not be much use. The SQT program immediately provides you with the mid-square and end-square dates based on the STARTING DATE you entered (Daily time-frame only). You can note this just below where you entered your starting values. In our example, it was 5/26 and then 6/8. In reality, the top in wheat occurred two trading days later of 5/26 and although a bottom formed on 6/9, a single price bar did go lower for one day on 6/14 before shooting to the top. While this program can be useful for TIME in a small degree, it is most useful for PRICE in a big degree. If you wish to time your market tops and bottoms with a very high degree of accuracy, it is suggested you look into using FDates (available to all members of the FDate Precision Trading membership Using FDates along with SQT is extremely powerful!
17 User Defined We have yet to address the User Defined boxes you see on the SQT interface. Here you can enter any degree value you like to get their results separate of the degree value you have set for the whole program at the very top (in the Degree box). For most of us the User Defined boxes are rarely if ever used. But they are there if you find a need. So while you are calculating for each 90-degree level in the bullish direction, for example, you can also note levels you define by using these UD boxes. The example above shows that we are using a Starting Price of in a market where prices are moving up. So this starting price represents a bottom low that you are calculating from. We have the program set to 10 Days/Bars as today is the 10 th bar being formed since that bottom low price was made. We have the program set to BULL and the DEGREE to 90 (17). We also decide that we want to see what the price level is for 22.5 degrees and 56.3 degrees from our bottom price, so we enter those in the User Defined boxes (19).
18 When we click on Calculate, we get our usual square results in the RESULTS list (18) and also the result for our User Defined degrees (20). If you are curious why I chose 22.5 and 56.3, it is because 22.5 are half of 45-degrees and 56.3 is 1/10 th of our starting price. You will find it interesting that using the Starting Price as a degree value often returns really useful support/resistance values where price may stop for the day (or even reverse to form a top or bottom). If you find the Starting Price as a degree yields levels too far apart, such as using , move the decimal point as I have demonstrated here to the left and recalculated. Experiment with this and soon you ll see what I ve long discovered that this technique is really valuable. Let me demonstrate using my charting program called Previsions Charting. As you can see on the example chart above, we started from a bottom low of in the SP500 market and calculated using the degree value of Notice that this degree value is the same as our Starting price with the decimal point moved to the left two positions. I first started with the whole value but the levels were too far apart. So I moved the decimal one to the left and still too large a spread. However, two worked out wonderfully! Here is how you solve this with SQT shown on the next page.
19 Above you can see that we enter the full price of of the bottom low and that we wish to calculate resistance for the second day following that bottom (enter 2 in Days/Bars). Next, we enter degrees into the Degree box and Calculate. In the Results list, we can see all the resistance levels above our Starting price. Note the value highlighted in the example as The actual high hit ! This example, however, is considered more of a short-term calculation. When you have levels that are relatively close to each other as you see here, you usually are solving for minor levels. For major levels you need to use degree values that spread the levels a bit more. In our example above, the levels are about 8 handles between some of the values and get closer as the slope (dynamic) levels moves near the middle or end of each square.

20 Take a look at this long-term example above. This is a weekly chart of SUGAR. 90- degree squaring is being calculated for this market starting from the low made on week ending October 24, As you watch this trend move up, you can see that a top was made just two weeks from the bottom that caused prices to drop all the way back down again where support was found. Later you see support just before a major bullish run (first arrow). You see this trend top out at resistance (second arrow). You see this sideways bearish move bottom out (third arrow), and then finally top out at resistance (forth arrow) which was made on February 5 th, Notice the bearish trend from that top where the first corrective bottom and top find resistance, and then the current bottom you see marked by the last arrow on this chart that represents currently week ending March 26, 2010.

21 Using SQT, you simply enter the very bottom low of week October 24, 2008 and then the number of bars from that low. So each week, do a new calculation or do them all in advance and keep a list. Watch each week to note if price stops at your levels. Simple! TIP: Be aware that the larger the time-frame you are calculating for the more leeway you need to give your price at levels. While price can be a couple ticks or so off from the level and still be considered an exact hit, doing this on a weekly or monthly chart is still valid by a few extra ticks. Keep in mind that on larger time frames a single price bar represents anywhere from 5 days of trading (weekly) to 20 or more (monthly/yearly). Never demand exact hits or you will get very few to work with. SQT Menu Options Currently there is only one menu for SQT and that is the File menu item. Under this menu item you will find sub-menu options such as Save Data to File. If you wish to save your current data values, you can do so from here. Control-S will also bring up the Save box to save these values onto your hard drive. To reload your saved data you will use the Load Data from File selection. When the file box opens, select the file you previously saved to reload its values. To quickly clear out the values on the SQT display, select Clear SQT Contents. Once you have calculated your price levels you can then Print them out using the Print sub-menu option. For those of us that like to look at our price chart at the same time as having the SQT program remain on top (rather than disappearing behind the chart), simply check the Stay On Top sub-menu or press Control-T. Of course, Exit means close the program.
22 Final Points It has been discovered that the best results come from using starting price values that are 3-digits left of the decimal. The SQT program automatically adjusts your Starting price to be 3-digits left of the decimal before performing calculations. If you wish to override this, you can do so by clicking on the checkbox marked Price Format Override. There you can set it to 0 to 5. Setting to 3 would change nothing as it already does that. Cocoa and some other markets may have prices such as 1022 that is 4 digits left of the decimal that you may wish to have them calculated without modification. So you can do so with the override. Thank you for purchasing my Square Timer program. I am sure that you will find it extremely useful with a little practice. The Square Timer program makes quick work of what the Gann Wheel was designed to do. As Gann had discovered decades ago, price does appear to react to these levels indicating that the major component of market behavior is not of randomness, making it highly predictable as Gann has historically demonstrated. But there is a small component of randomness that we all must deal with. With experience you can learn to minimize the negative effects of this small component and take full advantage of the predictive nature of market action. The Square Timer is one such tool to help you towards that goal. May you have success in your analysis! Rick J. Ratchford ProfitMax Trading Inc. Disclaimer: It is a legal requirement that you be informed that past results does not guarantee future results. The Square Timer program is a tool to assist you in your market timing. There is substantial risk in trading and that no tool can guarantee you success or protection from failure. Your use of the Square Timer or any other tool from ProfitMax Trading Inc. is at your own risk.

23 New in Version 3.5! Version 3.5 has a new tool. Under the Tools menu, locate and click on Time Count Calculator. You will see a new window that looks like this: This new tools allows you to enter up to 10 dates in the left most column shown in gray above. You will want to look on your price chart and locate the significant market tops and bottoms to use for this tool. Type the dates for those significant previous tops and bottoms and click on the Calculate button.

24 This calculator will then generate dates based on time counts. These time counts are based on divisions of 360 degrees (a full circle). There is also a Count Interval setting at the bottom of this calculator. This allows you to generate dates based on treating the 365 days of the year as 360 degrees. While prices should be watched closely during these periods marked by these dates, pay extra attention to those dates that show up in more than one row. This new calculator gives the SQT program an additional TIME element to go along with the PRICE element it is already strong at doing. THIS ENDS THE UPDATED INFORMATION FOR v3.5. THE REST OF THIS DOCUMENT IS THE ORIGINAL MATERIAL FOR THE EARLIER VERSION.

25 Additional Examples The following are addition examples that you can study to see how effective the SQT program is in producing valid support and resistance price levels. The above example is the SP500. There was a bottom on 2/23/05 and eventually topped on 3/7/05, 8 days later. This top formed.80 points of the internal resistance level in the results box. Notice that 22.5 degrees produced the best fit at this time for a price in the low 100 s (due to adjusting the decimal point over).


26 The above (previous page) example is of the Australian Dollar. Here we found the 90- degree squares to be effective on current price action. The SQT support level for 7/7/05 was and the actual was 77.36, just.03 ticks. Note the trend change was mid-square and that resistance temporarily affected price at the other two ¼ square locations. The above example is the same market as the previous example. Here I am showing how we calculated the resistance of the top that was used in the previous example of Australian Dollar.

27 This time the price of 6/1/05 was that which responded to the 45-degree squaring. Notice that it found the top price that is MID-SQUARE exactly. The SQT resistance was listed as and the actual top was 77.67, just one tick. The above is a recent example from the Cotton market. It is early to tell if this is a fullfledge trend change or just a correction for now. Notice that the turn found support just one-bar of MID-SQUARE using 45-degree squaring off the top. I can fill these pages with hundreds of examples. But I think you get the point.
 The 360 Degree List If you are familiar with the Gann Wheel (aka Square of Nine), you know that the values found")

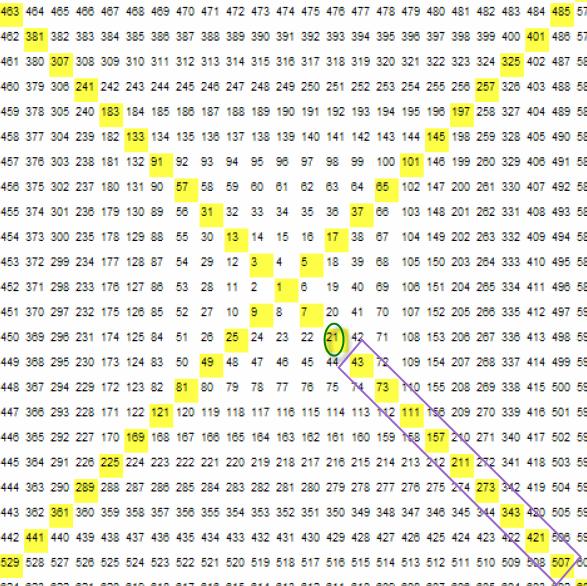
28 NEW FOR VERSION (added 5/7/2010) The 360 Degree List If you are familiar with the Gann Wheel (aka Square of Nine), you know that the values found along the same axis are good to know for important support and resistance levels to watch. Take for example the Square of Nine shown on the next page. Suppose that you wanted to know each 360-degree level up from the value 21. Using the Square of Nine, you would simply read each value off each square along the same axis. Below is how you would calculate these values quickly and easily.
29

 and those are the values you read off as 360-degree squares starting from 15.")
30 Here I am calculating all the 360-degree levels from the starting value of 15. Keep in mind that the angle of the axis where these values are found on the Wheel is based on the angle starting from the very center of the Wheel outward. So for the value 15, the angle is straight up from the center (1) and those are the values you read off as 360-degree squares starting from 15. The Intervals is simply the number of 360-degree results you wish to have returned. In the example above, 12 results are provided due to the Interval setting being 12. You can set this from 6 to 100.
In this chapter: Budgets and Planning Tools. Configure a budget. Report on budget versus actual figures. Export budgets.
 Budgets and Planning Tools In this chapter: Configure a budget Report on budget versus actual figures Export budgets Project cash flow Chapter 23 479 Tuesday, September 18, 2007 4:38:14 PM 480 P A R T
Monthly Treasurers Tasks
 As a club treasurer, you ll have certain tasks you ll be performing each month to keep your clubs financial records. In tonights presentation, we ll cover the basics of how you should perform these. Monthly
Monthly Treasurers Tasks
 As a club treasurer, you ll have certain tasks you ll be performing each month to keep your clubs financial records. In tonights presentation, we ll cover the basics of how you should perform these. Monthly
The Master Trader Counter-Trend Trade Set-Ups
 The Master Trader Counter-Trend Trade Set-Ups Trading Concepts, Inc. The Master Trader Counter-Trend Trade Set-Ups By Todd Mitchell Copyright 2014 by Trading Concepts, Inc. All Rights Reserved This training
Page 1 of 96 Order your Copy Now Understanding Chart Patterns
 Page 1 of 96 Page 2 of 96 Preface... 5 Who should Read this book... 6 Acknowledgement... 7 Chapter 1. Introduction... 8 Chapter 2. Understanding Charts Convention used in the book. 11 Chapter 3. Moving
The Gann Analysis Rule Book
 2006 Gann Managament Ltd. All Rights Reserved. Gann Management Limited is authorised and Regulated by the Financial Services Authority The Gann Analysis Rule Book A Man Who Never Changes His Mind Will
This presentation is part of a three part series.
 As a club treasurer, you ll have certain tasks you ll be performing each month to keep your clubs financial records. In tonights presentation, we ll cover the basics of how you should perform these. Monthly
Harmonic Volatility Line Indicator
 Harmonic Volatility Line Indicator Subtitle: Alternative Approach to Gann s Angle Author: Young Ho Seo Finance Engineer and Quantitative Trader Book Version: 1.7 (13 May 2017) Total Pages counted in MS-Word:
This is the complete: Fibonacci Golden Zone Strategy Guide
 This is the complete: Fibonacci Golden Zone Strategy Guide In this strategy report, we are going to share with you a simple Fibonacci Trading Strategy that uses the golden ratio which is a special mathematical
Figure 3.6 Swing High
 Swing Highs and Lows A swing high is simply any turning point where rising price changes to falling price. I define a swing high (SH) as a price bar high, preceded by two lower highs (LH) and followed
Data Sheet for Trendline Trader Pro
 Data Sheet for Trendline Trader Pro Introduction Trendline Trader Pro is a hybrid software application which used a JavaFX based interface to communicate with an underlying MetaTrader MT4 Expert Advisor.
Magic Line Trading System. A Simple, Easy-To-Learn Price-Action Trading Strategy
 Magic Line Trading System A Simple, Easy-To-Learn Price-Action Trading Strategy 1. Disclaimer... 3 2. Introduction... 4 3. Trading as a career... 6 4. Getting started... 8 5. Setting up your charts...
Formulating Models of Simple Systems using VENSIM PLE
 Formulating Models of Simple Systems using VENSIM PLE Professor Nelson Repenning System Dynamics Group MIT Sloan School of Management Cambridge, MA O2142 Edited by Laura Black, Lucia Breierova, and Leslie
Elementary Statistics
 Chapter 7 Estimation Goal: To become familiar with how to use Excel 2010 for Estimation of Means. There is one Stat Tool in Excel that is used with estimation of means, T.INV.2T. Open Excel and click on
This presentation is part of a three part series.
 As a club treasurer, you ll have certain tasks you ll be performing each month to keep your clubs financial records. In tonight s presentation, we ll cover the basics of how you should perform these. Monthly
How I Trade Forex Using the Slope Direction Line
 How I Trade Forex Using the Slope Direction Line by Jeff Glenellis Copyright 2009, Simple4xSystem.net By now, you should already have both the Slope Direction Line (S.D.L.) and the Fibonacci Pivot (FiboPiv)
Market Mastery Protégé Program Method 1 Part 1
 Method 1 Part 1 Slide 2: Welcome back to the Market Mastery Protégé Program. This is Method 1. Slide 3: Method 1: understand how to trade Method 1 including identifying set up conditions, when to enter
Free signal generator for traders
 Free signal generator for traders Trader s Bulletin Pivot Point Trading Strategy 1. Just download the FREE tool 2. Key in a few numbers 3. And follow the simple techniques by Mark Rose To make money from
Remarkable Results with Renkos
 Remarkable Results with Renkos Years ago, when I first began trading futures, I remember my struggle to find a system that I could depend on to consistently generate the income level that would support
SUPPLEMENTARY LESSON 1 DISCOVER HOW THE WORLD REALLY WORKS ASX Schools Sharemarket Game THE ASX CHARTS
 SUPPLEMENTARY LESSON 1 THE ASX CHARTS DISCOVER HOW THE WORLD REALLY WORKS 2015 ASX Schools Sharemarket Game The ASX charts When you spend time discovering a company s story and looking at company numbers
Now You Can Have These Trading Gems- Free!
 Presents Killer Patterns Now You Can Have These Trading Gems- Free! The Trading Info Revealed Here is not the Same as the Proven WizardTrader.com Methods But Works Well With Them 1 Copyright Information
SP500 Market Forecast for July 2011
 SP500 Market Forecast for July 2011 This document is designed to provide the trader and investor of the Standard and Poor s 500 with an overview of the seasonal tendency as well as the current cyclic pattern
The Advanced Budget Project Part D The Budget Report
 The Advanced Budget Project Part D The Budget Report A budget is probably the most important spreadsheet you can create. A good budget will keep you focused on your ultimate financial goal and help you
STATISTICAL INDICATOR
 STATISTICAL INDICATOR FOREX LIBRA CODE This short manual aims to explain how to use and apply the Statistical indicator which is part of the Forex Libra Code software. The Statistical indicator is available
Insurance Tracking with Advisors Assistant
 Insurance Tracking with Advisors Assistant Client Marketing Systems, Inc. 880 Price Street Pismo Beach, CA 93449 800 643-4488 805 773-7985 fax www.advisorsassistant.com support@climark.com 2015 Client
Technology Assignment Calculate the Total Annual Cost
 In an earlier technology assignment, you identified several details of two different health plans. In this technology assignment, you ll create a worksheet which calculates the total annual cost of medical
Follow Price Action Trends By Laurentiu Damir Copyright 2012 Laurentiu Damir
 Follow Price Action Trends By Laurentiu Damir Copyright 2012 Laurentiu Damir All rights reserved. No part of this book may be reproduced or transmitted in any form or by any means, electronic or mechanical,
Resource Planner For Microsoft Dynamics NAV
 Resource Planner For Microsoft Dynamics NAV Introduction to the Basics to be used for Self Study or Instructor Lead Training Distributed by: Cost Control Software, Inc. 12409 Old Meridian Street Carmel,
FIND THE SLAM DUNKS: COMBINE VSA WITH TECHNICAL ANALYSIS
 FIND THE SLAM DUNKS: COMBINE VSA WITH TECHNICAL ANALYSIS November 2006 By Todd Krueger In any competitive sports game there must be a specific set of boundaries for the game to make any sense. This actually
Spreadsheet Directions
 The Best Summer Job Offer Ever! Spreadsheet Directions Before beginning, answer questions 1 through 4. Now let s see if you made a wise choice of payment plan. Complete all the steps outlined below in
You should already have a worksheet with the Basic Plus Plan details in it as well as another plan you have chosen from ehealthinsurance.com.
 In earlier technology assignments, you identified several details of a health plan and created a table of total cost. In this technology assignment, you ll create a worksheet which calculates the total
ASX Schools Sharemarket Game
 The ASX charts When you spend time discovering a company s story and looking at company numbers you are using what is called fundamental analysis. Many people who invest in the sharemarket use fundamental
MT4 Awesomizer V3. Basics you should know:
 MT4 Awesomizer V3 Basics you should know: The big idea. Awesomizer was built for scalping on MT4. Features like sending the SL and TP with the trade, trailing stops, sensitive SL lines on the chart that
Student Guide: RWC Simulation Lab. Free Market Educational Services: RWC Curriculum
 Free Market Educational Services: RWC Curriculum Student Guide: RWC Simulation Lab Table of Contents Getting Started... 4 Preferred Browsers... 4 Register for an Account:... 4 Course Key:... 4 The Student
Chapter 6: Supply and Demand with Income in the Form of Endowments
 Chapter 6: Supply and Demand with Income in the Form of Endowments 6.1: Introduction This chapter and the next contain almost identical analyses concerning the supply and demand implied by different kinds
2.0. Learning to Profit from Futures Trading with an Unfair Advantage! Income Generating Strategies Essential Trading Tips & Market Insights
 2.0 Learning to Profit from Futures Trading with an Unfair Advantage! Income Generating Strategies Essential Trading Tips & Market Insights Income Generating Strategies Essential Trading Tips & Market
HOW TO MAKE YOUR FIRST FUTURES TRADE
 HOW TO MAKE YOUR FIRST FUTURES TRADE By Craig 1.800.800.3840 2 How to Make Your First Futures Trade You have an opinion on the futures market, you want to get involved, but you don t know how or where
Expectation Exercises.
 Expectation Exercises. Pages Problems 0 2,4,5,7 (you don t need to use trees, if you don t want to but they might help!), 9,-5 373 5 (you ll need to head to this page: http://phet.colorado.edu/sims/plinkoprobability/plinko-probability_en.html)
Processing Claims & Calculating Blended Rates
 Processing Claims & Calculating Blended Rates Overview Minute Menu CX is built to process claims that are ready to be submitted to your state agency. When a claim is processed, the system must do two primary
INTRODUCTION CHAPTER 1
 INTRODUCTION CHAPTER 1 Autochartist offers traders automated market-scanning tools that highlight trade opportunities based on support and resistance levels. Autochartist products include: Chart pattern
RISK DISCLOSURE STATEMENT / DISCLAIMER AGREEMENT
 RISK DISCLOSURE STATEMENT / DISCLAIMER AGREEMENT Trading any financial market involves risk. This report and all and any of its contents are neither a solicitation nor an offer to Buy/Sell any financial
Autochartist User Manual
 Autochartist User Manual compliance@ifxbrokers.com www.ifxbrokers.com +27 42 293 0353 INTRODUCTION Chapter 1 Autochartist offers traders automated market-scanning tools that highlight trade opportunities
Counter Trend Trades. (Trading Against The Trend) By Russ Horn
 By Russ Horn") Counter Trend Trades (Trading Against The Trend) By Russ Horn 1 RISK DISCLOSURE STATEMENT / DISCLAIMER AGREEMENT Trading any financial market involves risk. This report and all and any of its contents
Counter Trend Trades (Trading Against The Trend) By Russ Horn 1 RISK DISCLOSURE STATEMENT / DISCLAIMER AGREEMENT Trading any financial market involves risk. This report and all and any of its contents
Using the Clients & Portfolios Module in Advisor Workstation
 Using the Clients & Portfolios Module in Advisor Workstation Disclaimer - - - - - - - - - - - - - - - - - - - - - - - - - - - - - - - - - - - - - 1 Overview - - - - - - - - - - - - - - - - - - - - - -
Introduction to the Gann Analysis Techniques
 Introduction to the Gann Analysis Techniques A Member of the Investment Data Services group of companies Bank House Chambers 44 Stockport Road Romiley Stockport SK6 3AG Telephone: 0161 285 4488 Fax: 0161
A Different Take on Money Management
 A Different Take on Money Management www.simple4xsystem.net Anyone who read one of my books or spent time in one of my trade rooms knows I put a lot of emphasis on using sound Money Management principles
Chapter 6: The Art of Strategy Design In Practice
 Chapter 6: The Art of Strategy Design In Practice Let's walk through the process of creating a strategy discussing the steps along the way. I think we should be able to develop a strategy using the up
Risk Disclosure and Liability Disclaimer:
 Risk Disclosure and Liability Disclaimer: The author and the publisher of the information contained herein are not responsible for any actions that you undertake and will not be held accountable for any
GUIDE TO FOREX PROFITS REPORT
 GUIDE TO FOREX PROFITS REPORT CONTENTS Introduction... 3 First things first, get a demo!... 4 The Setup... 5 Indicators Explained... 8 IMACD... 8 Average Directional Movement Index... 8 The Strategy...
Mutual Fund & Stock Basis Keeper
 A Guide To Mutual Fund & Stock Basis Keeper By Denver Tax Software, Inc. Copyright 1995-2006 Denver Tax Software, Inc. Denver Tax Software, Inc. P.O. Box 5308 Denver, CO 80217-5308 Telephone (voice): Toll-Free:
Optimization Prof. A. Goswami Department of Mathematics Indian Institute of Technology, Kharagpur. Lecture - 18 PERT
 Optimization Prof. A. Goswami Department of Mathematics Indian Institute of Technology, Kharagpur Lecture - 18 PERT (Refer Slide Time: 00:56) In the last class we completed the C P M critical path analysis
Preliminary Trading Guide
 Preliminary Trading Guide for SMR Pro 2 BETA This Trading Guide will explain the new features and tools that are now part of the BETA version of SMR Pro 2. The following sections are included because they
1. Introduction 2. Chart Basics 3. Trend Lines 4. Indicators 5. Putting It All Together
 Technical Analysis: A Beginners Guide 1. Introduction 2. Chart Basics 3. Trend Lines 4. Indicators 5. Putting It All Together Disclaimer: Neither these presentations, nor anything on Twitter, Cryptoscores.org,
Forex Range Trading With Price Action Forex Trading System By Laurentiu Damir
 Forex Range Trading With Price Action Forex Trading System By Laurentiu Damir Copyright 2012 by Laurentiu Damir All rights reserved. No part of this book may be reproduced or transmitted in any form or
RISK DISCLOSURE STATEMENT / DISCLAIMER AGREEMENT
 RISK DISCLOSURE STATEMENT / DISCLAIMER AGREEMENT Trading any financial market involves risk. This report and all and any of its contents are neither a solicitation nor an offer to Buy/Sell any financial
Market Observations as of Nov 17, 2017
 Market Observations as of Nov 17, 2017 By Carl Jorgensen - For Objective Traders - For educational purposes only. Not Financial Advice. This week we saw a variety of market moves. The daily charts for
Budget Estimator Tool & Budget Template
 Budget Estimator Tool & Budget Template Integrated Refugee and Immigrant Services Created for you by a Yale School of Management student team IRIS BUDGET TOOLS 1 IRIS Budget Estimator and Budget Template
The Best Gann Fan Trading Strategy
 The Best Gann Fan Trading Strategy The best Gann fan trading strategy is a complex support and resistance trading strategy that uses diagonal support and resistance levels. Unlike the traditional horizontal
This document will provide a step-by-step tutorial of the RIT 2.0 Client interface using the Liability Trading 3 Case.
 RIT User Guide Client Software Feature Guide Rotman School of Management Introduction Welcome to Rotman Interactive Trader 2.0 (RIT 2.0). This document assumes that you have installed the Rotman Interactive
END OF DAY DATA CORPORATION. Scanning the Market. using Stock Filter. Randal Harisch 2/27/2011
 END OF DAY DATA CORPORATION Scanning the Market using Stock Filter Randal Harisch 2/27/2011 EOD's Stock Filter tool quickly searches your database, identifying stocks meeting your criteria. The results
FINITE MATH LECTURE NOTES. c Janice Epstein 1998, 1999, 2000 All rights reserved.
 FINITE MATH LECTURE NOTES c Janice Epstein 1998, 1999, 2000 All rights reserved. August 27, 2001 Chapter 1 Straight Lines and Linear Functions In this chapter we will learn about lines - how to draw them
Scheme Management System User guide
 Scheme Management System User guide 20-09-2016 1. GETTING STARTED 1.1 - accessing the scheme management system 1.2 converting my Excel file to CSV format 2. ADDING EMPLOYEES TO MY PENSION SCHEME 2.1 Options
Real Estate Private Equity Case Study 3 Opportunistic Pre-Sold Apartment Development: Waterfall Returns Schedule, Part 1: Tier 1 IRRs and Cash Flows
 Real Estate Private Equity Case Study 3 Opportunistic Pre-Sold Apartment Development: Waterfall Returns Schedule, Part 1: Tier 1 IRRs and Cash Flows Welcome to the next lesson in this Real Estate Private
MA 1125 Lecture 05 - Measures of Spread. Wednesday, September 6, Objectives: Introduce variance, standard deviation, range.
 MA 115 Lecture 05 - Measures of Spread Wednesday, September 6, 017 Objectives: Introduce variance, standard deviation, range. 1. Measures of Spread In Lecture 04, we looked at several measures of central
Client Software Feature Guide
 RIT User Guide Build 1.01 Client Software Feature Guide Introduction Welcome to the Rotman Interactive Trader 2.0 (RIT 2.0). This document assumes that you have installed the Rotman Interactive Trader
Pro Strategies Help Manual / User Guide: Last Updated March 2017
 Pro Strategies Help Manual / User Guide: Last Updated March 2017 The Pro Strategies are an advanced set of indicators that work independently from the Auto Binary Signals trading strategy. It s programmed
Binary Options Trading Strategies How to Become a Successful Trader?
 Binary Options Trading Strategies or How to Become a Successful Trader? Brought to You by: 1. Successful Binary Options Trading Strategy Successful binary options traders approach the market with three
TRADE SIGNALS POWERED BY AUTOCHARTIST
 SAXO TRADER GO TRADE SIGNALS POWERED BY AUTOCHARTIST Trade Signals is a SaxoTraderGO tool that uses Autochartist technology to identify emerging and completed patterns in most leading financial markets.
Naked Trading - Double Top Chart Pattern Strategy
 Naked Trading - Double Top Chart Pattern Strategy If you really want to learn a profitable way to trade then look no further, the Double Top chart pattern strategy uses simple and sound trading principles
WEB APPENDIX 8A 7.1 ( 8.9)
") WEB APPENDIX 8A CALCULATING BETA COEFFICIENTS The CAPM is an ex ante model, which means that all of the variables represent before-the-fact expected values. In particular, the beta coefficient used in
WEB APPENDIX 8A CALCULATING BETA COEFFICIENTS The CAPM is an ex ante model, which means that all of the variables represent before-the-fact expected values. In particular, the beta coefficient used in
Quick Reference Guide. Employer Health and Safety Planning Tool Kit
 Operating a WorkSafeBC Vehicle Quick Reference Guide Employer Health and Safety Planning Tool Kit Effective date: June 08 Table of Contents Employer Health and Safety Planning Tool Kit...5 Introduction...5
Is This Type of Stock Market For You? - Mike Swanson
 Stock Market Barometer Quote of the month: Investors should recognize that Euroland s problems are global and secular in nature; it will be years before Euroland and developed nations in total can constructively
What s Normal? Chapter 8. Hitting the Curve. In This Chapter
 Chapter 8 What s Normal? In This Chapter Meet the normal distribution Standard deviations and the normal distribution Excel s normal distribution-related functions A main job of statisticians is to estimate
Jacob: The illustrative worksheet shows the values of the simulation parameters in the upper left section (Cells D5:F10). Is this for documentation?
. Is this for documentation?") PROJECT TEMPLATE: DISCRETE CHANGE IN THE INFLATION RATE (The attached PDF file has better formatting.) {This posting explains how to simulate a discrete change in a parameter and how to use dummy variables
PROJECT TEMPLATE: DISCRETE CHANGE IN THE INFLATION RATE (The attached PDF file has better formatting.) {This posting explains how to simulate a discrete change in a parameter and how to use dummy variables
10 Errors to Avoid When Refinancing
 10 Errors to Avoid When Refinancing I just refinanced from a 3.625% to a 3.375% 15 year fixed mortgage with Rate One (No financial relationship, but highly recommended.) If you are paying above 4% and
Top-Down Approach to Stock Selection Using AIQ's Group/Sector Capabilities
 Section III. Top-Down Approach to Stock Selection Using AIQ's Group/Sector Capabilities In This Section TradingExpert provides the tools 54 View Market Log for sector rotation 54 Next: view Group Analysis
INSIDE DAYS. The One Trading Secret That Could Make You Rich
 The One Trading Secret That Could Make You Rich INSIDE DAYS What 'Inside Days' Are, How To Identify Them, The Setup, How They Work, Entrance Criteria, Management and Exit Criteria for MAXIMUM PROFITS IMPORTANT
Discrete Probability Distributions
 Chapter 5 Discrete Probability Distributions Goal: To become familiar with how to use Excel 2007/2010 for binomial distributions. Instructions: Open Excel and click on the Stat button in the Quick Access
TRADE SIGNALS POWERED BY AUTOCHARTIST
 SAXO TRADER GO TRADE SIGNALS POWERED BY AUTOCHARTIST Trade Signals is a SaxoTraderGO tool that uses Autochartist technology to identify emerging and completed patterns in most leading financial markets.
WHY TRADE FOREX? hat is Forex? NEW TO FOREX GUIDE
 WHY TRADE FOREX? hat is Forex? NEW TO FOREX GUIDE Table of Contents.. What is Forex? And Why Trade It? 1. Why Trade Forex? Putting Your Ideas into Action. The Bulls and the Bears.... Reading a Quote and
Chapter 1.4 Trends 0
 Chapter 1.4 Trends 0 TECHNICAL ANALYSIS: TRENDS, SUPPORT AND RESISTANCE Charts, charts, charts. When most people think about trading Forex, they think about watching price movements flash by them on the
Developmental Math An Open Program Unit 12 Factoring First Edition
 Developmental Math An Open Program Unit 12 Factoring First Edition Lesson 1 Introduction to Factoring TOPICS 12.1.1 Greatest Common Factor 1 Find the greatest common factor (GCF) of monomials. 2 Factor
You know when I first got into trading his was the question that plagued me most. What direction is the trend really in????
 The trend the trend oh where art thow trend? You know when I first got into trading his was the question that plagued me most. What direction is the trend really in???? I mean let s face it; we pull up
SIMPLE SCAN FOR STOCKS: FINDING BUY AND SELL SIGNALS
 : The Simple Scan is The Wizard s easiest tool for investing in stocks. If you re new to investing or only have a little experience, the Simple Scan is ideal for you. This tutorial will cover how to find
Simple Sales Tax Setup
 Lesson 3 Sales Tax Date: January 24, 2011 (1:00 EST, 12:00 CDT, 11:00 MDT 10:00 PDT) Time: 1.5 hours Presented by:vickie Ayres The Countess of QuickBooks & Tech Support Specialist for QuickBooks & Quoting
MT4 Supreme Edition Trade Terminal
 MT4 Supreme Edition Trade Terminal In this manual, you will find installation and usage instructions for MT4 Supreme Edition. Installation process and usage is the same in new MT5 Supreme Edition. Simply
Trading Forex Using High Probability Pattern Trade
 Presents Trading Forex Using High Probability Pattern Trade Trading Forex Using High Probability Pattern Trade Published by Alzaiak Trading CC Nominee Old Tree Publishing CC Suite 509, Private Bag X503
Unit 8 - Math Review. Section 8: Real Estate Math Review. Reading Assignments (please note which version of the text you are using)
") Unit 8 - Math Review Unit Outline Using a Simple Calculator Math Refresher Fractions, Decimals, and Percentages Percentage Problems Commission Problems Loan Problems Straight-Line Appreciation/Depreciation
Unit 8 - Math Review Unit Outline Using a Simple Calculator Math Refresher Fractions, Decimals, and Percentages Percentage Problems Commission Problems Loan Problems Straight-Line Appreciation/Depreciation
Q. Upon what trading methodology is Options Wizardry Profit Alert based?
 Q. What exactly is Options Wizardry Profit Alert? A. It is a weekly trade idea service. Each week, we post high probability trade ideas for you to consider. The trade ideas are posted to a private, secure
Gtrade manual version 2.04 updated
 Gtrade manual version 2.04 updated 9.30.2016 Table of Contents Contents Table of Contents2 Getting started, Logging in and setting display language in TurboTick Pro3 Level 25 Order Entry8 Streamlined Order
The Synthetic Futures Position. Goal
 The Synthetic Futures Position Goal To try to profit from a trending market using an option strategy that allows entry at a reduced cost while offering the same potential for unlimited profit (and loss)
Basic Order Strategies
 Basic Order Strategies Introduction... 3 Using the Pre-Defined Order Strategies with your Trading Interfaces... 3 Entry Order Strategies... 3 Basic Entry Order Strategies explained... 3 Exit Order Strategies...
DAILY DAY TRADING PLAN
 DAILY DAY TRADING PLAN Gatherplace will be used to place all of your trades. You will be using the 5 minute chart for the trade setup and the 1 minute chart for your entry, stop and trailing stop.you will
Jacob: What data do we use? Do we compile paid loss triangles for a line of business?
 PROJECT TEMPLATES FOR REGRESSION ANALYSIS APPLIED TO LOSS RESERVING BACKGROUND ON PAID LOSS TRIANGLES (The attached PDF file has better formatting.) {The paid loss triangle helps you! distinguish between
USER GUIDE
 USER GUIDE http://www.winningsignalverifier.com DISCLAIMER Please be aware of the loss, risk, personal or otherwise consequences of the use and application of this book s content. The author and the publisher
WHS FutureStation - Guide LiveStatistics
 WHS FutureStation - Guide LiveStatistics LiveStatistics is a paying module for the WHS FutureStation trading platform. This guide is intended to give the reader a flavour of the phenomenal possibilities
Module 2. Dealing online
 Dealing online Module 2 Dealing online In this module we look at how to place a trade online, how to create your own price lists and other basic features of our dealing platform. TradeSense US, April 2010,