CBOE/CBOT 10 Year Treasury Note Volatility Index (TYVIX SM Index) Compendium of Empirical Findings
|
|
|
- Janis Barnett
- 6 years ago
- Views:
Transcription
1 CBOE/CBOT 10 Year Treasury Note Volatility Index (TYVIX SM Index) Compendium of Empirical Findings 30 April
2 Scope of the Document This document is a compendium of various ad hoc studies conducted in response to common inquiries from potential end users about the empirical properties of TYVIX, related market variables, and anticipated behavior of futures on TYVIX. New results will be appended to this document as they become available, so please check back periodically. All data are sourced from Bloomberg and CBOE. Additional information about TYVIX can be found at For details on TYVIX calculations, see the Guide to the Index. For contract specifications of TYVIX futures, see the Futures Primer. Acknowledgement CBOE would like to thank Antonio Mele and Yoshiki Obayashi for their significant contributions to the empirical studies contained in this document. 2
3 1. Sensitivity of TYVIX to Fixed Income Portfolios When adding exposure to an index, whether for hedging or for return enhancement, it is important to understand how the index behaves with respect to various asset types and market factors. We show how the co-movement between TYVIX and various fixed income portfolios behaves through time by regressing weekly log returns of fixed income ETFs on log changes in TYVIX with a rolling 3-year estimation window. For comparison, we also run complementary regressions on log changes in the CBOE Volatility Index (VIX ) Index as well as in both VIX and TYVIX. The R 2 statistic measures the extent to which portfolio returns correlates with the volatility indexes. Figure 1.1 shows the rolling R 2 for ishares Core U.S. Aggregate Bond ETF. The R 2 for TYVIX travels within a wide range of nearly 0% to up 30% through the time period. There are two marked spikes in 2011 and 2013, which corresponds to the ratings downgrade of US and agency debt and the initial bout of anxiety around QE tapering, respectively, and fears of an impending increase in interest rate volatility took center stage. Figure 1.1 The R 2 is relatively low at the depth of the financial crisis including 2008 when AGG experienced a brief but sharp downturn. At first this observation may seem like an inconsistency, but the divergence in behavior makes sense once one considers that the 2008 episode was credit-driven whereas the 2011 and 2013 episodes were interest ratedriven. Further corroborating the idea that volatilities of different asset classes represent distinct but not mutually exclusive risks, the R 2 of VIX with respect to AGG also increases in the US downgrade episode but diminishes in The increase may be attributed to the 3
4 fact that the 2011 episode was both an interest rate and credit event, the latter causing the VIX to spike up. The significant R 2 of TYVIX during interest rate-led market moves does not immediately tell a fixed income portfolio manager if or how TYVIX derivatives may be used to hedge against downside risk. Periods during which there s little correlation between the performance of AGG and TYVIX as signified by low R 2 are presumably less likely to yield effective hedging opportunities than when correlations are high. As such, we take a cue from Figure 1.1 and zoom in on the 2013 episode to see the performance impact of beta-hedging AGG with TYVIX right as the R 2 kicks up. The left panel of Figure 1.2 shows that the non-compounded cumulative return of the hedged portfolio has significantly muted drawdowns compared to the unhedged case, which is what one would generally want to see in a tail hedge strategy. Looking at it another way, TYVIX tends to shoot up more than its historical relationship with AGG would suggest when AGG experiences pronounced downward moves. If this phenomenon is consistent across other benchmark fixed income portfolios despite the simplicity of this hedging rule, one can imagine a more sophisticated hedging technique based on TYVIX yielding even sharper results. Figure 1.2 The right panel of Figure 1.2 shows that the beta-hedged AGG using VIX does not lead to the same qualitative result, which is yet another manifestation of the difference 4
5 between equity and interest rate volatilities in the context of hedging different asset classes. For completeness, Figure 1.3 shows what happens when both VIX and TYVIX are used together. Figure 1.3 As one would expect, the conclusion is reversed when the same exercise is performed using the S&P 500 index instead of AGG as seen in Figure
6 Figure 1.4 The same analysis for other major ETFs representing different types of fixed income portfolios are shown in Figures A1 ~ A3 of the Appendix. Hedging using Hypothetical TYVIX Futures Prices The foregoing analysis does not take into account the basis between the TYVIX index itself and where futures prices may trade once listed. It is by now well known that log changes in the VIX index cannot necessarily be replicated by log returns on traded VIX futures because of the index-futures basis as well as the volatility term structure. The logical next step would then be to repeat the analysis with the model-calibrated TYVIX futures prices from Section 5 to anticipate the hedging properties of the contracts. In section 5, parameters of the TYVIX futures and options pricing model are calibrated to fit the volatility term structure implied by observed TY option prices. Figure 5.5 shows the short-term volatility term premium oscillating between contango and backwardation, with the latter being the norm during the period shown. The richness of the nearer term contracts is anecdotally ascribed to the TY options sensitivity to the macroeconomic announcement calendar, which appears to be consistent with the flattening of the volatility term structure around announcements as seen in Figure 3.4 below. Assuming TYVIX futures are listed according to the same maturity cycle as VIX futures, we test two simplistic hedging strategy designs. The first strategy is to be constantly long the near-term TYVIX futures contract and roll to the next-term contract a week from 6
7 expiry. The second strategy is to be long the near- and next-term contracts with respective weights being adjusted each day such that the time-weighted maturity of the hedge is always equal to one month. Figure 1.5 Figure 1.5 indicates that the hypothetical P&L of the two hedging strategies are nearly identical, so we only discuss and provide results for the first strategy in the subsequent analysis. The hypothetical hedging P&L displays an upward drift, which is due to the prominent backwardation in the modeled futures term structure that s driven by the underlying TY option-implied volatility slopes. For comparison with the foregoing analysis, Figure 1.5 also plots returns on the TYVIX index as it if were a traded security; the marked divergence in the return series highlights the impact of the index-futures basis. As a sanity check for the modeled futures term structure, the gray line shows returns on a constant one-month futures price obtained by interpolating the near- and next-term model-generated prices, which very closely tracks the index returns as one would expect in a well-specified model. See section 5 for further details on the pricing model. 7
8 Figure 1.6 Figure 1.6 is a repeat of Figures 1.2 and 1.3, except it is based on hypothetical futures hedging P&L for TYVIX and observed futures hedging P&L for VIX, ignoring any transaction costs. As Figure 1.5 would suggest, hedging with modeled TYVIX futures works even better than assuming one can go long the index itself, again primarily because of the frequent backwardation in the short end of the volatility curve. Returns on the simple VIX hedge are now also positive in the form of a gradual drift upwards. This is due to the fact that the beta between AGG and VIX futures going into this period is positive, which prescribes a short VIX futures position as the hedge and benefits from the roll-down effect of the VIX futures term structure. Unlike the hypothetical TYVIX futures hedge, however, the VIX futures hedge does not smooth out the returns on AGG as it still does not appear to be anymore sensitive to sharp downward moves in AGG than the VIX index itself. 8
9 Figure 1.7 Zooming out to a longer time frame, Figure 1.7 shows how the hypothetical TYVIX futures hedge has more or less no impact while AGG increases in value between roughly December 2011 and May 2013, only to kick in and smooth returns when AGG subsequently experiences a couple of sharp falls. The same analysis for other major ETFs representing different types of fixed income portfolios are shown in Figures A4 ~ A6 of the Appendix. 2. Volatility Risk Premium We define volatility risk premium (VRP) as the difference between the level of TYVIX on any given date and the volatility realized during the subsequent one-month period. The VRP can be interpreted roughly as the static P&L from selling volatility through a onemonth volatility swap struck at the level of TYVIX. As such, the time series of VRP can be thought of as the P&L profile of a volatility carry trade in which one systematically sells volatility as a yield enhancement strategy. 9

10 Figure 2.1 The historical VRP, shown by the light green histogram in Figure 2.1, is generally positive with a sprinkling of negative realizations and one particularly severe downward spike in 2008 around the Lehman bankruptcy. This broad pattern is in line with what one would expect from a carry trade. Upon closer inspection, not all carry trades have the same risk-return profile and subtler differences arise in the distribution of premiums collected over time. For example, Figure 2.2 compares the cumulative distribution of standardized variance risk premiums implied by VIX and TYVIX. 1 One can see that the VIX VRP takes on more extreme values of both signs and TYVIX VRP seems to offer less risk but also less reward, which may suit the more risk averse carry trader who would rather forgo the higher premiums to avoid the more frequent and severe drawdowns. 1 We standardize by subtracting the mean and dividing by standard deviation. 10
11 Figure 2.2 At the time of writing, interest rate variance and volatility swap trading is only just starting to show signs of possible life in OTC markets, but if they catch on, then this type of strategy becomes implementable. Alternatively, further analysis of VRP may lead to strategies for trading options on TYVIX if and when they are listed. 3. Macroeconomic Data Releases Many important macroeconomic data are released according to a predetermined schedule, which allows investors to anticipate the timing of potentially market-moving events. When actual numbers are significantly different from consensus numbers, such surprises may cause a shock to asset prices as investors rush to incorporate the unanticipated information. If investors trade options to hedge their portfolios against unwanted surprises, it is then reasonable to expect that, on average, scheduled macro announcements impact option-implied volatility around announcement dates. Since interest rates are particularly driven in large part by macroeconomic factors, we investigate how TYVIX behaves around macro announcements in a traditional event study framework. Since futures on TYVIX do not yet trade, we use log changes in the 11

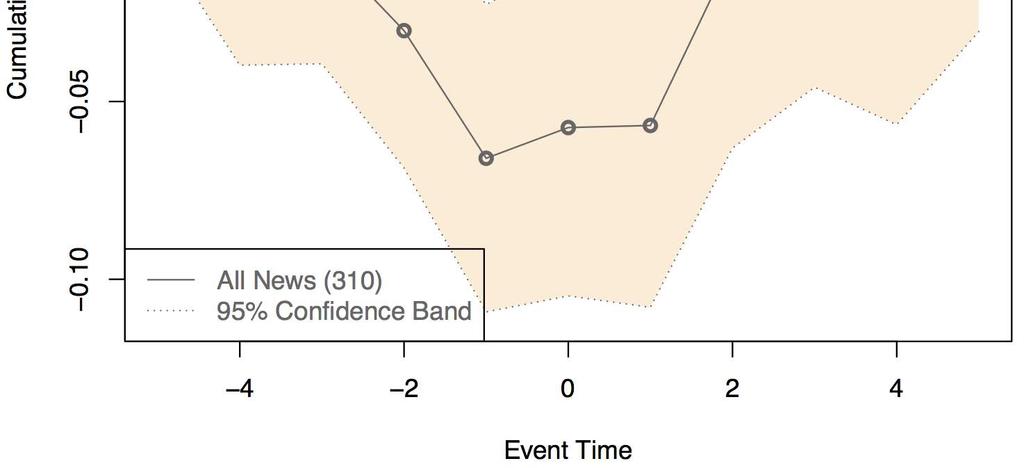
12 index itself as proxies for returns, and study cumulative log changes five trading days before and after announcement dates. We begin by studying the behavior of TYVIX over announcement dates for a large set of 26 macroeconomic numbers, all of which have been assigned the highest relevance rating by Bloomberg in its ECO page. 2 Figure 3.1 shows a clear and statistically significant tendency for TYVIX to rise during the week preceding announcement dates, peaking one day after announcements, and then rapidly declining thereafter. Figure 3.1 The pre-event day rise in TYVIX illuminates the process in which the market s anticipation of the impending announcement s impact is incrementally incorporated into options prices. The rapid and monotonic post-peak decline is consistent with implied 2ADP, U. Mich. Consumer Sentiment, Conf. Board Consumer Confidence, CPI, Durable Goods, Empire State Manufacturing, Existing Home Sales, Fed Funds, GDP, Initial Jobless Claims, Industrial Production, Conf. Board Leading Indicator, ISM Manufacturing, Non Farm Payroll, New One Family House Sold, New Privately Owned Housing, Personal Consumption, Personal Income, PPI, Adjusted Retail and Food Service, Manufacturers New Orders, FOMC Pace of Treasury Purchase, FOCM Pace of Agency Mortgage Purchase, Trade Balance, and Unemployment Rate. 12
13 volatilities falling after the resolution of uncertainty. One curious feature of the pattern seen in this event study is the pronounced peak one day after announcement dates, which deserves additional attention in future research. Figure 3.2 In classic event study fashion, we also decompose each announcement into positive, negative, and no surprises. The major takeaway here seems to be that surprises do not significantly alter the general shape of the pattern observed, indicating that the build-up 13

14 of anticipation and the subsequent release from the resolution of uncertainty outweighs any marginal impact of a surprise or lack thereof. 3 Some of the 26 macro numbers included in the above studies are anecdotally deemed more important than others. In particular, we look at a subset including only FOMC rate decisions, GDP, non-farm payroll, ADP, and ISM Manufacturing to produce Figure 3.3. The general shape of TYVIX s behavior is once again preserved, which indicates robustness of this pattern to the types of macro numbers considered. Results for individual announcements types can be found in the Appendix. Figure 3.3 3One non-trivial caveat here is that there s significant overlap of announcement days, and we have not controlled for clustering. 14

15 Next, we examine how the volatility term structure behaves around macro announcements. In the absence of observed futures prices, we use the absolute difference between generic one-month and two-month volatilities implied by at-themoney TY options to proxy for the volatility term premium. We then examine the cumulative log change in the term premium over a two-week window around announcements as done above. Figure 3.4, which includes all 26 macro announcement types, shows a clear U-shape indicating a flattening of the implied volatility term structure going into announcements and steepening back afterwards. The pattern remains the same for the same subset of 5 macro numbers as seen in Figure

16 Figure 3.4 Figure
17 4. Treasury Auctions Heightened interest rate uncertainty may affect the demand for Treasury securities as dealers and investors perceive greater risk. To test this hypothesis, we investigate if and how TYVIX relates to demand for US Government debt in past auctions based on their bid-to-cover ratios. The data used in this section start in January Specifically, we run the following multiple OLS regression: = where is the bid-to-cover ratio from the auction on date t is the level of TYVIX on date t is the volatility risk premium of TYVIX on date t is the log change in TYVIX compared to one month ago is the level of VIX on date t is the volatility risk premium of VIX on date t is the log change in VIX compared to one month ago We include VIX, change in VIX, and equity volatility risk premium based on VIX to control for factors possibly related to market-wide risk aversion that is not specific to the Treasury market. Auction! " # $ % Adj R2 p(f Stat) 4 Week Month Year Year Year Table 4.1 Table 4.1 tabulates the adjusted R-squared statistics and the p-values of the corresponding F statistics along with OLS estimates of the coefficients, with those significant at the 1% (5%) level highlighted in light green (yellow). The results are stark and in-line with the hypothesis that greater perceived uncertainty in Treasury rates as measured by TYVIX tends to reduce demand as indicated by the highly significant and 17
18 negative estimates for and the high levels of the adjusted R-squared statistics. The lack of explanatory power of the three VIX-related variables further illustrates how interest rate and equity volatilities are driven, at least in part, by distinct factors. 5. No-Arbitrage Model of TYVIX Futures and Options Mele, Obayashi, and Yang (2014) 4 propose a no-arbitrage model for pricing derivatives on TYVIX. The model may be calibrated to market data to generate prices of TYVIX futures, which may be used to back-test trading strategies and hedging techniques in the absence of historical data. One may even simulate tick data for TYVIX futures of any maturity, which may be of interest to market makers. The model may also be suitable as a risk management tool as it is able to simultaneously match the Treasury yield curve and TYVIX while pricing futures and options in one consistent framework, and may moreover be used for stress-testing and scenario analysis. For example, the model may be used to simulate how policy decisions may affect TYVIX as well as the term structure of futures prices; the model may even simulate the impact of policy shocks to specific parts of the yield curve. As another example, the model may be used to study how a spike in realized volatility of interest rates may affect TYVIX and the futures term structure. Theoretical Framework The model s main assumptions are that (a) the short-term rate is mean-reverting with mean-reverting stochastic volatility and (b) the entire current yield curve determines future developments in the yield curve. In detail, under the risk neutral probability, the short-term rate & is solution to, (& =) * + & (-+. (/ ' (. =) 0 1. (-+2. (/ where: / and / are two correlated Brownian motions;. is the instantaneous basis point variance of the short-term rate; ) * and ) 0 denote the speed of mean-reversion of & and. towards a time-varying long-run rate + and a long-run variance 1, respectively; 2 is a volatility of variance parameter. 4 Antonio Mele, Yoshiki Obayashi and Shihao Yang [2014]: Pricing Options and Futures on a Government Bond Volatility Index. Unpublished manuscript 18
19 The long-run rate + is calibrated each day so as to ensure that the model fits the whole market yield curve on each day exactly, i.e. with no pricing errors. That is, &,., ;5=6 78;98:8;9* ;<=8;90 ; > = $ where &,., ;5 denotes the price of a zero-coupon bond at - and expiring at when the short term rate and the instantaneous variance are & and., and 5 denotes the model s parameter vector;@ -;5, -;5 and -;5 are three functions depending on time-to-maturity -; and, finally, $ denotes the market counterpart to &,., ;5, interpolated through available data. The model makes predictions regarding the behavior of the price of forward contracts written on coupon-bearing bonds, which in turns determines the forward instantaneous, percentage realized variance as a function of.,. ;5 say. The function. ;5captures the endogenous nature of government bond realized variance, depending as it does on how the yield curve is exposed to changes in the factors through the sensitivities -;5 and -;5.The model predicts that: =B 1 < D E F [. H ;5](J =KL 5+L 5. where E F denotes the expectation at - under the forward probability (see Antonio Mele and Yoshiki Obayashi [2014]: Interest Rate Variance Swaps and the Pricing of Fixed Income Volatility. GARP s Quant Perspectives, March, 1-8); is the maturity of the variance swap underlying the index; and L 5 and L 5 are two time-varying functions that depend on the model s parameters, 5, as well as the yield curve at -. The model makes predictions regarding the value of products on TYVIX. For example, futures are determined as E [ <M ], where E denotes the expectation at - under the risk-neutral probability and N is the maturity of the future. To summarize, the rationale underlying the mean-reverting behavior of interest rates and volatility parallels that underlying standard methodologies in equity markets for modelbased pricing of products on VIX, but the present methodology for interest rates has three distinguishing features that are specific to fixed income markets: (a) it fits the entire yield curve at any point in time; (b) it takes into account the endogenous nature of government bond volatility by incorporating the yield curve sensitivities to factor changes; and (c) it ensures that the yield curve at any point in time also determines both TYVIX and the pricing of products on the index, such as futures and options. Calibration Strategy and Results 19
20 We calibrate the model to match (a) the level of TYVIX each day, (b) the salient timeseries properties of realized government bond volatility (levels, variation and meanreversion), and (c) the salient cross-sectional dynamics of ATM implied volatilities on TY options at different horizons. Item (c) is a natural benchmark as implied volatilities help calibrate the model while TYVIX futures do not trade yet. The calibration covers daily observations from January 5, 2008 to June 24, Figure 5.1 depicts the time series behavior of the TYVIX along with values of hypothetical one-month futures based on the model. The model predicts rich dynamics with TYVIX futures cycling between Contango and Backwardation. TYVIX & hypothetical TYVIX futures TYVIX hypothetical 1 month TYVIX futures Contango Backwardation Figure 5.1 These dynamics are distinct from those of VIX futures, depicted in Figure 5.2. The VIX futures market is in Contango for most of the time, with the exception of only two clear and persistent instances of Backwardation occurring over the surge of VIX in Fall 2008 and Summer Instead, the model-based TYVIX futures market is in Backwardation 20
21 markedly more frequently including the acute spikes in TYVIX also occurring in Fall 2008 and Summer Figure 5.3 provides a direct comparison of the VIX and TYVIX, along with one-month futures premiums (market-based for VIX; and model-based for TYVIX). Figure
22 Figure 5.3 Figure 5.4 shows the dynamics of TYVIX futures for two- and three-month maturities, and Figure 5.5 illustrates how spreads between TYVIX futures of various maturities and the index track spreads between ATM implied volatilities of TY options of corresponding maturities. 22
23 TYVIX & hypothetical TYVIX futures TYVIX hypothetical 1 month TYVIX futures hypothetical 2 month TYVIX futures hypothetical 3 month TYVIX futures hypothetical 1M TYVIX futures TYVIX hypothetical 2M TYVIX futures TYVIX hypothetical 3M TYVIX futures TYVIX hypothetical 2M TYVIX futures 1M TYVIX futures Figure
24 TYVIX futures premium & ATM Implied Vol premium 2M ATM Implied Vol 1M ATM Implied Vol hypothetical 1M TYVIX Futures TYVIX M ATM Implied Vol 1M ATM Implied Vol hypothetical 2M TYVIX Futures TYVIX M ATM Implied Vol 2M ATM Implied Vol hypothetical 2M TYVIX Futures 1M TYVIX Futures Figure
25 The model is able to fit both TYVIX and the yield curve without error as explained. Figures 5.6 through 5.8 demonstrate the model s ability to match the yield curve for two particular days at the beginning and on the very last day of the sampling period. Figure
26 Figure 5.7 Figure 5.8 Applications to Scenario Analysis and Stress Test This model may be used to study how shocks to various underlying variables of interest, such as the yield curve or short-term volatility, may impact the TYVIX futures curve. Such scenario analysis may be used as part of stress testing for risk management purposes or to explore trading ideas. An example of a scenario analysis could be to estimate what would happen to the futures curve if the market suddenly experiences a 1% upward parallel shift in yields accompanied by a 1.25-, 1.5-, or 2-fold increase in short term interest rate volatility. The left panel of Figure 5.9 shows what may happen in the various scenarios if the long-term volatility remains the same. 26
27 Figure 5.9 When only the short-term volatility is shocked, which could correspond to a temporary overreaction to the sudden 1% increase in yields, the model predicts a more pronounced increase in the shorter end of the futures curve while the longer end of the curve reverts towards the long-term mean. Flattening or even inversions of volatility curves are not unheard of, especially in times of extreme short-term uncertainty that is expected to dissipate over the long run. On the other hand, some events such as changes in long-term monetary policy may create a more permanent shock to interest rate volatility with the direction of change in long-term volatility being driven by the market s interpretation of the event. For example, the recent prolonged period of very low interest rate volatility is often attributed to the Federal Reserve s series of QE programs. The right panel of Figure 5.9 shows the opposite situation in which there s an upward shock to long-term volatility in addition to the same increase in yield and short-term volatility as the right panel. In this scenario, the model predicts volatility futures curves that shift upward with a counterclockwise twist, which is consistent with the intuition that longer-term futures prices will adjust to reflect the permanent volatility shock. 27
28 6. Intraday Tick Data Intraday spikes While isolated and transitory, there is a sprinkling of pronounced intraday spikes that occur with enough frequency and are of such magnitudes that warrant closer inspection. Spikes that result from broad-based price jumps with meaningful volumes going through at the significantly heightened or depressed levels may reflect abrupt but genuine changes in the market s expectation of volatility. On the other hand, spikes that result from momentary deterioration in the quality of price discovery in the underlying options may be less an intended feature of the index design than an artifact of market microstructure. The latter may occur, for instance, when market participants pull quotes for all but a couple of the options entering the calculation of TYVIX during a window of, say, 15 seconds to a minute around an important macro announcement. While trading of futures on TYVIX may not be influenced by every tick of the index, certain real-time uses of the index, such as its use as an input to a model generating trading signals, may be well-served by the implementation of a live filter to remove spikes that do not reflect genuine market moves. The main challenge in analyzing the intraday spikes, however, is the task of classifying each as legitimate or spurious since there are countless factors that may come together to cause a given spike. In proposing the filter below, we avoid relying on a specific definition of a false spike and instead take a purely statistical approach that is agnostic to the underlying cause and is particularly suited to the nature of the observed spikes as explained below. Theoretical Motivation for the Filter We assume that the log returns between each tick are independently and identically distributed ( i.i.d. ) and follow some probability distribution G with mean 1 and variance O. Let P be the log return between tick number n-1 and n, and suppose we have a series of observations =Q, =Q,, P =Q P.We would like to test whether the (n+1)-th tick and associated return P< =Q P< is an outlier based on the mean and variance of the n preceding observations, i.e. S T : P< ~W..J.S : P< W. In other words, we would like to test whether the current (n+1)-th tick is likely to have come from the unknown distribution G that has generated the past n-1returns. In doing so, we would like to control the probability that the filter incorrectly removes a tick, known as the p-value, which may also be interpreted as the probability that P< is even more extreme that the observation Q P<, i.e. P P< 1 > Q P< 1.To be conservative, we do not impose any distributional assumptions on G, but by Chebyshev s inequality, we have that 28
29 P P< 1 > Q P< 1 ^> _`ab 8c > which gives us a conservative upper bound for the actual p-value. Filtering methodology The methodology we propose is simple and intuitive. Moreover, the algorithm uses no forward-looking data, so it may be implemented as a real-time filter. We set a significance level such that the filter will remove the (n+1)-th tick if and only if the log return P< satisfies P< 1 > d f. For example, if we set =1/1600, the tick is removed if its log return deviates from the mean by more than 40 times the standard deviation, meaning that we will mistakenly filter out at most one tick per day since CBOE disseminates intraday values of TYVIX at 15 second intervals between 7:20am 2pm Central Time. In fact, the p-value we calculate is conservative and the actual error rate is likely to be much less than 1 tick per day. Spikes sometimes last for multiple ticks, which raises the question of how to assess the (n+2)-th tick if the filter has removed the (n+1)-th tick as an outlier. The theoretical framework underlying this methodology provides a natural way to handle this complication. Let us denote by j P the index value corresponding to the n-th tick, i.e. P =lnj P ln j P8. Since we have removed P< and therefore j P<, we cannot compute P<. However, ln j P< ln j P is the sum of two i.i.d. variables following distribution G, and therefore mlnj P< lnj P =21 and o&lnj P< lnj P = 2O, which yields P lnj P< lnj P 21 > lnj P< lnj P 21 ^> pqh`a> 8pq H`8c > By using the p-value above to evaluate the (n+2)-th tick, the methodology includes a failsafe mechanism in the sense that in the very unlikely event that we mistakenly remove j P<, j P< is likely to stay at a similar level, and the p-value for j P< will be double that of j P< and therefore the filter is less likely to remove j P<. If the TYVIX stays at the post-spike level for three, four, five ticks, the p-value will incrementally increase and the filter will eventually accept the spike as a true market move. The dynamics of this fail safe mechanism depends on the magnitude of the initial spike and the significance level α. Figure 6.1 illustrates the results of the filtering method for three different levels of. The choice of an optimal is likely to be context-dependent. 29
30 30
31 Figure
32 Intraday Patterns of Realized TYVIX Volatility As a first application of the filtering methodology above, we implement it with =1/100 and calculate the realized volatility of TYVIX using the filtered series to look for intraday patterns in the volatility of TYVIX, i.e. vol-of-vol. Without the filter, high-frequency realized volatility estimates are likely to be greatly influenced by the outliers and generate unreliable results; hence this serves as a straightforward and immediately relevant use case for the filter. After applying the filter, we calculate the autocorrelation function on log changes in TYVIX as shown in Figure 6.2. As is common with tick data, returns are highly negatively autocorrelated, possibly due to bid-ask bounce, which is likely to significantly bias the realized volatility estimate higher if one were to simply calculate the sum of tick-by-tick log returns squared as one may reasonably do with lower frequency data. Figure
33 In order to adjust for this effect, we use a high-frequency variance estimator suggested by Ait Sahalia et. al. 5, which is a linear combination of realized variances based on tick-by-tick and lower-frequency samplings. The idea behind it is to combine the robustness of the latter with the maximal informational content of the former. Figure 6.3 shows realized variance estimates based on naïve squared sums at different lags and the estimator in Ait Sahalia et. al. 6 The naïve estimates, even up to short lags, are more than double the more stable estimates are longer lags. The estimates are seen to stabilize around a lag of 5 minutes on this particular day; in fact, after comparing the empirical performance of various lags, we find that 5 minutes works well for our sample. Realized Variance computation naive estimator Ait Sahalia, Mykland, Zhang estimator Daily Realized Variance 1e 04 2e 04 3e 04 4e 04 5e sampling frequency (minute) Figure Yacine Ait-Sahalia, Per A. Mykland, and Lan Zhang. A tale of two time scales: Determining integrated volatility with noisy high-frequency data. Journal of the American Statistical Association, The estimates include the improvement proposed in Yacine Ait-Sahalia, Per A. Mykland, and Lan Zhang. Ultra high frequency volatility estimation with dependent microstructure noise. Journal of Econometrics,

34 To look for an intraday volatility pattern, we calculate the Ait-Sahalia et. al. estimator based on seven time intervals each day, and average across all dates to derive Figure 6.4. The pattern is nearly monotonically decreasing with the exception of a bump during the interval corresponding to 11:15am 12:15pm Central Time. We fit a Linear Mixed-Effects Model on the panel data of 1,591 days and 7 intervals by treating the passing of time as a fixed effect and the days as a random effect, and find that the decreasing pattern is highly statistically significant. Figure 6.5 displays the same data broken down by year. Lastly, let us note that the magnitudes obtained here are also in-line with estimates obtained when calibrating the futures pricing model. Figure
35 Annualized Realized Volatility (%) Annualized Realized Volatility (%) Annualized Realized Volatility (%) Annualized Realized Volatility (%) :20:00 10:15:00 13:15: Annualized Realized Volatility (%) :20:00 10:15:00 13:15: Annualized Realized Volatility (%) :20:00 10:15:00 13:15: :20:00 10:15:00 13:15:00 07:20:00 10:15:00 13:15:00 07:20:00 10:15:00 13:15:00 Figure
36 Appendix Figure A1 36
37 Figure A2 37
38 Figure A3 38
39 Figure A4 Figure A5 39
40 Figure A6 Figure B1 40
41 Figure B2 41
42 Figure B3 42
43 Figure B4 43
44 Figure B5 We welcome your feedback. Please direct all inquiries to: Catherine Shalen, Director, Research and Product Development Phone: +1(312)
45 Futures trading is not suitable for all investors, and involves risk of loss. Options involve risk and are not suitable for all investors. Prior to buying or selling an option, a person must receive a copy of Characteristics and Risks of Standardized Options. Copies are available from your broker, by calling OPTIONS, or from The Options Clearing Corporation at The information in this document is provided solely for general education and information purposes, and is not intended to provide, and should not be relied on for financial or legal advice. No statement within this document should be construed as a recommendation to buy or sell a security or futures contract or to provide investment advice. It is not possible to invest directly in an index. Past performance does not guarantee future results. Visit for more information. The CBOE/CBOT 10-Year U.S. Treasury Note Volatility Index (TYVIX SM Index), CBOE Volatility Index (VIX index) and all other data and information provided by Chicago Board Options Exchange, Incorporated (CBOE) and its affiliates and their respective directors, officers, employees, agents, representatives and third party providers of information (the Parties ) in connection with the TYVIX and VIX Indexes (collectively Data ) are presented "as is" and without representations or warranties of any kind. The Parties shall not be liable for loss or damage, direct, indirect or consequential, arising from any use of the Data or action taken in reliance upon the Data. This document contains comparisons regarding the performance of indexes based on backtesting, i.e., calculations of how the indexes might have performed in the past if they had existed. Backtested performance information is purely hypothetical and is provided in this document solely for informational purposes. Backtested performance does not represent actual performance, and should not be interpreted as an indication of actual performance. The VIX index methodology is the property of CBOE. CBOE, CBOE Volatility Index, CFE, Execute Success and VIX are registered trademarks and CBOE Futures Exchange and TYVIX are service marks of CBOE. CBOT is a trademark of CME Group, Inc. (CME). CBOE has, with the permission of CME, used such trademark in the CBOE/CBOT 10 Year U.S. T-Note Volatility Index. CME makes no representation regarding the advisability of investing in any investment product that is based on such index. Standard & Poor's, S&P and S&P 500 are registered trademarks of Standard & Poor's Financial Services, LLC and have been licensed for use by CBOE and CBOE Futures Exchange, LLC (CFE). Financial products based on S&P indices are not sponsored, endorsed, sold or promoted by Standard & Poor s, and Standard & Poor s makes no representation regarding the advisability of investing in such products. Redistribution, reproduction and/or photocopying in whole or in part are prohibited without the written permission of CFE. Copyright 2015 CBOE Futures Exchange, LLC (CFE). All rights reserved. 45
Portfolio Hedging with Interest Rate Volatility
 Portfolio Hedging with Interest Rate Volatility CBOE RMC USA, 5 March 2015 Presented by Yoshiki Obayashi, Managing Director, Applied Academics LLC In collaboration with Prof. Antonio Mele, Swiss Finance
Guide to the CBOE / CBOT 10 Year Treasury Note Volatility Index (TYVIX SM Index) Part I: Introduction to the TYVIX Index
 Part I: Introduction to the TYVIX Index") Guide to the CBOE / CBOT 1 Year Treasury Note Volatility Index ( SM Index) Part I: Introduction to the Index 1 Table of Contents I. Introduction to the Index II. III. IV. Index Calculation Conversion to
Guide to the CBOE / CBOT 1 Year Treasury Note Volatility Index ( SM Index) Part I: Introduction to the Index 1 Table of Contents I. Introduction to the Index II. III. IV. Index Calculation Conversion to
Developments in Volatility-Related Indicators & Benchmarks
 Developments in Volatility-Related Indicators & Benchmarks William Speth, Global Head of Research Cboe Multi-Asset Solutions Team September 12, 18 Volatility-related indicators unlock valuable information
Lazard Insights. The Art and Science of Volatility Prediction. Introduction. Summary. Stephen Marra, CFA, Director, Portfolio Manager/Analyst
 Lazard Insights The Art and Science of Volatility Prediction Stephen Marra, CFA, Director, Portfolio Manager/Analyst Summary Statistical properties of volatility make this variable forecastable to some
S&P/JPX JGB VIX Index
 S&P/JPX JGB VIX Index White Paper 15 October 015 Scope of the Document This document explains the design and implementation of the S&P/JPX Japanese Government Bond Volatility Index (JGB VIX). The index
Interpreting Volatility-Related Indicators & Benchmarks
 Interpreting Volatility-Related Indicators & Benchmarks William Speth, Head of Research Cboe Multi-Asset Solutions Team March 7, 18 Volatility-related indicators & benchmarks unlock valuable information
Internet Appendix: High Frequency Trading and Extreme Price Movements
 Internet Appendix: High Frequency Trading and Extreme Price Movements This appendix includes two parts. First, it reports the results from the sample of EPMs defined as the 99.9 th percentile of raw returns.
A Closer Look at High-Frequency Data and Volatility Forecasting in a HAR Framework 1
 A Closer Look at High-Frequency Data and Volatility Forecasting in a HAR Framework 1 Derek Song ECON 21FS Spring 29 1 This report was written in compliance with the Duke Community Standard 2 1. Introduction
Predicting Inflation without Predictive Regressions
 Predicting Inflation without Predictive Regressions Liuren Wu Baruch College, City University of New York Joint work with Jian Hua 6th Annual Conference of the Society for Financial Econometrics June 12-14,
Volatility as investment - crash protection with calendar spreads of variance swaps
 Journal of Applied Operational Research (2014) 6(4), 243 254 Tadbir Operational Research Group Ltd. All rights reserved. www.tadbir.ca ISSN 1735-8523 (Print), ISSN 1927-0089 (Online) Volatility as investment
Estimating the Dynamics of Volatility. David A. Hsieh. Fuqua School of Business Duke University Durham, NC (919)
") Estimating the Dynamics of Volatility by David A. Hsieh Fuqua School of Business Duke University Durham, NC 27706 (919)-660-7779 October 1993 Prepared for the Conference on Financial Innovations: 20 Years
Estimating the Dynamics of Volatility by David A. Hsieh Fuqua School of Business Duke University Durham, NC 27706 (919)-660-7779 October 1993 Prepared for the Conference on Financial Innovations: 20 Years
Janus Hedged Equity ETFs SPXH: Janus Velocity Volatility Hedged Large Cap ETF TRSK: Janus Velocity Tail Risk Hedged Large Cap ETF
 Janus Hedged Equity ETFs SPXH: Janus Velocity Volatility Hedged Large Cap ETF TRSK: Janus Velocity Tail Risk Hedged Large Cap ETF September 2014 The Janus Velocity Volatility Hedged Large Cap and Velocity
Options and Volatility Benchmarks & Indicators Cboe Risk Management Conference Asia. John Hiatt
 Options and Volatility Benchmarks & Indicators Cboe Risk Management Conference Asia John Hiatt December 5, 2017 Using options benchmarks & volatility indicators Using options for benchmarks & volatility
Factors in Implied Volatility Skew in Corn Futures Options
 1 Factors in Implied Volatility Skew in Corn Futures Options Weiyu Guo* University of Nebraska Omaha 6001 Dodge Street, Omaha, NE 68182 Phone 402-554-2655 Email: wguo@unomaha.edu and Tie Su University
Expectations and market microstructure when liquidity is lost
 Expectations and market microstructure when liquidity is lost Jun Muranaga and Tokiko Shimizu* Bank of Japan Abstract In this paper, we focus on the halt of discovery function in the financial markets
Inflation Targeting and Revisions to Inflation Data: A Case Study with PCE Inflation * Calvin Price July 2011
 Inflation Targeting and Revisions to Inflation Data: A Case Study with PCE Inflation * Calvin Price July 2011 Introduction Central banks around the world have come to recognize the importance of maintaining
How important is economic news for bond markets? *
 How important is economic news for bond markets? * Justinas Brazys and Martin Martens This draft: January 14, 2014 Abstract We propose a novel methodology to estimate how much of the variation in bond
VIX Fear of What? October 13, Research Note. Summary. Introduction
 Research Note October 13, 2016 VIX Fear of What? by David J. Hait Summary The widely touted fear gauge is less about what might happen, and more about what already has happened. The VIX, while promoted
The Characteristics of Stock Market Volatility. By Daniel R Wessels. June 2006
 The Characteristics of Stock Market Volatility By Daniel R Wessels June 2006 Available at: www.indexinvestor.co.za 1. Introduction Stock market volatility is synonymous with the uncertainty how macroeconomic
Empirical Distribution Testing of Economic Scenario Generators
 1/27 Empirical Distribution Testing of Economic Scenario Generators Gary Venter University of New South Wales 2/27 STATISTICAL CONCEPTUAL BACKGROUND "All models are wrong but some are useful"; George Box
FE670 Algorithmic Trading Strategies. Stevens Institute of Technology
 FE670 Algorithmic Trading Strategies Lecture 4. Cross-Sectional Models and Trading Strategies Steve Yang Stevens Institute of Technology 09/26/2013 Outline 1 Cross-Sectional Methods for Evaluation of Factor
Quarterly Currency Outlook
 Mature Economies Quarterly Currency Outlook MarketQuant Research Writing completed on July 12, 2017 Content 1. Key elements of background for mature market currencies... 4 2. Detailed Currency Outlook...
Lecture 5: Univariate Volatility
 Lecture 5: Univariate Volatility Modellig, ARCH and GARCH Prof. Massimo Guidolin 20192 Financial Econometrics Spring 2015 Overview Stepwise Distribution Modeling Approach Three Key Facts to Remember Volatility
PRE CONFERENCE WORKSHOP 3
 PRE CONFERENCE WORKSHOP 3 Stress testing operational risk for capital planning and capital adequacy PART 2: Monday, March 18th, 2013, New York Presenter: Alexander Cavallo, NORTHERN TRUST 1 Disclaimer
in-depth Invesco Actively Managed Low Volatility Strategies The Case for
 Invesco in-depth The Case for Actively Managed Low Volatility Strategies We believe that active LVPs offer the best opportunity to achieve a higher risk-adjusted return over the long term. Donna C. Wilson
1 Volatility Definition and Estimation
 1 Volatility Definition and Estimation 1.1 WHAT IS VOLATILITY? It is useful to start with an explanation of what volatility is, at least for the purpose of clarifying the scope of this book. Volatility
LECTURE 8 Monetary Policy at the Zero Lower Bound: Quantitative Easing. October 10, 2018
 Economics 210c/236a Fall 2018 Christina Romer David Romer LECTURE 8 Monetary Policy at the Zero Lower Bound: Quantitative Easing October 10, 2018 Announcements Paper proposals due on Friday (October 12).
MFE8825 Quantitative Management of Bond Portfolios
 MFE8825 Quantitative Management of Bond Portfolios William C. H. Leon Nanyang Business School March 18, 2018 1 / 150 William C. H. Leon MFE8825 Quantitative Management of Bond Portfolios 1 Overview 2 /
Jaime Frade Dr. Niu Interest rate modeling
 Interest rate modeling Abstract In this paper, three models were used to forecast short term interest rates for the 3 month LIBOR. Each of the models, regression time series, GARCH, and Cox, Ingersoll,
The Benefits of Dynamic Factor Weights
 100 Main Street Suite 301 Safety Harbor, FL 34695 TEL (727) 799-3671 (888) 248-8324 FAX (727) 799-1232 The Benefits of Dynamic Factor Weights Douglas W. Case, CFA Anatoly Reznik 3Q 2009 The Benefits of
Minimizing Timing Luck with Portfolio Tranching The Difference Between Hired and Fired
 Minimizing Timing Luck with Portfolio Tranching The Difference Between Hired and Fired February 2015 Newfound Research LLC 425 Boylston Street 3 rd Floor Boston, MA 02116 www.thinknewfound.com info@thinknewfound.com
Introducing the JPMorgan Cross Sectional Volatility Model & Report
 Equity Derivatives Introducing the JPMorgan Cross Sectional Volatility Model & Report A multi-factor model for valuing implied volatility For more information, please contact Ben Graves or Wilson Er in
Université de Montréal. Rapport de recherche. Empirical Analysis of Jumps Contribution to Volatility Forecasting Using High Frequency Data
 Université de Montréal Rapport de recherche Empirical Analysis of Jumps Contribution to Volatility Forecasting Using High Frequency Data Rédigé par : Imhof, Adolfo Dirigé par : Kalnina, Ilze Département
Economic Response Models in LookAhead
 Economic Models in LookAhead Interthinx, Inc. 2013. All rights reserved. LookAhead is a registered trademark of Interthinx, Inc.. Interthinx is a registered trademark of Verisk Analytics. No part of this
Managed Risk Alternatives for V-Shaped Markets. Chris Onken, FSA, MAAA
 Managed Risk Alternatives for V-Shaped Markets Chris Onken, FSA, MAAA Managed Risk Alternatives for V-Shaped Markets CHRIS ONKEN, FSA, MAAA Consulting Actuary, Milliman November 15, 2016 (1030 1200 hours)
Intro to Trading Volatility
 Intro to Trading Volatility Before reading, please see our Terms of Use, Privacy Policy, and Disclaimer. Overview Volatility has many characteristics that make it a unique asset class, and that have recently
Leading Economic Indicators and a Probabilistic Approach to Estimating Market Tail Risk
 Leading Economic Indicators and a Probabilistic Approach to Estimating Market Tail Risk Sonu Vanrghese, Ph.D. Director of Research Angshuman Gooptu Senior Economist The shifting trends observed in leading
E V O L U T I O N C A P I T A L
 E V O L U T I O N C A P I T A L L i q u i d A l t e r n a t i v e S t r a t e g i e s Volatility: A New Return Driver? Evolution Capital Strategies Schreiner Capital Management Investors have traditionally
FRBSF ECONOMIC LETTER
 FRBSF ECONOMIC LETTER 15- July, 15 Assessing the Recent Behavior of Inflation BY KEVIN J. LANSING Inflation has remained below the FOMC s long-run target of % for more than three years. But this sustained
Buyer Beware: Investing in VIX Products
 Buyer Beware: Investing in VIX Products VIX 1 based products have become very popular in recent years and many people identify the VIX as an investor fear gauge. Products based on the VIX are generally
It s Closing Time. Trading Strategy. Volume Curves Shift More into the Close. Key Points
 ( ( Trading Strategy It s Closing Time Victor Lin Victor.lin@credit-suisse.com 1-86-76 Market Commentary 12 September 217 Key Points Over the past decade, an increasing proportion of stock volume has moved
Volatility as a Tradable Asset: Using the VIX as a market signal, diversifier and for return enhancement
 Volatility as a Tradable Asset: Using the VIX as a market signal, diversifier and for return enhancement Joanne Hill Sandy Rattray Equity Product Strategy Goldman, Sachs & Co. March 25, 2004 VIX as a timing
Market risk measurement in practice
 Lecture notes on risk management, public policy, and the financial system Allan M. Malz Columbia University 2018 Allan M. Malz Last updated: October 23, 2018 2/32 Outline Nonlinearity in market risk Market
NATIONWIDE ASSET ALLOCATION INVESTMENT PROCESS
 Nationwide Funds A Nationwide White Paper NATIONWIDE ASSET ALLOCATION INVESTMENT PROCESS May 2017 INTRODUCTION In the market decline of 2008, the S&P 500 Index lost more than 37%, numerous equity strategies
Fixed-Income Insights
 Fixed-Income Insights The Appeal of Short Duration Credit in Strategic Cash Management Yields more than compensate cash managers for taking on minimal credit risk. by Joseph Graham, CFA, Investment Strategist
Macroeconomic Announcements and Investor Beliefs at The Zero Lower Bound
 Macroeconomic Announcements and Investor Beliefs at The Zero Lower Bound Ben Carlston Marcelo Ochoa [Preliminary and Incomplete] Abstract This paper examines empirically the effect of the zero lower bound
Macroeconomic announcements and implied volatilities in swaption markets 1
 Fabio Fornari +41 61 28 846 fabio.fornari @bis.org Macroeconomic announcements and implied volatilities in swaption markets 1 Some of the sharpest movements in the major swap markets take place during
Validation of Nasdaq Clearing Models
 Model Validation Validation of Nasdaq Clearing Models Summary of findings swissquant Group Kuttelgasse 7 CH-8001 Zürich Classification: Public Distribution: swissquant Group, Nasdaq Clearing October 20,
Discussion of "The Value of Trading Relationships in Turbulent Times"
 Discussion of "The Value of Trading Relationships in Turbulent Times" by Di Maggio, Kermani & Song Bank of England LSE, Third Economic Networks and Finance Conference 11 December 2015 Mandatory disclosure
April The Value Reversion
 April 2016 The Value Reversion In the past two years, value stocks, along with cyclicals and higher-volatility equities, have underperformed broader markets while higher-momentum stocks have outperformed.
The Gertler-Gilchrist Evidence on Small and Large Firm Sales
 The Gertler-Gilchrist Evidence on Small and Large Firm Sales VV Chari, LJ Christiano and P Kehoe January 2, 27 In this note, we examine the findings of Gertler and Gilchrist, ( Monetary Policy, Business
Premium Timing with Valuation Ratios
 RESEARCH Premium Timing with Valuation Ratios March 2016 Wei Dai, PhD Research The predictability of expected stock returns is an old topic and an important one. While investors may increase expected returns
The University of Chicago, Booth School of Business Business 41202, Spring Quarter 2012, Mr. Ruey S. Tsay. Solutions to Final Exam
 The University of Chicago, Booth School of Business Business 41202, Spring Quarter 2012, Mr. Ruey S. Tsay Solutions to Final Exam Problem A: (40 points) Answer briefly the following questions. 1. Consider
Comparing the Performance of Annuities with Principal Guarantees: Accumulation Benefit on a VA Versus FIA
 Comparing the Performance of Annuities with Principal Guarantees: Accumulation Benefit on a VA Versus FIA MARCH 2019 2019 CANNEX Financial Exchanges Limited. All rights reserved. Comparing the Performance
Monetary Policy and Medium-Term Fiscal Planning
 Doug Hostland Department of Finance Working Paper * 2001-20 * The views expressed in this paper are those of the author and do not reflect those of the Department of Finance. A previous version of this
NOTES ON THE BANK OF ENGLAND OPTION IMPLIED PROBABILITY DENSITY FUNCTIONS
 1 NOTES ON THE BANK OF ENGLAND OPTION IMPLIED PROBABILITY DENSITY FUNCTIONS Options are contracts used to insure against or speculate/take a view on uncertainty about the future prices of a wide range
Motif Capital Horizon Models: A robust asset allocation framework
 Motif Capital Horizon Models: A robust asset allocation framework Executive Summary By some estimates, over 93% of the variation in a portfolio s returns can be attributed to the allocation to broad asset
Citi Dynamic Asset Selector 5 Excess Return Index
 Multi-Asset Index Factsheet & Performance Update - 31 st August 2016 FOR U.S. USE ONLY Citi Dynamic Asset Selector 5 Excess Return Index Navigating U.S. equity market regimes. Index Overview The Citi Dynamic
An Examination of the Predictive Abilities of Economic Derivative Markets. Jennifer McCabe
 An Examination of the Predictive Abilities of Economic Derivative Markets Jennifer McCabe The Leonard N. Stern School of Business Glucksman Institute for Research in Securities Markets Faculty Advisor:
Indian Sovereign Yield Curve using Nelson-Siegel-Svensson Model
 Indian Sovereign Yield Curve using Nelson-Siegel-Svensson Model Of the three methods of valuing a Fixed Income Security Current Yield, YTM and the Coupon, the most common method followed is the Yield To
QF206 Week 11. Part 2 Back Testing Case Study: A TA-Based Example. 1 of 44 March 13, Christopher Ting
 Part 2 Back Testing Case Study: A TA-Based Example 1 of 44 March 13, 2017 Introduction Sourcing algorithmic trading ideas Getting data Making sure data are clean and void of biases Selecting a software
Estimates of the Productivity Trend Using Time-Varying Parameter Techniques
 Estimates of the Productivity Trend Using Time-Varying Parameter Techniques John M. Roberts Board of Governors of the Federal Reserve System Stop 80 Washington, D.C. 20551 November 2000 Abstract: In the
Dynamic Replication of Non-Maturing Assets and Liabilities
 Dynamic Replication of Non-Maturing Assets and Liabilities Michael Schürle Institute for Operations Research and Computational Finance, University of St. Gallen, Bodanstr. 6, CH-9000 St. Gallen, Switzerland
Sensex Realized Volatility Index (REALVOL)
") Sensex Realized Volatility Index (REALVOL) Introduction Volatility modelling has traditionally relied on complex econometric procedures in order to accommodate the inherent latent character of volatility.
Sensex Realized Volatility Index (REALVOL) Introduction Volatility modelling has traditionally relied on complex econometric procedures in order to accommodate the inherent latent character of volatility.
Market Risk Disclosures For the Quarter Ended March 31, 2013
 Market Risk Disclosures For the Quarter Ended March 31, 2013 Contents Overview... 3 Trading Risk Management... 4 VaR... 4 Backtesting... 6 Total Trading Revenue... 6 Stressed VaR... 7 Incremental Risk
We are not saying it s easy, we are just trying to make it simpler than before. An Online Platform for backtesting quantitative trading strategies.
 We are not saying it s easy, we are just trying to make it simpler than before. An Online Platform for backtesting quantitative trading strategies. Visit www.kuants.in to get your free access to Stock
CBOE Equity Market Volatility Indexes
 Interactive Brokers Webcast CBOE Equity Market Volatility Indexes March 26, 2014 Presented by Russell Rhoads, CFA Disclosure Options involve risks and are not suitable for all investors. Prior to buying
Week 2 Quantitative Analysis of Financial Markets Hypothesis Testing and Confidence Intervals
 Week 2 Quantitative Analysis of Financial Markets Hypothesis Testing and Confidence Intervals Christopher Ting http://www.mysmu.edu/faculty/christophert/ Christopher Ting : christopherting@smu.edu.sg :
Corresponding author: Gregory C Chow,
 Co-movements of Shanghai and New York stock prices by time-varying regressions Gregory C Chow a, Changjiang Liu b, Linlin Niu b,c a Department of Economics, Fisher Hall Princeton University, Princeton,
Black Box Trend Following Lifting the Veil
 AlphaQuest CTA Research Series #1 The goal of this research series is to demystify specific black box CTA trend following strategies and to analyze their characteristics both as a stand-alone product as
Interactive Brokers Webcast. VIX Trading Strategies Russell Rhoads, CFA Senior Instructor The Options Institute CBOE
 Interactive Brokers Webcast VIX Trading Strategies Russell Rhoads, CFA Senior Instructor The Options Institute CBOE Disclosure Statement Options involve risks and are not suitable for all investors. Prior
P2.T5. Market Risk Measurement & Management. Bruce Tuckman, Fixed Income Securities, 3rd Edition
 P2.T5. Market Risk Measurement & Management Bruce Tuckman, Fixed Income Securities, 3rd Edition Bionic Turtle FRM Study Notes Reading 40 By David Harper, CFA FRM CIPM www.bionicturtle.com TUCKMAN, CHAPTER
Bitcoin Futures a trading review of Q Thejas Naval, Director of Portfolio, The Element Group
 Bitcoin Futures a trading review of Q1 2018 Thejas Naval, Director of Portfolio, The Element Group Introduction to bitcoin futures We would like to start off by explaining some of the terms used in this
GLOBAL ECONOMICS SCOTIA FLASH
 Five Takeaways From The FOMC Minutes CONTACTS There are five broad takeaways from this batch of minutes (here) to the November 7 th 8 th meeting. First, the minutes flagged a rate hike as appropriate fairly
Vanguard: The yield curve inversion and what it means for investors
 Vanguard: The yield curve inversion and what it means for investors December 3, 2018 by Joseph Davis, Ph.D. of Vanguard The U.S. economy has seen a prolonged period of growth without a recession. As the
Explaining the Last Consumption Boom-Bust Cycle in Ireland
 Public Disclosure Authorized Public Disclosure Authorized Public Disclosure Authorized Public Disclosure Authorized Policy Research Working Paper 6525 Explaining the Last Consumption Boom-Bust Cycle in
Risk and Return of Short Duration Equity Investments
 Risk and Return of Short Duration Equity Investments Georg Cejnek and Otto Randl, WU Vienna, Frontiers of Finance 2014 Conference Warwick, April 25, 2014 Outline Motivation Research Questions Preview of
Ultra High Frequency Volatility Estimation with Market Microstructure Noise. Yacine Aït-Sahalia. Per A. Mykland. Lan Zhang
 Ultra High Frequency Volatility Estimation with Market Microstructure Noise Yacine Aït-Sahalia Princeton University Per A. Mykland The University of Chicago Lan Zhang Carnegie-Mellon University 1. Introduction
Why is Investor Confidence Lagging?
 Veronica Willis Investment Strategy Analyst WEEKLY GUIDANCE ON ECONOMIC AND GEOPOLITICAL EVENTS Why is Investor Confidence Lagging? July 3, 2018 Key takeaways» Typically, late in the economic cycle, we
More than meets the eye
 Professional clients/institutional investors only. March 2018 More than meets the eye The impact of volatility on put-writing strategies is much misunderstood UBS Asset Management By: Richard Lloyd, Head
Trading Financial Market s Fractal behaviour
 Trading Financial Market s Fractal behaviour by Solon Saoulis CEO DelfiX ltd. (delfix.co.uk) Introduction In 1975, the noted mathematician Benoit Mandelbrot coined the term fractal (fragment) to define
Fiduciary Insights LEVERAGING PORTFOLIOS EFFICIENTLY
 LEVERAGING PORTFOLIOS EFFICIENTLY WHETHER TO USE LEVERAGE AND HOW BEST TO USE IT TO IMPROVE THE EFFICIENCY AND RISK-ADJUSTED RETURNS OF PORTFOLIOS ARE AMONG THE MOST RELEVANT AND LEAST UNDERSTOOD QUESTIONS
A VIX for Canada. October 14, 2010
 A VIX for Canada October 4, 00 PROPRIEARY. Permission to reprint or distribute any content from this presentation requires the written approval of Standard & Poor s. Copyright 00 Standard & Poor s Financial
On modelling of electricity spot price
 , Rüdiger Kiesel and Fred Espen Benth Institute of Energy Trading and Financial Services University of Duisburg-Essen Centre of Mathematics for Applications, University of Oslo 25. August 2010 Introduction
HOW HAS CDO MARKET PRICING CHANGED DURING THE TURMOIL? EVIDENCE FROM CDS INDEX TRANCHES
 C HOW HAS CDO MARKET PRICING CHANGED DURING THE TURMOIL? EVIDENCE FROM CDS INDEX TRANCHES The general repricing of credit risk which started in summer 7 has highlighted signifi cant problems in the valuation
The Fixed Income Valuation Course. Sanjay K. Nawalkha Gloria M. Soto Natalia A. Beliaeva
 Interest Rate Risk Modeling The Fixed Income Valuation Course Sanjay K. Nawalkha Gloria M. Soto Natalia A. Beliaeva Interest t Rate Risk Modeling : The Fixed Income Valuation Course. Sanjay K. Nawalkha,
Characteristics of the euro area business cycle in the 1990s
 Characteristics of the euro area business cycle in the 1990s As part of its monetary policy strategy, the ECB regularly monitors the development of a wide range of indicators and assesses their implications
LECTURE 11 Monetary Policy at the Zero Lower Bound: Quantitative Easing. November 2, 2016
 Economics 210c/236a Fall 2016 Christina Romer David Romer LECTURE 11 Monetary Policy at the Zero Lower Bound: Quantitative Easing November 2, 2016 I. OVERVIEW Monetary Policy at the Zero Lower Bound: Expectations
Mortgage Securities. Kyle Nagel
 September 8, 1997 Gregg Patruno Kyle Nagel 212-92-39 212-92-173 How Should Mortgage Investors Look at Actual Volatility? Interest rate volatility has been a recurring theme in the mortgage market, especially
VIX Index Strategies Shorting volatility as a portfolio enhancing strategy
 VIX Index Strategies Shorting volatility as a portfolio enhancing strategy A. Dondoni D.M. Montagna M. Maggi Universita degli Studi di Pavia, Banca IMI January 2018 Abstract In this paper we perform an
Macroeconomics. Based on the textbook by Karlin and Soskice: Macroeconomics: Institutions, Instability, and the Financial System
 Based on the textbook by Karlin and Soskice: : Institutions, Instability, and the Financial System Robert M Kunst robertkunst@univieacat University of Vienna and Institute for Advanced Studies Vienna October
14. What Use Can Be Made of the Specific FSIs?
 14. What Use Can Be Made of the Specific FSIs? Introduction 14.1 The previous chapter explained the need for FSIs and how they fit into the wider concept of macroprudential analysis. This chapter considers
Alternative VaR Models
 Alternative VaR Models Neil Roeth, Senior Risk Developer, TFG Financial Systems. 15 th July 2015 Abstract We describe a variety of VaR models in terms of their key attributes and differences, e.g., parametric
Zero Beta (Managed Account Mutual Funds/ETFs)
") 2016 Strategy Review Zero Beta (Managed Account Mutual Funds/ETFs) December 31, 2016 The following report provides in-depth analysis into the successes and challenges of the NorthCoast Zero Beta investment
2016 Strategy Review Zero Beta (Managed Account Mutual Funds/ETFs) December 31, 2016 The following report provides in-depth analysis into the successes and challenges of the NorthCoast Zero Beta investment
CEO Attributes, Compensation, and Firm Value: Evidence from a Structural Estimation. Internet Appendix
 CEO Attributes, Compensation, and Firm Value: Evidence from a Structural Estimation Internet Appendix A. Participation constraint In evaluating when the participation constraint binds, we consider three
Appendix CA-15. Central Bank of Bahrain Rulebook. Volume 1: Conventional Banks
 Appendix CA-15 Supervisory Framework for the Use of Backtesting in Conjunction with the Internal Models Approach to Market Risk Capital Requirements I. Introduction 1. This Appendix presents the framework
Calendar and Diagonal Spreads with Volatility ETPs
 Interactive Brokers Webcast Calendar and Diagonal Spreads with Volatility ETPs November 19, 2014 Presented by Russell Rhoads, CFA Disclosure Options involve risks and are not suitable for all investors.
Long-term Bond Investors Shouldn t Fear Rate Rises
 VIEWPOINT February 2018 Long-term Bond Investors Shouldn t Fear Rate Rises AUTHORS Robert Mead Managing Director Portfolio Manager It s a commonly held belief that rising interest rates are universally
Debunking Five Myths about Cash-Secured PutWrite Strategies
 Debunking Five Myths about Cash-Secured PutWrite Strategies A Cash-Secured PutWrite strategy sells a put option and fully collateralizes the option with cash or cash equivalents, i.e. the collateral balance
CB Asset Swaps and CB Options: Structure and Pricing
 CB Asset Swaps and CB Options: Structure and Pricing S. L. Chung, S.W. Lai, S.Y. Lin, G. Shyy a Department of Finance National Central University Chung-Li, Taiwan 320 Version: March 17, 2002 Key words: