An Examination of the Predictive Abilities of Economic Derivative Markets. Jennifer McCabe
|
|
|
- Lionel Davis
- 6 years ago
- Views:
Transcription
1 An Examination of the Predictive Abilities of Economic Derivative Markets Jennifer McCabe The Leonard N. Stern School of Business Glucksman Institute for Research in Securities Markets Faculty Advisor: Richard Levich April 1, 2004
2 I. Introduction In late 2002, Deutsche Bank and Goldman Sachs introduced regular auctions of economic derivatives. These options allow market participants to take positions on a variety of official macroeconomic measures, in anticipation of their scheduled announcement. The statistics covered to date include U.S. Nonfarm Payrolls, Initial Jobless Claims, the Institute for Supply Management s manufacturing index, the U.S. Retail Report, and the Eurozone Index of Consumer Prices. The auctions are conducted using a Pari-mutuel Derivatives Call Auction (PDCA) technology developed by Longitude, Inc. The auctions last for between one to two hours and are typically held the day of or one day prior to the actual data release. While the auction is in progress, investors can enter limit orders to buy or sell digital or vanilla options. The digital options offer a $1 payout per contract if the actual release is at or above (for calls) or below (for puts) the strike, while vanilla options offer a payout of $1 per point the actual release is above or below the strike. The available strikes for each auction are determined in advance by the auction sponsors (Deutsche Band and Goldman Sachs). The available strikes center around economist consensus estimates and express a range of possible outcomes for the announced figure. Using the limit orders received during the auction, the PDCA technology calculates a unique equilibrium price for the various options that will 1) maximize the premiums collected and 2) ensure that the premiums collected will equal the total amount to be paid out for any given actual release number. 1 The equilibrium price of each digital option gives an indication of the subjective probability the market assigns to that particular option expiring in the money and, 1 The process by which this unique equilibrium price is calculated is outside the scope of this paper, but is explained in detail by Baron and Lange. 1
3 thus, gives insight into what the market expects the announced figure to be. This figure is called the implied forecast. As the auction proceeds, auction participants have access to real time information displaying indicative prices and implied forecasts (final prices and implied forecasts are not displayed until the auction has concluded). These figures are updated as the auction proceeds to reflect incoming orders. For example, if an auction participant expects (with high probability) that the released number will be higher than the current implied forecast, s/he may place an order for a digital call option with a strike at or near the current implied forecast. If this order is placed at or above the current indicative price, it will result in an upward adjustment of the implied probabilities above the strike and a downward adjustment of the implied probabilities of outcomes below the strike. As a result, the implied forecast will increase, expressing the revised view of the market taking the latest order into account. Deutsche Bank makes available on its economic derivatives website ( post auction reports which summarize each auction and the final implied forecast. Appendix I contains some examples of these post auction reports. Experience with other predictive markets, such as the Iowa Electronic Markets, suggests that the implied forecasts generated by these auctions may prove to be accurate predictors of the officially announced statistics. 2 In this paper, I examine the efficacy of the economic derivatives market in predicting the announced numbers, particularly in comparison to economists consensus predictions. Specifically, I examine the following four research questions: 1) Do the auctions generate more accurate predictions than those of economists, measured on an absolute basis? 2 See Berg, Forsyth, Nelson and Rietz (2001) 2
4 2) If the auction predictions are not more accurate on an absolute basis, are they useful indicators of the surprise in a forthcoming announcement? 3) Do the auctions generate forecasts which are more or less biased than those of economists? and 4) Have the auction predictions improved over time? Unfortunately, given the short span of time the economic derivative markets have been in existence, there is limited data available and it is difficult to reach conclusions with a high degree of statistical significance. My analysis of the data suggests that the auction forecasts are no better at predicting the actual announcements than economist consensus forecasts. Nor are they useful as indicators of the direction of any potential surprise. Both processes produced forecasts which were, on average, about 0.57 standard deviations from the actual announced figure. However, there does appear to be an interesting result relating to the degree of upward bias in the two types of forecasts. While the auction and economist forecasts both tended to be overly optimistic, the auction forecasts appear to be less so. II. Data Data were collected from 56 auctions, held over the period October 2002 to March 2004 and pertain to 49 actual announcements of the following measures: ISM Manufacturing, Nonfarm Payrolls, and Retail Sales. 3 There were seven Nonfarm Payroll announcements for which auctions were held both on the day of and day prior to the announcement, resulting in the difference between the number of announcements and the number of auctions. An additional 22 auctions, covering a European inflation measure, were not included because of difficulty in obtaining economist consensus estimates for those announcements. Economist consensus 3 Auctions covering Initial Jobless Claims were introduced in February However, because there have only been three auctions on this measure to date, these auctions were not included in this study. 3
5 estimates of the remaining three measures were collected from the Bloomberg terminal, as displayed on the day of the auction. Bloomberg surveys about 50 to 60 economists on a regular basis and reports the resulting median estimate as the consensus forecast. The actual announced statistic (not including any post-announcement revisions) was also collected from the Bloomberg terminal. Table 1 summarizes the available data. A full listing of the source data used in this analysis is contained in Appendix II. Table 1: Summary Descriptive Statistics Observations Mean St. Dev. Announcements ISM Manufacturing Retail Sales Nonfarm Payroll Auction Forecasts ISM Manufacturing Retail Sales Nonfarm Payroll Economist Forecasts ISM Manufacturing Retail Sales Nonfarm Payroll Units: ISM Manufacturing - Index 0-100; Retail Sales - % Monthly Change; Nonfarm Payroll - Monthly Change in Thousands The 56 observations cover announcements of economic statistics that are measured in very different ways. The ISM number is an index, the Retail Sales figure is a percentage change, and the Nonfarm Payroll is an absolute change. Accordingly, the data must first be standardized to allow for meaningful comparison. The relevant statistics of interest, for each of the 56 observations, are the magnitudes of the Auction Forecast Errors and Consensus Forecast Errors relative to the variation of the underlying statistic. The Forecast Errors were obtained by subtracting the actual announced statistic from the auction s implied forecast or the economist consensus forecast, respectively. The Forecast Errors were then standardized by dividing the 4
6 Forecast Error by the standard deviation of the announced statistic between October 2002 and March III. Accuracy of the Predictions The accuracy of the forecasts generated by the auctions and the economist surveys can be assessed by comparing the absolute values of the Standardized Errors for each observation. The one-sided research hypothesis to be tested is that the mean absolute error generated by the auction process is less than the mean absolute error generated by economist surveys. The null hypothesis, therefore, is that the mean absolute error generated by the auction is equal to (or greater than) that generated by the survey. As can be seen from the paired t-test results summarized in Table 2, this null hypothesis cannot be rejected. Both processes produce mean absolute errors about 0.57 standard deviations from the announced statistic. Table 2: Paired T-Test Comparing Mean Absolute Auction Forecast Error with Mean Absolute Consensus Forecast Error Observations Mean Standard Deviation Standard Error of Mean Auction Consensus Difference T-Test of mean difference = 0 (vs > 0): T-Value = P-Value = Similar results are obtained when this test is conducted separately for each economic statistic. The auction and consensus forecasts each generated mean absolute errors of about 0.21 for ISM releases, 0.76 for Nonfarm Payroll releases, and 0.62 for Retail Sales releases. IV. Predictions of the Surprise Although the auction forecasts do not appear from these data to provide a more accurate prediction of the announced statistics than consensus forecasts, an interesting question is whether the auctions provide an indication of the direction of the surprise element contained in the 4 This method of standardization follows that used by Balduzzi et al. (2001) and Andersen et al (2003) to measure the surprise element in macroeconomic news announcements. 5
7 announcement. The surprise element is typically measured as the difference between the announced figure and the consensus estimate. If the auction forecast tended to be above (below) the consensus estimate whenever the actual figure was also above (below) the consensus figure, the auction could prove to be an important indicator of the direction of the coming surprise, if not the magnitude. However, it turned out that the auction accurately predicted the sign of the surprise for only 31 of the 56 auctions, in line with what would be expected to occur by random chance. As is the case with the accuracy of predictions, this result is consistent across all types of data releases. The practice of measuring the surprise element in a news announcement in this fashion (i.e., as the difference between the announced figure and the consensus estimate) has been the norm in large part because there has been no other way to measure the market s expectation for the announced figure. For this reason, much of the research measuring the impact of news announcements on financial markets (e.g., Balduzzi et al. (2001) on bond markets and Andersen et al. (2003) on foreign exchange markets) measures the correlation between the market reaction and the surprise as measured by economist forecasts. However, the introduction of the economic derivative auctions presents an alternative measure of market expectations. It may be interesting to revisit the work of Balduzzi et al. and Andersen et al., measuring the surprise component as the difference between the auction forecast and the announced figure and see whether this measure of surprise does a better or worse job of predicting the actual market impact of the news announcement. Such a question is beyond the scope of this paper, but is highlighted as a potential area for future research. 6
8 V. Bias in the Predictions In a study of the accuracy of economists consensus estimates for major monthly news announcement, Moersch (2001) concluded that, although the forecasts tended to be fairly accurate, they frequently contained an element of upward bias. Moersch finds this to be consistent with earlier studies of long-term forecasts, which attribute bias to strategic behavior of forecasters such as a reluctance to adjust predictions in light of new information for fear that sharp adjustments might call into question a forecaster s original estimates and damage his/her standing with clients. 5 Bias is evident in a given forecasting process to the extent that the mean forecast errors deviate from zero. Figures 1 and 2, shown below, contain histograms and descriptive statistics of the standardized forecast errors generated by the auctions and by the economists estimates, respectively. Figure 1: Standardized Auction Forecast Errors Descriptive Statistics Standardized Auction Forecast Errors Mean StDev Variance Skewness Kurtosis N Minimum 1st Quartile Median 3rd Quartile Maximum % Confidence Interval for Mu 95% Confidence Interval for Mu % Confidence Interval for Median 95% Confidence Interval for Median See, e.g., Laster et al. (1999) and Ehrback and Waldmann (1996) 7
9 Figure 2: Standardized Consensus Forecast Errors Descriptive Statistics Standardized Consensus Forecast Errors Mean StDev Variance Skewness Kurtosis N Minimum 1st Quartile Median 3rd Quartile Maximum % Confidence Interval for Mu 95% Confidence Interval for Mu % Confidence Interval for Median 95% Confidence Interval for Median At first glance both distributions appear centered near zero, as would be expected. However, the consensus forecast errors demonstrate a more pronounced skew to the right than the auction forecast errors (skewness measures of 0.93 and 0.84, respectively). In addition, the mean forecast error generated by the auction process is nearly 25% closer to zero than that generated by the consensus estimates. The 95% confidence intervals for the true mean forecast errors generated under each process allow one to conclude that the consensus predictions are upwardly biased (i.e., significantly greater than zero), but the same cannot be said for the auction (because the confidence interval includes zero). A more rigorous test of whether the auction forecast errors are systematically less optimistic than the consensus estimates can be conducted using a paired t-test. Such a test, summarized in Table 3, below, is borderline significant at the 5% level. Although the auctions 8
10 may result in less of an upward bias, further data would need to be examined in order make a conclusive determination. Table 3: Paired T-Test Comparing the Mean Auction Forecast Error with the Mean Consensus Forecast Error Observations Mean Standard Deviation Standard Error of Mean Auction Consensus Difference T-Test of mean difference = 0 (vs < 0): T-Value = P-Value = Interestingly, similar analyses conducted for each of the three types of data announcements reveal varied distribution patterns for each type of announcement. Neither the consensus estimates nor the auction predictions for ISM announcements generate mean forecast errors significantly different from zero, but a test of whether the auction forecasts are less pessimistic than consensus estimates is significant at the 5% level. Mean forecast errors for Retail Sales announcements were also not significantly different from zero (for either process) and, for these announcements, a test of whether the auctions were more pessimistic was not quite significant at the 5% level. Payroll forecast errors, on the other hand, were significantly greater than zero for both processes, but the auction and consensus estimates were both equally optimistic. VI. Improvement over Time The final question to be addressed is whether auction participants learn from prior auctions with the result that, over time, the auction forecasts do a better job of predicting the announcements. To address this question, I first examined a plot of the auction forecast errors 9
11 against a chronological ordering of the auctions (shown below in Figure 3) to determine if there was a pattern over time. 6 Figure 3: Time series plot of auction forecast errors 3 Auction Forecast Error Auction Number If the forecasts are becoming more accurate over time, there should be a reduction in the variance in auction forecast errors for later auctions. To test whether this is the case, I divided the auctions into two groups the earlier half and the later half and conducted a variance ratio test to determine whether the two groups exhibit non-constant variance. The F-statistic for this test is with a tail probability of 0.047, suggesting that the variance may be decreasing over time. To determine whether this result holds for auction forecasts of all three economic measures, I repeated the test for ISM auctions, Nonfarm Payroll auctions, and Retail Sales 6 Note that, for the seven Nonfarm payroll announcements with two associated auctions, I used only the earlier of the two auctions in this analysis, as the earlier auction forecasts are more directly comparable with the announcements for which there was only one auction. 10
12 auctions separately. It appears that the overall reduction in variance is driven solely by a reduction in the variance of Retail Sales forecast errors. To further analyze the improvement over time, I conducted a regression to see whether the absolute value of the standardized auction forecast error is related to the chronological auction number, using the equation Error ( t ) t, where t = the chronological auction number. This analysis was conducted for the combined sample and for each of the individual types of announcements. The regressions were not significant for the combined sample or for the ISM and Nonfarm Payroll auctions, yielding F-statistics ranging from 0.03 to 0.61 (with associated tail probabilities of 0.87 to 0.44). Once again, however, Retail Sales auctions did demonstrate improvement. The regression for Retail Sales provided the results summarized in Table 4, below. For Retail Sales, it appears that each new auction is associated with a reduction in the absolute value of the forecast error of about 0.05 standard deviations. Table 4: Regression of Retail Sales Absolute Forecast Errors vs Auction Number Standard Error Coefficient of Coefficient T-Statistic Tail Probability Constant Auction Number Adjusted R 2 = 27.7%, F-statistic = 6.73 with tail probability of It is unclear why Retail Sales would be the only economic measure with a demonstrated improvement in auction forecast errors over time. It is not the least volatile of the measures under consideration here ISM manufacturing announcements exhibit a much smaller standard deviation relative to its mean. There also does not appear to have been a predictable trend in the Retail Sales announcements over the period in question that might explain the improvements. Perhaps the improvement in Retail Sales forecasts over time is related to its position in the monthly cycle of data releases. In a study of the impact of macroeconomic announcements on foreign exchange markets, Andersen et al (2003) found that releases which occur earlier in the 11
13 month tend to have a greater impact on markets than those that occur later in the month, presumably because later releases contain little new information. In keeping with those findings, we might expect to see auctions for Retail Sales releases, which take place later in the month, generate more accurate predictions than those for Nonfarm Payrolls, which take place about a week earlier, and for the ISM index, which typically occurs the first or second day of the month. Notwithstanding the improvement in Retail Sales predictions over time, however, this does not appear to be the case. As noted in section III, above, ISM auctions generated the smallest mean absolute errors (0.21), followed by Retail Sales auctions (0.62) and, finally, by Nonfarm Payrolls (0.76). A likely explanation for this unexpected result might be the impact of the so-called jobless recovery coming out of the 2001 recession. Nonfarm Payroll auction participants may have made overly optimistic predictions after receiving good news about the expanding economy. VII. Conclusion The analysis in this paper showed that, on average, the implied market forecasts from the auctions were not significantly different than economists consensus forecasts, and the auction predictions did not embody expertise in judging the surprise in the forthcoming announcement. However, the data do seem to support a finding that the auctions produce less overly optimistic forecasts than economist consensus estimates. It appears that market participants are more cautious when money is at risk than economists are when their reputation is at risk. Finally, with the possible exception of Retail Sales announcements, the accuracy of the auction forecasts does not appear to have improved with time. 12
14 References Andersen, Torben G.; Bollerslev, Tim; Diebold, Francis X.; and Vega, Clara. Micro Effects of Macro Announcements: Real-Time Price Discovery in Foreign Exchange. The American Economic Review, March 2003, Vol. 93 No. 1, pp Balduzzi, Pierluigi; Elton, Edwin J; and Green, T Clifton. Economic News and Bond Prices: Evidence from the U.S. Treasury Market. Journal of Financial and Quantitative Analysis. December 2001, Vol. 36 No. 4, pp Berg, Joyce; Forsythe, Robert; Nelson, Forrest; Rietz, Thomas. Results from a Dozen Years of Election Futures Markets Research. Working Paper, The University of Iowa, Ehrbeck, Tilman; and Waldmann, Robert. Why are Professional Forecasters Biased? Agency versus Behavioral Explanations. Quarterly Journal of Economics. February 1996, Vol. 111, No. 1, pp Laster, David; Bennet, Paul; Geoum, In Sun. Rational Bias in Macroeconomic Forecasts. The Quarterly Journal of Economics. February 1999, Vol. 114 No.1, pp Moersch, Mathias. Predicting Market Movers: A Closer Look at Consensus Estimates. Business Economics. April 2001, Vol. 36 No. 2, pp
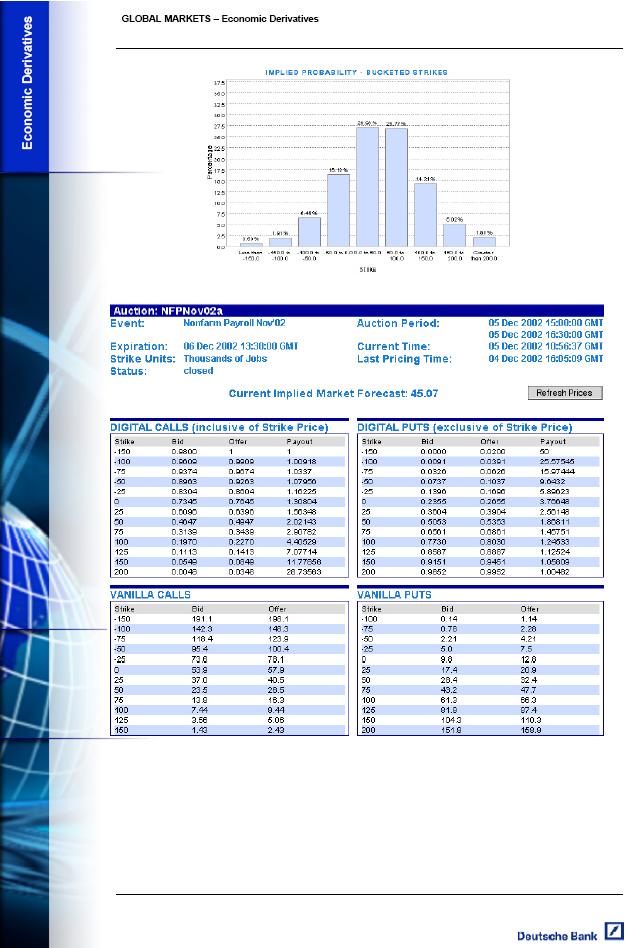
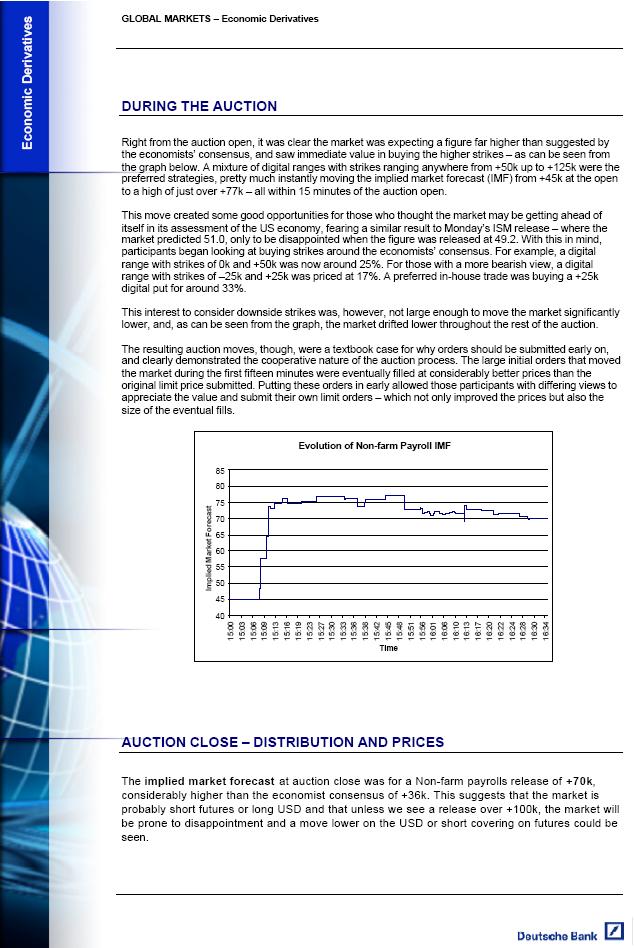
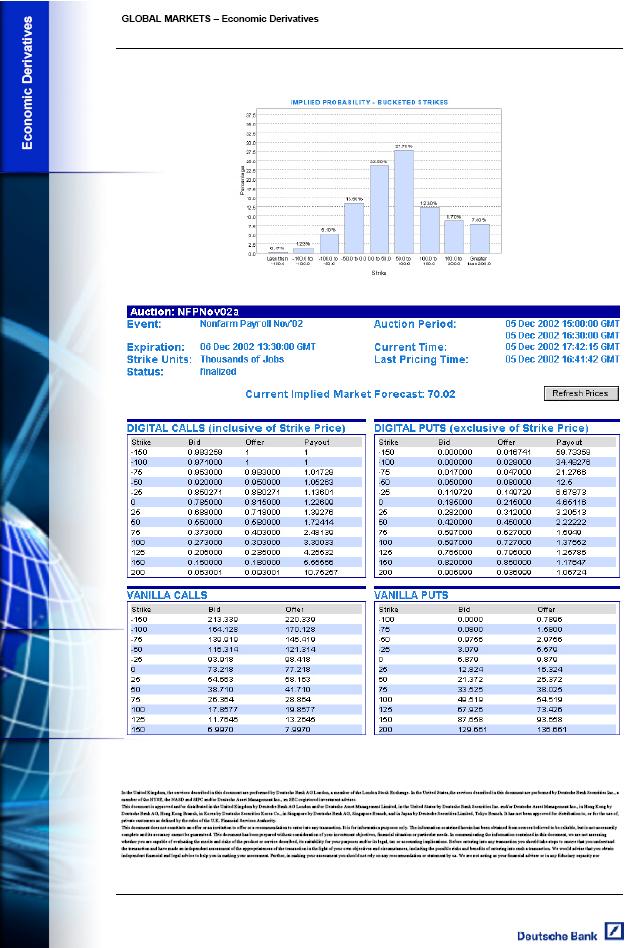
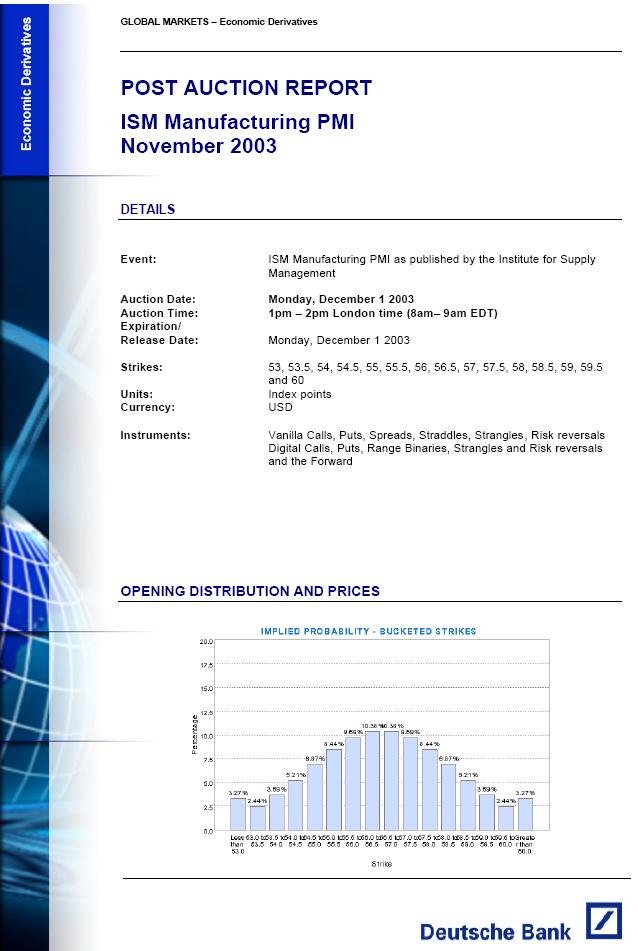
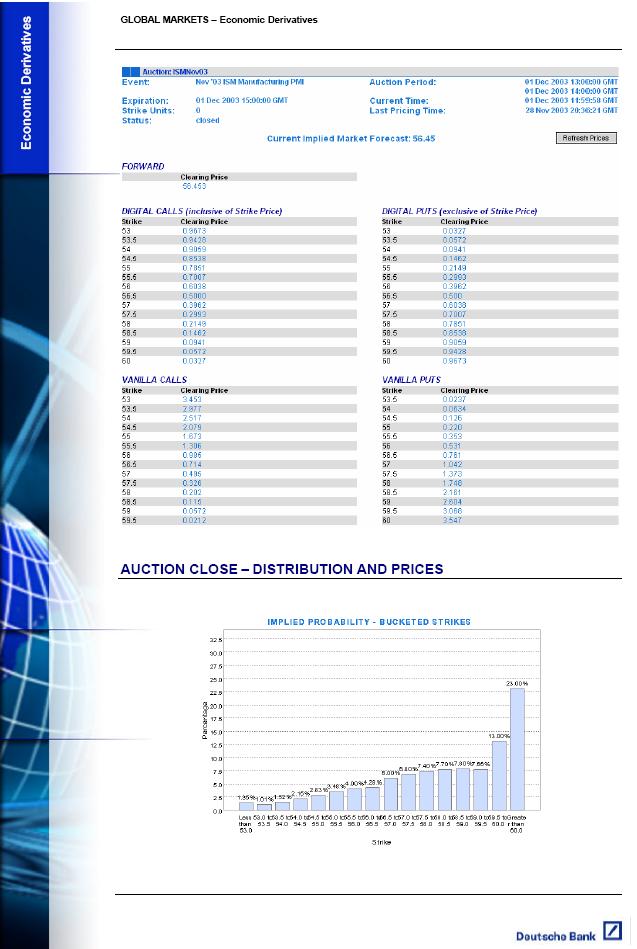
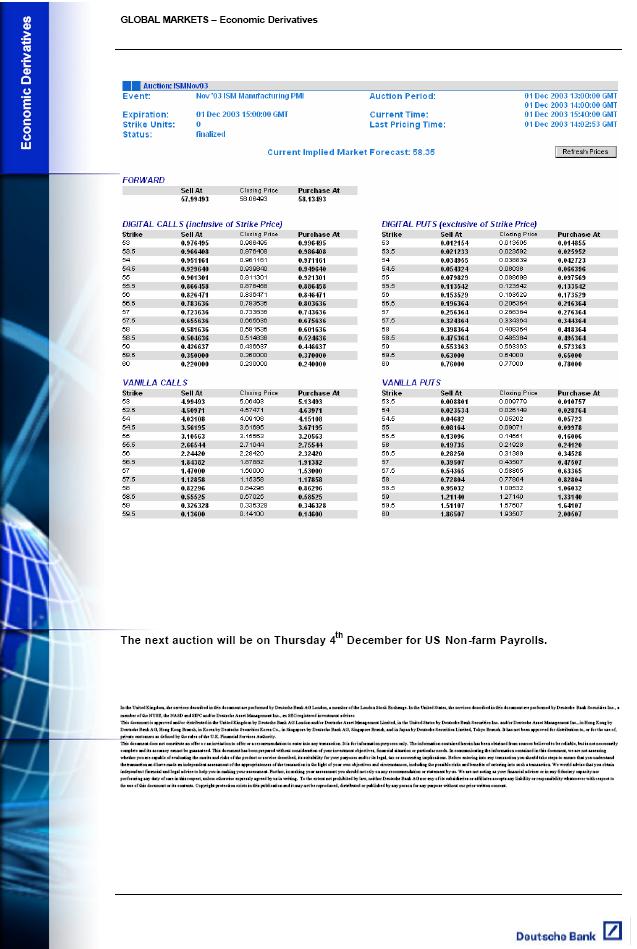
15 Appendix I Sample Post Auction Reports (a) Post Auction Report. Change in US Non-farm Payrolls, November 2002 Report The first graph shows implied probabilities that are fairly symmetric based on opening prices. The second graph shows the evolution of the implied market forecast over the auction period with a sharp change in the implied forecast around 3:00 PM. The third graph shows the revised implied probabilities based on the closing option prices. (b) Post Auction Report. ISM Manufacturing PMI, November 2003 The first graph shows implied probabilities based on opening prices. Note the symmetry in the graph and upturn for extreme high and low values. The second graph shows the revised implied probabilities based on closing option prices. These revised probabilities differ considerably from the first graph. 14
16 15
17 16
18 17
19 18
20 19
21 20
22 21
23 Appendix II Data Economist Consensus Forecast Actual Announcement Event Release Period Release Date Auction Date Auction Implied Market Forecast ISM Oct-02 11/1/ /31/ ISM Nov-02 12/2/ /2/ ISM Jan-03 2/3/2003 1/31/ ISM Feb-03 3/3/2003 2/28/ ISM Mar-03 4/1/2003 3/31/ ISM Apr-03 5/1/2003 4/30/ ISM May-03 6/2/2003 5/30/ ISM Jun-03 7/1/2003 7/1/ ISM Jul-03 8/1/2003 7/31/ ISM Aug-03 9/2/2003 9/2/ ISM Sep-03 10/1/ /1/ ISM Oct-03 11/3/ /2/ ISM Nov-03 12/1/ /1/ ISM Jan-04 2/2/2004 2/2/ ISM Feb-04 3/1/2004 3/1/ Retail Sales Oct-02 11/14/ /13/ Retail Sales Nov-02 12/12/ /11/ Retail Sales Dec-02 1/14/2003 1/13/ Retail Sales Jan-03 2/13/2003 2/12/ Retail Sales Feb-03 3/13/2003 3/12/ Retail Sales Mar-03 4/11/2003 4/10/ Retail Sales Apr-03 5/14/2003 5/13/ Retail Sales May-03 6/12/2003 6/11/ Retail Sales Jun-03 7/15/2003 7/14/ Retail Sales Jul-03 8/13/2003 8/12/ Retail Sales Aug-03 9/12/2003 9/12/ Retail Sales Sep-03 10/15/ /15/ Retail Sales Oct-03 11/14/ /14/ Retail Sales Nov-03 12/11/ /11/ Retail Sales Dec-03 1/15/2004 1/15/ Retail Sales Jan-04 2/12/2004 2/12/ Nonfarm Payroll Sep-02 10/4/ /1/ Nonfarm Payroll Sep-02 10/4/ /3/ Nonfarm Payroll Oct-02 11/1/ /29/ Nonfarm Payroll Oct-02 11/1/ /31/ Nonfarm Payroll Nov-02 12/6/ /5/ Nonfarm Payroll Dec-02 1/10/2003 1/9/ Nonfarm Payroll Jan-03 2/7/2003 2/6/ Nonfarm Payroll Feb-03 3/7/2003 3/6/ Nonfarm Payroll Mar-03 4/3/2003 4/3/ Nonfarm Payroll Apr-03 5/2/2003 5/1/ Nonfarm Payroll May-03 6/6/2003 6/5/ Nonfarm Payroll Jun-03 7/3/2003 7/2/ Nonfarm Payroll Jul-03 8/1/2003 7/31/ Nonfarm Payroll Aug-03 9/5/2003 9/4/ Nonfarm Payroll Sep-03 10/3/ /3/ Nonfarm Payroll Sep-03 10/3/ /2/ Nonfarm Payroll Oct-03 11/7/ /6/ Nonfarm Payroll Oct-03 11/7/ /7/ Nonfarm Payroll Nov-03 12/5/ /4/ Nonfarm Payroll Nov-03 12/5/ /5/ Nonfarm Payroll Dec-03 1/9/2004 1/8/ Nonfarm Payroll Dec-03 1/9/2004 1/9/ Nonfarm Payroll Jan-04 2/6/2004 2/5/ Nonfarm Payroll Jan-04 2/6/2004 2/6/ Nonfarm Payroll Feb-04 3/6/2004 3/6/
Federal Reserve Policy s Impact On Economic Releases
 Whitepaper No. 16003 Federal Reserve Policy s Impact On Economic Releases April 29, 2016 Ryan J. Coughlin, Gail Werner-Robertson Fellow Faculty Mentor: Dr. Ernest Goss Executive summary Financial analysts,
Federal Reserve Policy and the Intraday Impact of Economic Releases on US Equity Markets:
 Whitepaper No. 16505 Federal Reserve Policy and the Intraday Impact of Economic Releases on US Equity Markets: 2000-2015 November 22, 2016 Ryan Coughlin, Gail Werner-Robertson Fellow Faculty Mentor: Dr.
Federal Reserve Policy and the Intraday Impact of Economic Releases On the U.S. Equity Markets:
 Federal Reserve Policy and the Intraday Impact of Economic Releases On the U.S. Equity Markets: 2000-2015 Ryan Coughlin Gail Werner Robertson Scholar Institute for Economic Inquiry Creighton University
A Multi-perspective Assessment of Implied Volatility. Using S&P 100 and NASDAQ Index Options. The Leonard N. Stern School of Business
 A Multi-perspective Assessment of Implied Volatility Using S&P 100 and NASDAQ Index Options The Leonard N. Stern School of Business Glucksman Institute for Research in Securities Markets Faculty Advisor:
Manager Comparison Report June 28, Report Created on: July 25, 2013
 Manager Comparison Report June 28, 213 Report Created on: July 25, 213 Page 1 of 14 Performance Evaluation Manager Performance Growth of $1 Cumulative Performance & Monthly s 3748 3578 348 3238 368 2898
SYSTEMATIC GLOBAL MACRO ( CTAs ):
:") G R A H M C A P I T A L M A N G E M N T G R A H A M C A P I T A L M A N A G E M E N T GC SYSTEMATIC GLOBAL MACRO ( CTAs ): PERFORMANCE, RISK, AND CORRELATION CHARACTERISTICS ROBERT E. MURRAY, CHIEF OPERATING
G R A H M C A P I T A L M A N G E M N T G R A H A M C A P I T A L M A N A G E M E N T GC SYSTEMATIC GLOBAL MACRO ( CTAs ): PERFORMANCE, RISK, AND CORRELATION CHARACTERISTICS ROBERT E. MURRAY, CHIEF OPERATING
Macroeconomic announcements and implied volatilities in swaption markets 1
 Fabio Fornari +41 61 28 846 fabio.fornari @bis.org Macroeconomic announcements and implied volatilities in swaption markets 1 Some of the sharpest movements in the major swap markets take place during
Security Analysis: Performance
 Security Analysis: Performance Independent Variable: 1 Yr. Mean ROR: 8.72% STD: 16.76% Time Horizon: 2/1993-6/2003 Holding Period: 12 months Risk-free ROR: 1.53% Ticker Name Beta Alpha Correlation Sharpe
Macroeconomic surprise, forecast uncertainty, and stock prices
 University of Richmond UR Scholarship Repository Honors Theses Student Research 2014 Macroeconomic surprise, forecast uncertainty, and stock prices Alphonce M. Mshomba Follow this and additional works
1. What is Implied Volatility?
 Numerical Methods FEQA MSc Lectures, Spring Term 2 Data Modelling Module Lecture 2 Implied Volatility Professor Carol Alexander Spring Term 2 1 1. What is Implied Volatility? Implied volatility is: the
Portfolio Peer Review
 Portfolio Peer Review Performance Report Example Portfolio Example Entry www.suggestus.com Contents Welcome... 3 Portfolio Information... 3 Report Summary... 4 Performance Grade (Period Ended Dec 17)...
Sensex Realized Volatility Index (REALVOL)
") Sensex Realized Volatility Index (REALVOL) Introduction Volatility modelling has traditionally relied on complex econometric procedures in order to accommodate the inherent latent character of volatility.
Sensex Realized Volatility Index (REALVOL) Introduction Volatility modelling has traditionally relied on complex econometric procedures in order to accommodate the inherent latent character of volatility.
A COMPLETE STUDY OF THE HISTORICAL RELATIONSHIP BETWEEN INTEREST RATE CYCLES AND MLP RETURNS
 A COMPLETE STUDY OF THE HISTORICAL RELATIONSHIP BETWEEN INTEREST RATE CYCLES AND MLP RETURNS 405 Park Avenue, 9 th Floor New York, NY 10022 Phone. 212-755-1970 Fax. 212-317-8125 Toll Free. 877-317-8128
FEDERAL RESERVE BANK OF MINNEAPOLIS BANKING AND POLICY STUDIES
 FEDERAL RESERVE BANK OF MINNEAPOLIS BANKING AND POLICY STUDIES Minneapolis Options Report October 3 rd Risk neutral expectations for inflation continue to fall. Bank and Insurance company share prices
Journal Of Financial And Strategic Decisions Volume 10 Number 2 Summer 1997 AN ANALYSIS OF VALUE LINE S ABILITY TO FORECAST LONG-RUN RETURNS
 Journal Of Financial And Strategic Decisions Volume 10 Number 2 Summer 1997 AN ANALYSIS OF VALUE LINE S ABILITY TO FORECAST LONG-RUN RETURNS Gary A. Benesh * and Steven B. Perfect * Abstract Value Line
VIX ETPs, Inter-Relationships between Volatility Markets and Implications for Investors and Traders
 Not a Product of Research / Not for Retail Distribution Citi Equities I U.S. Equity Trading Strategy VIX ETPs, Inter-Relationships between Volatility Markets and Implications for Investors and Traders
Macroeconomic Announcements and Investor Beliefs at The Zero Lower Bound
 Macroeconomic Announcements and Investor Beliefs at The Zero Lower Bound Ben Carlston Marcelo Ochoa [Preliminary and Incomplete] Abstract This paper examines empirically the effect of the zero lower bound
Dividend Growth as a Defensive Equity Strategy August 24, 2012
 Dividend Growth as a Defensive Equity Strategy August 24, 2012 Introduction: The Case for Defensive Equity Strategies Most institutional investment committees meet three to four times per year to review
ACTUARIAL HIGHLIGHTS NEW BRUNSWICK RISK SHARING POOL APRIL 2014 OPERATIONAL REPORT
 NEW BRUNSWICK RISK SHARING POOL APRIL 2014 OPERATIONAL REPORT ACTUARIAL HIGHLIGHTS Related Bulletin: F14-033 New Brunswick RSP April 2014 Operational Report For your convenience, bookmarks have been added
TITLE: EVALUATION OF OPTIMUM REGRET DECISIONS IN CROP SELLING 1
 TITLE: EVALUATION OF OPTIMUM REGRET DECISIONS IN CROP SELLING 1 AUTHORS: Lynn Lutgen 2, Univ. of Nebraska, 217 Filley Hall, Lincoln, NE 68583-0922 Glenn A. Helmers 2, Univ. of Nebraska, 205B Filley Hall,
Economics and Politics Research Group CERME-CIEF-LAPCIPP-MESP Working Paper Series ISBN:
 ! University of Brasilia! Economics and Politics Research Group A CNPq-Brazil Research Group http://www.econpolrg.wordpress.com Research Center on Economics and Finance CIEF Research Center on Market Regulation
Nonfarm Payroll Employment
 PRESIDENT'S REPORT TO THE BOARD OF DIRECTORS, FEDERAL RESERVE BANK OF BOSTON Current Economic Developments - June 10, 2004 Data released since your last Directors' meeting show the economy continues to
International Financial Markets Prices and Policies. Second Edition Richard M. Levich. Overview. ❿ Measuring Economic Exposure to FX Risk
 International Financial Markets Prices and Policies Second Edition 2001 Richard M. Levich 16C Measuring and Managing the Risk in International Financial Positions Chap 16C, p. 1 Overview ❿ Measuring Economic
Do Management Buyouts of US Companies Demand Higher Premiums than UK Companies? Why?
 Do Management Buyouts of US Companies Demand Higher Premiums than UK Companies? Why? Harsh Nanda The Leonard N. Stern School of Business Glucksman Institute for Research in Securities Markets Faculty Advisor:
May Economic Activity Index ( FAFAA-EAI )
") May 2016 Economic Activity Index ( FAFAA-EAI ) About the interpretation of the FAFAA-EAI The FAFAA-EAI is an indicator of general economic activity, not a direct measurement of real GNP. The annual growth
May 2016 Economic Activity Index ( FAFAA-EAI ) About the interpretation of the FAFAA-EAI The FAFAA-EAI is an indicator of general economic activity, not a direct measurement of real GNP. The annual growth
February Economic Activity Index ( GDB-EAI )
") February 2014 Economic Activity Index ( GDB-EAI ) General Commentary February 2014 In February 2014, the GDB-EAI registered a 2.4% year-over-year (y-o-y) reduction (the lowest since May 2013), after showing
February 2014 Economic Activity Index ( GDB-EAI ) General Commentary February 2014 In February 2014, the GDB-EAI registered a 2.4% year-over-year (y-o-y) reduction (the lowest since May 2013), after showing
REAL EARNINGS DECEMBER 2018
 Transmission of material in this release is embargoed until 8:30 a.m. (EST), Friday, January 11, 2019 USDL-19-0019 Technical Information: (202) 691-6555 cesinfo@bls.gov www.bls.gov/ces Media Contact: (202)
XML Publisher Balance Sheet Vision Operations (USA) Feb-02
 Feb-02") Page:1 Apr-01 May-01 Jun-01 Jul-01 ASSETS Current Assets Cash and Short Term Investments 15,862,304 51,998,607 9,198,226 Accounts Receivable - Net of Allowance 2,560,786
Page:1 Apr-01 May-01 Jun-01 Jul-01 ASSETS Current Assets Cash and Short Term Investments 15,862,304 51,998,607 9,198,226 Accounts Receivable - Net of Allowance 2,560,786
ESTIMATION OF A BENCHMARK CERTIFICATE OF DEPOSIT (CD) CURVE
 CURVE") 1.1. Introduction: Certificate of Deposits are issued by Banks for raising short term finance from the market. As the banks have generally higher ratings (specifically short term rating because of availability
1.1. Introduction: Certificate of Deposits are issued by Banks for raising short term finance from the market. As the banks have generally higher ratings (specifically short term rating because of availability
REAL EARNINGS AUGUST 2018
 Transmission of material in this release is embargoed until 8:30 a.m. (EDT), Thursday, September 13, 2018 USDL-18-1454 Technical Information: (202) 691-6555 cesinfo@bls.gov www.bls.gov/ces Media Contact:
A STUDY ON EQUITY ANALYSIS OF SELECTED FMCG COMPANIES LISTED ON NSE
 A STUDY ON EQUITY ANALYSIS OF SELECTED FMCG COMPANIES LISTED ON NSE S.DHARCHANA 1, DR.P.KANCHANA DEVI 2 1 ASSISTANT PROFESSOR, DEPARTMENT OF B.COM (A&F), PSGR KRISHNAMMAL COLLGE FOR WOMEN, COIMBATORE,
What are the Essential Features of a Good Economic Scenario Generator? AFIR Munich September 11, 2009
 What are the Essential Features of a Good Economic Scenario Generator? Hal Pedersen (University of Manitoba) with Joe Fairchild (University of Kansas), Chris K. Madsen (AEGON N.V.), Richard Urbach (DFA
When determining but for sales in a commercial damages case,
 JULY/AUGUST 2010 L I T I G A T I O N S U P P O R T Choosing a Sales Forecasting Model: A Trial and Error Process By Mark G. Filler, CPA/ABV, CBA, AM, CVA When determining but for sales in a commercial
REAL EARNINGS JUNE 2018
 Transmission of material in this release is embargoed until 8:30 a.m. (EDT), Thursday, July 12, 2018 USDL-18-1144 Technical Information: (202) 691-6555 cesinfo@bls.gov www.bls.gov/ces Media Contact: (202)
Spheria Australian Smaller Companies Fund
 29-Jun-18 $ 2.7686 $ 2.7603 $ 2.7520 28-Jun-18 $ 2.7764 $ 2.7681 $ 2.7598 27-Jun-18 $ 2.7804 $ 2.7721 $ 2.7638 26-Jun-18 $ 2.7857 $ 2.7774 $ 2.7690 25-Jun-18 $ 2.7931 $ 2.7848 $ 2.7764 22-Jun-18 $ 2.7771
FUND OF HEDGE FUNDS DO THEY REALLY ADD VALUE?
 FUND OF HEDGE FUNDS DO THEY REALLY ADD VALUE? Florian Albrecht, Jean-Francois Bacmann, Pierre Jeanneret & Stefan Scholz, RMF Investment Management Man Investments Hedge funds have attracted significant
Regression Analysis and Quantitative Trading Strategies. χtrading Butterfly Spread Strategy
 Regression Analysis and Quantitative Trading Strategies χtrading Butterfly Spread Strategy Michael Beven June 3, 2016 University of Chicago Financial Mathematics 1 / 25 Overview 1 Strategy 2 Construction
A Comparative Study of Various Forecasting Techniques in Predicting. BSE S&P Sensex
 NavaJyoti, International Journal of Multi-Disciplinary Research Volume 1, Issue 1, August 2016 A Comparative Study of Various Forecasting Techniques in Predicting BSE S&P Sensex Dr. Jahnavi M 1 Assistant
STX FACULTY WORKING! PAPER NO An Error-Learning Model of Treasury Bill Future* and Implications for the Expectation Hypothesis. nun.
 330 3385 1020 COPY 2 STX FACULTY WORKING! PAPER NO. 1020 An Error-Learning Model of Treasury Bill Future* and Implications for the Expectation Hypothesis nun PiS fit &* 01*" srissf College of Commerce
1. (35 points) Assume a farmer derives utility from Income in the following manner
 Assume a farmer derives utility from Income in the following manner") Exam 3 AGEC 421 Advanced Agricultural Marketing Spring 2012 Instructor: Eric Belasco Name Belasco Key 1. (35 points) Assume a farmer derives utility from Income in the following manner where is income
Exam 3 AGEC 421 Advanced Agricultural Marketing Spring 2012 Instructor: Eric Belasco Name Belasco Key 1. (35 points) Assume a farmer derives utility from Income in the following manner where is income
Ho Ho Quantitative Portfolio Manager, CalPERS
 Portfolio Construction and Risk Management under Non-Normality Fiduciary Investors Symposium, Beijing - China October 23 rd 26 th, 2011 Ho Ho Quantitative Portfolio Manager, CalPERS The views expressed
15 Years of the Russell 2000 Buy Write
 15 Years of the Russell 2000 Buy Write September 15, 2011 Nikunj Kapadia 1 and Edward Szado 2, CFA CISDM gratefully acknowledges research support provided by the Options Industry Council. Research results,
Statistical Models of Stocks and Bonds. Zachary D Easterling: Department of Economics. The University of Akron
 Statistical Models of Stocks and Bonds Zachary D Easterling: Department of Economics The University of Akron Abstract One of the key ideas in monetary economics is that the prices of investments tend to
ANOMALOUS BEHAVIOR OF THE VOLATILITY OF DJIA OVER THE LAST CENTURY
 ANOMALOUS BEHAVIOR OF THE VOLATILITY OF DJIA OVER THE LAST CENTURY Shaikh A. Hamid* Associate Professor School of Business Southern New Hampshire University Tej S. Dhakar Associate Professor School of
U.S. Wage Growth: Highest Since Dec-10 Jul-11. Jan-08 Jul-08. Jul-11 Jan-12. Jan-13. Jan-15. Jan-16. Jan-18. Jan-17. Jul-13. Jul-12.
 WEEKLY GUIDANCE ON ECONOMIC AND GEOPOLITICAL EVENTS Surprise! Inflation? March 6, 2018 Peter Donisanu Investment Strategy Analyst Key takeaways» Last month s sell-off in global equities was arguably triggered
Division of Bond Finance Interest Rate Calculations. Revenue Estimating Conference Interest Rates Used for Appropriations, including PECO Bond Rates
 Division of Bond Finance Interest Rate Calculations Revenue Estimating Conference Interest Rates Used for Appropriations, including PECO Bond Rates November 16, 2018 Division of Bond Finance Calculation
2012 Review and Outlook: Plus ça change... BY JASON M. THOMAS
 Economic Outlook 2012 Review and Outlook: Plus ça change... September 10, 2012 BY JASON M. THOMAS Over the past several years, central banks have taken unprecedented actions to suppress both short-andlong-term
June Economic Activity Index ( GDB-EAI )
") June 2014 Economic Activity Index ( GDB-EAI ) General Commentary June 2014 In June 2014, the GDB-EAI registered a 1.0% year-over-year (y-o-y) reduction, after showing a 1.1% y-o-y decrease in June 2014.
June 2014 Economic Activity Index ( GDB-EAI ) General Commentary June 2014 In June 2014, the GDB-EAI registered a 1.0% year-over-year (y-o-y) reduction, after showing a 1.1% y-o-y decrease in June 2014.
MARKET ANALYSIS REPORT NO 1 OF 2015: ONION
 MARKET ANALYSIS REPORT NO 1 OF 215: ONION 1. INTRODUCTION The purpose of this text is to analyze the onion marketing environment. This analysis will be updated on a quarterly basis. The interval covered
Heterogeneity in Returns to Wealth and the Measurement of Wealth Inequality 1
 Heterogeneity in Returns to Wealth and the Measurement of Wealth Inequality 1 Andreas Fagereng (Statistics Norway) Luigi Guiso (EIEF) Davide Malacrino (Stanford University) Luigi Pistaferri (Stanford University
Notes on a California Perspective of the Dairy Margin Protection Program (DMPP)
") Notes on a California Perspective of the Dairy Margin Protection Program (DMPP) Leslie J. Butler Department of Agricultural & Resource Economics University of California-Davis If I were a California dairy
Notes on a California Perspective of the Dairy Margin Protection Program (DMPP) Leslie J. Butler Department of Agricultural & Resource Economics University of California-Davis If I were a California dairy
UNIVERSITY OF CALIFORNIA Economics 134 DEPARTMENT OF ECONOMICS Spring 2018 Professor Christina Romer LECTURE 16
 UNIVERSITY OF CALIFORNIA Economics 134 DEPARTMENT OF ECONOMICS Spring 2018 Professor Christina Romer LECTURE 16 FISCAL POLICY IN THE GREAT RECESSION MARCH 19, 2018 I. OVERVIEW II. ECONOMIC STIMULUS ACT
Journal Of Financial And Strategic Decisions Volume 7 Number 2 Summer 1994 INTEREST RATE PARITY IN TIMES OF TURBULENCE: THE ISSUE REVISITED
 Journal Of Financial And Strategic Decisions Volume 7 Number 2 Summer 1994 INTEREST RATE PARITY IN TIMES OF TURBULENCE: THE ISSUE REVISITED Nada Boulos * and Peggy E. Swanson * Abstract Empirical studies
High Dividend Stocks In Rising Interest Rate Environments
 High Dividend Stocks In Rising Interest Rate Environments July 2016 Disclosure: This research is provided for educational purposes only and is not intended to provide investment or tax advice. All numbers
The Risk Considerations Unique to Hedge Funds
 EDHEC RISK AND ASSET MANAGEMENT RESEARCH CENTRE 393-400 promenade des Anglais 06202 Nice Cedex 3 Tel.: +33 (0)4 93 18 32 53 E-mail: research@edhec-risk.com Web: www.edhec-risk.com The Risk Considerations
Integrated Cost Schedule Risk Analysis Using the Risk Driver Approach
 Integrated Cost Schedule Risk Analysis Using the Risk Driver Approach Qatar PMI Meeting February 19, 2014 David T. Hulett, Ph.D. Hulett & Associates, LLC 1 The Traditional 3-point Estimate of Activity
Online Appendix of. This appendix complements the evidence shown in the text. 1. Simulations
 Online Appendix of Heterogeneity in Returns to Wealth and the Measurement of Wealth Inequality By ANDREAS FAGERENG, LUIGI GUISO, DAVIDE MALACRINO AND LUIGI PISTAFERRI This appendix complements the evidence
Understanding the Principles of Investment Planning Stochastic Modelling/Tactical & Strategic Asset Allocation
 Understanding the Principles of Investment Planning Stochastic Modelling/Tactical & Strategic Asset Allocation John Thompson, Vice President & Portfolio Manager London, 11 May 2011 What is Diversification
Back Testing ALM Models April 17, Back Testing ALM Models: Concepts, Practice, and Compliant Business Solutions
 Back Testing ALM Models: Concepts, Practice, and Compliant Business Solutions Presented by: William J. McGuire Chairman Emeritus McGuire Performance Solutions, Inc. 16435 N. Scottsdale Rd, Ste 290 Scottsdale,
An Assessment of the Reliability of CanFax Reported Negotiated Fed Cattle Transactions and Market Prices
 An Assessment of the Reliability of CanFax Reported Negotiated Fed Cattle Transactions and Market Prices Submitted to: CanFax Research Services Canadian Cattlemen s Association Submitted by: Ted C. Schroeder,
UniCredit Eurozone Economist Toolbox
 UniCredit Eurozone Economist Toolbox Aurelio Maccario Chief Eurozone Economist - UniCredit Group UniCredit Group Research aurelio.maccario@unicreditgroup.de Florence, 03 April 2009 GDP Tracker: Sharp GDP
Model Construction & Forecast Based Portfolio Allocation:
 QBUS6830 Financial Time Series and Forecasting Model Construction & Forecast Based Portfolio Allocation: Is Quantitative Method Worth It? Members: Bowei Li (303083) Wenjian Xu (308077237) Xiaoyun Lu (3295347)
Managing Hog Price Risk: Futures, Options, and Packer Contracts
 Managing Hog Price Risk: Futures, Options, and Packer Contracts John D. Lawrence, Extension Livestock Economist and Director, Iowa Beef Center, and Alan Vontalge, Extension Economist, Iowa State University
Fundamentals of Statistics
 CHAPTER 4 Fundamentals of Statistics Expected Outcomes Know the difference between a variable and an attribute. Perform mathematical calculations to the correct number of significant figures. Construct
The Long-Run Equity Risk Premium
 The Long-Run Equity Risk Premium John R. Graham, Fuqua School of Business, Duke University, Durham, NC 27708, USA Campbell R. Harvey * Fuqua School of Business, Duke University, Durham, NC 27708, USA National
Revisionist History: How Data Revisions Distort Economic Policy Research
 Federal Reserve Bank of Minneapolis Quarterly Review Vol., No., Fall 998, pp. 3 Revisionist History: How Data Revisions Distort Economic Policy Research David E. Runkle Research Officer Research Department
The Characteristics of Stock Market Volatility. By Daniel R Wessels. June 2006
 The Characteristics of Stock Market Volatility By Daniel R Wessels June 2006 Available at: www.indexinvestor.co.za 1. Introduction Stock market volatility is synonymous with the uncertainty how macroeconomic
KARACHI UNIVERSITY BUSINESS SCHOOL UNIVERSITY OF KARACHI BS (BBA) VI
 VI") 88 P a g e B S ( B B A ) S y l l a b u s KARACHI UNIVERSITY BUSINESS SCHOOL UNIVERSITY OF KARACHI BS (BBA) VI Course Title : STATISTICS Course Number : BA(BS) 532 Credit Hours : 03 Course 1. Statistical
88 P a g e B S ( B B A ) S y l l a b u s KARACHI UNIVERSITY BUSINESS SCHOOL UNIVERSITY OF KARACHI BS (BBA) VI Course Title : STATISTICS Course Number : BA(BS) 532 Credit Hours : 03 Course 1. Statistical
JUPITER POLICE OFFICER'S RETIREMENT FUND INVESTMENT PERFORMANCE PERIOD ENDING SEPTEMBER 30, 2008
 JUPITER POLICE OFFICER'S RETIREMENT FUND INVESTMENT PERFORMANCE PERIOD ENDING SEPTEMBER 30, 2008 NOTE: For a free copy of Part II (mailed w/i 5 bus. days from request receipt) of Burgess Chambers and Associates,
starting on 5/1/1953 up until 2/1/2017.
 An Actuary s Guide to Financial Applications: Examples with EViews By William Bourgeois An actuary is a business professional who uses statistics to determine and analyze risks for companies. In this guide,
Article from: Risk Management. March 2015 Issue 32
 Article from: Risk Management March 2015 Issue 32 VIX & Tails: Hedging With Volatility By Rocky Fishman 9 8 7 6 5 4 3 1 REGIME: SINGLE-DIGIT RV RARE Apr-04 Jan-05 Sep-05 Jun-06 Mar-07 Dec-07 Sep-08 Jun-09
WEST AFRICAN MONETARY AGENCY (WAMA) Report on Developments in the Exchange Rates of ECOWAS Currencies as at end November 2011
 Report on Developments in the Exchange Rates of ECOWAS Currencies as at end November 2011") WEST AFRICAN MONETARY AGENCY (WAMA) Report on Developments in the Exchange Rates of ECOWAS Currencies as at end November 2011 Freetown, December 2011 Introduction The stabilization of ECOWAS currencies
WEST AFRICAN MONETARY AGENCY (WAMA) Report on Developments in the Exchange Rates of ECOWAS Currencies as at end November 2011 Freetown, December 2011 Introduction The stabilization of ECOWAS currencies
Filing Taxes Early, Getting Healthcare Late
 April 2018 Filing Taxes Early, Getting Healthcare Late Insights From 1.2 Million Households Filing Taxes Early, Getting Healthcare Late Insights From 1.2 Million Households Diana Farrell Fiona Greig Amar
Search costs and the dispersion of loan interest rates in Brazil *
 1 Search costs and the dispersion of loan interest rates in Brazil * Márcio I. Nakane Research Department, Brazilian Central Bank Economics Department, São Paulo University Sérgio Mikio Koyama Research
WEST AFRICAN MONETARY AGENCY (WAMA) Developments in the Exchange Rates of ECOWAS Currencies as at End November 2012
 Developments in the Exchange Rates of ECOWAS Currencies as at End November 2012") WEST AFRICAN MONETARY AGENCY (WAMA) Developments in the Exchange Rates of ECOWAS Currencies as at End November 2012 Freetown, December 2012 TABLE OF CONTENTS I. Introduction... 2 II. Trends in the Exchange
WEST AFRICAN MONETARY AGENCY (WAMA) Developments in the Exchange Rates of ECOWAS Currencies as at End November 2012 Freetown, December 2012 TABLE OF CONTENTS I. Introduction... 2 II. Trends in the Exchange
Factor Mixology: Blending Factor Strategies to Improve Consistency
 May 2016 Factor Mixology: Blending Factor Strategies to Improve Consistency Vassilii Nemtchinov, Ph.D. Director of Research Equity Strategies Mahesh Pritamani, Ph.D., CFA Senior Researcher Factor strategies
Absolute Return Fixed Income: Taking A Different Approach
 August 2015 Absolute Return Fixed Income: Taking A Different Approach Executive Summary Historically low global fixed income yield levels present a conundrum for today s fixed income investors. Increasing
MARGIN M ANAGER The Leading Resource for Margin Management Education
 Margin Management Since 1999 MARGIN M ANAGER The Leading Resource for Margin Management Education March 2015 Learn more at MarginManager.Com INSIDE THIS ISSUE Dear Ag Industry Associate, Margin Watch Reports
Online Appendix to. The Value of Crowdsourced Earnings Forecasts
 Online Appendix to The Value of Crowdsourced Earnings Forecasts This online appendix tabulates and discusses the results of robustness checks and supplementary analyses mentioned in the paper. A1. Estimating
The Not-So-Geeky World of Statistics
 FEBRUARY 3 5, 2015 / THE HILTON NEW YORK The Not-So-Geeky World of Statistics Chris Emerson Chris Sweet (a/k/a Chris 2 ) 2 Who We Are Chris Sweet JPMorgan Chase VP, Outside Counsel & Engagement Management
Accuracy of earnings forecasts: Evidence from Ghana
 ABSTRACT Accuracy of earnings forecasts: Evidence from Ghana Joseph Abrokwa University of West Georgia Paul Nkansah Florida A&M University This study examines the accuracy of the earnings forecasts contained
BUSI 344 LESSON 8 SUPPLEMENT TIME ADJUSTMENT ILLUSTRATION
 BUSI 344 LESSON 8 SUPPLEMENT TIME ADJUSTMENT ILLUSTRATION The "Ontario" database used in Lesson 8 did not have sufficient market movement to require a time adjustment. However, because this is a common
Futures Trading Opportunities: Fundamentally-Oriented and Convergence Trading
 J.P. Morgan Center for Commodities at the University of Colorado Denver Business School Futures Trading Opportunities: Fundamentally-Oriented and Convergence Trading Isabel Figuerola-Ferretti, Ph.D. Professor
Executive Summary. July 17, 2015
 Executive Summary July 17, 2015 The Revenue Estimating Conference adopted interest rates for use in the state budgeting process. The adopted interest rates take into consideration current benchmark rates
Illinois Job Index. Growth Rate %
 Illinois Job Index Release Data Issue 03/14/2011 Jan 1990 / Jan 2011 2011.02 www.real.illinois.edu For January Illinois Job Index, the Nation, RMW and the state all had positive job growth. The monthly
Six-Year Income Tax Revenue Forecast FY
 Six-Year Income Tax Revenue Forecast FY 2017-2022 Prepared for the Prepared by the Economics Center February 2017 1 TABLE OF CONTENTS EXECUTIVE SUMMARY... i INTRODUCTION... 1 Tax Revenue Trends... 1 AGGREGATE
Investment Opportunities in Global Fixed Income Markets
 Investment Opportunities in Global Fixed Income Markets GSAM Insurance Fixed Income May 217 GSAM Insurance Asset Management Key Themes for 217 Economic Backdrop End of the Distortion Monetary to Fiscal
Stripe Snapshot. Online Fraud Trends and Behavior. December Stripe Snapshot: Online Fraud Trends and Behavior. December 2017
 Stripe Snapshot Online Fraud Trends and Behavior 1 Introduction In 2016, an estimated 1.61 billion people worldwide purchased goods online, and global e-retail sales amounted to $1.9 trillion. And recent
Individual households and firms, as well as local, state,
 NationalEconomicTrends February 9 How Accu Are Forecasts in a Recession? Individual households and firms, as well as local, state, and federal governments, make economic decisions based on their view of
The Cash Rate and the Consumer: A Modern Australian Socio-Politico-Economic Saga
 The Cash Rate and the Consumer: A Modern Australian Socio-Politico-Economic Saga Author Worthington, Andrew Charles, Valadkhani, A. Published 2013 Journal Title Consumer Interests Annual Copyright Statement
Descriptive Statistics
 Petra Petrovics Descriptive Statistics 2 nd seminar DESCRIPTIVE STATISTICS Definition: Descriptive statistics is concerned only with collecting and describing data Methods: - statistical tables and graphs
1.2 The purpose of the Finance Committee is to assist the Board in fulfilling its oversight responsibilities related to:
 Category: BOARD PROCESS Title: Terms of Reference for the Finance Committee Reference Number: AB-331 Last Approved: February 22, 2018 Last Reviewed: February 22, 2018 1. PURPOSE 1.1 Primary responsibility
Today's jobs data: what you need to know
 Trend Macrolytics, LLC Donald Luskin, Chief Investment Officer Thomas Demas, Managing Director Michael Warren, Energy Strategist Data Insights: Jobs Friday, August 3, 2018 Today's jobs data: what you need
Exchange Rate Forecasting
 Exchange Rate Forecasting Controversies in Exchange Rate Forecasting The Cases For & Against FX Forecasting Performance Evaluation: Accurate vs. Useful A Framework for Currency Forecasting Empirical Evidence
ALTERNATIVE MOMENTUM STRATEGIES. Faculdade de Economia da Universidade do Porto Rua Dr. Roberto Frias Porto Portugal
 FINANCIAL MARKETS ALTERNATIVE MOMENTUM STRATEGIES António de Melo da Costa Cerqueira, amelo@fep.up.pt, Faculdade de Economia da UP Elísio Fernando Moreira Brandão, ebrandao@fep.up.pt, Faculdade de Economia
Estimating Standard Error of Inflation Rate in Pakistan: A Stochastic Approach
 The Pakistan Development Review 51:3 (Autumn 2012) pp. 257 272 Estimating Standard Error of Inflation Rate in Pakistan: A JAVED IQBAL and M. NADIM HANIF * The answer to the question what is the mean of
THEORY & PRACTICE FOR FUND MANAGERS. SPRING 2011 Volume 20 Number 1 RISK. special section PARITY. The Voices of Influence iijournals.
 T H E J O U R N A L O F THEORY & PRACTICE FOR FUND MANAGERS SPRING 0 Volume 0 Number RISK special section PARITY The Voices of Influence iijournals.com Risk Parity and Diversification EDWARD QIAN EDWARD
WESTWOOD LUTHERAN CHURCH Summary Financial Statement YEAR TO DATE - February 28, Over(Under) Budget WECC Fund Actual Budget
 Budget WECC Fund Actual Budget") WESTWOOD LUTHERAN CHURCH Summary Financial Statement YEAR TO DATE - February 28, 2018 General Fund Actual A B C D E F WECC Fund Actual Revenue Revenue - Faith Giving 1 $ 213 $ 234 $ (22) - Tuition $ 226
WESTWOOD LUTHERAN CHURCH Summary Financial Statement YEAR TO DATE - February 28, 2018 General Fund Actual A B C D E F WECC Fund Actual Revenue Revenue - Faith Giving 1 $ 213 $ 234 $ (22) - Tuition $ 226
Trading Volatility: Theory and Practice. FPA of Illinois. Conference for Advanced Planning October 7, Presented by: Eric Metz, CFA
 Trading Volatility: Theory and Practice Presented by: Eric Metz, CFA FPA of Illinois Conference for Advanced Planning October 7, 2014 Trading Volatility: Theory and Practice Institutional Use Only 1 Table
Common stock prices 1. New York Stock Exchange indexes (Dec. 31,1965=50)2. Transportation. Utility 3. Finance
2. Transportation. Utility 3. Finance") Digitized for FRASER http://fraser.stlouisfed.org/ Federal Reserve Bank of St. Louis 000 97 98 99 I90 9 9 9 9 9 9 97 98 99 970 97 97 ""..".'..'.."... 97 97 97 97 977 978 979 980 98 98 98 98 98 98 987 988
Digitized for FRASER http://fraser.stlouisfed.org/ Federal Reserve Bank of St. Louis 000 97 98 99 I90 9 9 9 9 9 9 97 98 99 970 97 97 ""..".'..'.."... 97 97 97 97 977 978 979 980 98 98 98 98 98 98 987 988