THE DYNAMICS OF PRECIOUS METAL MARKETS VAR: A GARCH-TYPE APPROACH. Yue Liang Master of Science in Finance, Simon Fraser University, 2018.
|
|
|
- Buck Barber
- 5 years ago
- Views:
Transcription
1 THE DYNAMICS OF PRECIOUS METAL MARKETS VAR: A GARCH-TYPE APPROACH by Yue Liang Master of Science in Finance, Simon Fraser University, 2018 and Wenrui Huang Master of Science in Finance, Simon Fraser University, 2018 PROJECT SUBMITTED IN PARTIAL FULFILLMENT OF THE REQUIREMENTS FOR THE DEGREE OF MASTER OF SCIENCE IN FINANCE In the Master of Science in Finance Program of the Faculty of Business Administration Yue Liang; Wenrui Huang 2018 SIMON FRASER UNIVERSITY Winter 2018 All rights reserved. However, in accordance with the Copyright Act of Canada, this work may be reproduced, without authorization, under the conditions for Fair Dealing. Therefore, limited reproduction of this work for the purposes of private study, research, criticism, review and news reporting is likely to be in accordance with the law, particularly if cited appropriately.
2 Approval Name: Yue Liang; Wenrui Huang Degree: Master of Science in Finance Title of Project: The Dynamics of Precious Metal Markets VaR: A GARCH-type Approach Supervisory Committee: Dr. Andrey Pavlov Senior Supervisor Professor Carlos da Costa Second Reader Lecturer Date Approved: 2
3 Abstract The data analysis of the metal markets has recently attracted a lot of attention, mainly because the prices of precious metal are relatively more volatile than its historical trend. A robust estimate of extreme loss is vital, especially for mining companies to mitigate risk and uncertainty in metal price fluctuations. This paper examines the Value-at-Risk and statistical properties in daily price return of precious metals, which include gold, silver, platinum, and palladium, from January 3, 2008 to November 27, The conditional variance is modeled by different univariate GARCH-type models (GARCH and EGARCH). The estimated model suggests that the two models both worked effectively with the metal price returns and volatility clustering in those metal returns are very clear. In the second part, backtesting approach is applied to evaluate the effectiveness of the models. In comparison of VaRs for the four precious metals return, gold has the highest and most steady VaR, then is platinum and silver, while palladium has the lowest and most volatile VaR. The backtesting result confirms that our approach is an adequate method in improving risk management assessments. 3
4 Content Approval... 2 Abstract Introduction Literature Review Data Exploration and Statistical Analysis Testing for Stationary, Serial Correlation and Heteroscedasticity Test for Stationary Test for Serial Correlation Test for Heteroscedasticity Test for Distribution Model Estimation Defining Value-at-Risk Estimating σt+1 using GARCH-type Model Estimating Result and Discussion VaR Estimations and Backtesting One-Day-Ahead VaR Estimations Results of Violation Ratio Conclusion References Appendix
5 List of tables Table 1. Literature Review Table 2. Statistical analysis Table 3. T-test results Table 4. Model estimation results Table 5. 1-day-ahead VaR estimations Table 6. Violation ratio results
6 List of figures Figure 1. Gold and Silver price ans log-return plots Figure 2. Autocorrelation and Partial autocorrelation Figure 3. Conditional variance for gold, silver, platinum and palladium Figure 4. Time series return Figure 5. Q-Q plot Figure 6. VaR and Violation happened Figure 7. Downside 0.05 quantile VaRs for gold, silver, platinum, and palladium
7 1. Introduction Precious metal markets have been highly volatile in recent years not only due to supply and demand issues, but also due to many other factors such as extreme weather conditions, new financial innovations, and international inflation. In this study, we replicate Z. Zhang & H-K Zhang s study (2016) on the metal commodity markets. In their study, they examined the VaR and statistical properties in daily price return of precious metals, which include gold, silver, platinum and palladium from January 11, 2000 to September 9, We generally confirm the original results using the time period used in the original study. However, we expected that using more recent data, especially data from the financial crisis, would change many of those results as GARCH generally does not perform particularly well during extreme events. We find that when including data from Jan. 3, 2008 to Oct. 26, 2018, the GARCH model only performs well on 95% confidence interval, while performs bad on 99% and 99.5% confidence interval. EGARCH model, similar to the previous study, performs well on the data sets. We offer a number of tests of the models, and show that their performance holds part of the conclusions of the previous study. The quantification of the potential size of losses and assessing risk levels for precious metals and portfolios including them is fundamental in designing prudent risk management and risk management strategies. Value-at-Risk (VaR for short) models is an important instrument within the financial markets which estimate the maximum 7
8 expected loss of a portfolio can generate over a certain holding period. Regulators also accept VaR as a basis for companies to set their capital requirements for market risk exposure. GARCH-type models are a common approach to model VaR and estimate volatility and correlations. Yet the standard GARCH model is unable to model asymmetries of the volatility, which means in a standard GARCH model, bad news has the same influence on the volatility as good news. To deal with this problem, there are extension models in GARCH family such as a threshold GARCH (TGARCH) or exponential GARCH (EGARCH). These two models have taken leverage effect into consideration. In this paper, similar to the previous study, we examine the volatility behavior of four precious metal: gold, silver, platinum and palladium. We contained two models, GARCH(1,1) and EGARCH(1,1), of GARCH family to calculate VaR at different level of confidence interval and estimate 1-day-ahead VaR for both GARCH-type models, and then use violation ratio to examine and compare the accuracy of fitting of the two models. In the previous study, they contained AR(1)-GARCH model and EGARCH model to test the data sets. This paper is organized as follow. After this introduction, Section 2 provides a literature review. Section 3 introduces the data exploration and statistical analysis. Section 4 presents the methodology implemented in this study. Section 5 provides the result of 1- day-ahead VaR estimation and violation ratio for GARCH-type models. Section 6 is 8
9 our conclusion. 2. Literature Review To offer a comparative view, we summarize the key findings of major studies in the related literature in Table 1, which demonstrates that GARCH and GARCH related models are widely used in the literature to analyze volatility performance and VaR in precious metal markets. 9
10 Table 1. Literature Review Studies Purposes Data Methodology Main Findings Daily time series for the This study uses three two closing future prices of oil, Risk hedging in the gold factors volatility models of the gold, silver and copper, GARCH, Hammoudeh and and silver markets is more GARCH family to examine the and for the US threemonth Treasury bill rates EGARCH CGARCH, Yuan (2008) pressing than in the copper volatility behavior of three market. strategic commodities from January 2, 1990 to May 1, 2006 This paper utilizes the most flexible skewed generalized t West Texas Intermediate The SGT distribution appears to be the most (SGT) distribution for describing (WTI) crude oil, gasoline, appropriate choice since it Cheng and Hung (2010) petroleum and metal volatilities that are characterized by leptokurtosis and skewness in order to provide better approximations of the reality. heating oil, gold, silver, and copper for the period January 2002 to March 2009 GARCH-SGT, GARCH-GED enables risk managers to fulfill their purpose of minimizing MRA regulatory capital requirements Daily returns based on The RiskMetrics model is This paper uses VaR to analyze closing spot prices for four the best performer under the market downside risk RiskMetrics, precious metals: gold, the Basel rules in terms of Hammoudeh et al. associated with investments in asymmetric silver, platinum, and both the number of days in (2011) four precious metals, oil and the GARCH type palladium from January 4, the red zone and the S&P 500 index, and three models 1995 to November 12, average capital diversified portfolios requirements GPD was found to be an appropriate model to This paper use generalized describe the conditional Monthly gold prices from Generalized Pareto distribution (GPD) to excess distributions of a Huang et al. (2015) January 1969 to October Pareto distribution model extreme returns in the heteroscedastic gold log (GPD model) gold market return series and provides adequate estimations for VaR and ES. There exists multiscale dependence structure, He et al. (2016) corresponding to different This paper proposed a new Copula GARCH, DGPs, in the precious Bivariate EMD copula-based Gold, Platinum, and Bivariate metal markets. The approach to analyze and model Palladium closing price Empirical Mode proposed model can be the multiscale dependence from 4 January 1993 to 4 Decomposition used to identify the structure in the precious metal April 2015 (BEMD) model significant interdependent markets relationship among precious metal markets in the multiscale domain 10
11 3. Data Exploration and Statistical Analysis In this study, we tend to estimate risk measures for precious metal market. For this aim, we consider daily closing spot prices of four precious metal: gold, silver, platinum and palladium, same as the previous study did. For the selected series, the data covers from January in 2008 to October in 2018, which is totaling more than 2500 observations. In our opinion, we think the high volatility in precious metal market after 2008 will be typical for the future market, so we removed data before 2008 and extended it to 2018.We collect daily spot price of all four kinds of precious metal from Bloomberg. All the four-precious metal price is based on U.S. dollars. The continuously compounded daily returns are computed as follows: r t = 100ln ( p t p t 1 ) In this formula, r t and p t are the return in percentage and the precious metal daily spot price on day t respectively. We used the price and return of gold and silver to represent metal market historical tendency since gold and silver are not only a financial indicator that can have impact on other precious metal commodities, but also widely used as a financial instrument for inclusion in portfolios. Fig. 1 provides the time series plots of gold and silver daily spot prices and their log-returns. 11


12 Figure 1. Gold and Silver price ans log-return plots Figure 1 indicate that volatility clustering is manifestly apparent for precious metal returns revealing the presence of heteroscedasticity. The number of isolated peaks in both log-return figure is larger than what would be expected from Gaussian series. The statistical results of the four kinds of precious metal returns are shown in Table 2. As can be seen in Table 2, the mean of all data sets is extremely close to zero, while the 12
13 standard deviation is also at a low level. Among the four-precious metal, silver has the highest standard deviation, while gold has the lowest. In the previous study, palladium has the highest standard deviation while gold has the lowest, indicating that silver has became more volatile during recent years. Comparing to the standard normal distribution with skewness 0 together with kurtosis 3, it leads to a conclusion that each data set has a leptokurtic distribution with fat tail. Meanwhile, the result of Jarque- Bera(J-B for short) test supports that we can surely reject the null hypothesis of Gaussian distribution for all returns. According to Augmented Dickey Fuller (ADF for short) test, the result undoubtedly rejects the hypothesis of unit root for the time series studied. So, we can conclude that precious metal price sample returns all have short memory. Table 2. Statistical analysis Mean (%) Standard Deviation Maximum Minimum Skewness Kurtosis J-B test ADF test Gold Silver Platinum Palladium Notes: J-B test results in 1 means reject the null hypothesis that the sample data have the skewness and kurtosis matching a normal distribution. ADF test results in 1 means reject the null hypothesis that a unit root is present in a time series sample. In conclusion, the statistical analysis for precious metal price return data sets reveals that these precious metal returns are stationary, non-normally distributed, and all have 13
14 short memory. This conclusion is same as the previous study. 4. Testing for data features 4.1 Test for Stationary Similar to the previous research, in order to build an effective model, stationary test is needed on the series to make sure the underlying assumption that all the series must be stationary hold. Only when series is stationary, i.e. has statistical properties that do not change with time, models can be adopted to process those series. In this paper, we adopted a simple test based on the null hypothesis that the data in vectors x and y comes from independent random samples from normal distributions with equal means and equal but unknown variances. We divided each time series data into equally two vectors x and y. Then we adopt the test on the two vectors to see if test results will reject the null hypothesis. Table 3. T-test results The results for the four series are all 0, indicating that we cannot reject the null hypothesis, and all the four data sets are stationary. And this conclusion is consistent with the previous research. Gold Silver Platinum Palladium Test result *result = 0, fail to reject null hypothesis, stationary 14
15 4.2 Test for Serial Correlation In order to perform a detailed modeling on the log returns, we need to perform several tests on the return and variance characteristics of the data sets. In the previous research, AR(1) model is adopted to filter out the autocorrelations of considered metal log-returns. And AR(1) is singled out according to the censored orders of autocorrelation and partial autocorrelation functions graphs through numerous trails. In this paper, we tried to conduct the same analysis and trying to figure out if serial correlation still holds. The first test we performed was about whether the return datasets still exists serial correlation. We adopted the autocorrelation function and partial autocorrelation function in MATLAB. 15
 model in the previous research would be not appropriate anymore. Figure 2.")
16 From the graph, it is evident that there is little influence of past return on today s return. Thus, we can reach the conclusion that no serial correlation exists, and that the use of AR(1) model in the previous research would be not appropriate anymore. Figure 2. Autocorrelation and Partial autocorrelation 4.3 Test for Heteroscedasticity After testing on the serial correlation, we conducted two tests on the heteroscedasticity. The time-varying volatility would interfere the effectiveness of the forecasting process and influence the quality of the data. The previous research has shown that the all the 16
 on today s volatility. Figure 3.")
17 metal returns showed significant conditional variance feature. The first test is the autocorrelation function on the variance of the metal prices returns. Like the autocorrelation and partial autocorrelation function on the returns data, this test showing the influence of past volatility (i.e. variance) on today s volatility. Figure 3. Conditional variance for gold, silver, platinum and palladium From the graph, we can see that today s return for all the metal price returns data would be influenced by the previous returns, meaning that conditional variance does exist. This conclusion is consistent with the previous research. Moreover, for Gold and 17
18 Platinum, the last day s variance has the strongest influence, while for Palladium and Silver, other recent variance also has some influence on today s volatility. The second test is plotting the return against time to show whether the volatility changes with time. According to the previous research, they found out that return for Palladium has the highest standard deviation, while return for gold has the lowest during the period 2000~2016. Compared with the newest data that we adopt in this paper, we found out that the return volatility for Silver became the highest one, indicating the Silver market in recent years are more volatile than before. And the return for Gold still has the lowest volatility, which means that the market volatility for Gold remained relatively stable and unchanged during the years. 18

19 Figure 4. Time series return On the other hand, as the previous research point out, the return against time graph for each metal showed strong mean-reverting trend, fluctuating around zero. They also pointed out that the return against time figure indicates heteroscedasticity and volatility clustering behavior. These conclusions still hold with the newest data we adopted based on the following graph. 4.4 Test for Distribution Due to the fat tail of the metal price returns, it is generally harder for normal distribution to capture the extreme conditions in the metal future market. Thus, we conducted test to modify if the student t distribution would be a better fit for the metal price returns. 19

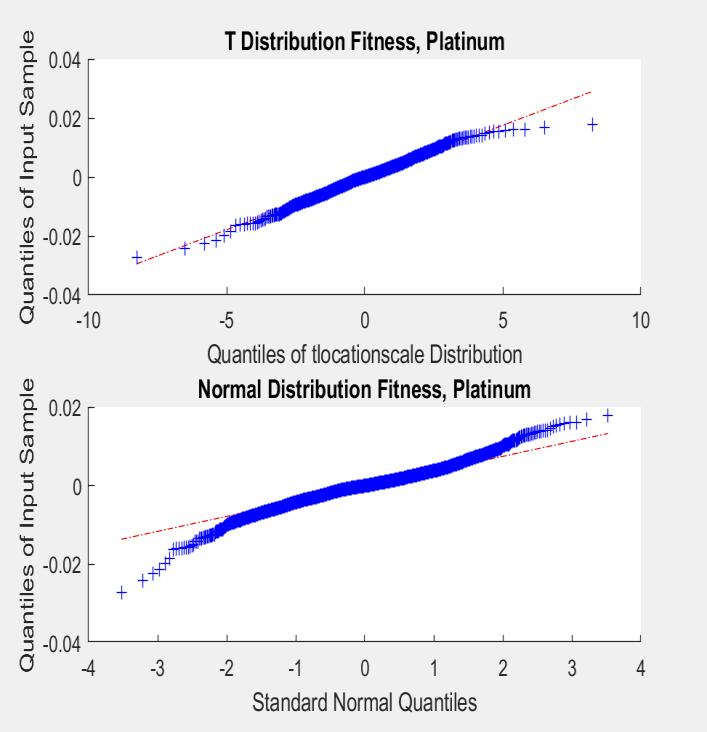
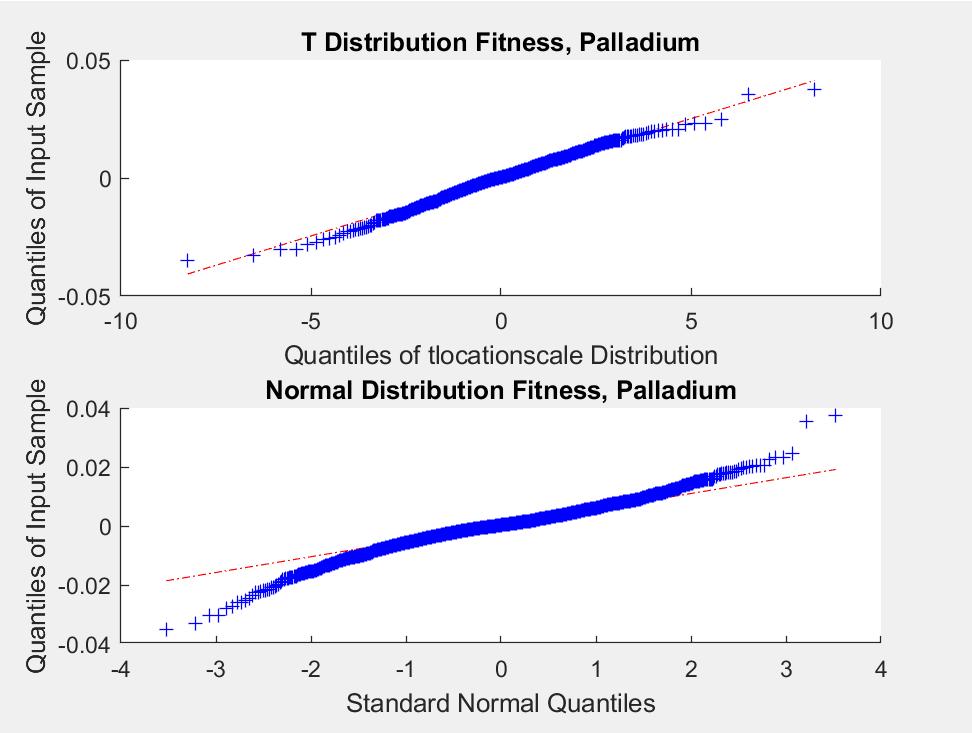
20 Figure 5. Q-Q plot According to the qqplot function in MATLAB, we monitored the fitness of the fourdata series with 2 different distributions - t distribution and normal distribution. The test result is that t-distribution have much stronger ability to capture the fat tail of the metal price returns. More specifically, the t-distribution can capture most of the extreme increases in metal prices and a considerable amount of extreme decrease in the metal prices. As for the normal distribution, it only captures some of the increases and decreases when the metal market has huge fluctuation. Thus overall, we decided to adopt the t-distribution. Based on different method, the previous research adopted a complicated EVT distribution to capture all extreme conditions. However, because t- 20
21 distribution has proven to be able to capture most of the extreme conditions between 2010 ~ Thus, we adopted t-distribution for this paper. In conclusion, based on the tests we performed above, the metal price returns are all stationary, meaning that models can be directly used. Then according to the autocorrelation function and partial autocorrelation function, the returns between 2010 and 2018 have no serial correlation, thus ARMA models are not needed anymore. Finally, according to the autocorrelation function on the return variance, the previous variance would have impact on today s variance, thus heteroscedasticity exists, and GARCH-type models are still needed. The difference between our conclusion and previous research are 1. The AR(1) Model is proven to be not necessary anymore; 2. We adopted t-distribution instead of the EVT distribution in the previous research; 3. The Silver return turned out to be more volatile than palladium and to be the most volatile one in recent years. 21
22 5. Model Estimation To implement an estimation procedure for these measures we must choose a particular model for the dynamics of the conditional volatility. According to the previous research, the AR(1)-GARCH model was adopted because they found out that historical returns of the metal historical prices are not independent, and variance was not constant either. However, after the 2010, based on the previous test we performed in part2, we found out that the newest returns for the four metals are independent, which means that AR(1) model is no longer needed. And the time-vary volatility still holds. Thus, in this paper, we use the parsimonious but effective GARCH (1.1) process for the volatility. Moreover, they also conducted EGARCH model to test whether leverage effect exist in the metal returns. Our paper also introduced EGARCH model to forecast VaR by capturing some volatility stylized facts such as asymmetry and leverage effect in the metal price return innovations to see whether EGARCH model still provide good VaR s computations. 5.1 Defining Value-at-Risk Exposure to risk can be defined as the worst expected loss over a great horizon within a given confidence level, which VaR is this quantity. The VaR at a given confidence 22
23 level Indicates the amount that might be lost in a portfolio of assets over a specified time period with a specified small failure probability α. In this paper, we still adopt time period as one day. Similar to the previous research, we suppose that a random variable X characterizes the distribution of daily returns in some risky financial asset, the left-tail α-quantile of the portfolio is then defined to be the VaR α such that Pr (X VaR) = α The VaR is the smallest value for X such that the probability of a loss over a day is no more than α. Although the parameter α is arbitrarily chosen, analysis in this study does not refer to the process of choosing the parameter which is considered to be α {0.005, 0.01, 0.05}. In the estimation, for each day we estimated 1000 possible returns, so the VaR for that day would be absolute value the 5th smallest return, 10th smallest return and 50th smallest return respectively. And this methodology is consistent with the previous research. 5.2 Estimating σt+1 using GARCH-type Model In 1986, Bollerslev developed the generalized ARCH, or GARCH, to capture the timevary volatility, which relies on modeling the conditional variance as a linear function of the squared past innovations. By using the log-returns (x 1, x 2, x 3 x t 1 ) as the input, the conditional variance of the standard GARCH (1,1) is defined as: σ 2 t = c + η ε 2 2 t 1 + β σ t 1 23
24 Where the c > 0, η > 0, β > 0, ε t 1 = x t 1 μ t 1. μ is the average return during the observing period. The volatility today would be a combination of the meanadjusted return and variance However, due to the drawback of standard GARCH that it fails to consider the leverage effect in the volatility of metal price returns. In the GARCH model, the underlying assumption is the volatility are symmetric to the change in return. However, in real world, the increase and decrease in return may bring different volatility changes (asymmetric impacts). In order to verify whether leverage effect exist in the metal return, the EGARCH model is also included. The E-GARCH(1,1) is defined as: ln σ 2 t = c + η ε t 1 σ + β ε t t 1 σ t γ ln σ t 1 where ε t 1 = x t 1 μ t 1 and η depicts the leverage effect. The positive return and negative return with same absolute amount of change will have different impact on the volatility prediction If η is positive and β is negative, meaning that negative change in return would bring higher impact on the next day s volatility In contrast to the GARCH model, no restrictions need to be imposed on the 24
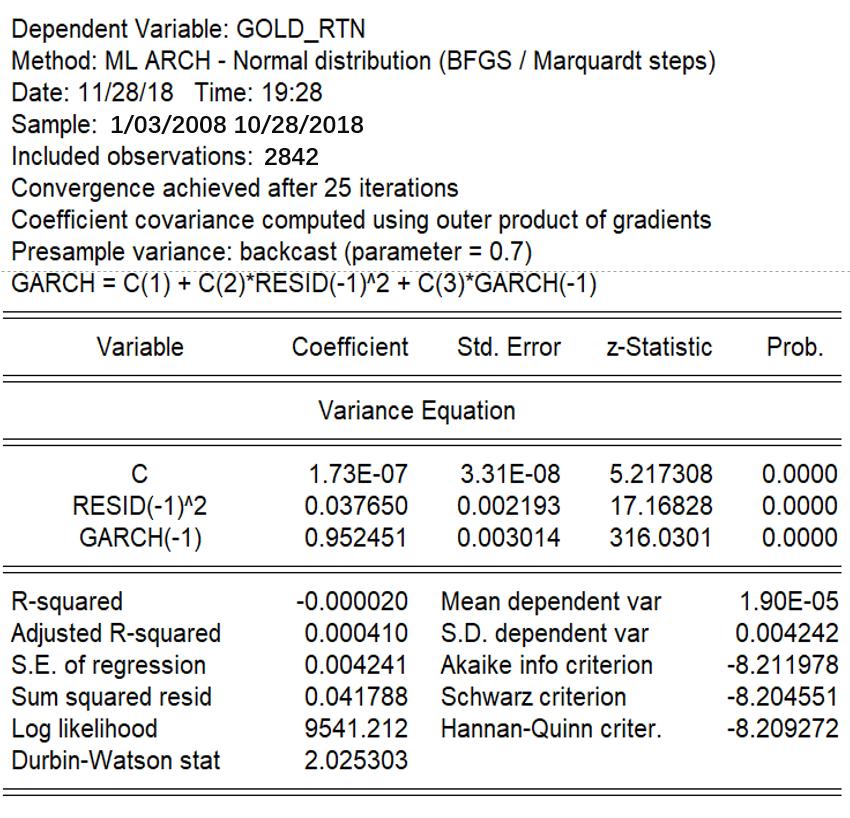
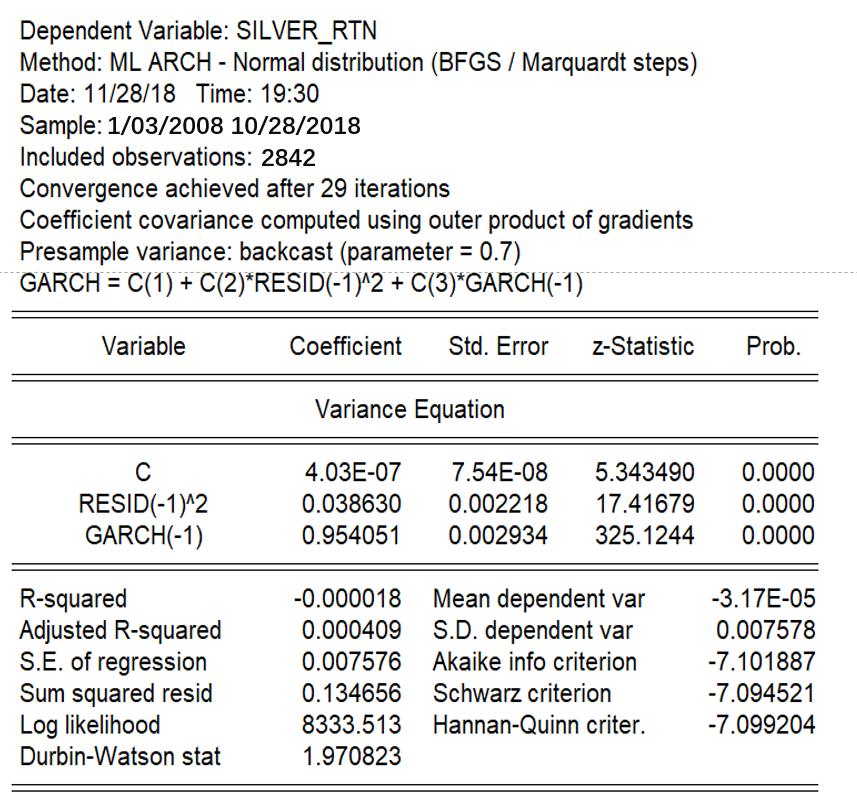
25 model parameters since the logarithmic transformation ensures that the forecasts of the variance are non-negative. In conclusion, the previous research adopted AR(1)-GARCH(1,1) and AR(1)- EGARCH(1,1). In our research, we found out that serial correlation do not exist anymore, thus GARCH(1,1) and EGARCH(1,1) are still adopted. 5.3 Estimating Result and Discussion By observing the autocorrelations in Section 2, we found the heteroscedasticity and volatility clustering behavior in the considered precious metal returns. The four metal returns have significant volatility clustering, so a GARCH-type model needs to be adopted. Because of the fat tail of the return, we chose the t-distribution instead of the normal distribution to better fit the data. GARCH(1,1), and EGARCH(1,1) models with student t distributions are developed so as to further investigate the leverage effect of the precious metal returns. 25
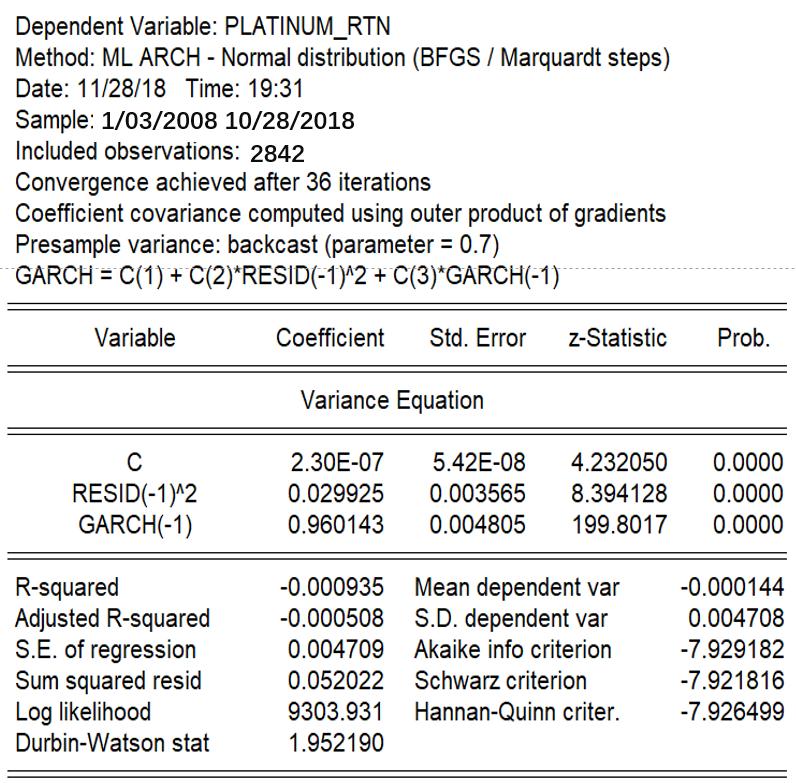
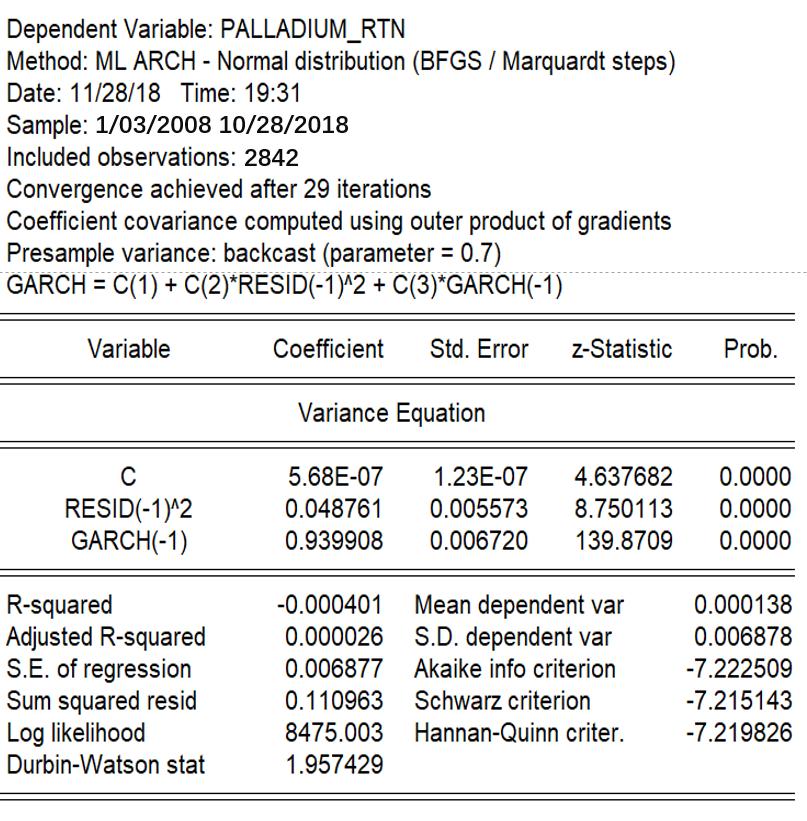
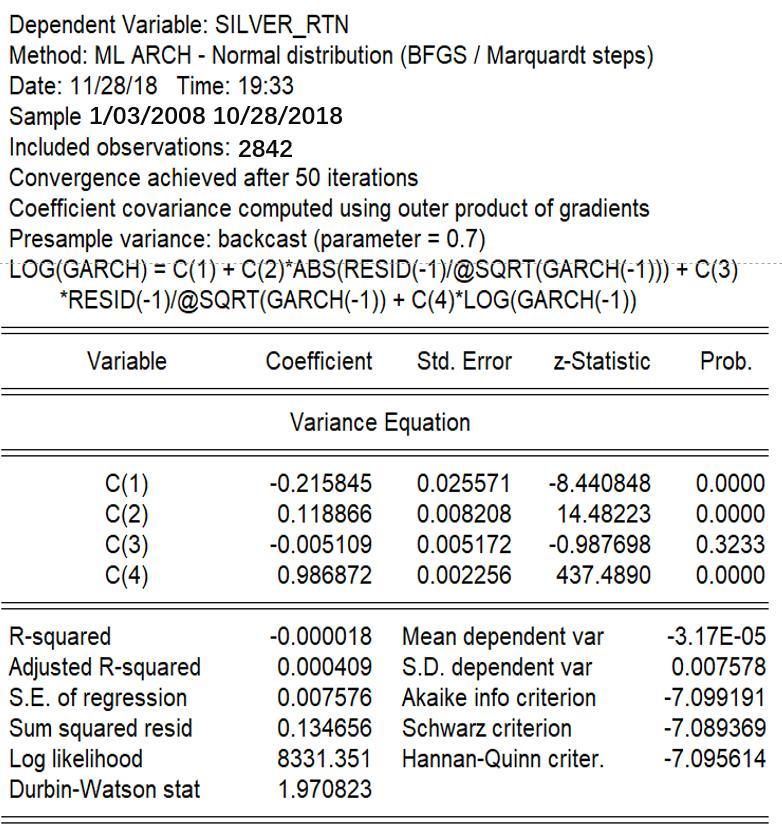
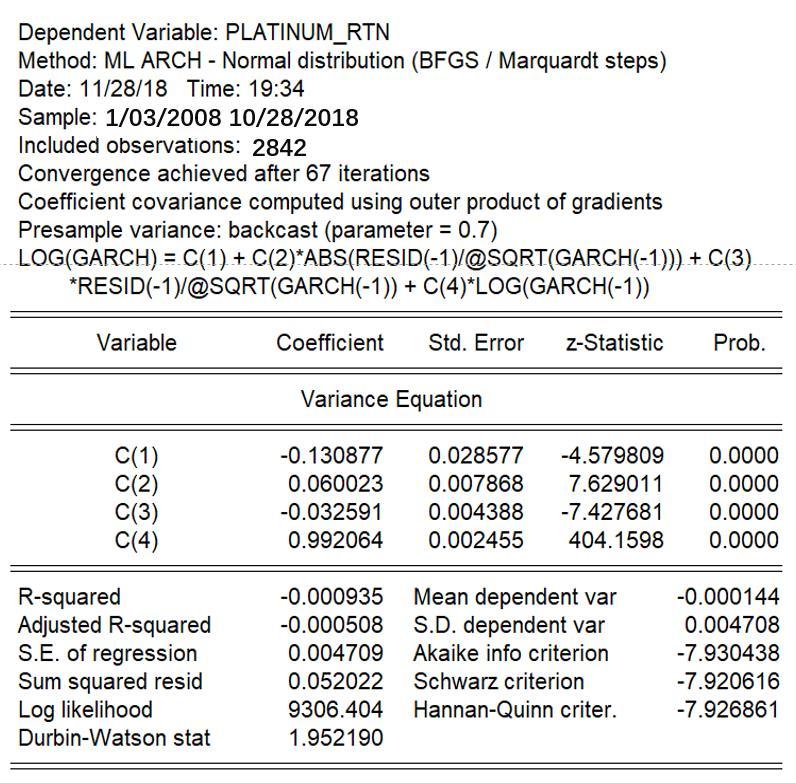
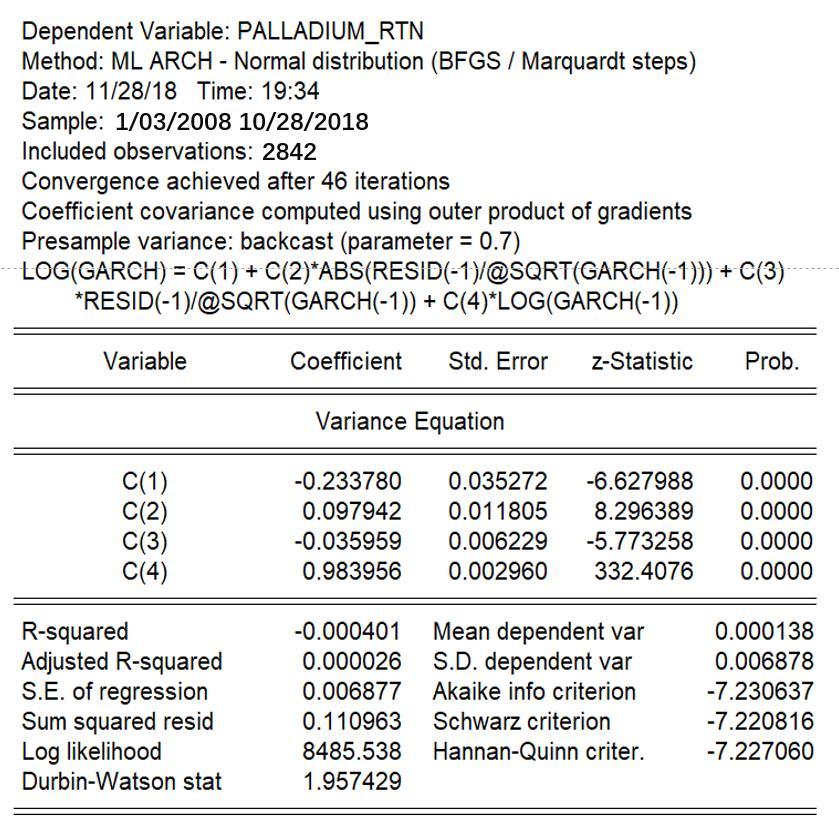
26 Table 4. Model estimation results As can be seen from Table 3, we performed GARCH(1,1) and EGARCH(1,1) to each of the metal returns, and we also recorded the AIC value, DW-test value and adjusted R-Square to compare the fitness of those models. For the GARCH model estimation result: The previous research indicates that the all the parameters are significant and parameter β all exceed 0.86, indicating the strong volatility clustering. And we found out that all 26
27 the parameters are still significant while parameter β are all greater than 0.93, indicating the volatility clustering in those metal returns is even clearer. As for the EGARCH model estimation result: The precious research got four conclusions, (1) leverage effects coefficient γ are all positive and significant at any significant level; (2) the asymmetric volatility behavior is the most significant in palladium while the least significant in gold; (3) the coefficient estimators γ in the EGARCH(1,1) conditional variance model are all greater than 0.95, which indicates that over 95% of current variance shock can still be seen in the following period. As for the three conclusions, according to the parameter estimation result from the conditional variance EGARCH(1,1) equation, we found that all the coefficient η are all positive and significant at any significant level. 1. Unlike the previous research that Palladium has the most leverage effect. We found out that the leverage effect coefficient η and βfor Gold and Silver are bigger than the other two metals, indicating that Gold and Silver may suffer more from bad news and benefit less from good news than the other two metals. 2. Similar to the previous research, estimators γ is all greater than 0.98, showing that the volatility clustering in those metal returns are still clear. This result is consistent 27
28 with the previous research on this topic. DW-test results are all close to 2, indicating that there is little serial correlation exists in the metal returns. Overall, based on the minimum AIC value, the GARCH(1,1) and EGARCH(1,1) model both have a relatively small AIC value, indicating that the fitness of the model is quite good. And the value of the AIC for EGARCH model is the smallest, which is consistent with the conclusion of the previous research. Moreover, we also conducted the DW-test. Based on its assumption that the closer the DW-test statistic to 2, the less serial correlation exist, we can also reach the conclusion that those metal price returns have no serial correlation. Similar to the previous research, the volatility clustering in those metal returns is clear, and the decay of the volatility shock is quite slow. Leverage effect does have an impact on the metal price returns. 6. VaR Estimations and Backtesting According to Basel Committee on Banking Supervision, a financial institution has freedom to use their own model to compute Value-at-Risk (VaR). In this section, we estimate the 1-day-ahead VaRs via the GARCH(1,1) model and E-GARCH(1,1) model and implement backtesting to measure accuracy for each of the two approaches by using violation ratio. As mentioned above in Section 5, we compute VaR by using: 28

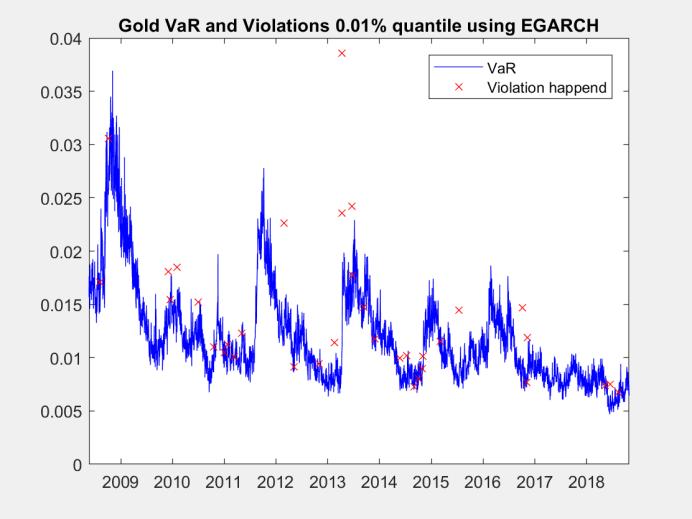
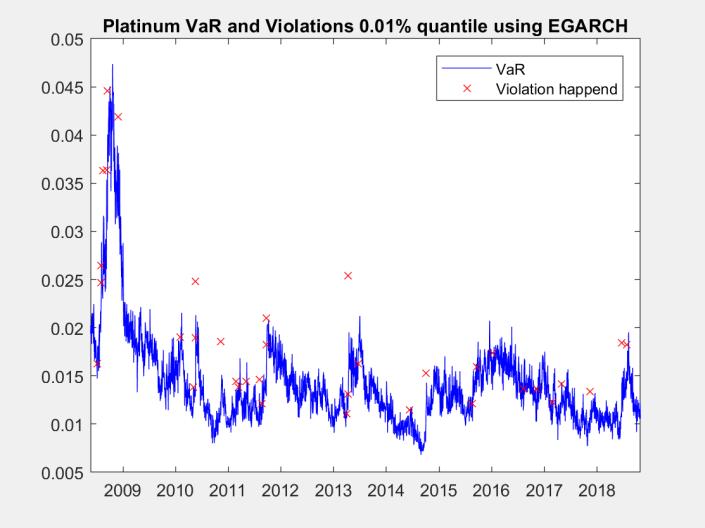
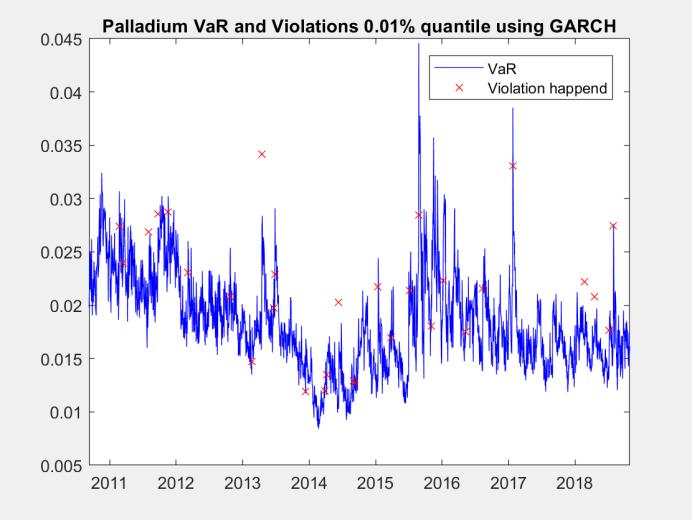
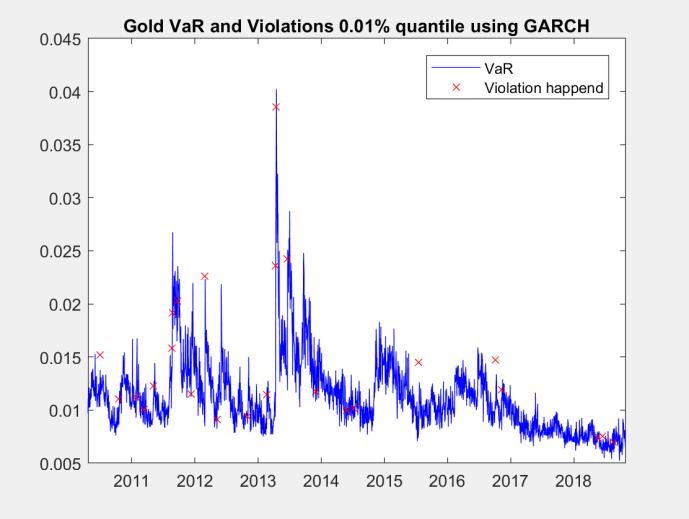
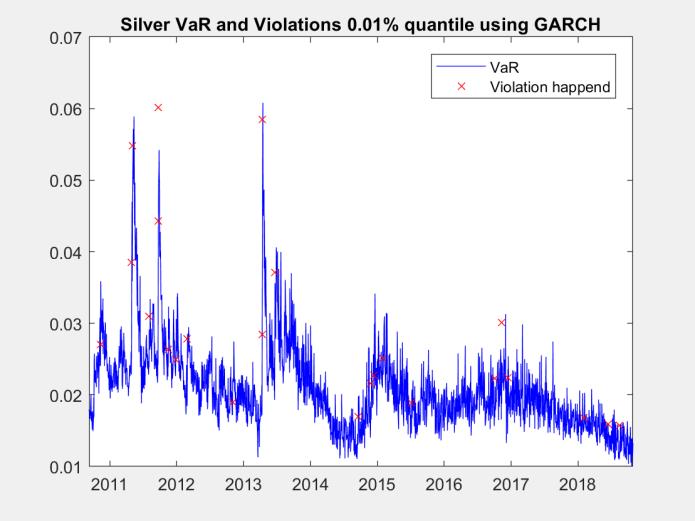
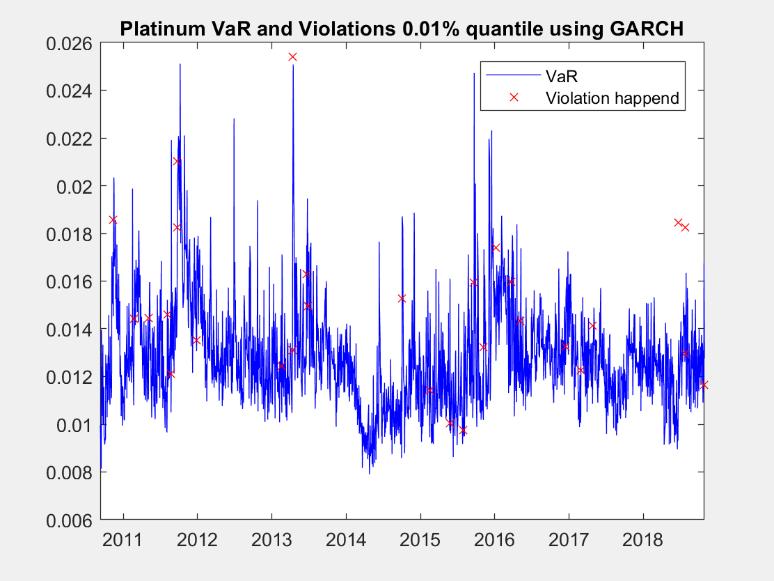
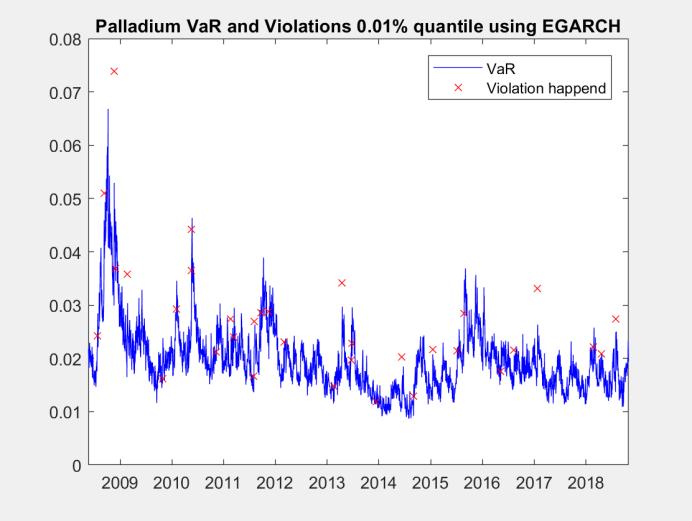
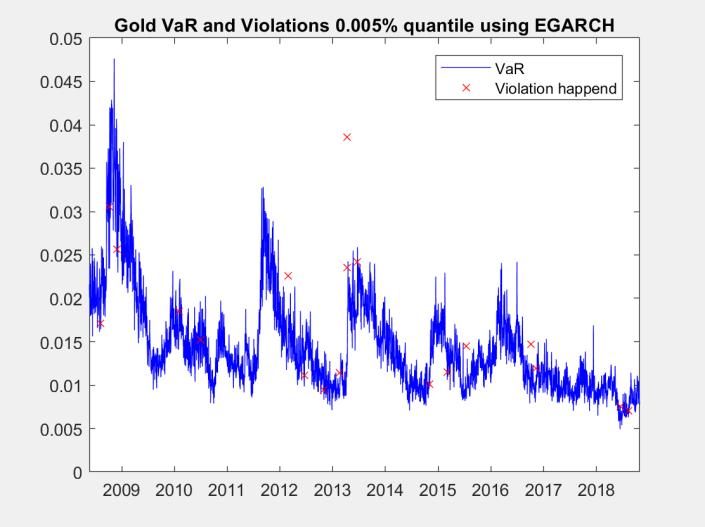
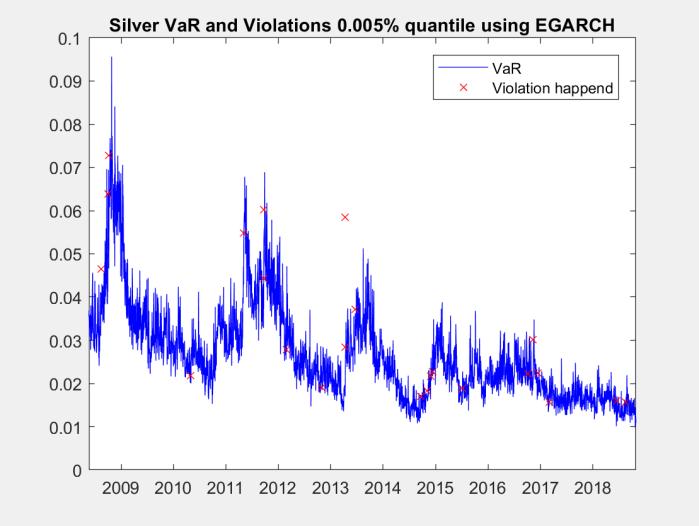
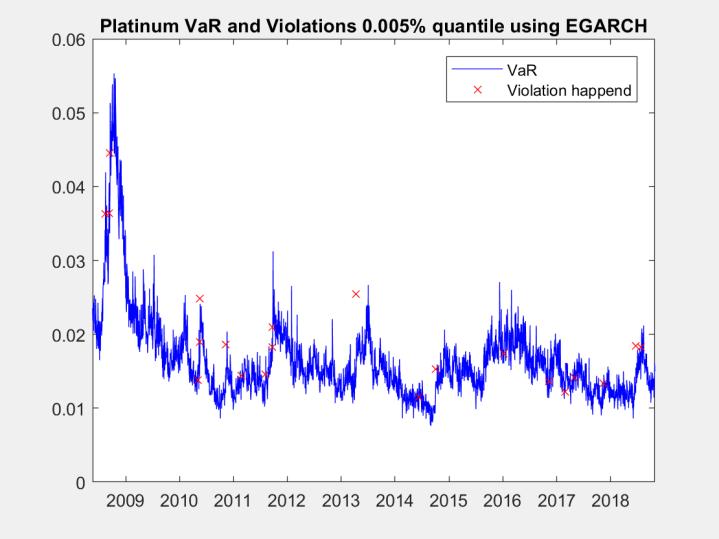
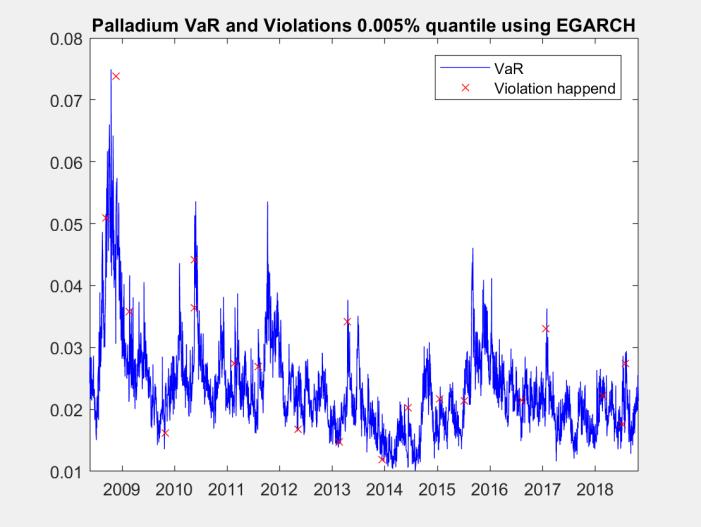
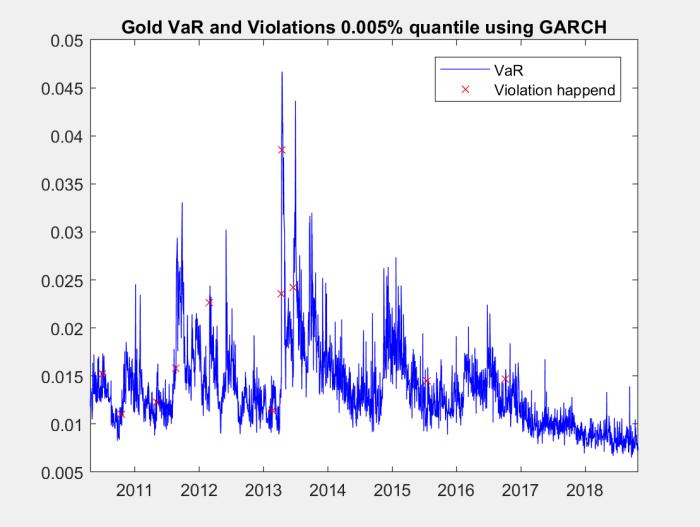
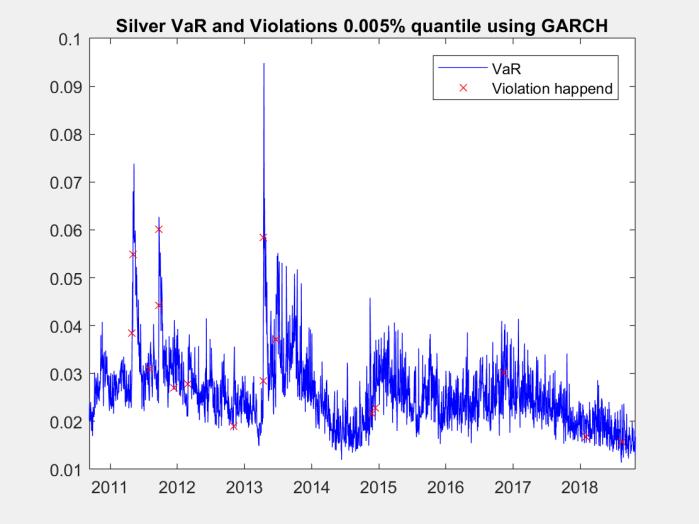
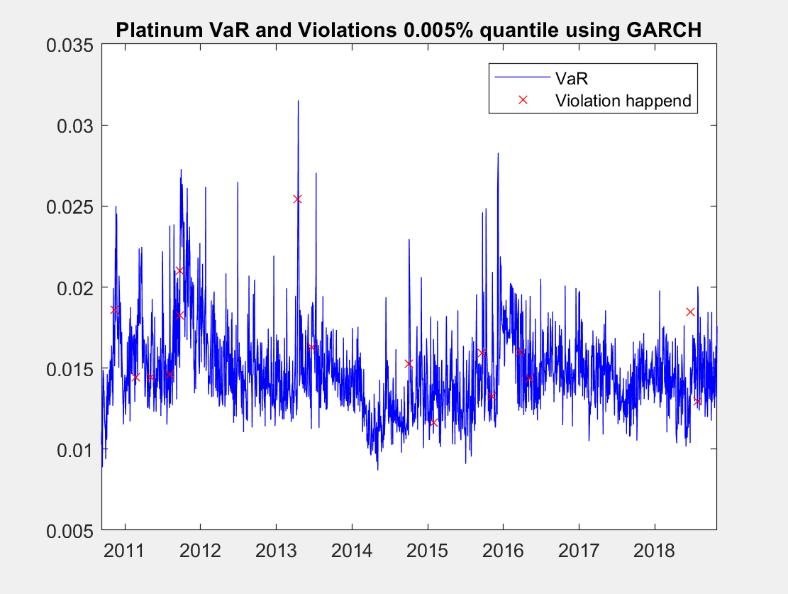
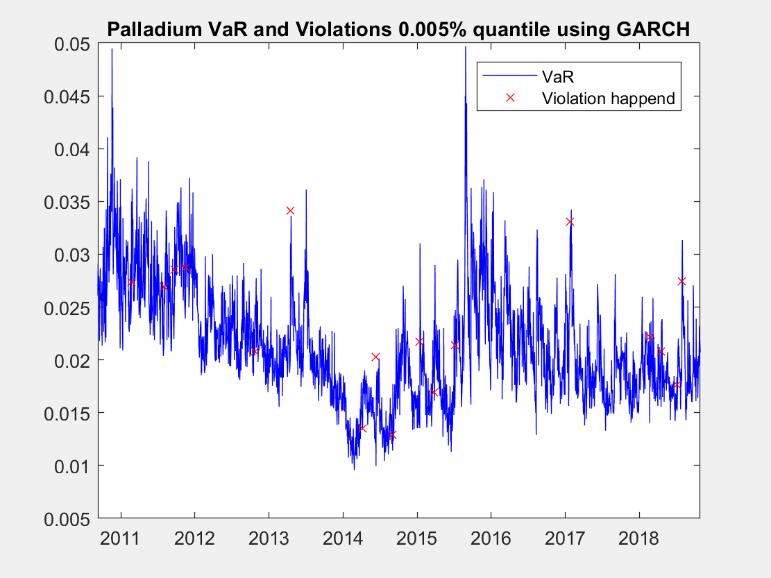
29 Pr (X VaR) = α To define and record the violations of VaR, we use: 1 if X < VaR I t (α) = { 0 else The recorded violations and 0.5% quantile VaRs using our E-GARCH approach are showed in Fig. 6. Figure for violations and VaRs under 0.01% or 0.005% quantile and using GARCH approach are available upon request. 29
 approach is 0.0091 for losses, which means we are 99.")
30 Figure 6. VaR and Violation happened 6.1 One-Day-Ahead VaR Estimations For the next step, we use the negative standardized residuals to estimate VaR for the four data sets. From Table 4 we can see that at a quantile level of 99.5%, the estimated VaR from our GARCH(1,1) approach is for losses, which means we are 99.5% confidence that the expected market value of gold would not lose more than 0.91% for the worst-case scenario within one-day duration. The reason we choose the GARCH(1,1) model and EGARCH(1,1) model to VaR is that EGARCH model does not have restrictions on nonnegativity constraints as linear GARCH model has. Therefore, we identify EGARCH model as the most proper conditional variance model for the four precious metal returns, and we want to compare its VaR estimations with GARCH model. According to the estimation result for 1-day-ahead VaR. As shown in Table 4, we note that EGARCH model produced lower VaR forecasts than the GARCH model at any quantile levels for any metal price return series, which is same to the previous study. 30

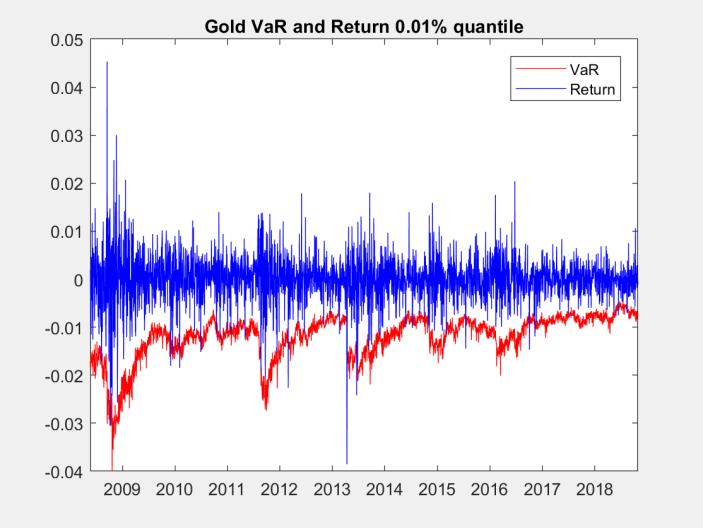
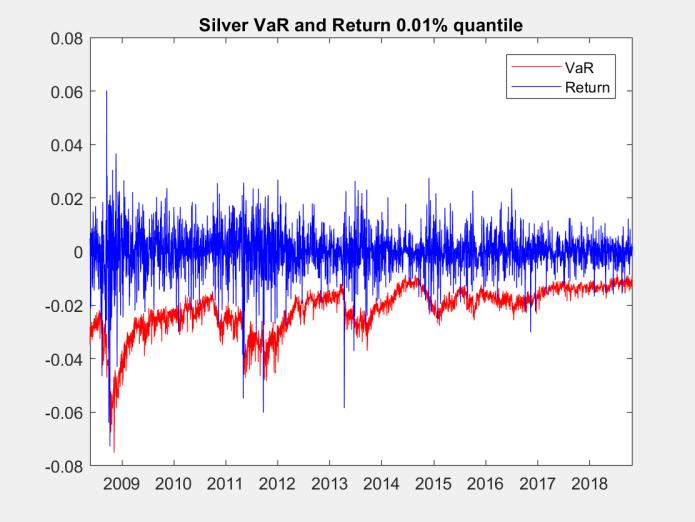
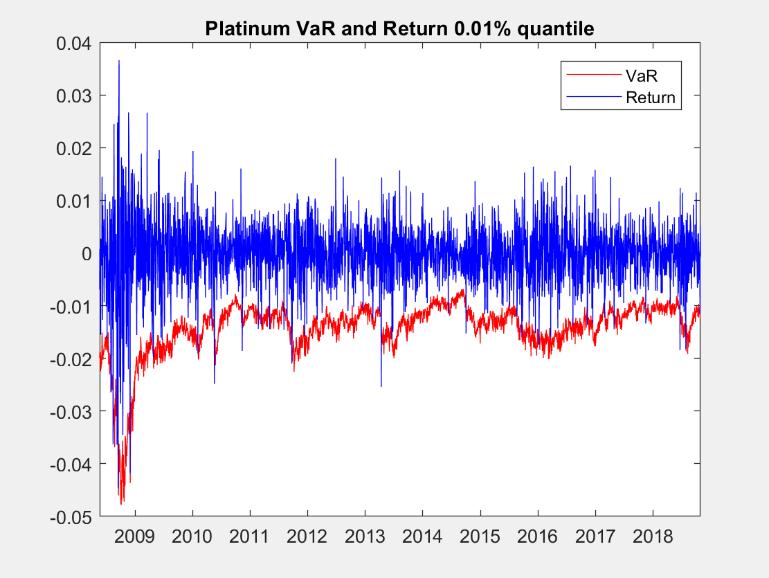
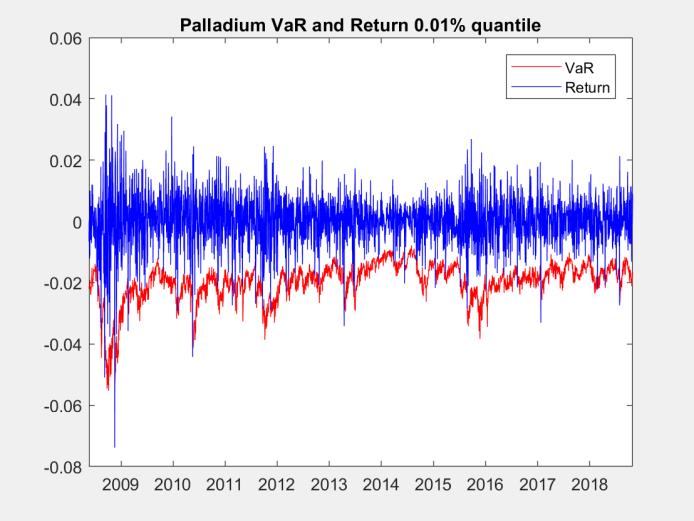
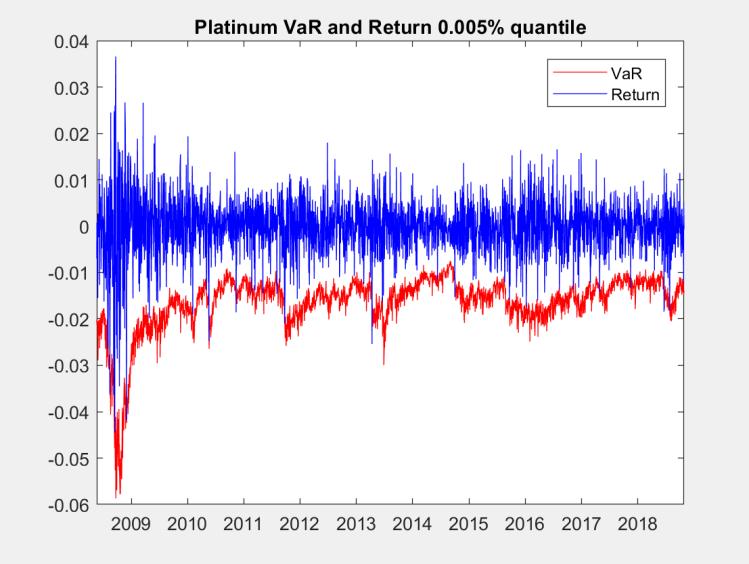
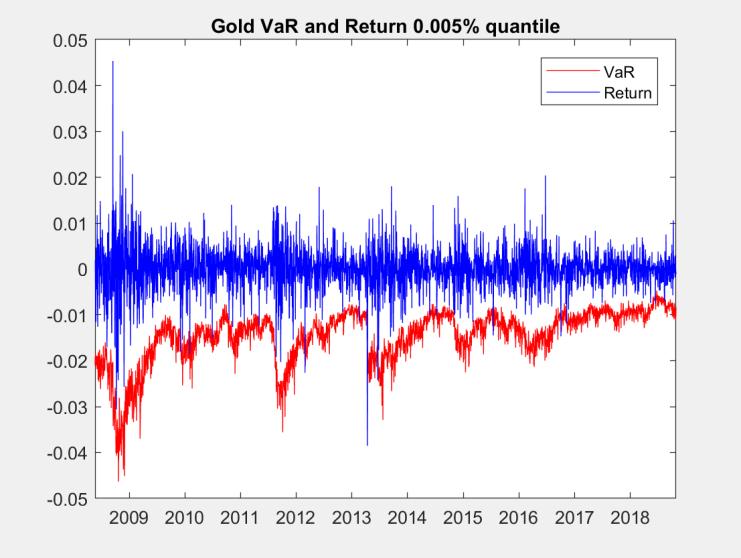
31 Table 5. 1-day-ahead VaR estimations Return Gold Silver Platinum Palladium Estimates for 1-day ahead VaRs from the GARCH model VaR T VaR T VaR T Estimates for 1-day ahead VaRs from the E-GARCH model VaR T VaR T VaR T Then we use a moving window to estimate the 1-day-ahead 5% quantile VaRs using our EGARCH approach to investigate further about the dynamics of VaR for the precious metal return series as shown in Figure 7. 31


32 Figure 7. Downside 0.05 quantile VaRs for gold, silver, platinum, and palladium In comparison of VaRs for the four precious metals return, gold has the highest and most steady VaR, then is platinum and silver, while palladium has the lowest and most volatile VaR. It indicates that gold is the safest valuable asset for investment, while palladium is most volatile since it is relatively rare comparing to other three precious 32
33 metal. There are also other factors that contribute to the downtrend of VaR. For instance, from 2012 to 2014, there is a long-term bull run in the U.S. stock market, which encouraged investors to use their money in stock investing and lead to the sustained low-level precious metal price. 6.2 Results of Violation Ratio In the previous study, they used likelihood ratio test to do backtesting. Different from the previous study, we used violation ratio to test the accuracy for fitting of GARCH model together with EGARCH model. If the violation ratio is between 0.8 and 1.2, it will be defined as close to 1 which means the model fits the data set at a good level. Otherwise, the violation ratio will be defined as significantly different from 1 which means the model fits the data series at a poor level. Table 6. Violation ratio results Return Gold Silver Platinum Palladium Violation ratio result from GARCH model VR α= VR α= VR α= Violation ratio result from E-GARCH model VR α= VR α= VR α=
34 Table 5 provides the backtesting results of violation ratio, where the level of confidence interval ranging among 0.5%, 1% and 5%. EGARCH model performs well at 1% and 5% confidence interval, yet the performance for 0.5% confidence interval is poor. GARCH model performs well only at 5% confidence interval. In the previous research, GARCH and EGARCH model do very well in predicting critical loss for precious metal markets. Our result is partly changed in comparison with the previous study. 7. Conclusion In this paper, we introduce an extension of the original study by Zhang Z. and Zhang H-K. (2016) by including data from the financial crisis to see if this would change many of those results as GARCH generally does not perform particularly well during extreme events. As the volatility in the metal market increases, it's extremely important to implement an effective risk management system against market risk. In this context, VaR has become the most popular tool to measure risk for institutions and regulators and how to correctly and effectively estimate VaR has become increasingly important. In addition, leverage effect has been proved to be an important influence factor of future prices. In this paper we introduce GARCH and EGARCH model to capture the volatility clustering of metal price returns and conducted back testing to exam the 34
35 effectiveness of the two models. Our findings reveal that the GARCH and EGARCH models all worked effectively with the metal price returns and volatility clustering in those metal returns are still clear. After we conduct the estimation for 1-day-ahead VaR, results at any quantile levels for any metal price return series of GARCH are higher than that of EGARCH, which indicate that EGARCH performs better than GARCH. It reveals that taking leverage effect into consideration is more realistic and comprehensive than using GARCH to VaR model. According to the backtesting result, violation ratio for GARCH only performs well at 5% quantile which proves our assumption that GARCH model is inadequate during extreme events. For EGARCH model, at 5% and 1% quantile the model performs good, while at 0.5% quantile the accuracy of fitting has a serious deterioration. We have not yet found out the reason for this question. A detailed analysis of this question is left for future research. 35
36 References Cheng, & Hung. (2011). Skewness and leptokurtosis in GARCH-typed VaR estimation of petroleum and metal asset returns. Journal of Empirical Finance, 18(1), Hammoudeh, Araújo Santos, & Al-Hassan. (2013). Downside risk management and VaR-based optimal portfolios for precious metals, oil and stocks. North American Journal of Economics and Finance, 25(C), Youssef, Belkacem, & Mokni. (2015). Value-at-Risk estimation of energy commodities: A long-memory GARCH EVT approach. Energy Economics, 51, Chinhamu, Knowledge & Huang, Chun-Kai & Huang, Chun Sung & Chikobvu, Delson. (2015). Extreme risk, value-at-risk and expected shortfall in the gold market. International Business & Economics Research Journal (IBER). 14(107). He, K., Liu, Y., Yu, L., & Lai, K. (2016). Multiscale dependence analysis and portfolio risk modeling for precious metal markets. Resources Policy, 50, 224. Zhang, Zijing, & Zhang, Hong-Kun. (2016). The dynamics of precious metal markets VaR: A GARCHEVT approach. Journal of Commodity Markets, 4(1),

37 Appendix 37
38 38
39 39
40 40
41 41
42 42
43 43
44 44
45 45
Research Article The Volatility of the Index of Shanghai Stock Market Research Based on ARCH and Its Extended Forms
 Discrete Dynamics in Nature and Society Volume 2009, Article ID 743685, 9 pages doi:10.1155/2009/743685 Research Article The Volatility of the Index of Shanghai Stock Market Research Based on ARCH and
Amath 546/Econ 589 Univariate GARCH Models: Advanced Topics
 Amath 546/Econ 589 Univariate GARCH Models: Advanced Topics Eric Zivot April 29, 2013 Lecture Outline The Leverage Effect Asymmetric GARCH Models Forecasts from Asymmetric GARCH Models GARCH Models with
Indian Institute of Management Calcutta. Working Paper Series. WPS No. 797 March Implied Volatility and Predictability of GARCH Models
 Indian Institute of Management Calcutta Working Paper Series WPS No. 797 March 2017 Implied Volatility and Predictability of GARCH Models Vivek Rajvanshi Assistant Professor, Indian Institute of Management
Financial Econometrics
 Financial Econometrics Volatility Gerald P. Dwyer Trinity College, Dublin January 2013 GPD (TCD) Volatility 01/13 1 / 37 Squared log returns for CRSP daily GPD (TCD) Volatility 01/13 2 / 37 Absolute value
Volatility Analysis of Nepalese Stock Market
 The Journal of Nepalese Business Studies Vol. V No. 1 Dec. 008 Volatility Analysis of Nepalese Stock Market Surya Bahadur G.C. Abstract Modeling and forecasting volatility of capital markets has been important
The University of Chicago, Booth School of Business Business 41202, Spring Quarter 2017, Mr. Ruey S. Tsay. Solutions to Final Exam
 The University of Chicago, Booth School of Business Business 41202, Spring Quarter 2017, Mr. Ruey S. Tsay Solutions to Final Exam Problem A: (40 points) Answer briefly the following questions. 1. Describe
Volatility Clustering of Fine Wine Prices assuming Different Distributions
 Volatility Clustering of Fine Wine Prices assuming Different Distributions Cynthia Royal Tori, PhD Valdosta State University Langdale College of Business 1500 N. Patterson Street, Valdosta, GA USA 31698
The University of Chicago, Booth School of Business Business 41202, Spring Quarter 2009, Mr. Ruey S. Tsay. Solutions to Final Exam
 The University of Chicago, Booth School of Business Business 41202, Spring Quarter 2009, Mr. Ruey S. Tsay Solutions to Final Exam Problem A: (42 pts) Answer briefly the following questions. 1. Questions
MEASURING PORTFOLIO RISKS USING CONDITIONAL COPULA-AR-GARCH MODEL
 MEASURING PORTFOLIO RISKS USING CONDITIONAL COPULA-AR-GARCH MODEL Isariya Suttakulpiboon MSc in Risk Management and Insurance Georgia State University, 30303 Atlanta, Georgia Email: suttakul.i@gmail.com,
Dealing with Downside Risk in Energy Markets: Futures versus Exchange-Traded Funds. Panit Arunanondchai
 Dealing with Downside Risk in Energy Markets: Futures versus Exchange-Traded Funds Panit Arunanondchai Ph.D. Candidate in Agribusiness and Managerial Economics Department of Agricultural Economics, Texas
Model Construction & Forecast Based Portfolio Allocation:
 QBUS6830 Financial Time Series and Forecasting Model Construction & Forecast Based Portfolio Allocation: Is Quantitative Method Worth It? Members: Bowei Li (303083) Wenjian Xu (308077237) Xiaoyun Lu (3295347)
Modeling Exchange Rate Volatility using APARCH Models
 96 TUTA/IOE/PCU Journal of the Institute of Engineering, 2018, 14(1): 96-106 TUTA/IOE/PCU Printed in Nepal Carolyn Ogutu 1, Betuel Canhanga 2, Pitos Biganda 3 1 School of Mathematics, University of Nairobi,
Chapter 4 Level of Volatility in the Indian Stock Market
 Chapter 4 Level of Volatility in the Indian Stock Market Measurement of volatility is an important issue in financial econometrics. The main reason for the prominent role that volatility plays in financial
The Analysis of ICBC Stock Based on ARMA-GARCH Model
 Volume 04 - Issue 08 August 2018 PP. 11-16 The Analysis of ICBC Stock Based on ARMA-GARCH Model Si-qin LIU 1 Hong-guo SUN 1* 1 (Department of Mathematics and Finance Hunan University of Humanities Science
ANALYSIS OF THE RELATIONSHIP OF STOCK MARKET WITH EXCHANGE RATE AND SPOT GOLD PRICE OF SRI LANKA
 ANALYSIS OF THE RELATIONSHIP OF STOCK MARKET WITH EXCHANGE RATE AND SPOT GOLD PRICE OF SRI LANKA W T N Wickramasinghe (128916 V) Degree of Master of Science Department of Mathematics University of Moratuwa
The Great Moderation Flattens Fat Tails: Disappearing Leptokurtosis
 The Great Moderation Flattens Fat Tails: Disappearing Leptokurtosis WenShwo Fang Department of Economics Feng Chia University 100 WenHwa Road, Taichung, TAIWAN Stephen M. Miller* College of Business University
Booth School of Business, University of Chicago Business 41202, Spring Quarter 2012, Mr. Ruey S. Tsay. Solutions to Midterm
 Booth School of Business, University of Chicago Business 41202, Spring Quarter 2012, Mr. Ruey S. Tsay Solutions to Midterm Problem A: (34 pts) Answer briefly the following questions. Each question has
Volatility in the Indian Financial Market Before, During and After the Global Financial Crisis
 Volatility in the Indian Financial Market Before, During and After the Global Financial Crisis Praveen Kulshreshtha Indian Institute of Technology Kanpur, India Aakriti Mittal Indian Institute of Technology
Graduate School of Business, University of Chicago Business 41202, Spring Quarter 2007, Mr. Ruey S. Tsay. Solutions to Final Exam
 Graduate School of Business, University of Chicago Business 41202, Spring Quarter 2007, Mr. Ruey S. Tsay Solutions to Final Exam Problem A: (30 pts) Answer briefly the following questions. 1. Suppose that
INFORMATION EFFICIENCY HYPOTHESIS THE FINANCIAL VOLATILITY IN THE CZECH REPUBLIC CASE
 INFORMATION EFFICIENCY HYPOTHESIS THE FINANCIAL VOLATILITY IN THE CZECH REPUBLIC CASE Abstract Petr Makovský If there is any market which is said to be effective, this is the the FOREX market. Here we
An Empirical Research on Chinese Stock Market Volatility Based. on Garch
 Volume 04 - Issue 07 July 2018 PP. 15-23 An Empirical Research on Chinese Stock Market Volatility Based on Garch Ya Qian Zhu 1, Wen huili* 1 (Department of Mathematics and Finance, Hunan University of
Modelling Stock Market Return Volatility: Evidence from India
 Modelling Stock Market Return Volatility: Evidence from India Saurabh Singh Assistant Professor, Graduate School of Business,Devi Ahilya Vishwavidyalaya, Indore 452001 (M.P.) India Dr. L.K Tripathi Dean,
DOES COMPENSATION AFFECT BANK PROFITABILITY? EVIDENCE FROM US BANKS
 DOES COMPENSATION AFFECT BANK PROFITABILITY? EVIDENCE FROM US BANKS by PENGRU DONG Bachelor of Management and Organizational Studies University of Western Ontario, 2017 and NANXI ZHAO Bachelor of Commerce
Forecasting Volatility of USD/MUR Exchange Rate using a GARCH (1,1) model with GED and Student s-t errors
 model with GED and Student s-t errors") UNIVERSITY OF MAURITIUS RESEARCH JOURNAL Volume 17 2011 University of Mauritius, Réduit, Mauritius Research Week 2009/2010 Forecasting Volatility of USD/MUR Exchange Rate using a GARCH (1,1) model with
UNIVERSITY OF MAURITIUS RESEARCH JOURNAL Volume 17 2011 University of Mauritius, Réduit, Mauritius Research Week 2009/2010 Forecasting Volatility of USD/MUR Exchange Rate using a GARCH (1,1) model with
Open Access Asymmetric Dependence Analysis of International Crude Oil Spot and Futures Based on the Time Varying Copula-GARCH
 Send Orders for Reprints to reprints@benthamscience.ae The Open Petroleum Engineering Journal, 2015, 8, 463-467 463 Open Access Asymmetric Dependence Analysis of International Crude Oil Spot and Futures
Conditional Heteroscedasticity
 1 Conditional Heteroscedasticity May 30, 2010 Junhui Qian 1 Introduction ARMA(p,q) models dictate that the conditional mean of a time series depends on past observations of the time series and the past
Booth School of Business, University of Chicago Business 41202, Spring Quarter 2014, Mr. Ruey S. Tsay. Solutions to Midterm
 Booth School of Business, University of Chicago Business 41202, Spring Quarter 2014, Mr. Ruey S. Tsay Solutions to Midterm Problem A: (30 pts) Answer briefly the following questions. Each question has
Booth School of Business, University of Chicago Business 41202, Spring Quarter 2010, Mr. Ruey S. Tsay. Solutions to Midterm
 Booth School of Business, University of Chicago Business 41202, Spring Quarter 2010, Mr. Ruey S. Tsay Solutions to Midterm Problem A: (30 pts) Answer briefly the following questions. Each question has
Lecture 6: Non Normal Distributions
 Lecture 6: Non Normal Distributions and their Uses in GARCH Modelling Prof. Massimo Guidolin 20192 Financial Econometrics Spring 2015 Overview Non-normalities in (standardized) residuals from asset return
Modelling Kenyan Foreign Exchange Risk Using Asymmetry Garch Models and Extreme Value Theory Approaches
 International Journal of Data Science and Analysis 2018; 4(3): 38-45 http://www.sciencepublishinggroup.com/j/ijdsa doi: 10.11648/j.ijdsa.20180403.11 ISSN: 2575-1883 (Print); ISSN: 2575-1891 (Online) Modelling
1 Volatility Definition and Estimation
 1 Volatility Definition and Estimation 1.1 WHAT IS VOLATILITY? It is useful to start with an explanation of what volatility is, at least for the purpose of clarifying the scope of this book. Volatility
RISK SPILLOVER EFFECTS IN THE CZECH FINANCIAL MARKET
 RISK SPILLOVER EFFECTS IN THE CZECH FINANCIAL MARKET Vít Pošta Abstract The paper focuses on the assessment of the evolution of risk in three segments of the Czech financial market: capital market, money/debt
Stock Price Volatility in European & Indian Capital Market: Post-Finance Crisis
 International Review of Business and Finance ISSN 0976-5891 Volume 9, Number 1 (2017), pp. 45-55 Research India Publications http://www.ripublication.com Stock Price Volatility in European & Indian Capital
Prerequisites for modeling price and return data series for the Bucharest Stock Exchange
 Theoretical and Applied Economics Volume XX (2013), No. 11(588), pp. 117-126 Prerequisites for modeling price and return data series for the Bucharest Stock Exchange Andrei TINCA The Bucharest University
International Journal of Business and Administration Research Review. Vol.3, Issue.22, April-June Page 1
 A STUDY ON ANALYZING VOLATILITY OF GOLD PRICE IN INDIA Mr. Arun Kumar D C* Dr. P.V.Raveendra** *Research scholar,bharathiar University, Coimbatore. **Professor and Head Department of Management Studies,
Lecture 5a: ARCH Models
 Lecture 5a: ARCH Models 1 2 Big Picture 1. We use ARMA model for the conditional mean 2. We use ARCH model for the conditional variance 3. ARMA and ARCH model can be used together to describe both conditional
Modeling the volatility of FTSE All Share Index Returns
 MPRA Munich Personal RePEc Archive Modeling the volatility of FTSE All Share Index Returns Bayraci, Selcuk University of Exeter, Yeditepe University 27. April 2007 Online at http://mpra.ub.uni-muenchen.de/28095/
Jaime Frade Dr. Niu Interest rate modeling
 Interest rate modeling Abstract In this paper, three models were used to forecast short term interest rates for the 3 month LIBOR. Each of the models, regression time series, GARCH, and Cox, Ingersoll,
Application of Conditional Autoregressive Value at Risk Model to Kenyan Stocks: A Comparative Study
 American Journal of Theoretical and Applied Statistics 2017; 6(3): 150-155 http://www.sciencepublishinggroup.com/j/ajtas doi: 10.11648/j.ajtas.20170603.13 ISSN: 2326-8999 (Print); ISSN: 2326-9006 (Online)
2. Copula Methods Background
 1. Introduction Stock futures markets provide a channel for stock holders potentially transfer risks. Effectiveness of such a hedging strategy relies heavily on the accuracy of hedge ratio estimation.
GARCH vs. Traditional Methods of Estimating Value-at-Risk (VaR) of the Philippine Bond Market
 of the Philippine Bond Market") GARCH vs. Traditional Methods of Estimating Value-at-Risk (VaR) of the Philippine Bond Market INTRODUCTION Value-at-Risk (VaR) Value-at-Risk (VaR) summarizes the worst loss over a target horizon that
GARCH vs. Traditional Methods of Estimating Value-at-Risk (VaR) of the Philippine Bond Market INTRODUCTION Value-at-Risk (VaR) Value-at-Risk (VaR) summarizes the worst loss over a target horizon that
Oil Price Effects on Exchange Rate and Price Level: The Case of South Korea
 Oil Price Effects on Exchange Rate and Price Level: The Case of South Korea Mirzosaid SULTONOV 東北公益文科大学総合研究論集第 34 号抜刷 2018 年 7 月 30 日発行 研究論文 Oil Price Effects on Exchange Rate and Price Level: The Case
Recent analysis of the leverage effect for the main index on the Warsaw Stock Exchange
 Recent analysis of the leverage effect for the main index on the Warsaw Stock Exchange Krzysztof Drachal Abstract In this paper we examine four asymmetric GARCH type models and one (basic) symmetric GARCH
The University of Chicago, Booth School of Business Business 41202, Spring Quarter 2010, Mr. Ruey S. Tsay Solutions to Final Exam
 The University of Chicago, Booth School of Business Business 410, Spring Quarter 010, Mr. Ruey S. Tsay Solutions to Final Exam Problem A: (4 pts) Answer briefly the following questions. 1. Questions 1
Implied Volatility v/s Realized Volatility: A Forecasting Dimension
 4 Implied Volatility v/s Realized Volatility: A Forecasting Dimension 4.1 Introduction Modelling and predicting financial market volatility has played an important role for market participants as it enables
Assicurazioni Generali: An Option Pricing Case with NAGARCH
 Assicurazioni Generali: An Option Pricing Case with NAGARCH Assicurazioni Generali: Business Snapshot Find our latest analyses and trade ideas on bsic.it Assicurazioni Generali SpA is an Italy-based insurance
Booth School of Business, University of Chicago Business 41202, Spring Quarter 2016, Mr. Ruey S. Tsay. Solutions to Midterm
 Booth School of Business, University of Chicago Business 41202, Spring Quarter 2016, Mr. Ruey S. Tsay Solutions to Midterm Problem A: (30 pts) Answer briefly the following questions. Each question has
Financial Econometrics
 Financial Econometrics Value at Risk Gerald P. Dwyer Trinity College, Dublin January 2016 Outline 1 Value at Risk Introduction VaR RiskMetrics TM Summary Risk What do we mean by risk? Dictionary: possibility
FINANCIAL ECONOMETRICS AND EMPIRICAL FINANCE MODULE 2
 MSc. Finance/CLEFIN 2017/2018 Edition FINANCIAL ECONOMETRICS AND EMPIRICAL FINANCE MODULE 2 Midterm Exam Solutions June 2018 Time Allowed: 1 hour and 15 minutes Please answer all the questions by writing
Chapter 6 Forecasting Volatility using Stochastic Volatility Model
 Chapter 6 Forecasting Volatility using Stochastic Volatility Model Chapter 6 Forecasting Volatility using SV Model In this chapter, the empirical performance of GARCH(1,1), GARCH-KF and SV models from
Linkage between Gold and Crude Oil Spot Markets in India-A Cointegration and Causality Analysis
 Linkage between Gold and Crude Oil Spot Markets in India-A Cointegration and Causality Analysis Narinder Pal Singh Associate Professor Jagan Institute of Management Studies Rohini Sector -5, Delhi Sugandha
GARCH Models. Instructor: G. William Schwert
 APS 425 Fall 2015 GARCH Models Instructor: G. William Schwert 585-275-2470 schwert@schwert.ssb.rochester.edu Autocorrelated Heteroskedasticity Suppose you have regression residuals Mean = 0, not autocorrelated
An Empirical Analysis of Effect on Copper Futures Yield. Based on GARCH
 An Empirical Analysis of Effect on Copper Futures Yield Based on GARCH Feng Li 1, Ping Xiao 2 * 1 (School of Hunan University of Humanities, Science and Technology, Hunan 417000, China) 2 (School of Hunan
Forecasting Stock Index Futures Price Volatility: Linear vs. Nonlinear Models
 The Financial Review 37 (2002) 93--104 Forecasting Stock Index Futures Price Volatility: Linear vs. Nonlinear Models Mohammad Najand Old Dominion University Abstract The study examines the relative ability
THE INFORMATION CONTENT OF IMPLIED VOLATILITY IN AGRICULTURAL COMMODITY MARKETS. Pierre Giot 1
 THE INFORMATION CONTENT OF IMPLIED VOLATILITY IN AGRICULTURAL COMMODITY MARKETS Pierre Giot 1 May 2002 Abstract In this paper we compare the incremental information content of lagged implied volatility
Financial Time Series Analysis (FTSA)
") Financial Time Series Analysis (FTSA) Lecture 6: Conditional Heteroscedastic Models Few models are capable of generating the type of ARCH one sees in the data.... Most of these studies are best summarized
Financial Time Series Analysis (FTSA) Lecture 6: Conditional Heteroscedastic Models Few models are capable of generating the type of ARCH one sees in the data.... Most of these studies are best summarized
Financial Econometrics Jeffrey R. Russell. Midterm 2014 Suggested Solutions. TA: B. B. Deng
 Financial Econometrics Jeffrey R. Russell Midterm 2014 Suggested Solutions TA: B. B. Deng Unless otherwise stated, e t is iid N(0,s 2 ) 1. (12 points) Consider the three series y1, y2, y3, and y4. Match
Exchange Rate Risk of China's Foreign Exchange Reserve Assets An Empirical Study Based on GARCH-VaR Model
 Exchange Rate Risk of China's Foreign Exchange Reserve Assets An Empirical Study Based on GARCH-VaR Model Jialin Li SHU-UTS SILC Business School, Shanghai University, 201899, China Email: 18547777960@163.com
Modelling Stock Returns Volatility on Uganda Securities Exchange
 Applied Mathematical Sciences, Vol. 8, 2014, no. 104, 5173-5184 HIKARI Ltd, www.m-hikari.com http://dx.doi.org/10.12988/ams.2014.46394 Modelling Stock Returns Volatility on Uganda Securities Exchange Jalira
Week 2 Quantitative Analysis of Financial Markets Hypothesis Testing and Confidence Intervals
 Week 2 Quantitative Analysis of Financial Markets Hypothesis Testing and Confidence Intervals Christopher Ting http://www.mysmu.edu/faculty/christophert/ Christopher Ting : christopherting@smu.edu.sg :
Risk Management and Time Series
 IEOR E4602: Quantitative Risk Management Spring 2016 c 2016 by Martin Haugh Risk Management and Time Series Time series models are often employed in risk management applications. They can be used to estimate
Market Integration, Price Discovery, and Volatility in Agricultural Commodity Futures P.Ramasundaram* and Sendhil R**
 Market Integration, Price Discovery, and Volatility in Agricultural Commodity Futures P.Ramasundaram* and Sendhil R** *National Coordinator (M&E), National Agricultural Innovation Project (NAIP), Krishi
Amath 546/Econ 589 Univariate GARCH Models
 Amath 546/Econ 589 Univariate GARCH Models Eric Zivot April 24, 2013 Lecture Outline Conditional vs. Unconditional Risk Measures Empirical regularities of asset returns Engle s ARCH model Testing for ARCH
Lecture 1: The Econometrics of Financial Returns
 Lecture 1: The Econometrics of Financial Returns Prof. Massimo Guidolin 20192 Financial Econometrics Winter/Spring 2016 Overview General goals of the course and definition of risk(s) Predicting asset returns:
Study on Dynamic Risk Measurement Based on ARMA-GJR-AL Model
 Applied and Computational Mathematics 5; 4(3): 6- Published online April 3, 5 (http://www.sciencepublishinggroup.com/j/acm) doi:.648/j.acm.543.3 ISSN: 38-565 (Print); ISSN: 38-563 (Online) Study on Dynamic
Graduate School of Business, University of Chicago Business 41202, Spring Quarter 2007, Mr. Ruey S. Tsay. Midterm
 Graduate School of Business, University of Chicago Business 41202, Spring Quarter 2007, Mr. Ruey S. Tsay Midterm GSB Honor Code: I pledge my honor that I have not violated the Honor Code during this examination.
Financial Econometrics Notes. Kevin Sheppard University of Oxford
 Financial Econometrics Notes Kevin Sheppard University of Oxford Monday 15 th January, 2018 2 This version: 22:52, Monday 15 th January, 2018 2018 Kevin Sheppard ii Contents 1 Probability, Random Variables
Market Risk Analysis Volume IV. Value-at-Risk Models
 Market Risk Analysis Volume IV Value-at-Risk Models Carol Alexander John Wiley & Sons, Ltd List of Figures List of Tables List of Examples Foreword Preface to Volume IV xiii xvi xxi xxv xxix IV.l Value
ARCH and GARCH models
 ARCH and GARCH models Fulvio Corsi SNS Pisa 5 Dic 2011 Fulvio Corsi ARCH and () GARCH models SNS Pisa 5 Dic 2011 1 / 21 Asset prices S&P 500 index from 1982 to 2009 1600 1400 1200 1000 800 600 400 200
The Impact of Falling Crude Oil Price on Financial Markets of Advanced East Asian Countries
 10 Journal of Reviews on Global Economics, 2018, 7, 10-20 The Impact of Falling Crude Oil Price on Financial Markets of Advanced East Asian Countries Mirzosaid Sultonov * Tohoku University of Community
Linda Allen, Jacob Boudoukh and Anthony Saunders, Understanding Market, Credit and Operational Risk: The Value at Risk Approach
 P1.T4. Valuation & Risk Models Linda Allen, Jacob Boudoukh and Anthony Saunders, Understanding Market, Credit and Operational Risk: The Value at Risk Approach Bionic Turtle FRM Study Notes Reading 26 By
Lecture 5: Univariate Volatility
 Lecture 5: Univariate Volatility Modellig, ARCH and GARCH Prof. Massimo Guidolin 20192 Financial Econometrics Spring 2015 Overview Stepwise Distribution Modeling Approach Three Key Facts to Remember Volatility
Forecasting the Volatility in Financial Assets using Conditional Variance Models
 LUND UNIVERSITY MASTER S THESIS Forecasting the Volatility in Financial Assets using Conditional Variance Models Authors: Hugo Hultman Jesper Swanson Supervisor: Dag Rydorff DEPARTMENT OF ECONOMICS SEMINAR
The University of Chicago, Booth School of Business Business 41202, Spring Quarter 2012, Mr. Ruey S. Tsay. Solutions to Final Exam
 The University of Chicago, Booth School of Business Business 41202, Spring Quarter 2012, Mr. Ruey S. Tsay Solutions to Final Exam Problem A: (40 points) Answer briefly the following questions. 1. Consider
A market risk model for asymmetric distributed series of return
 University of Wollongong Research Online University of Wollongong in Dubai - Papers University of Wollongong in Dubai 2012 A market risk model for asymmetric distributed series of return Kostas Giannopoulos
The GARCH-GPD in market risks modeling: An empirical exposition on KOSPI
 Journal of the Korean Data & Information Science Society 2016, 27(6), 1661 1671 http://dx.doi.org/10.7465/jkdi.2016.27.6.1661 한국데이터정보과학회지 The GARCH-GPD in market risks modeling: An empirical exposition
Cross-Sectional Distribution of GARCH Coefficients across S&P 500 Constituents : Time-Variation over the Period
 Cahier de recherche/working Paper 13-13 Cross-Sectional Distribution of GARCH Coefficients across S&P 500 Constituents : Time-Variation over the Period 2000-2012 David Ardia Lennart F. Hoogerheide Mai/May
Financial Econometrics Jeffrey R. Russell Midterm 2014
 Name: Financial Econometrics Jeffrey R. Russell Midterm 2014 You have 2 hours to complete the exam. Use can use a calculator and one side of an 8.5x11 cheat sheet. Try to fit all your work in the space
Application of Structural Breakpoint Test to the Correlation Analysis between Crude Oil Price and U.S. Weekly Leading Index
 Open Journal of Business and Management, 2016, 4, 322-328 Published Online April 2016 in SciRes. http://www.scirp.org/journal/ojbm http://dx.doi.org/10.4236/ojbm.2016.42034 Application of Structural Breakpoint
Value-at-Risk forecasting with different quantile regression models. Øyvind Alvik Master in Business Administration
 Master s Thesis 2016 30 ECTS Norwegian University of Life Sciences Faculty of Social Sciences School of Economics and Business Value-at-Risk forecasting with different quantile regression models Øyvind
Performance of Statistical Arbitrage in Future Markets
 Utah State University DigitalCommons@USU All Graduate Plan B and other Reports Graduate Studies 12-2017 Performance of Statistical Arbitrage in Future Markets Shijie Sheng Follow this and additional works
Occasional Paper. Risk Measurement Illiquidity Distortions. Jiaqi Chen and Michael L. Tindall
 DALLASFED Occasional Paper Risk Measurement Illiquidity Distortions Jiaqi Chen and Michael L. Tindall Federal Reserve Bank of Dallas Financial Industry Studies Department Occasional Paper 12-2 December
International Business & Economics Research Journal January/February 2015 Volume 14, Number 1
 Extreme Risk, Value-At-Risk And Expected Shortfall In The Gold Market Knowledge Chinhamu, University of KwaZulu-Natal, South Africa Chun-Kai Huang, University of Cape Town, South Africa Chun-Sung Huang,
Asset Allocation Model with Tail Risk Parity
 Proceedings of the Asia Pacific Industrial Engineering & Management Systems Conference 2017 Asset Allocation Model with Tail Risk Parity Hirotaka Kato Graduate School of Science and Technology Keio University,
Overnight Index Rate: Model, calibration and simulation
 Research Article Overnight Index Rate: Model, calibration and simulation Olga Yashkir and Yuri Yashkir Cogent Economics & Finance (2014), 2: 936955 Page 1 of 11 Research Article Overnight Index Rate: Model,
Empirical Study on Short-Term Prediction of Shanghai Composite Index Based on ARMA Model
 Empirical Study on Short-Term Prediction of Shanghai Composite Index Based on ARMA Model Cai-xia Xiang 1, Ping Xiao 2* 1 (School of Hunan University of Humanities, Science and Technology, Hunan417000,
VOLATILITY COMPONENT OF DERIVATIVE MARKET: EVIDENCE FROM FBMKLCI BASED ON CGARCH
 VOLATILITY COMPONENT OF DERIVATIVE MARKET: EVIDENCE FROM BASED ON CGARCH Razali Haron 1 Salami Monsurat Ayojimi 2 Abstract This study examines the volatility component of Malaysian stock index. Despite
MODELING EXCHANGE RATE VOLATILITY OF UZBEK SUM BY USING ARCH FAMILY MODELS
 International Journal of Economics, Commerce and Management United Kingdom Vol. VI, Issue 11, November 2018 http://ijecm.co.uk/ ISSN 2348 0386 MODELING EXCHANGE RATE VOLATILITY OF UZBEK SUM BY USING ARCH
Managing Risk with Energy Commodities using Value-at-Risk and Extreme Value Theory
 Managing Risk with Energy Commodities using Value-at-Risk and Extreme Value Theory Master Thesis Alexander Noshkov Zafer Demirtas Abstract Today s society requires an endless supply of energy resources
Chapter 5 Mean Reversion in Indian Commodities Market
 Chapter 5 Mean Reversion in Indian Commodities Market 5.1 Introduction Mean reversion is defined as the tendency for a stochastic process to remain near, or tend to return over time to a long-run average
Key Words: emerging markets, copulas, tail dependence, Value-at-Risk JEL Classification: C51, C52, C14, G17
 RISK MANAGEMENT WITH TAIL COPULAS FOR EMERGING MARKET PORTFOLIOS Svetlana Borovkova Vrije Universiteit Amsterdam Faculty of Economics and Business Administration De Boelelaan 1105, 1081 HV Amsterdam, The
A Study on Developing a VKOSPI Forecasting Model via GARCH Class Models for Intelligent Volatility Trading Systems
 지능정보연구제 16 권제 2 호 2010 년 6 월 (pp.19~32) A Study on Developing a VKOSPI Forecasting Model via GARCH Class Models for Intelligent Volatility Trading Systems Sun Woong Kim Visiting Professor, The Graduate
Financial Returns: Stylized Features and Statistical Models
 Financial Returns: Stylized Features and Statistical Models Qiwei Yao Department of Statistics London School of Economics q.yao@lse.ac.uk p.1 Definitions of returns Empirical evidence: daily prices in
Jet Fuel-Heating Oil Futures Cross Hedging -Classroom Applications Using Bloomberg Terminal
 Jet Fuel-Heating Oil Futures Cross Hedging -Classroom Applications Using Bloomberg Terminal Yuan Wen 1 * and Michael Ciaston 2 Abstract We illustrate how to collect data on jet fuel and heating oil futures
Trends in currency s return
 IOP Conference Series: Materials Science and Engineering PAPER OPEN ACCESS Trends in currency s return To cite this article: A Tan et al 2018 IOP Conf. Ser.: Mater. Sci. Eng. 332 012001 View the article
Graduate School of Business, University of Chicago Business 41202, Spring Quarter 2007, Mr. Ruey S. Tsay. Final Exam
 Graduate School of Business, University of Chicago Business 41202, Spring Quarter 2007, Mr. Ruey S. Tsay Final Exam GSB Honor Code: I pledge my honor that I have not violated the Honor Code during this
Scaling conditional tail probability and quantile estimators
 Scaling conditional tail probability and quantile estimators JOHN COTTER a a Centre for Financial Markets, Smurfit School of Business, University College Dublin, Carysfort Avenue, Blackrock, Co. Dublin,
Value at risk might underestimate risk when risk bites. Just bootstrap it!
 23 September 215 by Zhili Cao Research & Investment Strategy at risk might underestimate risk when risk bites. Just bootstrap it! Key points at Risk (VaR) is one of the most widely used statistical tools
Market Risk Management for Financial Institutions Based on GARCH Family Models
 Washington University in St. Louis Washington University Open Scholarship Arts & Sciences Electronic Theses and Dissertations Arts & Sciences Spring 5-2017 Market Risk Management for Financial Institutions
ESTABLISHING WHICH ARCH FAMILY MODEL COULD BEST EXPLAIN VOLATILITY OF SHORT TERM INTEREST RATES IN KENYA.
 ESTABLISHING WHICH ARCH FAMILY MODEL COULD BEST EXPLAIN VOLATILITY OF SHORT TERM INTEREST RATES IN KENYA. Kweyu Suleiman Department of Economics and Banking, Dokuz Eylul University, Turkey ABSTRACT The