Options for Managing Volatility
|
|
|
- Arron Parks
- 5 years ago
- Views:
Transcription
1 Options for Managing Volatility -- Income -- Diversification -- Risk-adjusted Returns Please see the last slide for important disclosures By Matthew Moran Vice President, Chicago Board Options Exchange (312) ; morana cboe.com June 8th, 2010 Presentation for the CFA Society of Ireland
2 16 Challenging Months Little diversification as stock and commodity indexes fell by more than 50% Month-end values of indexes, re-scaled to 1 as of Oct. 31, Oct-07 D ec-07 Feb-08 Apr-08 Jun-08 Aug-08 Oct-08 D ec-08 (Oct. 31, Feb. 28, 2009) Sources: CBOE and Bloomberg Total return indexes Feb-09-51% -52% -53% -54% S&P 500 Russell 2000 SP GSCI (commodity) MSCI World Index Net US$ ERISA requires pension fiduciaries to diversify so as to minimize the risk of large losses 2
3 16 Challenging Months Several worldwide MSCI country stock indexes experienced sharp drops 1.2 Month-end values of indexes, re-scaled to 1 as of Oct. 31, Oct-07 Jan-08 Apr-08 Jul-08 Oct-08 Jan-09-41% -51% -64% -77% MSCI Canada MSCI United States MSCI China Free MSCI Ireland (Oct. 31, Feb. 26, 2009) Sources: CBOE and Bloomberg Total return indexes are used for stocks and commodities 3
4 16 Challenging Months for Alternatives Month-end values of indexes, re-scaled to 1 as of Oct. 31, Oct-07 D ec-07 Feb-08 Apr-08 Jun-08 Aug-08 Oct-08 D ec-08 Feb-09-22% -25% -26% -51% -54% -62% -80% Hedge Fund - CISDM High-Yield Bond (CS) 20-metro Home Price Index Russell 3000 MSCI EAFE MSCI Emerging Mkts Private Equity (Oct. 31, Feb. 28, 2009) Sources: CBOE and Bloomberg Total return indexes are used for stocks. S&P Case-Shiller Home Price Index and S&P Private Equity Index are used. 4
5 Harry Markowitz and Modern Portfolio Theory (MPT) -- [in 2008] the S&P 500 fell approximately 38.5%; the higherbeta emerging-markets asset class fell much farther. Corporate bonds fell in value, but much less than equities, and government bonds went up. Generally, asset classes moved roughly in proportion to their historical betas. MPT never promised high return with low risk. [u]nless our portfolios are comprised entirely of short-term government bonds, we ll be dealing with a level of risk for which MPT prescribes following an old and true adage: Don t put all your eggs in one basket. The Investment Professional magazine (Spring 2009)
6 16 Challenging Months Can volatility diversify and lessen portfolio volatility? 3.5 Month-end values of indexes, re-scaled to 1 as of Oct. 31, % 150% 25% -51% VIX Short-Term Futures Idx S&P VIX - Spot Volatility Citigroup 30-yr Treasury S&P 500 Feb-09 Dec-08 Oct-08 Aug-08 Jun-08 Apr-08 Feb-08 Dec-07 Oct-07 (Oct. 31, Feb. 28, 2009) Sources: CBOE and Bloomberg 6
7 Diversification over a 23-month Time Period 23 Months Month-end Prices, Re-scaled to 1 on Oct. 31, Oct-07 Apr-08 Oct-08 Apr VIX - CBOE Volatility Index S&P 500 MSCI World Index Net US$ SP GSCI TR (Oct. 31, Sep. 30, 2009) Sources: CBOE and Bloomberg 7
8 29 Months for Select MSCI Country Indexes Month-end values of indexes, re-scaled to 1 as of Oct. 31, % -21% -35% -71% MSCI Canada MSCI United States MSCI China Free MSCI Ireland Jan-10 Oct-09 Jul-09 Apr-09 Jan-09 Oct-08 Jul-08 Apr-08 Jan-08 Oct-07 (Oct. 31, Mar. 31, 2010) Sources: CBOE and Bloomberg Total return indexes are used for stocks and commodities 8
9 Higher Correlations for Stock Indexes Rolling One-Year Correlations of Weekly Returns of Indexes to the S&P Russell 2000 MSCI EAFE MSCI Emerging VXO -1.0 Jan-07 Jan-98 Jan-89 Jan-80 Jan-71 Sources: Bloomberg and CBOE. (Jan. 1, April 16, 2010) 9
10 Higher Correlations for Alternatives Indexes Rolling One-Year Correlations of Weekly Returns of Indexes to the S&P S&P Private Equity DJ REIT S&P GSCI VIX Jan-07 Jan-98 Jan-89 Jan-80 Jan-71 Sources: Bloomberg and CBOE. (Jan. 1, April 16, 2010) 10
11 Correlations and Fixed Income Indexes Rolling One-Year Correlations of Weekly Returns of Indexes to the S&P Citi High- Yield Jan-71 Jan-80 Jan-89 Jan-98 Jan Citi BIG Index 30-Yr Treasury VIX Sources: Bloomberg and CBOE. (Jan. 1, April 16, 2010) 11
12 Exchange Listed Equity Options Calls Right to buy security at certain price for certain period Puts Right to sell security at certain price for certain period Usually represents 100 shares Limited life usually expires after third Friday Option Info 200 XYZ Jan 50 calls for 1.55 Number of contracts Underlying Security Expiration Date Strike price Call / Put Premium 12

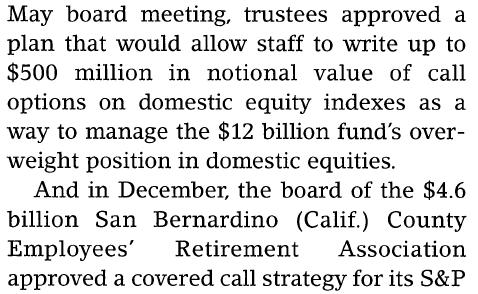
 a covered call for income * The colored line")
13 Simple Options Profit-and-Loss Diagrams Long call gives the holder the right to buy the underlying security at a specified price for a certain, fixed period of time. Protective put investor purchases a put (right to sell) while holding underlying security. Buy-write investor buys a security and writes (sells) a covered call for income * The colored line reflects a position with both options and stock 13
14 Some Key CBOE Options in Jan Options Symbol CBOE Options Product Put Avg. Daily Volume Call Avg. Daily Volume Pu/Call Ratio for January Volume Index Options SPX S&P 500 Index 451, , VIX CBOE Volatility Index (options) 65, , RUT Russell 2000 Index 30,430 22, OEX S&P 100 Index (American-Style Exercise) 24,559 17, NDX Nasdaq 100 Index 19,249 14, DJX Dow Jones Industrial Average 8,068 6, Equity Options C Citigroup, Inc. 35, , BAC Bank of America Corporation 46,485 89, AAQ Apple, Inc. 33,265 57, INQ Intel Corporation 20,099 41, JPM JPMorgan Chase & Co. 23,630 32, MQF Microsoft Corporation 12,389 38, GE General Electric Company 18,948 32, F Ford Motor Company 18,458 25, GS The Goldman Sachs Group, Inc. 17,281 24, YUX YRC Worldwide, Inc. 22,167 15, AA ALCOA, Inc. 11,560 19, WFC Wells Fargo & Company 15,692 15, ZQN Amazon.Com, Inc. 11,891 15, GOQ Google, Inc. 10,682 16, RUL Research in Motion Limited 9,779 16, Sources: CBOE and 14
15 Put/call Ratios 2.5 Put/call Ratios for CBOE Options Rolling 20-day ratios of Put/call Volumes Index Options Equity Options VIX options Nov Nov Nov Nov-2009 (Nov. 29, May 17, 2010) Source: 15
16 Historic Volatility Since day Historic Volatility for U.S. Stock Indexes (DJIA 1900 to 1927, and S&P 500 from 1928 to Sept. 2009) on Nov. 29, on Nov. 20, on Nov. 14, 2008 End-of-week values Mean 15.8 Median Jan-00 Jan-20 Jan-40 Jan-60 Jan-80 Jan-00 Source: Bloomberg 16
17 30-Day Historic Volatilities for Select MSCI Country Indexes MSCI Ireland Dec Dec Dec MSCI United States MSCI China Free (30-Dec May-2010) Sources: Bloomberg and CBOE 17
18 Implied Volatility Indexes Since 1986 Indexes Measuring 30-day Implied Volatility (Jan. 2, Nov. 2, 2009) Daily Closing Values VXO on Oct. 19, OVX on Dec. 11, VIX on Nov. 20, 2008 OVX - CBOE Crude Oil Volatility Index VIX - CBOE Volatility Index VXO - CBOE S&P 100 Volatility Index (pre-1990) 0 21-Feb Jan Jan Jan Jan-1986 Source: Bloomberg Implied Volatility is a measure of the option market s expectations for the future volatility of the underlying security. It is determined by using option prices currently existing in the market at the time (rather than using historical data on the price changes of the underlying stock or index). It is the annualized volatility implied by the market price of the option based on an option pricing model. If a 30-day option and a one-year option both have implied volatilities of 25, that means that the options prices imply that options investors believe that there is about a 68% chance that the price of the underlying will be approximately -- (a) within 25% (or one standard deviation) of its current price one year from now, and (b) within 7.3% (or one standard deviation) of its current price one month from now. (The annualized number of 25% is divided by (the square root of 12)). 18
19 VIX and S&P 500 Indexes S&P 500 (SPX) VIX Daily Closing Prices SPX 0 VIX 2-Jan Jan Jan Jan Jan-2010 Sources: CBOE and Bloomberg. (Jan. 2, May 14, 2010). 0 CBOE Volatility Index (VIX) Average daily closing value in each of 20 years Sources: CBOE and Bloomberg 19
20 Worldwide Volatility Indexes Weekly Highs May Apr Mar-2010 OVX - CBOE Crude Oil Volatility Idx VIX - CBOE Volatility Index GVZ - CBOE Gold Volatility Index EVZ - CBOE EuroCurrency Volat Idx VSTOXX - EuroSTOXX 50 Volatility 30 INVIX - India VIX Index 0 16-May Apr Mar-2010 VFTSE - FTSE 100 Volatility Idx (May 16, May 14, 2010) Sources: CBOE and Bloomberg 20

21 Key Features of VIX High Volatility of Volatility Historic Volatility of Daily Returns 132.0% 127.3% VIX (spot) 83.3% 45.8% 94.2% 56.0% 78.5% 88.9% 88.9% 69.2% VIX Nearterm Futures Negative Correlations of Daily Returns for VIX vs. S&P Sources: CBOE and Bloomberg 21
22 Recent VIX Futures & Call Options 50 VIX and VIX Futures Four Days -- % Change in Daily Closing Prices from May 3 rd to May 7 th S&P 500 Down 7.6% Daily Closing Values VIX Index VIX May '10 Futures VIX Sept '10 Futures VIX Index Up 103% VIX May Fut. Up 60% VIX Sept. Fut. Up 23% Apr May May-2010 Daily Closing Price VIX May 2010 Call Options 15-Apr May May-2010 (April 15, May 17, 2010) Sources: CBOE and Bloomberg 25 Strike Price 30 Strike Price 35 Strike Price VIX May25 Calls Up 865% VIX May30 Calls Up 1233% VIX May35 Calls Up 1580% Please read the risk disclosure at the last slide 22
23 VIX Term Structure on April 14, 2010 (May 2010 Dec. 2011) Expectations of VIX in future months at Dec. 17, 2011 expiration mid at May 22, 2010 expiration VIX closed at on April 14,
 0% VIX Futures or Options -19.7% 2.")
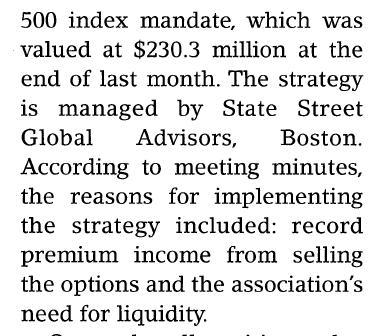
24 Impact of Adding Long VIX Futures or Options to a Traditional Portfolio During the 5-Month Period Aug Dec From: "VIX Futures and Options: A Case Study of Portfolio Diversification During the 2008 Financial Crisis." The Journal of Alternative Investments (Fall 2009) 0% VIX Futures or Options -19.7% 2.5% VIX Futures -15.9% 10% VIX Futures -4.0% 3% ATM VIX Call Options 20.8% 3% 25%-OTM VIX Call Options 97.2% Please see disclaimers at paper at 24
 by Edward Szado, CFA, Research")
25 UMass Study on Diversification with VIX Futures & Options With a 10% allocation to VIX futures (in black), returns increased by 3.5 percentage points and standard deviation cut by one-third. From: VIX Futures and Options - A Case Study of Portfolio Diversification During the 2008 Financial Crisis (published in The Journal of Alternative Investments in 2009) by Edward Szado, CFA, Research Analyst at the Center for International Securities and Derivatives Markets (CISDM), University of Massachusetts, Amherst 25
26 CBOE Performance Benchmark Indexes Index Ticker Introduced Data beginning Website CBOE S&P 500 BuyWrite BXM SM 2002 June 30, CBOE S&P 500 BXY SM %OTM BuyWrite CBOE Russell 2000 BuyWrite BXR SM 2006 CBOE DJIA BuyWrite BXD SM 2005 CBOE NASDAQ-100 BuyWrite BXN SM 2005 June 1, 1988 Dec. 29, 2000 Oct. 16, 1997 Dec. 30, CBOE S&P Collar CBOE S&P 500 PutWrite CLL SM 2008 June 30, PUT SM 2007 June 30, Bloomberg provides historical data for all seven indexes. 26
27 What is a Buy-write? Buy stocks, and write (or sell) a call option to gain premium income. Also known as a covered call. Pros add premium income, can reduce portfolio volatility and boost risk-adjusted returns. Cons forego some or all of the upside on stock position; underperformance in bull market. 27

28 CBOE S&P 500 BuyWrite Index (BXM) Benchmark for strategy -- buy portfolio of S&P 500 stocks write (sell) cash-settled S&P 500 Index options every 3 rd Friday for income Announced in 2002 study by Duke U. Data history back to June 30, 1986 Innovative Index of the Year in 2004 More than $20 billion in buywrite funds 28

29 CBOE S&P 500 PutWrite Index (PUT) Benchmark for strategy -- write (sell) cash-settled S&P 500 put options every 3 rd Friday for income invest in Treasury Bills as collateral - finance the maximum loss from final settlement of the SPX puts Announced in 2007 Data history back to June 30, 1986 Innovative Index of the Year in
30 Growth of $1 PUT Index end value is 36% higher than that of the S&P 500 Indexes Since Mid-1986 $12 $11.22 PUT Index re-scaled to $1 as of June 30, 1986 $8 $4 $8.38 $8.23 $4.80 $2.74 BXM S&P Yr Tr Bd 3-Mo Tr Bill $0 30-Jun Jun Jun-2008 (June 30, Apr. 30, 2010) Sources: CBOE, Bloomberg and Citigroup Fixed Incom e Indexes Please see important risk disclosures on the final slide 30
31 Rolling 5-year Annualized Returns (June 1991 April 2010) 40% 30% 20% 10% BXM S&P 500 0% -10% Jun-09 Jun-07 Jun-05 Jun-03 Jun-01 Jun-99 Jun-97 Jun-95 Jun-93 Jun-91 Sources: Bloomberg and CBOE 31
32 Returns and Volatility (June 30, 1986 April 30, 2010) Total Return Indexes Annualized Returns Standard Deviation PUT - CBOE S&P 500 PutWrite Index 10.7% Citigroup 5-yr Treasury 4.7% BXM - CBOE S&P 500 BuyWrite Index 9.3% PUT - CBOE S&P 500 PutWrite Index 10.3% SPTR - S&P 500 Total Return 9.2% CLL - CBOE S&P Collar Index 11.0% Russell 2000 Total Return Index 8.3% BXM - CBOE S&P 500 BuyWrite Index 11.2% SP GSCI TR 7.7% Citigroup 30-yr Treasury 11.7% MSCI World Index (TR) Net US$ 7.4% MSCI World Index (TR) Net US$ 15.6% CLL - CBOE S&P Collar Index 7.1% SPTR - S&P 500 Total Return 15.7% Citigroup 30-yr Treasury 6.8% Russell 2000 Total Return Index 20.0% Citigroup 5-yr Treasury 6.5% SP GSCI TR 20.7% Sources: CBOE, Bloomberg and Citigroup Fixed Income Indexes Please see last slide for important risk disclosures. 32
33 Returns and Volatility (July 1986 April. 2010) PUT CBOE S&P 500 PutWrite Index BXM CBOE S&P 500 BuyWrite Index CLL CBOE S&P Collar Index Annualized Returns 12% 8% 4% T-bill 3-mo. T-note 5-yr. PUT CLL BXM T-bond 30-yr. S&P 500 MSCI World Russell % 0% 5% 10% 15% 20% Standard Deviation of Monthly Returns Sources: CBOE and Bloomberg. The figures above represent total return indexes; Citigroup indexes are used for the fixed income numbers. Please see risk disclosures. Past performance is not a guarantee of future returns. 33
34 Source of Returns- Sell Rich Options From: "Finding Alpha via Covered Index Writing," Financial Analysts Journal. (September/October 2006). 34
35 Gross Monthly Income from Options Premiums 9% BXM Index - Monthly Premiums Gross amount* received as a % of the underlying Average was about 1.8% per month 6% 3% 0% Jun-88 Jun-93 Jun-98 Jun-03 Jun-08 (June May 2010). Source: CBOE. * Please note that these are gross amounts, and the net return often will be substantailly less with a buywrite strategy. 35
36 Histograms of Monthly Index Returns for 284 Months (July Feb. 2010) Sources: CBOE and Bloomberg 100 S&P 500 TR Index BXM Index % 20% 16% 12% 8% 4% 0% -4% -8% -12% -16% -20% -24% 24% 20% 16% 12% 8% 4% 0% -4% -8% -12% -16% -20% -24% Low month -21.5% High month 13.5% Low month -17.4% High month 8.2% 100 CLL Index PUT Index % -4% -8% -12% -16% -20% -24% % 4% % 20% 16% 12% % -4% -8% -12% -16% -20% -24% % 20% 16% 12% 8% 4% Low month -8.6% High month 10.8% Low month -17.7% High month 8.4% Number of months in which the index returns are within 2 percentage points under the number on the x-axis 36
37 Studies on BuyWrites Fund Evaluation Group. Study of BXD and VXD Indexes (2007) at Callan Associates. An Historical Evaluation of the CBOE S&P 500 BuyWrite Index (BXM). (Oct. 2006). at Goldman Sachs. "Finding Alpha via Covered Index Writing," Financial Analysts Journal. (September/October 2006). Ibbotson Associates. Feldman, Barry, and Dhruv Roy, "Passive Options-Based Investment Strategies: The Case of the CBOE S&P 500 BuyWrite Index." The Journal of Investing. (Summer 2005). at Duke University. Whaley, Robert. "Risk and Return of the CBOE BuyWrite Monthly Index" The Journal of Derivatives (Winter 2002). University of Massachusetts. Schneeweis, Thomas, and Richard Spurgin. "The Benefits of Index Option-Based Strategies for Institutional Portfolios" The Journal of Alternative Investments, (Spring 2001). 37


 is available")
38 Study By Ibbotson Associates A case study of a real-life BXM investment program is included. The study (both long and short versions) is available at 38

39 Study by Fund Evaluation Group 39

40 Risk-adjusted Returns Exhibit 6 from the Callan Study 40
41 Exhibit 17 from Callan Associates 2006 Study 10.25% Annualized Return versus Risk (June 1, August 31, 2006) 10.00% Aggressive + BXM 9.75% Moderate + BXM Aggressive 9.50% Moderate Returns 9.25% 9.00% 8.75% Conservative + BXM Conservative 8.50% 8.25% 3.0% 4.0% 5.0% 6.0% 7.0% 8.0% 9.0% 10.0% 11.0% 12.0% 13.0% Standard Deviation Measuring the impact of adding CBOE BXM to diversified portfolios. Calculated with monthly rebalancing over the period June 1, 1988 to August 31, BXM substituted for 10% of large cap equity exposure in each asset mix. In all cases, return is essentially unchanged while risk is reduced, improving the risk-adjusted return as measured by the Sharpe ratio. 41


42 Pensions & Investments Sept. 7, 2009 excerpts 42
43 Returns and Volatility for Select Indexes A-T-M BuyWrite BXM - CBOE S&P 500 BuyWrite Index A-T-M BuyWrite BXY - CBOE S&P 500 2% OTM BuyWrite Put Write PUT - CBOE S&P 500 PutWrite Index Collar CLL - CBOE S&P Collar Index US Large Cap SPTR - S&P 500 Total Return World Stocks MSCI World Index (TR) Net US$ U.S. Treasuries Citigroup 30-yr Treasury Commodities SP GSCI TR BXM BXY PUT CLL SPTR World 30-Yr Tr GSCI TR One-Year Annualized Return 25.6% 35.0% 29.5% 24.8% 38.8% 37.0% -3.8% 30.6% Three-Year Annualized Return -1.7% -0.9% 2.3% -3.0% -5.0% -6.8% 5.6% -7.9% Five-Year Annualized Return 2.8% 4.3% 6.0% 2.4% 2.6% 3.3% 3.9% -4.6% Ten-Year Annualized Return 2.4% 2.5% 4.7% 1.3% -0.2% 0.4% 6.5% 4.1% Twenty-Year Annualized Return 9.2% 9.9% 10.5% 6.8% 8.9% 6.5% 7.7% 4.6% Annualized Return Since 30-Jun % 10.7% 7.1% 9.2% 7.4% 6.8% 7.7% One-Year Standard Deviation 9.5% 10.0% 8.3% 9.4% 11.7% 13.9% 11.0% 22.5% Three-Year Standard Deviation 16.2% 18.1% 16.1% 12.2% 20.2% 21.9% 18.6% 31.4% Five-Year Standard Deviation 12.8% 14.4% 12.7% 10.3% 16.3% 17.7% 15.6% 27.8% Ten-Year Standard Deviation 12.2% 13.9% 12.0% 10.7% 15.9% 16.4% 13.8% 25.4% Twenty-Year Standard Deviation 10.7% 12.4% 10.0% 10.6% 15.0% 15.3% 11.8% 21.9% Standard Deviation Since 30-Jun % 10.3% 11.0% 15.7% 15.6% 11.7% 20.7% Total Returns Indexes, for Periods Ending April 30, Sources: CBOE and Bloomberg 43
44 Options involve risk and are not suitable for all investors. Prior to buying or selling an option, a person must receive a copy of Characteristics and Risks of Standardized Options (the ODD ). The ODD and supporting documentation for any claims, comparisons, recommendations, statistics or other technical data in these materials are available by calling OPTIONS, or contacting CBOE at The information in these materials is provided solely for general education and information purposes and therefore should not be considered complete, precise, or current. Many of the matters discussed are subject to detailed rules, regulations, and statutory provisions which should be referred to for additional detail and are subject to changes that may not be reflected in these materials. No statement within this material should be construed as a recommendation to buy or sell a security or to provide investment advice. The CBOE S&P 500 BuyWrite Index (BXM SM ), CBOE S&P 500 2% OTM BuyWrite Index (BXY SM ), CBOE DJIA BuyWrite Index (BXD SM ), CBOE Russell 2000 BuyWrite Index (BXR SM ) and CBOE NASDAQ-100 BuyWrite Index (BXN SM ) (the Indexes ) are designed to represent proposed hypothetical buy-write strategies. Like many passive benchmarks, the Indexes do not take into account significant factors such as transaction costs and taxes. Transaction costs and taxes for a buy-write strategy could be significantly higher than transaction costs for a passive strategy of buying-and-holding stocks. Investors attempting to replicate the Indexes should discuss with their brokers possible timing and liquidity issues. Past performance does not guarantee future results. These materials contain comparisons, assertions, and conclusions regarding the performance of indexes based on backtesting, i.e., calculations of how the indexes might have performed in the past if they had existed. Backtested performance information is purely hypothetical and is provided in this document solely for informational purposes. The methodology of the Indexes is owned by Chicago Board Options Exchange, Incorporated (CBOE) may be covered by one or more patents or pending patent applications. Standard & Poor's, S&P, and S&P 500 are registered trademarks of The McGraw-Hill Companies, Inc. and are licensed for use by CBOE. "Dow Jones", "The Dow", "DJIA" and Dow Jones Industrial Average are trademarks of Dow Jones & Company, Inc. and have been licensed for use for certain purposes by CBOE. CBOE's options based on Dow Jones indexes and financial products based on the CBOE DJIA BuyWrite Index are not sponsored, endorsed, marketed or promoted by Dow Jones and Dow Jones makes no representations regarding the advisability of investing in such products. Nasdaq, Nasdaq-100, and Nasdaq-100 Index, are trademarks of The Nasdaq Stock Market, Inc. (which with its affiliates is referred to as the "Corporations") and are licensed for use by CBOE. The CBOE NASDAQ-100 BuyWrite Index (the "BXN Index") is not derived, maintained, published, calculated or disseminated by the Corporations. CBOE Volatility Index, VIX, CBOE and Chicago Board Options Exchange are registered trademarks and BXM, BXD, BXN and BXY are servicemarks of CBOE. Copyright 2010 Chicago Board Options Exchange, Incorporated. All Rights Reserved. 44
Options for Managing Volatility
 Options for Managing Volatility Historical Performance of Options-Related Strategies -- Income -- Diversification -- Risk-adjusted Returns By Matt Moran VP, Chicago Board Options Exchange (312) 786-7249
Options- and Volatility-Based Strategy Benchmark Indexes
 Options- and Volatility-Based Strategy Benchmark Indexes FAQ on Strategies Designed for Portfolio Management By Matt Moran, VP, Cboe Cboe RMC Asia at Conrad Hong Kong 12:30 p.m. on Tuesday, 5 Dec. 2017
Options- and Volatility based Benchmark Indexes > Manage Portfolio Volatility > Generate Premium Income > Potentially Enhance Risk-adjusted Returns
 Options- and Volatility based Benchmark Indexes > Manage Portfolio Volatility > Generate Premium Income > Potentially Enhance Risk-adjusted Returns Prepared for CBOE RMC Asia on 30 Nov. 2016 By Matt Moran,
3 Gurus VIX and VIX Related Products. Russell Rhoads, CFA Instructor The Options Institute Author Trading VIX Derivatives
 3 Gurus VIX and VIX Related Products Russell Rhoads, CFA Instructor The Options Institute Author Trading VIX Derivatives CBOE Disclaimer Options involve risks and are not suitable for all investors. Prior
Beyond BXM Next Generation Option Strategy Benchmarks
 CBOE Risk Management Conference Europe Beyond BXM Next Generation Option Strategy Benchmarks William Speth, VP Research & Product Development September 28, 215 Forward Looking Statements This presentation
Russell 2000 Index Options
 Interactive Brokers Webcast Russell 2000 Index Options April 20, 2016 Presented by Russell Rhoads, Senior Instructor Disclosure Options involve risks and are not suitable for all investors. Prior to buying
Instructor The Options Institute Chicago Board Options Exchange, Incorporated. All rights reserved.
 Al Alternative i V Volatility l ili Indexes I d Russell Rhoads, CFA Instructor The Options Institute 211 Chicago Board Options Exchange, Incorporated. All rights reserved. CBOE Disclaimer Options involve
Hedge Fund Indexes. Prepared for QWAFAFEW Chicago October By Matthew Moran
 Hedge Fund Indexes Prepared for QWAFAFEW Chicago October 2002 By Matthew Moran Hedge Fund Assets (in $billions) Source: Hedge Fund Research - HFR Inc. $600 $500 $571.7 $536.1 $487.3 $400 $300 $200 $100
WisdomTree CBOE S&P 500 PutWrite Strategy Fund (PUTW) and CBOE S&P 500 PutWrite Index (PUT)
 and CBOE S&P 500 PutWrite Index (PUT)") Q3 2017 WisdomTree CBOE S&P 500 PutWrite Strategy Fund (PUTW) and CBOE S&P 500 PutWrite (PUT) WisdomTree.com 866.909.9473 WisdomTree CBOE S&P 500 PutWrite Strategy Fund +Investment Objective: The WisdomTree
Q3 2017 WisdomTree CBOE S&P 500 PutWrite Strategy Fund (PUTW) and CBOE S&P 500 PutWrite (PUT) WisdomTree.com 866.909.9473 WisdomTree CBOE S&P 500 PutWrite Strategy Fund +Investment Objective: The WisdomTree
By Matt Moran, VP, CBOE Jan
 New Studies on Uses of Options Protection, and Enhancing Income and Risk-Adjusted Returns April 2016 Continuing Education Presentations for Five CFA Societies in Texas Jan By Matt Moran, VP, CBOE 1-312-786-7249
Introduction to VIX Futures. Russell Rhoads, CFA Instructor The Options Institute
 Introduction to VIX Futures Russell Rhoads, CFA Instructor The Options Institute CBOE Disclaimer Options and futures involve risks and are not suitable for all investors. Prior to buying or selling options,
New Developments in Options and Volatility-Based Benchmarks
 CBOE Risk Management Conference Asia New Developments in Options and Volatility-Based Benchmarks Bruce Traan, Director Research & Product Development November 30, 2016 Forward Looking Statements This presentation
Risk Reducing & Income Enhancing. Buy-Write Strategy. 15 Years of the Russell 2000 Buy-Write
 Risk Reducing & Income Enhancing Buy-Write Strategy 15 Years of the Russell 2000 Buy-Write About OIC The Options Industry Council (OIC) was created as an industry cooperative to increase the awareness,
Short Volatility Trading with Volatility Derivatives. Russell Rhoads, CFA
 Short Volatility Trading with Volatility Derivatives Russell Rhoads, CFA Disclosure Options involve risk and are not suitable for all investors. Prior to buying or selling an option, a person must receive
Equity Volatility and Covered Call Writing
 December 2017 Equity Volatility and Covered Call Writing Executive Summary Amid uncertainty in the markets and investor desire for lower volatility, investors may want to consider a covered call strategy
Disclosure 6/26/2017. TEXPERS Derivatives Symposium. 6/20/2017 Chicago Board Options Exchange (CBOE)
") 6/20/2017 Chicago Board Options Exchange (CBOE) TEXPERS Derivatives Symposium Kevin P. Davitt CBOE Options Institute davitt@cboe.com Disclosure Options involve risks and are not suitable for all investors.
6/20/2017 Chicago Board Options Exchange (CBOE) TEXPERS Derivatives Symposium Kevin P. Davitt CBOE Options Institute davitt@cboe.com Disclosure Options involve risks and are not suitable for all investors.
CBOE Equity Market Volatility Indexes
 Interactive Brokers Webcast CBOE Equity Market Volatility Indexes March 26, 2014 Presented by Russell Rhoads, CFA Disclosure Options involve risks and are not suitable for all investors. Prior to buying
Option Strategies for a Long-Term Outlook
 Option Strategies for a Long-Term Outlook Interactive Brokers Webcast June 20, 2018 Russell Rhoads, CFA Disclosure Options involve risk and are not suitable for all investors. Prior to buying or selling
Attached you will find the press releases for each of the announcements.
 Information Circular IC06-37 Date: March 17, 2006 To: From: Re: CBOE Membership Bill Brodsky Ed Joyce Ed Tilly New Product Announcements At a press briefing hosted by CBOE at the Futures Industry Association
15 Years of the Russell 2000 Buy Write
 15 Years of the Russell 2000 Buy Write September 15, 2011 Nikunj Kapadia 1 and Edward Szado 2, CFA CISDM gratefully acknowledges research support provided by the Options Industry Council. Research results,
Weeklys Options and Short Term Strategies. Russell A. Rhoads, CFA
 SM Weeklys Options and Short Term Strategies Russell A. Rhoads, CFA CBOE Disclaimer Options involve risks and are not suitable for all investors. Prior to buying or selling options, an investor must receive
Trading Volatility: Theory and Practice. FPA of Illinois. Conference for Advanced Planning October 7, Presented by: Eric Metz, CFA
 Trading Volatility: Theory and Practice Presented by: Eric Metz, CFA FPA of Illinois Conference for Advanced Planning October 7, 2014 Trading Volatility: Theory and Practice Institutional Use Only 1 Table
New Studies on Funds Use of Options for Managing Volatility Prepared for CFA CE Seminars on 16th and 19th of Sept in Mumbai and Kolkata
 New Studies on Funds Use of Options for Managing Volatility Prepared for CFA CE Seminars on 16th and 19th of Sept. 2015 in Mumbai and Kolkata Jan By Matt Moran, VP, CBOE 1-312-786-7249 Important Disclosures
Beyond VIX. Trading Volatility & Variance Across Asset Classes. CBOE RMC Europe October 2, 2013
 Beyond VIX Trading Volatility & Variance Across Asset Classes CBOE RMC Europe October 2, 2013 Life after VIX Culture of Innovation Grow from core competencies Leverage experience, apply to other asset
CBOE Volatility Index and VIX Futures Trading
 CBOE Volatility Index and VIX Futures Trading Russell Rhoads, CFA Disclosure In order to simplify the computations, commissions have not been included in the examples used in these materials. Commission
New Developments in Options and Volatility-Based Benchmarks
 CBOE Risk Management Conference Europe New Developments in Options and Volatility-Based Benchmarks William Speth, VP Research & Product Development September 26, 2016 Forward Looking Statements This presentation
Volatility Market Review / Preview
 Interactive Brokers Webcast Volatility Market Review / Preview Russell Rhoads, CFA Director The Options Institute Disclosure Options involve risks and are not suitable for all investors. Prior to buying
Index Options and Credit Spreads
 Interactive Brokers Webcast Index Options and Credit Spreads December 14, 2016 Disclosure Options involve risks and are not suitable for all investors. Prior to buying or selling an option, an investor
Options and Volatility Benchmarks & Indicators Cboe Risk Management Conference Asia. John Hiatt
 Options and Volatility Benchmarks & Indicators Cboe Risk Management Conference Asia John Hiatt December 5, 2017 Using options benchmarks & volatility indicators Using options for benchmarks & volatility
Short-Term Trading with SPX Options
 Short-Term Trading with SPX Options Interactive Brokers Webcast Russell Rhoads, CFA Disclosure Options involve risk and are not suitable for all investors. Prior to buying or selling an option, a person
Interactive Brokers Webcast. VIX Trading Strategies Russell Rhoads, CFA Senior Instructor The Options Institute CBOE
 Interactive Brokers Webcast VIX Trading Strategies Russell Rhoads, CFA Senior Instructor The Options Institute CBOE Disclosure Statement Options involve risks and are not suitable for all investors. Prior
Risk Mitigating Collar Strategy
 Risk Mitigating Collar Strategy Loosening Your Collar: Alternative Implementations of QQQ Collars www.optionseducation.org About OIC The Options Industry Council (OIC) was created as an industry cooperative
The Risk and Return Characteristics of the Buy Write Strategy On The Russell 2000 Index
 The Risk and Return Characteristics of the Buy Write Strategy On The Russell 2000 Index Nikunj Kapadia and Edward Szado 1 January 2007 1 Isenberg School of Management, University of Massachusetts, Amherst,
Developments in Volatility-Related Indicators & Benchmarks
 Developments in Volatility-Related Indicators & Benchmarks William Speth, Global Head of Research Cboe Multi-Asset Solutions Team September 12, 18 Volatility-related indicators unlock valuable information
Dynamic ETF Option Strategy
 Dynamic ETF Option Strategy Dynamic ETF Option Strategy The Dynamic ETF Option strategy embodies the idea of selling ETF put options against cash and collecting premium that seeks continuous income stream
VIX Option Strategies
 VIX Option Strategies Russell Rhoads, CFA Instructor The Options Institute 2010 Chicago Board Options Exchange, Incorporated. All rights reserved. CBOE Disclaimer Options involve risks and are not suitable
Interpreting Volatility-Related Indicators & Benchmarks
 Interpreting Volatility-Related Indicators & Benchmarks William Speth, Head of Research Cboe Multi-Asset Solutions Team March 7, 18 Volatility-related indicators & benchmarks unlock valuable information
Equity Volatility Management
 Equity Volatility Management -- Income -- Diversification -- Risk-adjusted Returns Please read disclosures at the last slide Prepared for the 11 th Annual Closed-end Funds and Global ETFs Capital Link
First Half 2014 Volatility Trading Review
 Interactive Brokers Webcast First Half 2014 Volatility Trading Review July 16, 2014 Presented by Russell Rhoads, CFA Disclosure Statement Options involve risks and are not suitable for all investors. Prior
September 30, 2013
 www.cempindex.com September 30, 2013 Compass Efficient Model Portfolios Compass EMP was founded in 1996. Compass EMP has served as consultants to large institutions such as governments, endowments, foundations,
Trading Volatility with VIX Futures and Options. Peter Lusk. Instructor The Options Institute at CBOE
 Trading Volatility with VIX Futures and Options Peter Lusk Instructor The Options Institute at CBOE Disclosures In order to simplify the computations, commissions have not been included in the examples
BROAD COMMODITY INDEX
 BROAD COMMODITY INDEX COMMENTARY + STRATEGY FACTS JULY 2018 100.00% 80.00% 60.00% 40.00% 20.00% 0.00% -20.00% -40.00% -60.00% CUMULATIVE PERFORMANCE ( SINCE JANUARY 2007* ) -80.00% ABCERI S&P GSCI ER BCOMM
BROAD COMMODITY INDEX
 BROAD COMMODITY INDEX COMMENTARY + STRATEGY FACTS APRIL 2017 80.00% CUMULATIVE PERFORMANCE ( SINCE JANUARY 2007* ) 60.00% 40.00% 20.00% 0.00% -20.00% -40.00% -60.00% -80.00% ABCERI S&P GSCI ER BCOMM ER
Portfolio Risk Management with RVX SM Futures
 Portfolio Risk Management with RVX SM Futures 6 March 2018 Edward Szado, Ph.D., CFA Associate Professor of Finance, Providence College Director of Research, INGARM (Institute for Global Asset and Risk
CBOE Strategy Benchmarks
 White Paper CBOE Strategy Benchmarks Differences Between CBOE Strategy Benchmarks June 2013 by Catherine Shalen Differences Between CBOE Strategy Benchmarks 2 CBOE is the leading Exchange in designing
BROAD COMMODITY INDEX
 BROAD COMMODITY INDEX COMMENTARY + STRATEGY FACTS AUGUST 2018 120.00% 100.00% 80.00% 60.00% 40.00% 20.00% 0.00% -20.00% -40.00% -60.00% CUMULATIVE PERFORMANCE ( SINCE JANUARY 2007* ) -80.00% ABCERI S&P
Performance Analysis of Option-Based Equity Mutual Funds, CEFs, and ETFs: An Update
 Performance Analysis of Option-Based Equity Mutual Funds, CEFs, and ETFs: An Update Keith Black, Ph.D., CAIA, CFA Managing Director of CAIA (Chartered Alternative Investment Analyst) Association Edward
PUTW. WisdomTree CBOE S&P 500 PutWrite Strategy Fund
 WisdomTree CBOE S&P 500 PutWrite Strategy Fund PUTW The S&P 500 Index (SPX) is one of the most widely followed indexes for U.S. stock market exposure. And many investors have an investment (or two) that
Interactive Brokers Webcast. Options on ETFs. February 13, 2013 Presented by Russell Rhoads, CFA
 Interactive Brokers Webcast Options on ETFs February 13, 2013 Presented by Russell Rhoads, CFA Disclosure CBOE Disclosure Statement Options involve risks and are not suitable for all investors. Prior to
Presentation Outline. What is the VIX? VIX and the Market VIX Futures Contract Specs & Pricing VIX Options Unique Characteristics Trading Case Studies
 Chicago Board Options Exchange Trading the VIX VIX Futures and VIX Options Presented by The s Options Institute www.cboe.com 1 Disclosures In order to simplify the computations, commissions have not been
New Risk Management Strategies
 Moderator: Jon Najarian, Co-Founder, optionmonster.com New Risk Management Strategies Wednesday, May 4, 2011; 2:30 PM - 3:45 PM Speakers: Jim Lenz, Chief Credit and Risk Officer, Wells Fargo Advisors John
Indexed Universal Life. Disclosure
 Indexed Universal Life Matt Fowler, CLU SVP ISD Brokerage August 11 th, 2015 2012 Lincoln National Corporation LCN 201204-2066961 Disclosure This seminar is for continuing education purposes only. It is
Weeklys Options What s New?
 Interactive Brokers Webcast SM Weeklys Options What s New? July 17, 2013 Presented by Russell Rhoads, CFA Senior Instructor Disclosure CBOE Disclosure Statement Options involve risks and are not suitable
Analytic Investors, LLC Mandate: Buy Write Strategy Hired: 2011
 Analytic Investors, LLC Mandate: Buy Write Strategy Hired: 2011 Firm Information Investment Approach Total ARMB Mandate Wells Fargo Asset Management acquired Analytic Investors on October 1, 2016. As of
Risk Management for Equity Asset Managers. John W. Labuszewski
 Risk Management for Equity Asset Managers John W. Labuszewski Disclaimer Futures trading is not suitable for all investors, and involves the risk of loss. Futures are a leveraged investment, and because
Evolving Equity Investing: Delivering Long-Term Returns in Short-Tempered Markets
 March 2012 Evolving Equity Investing: Delivering Long-Term Returns in Short-Tempered Markets Kent Hargis Portfolio Manager Low Volatility Equities Director of Quantitative Research Equities This information
Dividend Income Strategy. 999 Vanderbilt Beach Road, Suite 102 Naples, Florida V:
 Dividend Income Strategy 3/31/2018 999 Vanderbilt Beach Road, Suite 102 Naples, Florida 34108 V: 866-459-9998 10 Executive Summary Experienced Specialists Since it s inception on October 1 st, 2007,The
Investment Strategy On-Demand Webinar Series
 Investment Strategy On-Demand Webinar Series Know Your Options Kevin Hrad, CAIA, Hewitt EnnisKnupp The Required Return Dilemma and the Need to Diversify Institutional investors return assumptions have
BROAD COMMODITY INDEX
 BROAD COMMODITY INDEX COMMENTARY + STRATEGY FACTS JUNE 2017 80.00% CUMULATIVE PERFORMANCE ( SINCE JANUARY 2007* ) 60.00% 40.00% 20.00% 0.00% -20.00% -40.00% -60.00% -80.00% ABCERI S&P GSCI ER BCOMM ER
MANAGED FUTURES INDEX
 MANAGED FUTURES INDEX COMMENTARY + STRATEGY FACTS JUNE 2018 CUMULATIVE PERFORMANCE ( SINCE JANUARY 2007* ) 120.00% 100.00% 80.00% 60.00% 40.00% 20.00% 0.00% AMFERI BARCLAY BTOP50 CTA INDEX S&P 500 S&P
MANAGED FUTURES INDEX
 MANAGED FUTURES INDEX COMMENTARY + STRATEGY FACTS JULY 2017 CUMULATIVE PERFORMANCE ( SINCE JANUARY 2007* ) 120.00% 100.00% 80.00% 60.00% 40.00% 20.00% 0.00% AMFERI BARCLAY BTOP50 CTA INDEX S&P 500 S&P
MANAGED FUTURES INDEX
 MANAGED FUTURES INDEX COMMENTARY + STRATEGY FACTS JULY 2018 CUMULATIVE PERFORMANCE ( SINCE JANUARY 2007* ) 120.00% 100.00% 80.00% 60.00% 40.00% 20.00% 0.00% AMFERI BARCLAY BTOP50 CTA INDEX S&P 500 S&P
BROAD COMMODITY INDEX
 BROAD COMMODITY INDEX COMMENTARY + STRATEGY FACTS JANUARY 2018 100.00% 80.00% 60.00% 40.00% 20.00% 0.00% -20.00% -40.00% -60.00% CUMULATIVE PERFORMANCE ( SINCE JANUARY 2007* ) -80.00% ABCERI S&P GSCI ER
VIX ETPs, Inter-Relationships between Volatility Markets and Implications for Investors and Traders
 Not a Product of Research / Not for Retail Distribution Citi Equities I U.S. Equity Trading Strategy VIX ETPs, Inter-Relationships between Volatility Markets and Implications for Investors and Traders
Alternative Investments: Risks & Returns
 Alternative Investments: Risks & Returns THE FAMILY ALTERNATIVE INVESTMENT CONFERENCE February 2007, Monaco Hossein Kazemi, PhD, CFA Managing Partner, AIA Professor of Finance, Univ of Massachusetts kazemi@alternativeanalytics.com
S&P 500 Optimal Weight Strategy. 9/30/ Vanderbilt Beach Road, Suite 102 Naples, Florida V:
 S&P 500 Optimal Weight Strategy 9/30/2018 999 Vanderbilt Beach Road, Suite 102 Naples, Florida 34108 V: 866-459-9998 10 Executive Summary Sector Momentum, Income, Broad U.S. Equity Exposure Existing financial
Volatility as a Tradable Asset: Using the VIX as a market signal, diversifier and for return enhancement
 Volatility as a Tradable Asset: Using the VIX as a market signal, diversifier and for return enhancement Joanne Hill Sandy Rattray Equity Product Strategy Goldman, Sachs & Co. March 25, 2004 VIX as a timing
Volatility Tracker -2.54% -0.25% -5.12%
 1/19/21 1. Comment Last week, I noted the very wide spread between short-term realized and implied volatilities. Although the selloff on Friday alleviated conditions slightly, [5] the spread is still large
MANAGED FUTURES INDEX
 MANAGED FUTURES INDEX COMMENTARY + STRATEGY FACTS SEPTEMBER 2018 CUMULATIVE PERFORMANCE ( SINCE JANUARY 2007* ) 140.00% 120.00% 100.00% 80.00% 60.00% 40.00% 20.00% 0.00% AMFERI BARCLAY BTOP50 CTA INDEX
MANAGED FUTURES INDEX
 MANAGED FUTURES INDEX COMMENTARY + STRATEGY FACTS JANUARY 2019 CUMULATIVE PERFORMANCE ( SINCE JANUARY 2007* ) 140.00% 120.00% 100.00% 80.00% 60.00% 40.00% 20.00% 0.00% AMFERI BARCLAY BTOP50 CTA INDEX S&P
MANAGED FUTURES INDEX
 MANAGED FUTURES INDEX COMMENTARY + STRATEGY FACTS JANUARY 2018 CUMULATIVE PERFORMANCE ( SINCE JANUARY 2007* ) 120.00% 100.00% 80.00% 60.00% 40.00% 20.00% 0.00% AMFERI BARCLAY BTOP50 CTA INDEX S&P 500 S&P
Methods for Getting Long Volatility
 Interactive Brokers Webcast Methods for Getting Long Volatility September 17, 2014 Presented by Russell Rhoads, CFA Copyright 2014 CBOE Disclosure Statement Options involve risks and are not suitable for
Vanguard Institutional Index Fund
 Vanguard Institutional Product Summary Seeks to track the performance of the Standard & Poor s 500. U.S. large-cap equity diversified across growth and value styles. Passively managed, full-replication
FTSE Nareit All Equity REITs equity market capitalization = $986.8 billion
 Nareit REIT Industry Fact Sheet Data as of, except where noted. Unless otherwise noted, all data are derived from, and apply only to, publicly traded US REITs. Industry Size FTSE Nareit All REITs equity
JUPITER POLICE OFFICER'S RETIREMENT FUND INVESTMENT PERFORMANCE PERIOD ENDING SEPTEMBER 30, 2008
 JUPITER POLICE OFFICER'S RETIREMENT FUND INVESTMENT PERFORMANCE PERIOD ENDING SEPTEMBER 30, 2008 NOTE: For a free copy of Part II (mailed w/i 5 bus. days from request receipt) of Burgess Chambers and Associates,
Gateway Active Index-Option Overwrite Composite Commentary
 Overwrite Composite Commentary EQUITY MARKETS The S&P 500 Index gained 3.09% for the second quarter of, bringing its year-to-date return to 9.34%. The equity market posted positive returns each month of
A Summary of the Rogers International Commodity Index 3 rd Quarter 2017
 A Summary of the Rogers International Commodity Index 3 rd Quarter 2017 The Rogers International Commodity Index (RICI ) was developed by Jim Rogers to be an international, diversified, investable raw
J.P. Morgan Alternative Index Multi-Strategy 5 (USD)
") J.P. Morgan Alternative Index Multi-Strategy 5 (USD) Structured Investments January 18, 2010 Benefit or brief highlights Important Information The information contained in this document is for discussion
J.P. Morgan Alternative Index Multi-Strategy 5 (USD) Structured Investments January 18, 2010 Benefit or brief highlights Important Information The information contained in this document is for discussion
First Quarter 2015 Earnings Presentation. May 1, 2015
 First Quarter 2015 Earnings Presentation May 1, 2015 Agenda Strategic Review Financial Review Questions and Answers Edward Tilly Chief Executive Officer Alan Dean Executive Vice President, CFO and Treasurer
Factor Mixology: Blending Factor Strategies to Improve Consistency
 May 2016 Factor Mixology: Blending Factor Strategies to Improve Consistency Vassilii Nemtchinov, Ph.D. Director of Research Equity Strategies Mahesh Pritamani, Ph.D., CFA Senior Researcher Factor strategies
Morgan Stanley ETF-MAP 2 Index Information
 Morgan Stanley ETF-MAP 2 Index Information Investing in instruments linked to the Morgan Stanley ETF-MAP 2 Index involves risks not associated with an investment in other instruments. See Risk Factors
Trading Options In An IRA Without Blowing Up The Account
 Trading Options In An IRA Without Blowing Up The Account terry@terrywalters.com July 12, 2018 Version 2 The Disclaimer I am not a broker/dealer, CFP, RIA or a licensed advisor of any kind. I cannot give
J.P. Morgan Structured Investments
 October 2009 J.P. Morgan Structured Investments The JPMorgan Efficiente (USD) Index Strategy Guide Important Information The information contained in this document is for discussion purposes only. Any
Explore your options. 440 COVERED CALL & COLLAR STRATEGIES
 Explore your options. 440 COVERED CALL & COLLAR STRATEGIES 440 Investment Group 2017 440 Investment Group Mariner Holdings Mariner brings together diverse teams of experienced wealth advisory, specialty
Explore your options. 440 COVERED CALL & COLLAR STRATEGIES
 Explore your options. 440 COVERED CALL & COLLAR STRATEGIES 440 Investment Group 2018 440 Investment Group Mariner Holdings Mariner brings together diverse teams of experienced wealth advisory, specialty
Covered Call Funds Resurrected
 Covered Call Funds Resurrected QWAFAFEW Presentation Boston, MA 3/15/2005 Stuart J. Rosenthal, CFA 1 Disclaimer The views I express here today are my own and do not reflect the views of Credit Suisse First
Emerging Markets Stocks Q STOCKS BONDS
 Q4 US Stock Market International Developed Stocks Emerging Markets Stocks Global Real Estate US Bond Market Global Bond Market ex US Q4 2017 STOCKS BONDS 6.34% 4.23% 7.44% 2.97% 0.39% 1.10% Since Jan.
Using Options to Manage Volatility
 Using Options to Manage Volatility CBOE European Risk Management Conference Scott Maidel, CFA Senior Portfolio Manager OCTOBER 2013 Important information and disclosures Russell Investment Group is a Washington,
FEDERAL RESERVE BANK OF MINNEAPOLIS BANKING AND POLICY STUDIES
 FEDERAL RESERVE BANK OF MINNEAPOLIS BANKING AND POLICY STUDIES Minneapolis Options Report October 3 rd Risk neutral expectations for inflation continue to fall. Bank and Insurance company share prices
Low Correlation Strategy Investment update to 31 March 2018
 The Low Correlation Strategy (LCS), managed by MLC s Alternative Strategies team, is made up of a range of diversifying alternative strategies, including hedge funds. A distinctive alternative strategy,
The Bull Market: Six Years Old And Not Over
 The Bull Market: Six Years Old And Not Over April 22-24, 2015 FOR PROFESSIONAL USE ONLY. FURTHER DISTRIBUTION OF THE INFORMATION CONTAINED HEREIN IS PROHIBITED WITHOUT PRIOR PERMISSION. Disclosures This
MARKET VOLATILITY - NUMBER OF "BIG MOVE" TRADING DAYS
 M O O D S W I N G S November 11, 214 Northern Trust Asset Management http://www.northerntrust.com/ investmentstgy James D. McDonald Chief Investment Stgist jxm8@ntrs.com Daniel J. Phillips, CFA Investment
NASDAQ Global Index. More information about the Index can be found at
 NASDAQ Global Index The NASDAQ Global Index is a float adjusted market capitalization-weighted index designed to track the performance of global equities covering over 98% of the entire listed market capitalization
W.E. Donoghue Power Dividend Total Return Index TM (PWRDXTR)
") W.E. Donoghue Power Dividend Total Return Index TM (PWRDXTR) A Tactical Dividend Strategy for Today s Low Yield World For more information call: 800 642-4276 S&P 500 Index Since the Turn of the Millennium
W.E. Donoghue Power Dividend Total Return Index TM (PWRDXTR) A Tactical Dividend Strategy for Today s Low Yield World For more information call: 800 642-4276 S&P 500 Index Since the Turn of the Millennium
First Quarter Earnings Conference Call May 1, 2012
 First Quarter Earnings Conference Call May 1, 2012 Agenda Strategic Review William Brodsky Chairman and CEO Financial Review Alan Dean Executive Vice President CFO and Treasurer Questions and Answers William
Manager Comparison Report June 28, Report Created on: July 25, 2013
 Manager Comparison Report June 28, 213 Report Created on: July 25, 213 Page 1 of 14 Performance Evaluation Manager Performance Growth of $1 Cumulative Performance & Monthly s 3748 3578 348 3238 368 2898
AlphaCentric Hedged Market Opportunity Fund
 AlphaCentric Hedged Market Opportunity Fund HMXAX HMXCX HMXIX Q1 2018 Presentation Seeks to achieve capital appreciation with lower overall volatility than the equity market For Registered Investment Professional
Fourth Quarter 2015 Market Review. March 2016
 Fourth Quarter 2015 Market Review March 2016 Agenda Market Review Investment Outlook and Portfolio Positioning 2 2015 was a Challenging Year for Investment Returns Last year was the first time since 2001
MAY 2018 Capital Markets Update
 MAY 2018 Market commentary U.S. ECONOMICS The U.S. added 223,000 jobs to payrolls in May, well above the consensus estimate of 180,000 and the expansion average of around 200,000. Sector job gains were
Cboe S&P 500 3x Up, 1x Down Enhanced Growth Index Series. Cboe S&P 500 3x Up, 1x Down Enhanced Growth Index Series
 Cboe S&P 500 3x Up, 1x Down Enhanced Growth Index Series As of December 2017 Table of Contents Introduction... 1 Highlights... 1 Index Series Value and Return... 2 First Roll Date and Starting Values...