JUPITER POLICE OFFICER'S RETIREMENT FUND INVESTMENT PERFORMANCE PERIOD ENDING SEPTEMBER 30, 2008
|
|
|
- Ashlynn Walters
- 5 years ago
- Views:
Transcription
1 JUPITER POLICE OFFICER'S RETIREMENT FUND INVESTMENT PERFORMANCE PERIOD ENDING SEPTEMBER 30, 2008 NOTE: For a free copy of Part II (mailed w/i 5 bus. days from request receipt) of Burgess Chambers and Associates, Inc.'s most recent Form ADV which details pertinent business procedures, please contact: 601 North New York Avenue, Suite 200, Winter Park, Florida 32789,
2 Jupiter Police Officers Retirement Fund Total Fund Investment Summary September 30, 2008 For the quarter, both domestic and foreign stocks experienced negative returns. Capital markets suffered from counter-party defaults, credit defaults, and forced liquidations caused by capital calls. While US backed securities gained favor, corporate bonds were sold off with few buyers, resulting in a further widening of credit spreads. The banking crises was amplified by the marked-to-market accounting rule established in late 2007, which requires loans to be marked to fair market. As investment banks were forced to deleverage and sell loans, the fair market value of all bank loans declined rapidly. The Fund experienced a -7.1% return, net. The best two performing asset classes were cash (+0.6%) and the REIT (0.0%). While Westwood had an impressive 12-month return, relative to its benchmark (-16.8% vs %), it trailed for the quarter (-8.0% vs. -6.1%). The i-shares R1000G account was in line with the target for the quarter and year. Robeco performed well below the target for the quarter. The firm has been on BCA s watch list for the past three quarters. Accordingly, BCA recommends that Robeco be terminated. Based upon the fact that 80% of the active mid-cap managers fell short of the index for the year, BCA recommends the assets be invested into the i-shares S&P 400 index. The total equity exposure at quarter-end was 47% versus 60% for the target. BCA recommends delaying in rebalancing until the credit markets experience sustained improvement. Investment Performance Quarter One Year Beginning Market Value 26,737,791 26,470,744 Ending Market Value 25,902,816 25,902,816 Net Contributions +1,055,299 +2,472,304 Investment Gain/(Loss) -1,890,274-3,040,232 Investment Return, Net -7.1% -11.2% Fiscal Year: October 1st to September 30th. 2
3 Jupiter Police Officers Retirement Fund Total Fund Compliance Checklist September 30, 2008 The annualized three-year total Fund performance achieved the return of the strategic benchmark. The annualized three-year total Fund performance ranked in the top 40th percentile (actual: top 35th). The annualized five-year total Fund performance achieved the return of the strategic benchmark. The annualized five-year total Fund performance ranked in the top 40th percentile (actual: 55th) Yes No The annualized three-year domestic equity performance achieved the domestic equity benchmark. (+0.0% vs. +0.8%) The annualized five-year domestic equity performance achieved the domestic equity benchmark. (+5.7% vs. +5.7%) The annualized three-year C.S. McKee international performance achieved the MSCI EAFE. The annualized three-year C.S. McKee international performance ranked in the top 40th percentile. The annualized three-year Adelente REIT performance achieved the DJ Wilshire REIT. The annualized three-year Adelante REIT performance ranked in the top 40th percentile. BCA recommends no action. The annualized three-year Sawgrass fixed income performance achieved the fixed income benchmark. The annualized three-year Sawgrass fixed income performance ranked in the top 40th percentile. The annualized five-year Sawgrass fixed income performance achieved the fixed income benchmark. The annualized five-year Sawgrass fixed income performance ranked in the top 40th percentile. Total equity securities (including the REIT), were within the 60% limitation. No more than 10% of the Fund s equity assets (at cost) were invested in foreign securities. No more than 10% of the fixed income portfolio (at cost) was invested in the securities of any single corporate issuer. 3
4 Total Fund Actual vs Target Asset Allocation September 30, 2008 ACTUAL ASSET ALLOCATION TARGET ASSET ALLOCATION DOMESTIC EQUITY 38.74% REAL ESTATE 2.83% INTERNATIONAL 8.24% DOMESTIC EQUITY 50.00% REAL ESTATE 10.00% INTERNATIONAL 10.00% CASH 6.05% FIXED INCOME 44.14% FIXED INCOME 30.00% MARKET VALUE PERCENT MARKET VALUE PERCENT MARKET VALUE PERCENT ACTUAL ACTUAL TARGET TARGET DIFFERENCE DIFFERENCE DOMESTIC EQUITY 10,035, % 12,951, % (2,915,485.3) (11.3%) INTERNATIONAL 2,133, % 2,590, % (456,921.6) (1.8%) REAL ESTATE 733, % 2,590, % (1,857,046.6) (7.2%) FIXED INCOME 11,433, % 7,770, % 3,662, % CASH 1,567, % % 1,567, % TOTAL FUND $25,902, % $25,902, % $ % 4
5 JUPITER POLICE OFFICER'S RETIREMENT FUND TOTAL FUND ASSET ALLOCATION TOTAL MARKET VALUE AS OF SEPTEMBER 30, 2008 $ 25,902,816 SAWGRASS FIXED INCOME 44.1% FIFTH THIRD CASH (ETF) 0.7% WESTWOOD LARGE CAP VALUE 17.9% ADELANTE REIT 2.8% ROBECO MID-CAP 12.7% I-SHARES RUSSELL 1000 GROWTH 8.1% CS MCKEE INTERNATIONAL 8.2% FIFTH THIRD CASH (R&D) 5.4% VALUE PERCENT SAWGRASS FIXED INCOME 11,433, WESTWOOD LARGE CAP VALUE 4,649, ROBECO MID-CAP 3,282, CS MCKEE INTERNATIONAL 2,133, I-SHARES RUSSELL 1000 GROWTH 2,104, FIFTH THIRD CASH (R&D) 1,396, ADELANTE REIT 733, FIFTH THIRD CASH (ETF) 170,
6 Total Fund September 30, 2008 Gross of Fees QTD 1 Year 2 Year 3 Year 5 Year Name Market Values ROR ROR ROR ROR ROR TOTAL FUND Equity Domestic Equity Westwood Large Cap Value 4,649, % -16.8% N/A N/A N/A i-shares Russell 1000 Growth 2,104, % -20.5% -2.3% 0.4% N/A Robeco Mid-Cap 3,282, % -20.6% N/A N/A N/A International CS McKee International 2,133, % -27.0% -3.9% 3.5% N/A Real Estate Real Estate Adelante REIT 733, % -15.3% -4.4% 5.4% 13.6% Fixed Income Fixed Income Sawgrass Fixed Income 11,433, % 3.4% 4.3% 4.3% 3.3% Cash Cash Fifth Third Cash (ETF) 170, % 3.2% 4.2% 4.2% N/A Fifth Third Cash (R&D) 1,396, % 3.5% 3.9% 4.0% 1.7% TOTAL: (1, 2) 25,902, % -10.6% 0.8% 2.9% 5.8% Strategic Model -5.8% -13.1% -1.1% 2.8% 6.7% 60% S&P500/40% LBAG -5.2% -12.3% -0.9% 1.9% 4.8% Russell 1000 Value -6.1% -23.6% -6.5% 0.1% 7.1% Russell 1000 Growth -12.3% -20.9% -2.8% 0.0% 3.7% S&P 400 Mid Cap -10.9% -16.7% -0.5% 1.8% 8.7% MSCI Gross EAFE -20.5% -30.1% -6.4% 1.6% 10.2% Wilshire REIT 4.8% -12.5% -4.7% 5.2% 13.4% Fixed Income Bnch -0.5% 3.7% 4.4% 4.2% 3.7% ML 3M TBill 0.6% 2.9% 4.1% 4.2% 3.3% 1 Fixed Income Bnch:5/07 100% LBAG; from 4/03 100% LB Int Ag; from 6/02 100% ML Dom Bd 2 Strategic Model (IPS Hybrid Benchmark): From 5/07 45% R % 6EAFE + 10% Wilshire REIT + 35% LBAG; from 4/04 50% R3000 +
7 Total Fund September 30, 2008 Gross of Fees 10% EAFE + 10% Wilshire REIT + 30% LB Int Ag; from 4/03 45% R % EAFE + 10%Wilshire REIT + 35% LB Int Ag; from 1/03 60% S&P % ML Dom Bd; and from 6/02 50% S&P % ML Dom Bd 7
8 Total Fund Total Fund Versus Balanced Moderate September 30, 2003 Through September 30, RATE OF RETURN (%) LATEST QUARTER YEAR TO DATE ONE YEAR THREE YEARS FIVE YEARS HIGHEST VALUE FIRST QUARTILE MEDIAN VALUE THIRD QUARTILE LOWEST VALUE MEAN MEMBERS LATEST QUARTER YEAR TO DATE ONE YEAR THREE YEARS FIVE YEARS RETURN RANK RETURN RANK RETURN RANK RETURN RANK RETURN RANK TF % S&P500/40% LBAG
9 Total Fund Growth of a Dollar Analysis September 30, 2003 Through September 30, DOLLARS /2003 3/2004 9/2004 3/2005 9/2005 3/2006 9/2006 3/2007 9/2007 3/2008 9/2008 LATEST QUARTER YEAR TO DATE ONE YEAR THREE YEARS FIVE YEARS TOTAL FUND % S&P500/40% LBAG
10 Westwood Large Cap Value Performance Profile Through September 30, 2008 ENDED RETURN BEST QUARTER 12/ WORST QUARTER 3/ BEST 4 QUARTERS 9/ WORST 4 QUARTERS 9/ TOTAL # OF PERIODS: 12 # OF POSITIVE PERIODS: 6 # OF NEGATIVE PERIODS: 6 QUARTER TO ONE DATE YEAR TOTAL FUND RUSSELL 1000 VALUE EXCESS RISKLESS INDEX REAL ROR UNIVERSE STD SHARPE INFO PERIOD RETURN RANKING DEV RATIO ALPHA BETA R-SQUARED RATIO ONE YEAR The risk benchmark for this analysis is the Russell 1000 Value. The universe used was the Large Cap Value 10
11 i-shares Russell 1000 Growth Performance Profile Through September 30, 2008 ENDED RETURN BEST QUARTER 6/ WORST QUARTER 9/ BEST 4 QUARTERS 9/ WORST 4 QUARTERS 9/ TOTAL # OF PERIODS: 36 # OF POSITIVE PERIODS: 20 # OF NEGATIVE PERIODS: 16 QUARTER TO ONE TWO THREE DATE YEAR YEARS YEARS TOTAL FUND RUSSELL 1000 GROWTH EXCESS RISKLESS INDEX REAL ROR UNIVERSE STD SHARPE INFO PERIOD RETURN RANKING DEV RATIO ALPHA BETA R-SQUARED RATIO ONE YEAR TWO YEARS THREE YEARS The risk benchmark for this analysis is the Russell 1000 Growth. The universe used was the Large Cap Growth 11
12 Robeco Mid-Cap Performance Profile Through September 30, 2008 ENDED RETURN BEST QUARTER 6/ WORST QUARTER 9/ BEST 4 QUARTERS 9/ WORST 4 QUARTERS 9/ TOTAL # OF PERIODS: 12 # OF POSITIVE PERIODS: 4 # OF NEGATIVE PERIODS: 8 QUARTER TO ONE DATE YEAR TOTAL FUND S&P 400 MID CAP EXCESS RISKLESS INDEX REAL ROR UNIVERSE STD SHARPE INFO PERIOD RETURN RANKING DEV RATIO ALPHA BETA R-SQUARED RATIO ONE YEAR The risk benchmark for this analysis is the S&P 400 Mid Cap. The universe used was the Mid Cap 12
13 CS McKee International Performance Profile Through September 30, 2008 ENDED RETURN BEST QUARTER 12/ WORST QUARTER 9/ BEST 4 QUARTERS 9/ WORST 4 QUARTERS 9/ TOTAL # OF PERIODS: 36 # OF POSITIVE PERIODS: 25 # OF NEGATIVE PERIODS: 11 QUARTER TO ONE TWO THREE DATE YEAR YEARS YEARS TOTAL FUND MSCI GROSS EAFE EXCESS RISKLESS INDEX REAL ROR UNIVERSE STD SHARPE INFO PERIOD RETURN RANKING DEV RATIO ALPHA BETA R-SQUARED RATIO ONE YEAR TWO YEARS THREE YEARS The risk benchmark for this analysis is the MSCI Gross EAFE. The universe used was the EAFE 13
14 Adelante REIT Performance Profile Through September 30, 2008 ENDED RETURN BEST QUARTER 6/ WORST QUARTER 12/ BEST 4 QUARTERS 9/ WORST 4 QUARTERS 9/ TOTAL # OF PERIODS: 60 # OF POSITIVE PERIODS: 41 # OF NEGATIVE PERIODS: 19 QUARTER TO ONE TWO THREE FIVE DATE YEAR YEARS YEARS YEARS TOTAL FUND WILSHIRE REIT EXCESS RISKLESS INDEX REAL ROR UNIVERSE STD SHARPE INFO PERIOD RETURN RANKING DEV RATIO ALPHA BETA R-SQUARED RATIO ONE YEAR TWO YEARS THREE YEARS FIVE YEARS The risk benchmark for this analysis is the Wilshire REIT. The universe used was the REIT/Real Estate 14
15 Sawgrass Fixed Income Performance Profile Through September 30, 2008 ENDED RETURN BEST QUARTER 9/ WORST QUARTER 6/ BEST 4 QUARTERS 9/ WORST 4 QUARTERS 9/ TOTAL # OF PERIODS: 60 # OF POSITIVE PERIODS: 44 # OF NEGATIVE PERIODS: 16 QUARTER TO ONE TWO THREE FIVE DATE YEAR YEARS YEARS YEARS TOTAL FUND FIXED INCOME BNCH EXCESS RISKLESS INDEX REAL ROR UNIVERSE STD SHARPE INFO PERIOD RETURN RANKING DEV RATIO ALPHA BETA R-SQUARED RATIO ONE YEAR TWO YEARS THREE YEARS FIVE YEARS The risk benchmark for this analysis is the Fixed Income Bnch. The universe used was the Fixed Income 15
16 Total Fund Total Fund Within Balanced Moderate September 30, 2005 Through September 30, RETURN HIGHEST VALUE 5.43 FIRST QUARTILE 3.23 MEDIAN VALUE 2.44 THIRD QUARTILE 1.11 LOWEST VALUE MEAN 2.45 VALUE RANK TF % S&P500/40% LBAG ALPHA VALUE RANK BETA VALUE RANK STD DEV VALUE RANK R-SQUARED VALUE RANK SHARPE RATIO VALUE RANK The risk benchmark for this analysis is the 60% S&P500/40% LBAG. 16
17 Total Fund Risk Versus Reward Analysis - 3 Yr. September 30, 2005 Through September 30, MORE RETURN LESS RISK MORE RETURN MORE RISK RATE OF RETURN LESS RETURN LESS RISK STANDARD DEVIATION LESS RETURN MORE RISK RETURN STD DEV ALPHA BETA R-SQUARED TOTAL FUND % S&P500/40% LBAG The risk benchmark for this analysis is the Lehman Bros Treasury-Long Term. The comparative universe is comprised of Balanced Moderate. 17
18 Total Fund Risk Versus Reward Analysis - 5 Yr. September 30, 2003 Through September 30, MORE RETURN LESS RISK MORE RETURN MORE RISK RATE OF RETURN LESS RETURN LESS RISK LESS RETURN MORE RISK STANDARD DEVIATION RETURN STD DEV ALPHA BETA R-SQUARED TOTAL FUND % S&P500/40% LBAG The risk benchmark for this analysis is the Lehman Bros Treasury-Long Term. The comparative universe is comprised of Balanced Moderate. 18
19 Performance in Rising and Declining Markets As Compared to the Benchmark September 30, 2003 Through September 30, 2008 UP MARKET PERFORMANCE DOWN MARKET PERFORMANCE RATE OF RETURN (%) RATE OF RETURN (%) ONE YEAR TWO YEARS THREE YEARS FIVE YEARS TOTAL FUND % S&P500/40% LBAG DIFFERENCE RATIO UP PERIODS ONE YEAR TWO YEARS THREE YEARS FIVE YEARS TOTAL FUND % S&P500/40% LBAG DIFFERENCE RATIO DOWN PERIODS
20 Glossary of Terms -ACCRUED INTEREST- Bond interest earned since the last interest payment, but not yet received. -ALPHA- A linear regressive constant that measures the manager's expected return independent of Beta. -ASSET ALLOCATION- The optimal division of portfolio asset classes in order to achieve an expected investment objective. -BETA- A measure of portfolio sensitivity (volatility) in relation to the market, based upon past experience. -BOND DURATION- A measure of portfolio sensitivity to interest rate risk. -COMMINGLED FUND- An investment fund, offered by a bank or insurance company, which is similar to a mutual fund in that investors are permitted to purchase and redeem units that represent ownership in a pool of securities. -CORE- A type of investment strategy that has approximately an equal weighting in both growth and value stocks in order to achieve a return that is comparable to the broad market performance (i.e., the S&P 500). -CORRELATION COEFFICIENT- A statistical measure of how two assets move together. The measure is bounded by +1 and -1; +1 means that the two assets move together positively, while a measure of -1 means that the assets are perfectly negatively correlated. -INDEXES- Indexes are used as "independent representations of markets" (e.g., S&P 500 and LBGC). -INFORMATION RATIO- Annualized excess return above the benchmark relative to the annualized tracking error. -GROWTH MANAGER- A growth manager generally invests in companies that have either experienced above-average growth rates and/or are expected to experience above-average growth rates in the future. Growth portfolios tend to have high price/earnings ratios and generally pay little to no dividends. -LARGE CAP- Generally, the term refers to a company that has a market capitalization that exceeds $5 billion. -MANAGER UNIVERSE- A collection of quarterly investment returns from various investment management firms that may be subdivided by style (e.g. growth, value, core). -MID CAP- Generally, the term refers to a company that has a market capitalization between $1 and $5 billion. 20
21 Glossary of Terms -RATE OF RETURN- The percentage change in the value of an investment in a portfolio over a specified time period. -RISK MEASURES- Measures of the investment risk level, including beta, credit, duration, standard deviation, and others that are based on current and historical data. -R-SQUARED- Measures how closely portfolio returns and those of the market are correlated, or how much variation in the portfolio returns may be explained by the market. An R2 of 40 means that 40% of the variation in a fund s price changes could be attributed to changes in the market index over the time period. -SHARPE RATIO- The ratio of the rate of return earned above the risk-free rate to the standard deviation of the portfolio. It measures the number of units of return per unit of risk. -STANDARD DEVIATION- Measure of the variability (dispersion) of historical returns around the mean. It measures how much exposure to volatility was experienced by the implementation of an investment strategy. -SYSTEMATIC RISK- Measured by beta, it is the risk that cannot be diversified away (market risk). -TRACKING ERROR- A measure of how closely a manager s performance tracks an index; it is the annualized standard deviation of the differences between the quarterly returns for the manager and the benchmark. -TREYNOR RATIO- A measure of reward per unit of risk. (excess return divided by beta) -UP-MARKET CAPTURE RATIO- Ratio that illustrates how a manager performed relative to the market during rising market periods; the higher the ratio, the better the manager performed (i.e., a ratio of 110 implies the manager performed 10% better than the market). -VALUE MANAGER- A value manager generally invests in companies that have low price-to-earnings and price-to-book ratios and/or above-average dividend yields. 21
22 Glossary of Terms Advisory services are offered through or by Burgess Chambers and Associates, Inc., a registered SEC investment advisor. Performance Reporting: 1.Changes in portfolio valuations due to capital gains or losses, dividends, interest or other income are included in the calculation of returns. All calculations are made in accordance with generally accepted industry standards. 2.Transaction costs, such as commissions, are included in the purchase cost or deducted from the proceeds or sale of a security. Differences in transaction costs may affect comparisons. 3.Individual client returns may vary due to a variety of factors, including differences in investment objectives and timing of investment decisions. 4.BCA does not have discretion or decision making authority over any investments. All decisions regarding investment manager selection and retention, asset allocation, and other investment policies were made by the client. While BCA provides recommendations and choices regarding suitable investments, not all clients take these recommendations or select from the choices offered. 5.Portfolio returns are generally shown before the deduction of investment advisory fees. 6.Performance reports are generated from information supplied by the client, custodian, and/or investment managers. BCA relies upon the accuracy of this data when preparing reports. 7.The market indexes do not include transaction costs, and an investment in a product similar to the index would have lower performance dependent upon costs, fees, dividend reinvestments, and timing. Benchmarks and indexes are for comparison purposes only, and there is no assurance or guarantee that such performance will be achieved. 8.Performance information prepared by third party sources may differ from that shown by BCA. These differences may be due to different methods of analysis, different time periods being evaluated, different pricing sources for securities, treatment of accrued income, treatment of cash, and different accounting procedures. 9.Certain valuations, such as alternative assets, ETF, and mutual funds, are prepared based on information from third party sources, the accuracy of such information cannot be guaranteed by BCA. Such data may include estimates and maybe be subject to revision. 10.BCA has not reviewed the risks of individual security holdings. The firm's ADV, Part II, is available upon request. 22


23 601 North New York Avenue, Suite 200 Winter Park, FL P: or F: October 2008 Downturns & Recoveries
24 Source: Morningstar Research 2
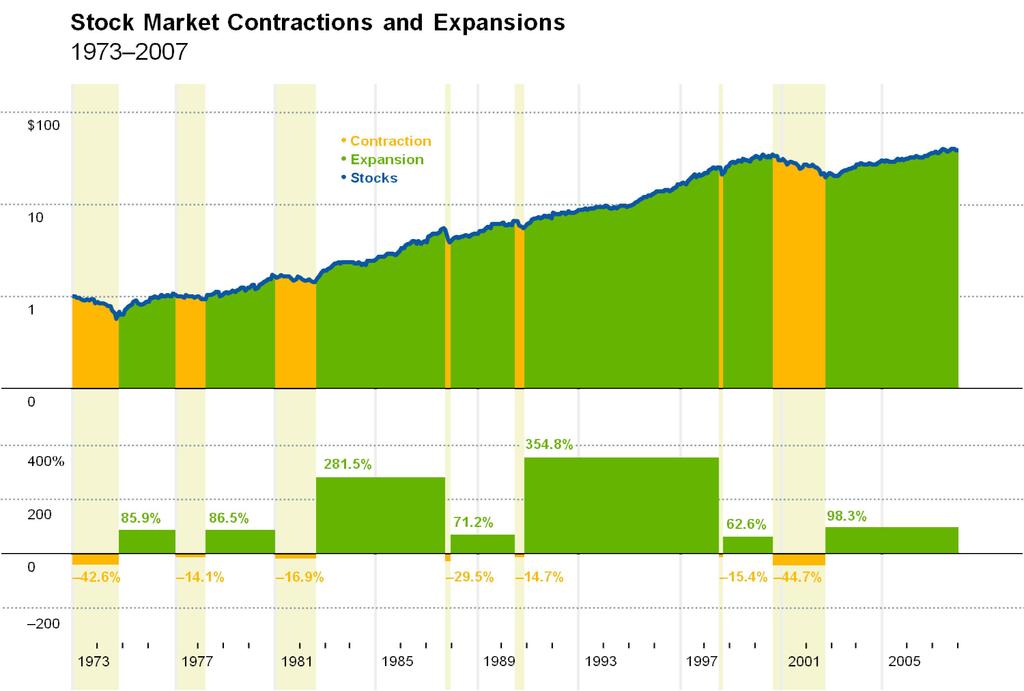
25 Market Downturns and Recoveries Downturn % Loss Recovery 34 months 83.4% Sep 1929 Jun 1932 Jul 1932 Jan months 6 months 21.8% Jun 1946 Nov 1946 Dec 1946 Oct months 7 months 5 months 10.2% 15.0% Aug 1956 Feb 1957 Mar 1957 Jul 1957 Aug 1957 Dec 1957 Jan 1958 Jul months 7 months 6 months 22.3% Jan 1962 Jun 1962 Jul 1962 Apr months 8 months 15.6% Feb 1966 Sep 1966 Oct 1966 Mar months 19 months 29.3% Dec 1968 Jun 1970 Jul 1970 Mar months 21 months 42.6% Jan 1973 Sep 1974 Oct 1974 Jun months 14 months 14.1% Jan 1977 Feb 1978 Mar 1978 Jul months 20 months 16.9% Dec 1980 Jul 1982 Aug 1982 Oct months 3 months 29.5% Sep 1987 Nov 1987 Dec 1987 May months 5 months 14.7% Jun 1990 Oct 1990 Nov 1990 Feb months 2 months 15.4% Jul 1998 Aug 1998 Sep 1998 Nov months 25 months 44.7% Sep 2000 Sep 2002 Oct 2002 Oct months Source: Morningstar Research 3
26 Periods of Consecutive Negative Stock Returns % Return 50 54% Average stock market return from was 10.4% % 29% 20 20% % 8% 0.4% 10% 12% 15% 9% 12% 20 25% 26% 22% % Source: Morningstar Research 4
27 Stock Performance During Recessions $1, Shaded regions denote economic recessions Source: Morningstar Research 5
28 Stock Performance After Recessions % Return % 60 Small stocks Large stocks % % % 19.1% % 2.2% 3.8% 0 After 1 month After 6 months After 1 year After 3 years Source: Morningstar Research 6
29 History of Interest Rates July 1954 December % Average: 5.76% 6.31% 6.73% 5.69% 5 Current 0 1 year yield IT government yield LT government yield Federal funds Source: Morningstar Research 7
30 Bond Yields During Recessions % Yield Short-term govt bonds (4/53 12/07) Long-term govt bonds 12 Shaded regions denote economic recessions % % Source: Morningstar Research 8
31 Stock Returns and Monetary Policy Annualized monthly returns, July 1971 December 2007 Monetary period Period length* Restrictive Expansive Entire period average = 11.7% Jul 71 Oct 71 3 months 1.9% Nov 71 Dec months 24.4% Jan 73 Nov months 21.4% Dec 74 Jul months 19.4% Aug 77 Apr months 9.9% May 80 Aug 80 3 months 44.1% Sep 80 Oct months 3.4% Nov 81 Mar months 15.9% Apr 84 Oct 84 6 months 13.9% Nov 84 Aug months 30.6% Sep 87 Nov months 5.6% Dec 90 Apr months 12.9% May 94 Dec months 22.1% Jan 96 Jul months 24.3% Aug 99 Dec months 2.5% Jan 01 Jun months 2.2% Jul 04 Jul months 11.4% Aug 07 Dec 07 4 months 1.4% Average return % Source: Morningstar Research 9
32 U.S. Market Recovery After Tragedy Cumulative return of the S&P 500 after tragic events 80% % 57.7% 56.6% After 1 month After 6 months After 1 year After 3 years % % 20.3% 15.9% 2.2% 6.1% 8.3% 1.9% 11.0% 12.6% 0 1.0% 4.9% 20.5% 20 Dec 7, 1941: Pearl Harbor Aug 2, 1990: Iraq invades Kuwait Feb 26, 1993: World Trade Center bombed Sep 11, 2001: Terrorist attack Source: Morningstar Research 10
BOYNTON BEACH POLICE PENSION FUND INVESTMENT PERFORMANCE PERIOD ENDING MARCH 31, 2011
 BOYNTON BEACH POLICE PENSION FUND INVESTMENT PERFORMANCE PERIOD ENDING MARCH 31, 2011 NOTE: For a free copy of Part II (mailed w/i 5 bus. days from request receipt) of Burgess Chambers and Associates,
PALM TRAN, INC./ATU LOCAL 1577 PENSION FUND INVESTMENT PERFORMANCE PERIOD ENDING MARCH 31, 2011
 PALM TRAN, INC./ATU LOCAL 1577 PENSION FUND INVESTMENT PERFORMANCE PERIOD ENDING MARCH 31, 2011 NOTE: For a free copy of Part II (mailed w/i 5 bus. days from request receipt) of Burgess Chambers and Associates,
BOYNTON BEACH POLICE PENSION FUND INVESTMENT PERFORMANCE PERIOD ENDING MARCH 31, 2013
 BOYNTON BEACH POLICE PENSION FUND INVESTMENT PERFORMANCE PERIOD ENDING MARCH 31, 2013 NOTE: For a free copy of Part II (mailed w/i 5 bus. days from request receipt) of Burgess Chambers and Associates,
CITY OF SANIBEL TREASURY INVESTMENT PERFORMANCE PERIOD ENDING JUNE 30, 2011
 CITY OF SANIBEL TREASURY INVESTMENT PERFORMANCE PERIOD ENDING JUNE 30, 2011 NOTE: For a free copy of Part II (mailed w/i 5 bus. days from request receipt) of Burgess Chambers and Associates, Inc.'s most
PALM TRAN / A.T.U. LOCAL 1577 PENSION FUND
 INVESTMENT PERFORMANCE EVALUATION For the Quarter Ended Decmber 31, 2006 Presented on February 22, 2007 NOTE: For a free copy of Part II of Burgess Chambers and Associates, Inc.'s most recent Form ADV
Manager Comparison Report June 28, Report Created on: July 25, 2013
 Manager Comparison Report June 28, 213 Report Created on: July 25, 213 Page 1 of 14 Performance Evaluation Manager Performance Growth of $1 Cumulative Performance & Monthly s 3748 3578 348 3238 368 2898
Beginning Date: January 2016 End Date: June Managers in Zephyr: Benchmark: Morningstar Short-Term Bond
 Beginning Date: January 2016 End Date: June 2018 Managers in Zephyr: Benchmark: Manager Performance January 2016 - June 2018 (Single Computation) 11200 11000 10800 10600 10400 10200 10000 9800 Dec 2015
Beginning Date: January 2016 End Date: September Managers in Zephyr: Benchmark: Morningstar Short-Term Bond
 Beginning Date: January 2016 End Date: September 2018 Managers in Zephyr: Benchmark: Manager Performance January 2016 - September 2018 (Single Computation) 11400 - Yorktown Funds 11200 11000 10800 10600
Security Analysis: Performance
 Security Analysis: Performance Independent Variable: 1 Yr. Mean ROR: 8.72% STD: 16.76% Time Horizon: 2/1993-6/2003 Holding Period: 12 months Risk-free ROR: 1.53% Ticker Name Beta Alpha Correlation Sharpe
Aspiriant Risk-Managed Equity Allocation Fund RMEAX Q4 2018
 Aspiriant Risk-Managed Equity Allocation Fund Q4 2018 Investment Objective Description The Aspiriant Risk-Managed Equity Allocation Fund ( or the Fund ) seeks to achieve long-term capital appreciation
INVESTMENT POLICY STATEMENT CITY OF DOVER POLICE PENSION PLAN
 INVESTMENT POLICY STATEMENT CITY OF DOVER POLICE PENSION PLAN August 2016 INVESTMENT POLICY STATEMENT CITY OF DOVER POLICE PENSION PLAN Table of Contents Section Page I. Purpose and Background 2 II. Statement
Beginning Date: January 2016 End Date: February Managers in Zephyr: Benchmark: Morningstar Short-Term Bond
 Beginning Date: January 2016 End Date: February 2018 Managers in Zephyr: Benchmark: Manager Performance January 2016 - February 2018 (Single Computation) 11200 11000 10800 10600 10400 10200 10000 9800
3Q17 Investment Review Presented to Lisle Woodridge FPD Pension Fund
 3Q17 Investment Review Presented to Lisle Woodridge FPD Pension Fund November 20th 2017 Jon Willhite, CIMA UBS Institutional Consulting 1780 Hughes Landing Blvd., Ste 200 The Woodlands, TX 77380 281-362-2250
Dividend Growth as a Defensive Equity Strategy August 24, 2012
 Dividend Growth as a Defensive Equity Strategy August 24, 2012 Introduction: The Case for Defensive Equity Strategies Most institutional investment committees meet three to four times per year to review
The Swan Defined Risk Strategy - A Full Market Solution
 The Swan Defined Risk Strategy - A Full Market Solution Absolute, Relative, and Risk-Adjusted Performance Metrics for Swan DRS and the Index (Summary) June 30, 2018 Manager Performance July 1997 - June
Sample Report PERFORMANCE REPORT I YOUR FUND
 Produced on //28 Data as of 6/3/28 PERFORMANCE REPORT I 5 East 57 th Street, Floor, New York, NY 22 Tel (22) 248-532 Fax (646) 45-884 7 Seventh Avenue, Suite 2, Seattle, WA 98 Tel (26) 47-254 Fax (26)
The Compelling Case for Value
 The Compelling Case for Value July 2, 2018 SOLELY FOR THE USE OF INSTITUTIONAL INVESTORS AND PROFESSIONAL ADVISORS 0 Jan-75 Jan-77 Jan-79 Jan-81 Jan-83 Jan-85 Jan-87 Jan-89 Jan-91 Jan-93 Jan-95 Jan-97
INDEX PERFORMANCE HISTORY MARKET CYCLE ANALYSIS*
 OVERVIEW Index Name: Helios Alpha Index Ticker: Inception Date: September 30, 2003 S&P Launch Date: March 3, 2017 Benchmark: MSCI ACWI Index INDEX PERFORMANCE HISTORY As of: October 31, 2018 DESCRIPTION
INDEX PERFORMANCE HISTORY MARKET CYCLE ANALYSIS*
 Jun 09 Dec 09 Jun 10 Dec 10 Jun 11 Dec 11 Jun 12 Dec 12 Jun 13 Dec 13 Jun 14 Dec 14 Jun 15 Dec 15 Jun 16 Dec 16 Jun 17 Dec 17 Jun 18 Dec 18 Dec 07 Jan 08 Feb 08 Mar 08 Apr 08 May 08 Jun 08 Jul 08 Aug 08
INDEX PERFORMANCE HISTORY MARKET CYCLE ANALYSIS*
 OVERVIEW Index Name: Helios Diversified Index Ticker: Inception Date: September 30, 2003 S&P Launch Date: March 3, 2017 : 45% MSCI ACWI / 25% BBgBarc Agg Bond / 30% Morningstar Div Alts Morningstar SecID:
INDEX PERFORMANCE HISTORY MARKET CYCLE ANALYSIS*
 OVERVIEW Index Name: Helios Dynamic Risk 13% Index Ticker: Inception Date: February 28, 2005 S&P Launch Date: March 3, 2017 Benchmark: 65% MSCI ACWI / 35% BBgBarc Agg Bond Morningstar SecID: F00000YYHJ
Kensington Analytics LLC. Convertible Income Strategy
 Kensington Analytics LLC Convertible Income Strategy Investment Process About Convertible Bonds Coupon income tends to instill some level of downside price resilience on convertible bond prices. This explains
Retirement Plan Quarterly Investment Review Summary
 Retirement Plan Quarterly Investment Review Summary Prepared for: Plan Name: Quarter Ending: Pepperdine University Retirement Plan December 31, 2008 Table of Contents Introduction: Asset Allocation by
BOARD OF VISITORS OF THE COLLEGE OF WILLIAM AND MARY IN VIRGINIA
 BOARD OF VISITORS OF THE COLLEGE OF WILLIAM AND MARY IN VIRGINIA COMMITTEE MEETINGS Board Rooms - Blow Memorial Hall April 17-19, 2013 INVESTMENTS SUBCOMMITTEE of the COMMITTEE ON FINANCIAL AFFAIRS
Financial Markets 11-1
 Financial Markets Laurent Calvet calvet@hec.fr John Lewis john.lewis04@imperial.ac.uk Topic 11: Measuring Financial Risk HEC MBA Financial Markets 11-1 Risk There are many types of risk in financial transactions
Risk / Return August January 2016 (Single Computation)
") Risk / Return August 2015 - January 2016 (Single Computation) 2% Zephyr StyleADVISOR:, LLC 0% -2% -4% Return -6% -8% -10% Benchmark: Cash Equivalent: Citigroup 3-month T-bill -12% -14% 0% 2% 4% 6% 8% 10%
Risk / Return August 2015 - January 2016 (Single Computation) 2% Zephyr StyleADVISOR:, LLC 0% -2% -4% Return -6% -8% -10% Benchmark: Cash Equivalent: Citigroup 3-month T-bill -12% -14% 0% 2% 4% 6% 8% 10%
F U N D E V A L U A T I O N R E P O R T
 F U N D E V A L U A T I O N R E P O R T Santa Barbara Foundation Performance Update M E K E T A I N V E S T M E N T G R O U P BOSTON MASSACHUSETTS CHICAGO ILLINOIS MIAMI FLORIDA PORTLAND OREGON SAN DIEGO
4Q17 Global & International Equity GLOBAL EQUITY. 10+ Years of Providing High Income Through Global Dividends
 4Q17 Global & International Equity GLOBAL EQUITY INCOME FUND 10+ Years of Providing High Income Through Global Dividends A: HFQAX C: HFQCX I: HFQIX N: HFQRX S: HFQSX T: HFQTX Overall Morningstar Rating
20% 20% Conservative Moderate Balanced Growth Aggressive
 The Global View Tactical Asset Allocation series offers five risk-based model portfolios specifically designed for the Retirement Account (PCRA), which is a self-directed brokerage account option offered
Investors Have Allocated Less to Value
 Investors Have Allocated Less to Value by Over $1 Trillion Compared to 10 Years Ago Equity Asset Under Management $20,000,000,000,000 $18,000,000,000,000 $16,000,000,000,000 $14,000,000,000,000 $12,000,000,000,000
Multi-Asset Income: Moderate Growth (MAP) Select UMA
 Select UMA") J.P. Morgan Asset Management (Model Portfolio Provider) 270 Park Avenue New York, New York 10017 PRODUCT OVERVIEW Morgan Stanley Smith Barney LLC ("Morgan Stanley") is the Manager of this strategy. The
J.P. Morgan Asset Management (Model Portfolio Provider) 270 Park Avenue New York, New York 10017 PRODUCT OVERVIEW Morgan Stanley Smith Barney LLC ("Morgan Stanley") is the Manager of this strategy. The
How much will your current lifestyle cost at 60?
 (MODERATE PLAN) How much will your current lifestyle cost at 60? DATE OF ALLOTMENT November 01,2011 BENCHMARK CRISIL Hybrid 25+75 - Aggressive Index (WEF From 1st February 2018) FUND SIZE: Rs.856.45 (Rs.
ACCG - Workers Compensation Portfolio Evaluation. Client Advisor: L. Ferber Buckley 3414 Peachtree Road, N.E. Atlanta, GA (800)
") Portfolio Evaluation First Quarter 2008 Client Advisor: L. Ferber Buckley 3414 Peachtree Road, N.E. Atlanta, GA 30326 (800) 241-2130 Table of Contents Report (Composite Portfolio) Separator Important Information
Portfolio Evaluation First Quarter 2008 Client Advisor: L. Ferber Buckley 3414 Peachtree Road, N.E. Atlanta, GA 30326 (800) 241-2130 Table of Contents Report (Composite Portfolio) Separator Important Information
How much will your current lifestyle cost at 60?
 (MODERATE PLAN) How much will your current lifestyle cost at 60? DATE OF ALLOTMENT November 01,2011 BENCHMARK CRISIL Hybrid 25+75 - Aggressive Index (WEF From 1st February 2018) FUND SIZE: Rs.772.12 (Rs.
2015 ANNUAL RETURNS YTD
 Stephen Somers, William Somers 1410 Russell Road, Suite 100, Paoli, PA 19301 USA ph. +1-484-576-3371 fax +1-610-688-9261 http://www.somersbrothers.com ANNUAL RETURNS 2011 2012 2013 2014 2015 YTD Advisor
Alpha Bonds Strategy
 Alpha Bonds Strategy Strategy Overview The Alpha Bonds Strategy combines conservative bond funds with Alpha s fourth quarter power periods to create what we believe is a unique solution to the conservative
Maycrest Balanced Fund Richard Davis, Maria Davis 1275 Gator Trl, West Palm Beach, FL USA ph fax
 Richard Davis, Maria Davis 1275 Gator Trl, West Palm Beach, FL 33409 USA ph. +1-203-722-8824 fax http://www.maycrestcapital.com Primary Category: Equity Long-Bias ANNUAL RETURNS 2014 2015 2016 2017 2018
Liquidity Risk Management for Portfolios
 Liquidity Risk Management for Portfolios IPARM China Summit 2011 Shanghai, China November 30, 2011 Joseph Cherian Professor of Finance (Practice) Director, Centre for Asset Management Research & Investments
Templeton Non-US Equity. Imperial County Employees' Retirement System. February SEATTLE LOS ANGELES
 Templeton Non-US Equity Imperial County Employees' Retirement System February 14 SEATTLE 6.6.37 LOS ANGELES 31.97.1777 www.wurts.com MANAGER OVERVIEW Firm Ownership Firm Name Product Name Product Total
AlphaCentric Hedged Market Opportunity Fund
 AlphaCentric Hedged Market Opportunity Fund HMXAX HMXCX HMXIX Q1 2018 Presentation Seeks to achieve capital appreciation with lower overall volatility than the equity market For Registered Investment Professional
Turner Investments 1205 Westlakes Drive - Suite 100 Berwyn, Pennsylvania 19312
 Turner Investments 1205 Westlakes Drive - Suite 100 Berwyn, Pennsylvania 19312 PRODUCT OVERVIEW The investment objective of the Turner Select portfolio is to outperform the Russell 1000 Growth Index over
How much will your current lifestyle cost at 60?
 (PROGRESSIVE PLAN) How much will your current lifestyle cost at 60? DATE OF ALLOTMENT November 01, 2011 BENCHMARK S&P BSE Sensex TRI (WEF From 1st February 2018) FUND SIZE Rs.474.87 (Rs. in Cr.) MONTHLY
AlphaSolutions Multi-Sector Fixed Income Model
 AlphaSolutions Multi-Sector Fixed Income Model A fixed income model based on trending and momentum strategies Portfolio Goals Primary: Seeks to invest in highranked sectors within the fixed income market
Eastern Point Trust Company Basic Plan Portfolio
 Eastern Point Trust Company Basic Plan Portfolio January 2001 - August 2018 (Single Computation) 400 350 300 250 200 150 100 50 Dec 2000 Dec 2003 Dec 2005 Dec 2007 Dec 2009 Dec 2011 Dec 2013 Dec 2015 Aug
High Dividend Stocks In Rising Interest Rate Environments
 High Dividend Stocks In Rising Interest Rate Environments July 2016 Disclosure: This research is provided for educational purposes only and is not intended to provide investment or tax advice. All numbers
I. CALL TO ORDER ROLL CALL PLEDGE OF ALLEGIANCE APPROVAL OF AGENDA V. PUBLIC COMMENT NEW BUSINESS
 I. CALL TO ORDER AGENDA RETIREE HEALTH CARE TRUST BOARD SPECIAL MEETING MONROE COUNTY BOARD OF COMMISSIONERS CHAMBERS ROOM FRIDAY, OCTOBER 28, 2016 11:30 A.M. 125 E. SECOND STREET MONROE, MI 48161 (734)
Cash. Period Ending 06/30/2016 Period Ending 3/31/2016. Equity. Fixed Income. Other
 Product Type: Multi-Product Portfolio Headquarters: Austin, TX Total Staff: 46 Geography Focus: Global Year Founded: 1996 Investment Professionals: 16 Type of Portfolio: Balanced Total AUM: $12,046 million
SYSTEMATIC GLOBAL MACRO ( CTAs ):
:") G R A H M C A P I T A L M A N G E M N T G R A H A M C A P I T A L M A N A G E M E N T GC SYSTEMATIC GLOBAL MACRO ( CTAs ): PERFORMANCE, RISK, AND CORRELATION CHARACTERISTICS ROBERT E. MURRAY, CHIEF OPERATING
G R A H M C A P I T A L M A N G E M N T G R A H A M C A P I T A L M A N A G E M E N T GC SYSTEMATIC GLOBAL MACRO ( CTAs ): PERFORMANCE, RISK, AND CORRELATION CHARACTERISTICS ROBERT E. MURRAY, CHIEF OPERATING
How much will your current lifestyle cost at 60?
 (PROGRESSIVE PLAN) How much will your current lifestyle cost at 60? DATE OF ALLOTMENT November 01, 2011 BENCHMARK S&P BSE Sensex TRI (WEF From 1st February 2018) FUND SIZE Rs.547.64 (Rs. in Cr.) MONTHLY
How much will your current lifestyle cost at 60?
 (MODERATE PLAN) How much will your current lifestyle cost at 60? DATE OF ALLOTMENT November 01,2011 BENCHMARK CRISIL Hybrid 25+75 - Aggressive Index (WEF From 1st February 2018) FUND SIZE: Rs.733.18 (Rs.
September 30, 2013
 www.cempindex.com September 30, 2013 Compass Efficient Model Portfolios Compass EMP was founded in 1996. Compass EMP has served as consultants to large institutions such as governments, endowments, foundations,
Investment Performance Review Period Ending June 30, City of Trenton Fire & Police Retirement System
 Investment Performance Review Period June 30, 2017 City of Trenton Fire & Police Retirement System Market Update June 30, 2017 Index Returns (%) Equities Month 3 M YTD 1 Year 3 Yr 5 Yr Ann Ann S&P 500
BROAD COMMODITY INDEX
 BROAD COMMODITY INDEX COMMENTARY + STRATEGY FACTS JUNE 2017 80.00% CUMULATIVE PERFORMANCE ( SINCE JANUARY 2007* ) 60.00% 40.00% 20.00% 0.00% -20.00% -40.00% -60.00% -80.00% ABCERI S&P GSCI ER BCOMM ER
How much will your current lifestyle cost at 60?
 (MODERATE PLAN) How much will your current lifestyle cost at 60? DATE OF ALLOTMENT November 01,2011 BENCHMARK CRISIL Balanced Fund - Aggressive Index FUND SIZE Rs.370.53 (Rs. in Cr.) MONTHLY AVERAGE AUM
TIAA-CREF Lifecycle Index 2010 Fund
 TIAA-CREF Lifecycle Index 2010 Institutional Class (TLTIX) As of 12/31/17 Portfolio Strategies The Lifecycle Index 2010 seeks high total return over time through a combination of capital appreciation and
AI: Weighted Sector Strategy DEC
 KEN STERN & ASSOCIATES DEC 31 2016 1 Tactical Rebalanced AI: Strategy DEC 31 2016 Ken Stern & Associates Strategy seeks to track the investment results of the Morgan Stanley Capital International USA Investable
Custom S&P 500 / Short Laddered Muni (60/40) Select UMA Parametric Portfolio Associates
 Select UMA Parametric Portfolio Associates") Parametric Portfolio Associates 1918 8th Avenue, Suite 3100 Seattle, Washington 98101 Style: Sub-Style: Firm AUM: Firm Strategy AUM: US Multi Asset Balanced Blend Tax Favored $231.5 billion Year Founded:
Parametric Portfolio Associates 1918 8th Avenue, Suite 3100 Seattle, Washington 98101 Style: Sub-Style: Firm AUM: Firm Strategy AUM: US Multi Asset Balanced Blend Tax Favored $231.5 billion Year Founded:
Playing The Bull Market s Final Inning(s)
") Playing The Bull Market s Final Inning(s) Douglas Ramsey, CFA, CMT Mid-September 2013 FOR PROFESSIONAL USE ONLY. FURTHER DISTRIBUTION OF THE INFORMATION CONTAINED HEREIN IS PROHIBITED WITHOUT PRIOR PERMISSION.
Playing The Bull Market s Final Inning(s) Douglas Ramsey, CFA, CMT Mid-September 2013 FOR PROFESSIONAL USE ONLY. FURTHER DISTRIBUTION OF THE INFORMATION CONTAINED HEREIN IS PROHIBITED WITHOUT PRIOR PERMISSION.
Tower Square Investment Management LLC Strategic Aggressive
 Product Type: Multi-Product Portfolio Headquarters: El Segundo, CA Total Staff: 15 Geography Focus: Global Year Founded: 2012 Investment Professionals: 12 Type of Portfolio: Balanced Total AUM: $1,422
Aims to achieve the right blend of Growth and Tax Saving
 Aims to achieve the right blend of Growth and Tax Saving DATE OF ALLOTMENT March 31,1996 BENCHMARK S&P BSE Sensex FUND SIZE Rs.981.23 (Rs. in Cr.) MONTHLY AVERAGE AUM Rs.939.37 (Rs. in Cr.) EXIT LOAD Nil
MFS Investment Management 500 Boyleston Street Boston, Massachusetts 02116
 Investment Management 500 Boyleston Street Boston, Massachusetts 02116 MANAGER'S INVESTMENT PROCESS RISK CONSIDERATIONS Bottom-up idea generation within a sector-neutral framework, managed by a team of
BROAD COMMODITY INDEX
 BROAD COMMODITY INDEX COMMENTARY + STRATEGY FACTS APRIL 2017 80.00% CUMULATIVE PERFORMANCE ( SINCE JANUARY 2007* ) 60.00% 40.00% 20.00% 0.00% -20.00% -40.00% -60.00% -80.00% ABCERI S&P GSCI ER BCOMM ER
2nd Quarter 2018 Webcast
 2nd Quarter 2018 Webcast Classic Large Cap Value Equity Presented by James J. Clarke Director of Fundamental Research & Portfolio Manager This material may not be reproduced or used in any form or medium
Participate in one of the key drivers of Growth & Development in India
 Participate in one of the key drivers of Growth & Development in India DATE OF ALLOTMENT December 28, 2015 BENCHMARK Nifty Financial Services TRI (WEF From 1st February 2018) FUND SIZE Rs.261.73 (Rs. in
BROAD COMMODITY INDEX
 BROAD COMMODITY INDEX COMMENTARY + STRATEGY FACTS JULY 2018 100.00% 80.00% 60.00% 40.00% 20.00% 0.00% -20.00% -40.00% -60.00% CUMULATIVE PERFORMANCE ( SINCE JANUARY 2007* ) -80.00% ABCERI S&P GSCI ER BCOMM
BROAD COMMODITY INDEX
 BROAD COMMODITY INDEX COMMENTARY + STRATEGY FACTS JANUARY 2018 100.00% 80.00% 60.00% 40.00% 20.00% 0.00% -20.00% -40.00% -60.00% CUMULATIVE PERFORMANCE ( SINCE JANUARY 2007* ) -80.00% ABCERI S&P GSCI ER
Schafer Cullen Capital Management High Dividend Value
 Product Type: Separate Account Manager Headquarters: New York, NY Total Staff: 56 Geography Focus: Domestic Year Founded: 1983 Investment Professionals: 21 Type of Portfolio: Equity Total AUM: $17,896
Mid Cap Value Fiduciary Services EARNEST Partners, LLC
 EARNEST Partners, LLC 1180 Peachtree St. - Suite 2300 Atlanta, Georgia 30309 Style: Sub-Style: Firm AUM: Firm Strategy AUM: US Mid Cap Value Traditional Value $20.1 billion $64.0 billion Year Founded:
Sustainable Investment Solutions Personalized Investment Plan
 Sustainable Investment Solutions Personalized Investment Plan Portfolio Recommendation and Investment Policy Statement Prepared for John Q. Sample and Mary R. Sample February 11, 2014 By First Affirmative
Eastern Point Trust Company Deluxe Plan Portfolio Review
 Eastern Point Trust Company Deluxe Plan Portfolio Review January 2001 - August 2018 (Single Computation) 500 450 400 350 300 250 200 150 100 50 Dec 2000 Dec 2003 Dec 2005 Dec 2007 Dec 2009 Dec 2011 Dec
THE B E A CH TO WN S O F P ALM B EA CH
 THE B E A CH TO WN S O F P ALM B EA CH C OU N T Y F LO R I D A August www.luxuryhomemarketing.com PALM BEACH TOWNS SINGLE-FAMILY HOMES LUXURY INVENTORY VS. SALES JULY Sales Luxury Benchmark Price : 7,
Think Of Us Before You Invest
 Think Of Us Before You Invest DATE OF ALLOTMENT March 31,1996 BENCHMARK S&P BSE Sensex FUND SIZE Rs.679.21 (Rs. in Cr.) MONTHLY AVERAGE AUM Rs.668.51 (Rs. in Cr.) EXIT LOAD Nil (Compulsory lock-in period
Invesco Diversified Dividend Fund. Building a solid foundation
 Invesco Diversified Dividend Fund Building a solid foundation of dividend growers Equity Objective Seeks long-term capital growth with current income as its secondary objective Symbols A: LCEAX C: LCEVX
How much will your current lifestyle cost at 60?
 (PROGRESSIVE PLAN) How much will your current lifestyle cost at 60? DATE OF ALLOTMENT November 01, 2011 BENCHMARK S&P BSE Sensex TRI (WEF From 1st February 2018) FUND SIZE Rs.467.54 (Rs. in Cr.) MONTHLY
Schindler Capital Management, LLC / Dairy Advantage Program. Year Jan Feb Mar Apr May Jun Jul Aug Sep Oct Nov Dec
 Schindler Capital Management, LLC / Dairy Advantage Program Fundamental / Ag & Livestock Performance Since August 2005 Year Jan Feb Mar Apr May Jun Jul Aug Sep Oct Nov Dec 2005-11.20% 3.20% -6.67% -13.73%
 EDM Ahorro Corporate Bonds Return Date: 28/02/2018 Snapshot Global Category Custodian / Administrator Auditor Domicile UCITS Morningstar Rating 3 Yr Morningstar Rating 5 Yr Fund s Data Inception Date Month
Navigator Global Equity ETF
 CCM-17-12-3 As of 12/31/2017 Navigator Global Equity ETF Navigate Global Equity with a Dynamic Approach The world s financial markets offer a variety of growth opportunities, but identifying the right
Destinations. Defensive Qualified. March 31, Asset class breakdown. Portfolio overview* Key statistics. Portfolio holdings
 Destinations Defensive Qualified March 31, 2018 Portfolio overview* Absolute return objective Low volatility and low correlation to equity markets Suited for investors with a timeframe of 1+ years Key
MAY 2018 Capital Markets Update
 MAY 2018 Market commentary U.S. ECONOMICS The U.S. added 223,000 jobs to payrolls in May, well above the consensus estimate of 180,000 and the expansion average of around 200,000. Sector job gains were
FUND OF HEDGE FUNDS DO THEY REALLY ADD VALUE?
 FUND OF HEDGE FUNDS DO THEY REALLY ADD VALUE? Florian Albrecht, Jean-Francois Bacmann, Pierre Jeanneret & Stefan Scholz, RMF Investment Management Man Investments Hedge funds have attracted significant
(Comparisons Charts)
") (Comparisons Charts) IFS-A76904 Charts 1-10 Reminder: You must include the Glossary of Indices and disclosure pages with all charts you select to use, either individually or as a group. Information as
(Comparisons Charts) IFS-A76904 Charts 1-10 Reminder: You must include the Glossary of Indices and disclosure pages with all charts you select to use, either individually or as a group. Information as
Palm Beach County School District
 Palm Beach County School District Investment Performance Review Quarter Ended March 31, 2008 Investment Advisors Steven Alexander, CTP, CGFO, Managing Director 300 S. Orange Avenue, Suite 1170 Orlando,
Custom Russell 3000 / Interm Laddered Muni (60/40) Select UMA Parametric Portfolio Associates
 Select UMA Parametric Portfolio Associates") Parametric Portfolio Associates 1918 8th Avenue, Suite 3100 Seattle, Washington 98101 Style: Sub-Style: Firm AUM: Firm Strategy AUM: US Multi Asset Balanced Blend Tax Favored $959 billion Year Founded:
Parametric Portfolio Associates 1918 8th Avenue, Suite 3100 Seattle, Washington 98101 Style: Sub-Style: Firm AUM: Firm Strategy AUM: US Multi Asset Balanced Blend Tax Favored $959 billion Year Founded:
AlphaSolutions Sector Rotation Model
 AlphaSolutions Sector Rotation Model An investment model based on trending and momentum strategies Portfolio Goals Primary: Seeks long term growth of capital by investing in highranked U.S. Equity Sectors
Schwab Diversified Growth Allocation Trust Fund (Closed to new investors) Institutional Unit Class As of June 30, 2017
 Institutional Unit Class As of June 30, 2017") Fund Facts Trustee Fund Type Charles Schwab Bank Collective Trust Fund Morningstar Category Allocation - 50-70% Equity Benchmark Global Growth Custom Index 1 Unit Class Inception Date 3/7/2012 Fund Inception
Fund Facts Trustee Fund Type Charles Schwab Bank Collective Trust Fund Morningstar Category Allocation - 50-70% Equity Benchmark Global Growth Custom Index 1 Unit Class Inception Date 3/7/2012 Fund Inception
Statistically Speaking
 Statistically Speaking August 2001 Alpha a Alpha is a measure of a investment instrument s risk-adjusted return. It can be used to directly measure the value added or subtracted by a fund s manager. It
LOUISIANA SCHOOL EMPLOYEES RETIREMENT SYSTEM
 LOUISIANA SCHOOL EMPLOYEES RETIREMENT SYSTEM Investment Performance Analysis through March 31, 2008 May 2008 Copyright 2008 by Segal Advisors, Inc. All rights reserved. 1300 East Ninth Street, Suite 1900
The London Company Domestic Equity SMID Core
 Product Type: Separate Account Manager Headquarters: Richmond, VA Total Staff: 24 Geography Focus: Domestic Year Founded: 1994 Investment Professionals: 5 Type of Portfolio: Equity Total AUM: $7,069 million
457 Deferred Compensation Plan
 457 Deferred Compensation Plan Third Quarter Plan Executive Summary October 31, Kristin Finney-Cooke, CAIA Senior Consultant Kristen Jackson, CFA Senior Analyst Metropolitan St. Louis Sewer District Deferred
MANAGED FUTURES INDEX
 MANAGED FUTURES INDEX COMMENTARY + STRATEGY FACTS SEPTEMBER 2018 CUMULATIVE PERFORMANCE ( SINCE JANUARY 2007* ) 140.00% 120.00% 100.00% 80.00% 60.00% 40.00% 20.00% 0.00% AMFERI BARCLAY BTOP50 CTA INDEX
Custom S&P500/MSCI EAFE ADR/Int Ldr Corp 30/30/40 Select UMA Parametric Portfolio Associates
 Parametric Portfolio Associates 1918 8th Avenue, Suite 3100 Seattle, Washington 98101 Style: Sub-Style: Firm AUM: Firm Strategy AUM: Global Multi Asset $226.4 billion Year Founded: GIMA Status: Firm Ownership:
Asset Liability Management Report 4 Q 2018
 Asset Liability Management Report 4 Q 2018 Performance Indicators and Key Measures Cash, Investment and Debt Balances Book Value ($M) Restricted Cash and Investments 529.8 Unrestricted Cash and Investments
The Evolution of Alternative Beta: Using Index-Based Investment Strategies
 Filed pursuant to Rule 433 Registration Statement No. 333-180300-03 Investor Solutions The Evolution of Alternative Beta: Using Index-Based Investment Strategies This presentation may not be altered except
The Bull Market: Six Years Old And Not Over
 The Bull Market: Six Years Old And Not Over April 22-24, 2015 FOR PROFESSIONAL USE ONLY. FURTHER DISTRIBUTION OF THE INFORMATION CONTAINED HEREIN IS PROHIBITED WITHOUT PRIOR PERMISSION. Disclosures This
Mid Cap Dividend Growth Strategy
 Mid Cap Dividend Growth Strategy Product Level Investment Process Stock Universe Companies that have increased their dividends with market capitalizations of $1 billion to $15 billion Stock Selection Top
WisdomTree.com Currency Hedged Equities Q2 2018
 WisdomTree.com 866.909.9473 Q2 2018 Ratio of MSCI to S&P The Dollar s Impact on Equities: ACWX (Unhedged) Relative to the S&P 500 1.7 1.6 1.5 1.4 1.3 U.S. Dollar Depreciation Cumulative: -25.52% Annualized:
BROAD COMMODITY INDEX
 BROAD COMMODITY INDEX COMMENTARY + STRATEGY FACTS AUGUST 2018 120.00% 100.00% 80.00% 60.00% 40.00% 20.00% 0.00% -20.00% -40.00% -60.00% CUMULATIVE PERFORMANCE ( SINCE JANUARY 2007* ) -80.00% ABCERI S&P
SMMV ishares Edge MSCI Min Vol U.S.A. Small-Cap ETF
 ishares Edge MSCI Min Vol U.S.A. Small-Cap ETF ETF.com segment: Equity: U.S. - Small Cap Competing ETFs: XSLV, SMLV, RPUT, IWM, IJR Related ETF Channels: Smart-Beta ETFs, U.S., Low Volatility, Small Cap,
CLICK TO EDIT MASTER TITLE STYLE Market Perspective
 Market Perspective Global Earnings Remain Supportive November 8, 2017 Keith Lerner, CFA, CMT Managing Director, Chief Market Strategist 2017 SunTrust Banks, Inc. SunTrust is a federally registered service
Navigator Taxable Fixed Income
 CCM-17-09-966 As of 9/30/2017 Navigator Taxable Fixed Navigate Fixed with Individual Bonds With yields hovering at historic lows, an active strategy focused on managing risk may deliver better client outcomes