Performance Report - Quarterly Update 31 December 2012 London Borough of Barnet Superannuation Fund JLT INVESTMENT CONSULTING
|
|
|
- Mae Mitchell
- 5 years ago
- Views:
Transcription

1 Performance Report - Quarterly Update 31 December 2012 London Borough of Barnet Superannuation Fund JLT INVESTMENT CONSULTING
2 Contents Contents... 2 Section One Market Update... 3 Section Two Total Scheme Performance... 3 Section Three Manager Performance Section Four Consideration of Funding Level Section Five Summary Appendix Jignasha Patel, MMath (Hons) IMC Principal Analyst Julian Brown, PhD IMC Head of Investment Consulting - South March 2013 London Borough of Barnet Superannuation Fund 2
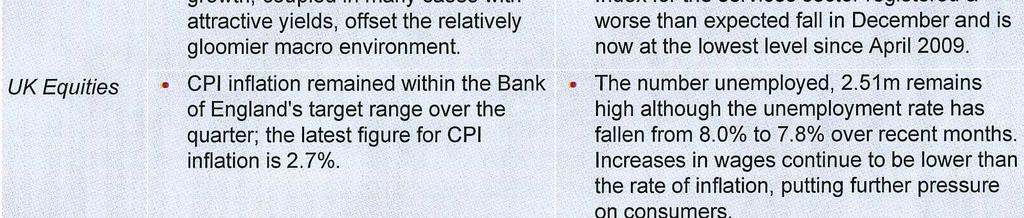
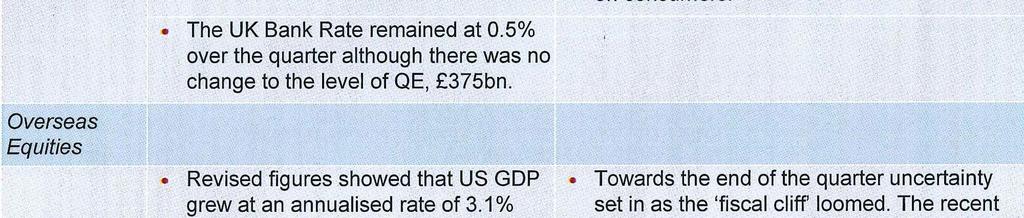
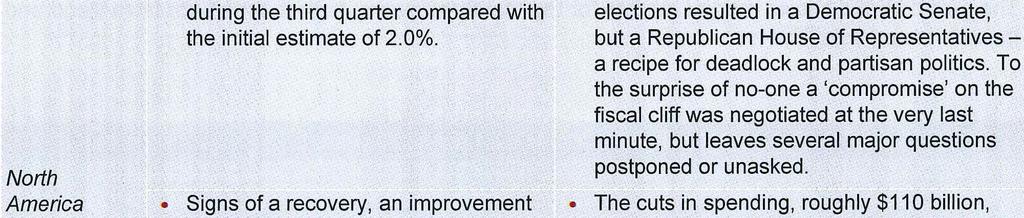
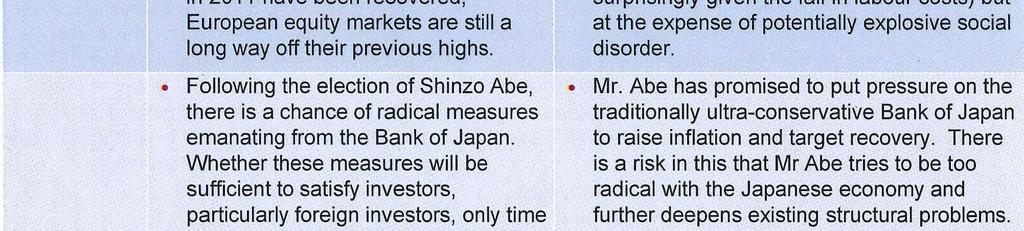
3 Section One Market Update Introduction The tables below summarise the various market returns to 31 December 2012, to relate the analysis of your Scheme's performance to the global economic and market background. Yields as at 31 December 2012 % p.a. Market Returns 3 Mths 1 Year 3 Years Growth Assets % % % UK Equities 3.57 UK Equities UK Gilts (>15 yrs) 3.00 Overseas Equities Real Yield (>5 yrs ILG) USA Corporate Bonds (>15 yrs AA) 4.07 Europe Non-Gilts (>15 yrs) 4.22 Japan Absolute Change in Yields 3 Mths 1 Year 3 Years Asia Pacific (ex Japan) Emerging Markets Property % % % Hedge Fund UK Equities Commodities UK Gilts (>15 yrs) High Yield Index-Linked Gilts (>5 yrs) Emerging Market Debt Corp Bonds (>15 yrs AA) Senior Secured Loans Non-Gilts (>15 yrs) Cash Mths 3 Years Market Returns 1 Year 3 Mths 1 Year Change in Sterling Bond Assets % % % % % % UK Gilts (>15 yrs) Against US Dollar Index-Linked Gilts (>5 yrs) Against Euro Years Corp Bonds (>15 yrs AA) Against Yen Non-Gilts (>15 yrs) * Subject to 1 month lag Source: Thomson Reuters and Bloomberg Inflation Indices 3 Mths 1 Year 3 Years % % % Price Inflation - RPI Price Inflation - CPI Earnings Inflation * London Borough of Barnet Superannuation Fund 3


4 London Borough of Barnet Superannuation Fund 4


5 London Borough of Barnet Superannuation Fund 5

6 London Borough of Barnet Superannuation Fund 6
7 Section Two Total Scheme Performance Start of Quarter Net New Money End of Quarter Manager Fund Value Proportion Value Proportion of Total of Total % % Newton Investment Management Limited (Newton) Real Return 240,437, ,520, ,091, Schroder Investment Management Limited (Schroder) Legal and General Investment Management (L&G) Newton Diversified Growth World (ex UK) Equity Index Corporate Bond 224,871, ,188, ,250, ,001, ,822, ,080, ,414, Schroder L&G All Maturities Corporate Bond Active Corporate Bond All Stocks 109,281, ,043, ,456, ,855, Schroders Cash 428, , Internal Cash 5,264, n/a 4,498, ASSET SPLIT Growth assets 505,252, ,218, Bond assets 243,560, ,313, TOTAL 748,812, ,600, ,532, Source: Investment managers, bid values. Please note that the Internal Cash is assumed to have earned no interest over the quarter. The Schroders Cash is assumed to be held in respect of the Growth portfolio. London Borough of Barnet Superannuation Fund 7
8 Total Scheme Performance Portfolio Return Q % Benchmark Return Q % Total Scheme Growth Portfolio Growth v Global Equity Growth v RPI+5% p.a Growth v LIBOR + 4% p.a Bond Portfolio Bond v Over 15 Year Gilts Bond v Index-Linked Gilts (> 5 yrs) The Growth portfolio excludes L&G equities. The global equity benchmark is 60% FTSE All Share Index, 40% FTSE AW All-World (ex UK) Index. *Liability benchmark (see page 17). The Bond portfolio excludes L&G corporate bond fund. The total scheme return is shown against the liability benchmark return (see page 17). The Growth portfolio return is the combined Newton and Schroder DGF portfolios and is shown against a notional 60/40 global equity benchmark and the underlying benchmarks of each fund for comparison purposes. The Bond portfolio is the combined Newton and Schroder corporate bond portfolios and is shown against the Over 15 Year Gilts Index and Index Linked (Over 5 years) Index. Individual Manager Performance Manager/Fund Portfolio Return Q % Portfolio Benchmark Q % Newton Real Return Schroder Diversified Growth L&G Overseas Equity Newton Corporate Bond Schroder Corporate Bond L&G Corporate Bond Source: Investment managers, Thomson Reuters. Performance is money-weighted. London Borough of Barnet Superannuation Fund 8
9 The previous table shows the breakdown of the individual manager/portfolio returns against their underlying benchmarks. Total Scheme - performance relative to liability benchmark Return 12.0% 8.0% 4.0% -4.0% -8.0% 12.0% 8.0% 4.0% -4.0% -8.0% -12.0% -12.0% Q1 10 Q2 10 Q3 10 Q4 10 Q1 11 Q2 11 Q3 11 Q4 11 Q1 12 Q2 12 Q3 12 Q4 12 Benchmark Return (LHS) Quarterly Outperformance (RHS) Fund Return (LHS) Quarterly Underperformance (RHS) Source: Investment managers, Thomson Reuters. The Scheme achieved a return of 0.8% over the quarter and outperformed the liability benchmark return by 0.3%. This was due to a combination of rebounding equity markets, good corporate bond returns and an expected fall in the estimated value of the liabilities. The chart above shows the historical returns against the WM Universe for information. The new strategy against the liability benchmark is effective from 1 January The Scheme generated a positive absolute return as all the underlying funds generated positive absolute returns except the Newton Real Return Fund. On a relative basis, only the corporate bond funds outperformed their respective benchmarks. The Growth Portfolio, comprising the two DGF funds, underperformed the notional 60/40 global equity benchmark, by 3.4%, as the equity markets performed well compared to the DGF funds. It is usual to expect DGF funds to underperform equities in rising markets. The Growth portfolio returned less than both of the LIBOR +4% and the RPI +5% target returns of the respective DGF funds. The Growth portfolio s negative absolute (and relative) return over the quarter was driven by the Newton Real Return Fund. The Bond Portfolio, comprising the two corporate bond portfolios managed by Newton and Schroder, outperformed the Over 15 Year Gilts Index (by 2.5%) and underperformed the Over 5 Years Index Linked Gilts Index (by 2.7%). London Borough of Barnet Superannuation Fund 9
10 Section Three Manager Performance Newton - Real Return Fund - performance relative to portfolio benchmark 6.0% 6.0% 4.0% 4.0% 2.0% -2.0% -4.0% -6.0% Q1 10 Q2 10 Q3 10 Q4 10 Q1 11 Q2 11 Q3 11 Q4 11 Q1 12 Q2 12 Q3 12 Q4 12 Return 2.0% -2.0% -4.0% -6.0% Benchmark Return (LHS) Quarterly Outperformance (RHS) Fund Return (LHS) Quarterly Underperformance (RHS) Source: Investment manager. The Newton Real Return Fund return was -2.0% compared to its LIBOR + 4% p.a. benchmark return of 1.1%, thereby underperforming by 3.1%. In comparison to a notional 60/40 global equity benchmark return the fund underperformed by 5.2%. The Newton Real Return Fund produced a negative absolute return during a quarter; the negative performance was a result of the Fund's defensive positioning. The Fund s equity allocation was impacted negatively by both sector selection and stock specific events. At a stock level, Newcrest Mining and Barrick Gold (mining stocks) were the largest detractors from performance. Over the 12 month period, the Fund returned 4.2% versus the benchmark return of 4.7%. In comparison to a notional 60/40 global equity benchmark return the fund underperformed by 8.0%. London Borough of Barnet Superannuation Fund 10
11 Schroder - Diversified Growth Fund - performance relative to portfolio benchmark 6.0% 6.0% 4.0% 4.0% 2.0% 2.0% Return -2.0% -4.0% -2.0% -4.0% -6.0% -6.0% -8.0% -8.0% % -12.0% Q1 10 Q2 10 Q3 10 Q4 10 Q1 11 Q2 11 Q3 11 Q4 11 Q1 12 Q2 12 Q3 12 Q4 12 Benchmark Return (LHS) Quarterly Outperformance (RHS) Fund Return (LHS) Quarterly Underperformance (RHS) Source: Investment manager. The Schroder DGF return was 1.9% compared to its RPI + 5% p.a. portfolio benchmark return of 2.3%, underperforming by 0.4%. In comparison to a notional 60/40 global equity benchmark return the fund underperformed by 1.3%. The significant position in equities was the largest contributor to performance over the quarter. Other notable contributions were made from High Yield and foreign exchange. At an asset class level, the main detractor to performance over the quarter was the allocation to commodities. Schroder believe that 'safety' is looking expensive with negative real yields on cash and bonds, thus increasing the incentive to take on more risk. They believe that there are opportunities in value equities and an improving macro picture has meant that they have increased their exposure to US small caps and banks. Over the 12 month period, the Fund returned a strong absolute return of 7.5% versus the benchmark return of 8.3%. In comparison to a notional 60/40 global equity benchmark return the fund underperformed by 4.7%. London Borough of Barnet Superannuation Fund 11
12 Asset allocation for growth managers: movement over the quarter Q4 '12 Q4 '12 Q3 '12 Q3 '12 Newton Schroder Newton Schroder % % % % Source: Investment managers. UK Equities Overseas Equities Fixed Interest Corporate Bonds High Yield Private Equity Commodities Absolute Return Index-Linked Property Cash/Other TOTAL London Borough of Barnet Superannuation Fund 12
13 Newton - Corporate Bond portfolio - performance relative to portfolio benchmark 7.0% 7.0% 6.0% 6.0% 5.0% 5.0% Return 4.0% 3.0% 2.0% 4.0% 3.0% 2.0% 1.0% ` 1.0% -1.0% -1.0% Q1 10 Q2 10 Q3 10 Q4 10 Q1 11 Q2 11 Q3 11 Q4 11 Q1 12 Q2 12 Q3 12 Q4 12 Benchmark Return (LHS) Quarterly Outperformance (RHS) Fund Return (LHS) Quarterly Underperformance (RHS) Source: Investment manager. The Newton Corporate Bond portfolio marginally outperformed its benchmark, returning 2.1% versus the benchmark return of 2.0%. The outperformance was attributable to the Fund's strong stock selection and a well-timed move to shorten the funds duration. Over the 12 month period, the Fund returned 13.9% versus the benchmark return of 14.5%. Schroder - All Maturities Corporate Bond portfolio - performance relative to portfolio benchmark Return 8.0% 6.0% 4.0% 2.0% -2.0% 8.0% 6.0% 4.0% 2.0% -2.0% -4.0% -4.0% Q1 10 Q2 10 Q3 10 Q4 10 Q1 11 Q2 11 Q3 11 Q4 11 Q1 12 Q2 12 Q3 12 Q4 12 Benchmark Return (LHS) Quarterly Outperformance (RHS) Fund Return (LHS) Quarterly Underperformance (RHS) Source: Investment manager. The Schroders Corporate Bond portfolio outperformed the benchmark by 0.3%, returning 2.5%. The Fund s positions in lower-rated credits and subordinated financials benefitted as these were the best performing bonds. Over the 12 month period, the Fund returned 13.9% versus the benchmark return of 13.2%. London Borough of Barnet Superannuation Fund 13
14 L&G Overseas Equities 25.0% % 25.0% % Return 1 5.0% -5.0% % 1 5.0% -5.0% % -2-2 Q1 10 Q2 10 Q3 10 Q4 10 Q1 11 Q2 11 Q3 11 Q4 11 Q1 12 Q2 12 Q3 12 Q4 12 Benchmark Return (LHS) Quarterly Outperformance (RHS) Fund Return (LHS) Quarterly Underperformance (RHS) Source: Investment manager. Over the fourth quarter of 2012, the Fund underperformed its benchmark by 0.2% and generated positive absolute return of 2.2%. Over the 12 month period, the Fund return was 11.9%, and underperformed its benchmark by 0.2%. The Funds has performed broadly in line with its benchmark over the 3 year period. London Borough of Barnet Superannuation Fund 14
15 L&G Active Corporate Bond - All Stocks - Fund 8.0% 8.0% 6.0% 6.0% 4.0% 4.0% Return 2.0% 2.0% -2.0% -2.0% -4.0% -4.0% -6.0% -6.0% Q1 10 Q2 10 Q3 10 Q4 10 Q1 11 Q2 11 Q3 11 Q4 11 Q1 12 Q2 12 Q3 12 Q4 12 Benchmark Return (LHS) Quarterly Outperformance (RHS) Fund Return (LHS) Quarterly Underperformance (RHS) Source: Investment manager. Over the quarter the Fund outperformed its benchmark by 0.3% and generated positive absolute return of 2.4%. Stock selection and sector exposures were the main positive drivers of performance, the overweight exposure to financials was supportive as financials outperformed significantly during the quarter. Over the 12 month period, the Fund has performed well with a return of 14.0% compared with the benchmark return of 13.1%. London Borough of Barnet Superannuation Fund 15
16 Section Four Consideration of Funding Level This section of the report considers the funding level of the Scheme. Firstly, it looks at the Scheme asset allocation relative to its liabilities. Then it looks at market movements, as they have an impact on both the assets and the estimated value placed on the liabilities. Allocation to Bond and Growth assets against estimated liability split 100 Proportion of Liabilities % Sep 12 Assets Sep 12 Liabilities Dec 12 Assets Dec 12 Liabilities Bond Assets Pensioner Liabilities Deficit Grow th Assets Non-Pensioner Liabilities Surplus The chart above shows the allocation of the Scheme to Bond and Growth assets (see Glossary of Terms for definition) against the estimated liability split, which is based on changes in gilt yields underlying the Scheme Actuary s calculation of liabilities. The reference yield for the liabilities is the over 15-year gilt yield, as shown in the Market Statistics table in Section 2. These calculations do not take account of unexpected changes to Scheme membership and should not be construed as an actuarial valuation. However, by showing approximations to these liabilities, this chart should assist the Panel in making informed decisions on asset allocation. Over the quarter, the funding position improved by 0.4%, led by an increase in the value of assets by 8.7 million coupled with positive cashflow which was partially offset by an increase in the estimated value of the liabilities by 6.2 million. The Scheme was approximately 73.4% funded as at 31 December The split between non-pensioner and pensioner liabilities is estimated to have remained fairly stable over the quarter. The Scheme remains very underweight to Bond assets relative to its estimated pensioner liabilities; a mismatch that leaves the Scheme exposed to interest rate risk. London Borough of Barnet Superannuation Fund 16
17 Scheme performance relative to estimated liabilities % Q Q Q Q Asset return (scaled by funding level) Cashflow effects Liability impact Change in estimated funding level The above chart shows, for each quarter, how changes in the value of the assets and the liabilities, combined with the cashflow of the Scheme, have affected the funding level. As detailed earlier, the value of the liabilities has been estimated with reference to changes in the gilt yields underlying the Scheme Actuary s calculation of liabilities, as shown in the Market Statistics table. Over the quarter, the estimated funding level increased by 0.4%, from 73.0% to stand at 73.4%, due to an increase in the assets due to the positive absolute returns coupled with positive cashflow which was partially offset by an increase in the expected value of the liabilities. Therefore, based on movements in the investment markets alone, this quarter has seen an increase in the Scheme s estimated funding position with a decrease in the funding deficit. Overall, Q has been a positive quarter for the Scheme in terms of the funding level. London Borough of Barnet Superannuation Fund 17
18 Section Five Summary Overall this has been a good quarter for the Scheme in improving equity markets. In absolute terms, the Scheme s assets produced a return of 0.8% over the quarter. All the growth and bond portfolios produced positive absolute returns (except Newton Real Return Fund). In relative terms, the Scheme outperformed the liability benchmark return (see page 17) by 0.3%. Of the funds, only the corporate bond funds outperformed their respective benchmarks; the DGF's underperformed their respective benchmarks. The combined Growth portfolio underperformed a notional 60/40 global equity return and produced a negative absolute return of 0.1%, also, underperforming the benchmarks which are cash-based. The combined Bond Portfolio outperformed the Over 15 Year Gilts Index by 2.5% and underperformed the Index Linked Gilts (>5 Years) Index by 2.7%. Over the quarter it is anticipated, all other things being equal, that investment conditions had a positive impact (0.4%) on the Scheme's estimated funding level which was 73.4% as at 31 December London Borough of Barnet Superannuation Fund 18
19 Appendix Liability benchmarking An assessment of Scheme liabilities and how they change would require details of membership changes and actuarial valuation calculations to be carried out. However, by considering the changes in value of a suitable notional portfolio, based on your own liabilities, we can obtain an approximation to the changes in liabilities which will have occurred as a result of investment factors. In this report, when we refer to liabilities we mean the notional portfolio representing the actuarial liabilities disclosed in the actuarial valuation report dated 31 March 2010, adjusted approximately to reflect changes in investment factors. This will, therefore, not reflect any unanticipated member movements since the actuarial valuation. However, as a broad approximation it will allow more informed decisions on investment strategy. When we refer to the "liability benchmark" we mean the estimated impact on the liabilities (as referred to above) based on market movements alone. Summary of current funds Manager Fund Date of Management Monitoring Target Appointment Style Benchmark Newton Real December Active, pooled 1 month LIBOR To achieve significant real Investment Return 2010 plus 4% p.a. rates of return in sterling Management terms predominantly from a Limited portfolio of UK and (Newton) international securities and to outperform the benchmark over rolling 5 years Newton Corporate December Active, pooled Merrill Lynch To outperform the Bond 2010 Sterling Non Gilt benchmark by 1% p.a. over Over 10 Years rolling 5 years Investment Grade Index Schroder Diversified December Active, pooled Retail Price Index To outperform the Investment Growth 2010 plus 5% p.a. benchmark over a market Management cycle (typically 5 years) Limited (Schroder) Schroder All December Active, pooled Merrill Lynch To outperform the Maturities 2010 Sterling Non-Gilts benchmark by 0.75% p.a. Corporate All Stocks Index (gross of fees) over rolling Bond 3 years Legal and World (ex September Passive, FTSE AW World Track within +/- 0.5% p.a. General UK) Equity 2008 pooled (ex UK) Index the index for 2 years in Investment Index Fund every 3 Management (L&G) London Borough of Barnet Superannuation Fund 19
20 Summary of current funds (continued) Manager Fund Date of Management Monitoring Target Appointment Style Benchmark L&G Active December Active, pooled iboxx Sterling Non- Outperform by 0.75% p.a. Corporate 2008 Gilts All Stocks (before fees) over rolling 3 Bond All Index years Stocks Internal Property N/a Active, property unit trust portfolio UK IPD Property Index Outperform the index Newton Balanced April 2006 Active, WM Local Outperform by 1% p.a over Investment segregated Authority Weighted rolling 3 years, and not to Management Average underperform by 3% in any Limited rolling 12 month period (Newton) Schroder Balanced 1994 Active, WM Local Outperform by 1% p.a over Investment segregated Authority Weighted rolling 3 years, and not to Management Average ex underperform by 3% in any Limited property, Japan rolling 12 month period (Schroder) and other international equities London Borough of Barnet Superannuation Fund 20
21 Glossary of Terms Term Absolute return Bond asset Growth asset Duration Funded liabilities Market stats indices Definition The overall return on a fund. Assets held in the expectation that they will exhibit a degree of sensitivity to yield changes. The value of a benefit payable to a pensioner is often calculated assuming the invested assets in respect of those liabilities achieve a return based on UK bonds. Assets held in the expectation that they will achieve more than the return on UK bonds. The value of a benefit payable to a non-pensioner is often calculated assuming the invested assets in respect of those liabilities achieve a return based on UK bonds plus a premium (for example, if holding equities an equity risk premium may be applied). The liabilities will still remain sensitive to yields although the Growth assets may not. The average time to payment of cashflows (in years), calculated by reference to the time and amount of each payment. It is a measure of the sensitivity of price/value to movements in yields. The value of benefits payable to members that can be paid from the existing assets of the scheme (i.e. those liabilities that have assets available to meet them). The following indices are used for asset returns: UK Equities: FTSE All-Share Index Overseas Equities: FTSE World Index Series (and regional sub-indices) UK Gilts: FTSE-A Gilt >15 Yrs Index Index Linked Gilts: FTSE-A ILG >5 Yrs Index Corporate Bonds: iboxx Corporate Bonds (AA) Over 15 Yrs Index Non-Gilts: iboxx Non-Gilts Over 15 Yrs Index Property: IPD Property Index High Yield: ML Global High Yield Index Commodities: S&P GSCI GBP Index Hedge Funds: CSFB/Tremont Hedge Fund Index Cash: 7 day London Interbank Middle Rate Price Inflation: Retail Price Index (excluding mortgages), RPIX Earnings Inflation: Average Earnings Index London Borough of Barnet Superannuation Fund 21
22 Market volatility Money-Weighted rate of return Non-Pensioner liability Pensioner liability Portfolio benchmark The impact of the assets producing returns different to those assumed within the actuarial valuation basis, excluding the yield change impact. The rate of return on an investment including the amount and timing of cashflows. The value of benefits payable to those who are yet to retire, including active and deferred members. The value of benefits payable to those who have already retired, irrespective of their age. The benchmark return of the each manager/fund. Relative return Scheme investments Standard deviation Surplus/Deficit Time-Weighted rate of return Unfunded liabilities Yield (gross redemption yield) The return on a fund compared to the return on another fund, index or benchmark. For IMAGE purposes this is defined as: Return on Fund less Return on Index or Benchmark. Refers only to the invested assets, including cash, held by your investment managers. A statistical measure of volatility. We expect returns to be within one standard deviation of the benchmark 2 years in every 3. Hence as the standard deviation increases so does the risk. The estimated funding position of the Scheme. This is not an actuarial valuation and is based on estimated changes in liabilities as a result of bond yield changes, asset movements and, if carried out, output from an asset liability investigation (ALI). If no ALI has been undertaken the estimate is less robust. The rate of return on an investment removing the effect of the amount and timing of cashflows. The value of benefits payable to members that cannot be paid from the existing assets of the Scheme (i.e. those liabilities that have no physical assets available to meet them). These liabilities are effectively the deficit of the Scheme. The return expected from a bond if held to maturity. It is calculated by finding the rate of return that equates the current market price to the discounted value of future cashflows. 3 Year return The total return on the fund over a 3 year period expressed in percent per annum. London Borough of Barnet Superannuation Fund 22
23 JLT Manager Research Tier Rating System BUY Tier Definition Significant probability that the manager will meet the client s objectives. HOLD REVIEW Reasonable probability that the manager will meet the client s objectives. This fund will not be put forward for new investments but there is no intention to sell existing holdings. The manager may reach the client s objectives but a number of concerns exist. The JLT Manager Research Team are currently reviewing this fund. SELL There is a reasonable probability that the manager will fail to meet the client s objective due to a number of key concerns and therefore we recommend clients to redeem their assets. This report is written for the addressees only and may not be further copied or distributed without the prior permission of JLT Investment Consulting. The value of investments can fall as well as rise and you may get back less than your original investment. The past is no guide to future performance. The information contained in this report is compiled from sources which we believe to be reliable and accurate at the date of this report. London Borough of Barnet Superannuation Fund 23
24 JLT Investment Consulting St James's House, 7 Charlotte Street, Manchester, M1 4DZ Fax +44 (0) JLT Investment Consulting. A trading name of JLT Benefit Solutions Limited. Authorised and regulated by the Financial Services Authority. Registered in England: 6 Crutched Friars, London EC3N 2PH Tel +44 (0) Fax +44 (0) Registered in England Number VAT No CONTACTS Julian Brown, PhD IMC JLT Investment Consulting Tel: +44 (0) julian_brown@jltgroup.com Jignasha Patel, MMath (Hons) IMC JLT Investment Consulting Tel: +44 (0) jignasha_patel@jltgroup.com 24
Performance Report - Quarterly Update 30 September 2012 London Borough of Barnet Superannuation Fund
 APPENDIX B Performance Report - Quarterly Update 30 September 2012 London Borough of Barnet Superannuation Fund JLT INVESTMENT CONSULTING Contents Contents...2 Section One Market Update...3 Section Two
Performance Report - Quarterly Update 31 December 2013 London Borough of Barnet Superannuation Fund
 Appendix B Performance Report - Quarterly Update 31 December 2013 London Borough of Barnet Superannuation Fund JLT Employee Benefits Contents Contents... 1 Section One Market Update... 2 Section Two Total
London Borough of Barnet Superannuation Fund. Quarterly update to 30 September 2014
 Superannuation Fund Quarterly update to 30 September 2014 May 2014 Contents 1 Market update... 1 2 Total scheme performance... 6 3 Manager performance... 9 3.1 Newton Real Return Fund... 9 3.2 Schroder
London Borough of Barnet Superannuation Fund. Quarterly update to 31 March 2014
 Superannuation Fund Quarterly update to 31 March 2014 May 2014 Contents 1 Market update... 1 2 Total scheme performance... 6 3 Manager performance... 9 3.1 Newton Real Return Fund... 9 3.2 Schroder Diversified
London Borough of Barnet Pension Fund. Quarterly update to 31 March 2015
 Quarterly update to 31 March 2015 19 May 2015 Contents 1 Executive Summary... 1 2 Market update... 2 3 Total scheme performance... 7 4 Longer Term Performance... 10 5 Asset Allocation... 11 6 Manager performance...
Fund Fact Sheet. for members of the Hewlett-Packard Limited Pension Scheme
 Fund Fact Sheet for members of the Hewlett-Packard Limited Pension Scheme 31 December 29 Introduction This fact sheet gives you details of the investment funds available to you as a member of the Hewlett-Packard
John Hooton, Assistant Director of Strategic Finance Karen Bannister, Interim Treasury Manager. Not applicable
 AGENDA ITEM: 7 Page nos: 8-24 Meeting Pension Fund Committee Date 21 March 2011 Subject Report of Summary Property Portfolio Deputy Chief Executive This report asks the Committee to note the recommendations
Fund Fact Sheet. for members of the Hewlett-Packard Limited Pension Scheme
 Fund Fact Sheet for members of the Hewlett-Packard Limited Pension Scheme 3 June 21 Introduction This fact sheet gives you details of the investment funds available to you as a member of the Hewlett-Packard
The SunGard Retirement Benefits Scheme Quarterly Investment Monitoring Report to 31 March 2012
 Quarterly Investment Monitoring Report to 31 March 2012 Executive Summary Scheme Asset Valuation The SunGard Section's assets increased in value over the quarter to 75,233,620. This is an increase of 5,188,852
Bank of America Merrill Lynch UK Pension Plan Statement of Investment Principles
 Bank of America Merrill Lynch UK Pension Plan Statement of Investment Principles This Statement of Investment Principles ( SIP ) covers both the defined benefit (also known as final salary ) and the defined
London Borough of Barnet Pension Fund
 Appendix D - JLT Investment Strategy Positioning Report London Borough of Barnet Pension Fund Investment strategy Contents 1 Introduction... 1 2 Executive summary... 2 3 Current investment strategy...
Pension Fund Committee Date 6 June Barnet Council Pension Fund Performance for Quarter January to March 2013 Chief Operating Officer
 Meeting Pension Fund Committee Date 6 June 2013 Subject Report of Summary Barnet Council Pension Fund Performance for Quarter January to March 2013 Chief Operating Officer Barnet Council Pension Fund Performance
NORTH YORKSHIRE COUNTY COUNCIL PENSION FUND COMMITTEE 26 FEBRUARY 2015 PERFORMANCE OF THE FUND'S PORTFOLIO FOR THE QUARTER ENDING 31 DECEMBER 2014
 NORTH YORKSHIRE COUNTY COUNCIL PENSION FUND COMMITTEE 26 FEBRUARY 2015 PERFORMANCE OF THE FUND'S PORTFOLIO FOR THE QUARTER ENDING 31 DECEMBER 2014 Report of the Treasurer 1.0 PURPOSE OF REPORT 1.1 To report
Investment Report. Corporate Investment Proposition Passive Plus Funds Report. Standard Life
 Investment Report Standard Life Corporate Investment Proposition Q3 2016 Corporate Investment Proposition 1 Our Corporate Investment Proposition is made up of a family of carefully constructed risk-based
LONDON BOROUGH OF REDBRIDGE PENSION FUND INVESTMENT PANEL
 LONDON BOROUGH OF REDBRIDGE PENSION FUND INVESTMENT PANEL ANNUAL REVIEW 2007 2008 Contents Page Executive Summary 1 Introduction 2 Pension Fund Membership 2 Fund Performance 3 Draft Pension Fund Accounts
Investment Strategy Statement (June 2018)
") Investment Strategy Statement (June 2018) Introduction and background This is the Investment Strategy Statement ( ISS ) of the Tyne and Wear Pension Fund ( the Fund ), which is administered by South Tyneside
Investment Strategy Statement (June 2018) Introduction and background This is the Investment Strategy Statement ( ISS ) of the Tyne and Wear Pension Fund ( the Fund ), which is administered by South Tyneside
Week in Markets. FTSE Equity Indices Week MTD Jul 12 Jun 12 QTD YTD. MSCI Equity Indices Week MTD Jul 12 Jun 12 QTD YTD
 Week ending 24 August, 20 Page 1 of 8 FTSE Equity Indices Week MTD Jul Jun QTD YTD UK FTSE All Share -1.3 3.2 1.3 4.8 4.6 8.0 15.5 FTSE -1.3 3.2 1.2 5.0 4.5 6.8 15.3 FTSE 250-1.4 3.0 2.1 3.8 5.2 15.6 17.5
ASSET MANAGEMENT ROYAL LONDON GMAP BALANCED FUND. Quarterly Report 31 March For professional investors only, not for retail investors
 ASSET MANAGEMENT ROYAL LONDON GMAP BALANCED FUND Quarterly Report 31 March 2018 For professional investors only, not for retail investors Contents CONTENTS ROYAL LONDON GMAP BALANCED FUND 3 2 PAGE Royal
Investment Report. Standard Life Corporate Investment Proposition Passive Plus Funds Report Q3 2018
 Investment Report Standard Life Corporate Investment Proposition Q3 2018 Corporate Investment Proposition Our Corporate Investment Proposition is made up of a family of carefully constructed risk-based
The objective of an occupational DB pension scheme is simple pay members their
 October 2016. For professional investors only. Please read the important disclosure at the end of this article. spotlight Supporting the liability-hedging and return-seeking demands of a modern LDI strategy
Investment Report. Corporate Investment Proposition Passive Plus Funds Report. Standard Life
 Investment Report Standard Life Corporate Investment Proposition Q1 2017 Corporate Investment Proposition 1 Our Corporate Investment Proposition is made up of a family of carefully constructed risk-based
Investment Considerations CCLA Investment Management Limited
 Trustee Act 2000 Have regard for Suitability Investment Considerations CCLA Investment Management Limited Heather Lamont 020 7489 6058 Heather.Lamont@ccla.co.uk Alison Jermey 020 7489 6011 Alison.Jermey@ccla.org.uk
LOCAL GOVERNMENT PENSION SCHEME UPDATE
 Central Bedfordshire Council AUDIT COMMITTEE 29 June 2015 LOCAL GOVERNMENT PENSION SCHEME UPDATE Report of Charles Warboys, Chief Finance Officer (charles.warboys@centralbedfordshire.gov.uk) Contact Officer:
Week in Markets. FTSE Equity Indices Week MTD Mar 17 Feb 17 QTD YTD. MSCI Equity Indices Week MTD Mar 17 Feb 17 QTD YTD
 Week ending 7 April, 2017 Page 1 of 8 FTSE Equity Indices Week MTD Mar 17 Feb 17 QTD YTD UK FTSE All Share 0.6 0.6 1.2 3.1 0.6 4.7 23.5 FTSE 0.5 0.5 1.1 3.1 0.5 4.2 24.6 FTSE 250 1.5 1.5 1.4 3.5 1.5 7.0
Investment Strategy Statement: September 2018
 Investment Strategy Statement: September 2018 Introduction and background This is the Investment Strategy Statement ( ISS ) of the London Borough of Lewisham Pension Fund ( the Fund ), which is administered
LONDON BOROUGH OF HARROW PENSION FUND INVESTMENT STRATEGY STATEMENT
 LONDON BOROUGH OF HARROW PENSION FUND INVESTMENT STRATEGY STATEMENT March 2017 CONTENTS Executive Summary 1. Introduction 2. Statutory background 3. Directions by Secretary of State 4. Advisers 5. Objective
Member FundWatch. DHL Group Retirement Plan. Fourth quarter Willis Towers Watson. All rights reserved.
 Member FundWatch DHL Group Retirement Plan Fourth quarter 216 217 Willis Towers Watson. All rights reserved. EXEC SUMMARY Executive summary Headline Comments Action The Plan s assets increased by 3.% over
LPFA Monthly Solvency Report as at 29 September 2017 Final Month End Data
 LPFA Monthly Solvency Report as at 29 September 2017 Final Month End Data Purpose and summary This report is prepared for the LPFA Board. It provides an up to date estimate of funding level and sets out
LPFA Monthly Solvency Report as at 30 November 2017 Final Month End Data
 LPFA Monthly Solvency Report as at 30 November 2017 Final Month End Data Purpose and summary This report is prepared for the LPFA Board. It provides an up to date estimate of funding level and sets out
Threadneedle UK Regulated Funds. Threadneedle Focus Investment Funds ICVC. Threadneedle Investment Funds ICVC
 Details before Details after Threadneedle Focus Investment Funds ICVC Credit Opportunities Fund 01/01/2010 No high water mark Introduction of a high water mark and increase of the hurdle rate above which
Prepared with you in mind
 My Default Strategy for the J.P. Morgan UK Pension Plan Prepared with you in mind J.P. Morgan UK Pension Plan Your future. Your choice. Your future. Your choice. Introduction to the Default Strategy The
YOUR INVESTMENT OPTIONS
 BNP PARIBAS RETIREMENT SAVINGS PLAN YOUR INVESTMENT OPTIONS VISTA RETIREMENT SAVINGS PLAN V I S T A ENTER The bank for a changing world CONTENTS DIFFERENT TYPES OF INVESTMENT...4 WHAT ARE THE MAIN RISKS?...5
Q4 QUARTERLY GUIDE PENSIONS ACCOUNTING
 Q4 QUARTERLY GUIDE PENSIONS ACCOUNTING As at 31 December 2017 Guidance for Finance Directors 1 QUARTERLY GUIDE TO PENSIONS ACCOUNTING ASSUMPTIONS REPORT DECEMBER 2017 QUARTERLY GUIDE TO PENSIONS ACCOUNTING
Pensions Statement of Investment
 Pensions Statement of Investment Principles 2015 Your Guide to the London Borough of Croydon Statement of Investment Principles As the Administering Authority we have prepared this guide to the Investment
Finance Services. London Borough of Redbridge Pension Fund Investment Panel. Annual Review 2005/06
 Finance Services London Borough of Redbridge Pension Fund Investment Panel Annual Review 2005/06 CONTENTS PAGE Executive Summary 1 Introduction 2 Pension Fund Membership 2 Fund Performance 3 Draft Pension
DLA Piper UK Pension Scheme Medium Growth/Med Risk Fund Fund Factsheet 1st Quarter 2018
 This factsheet has been produced to provide you with information on this blended fund. It includes information on the investment objective of the fund, where the fund is invested, risk information and
Pension Fund March 2018
 Pension Fund March 2018 Aviva Pension BlackRock Consensus IE/XE This factsheet provides factual information only. The information shown should not be used in isolation for making buying and selling decisions.
Q3 QUARTERLY GUIDE PENSIONS ACCOUNTING
 Q3 QUARTERLY GUIDE PENSIONS ACCOUNTING As at 30 September 2017 Guidance for Finance Directors 1 QUARTERLY GUIDE TO PENSIONS ACCOUNTING ASSUMPTIONS REPORT SEPTEMBER 2017 QUARTERLY GUIDE TO PENSIONS ACCOUNTING
Shetland Islands Council Pension Fund. Statement of Investment Principles
 Shetland Islands Council Pension Fund 1.0 Introduction Statement of Investment Principles 1.1 The Local Government Pension Scheme (Management and Investment of Funds) (Scotland) Regulations 2010 requires
Latest news about the fund, what it invests in and how it performed in the three months to the end of June 2017
 All data as at unless otherwise stated. My Future (NGP) Second quarter 2017 Latest news about the fund, what it invests in and how it performed in the three months the end of June 2017
STATEMENT OF INVESTMENT PRINCIPLES (SIP) IN RESPECT OF EDS RETIREMENT PLAN and EDS 1994 PENSION SCHEME (Plans)
 IN RESPECT OF EDS RETIREMENT PLAN and EDS 1994 PENSION SCHEME (Plans)") INTRODUCTION STATEMENT OF INVESTMENT PRINCIPLES (SIP) IN RESPECT OF EDS RETIREMENT PLAN and EDS 1994 PENSION SCHEME (Plans) 1.1 EDS Trustee Limited and EDS 1994 Trustee Limited (Trustees) have each prepared
INTRODUCTION STATEMENT OF INVESTMENT PRINCIPLES (SIP) IN RESPECT OF EDS RETIREMENT PLAN and EDS 1994 PENSION SCHEME (Plans) 1.1 EDS Trustee Limited and EDS 1994 Trustee Limited (Trustees) have each prepared
The Mercantile Investment Trust plc Investment Trust Adviser Seminar
 The Mercantile Investment Trust plc Investment Trust Adviser Seminar October 2015 FOR PROFESSIONAL CLIENTS ONLY NOT FOR RETAIL USE OR DISTRIBUTION Agenda Overview of fund strategy Benefits of investment
Quarterly market summary
 Quarterly market summary 4th Quarter 2017 Economic overview Further evidence of synchronised global economic improvement was signalled by higher measures of economic activity and company profits, along
Quarterly market summary
 Quarterly market summary 4th Quarter 2016 Economic overview Economies around the world appear to be relatively resilient, with data signalling that in many countries, economic activities are expanding
AXA Australia Staff Superannuation Plan
 AXA Australia Staff Superannuation Plan March 2008 Newsletter for Retirement Pensioner and Deferred Benefit members covering: - Changes to the Plan s investment structure The trustee of the AXA Australia
Q2 QUARTERLY GUIDE PENSIONS ACCOUNTING
 Q2 QUARTERLY GUIDE PENSIONS ACCOUNTING As at 30 June 2017 Guidance for Finance Directors 1 QUARTERLY GUIDE TO PENSIONS ACCOUNTING ASSUMPTIONS REPORT JUNE 2017 QUARTERLY GUIDE TO PENSIONS ACCOUNTING AS
GSK Pension Fund ( the Fund ) Statement of Investment Principles
 Statement of Investment Principles") GSK Pension ( the ) Statement of Principles This Statement of Principles (SIP) covers the defined benefit and the defined contribution sections of the. It is set out in four parts: 1) Governance arrangements
GSK Pension ( the ) Statement of Principles This Statement of Principles (SIP) covers the defined benefit and the defined contribution sections of the. It is set out in four parts: 1) Governance arrangements
SOCIAL HOUSING PENSION SCHEME FRS102 ASSUMPTION SETTING METHODOLOGY
 THE PENSIONS TRUST SOCIAL HOUSING PENSION SCHEME FRS102 METHODOLOGY Month ends from 31 March 2019 to 29 February 2020 TABLE OF CONTENTS 1 Introduction... 3 2 Proposed Assumptions... 4 3 Discount Rate...
P a g e 1
 P a g e 1 P a g e 2 P a g e 3 P a g e 4 P a g e 5 P a g e 6 P a g e 7 P a g e 8 P a g e 9 P a g e 1 P a g e 2 The Professional Footballers Pension Scheme Income Section Statement of Investment Principles
LONDON BOROUGH OF HARINGEY PENSION FUND INVESTMENT STRATEGY STATEMENT. 1. Introduction
 LONDON BOROUGH OF HARINGEY PENSION FUND INVESTMENT STRATEGY STATEMENT 1. Introduction Haringey Council is the Administering Authority for the Local Government Pension Scheme in the London Borough of Haringey
Investment Report. Corporate Investment Proposition Passive Plus Funds Report. Standard Life
 Investment Report Standard Life Corporate Investment Proposition Q3 2017 Corporate Investment Proposition 1 Our Corporate Investment Proposition is made up of a family of carefully constructed risk-based
Managed Portfolios from OBSR December 2012
 Managed Portfolios from OBSR December 2012 WHAT ARE THE MANAGED PORTFOLIOS FROM OBSR? The Managed Portfolios from OBSR are a range of five funds designed to actively target and maintain different levels
Statement of Investment Principles University of Oxford Staff Pension Scheme (Defined Benefit)
") Statement of Investment Principles University of Oxford Staff Pension Scheme (Defined Benefit) Introduction This Statement of Investment Principles (SIP) has been prepared by the Trustee of the University
Statement of Investment Principles University of Oxford Staff Pension Scheme (Defined Benefit) Introduction This Statement of Investment Principles (SIP) has been prepared by the Trustee of the University
eastsussex.gov.uk Investment Strategy Statement
 eastsussex.gov.uk Investment Strategy Statement September 2018 Introduction and background This is the Investment Strategy Statement ( ISS ) of the East Sussex Pension Fund ( the Fund ), which is administered
Pension Fund June 2018
 Pension Fund June 2018 Aviva Pension My Future Drawdown IE/ XE This factsheet provides factual information only. The information shown should not be used in isolation for making buying and selling decisions.
Global House View: Market Outlook
 HSBC GLOBAL ASSET MANAGEMENT September 29 Global House View: Market Outlook Contents 1688/HSB1395a Market performance Macro-economic Picture Market Views: high level asset allocation Market Views: Equity
Risk-Adjusted Return: Quarterly Update
 Risk-Adjusted Return: Quarterly Update R R f R f Economics Nobel Laureate William F. developed the ratio to measure risk-adjusted investment return. The ratio allows us to evaluate the performance of an
Monthly Bulletin May J.P. Morgan Luxembourg based fund ranges
 Monthly Bulletin May 2018 J.P. Morgan Luxembourg based fund ranges Performance summary for Equity Fund Range EQUITY US A (dist) - USD 2.1-5.3 14.9 33.1 79.9 14.6 15.7-1.0 8.2 25.2 JPM America Equity A
What are the changes to the funds available to me (UP960)?
?") What are the changes to the funds available to me (UP960)? The changes listed below will be made to the funds between July 2018 and the end of the year. We will update the information we have online with
What are the changes to the funds available to me (UP960)? The changes listed below will be made to the funds between July 2018 and the end of the year. We will update the information we have online with
OCM Asset Management - Risk Profile Report
 June 2015 Contents Executive summary... 3 1. Introduction... 4 2. Analysis and methodology... 5 3. Results and model profiles... 7 4. Summary... 11 Appendix A: Investment assumptions... 12 Appendix B:
Summary of fund changes
 Life funds Event Type Fund Name Fund Code Effective Date Fund Name and Description Change Schroder have informed us that their European Opportunities fund will be managed by a different portfolio manager
Evaluating Scottish Widows Funds 1 July 2018
 Evaluating Scottish Widows 1 July 2018 This information is for UK Financial Advisers use only and should not be distributed to or relied upon by any other person. Contents Pension Statistics Life Statistics
Evaluating Scottish Widows Funds 1 October 2018
 Evaluating Scottish Widows 1 October 2018 This information is for UK Financial Advisers use only and should not be distributed to or relied upon by any other person. Contents Pension Statistics Life Statistics
West Midlands Pension Fund
 West Midlands Pension Fund Asset allocation and investment performance report Quarter to 31 March 2017 Jason Fletcher Chief Investment Officer This page is deliberately left blank 2 Contents page 4 page
STATEMENT OF INVESTMENT PRINCIPLES Feb 2017
 1. Introduction 1.1 Local Government Pension Scheme (LGPS) Funds are required to publish a Statement of Investment Principles (SIP) 1 which must include the Fund's policy on the following: The types of
Investment Report. Corporate Investment Proposition Active Plus Funds Report. Standard Life. Corporate Investment Proposition Active Plus Funds Report
 Investment Report Standard Life Corporate Investment Proposition Q1 2018 Corporate Investment Proposition 1 Our Corporate Investment Proposition is made up of a family of carefully constructed risk-based
Statement of Investment Principles
 Statement of Investment Principles Cheshire Pension Fund November 2014 Page 1 of 15 Introduction The Cheshire Pension Fund ( The Fund ) is required to publish a Statement of Investment Principles (SIP)
Sinfonia Asset Management Risk Profile Report May 2017
 Sinfonia Asset Management Risk Profile Report May 2017 Contents Executive summary... 3 1 Introduction... 4 2 Investment objectives... 5 2.1 IFSL Sinfonia Income Portfolio... 5 2.2 IFSL Sinfonia Cautious
THREADNEEDLE POOLED PENSION FUNDS KEY FEATURES DOCUMENT ( KFD )
") THREADNEEDLE POOLED PENSION FUNDS KEY FEATURES DOCUMENT ( KFD ) Effective Date: 1 January 2014 This is an important document which you should read and keep in a safe place threadneedle.com Contents 1.
THREADNEEDLE POOLED PENSION FUNDS KEY FEATURES DOCUMENT ( KFD ) Effective Date: 1 January 2014 This is an important document which you should read and keep in a safe place threadneedle.com Contents 1.
Quarterly market summary 4th Quarter 2018
 POOLED PENSIONS Quarterly market summary 4th Quarter 2018 Economic overview As the quarter progressed, investors became increasingly concerned about the outlook for the world economy. The perception was
2018 saw Fiduciary Managers struggle to deliver their performance targets in testing markets
 XPS FM Watch 2018 saw Fiduciary Managers struggle to deliver their performance targets in testing markets 2018 was the worst year for financial markets since 2011 making it a real test for Fiduciary Managers
Quarterly market summary
 Quarterly market summary 1st Quarter 2017 Economic overview Data appears to signal that economic activity is picking up around the world, with many forecasts for growth being revised upwards. This has
Pensions. Investment Strategy. Statement. Your Guide to the London Borough of Croydon Investment Strategy. Statement
 Pensions Investment Strategy Statement 2018 Your Guide to the London Borough of Croydon Investment Strategy Statement As the Administering Authority we have prepared this guide to the Investment Principles
For professional advisers only. Schroders. for Bonds. Strength. in bonds. Best Large Fixed-Interest House
 For professional advisers only Schroders for Bonds Strength in bonds Best Large Fixed-Interest House Why Schroders for bonds? Experience: Schroders has a long and successful history, commencing in 1804.
Managing cash and investments
 Click to edit Master text styles Second level Managing cash and investments 10 December 2015 Page 0 Agenda Understanding your church s risks and priorities Cash what is it good for? Principal investment
Investment Report With Profits Fund
 Investment Report 2010 With Profits Fund With Profits Fund Investment Report 2010 This report provides information on the performance of the Equities, Property and Fixed Interest investments held in the
MANAGED PORTFOLIO SERVICE
 MANAGED PORTFOLIO SERVICE Balanced Portfolio March 2018 The value of investments can fall and you may get back less than you invested. Past performance is not a guide to future performance. Any specific
Aviva Pension My Future Annuity IE
 Pension Fund July 2018 Aviva Pension My Future Annuity IE This factsheet provides factual information only. The information shown should not be used in isolation for making buying and selling decisions.
Firth Rixson Retirement Benefit Plan Growth Fund Fund Factsheet 4th Quarter 2017
 This factsheet has been produced to provide you with information on this blended fund. It includes information on the investment objective of the fund, where the fund is invested, risk information and
Asset Strategy for Matching Adjustment Business Challenges and Choices
 This document is intended for use at the Insurance Investment Exchange event only. Not for onward distribution. Asset Strategy for Matching Adjustment Business Challenges and Choices June 2016 Agenda Background
SCOTTISH WIDOWS PREMIER PENSION PORTFOLIO FUNDS
 SCOTTISH WIDOWS PREMIER PENSION PORTFOLIO FUNDS SCOTTISH WIDOWS PREMIER PENSION PORTFOLIO FUNDS BUILD ON OUR WELL-ESTABLISHED PENSION PORTFOLIO FUNDS. THEY AIM FOR BETTER POTENTIAL RETURNS FOR BROADLY
Pensions. Investment Strategy. Statement. Your Guide to the London Borough of Croydon Investment Strategy. Statement
 Pensions Investment Strategy Statement 2017 Your Guide to the London Borough of Croydon Investment Strategy Statement As the Administering Authority we have prepared this guide to the Investment Principles
Pension Fund Committee 26 June 2018
 Pension Fund Committee 26 June 2018 Title Report of Wards Status Barnet Council Pension Fund - Performance for the Quarter to 31 March 2018 Director of Finance n/a Public Report with Exempt Appendix C
Investment Report. Standard Life Corporate Investment Proposition MyFolio Managed Pension Funds Report Q2 2018
 Investment Report Standard Life Corporate Investment Proposition Q2 2018 Corporate Investment Proposition Our Corporate Investment Proposition is made up of a family of carefully constructed risk-based
PIER Portfolio News Summer 2017
 PIER Portfolio News Summer 2017 Investment Committee The Investment Committee meeting of PIER Financial Investments Limited ( PIER ), attended by Thesis Asset Management plc ( Thesis ) and Antrams Financial
Quarterly market summary
 Quarterly market summary 2nd Quarter 2017 Economic overview Economic indicators, such as employment statistics, manufacturing activity and company profits, seem to indicate that the global economy is recovering
MEASUREMENT OF VALUE ADDED THROUGH MERCER S MANAGER RESEARCH RECOMMENDATIONS SEPTEMBER 2015
 MEASUREMENT OF VALUE ADDED THROUGH MERCER S MANAGER RESEARCH RECOMMENDATIONS SEPTEMBER 2015 CONTENTS 1. Introduction... 1 2. Summary of value added through Mercer s Manager Research recommendations...
London Borough of Hackney Pension Fund. Investment Strategy Statement
 London Borough of Hackney Pension Fund Investment Strategy Statement Investment Strategy Statement (Published 01/04/2017) 1. Introduction The London Borough of Hackney is the Administering Authority for
KB Elite Multi Asset Balanced Fund
 KB Elite Multi Asset Balanced Fund Quarterly update, Q4 2014 For professional use only Key events in Q4 2014 October Islamic state forces besiege the Syrian border town of Kobane Bank of Japan announces
Review of Pension Plans Performance (Period ending December 31 st, 2013)
") Review of Pension Plans Performance (Period ending December 31 st, 2013) prepared for Investment Subcommittee (Note all returns and values are expressed in Canadian Dollars- CAD s) 1 Canadian Equity The
Review of Pension Plans Performance (Period ending December 31 st, 2013) prepared for Investment Subcommittee (Note all returns and values are expressed in Canadian Dollars- CAD s) 1 Canadian Equity The
Agenda. The Role of Real Estate. Myths that drive the UK real estate market. Potential investment strategies risks & opportunities
 Agenda The Role of Real Estate Myths that drive the UK real estate market Potential investment strategies risks & opportunities 1 The Role of Real Estate Real Estate as an investment asset class Roles
The outlook for UK savers: Markets, Politics and Policy
 The outlook for UK savers: Markets, Politics and Policy Rupert Harrison, Portfolio Manager Multi-Asset Strategies Tuesday 21 st November, 2017 Not a bad year so far for a UK investor Asset performance
> Macro Investment Outlook
 > Macro Investment Outlook Dr Shane Oliver Head of Investment Strategy and Chief Economist October 214 The challenge for investors how to find better yield and returns as bank deposit rates stay low 9
Income - I Class. Investment Report
 Income - I Class Investment Report Income Portfolio Report period 01 April 2018-30 June 2018 Income Portfolio positioning as at 30 June 2018 Asset allocation Equity breakdown United Kingdom 15.6% 203,
Investment Report. Standard Life Good to Go Default Growth Fund Active Plus III Report Q3 2018
 Investment Report Standard Life Good to Go Default Growth Fund Active Plus III Report Q3 2018 Corporate Investment Proposition Our Corporate Investment Proposition is made up of a family of carefully constructed
Cashflow Driven Investment Assets
 Aon Hewitt Retirement and Investment Aon Investment Research and Insights Cashflow Driven Investment Assets Cashflow Driven Investment Series November 2017 Table of contents Executive summary....3 Introduction...4
Prudential Dynamic Growth Funds Quarterly Update Quarter
 Prudential Dynamic Growth Funds Quarterly Update Quarter 2 2018 This is for information only and is designed for Investment Professionals. This is the quarterly update for the Prudential Dynamic Growth
Aon Hewitt. Facts & Figures. December 2014 Update. Risk. Reinsurance. Human Resources. Empower Results
 Aon Hewitt Facts & Figures Risk. Reinsurance. Human Resources. Empower Results In this document... Facts & Figures Contents Financial Markets 3 6 > jump to Earnings and Inflation 7 > jump to Miscellaneous
Schroder ISF Global Conservative Convertible Bond. Schroder ISF Asian Convertible Bond
 Marketing material for professional investors and advisors only. Convertible Bonds Schroder ISF 1 Global Convertible Bond Schroder ISF Global Conservative Convertible Bond Schroder ISF Asian Convertible
Investment Report. Standard Life Corporate Investment Proposition Active Plus Funds Report Q3 2018
 Investment Report Standard Life Corporate Investment Proposition Q3 2018 Corporate Investment Proposition Our Corporate Investment Proposition is made up of a family of carefully constructed risk-based