NORTH YORKSHIRE COUNTY COUNCIL PENSION FUND COMMITTEE 26 FEBRUARY 2015 PERFORMANCE OF THE FUND'S PORTFOLIO FOR THE QUARTER ENDING 31 DECEMBER 2014
|
|
|
- Jesse Hancock
- 5 years ago
- Views:
Transcription
1 NORTH YORKSHIRE COUNTY COUNCIL PENSION FUND COMMITTEE 26 FEBRUARY 2015 PERFORMANCE OF THE FUND'S PORTFOLIO FOR THE QUARTER ENDING 31 DECEMBER 2014 Report of the Treasurer 1.0 PURPOSE OF REPORT 1.1 To report the investment performance of the overall Fund, and of the individual Fund Managers, for the Quarter to 31 December PERFORMANCE REPORT 2.1 The Fund Analysis & Performance Report (Appendix 1) produced by BNY Mellon Asset Servicing (MAS) provides a performance analysis of the North Yorkshire Pension Fund for the quarter ending 31 December The report highlights the performance of the total Fund by asset class against the customised Fund benchmark. It also includes an analysis of the performance of each manager against their specific benchmark and a comparison of performance levels over time. 3.0 PERFORMANCE OF THE FUND 3.1 The absolute overall return for the quarter (+5.1%) was above the customised benchmark for the Fund (+4.6%) by 0.5%. 3.2 The 12 month absolute rolling return was +10.2%, 0.7% above the customised benchmark. 3.3 Absolute and relative returns over the rolling years to each of the last four quarter ends were as follows. Year End Absolute % Relative % 31 December September June March The performance of the various managers against their benchmarks for the Quarter ended 31 December 2014 is detailed on page 8 of the MAS report and in Section 4 below. This performance is measured on a time-weighted basis and expressed as a +/- variation to their benchmark.
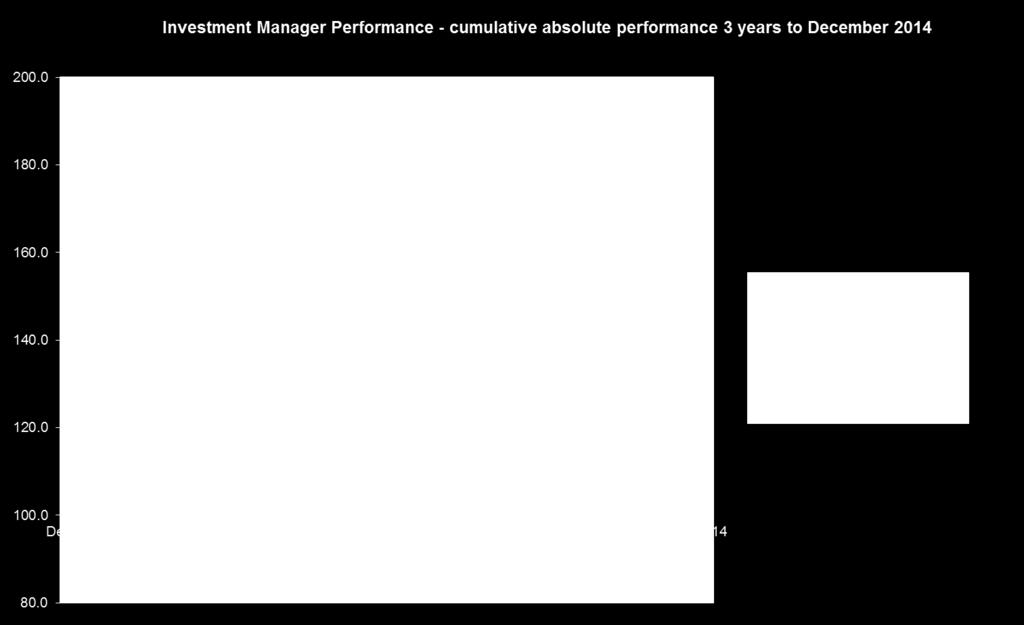
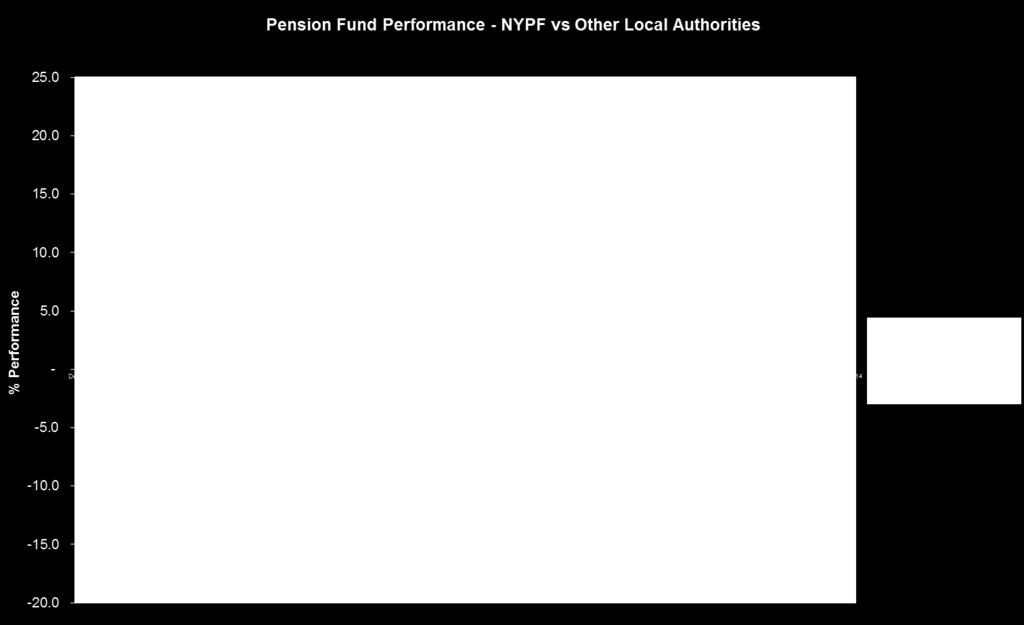
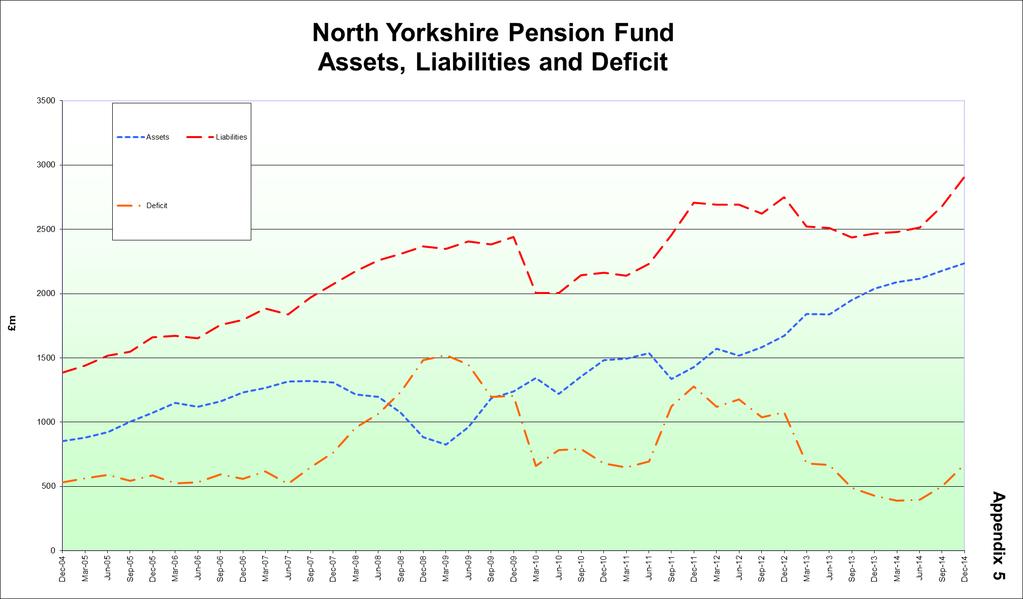
2 3.5 The Appendices used in this report have been designed to present a fuller picture of recent investment performance. Appendix 2 Fund Manager Performance over the three years to 31 December 2014 in absolute percentage terms from a starting point of 100 Appendix 3 Performance of NYPF relative to other LGPS Funds over the last ten years Appendix 4 Solvency position (in % and terms) since the 2004 Triennial Valuation; this Appendix also shows in absolute terms the +/- in the value of assets and liabilities of the Fund Appendix 5 Solvency graph this shows the key figures from Appendix 4 in a simple graphical format 3.6 The separate reports of the Investment Adviser and Investment Consultant explain what has been happening in the financial markets and to NYPF s investments, and look ahead over the short, medium and longer term. 4.0 FUND MANAGER PERFORMANCE 4.1 In monetary terms, the positive absolute return of +5.1% in the Quarter increased the invested value of the Fund by 111m before taking into account the transfer out in relation to the Probation Service (see Section 7). Eight managers/funds outperformed their respective benchmarks and three underperformed, however every manager added value in absolute terms. At the end of the December 2014 quarter the value of the Fund was 198m above the value at the end of December 2013, an increase of 10%. 4.2 Appendix 3 shows the performance of NYPF relative to other Funds in the LGPS universe. The local authority average performance figure for the quarter is not yet available. For the one, three and five year periods to September 2014 NYPF was placed 17 th, 2 nd and 4 th respectively. Overseas Equities 4.3 Fidelity produced a positive relative return in the quarter of 0.9% over the benchmark return of +2.8%. Performance over the year to December 2014 was +1.2% relative. The longer term figures also look impressive, at +1.7% pa and +0.7% pa over the last three and five years respectively. Since inception in November 2008 the manager has exceeded the benchmark by 0.4% pa (gross of fees) with the manager out-performing in all geographic areas (North America, Europe ex-uk, Emerging Markets and Pan-Pacific). Global Equities 4.4 The Global Alpha fund managed by Baillie Gifford returned +6.6% for the quarter against a benchmark return of +4.5%. Outperformance over the longer term was +0.4% over 1 year, +2.8% pa over 3 years and +3% pa over 5 years. Since inception in 2006, the Fund has outperformed the FTSE All World by 2.2% pa.
3 The LTGG fund, also managed by Baillie Gifford on an absolute return basis, produced a positive relative return for the quarter (+0.3%) against the same benchmark return of +4.5%. Outperformance over the longer term was +2.1% over 1 year, +5.8% pa over 3 years and +3.7% pa over 5 years. Performance since inception in 2006 is 3.1% pa above the benchmark. UK Equities 4.5 Standard Life produced a negative relative return (-0.8%) in the quarter against the benchmark return of +3.7%. Relative performance for the year was -1.5%, which was 4.1% below the benchmark return. Performance over the longer term has been more positive, with the manager achieving a relative +3.3% pa over three years and -0.9% pa over five years. It should be borne in mind that exceeding the FTSE 350 equally weighted benchmark is a particularly challenging target, as this benchmark performed more strongly than the FTSE All World by 3.3% pa and 3% pa over three and five years respectively. Fixed Income 4.6 ECM produced +0.6% relative against the cash benchmark for the quarter and +2.8% relative for the year to December The benchmark was changed from liability matching to cash in 2010 and since that time the manager has outperformed by 3.9% pa. 4.7 Amundi underperformed above the benchmark (+11.7%) by 1.9% in the quarter and was also below it (-2.9%) for the year to December This was largely as a result of yields tightening, contrary to expectations. Relative performance over the longer term was +1.4% pa and +0.6% pa over three and five year periods respectively. 4.8 The investment in Gilts with M&G equalled the liability matching benchmark of +11.7% for the quarter to December Year to date performance was above the benchmark return of +26.8% by +0.4%. Performance since inception in 2011 was +1.8% pa. Property 4.9 The investments with Hermes, Threadneedle and L&G produced +1.1%, +1.4% and -0.3% respectively in relative terms, against the property index for each manager for the quarter to December Property has been the best performing asset class over the year to December 2014 with Hermes, Threadneedle and L&G returning in absolute terms +19.3%, +20.3% and +12.9% respectively. Diversified Growth Funds 4.11 The Investment with the Standard Life Global Absolute Return Strategy (GARS) Fund and the Newton Investments Real Return Fund produced relative outperformance of +1.1% and +0.6% respectively against a cash benchmark of +0.1%.
4 4.12 Over the period since inception in March 2013, in absolute terms, Standard Life returned +5% pa and Newton +1.9% pa. The cash benchmark return was +0.5% pa. 5.0 RISK INDICATORS 5.1 The Report (pages 10 and 11) includes three long-term risk indicators. 5.2 The Fund s annualised Standard Deviation, which is a reflection of volatility, is 7.8% for the rolling three year period to December 2014, 1.4% above the benchmark. 5.3 The Sharpe Ratio is a measure of how well the return compensates an investor relative to the risk taken. A higher Sharpe Ratio reflects a better return for a given level of risk or lower risk for a given level of return. The ratio for the Fund for the rolling three year period to December 2014 is slightly above the benchmark. 5.4 The Tracking Error figure reflects how closely a fund manager s actual return follows their respective benchmark. As at December 2014 the figure was 2.9%. 5.5 The Information Ratio is a measure of excess returns in relation to the benchmark and the consistency of those returns. A high IR could be derived from a high portfolio return, a low benchmark return and a low tracking error. For the period to December 2014 the ratio for the Fund was +1.1%. 6.0 SOLVENCY 6.1 The solvency position is presented in Appendices 4 and 5. As at 31 December 2014 the estimated solvency was 77%, being 4% below the level at the previous quarter end. 6.2 The assets of the Fund increased by 2.7% in the Quarter, whilst liabilities (as modelled by the Actuary) rose by 8.6% as a result of Gilt yields falling. Despite investment returns exceeding expectations, in cash terms the deficit increased by 171m in the quarter. 7.0 REBALANCING 7.1 It was reported at the last PFC meeting that as a result of local authority pension fund arrangements for the Probation Service transferring to Greater Manchester Pension Fund, 34m was transferred from NYPF on 1 October This was funded by disinvestments from Amundi ( 17m) and Fidelity ( 18m), the balance being required for cash flow purposes. 7.2 An 11.7m transfer from cash to Threadneedle on 27 October 2014 to fund a secondary market investment opportunity was matched by a 14m disinvestment from Amundi on 12 December 2014, the balance being required for cash flow purposes. See Appendix 6 for the Rebalancing Schedule. 7.3 An opportunity to acquire additional units in one of the property funds may become available. A verbal update will be provided at the meeting.
5 8.0 PROXY VOTING 8.1 The report from PIRC is available on request summarising the proxy voting activity in the period October to December This report covers the votes cast on behalf of NYPF at all relevant company AGMs in the period and includes an analysis of voting recommendations at selected meetings and responses to company engagement RECOMMENDATION 10.1 Members to note the investment performance of the Fund for the Quarter ending 31 December GARY FIELDING Treasurer Central Services County Hall Northallerton 17 February 2015


6 Appendix 1 North Yorkshire Pension Fund 3 Months Ending 31 December 2014 Fund Analysis & Performance Report Fund Analysis
7 Contents Fund Analysis Executive Summary 1 Fund Allocation Fund Allocation - Managers 4 Fund Allocation - Relative Analysis 5 Fund Performance Fund Performance - Summary 6 Fund Performance - Segment Analysis 7 Fund Performance - Manager Overview 8 Fund Performance - Contribution Analysis 9 Risk Profile Risk Profile - Historic Risk 10 Risk Profile - Consistency Analysis 12 Fund Profile Manager Analysis Manager Analysis - Total Consolidation 14 Manager Analysis - Fidelity 15 Manager Analysis - Standard Life 16 Manager Analysis - Baillie Gifford GA 17 Manager Analysis - Amundi 18 Manager Analysis - Baillie Gifford LTGG 19 Manager Analysis - ECM Asset Management 20 Manager Analysis - Standard Life Divers Growth 21 Manager Analysis - Newton Diversified Growth 22 Manager Analysis - M&G 23 Manager Analysis - LGIM Property 24 Manager Analysis - Hermes 25 Manager Analysis - Threadneedle 26 Appendix Appendix - Benchmark Summary 27 Appendix - Glossary 28 Fund Profile - Movement of Funds 13 Performance & Risk Analytics Contents
8 Executive Summary Market Review Market Briefing - Market Summary During the fourth quarter of 2014, returns were all positive with UK Index- Cash and UK Equities were the poorest performers over the quarter. UK Equities All of the UK Equity market capitalisation sectors recorded positive returns for the quarter except the FTSE 100 with a negative return of -0.2%. The FTSE 250 was the best performing sector with a return of 5.2%, followed by the FTSE All-Share and FTSE 350, both with a return of 0.6%. Over the one year period ending 31st December 2014, all the indices achieved positive returns. The FTSE 250 was the best performing index with a return of 3.7% over this period. The FTSE 100 was the weakest performing index with a return of 0.7%. Telecommunications was the best performing industry sector with a return of 9.2% for the quarter. The weakest performing sector was Oil and Gas with a return of -11.9%. Over the one year period ending on 31st December 2014, returns ranged from 14.9% for Health Care to -10.2% for Oil and Gas. Utilities was the second best performing sector with a return of 13.2%. Overseas Equities -25.4%, followed by Portugal with a return of - Ireland was the strongest performing country with a return of 18.2%, and Greece the weakest with a return of -38%. Brazil with a return of -11.9% in Sterling terms. Page 1 Performance & Risk Analytics Executive Summary
9 Executive Summary Market Review UK Bonds Returns were positive across all the UK Bond sectors during the quarter. UK Gilts outperformed Non-Gilts with a return of 6.3% compared to 4.3%. Within Gilts, Long-dated Gilts was the strongest performing sector with a return of 11.2%. Short-dated Gilts was the weakest performing sector with a return of 1.6%. Over the one year period ending 31st December 2014, UK Gilts was the best performing sector with a return of 13.9% compared to the return of 12.3% for UK Non--dated Gilts provided the strongest performance with a return of 26.1%, whilst the weakest came from Short-dated Gilts with 2.9%. Overseas Bonds weakest performing country with a return of - of -2.5%. Over the twelve month period, Overseas Bonds achieved a return of 6.4%. European Bonds saw positive returns over this period, except Sweden with a return of -2.3%. Spain provided the strongest performance with a return of 9.1%, followed by Italy with a return of 8%. Outside Europe, the best performance again came from the USA with a return of 12.7%. The worst performing country was Japan with a return of - UK Index-Linked Gilts UK Index Linked--dated Index-Linked Gilts provided the strongest performance with a return of 11.9%, whereas the weakest performance was provided by Short-dated Index-Linked Gilts with a negative return of -0.2%. Over the one year period to 31st December 2014, on an overall basis UK Index--dated Index-Linked Gilts was the strongest performing sector with a return of 27.3%, whereas short- UK Cash and Property st December 2014 was 15.3%. Cash achieved a return of 0.1% over the Quarter and 0.3% over the last twelve months. Page 2 Performance & Risk Analytics Executive Summary
10 Executive Summary Fund Performance, Risk and Allocation Highlights During the fourth quarter of 2014, the fund returned 5.07% versus its benchmark of 4.62%, thereby outperforming by 0.45%. In terms of longer period performance, the fund outperformed over 5 years by 1.01%. At asset class level, the fund outperformed its blended benchmark in the majority of asset classes. Overseas Equities is the best performing sector which outperformed its benchmark by 1.81%. UK Equities however underperformed the benchmark by 1.81% respectively. Over the quarter, nine accounts out-performed their benchmarks. The best performance (excluding the Cash Account) was shown by Baillie Gifford GA which out-performed its benchmark by 2.12%. For asset allocation the fund is closely matched to the benchmark with the largest variances being in UK Equities and Bonds where the fund is 2.01% underweight and 1.03% overweight respectively. Page 3 Performance & Risk Analytics Executive Summary
11 Fund Allocation


12 Fund Allocation - Managers Manager Weight (%) Fidelity Standard Life Baillie Gifford GA Liability Matching Bonds Baillie Gifford LTGG ECM Asset Management 5.76 Standard Life Divers Growth 3.91 Newton Diversified Growth 4.65 LGIM Property 2.37 Hermes 1.29 Threadneedle 2.90 Cash Account 0.37 Yorkshire Fund Managers 0.01 Currency Hedge Cash 0.00 Page 4 Performance & Risk Analytics Fund Allocation - Managers


13 Fund Allocation - Relative Analysis UK Equities Overseas Equities Global Equity Units Bonds Property Cash Alternatives Portfolio Benchmark Relative Weight Page 5 Performance & Risk Analytics Fund Allocation - Relative Analysis
14 Fund Performance
 Since Inception (Ann) Portfolio 5.07 8.55 10.21 11.42 7.77 6.")

15 Fund Performance - Summary Quarter Fiscal Year To Date 1 Year 5 Years (Ann) 10 Years (Ann) Since Inception (Ann) Portfolio Benchmark Inception Date: 31 Jan 2002 Ann = Annualised Page 6 Performance & Risk Analytics Fund Performance - Summary


16 Fund Performance - Segment Analysis UK Equities Overseas Equities Global Equity Units Bonds Property Alternatives Portfolio Benchmark Page 7 Performance & Risk Analytics Fund Performance - Segment Analysis


17 Fund Performance - Manager Overview Fidelity Standard Life Baillie Gifford GA Liability Matching Baillie Gifford LTGG ECM Asset Management Standard Life Divers Growth Newton Diversified LGIM Property Hermes Threadneedle Cash Account Yorkshire Fund Portfolio Benchmark Fidelity Standard Life Baillie Gifford GA Liability Matching Baillie Gifford LTGG ECM Asset Management Standard Life Divers Growth Newton Diversified LGIM Property Hermes Threadneedle Cash Account Yorkshire Fund Portfolio Benchmark Page 8 Performance & Risk Analytics Fund Performance - Manager Overview


18 Fund Performance - Contribution Analysis UK Equities Overseas Equities Global Equity Units Bonds Property Cash Alternatives Portfolio Benchmark Total Consolidation Baillie Gifford GA Amundi M&G Fidelity Baillie Gifford LTGG Remaining Managers Portfolio Page 9 Performance & Risk Analytics Fund Performance - Contribution Analysis
19 Risk Profile


20 Risk Profile - Historic Risk Total Consolidation Fidelity Standard Life Baillie Gifford GA Amundi Baillie Gifford LTGG ECM Asset Management M&G Yorkshire Fund Managers Portfolio Benchmark Total Consolidation Fidelity Standard Life Baillie Gifford GA Amundi Baillie Gifford LTGG ECM Asset Management M&G Yorkshire Fund Managers Portfolio Benchmark Ann = Annualised Page 10 Performance & Risk Analytics Risk Profile - Historic Risk


21 Risk Profile - Historic Risk Total Consolidation Fidelity Standard Life Baillie Gifford GA Amundi Baillie Gifford LTGG ECM Asset M&G Yorkshire Fund Management Managers Portfolio Total Consolidation Fidelity Standard Life Baillie Gifford GA Amundi Baillie Gifford LTGG ECM Asset M&G Yorkshire Fund Management Managers Portfolio Ann = Annualised Page 11 Performance & Risk Analytics Risk Profile - Historic Risk
22 Risk Profile - Consistency Analysis Manager Active Number of Months Number of Positive Months Consistency Rate (%) Benchmark Consistency (%) Outperformance (%) Total Consolidation Fidelity Standard Life Baillie Gifford GA Amundi Baillie Gifford LTGG ECM Asset Management Standard Life Divers Growth Newton Diversified Growth M&G LGIM Property Hermes Threadneedle Yorkshire Fund Managers Page 12 Performance & Risk Analytics Risk Profile - Consistency Analysis
23 Fund Profile
24 Fund Profile - Movement of Funds Manager Name Market Value 30-Sep (000's) Net Contributions (000's) Income (000's) Gain/Loss (000's) Market Value 31-Dec (000's) % Change Total Consolidation 2,171, , , , ,237, Total Consolidation 2,171, , , , ,237, Fidelity 396, , , , , Standard Life 329, , , , Baillie Gifford GA 353, , , Amundi 250, , , , Baillie Gifford LTGG 235, , , ECM Asset Management 127, , Standard Life Divers Growth 86, , , Newton Diversified Growth 103, , M&G 146, , , LGIM Property 50, , , Hermes 27, , , Threadneedle 49, , , , Cash Account 12, , , Yorkshire Fund Managers Currency Hedge Cash Page 13 Performance & Risk Analytics Fund Profile - Movement of Funds
25 Manager Analysis

26 Manager Analysis - Total Consolidation Portfolio Size and Mandate Portfolio Size (GBP) 2,237,684,333 Portfolio Mandate Total Plan Allocation - 31 December 2014 UK Overseas Global Bonds Property Cash Alternative Portfolio Equities Equities Equity Benchmark Inception Date: 31 Jan 2002 Periodic Performance Quarter Fiscal Year To Date 1 Year 5 Years (Ann) 10 Years (Ann) Since Inception Portfolio Benchmark Summary - 3 Months Ending 31 December 2014 The funds relative performance of the Quarter and 1 Year was 0.5% and 0.7% respectively. Risk Profile - 3 Years (Ann) to 31 December 2014 Standard Sharpe Ratio Tracking Error Information Ratio Deviation Portfolio Benchmark Page 14 Performance & Risk Analytics Manager Analysis - Total Consolidation
 Since Inception (Ann) Portfolio 3.7 7.6 8.1 9.1 12.4 Benchmark 2.8 6.6 7.3 8.5 12.")
27 Manager Analysis - Fidelity Portfolio Size and Mandate Portfolio Size (GBP) 392,500,394 Portfolio Mandate Allocation - 31 December 2014 UK Equities Overseas Equities Cash Portfolio Benchmark Inception Date: 30 Nov 2008 Periodic Performance Quarter Fiscal Year To Date 1 Year 5 Years (Ann) Since Inception (Ann) Portfolio Benchmark Summary - 3 Months Ending 31 December 2014 The managers relative performance of the Quarter and 1 Year was 0.9% and 0.8% respectively. Risk Profile - 3 Years (Ann) to 31 December 2014 Standard Sharpe Ratio Tracking Error Information Ratio Deviation Portfolio Benchmark Page 15 Performance & Risk Analytics Manager Analysis - Fidelity
 Since Inception (Ann) Portfolio 2.9-3.5-1.4 12.7 7.7 Benchmark 3.7 0.1 2.7 13.5 8.")
28 Manager Analysis - Standard Life Portfolio Size and Mandate Portfolio Size (GBP) 339,480,583 Portfolio Mandate Allocation - 31 December 2014 UK Equities Overseas Equities Cash Portfolio Benchmark Inception Date: 31 Oct 2006 Periodic Performance Quarter Fiscal Year To Date 1 Year 5 Years (Ann) Since Inception (Ann) Portfolio Benchmark Summary - 3 Months Ending 31 December 2014 The managers relative performance of the Quarter and 1 Year was -0.8% and -4.1% respectively. Risk Profile - 3 Years (Ann) to 31 December 2014 Standard Sharpe Ratio Tracking Error Information Ratio Deviation Portfolio Benchmark Page 16 Performance & Risk Analytics Manager Analysis - Standard Life
 Since Inception (Ann) Portfolio 6.6 9.3 11.7 13.5 9.8 Benchmark 4.5 10.7 11.3 10.")
29 Manager Analysis - Baillie Gifford GA Portfolio Size and Mandate Portfolio Size (GBP) 377,293,519 Portfolio Mandate Allocation - 31 December 2014 Global Equity Units Cash Portfolio Benchmark Inception Date: 31 Oct 2006 Periodic Performance Quarter Fiscal Year To Date 1 Year 5 Years (Ann) Since Inception (Ann) Portfolio Benchmark Summary - 3 Months Ending 31 December 2014 The managers relative performance of the Quarter and 1 Year was 2.1% and 0.4% respectively. Risk Profile - 3 Years (Ann) to 31 December 2014 Standard Sharpe Ratio Tracking Error Information Ratio Deviation Portfolio Benchmark Page 17 Performance & Risk Analytics Manager Analysis - Baillie Gifford GA
 Since Inception (Ann) Portfolio 9.8 20.2 23.9 12.1 9.7 Benchmark 11.7 22.1 26.8 11.5 9.")
30 Manager Analysis - Amundi Portfolio Size and Mandate Portfolio Size (GBP) 242,172,424 Portfolio Mandate Allocation - 31 December 2014 Bonds Cash Portfolio Benchmark Inception Date: 31 Jul 2005 Periodic Performance Quarter Fiscal Year To Date 1 Year 5 Years (Ann) Since Inception (Ann) Portfolio Benchmark Summary - 3 Months Ending 31 December 2014 The managers relative performance of the Quarter and 1 Year was -1.9% and -2.9% respectively. Risk Profile - 3 Years (Ann) to 31 December 2014 Standard Sharpe Ratio Tracking Error Information Ratio Deviation Portfolio Benchmark Page 18 Performance & Risk Analytics Manager Analysis - Amundi
 Since Inception (Ann) Portfolio 4.8 14.8 13.4 14.2 11.1 Benchmark 4.5 10.7 11.3 10.")
31 Manager Analysis - Baillie Gifford LTGG Portfolio Size and Mandate Portfolio Size (GBP) 246,672,185 Portfolio Mandate Allocation - 31 December 2014 Global Equity Units Portfolio Benchmark Inception Date: 30 Sep 2006 Periodic Performance Quarter Fiscal Year To Date 1 Year 5 Years (Ann) Since Inception (Ann) Portfolio Benchmark Summary - 3 Months Ending 31 December 2014 The managers relative performance of the Quarter and 1 Year was 0.3% and 2.1% respectively. Risk Profile - 3 Years (Ann) to 31 December 2014 Standard Sharpe Ratio Tracking Error Information Ratio Deviation Portfolio Benchmark Page 19 Performance & Risk Analytics Manager Analysis - Baillie Gifford LTGG
 Since Inception (Ann) Portfolio 0.7 2.4 3.7 4.7 0.4 Benchmark 0.1 0.4 0.5 0.6 3.")
32 Manager Analysis - ECM Asset Management Portfolio Size and Mandate Portfolio Size (GBP) 128,814,034 Portfolio Mandate Allocation - 31 December 2014 Alternatives Portfolio Benchmark Inception Date: 31 Jul 2005 Periodic Performance Quarter Fiscal Year To Date 1 Year 5 Years (Ann) Since Inception (Ann) Portfolio Benchmark Summary - 3 Months Ending 31 December 2014 The managers relative performance of the Quarter and 1 Year was 0.6% and 3.2% respectively. Risk Profile - 3 Years (Ann) to 31 December 2014 Standard Sharpe Ratio Tracking Error Information Ratio Deviation Portfolio Benchmark Page 20 Performance & Risk Analytics Manager Analysis - ECM Asset Management
 Portfolio 1.2 5.4 5.7 5.0 Benchmark 0.1 0.4 0.5 0.")
33 Manager Analysis - Standard Life Divers Growth Portfolio Size and Mandate Portfolio Size (GBP) 87,503,871 Portfolio Mandate Allocation - 31 December 2014 Alternatives Portfolio Benchmark Inception Date: 31 Mar 2013 Periodic Performance Quarter Fiscal Year To Date 1 Year Since Inception (Ann) Portfolio Benchmark Summary - 3 Months Ending 31 December 2014 The managers relative performance of the Quarter and 1 Year was and 1.1% & 5.2% respectively. Risk Profile - 3 Years (Ann) to 31 December 2014 Standard Sharpe Ratio Tracking Error Information Ratio Deviation Portfolio Benchmark Page 21 Performance & Risk Analytics Manager Analysis - Standard Life Divers Growth
 Portfolio 0.7 2.0 3.4 1.9 Benchmark 0.1 0.4 0.5 0.")
34 Manager Analysis - Newton Diversified Growth Portfolio Size and Mandate Portfolio Size (GBP) 104,015,175 Portfolio Mandate Diversified Growth Allocation - 31 December 2014 Alternatives Portfolio Benchmark Inception Date: 31 Mar 2013 Periodic Performance Quarter Fiscal Year To Date 1 Year Since Inception (Ann) Portfolio Benchmark Summary - 3 Months Ending 31 December 2014 The managers relative performance of the Quarter and 1 Year was 0.6% and 2.9% respectively. Risk Profile - 3 Years (Ann) to 31 December 2014 Standard Sharpe Ratio Tracking Error Information Ratio Deviation Portfolio Benchmark Page 22 Performance & Risk Analytics Manager Analysis - Newton Diversified Growth
 Portfolio 11.7 22.1 27.2 9.9 Benchmark 11.7 22.1 26.8 8.")
35 Manager Analysis - M&G Portfolio Size and Mandate Portfolio Size (GBP) 163,651,784 Portfolio Mandate Allocation - 31 December 2014 Bonds Cash Portfolio Benchmark Inception Date: 31 Dec 2011 Periodic Performance Quarter Fiscal Year To Date 1 Year Since Inception (Ann) Portfolio Benchmark Summary - 3 Months Ending 31 December 2014 The managers performed equal of the Benchmark over the Quarter and outperformed by 0.4% over the 1 year period. Risk Profile - 3 Years (Ann) to 31 December 2014 Standard Sharpe Ratio Tracking Error Information Ratio Deviation Portfolio Benchmark Page 23 Performance & Risk Analytics Manager Analysis - M&G
 Portfolio 4.3 9.5 12.9 10.3 Benchmark 4.6 5.7 6.3 4.")
36 Manager Analysis - LGIM Property Portfolio Size and Mandate Portfolio Size (GBP) 53,046,305 Portfolio Mandate Property Allocation - 31 December 2014 Property Portfolio Benchmark Inception Date: 31 Dec 2012 Periodic Performance Quarter Fiscal Year To Date 1 Year Since Inception (Ann) Portfolio Benchmark Summary - 3 Months Ending 31 December 2014 The managers relative performance of the Quarter and 1 year was -0.3% and 6.6% respectively. Risk Profile - 3 Years (Ann) to 31 December 2014 Standard Sharpe Ratio Tracking Error Information Ratio Deviation Portfolio Benchmark Page 24 Performance & Risk Analytics Manager Analysis - LGIM Property
 Portfolio 5.6 15.2 19.3 8.1 Benchmark 4.5 5.7 6.3 4.")
37 Manager Analysis - Hermes Portfolio Size and Mandate Portfolio Size (GBP) 28,954,082 Portfolio Mandate Allocation - 31 December 2014 Property Cash Portfolio Benchmark Inception Date: 31 Mar 2012 Periodic Performance Quarter Fiscal Year To Date 1 Year Since Inception (Ann) Portfolio Benchmark Summary - 3 Months Ending 31 December 2014 The manager respectively. Risk Profile - 3 Years (Ann) to 31 December 2014 Standard Sharpe Ratio Tracking Error Information Ratio Deviation Portfolio Benchmark Page 25 Performance & Risk Analytics Manager Analysis - Hermes
 Portfolio 6.0 16.6 20.3 15.5 Benchmark 4.6 5.7 6.3 4.")
38 Manager Analysis - Threadneedle Portfolio Size and Mandate Portfolio Size (GBP) 64,945,117 Portfolio Mandate Allocation - 31 December 2014 Property Portfolio Benchmark Inception Date: 30 Jun 2012 Periodic Performance Quarter Fiscal Year To Date 1 Year Since Inception (Ann) Portfolio Benchmark Summary - 3 Months Ending 31 December 2014 The manager respectively. Risk Profile - 3 Years (Ann) to 31 December 2014 Standard Sharpe Ratio Tracking Error Information Ratio Deviation Portfolio Benchmark Page 26 Performance & Risk Analytics Manager Analysis - Threadneedle
39 Appendix
40 Appendix - Benchmark Summary Manager Weight Benchmark Total Consolidation Overseas Global Equity Bmk Overseas Equity Bmk Fixed Income Bmk UK Equity Bmk Cash Bmk 6.60 Property Bmk Fidelity Fidelity Bmk Standard Life Standard Life Alg100 Bmk Baillie Gifford GA FTAW All World Amundi Amundi Bmk Baillie Gifford LTGG FTAW All World ECM Asset Management LIBOR BBA GBP 1 Month Standard Life Divers Growth LIBOR BBA GBP 1 Month Index Newton Diversified Growth LIBOR BBA GBP 1 Month Index M&G M&G Bmk LGIM Property IPD ABal Prop Fund WA^ Hermes IPDOBALPROPMO^ Threadneedle IPD ABal Prop Fund WA^ Cash Account LIBID 1 Week Bid Yorkshire Fund Managers FTSE All-Share Page 27 Performance & Risk Analytics Appendix - Benchmark Summary
41 Appendix - Glossary Risk Standard Deviation - Standard Deviation measures the variability (or volatility) of a fund's return over a specified time period. Tracking Error - Tracking Error measures the variability of a fund's returns relative to its benchmark over a time period. Information Ratio - Information Ratio is a measure of performance adjusted for the level of (active) risk. Sharpe Ratio - Sharpe Ratio relates a portfolio's reward (determined as the portfolio's return minus risk free return) to the portfolio's variability (as measured by its standard deviation). Active Number of months - Number of complete months of performance Number of Positive Months - number of complete months the portfolio has produced a positive return Consistency Rate (%) - Number of Positive Months/Active Number of Months Benchmark Consistency (%) - Number of Positive Benchmark Months/Active Number of Months Outperformance (%) - Percentage of months the portfolio has outperformed the benchmark Attribution Allocation Effect - Measures the impact of decisions to allocate assets differently from the benchmark. Selection Effect - Measures the impact of decisions of selecting securities different from those held in the benchmark. Currency Effect - Measures the impact of deviating from the benchmark currency position. Management Effect - Measures the combined impact of allocation, selection and currency effects. At the total level, this represents the fund's relative performance against thebenchmark. Interaction Effect - Measures the combined impact of an investment managers selection and allocation decisions within a segment. Page 28 Performance & Risk Analytics Appendix - Glossary
42 2009 BNY Mellon Performance & Risk Analytics Europe Limited ("BNYM"). All rights are reserved by BNYM and its licensors. This provision and use of this report is subject to the terms of the contract between BNYM and Customer for Performance, Risk & Analytics services ("Contract"). This report is for information purposes only and does not constitute the rendering of investment or any other form of financial advice on any matter, and is not to be used as such. No statement or expression is a recommendation, offer or solicitation to buy or sell any products mentioned within the report. Except as provided for in the Contract, BNYM makes no representation as to the accuracy, completeness, timeliness, merchantability or fitness for a specific purpose of the information and statements provided in this report. BNYM recommends that professional consultation with a qualified third party should be obtained before making any investment decision based upon the information and statements contained in this report. BNYM assumes no liability whatsoever for any investment decision or action taken in reliance on the information and statements contained in this report. Any unauthorised use of the information and statements contained in this report is at the Customer's own risk. Except as provided for in the Contract, any reproduction, distribution, republication and retransmission of material contained in the report is prohibited unless the prior consent of BNYM has been obtained. This report may contain information and statements provided by non-bnym and BNY Mellon parties, such information and statements are the opinions of the party providing such information and statements and not those of Performance & Risk Analytics

43 Appendix 2

44 Appendix 3
45 Appendix 4 Actuarial Model of Quarterly Solvency Position Date Solvency Deficit (M) Fund Value (M) FTSE 100 March 31, % ,634 June 30, % ,643 September 30, % ,903 December 31, % ,217 March 31, % ,272 June 30, % ,656 September 30, % ,722 December 31, % ,940 March 31, % ,613 June 30, % ,031 September 30, % ,091 December 31, % ,477 March 31, % ,386 June 30, % ,464 September 30, % ,571 December 31, % ,814 March 31, % ,894 June 30, % ,113 September 30, % ,478 December 31, % ,619 March 31, % ,965 June 30, % ,833 September 30, % ,961 December 31, % ,221 March 31, % ,308 June 30, % ,608 September 30, % ,467 December 31, % ,457 March 31, % ,702 June 30, % ,625 September 30, % ,902 December 31, % ,434 March 31, % ,926 June 30, % ,249 September 30, % ,134 December 31, % ,413 March 31, % ,680 June 30, % ,917 September 30, % ,549 December 31, % ,900 March 31, % ,909 June 30, % ,946 September 30, % ,129 December 31, % ,572 March 31, % ,768 June 30, % ,571 September 30, % ,742 December 31, % ,898 March 31, % ,412 June 30, % ,215 September 30, % ,462 December 31, % ,749 March 31, % ,598 June 30, % ,744 September 30, % ,623 December 31, % ,566 Triennial valuation results highlighted in grey Movement in Assets and Liabilities Value M Fund Value (M) Deficit (M)
46
47 APPENDIX 6 REBALANCING OF NYPF ASSETS AS AT 31 DECEMBER 2014 Asset Class Minimum Allocation to Non-Equities Maximum Allocation to Non- Equities Allocation as at December 2014 Allocation After Rebalancing Equity + Cash 75% 50% 61.0% 61.0% Bonds 15% 30% 23.9% 23.9% DGFs 5% 10% 8.6% 8.6% Property 5% 10% 6.6% 6.6% Total 100% 100% 100% 100% 31-Dec-14 Post December Value actual Min Max Under Over Rebalancing Global Equity Managers m % % m % m Baillie Gifford Global Alpha % 13.6% % % Baillie Gifford Global Growth % 9.0% % % (a) % 22.6% % % Global (ex UK) Equity Managers Fidelity % (b) % 14.5% % % UK Equity Managers Standard Life % 12.9% % % Yorkshire Fund Managers % 0.0% % % (c) % 12.9% % % Equity sub-total (a+b+c)=(d ) % 50.0% % % Amundi % ECM % M & G % Fixed Income sub-total (e) % 15.0% % % Hermes % LGIM Property % Threadneedle % Property sub-total (f) % 5% % % Standard Life % Newton % DGF sub-total (g) % 5% % % Cash (h) % 0.0% % % Total Assets (d+e+f+g+h)=(i) % 100.0% 17/02/2015
NORTH YORKSHIRE COUNTY COUNCIL PENSION FUND COMMITTEE 25 MAY 2017 PERFORMANCE OF THE FUND'S PORTFOLIO FOR THE QUARTER ENDING 31 MARCH 2017
 ITEM 9 NORTH YORKSHIRE COUNTY COUNCIL PENSION FUND COMMITTEE 25 MAY 2017 PERFORMANCE OF THE FUND'S PORTFOLIO FOR THE QUARTER ENDING 31 MARCH 2017 Report of the Treasurer 1.0 PURPOSE OF REPORT 1.1 To report
NORTH YORKSHIRE PENSION FUND INVESTMENT STRATEGY STATEMENT
 NORTH YORKSHIRE PENSION FUND INVESTMENT STRATEGY STATEMENT TABLE OF CONTENTS Section Page 1 INTRODUCTION 2 2 OBJECTIVES OF THE FUND 2 2 INVESTMENT OF MONEY IN A WIDE VARIETY OF INVESTMENTS 2 3 THE SUITABILITY
NORTH YORKSHIRE PENSION FUND INVESTMENT STRATEGY STATEMENT
 NORTH YORKSHIRE PENSION FUND INVESTMENT STRATEGY STATEMENT TABLE OF CONTENTS Section Page 1 INTRODUCTION 2 2 OBJECTIVES OF THE FUND 2 2 INVESTMENT OF MONEY IN A WIDE VARIETY OF INVESTMENTS 2 3 THE SUITABILITY
Fund Fact Sheet. for members of the Hewlett-Packard Limited Pension Scheme
 Fund Fact Sheet for members of the Hewlett-Packard Limited Pension Scheme 31 December 29 Introduction This fact sheet gives you details of the investment funds available to you as a member of the Hewlett-Packard
CONTENTS PART 1 MANAGEMENT AND FINANCIAL PERFORMANCE 3 PART 2 SCHEME ADMINISTRATION 6 PART 3 INVESTMENT POLICY AND PERFORMANCE 9
 2903 2014/15 1 CONTENTS Item Page No PART 1 MANAGEMENT AND FINANCIAL PERFORMANCE 3 PART 2 SCHEME ADMINISTRATION 6 PART 3 INVESTMENT POLICY AND PERFORMANCE 9 PART 4 PENSION ADMINISTRATION ACTIVITY 14 PART
Performance Report - Quarterly Update 31 December 2012 London Borough of Barnet Superannuation Fund JLT INVESTMENT CONSULTING
 Performance Report - Quarterly Update 31 December 2012 London Borough of Barnet Superannuation Fund JLT INVESTMENT CONSULTING Contents Contents... 2 Section One Market Update... 3 Section Two Total Scheme
Performance Report - Quarterly Update 30 September 2012 London Borough of Barnet Superannuation Fund
 APPENDIX B Performance Report - Quarterly Update 30 September 2012 London Borough of Barnet Superannuation Fund JLT INVESTMENT CONSULTING Contents Contents...2 Section One Market Update...3 Section Two
The SunGard Retirement Benefits Scheme Quarterly Investment Monitoring Report to 31 March 2012
 Quarterly Investment Monitoring Report to 31 March 2012 Executive Summary Scheme Asset Valuation The SunGard Section's assets increased in value over the quarter to 75,233,620. This is an increase of 5,188,852
MANAGED PORTFOLIO SERVICE
 MANAGED PORTFOLIO SERVICE Cautious February 218 The value of investments can fall and you may get back less than you invested. Past performance is not a guide to future performance. Any specific investments
North Yorkshire Pension Fund. Annual Report and Accounts 2016/17
 North Yorkshire Pension Fund Annual Report and Accounts 2016/17 Contents Part 1 Part 2 Part 3 Part 4 Part 5 Part 6 Part 7 Part 8 Management and Financial Performance Scheme Administration Investment Policy
MANAGED PORTFOLIO SERVICE
 MANAGED PORTFOLIO SERVICE Cautious November 217 The value of investments can fall and you may get back less than you invested. Past performance is not a guide to future performance. Any specific investments
Fund Factsheet 1st Quarter 2017
 This factsheet has been produced by AXA Wealth and should be read in conjunction with your pension scheme booklet and the AXA Wealth Guide to your scheme fund factsheet. The factsheet is updated quarterly
MANAGED FUNDS SERVICE
 MANAGED FUNDS SERVICE Cautious Portfolio December 214 The value of investments can fall and you may get back less than you invested. Past performance is not a guide to future performance. Any specific
NORTH YORKSHIRE PENSION FUND STATEMENT OF INVESTMENT PRINCIPLES
 NORTH YORKSHIRE PENSION FUND STATEMENT OF INVESTMENT PRINCIPLES TABLE OF CONTENTS Section Page 1 INTRODUCTION 2 2 INVESTMENT DECISION MAKING PROCESS 2 3 TYPES OF INVESTMENTS TO BE HELD 2 4 BALANCE BETWEEN
MANAGED PORTFOLIO SERVICE
 MANAGED PORTFOLIO SERVICE Balanced Portfolio March 2018 The value of investments can fall and you may get back less than you invested. Past performance is not a guide to future performance. Any specific
LOCAL GOVERNMENT PENSION SCHEME UPDATE
 Central Bedfordshire Council AUDIT COMMITTEE 29 June 2015 LOCAL GOVERNMENT PENSION SCHEME UPDATE Report of Charles Warboys, Chief Finance Officer (charles.warboys@centralbedfordshire.gov.uk) Contact Officer:
Kent County Council Superannuation Fund
 Kent County Council Superannuation Fund Statement of Investment Principles 2017 www.kentpensionfund.co.uk Introduction Under Regulation 12 of the LGPS (Management and Investment of Funds) Regulations 2009,
Finance Services. London Borough of Redbridge Pension Fund Investment Panel. Annual Review 2005/06
 Finance Services London Borough of Redbridge Pension Fund Investment Panel Annual Review 2005/06 CONTENTS PAGE Executive Summary 1 Introduction 2 Pension Fund Membership 2 Fund Performance 3 Draft Pension
LPFA Monthly Solvency Report as at 29 September 2017 Final Month End Data
 LPFA Monthly Solvency Report as at 29 September 2017 Final Month End Data Purpose and summary This report is prepared for the LPFA Board. It provides an up to date estimate of funding level and sets out
Preference. Fund Performance Booklet. Performance Data. Risk Rating
 Performance Data This booklet contains a number of different performance measures and time periods to help you assess the fund range. The data used to arrive at the figures shown is provided by Morningstar.
Fund Fact Sheet. for members of the Hewlett-Packard Limited Pension Scheme
 Fund Fact Sheet for members of the Hewlett-Packard Limited Pension Scheme 3 June 21 Introduction This fact sheet gives you details of the investment funds available to you as a member of the Hewlett-Packard
Preference. Fund Performance Booklet. Performance Data. Risk Rating
 Performance Data This booklet contains a number of different performance measures and time periods to help you assess the Preference fund range. The data used to arrive at the figures shown is provided
Preference. Fund Performance Booklet. Performance Data. Risk Rating
 Performance Data This booklet contains a number of different performance measures and time periods to help you assess the Preference fund range. The data used to arrive at the figures shown is provided
MANAGED PORTFOLIO SERVICE
 MANAGED PORTFOLIO SERVICE Cautious Portfolio August 21 August 21 1 Mth 3 YTD 1 Yr 2 Yr 3 Yr 5 Yr 215 214 213 212 211 21 29 Cautious Portfolio 1.7 7.2 1. 9.1 12.1 15.8 2.3 47.5 2.5 9.2 5.8 1.9 2.9 9.3 11.8
MANAGED PORTFOLIO SERVICE
 MANAGED PORTFOLIO SERVICE Cautious January 17 The value of investments can fall and you may get back less than you invested. Past performance is not a guide to future performance. Any specific investments
LPFA Monthly Solvency Report as at 30 November 2017 Final Month End Data
 LPFA Monthly Solvency Report as at 30 November 2017 Final Month End Data Purpose and summary This report is prepared for the LPFA Board. It provides an up to date estimate of funding level and sets out
RHONDDA CYNON TAF COUNTY BOROUGH COUNCIL RHONDDA CYNON TAF PENSION FUND INVESTMENT STRATEGY STATEMENT
 RHONDDA CYNON TAF COUNTY BOROUGH COUNCIL RHONDDA CYNON TAF PENSION FUND INVESTMENT STRATEGY STATEMENT The Local Government Pension Scheme (Management and Investment of Funds) Regulations 2016 require administering
Kudos. Fund Performance Booklet. Performance Data. Risk Rating
 Performance Data This booklet contains a number of different performance measures and time periods to help you assess the Kudos fund range. The data used to arrive at the figures shown is provided by Morningstar.
ETF portfolio review, 30th September ETF portfolios with ESG overlay. market overview. portfolio performance
 ETF portfolio review, 30th September 2017 market overview All our ETF portfolios performed better than s in September and all portfolios bar fixed-income continued to add to their gains year-to-date. Our
Kudos. Fund Performance Booklet. Performance Data. Risk Rating
 Performance Data This booklet contains a number of different performance measures and time periods to help you assess the Kudos fund range. The data used to arrive at the figures shown is provided by Morningstar.
MLC Horizon 1 - Bond Portfolio
 Horizon 1 - Bond Portfolio Annual Review September 2009 Investment Management Level 12, 105 153 Miller Street North Sydney NSW 2060 review for the year ending 30 September 2009 Page 1 of 11 Important information
LONDON BOROUGH OF REDBRIDGE PENSION FUND INVESTMENT PANEL
 LONDON BOROUGH OF REDBRIDGE PENSION FUND INVESTMENT PANEL ANNUAL REVIEW 2007 2008 Contents Page Executive Summary 1 Introduction 2 Pension Fund Membership 2 Fund Performance 3 Draft Pension Fund Accounts
Bank of America Merrill Lynch UK Pension Plan Statement of Investment Principles
 Bank of America Merrill Lynch UK Pension Plan Statement of Investment Principles This Statement of Investment Principles ( SIP ) covers both the defined benefit (also known as final salary ) and the defined
MANAGED PORTFOLIO SERVICE
 MANAGED PORTFOLIO SERVICE Cautious May 218 The value of investments can fall and you may get back less than you invested. Past performance is not a guide to future performance. Any specific investments
Global Equities. Q&A roadshow #QAroadshow2016. Gavin Marriott Product Manager
 Global Equities Q&A roadshow 216 #QAroadshow216 Gavin Marriott Product Manager June 216 For professional advisers only. This material is not suitable for retail clients Questions What will drive global
Prepared with you in mind
 My Default Strategy for the J.P. Morgan UK Pension Plan Prepared with you in mind J.P. Morgan UK Pension Plan Your future. Your choice. Your future. Your choice. Introduction to the Default Strategy The
Investment Factsheets
 MMC UK Pensions Investment Factsheets FUNDS AVAILABLE FROM JUNE 206 COMPARE LEARN SAVE INVEST REVIEW Contents: DEFAULT FUNDS Page LifeStyle Equity Fund 2 Diversified Growth Fund Fixed Interest Bond Fund
Fund Management Monthly Commentary
 Fund Management Monthly Commentary Covering the month of September 2018 September Market Update Margetts monthly diary summarises major economic and market developments that occur over the month. It is
Aviva Select Funds. An overview of our funds. Retirement Investments Insurance Health
 For financial adviser use only. Not approved for use with customers Aviva Select Funds An overview of our funds Retirement Investments Insurance Health Welcome to our range of fully researched funds Aviva
Performance Report - Quarterly Update 31 December 2013 London Borough of Barnet Superannuation Fund
 Appendix B Performance Report - Quarterly Update 31 December 2013 London Borough of Barnet Superannuation Fund JLT Employee Benefits Contents Contents... 1 Section One Market Update... 2 Section Two Total
FTSE Global Equity Index Series
 FTSE Global Equity Index Series THE FTSE GLOBAL EQUITY INDEX SERIES With an unparalleled record of flexibility, transparency, consistent accuracy and the ability to meet any mandate, FTSE indices are already
2018 saw Fiduciary Managers struggle to deliver their performance targets in testing markets
 XPS FM Watch 2018 saw Fiduciary Managers struggle to deliver their performance targets in testing markets 2018 was the worst year for financial markets since 2011 making it a real test for Fiduciary Managers
San Francisco Retiree Health Care Trust Fund Education Materials on Public Equity
 M E K E T A I N V E S T M E N T G R O U P 5796 ARMADA DRIVE SUITE 110 CARLSBAD CA 92008 760 795 3450 fax 760 795 3445 www.meketagroup.com The Global Equity Opportunity Set MSCI All Country World 1 Index
ENHANCE - CONSTRUCTION PENSION SCHEME NORTHERN IRELAND CHAIRMAN S ANNUAL STATEMENT REGARDING DC GOVERNANCE
 YEAR ENDED 5 APRIL 2018 CHAIRMAN S ANNUAL STATEMENT REGARDING DC GOVERNANCE This statement is produced pursuant to Regulation 17 of the Occupational Pension Schemes (Charges and Governance) Regulations
Statement of Investment Principles
 Statement of Investment Principles Cheshire Pension Fund June 2009 Page 1 of 30 Contents Section Page 1 Introduction 3 2 Effective Decision Making 4 3 Investment Objectives 8 4 Funding Strategy Statement
INVESTMENT REPORT Q EDS 1994 PENSION SCHEME AVCS MAY 2017
 MAY 2017 CONTENTS 1. Introduction...1 2. Market Background...2 3. Asset Allocation...4 4. Performance Summary...6 Appendix A: Fund Fact Sheets... 10 MERCER i 1 Introduction The EDS 1994 Pension Scheme
Update on charity funds
 Newton charity seminar 2016 Update on charity funds Jeremy Wells June 2016 For Professional and Retail Charity clients only Please read the important information at the back of this material The opinions
Investment Strategy Statement (June 2018)
") Investment Strategy Statement (June 2018) Introduction and background This is the Investment Strategy Statement ( ISS ) of the Tyne and Wear Pension Fund ( the Fund ), which is administered by South Tyneside
Investment Strategy Statement (June 2018) Introduction and background This is the Investment Strategy Statement ( ISS ) of the Tyne and Wear Pension Fund ( the Fund ), which is administered by South Tyneside
SAMPLE. Adventurous Portfolio. Create your tomorrow. Quarterly Review July 2018
 Adventurous Portfolio Quarterly Review July 2018 Create your tomorrow Q3 Our investment committee carried out the quarterly review of our governed investment portfolios. The information that follows summarises
Michael McLintock, Will Nott, Simon Pilcher and Grant Speirs
 M&G Overview & Performance Michael McLintock, Will Nott, Simon Pilcher and Grant Speirs 1 M&G Agenda g M&G Group overview Michael McLintock M&G Retail Will Nott M&G Fixed Income Simon Pilcher M&G Group
Prosper. Fund Performance Booklet. Performance Data. Risk Rating
 Performance Data This booklet contains a number of different performance measures and time periods to help you assess the fund range. The data used to arrive at the figures shown is provided by Morningstar.
Investment Report. Corporate Investment Proposition Passive Plus Funds Report. Standard Life
 Investment Report Standard Life Corporate Investment Proposition Q3 2016 Corporate Investment Proposition 1 Our Corporate Investment Proposition is made up of a family of carefully constructed risk-based
MANAGED PORTFOLIO SERVICE
 MANAGED PORTFOLIO SERVICE Cautious February 217 The value of investments can fall and you may get back less than you invested. Past performance is not a guide to future performance. Any specific investments
NBIM Quarterly Performance Report Second quarter 2007
 NBIM Quarterly Performance Report Second quarter 2007 Government Pension Fund Global Norges Bank s foreign exchange reserves Investment portfolio Buffer portfolio Government Petroleum Insurance Fund Norges
Q data reveal toughest active manager climate since report s inception:
 JULY Russell Investments Canada Active Manager Report data reveal toughest active manager climate since report s inception: Only 17% of Canadian large-cap equity managers beat the benchmark Early look
Standard Bank International Funds Limited. January 2016
 Standard Bank International Funds Limited January 2016 Standard Bank International Funds Limited Standard Bank International Funds Limited (the Fund ) is a registered Fund of Funds incorporated in Jersey
Summary of fund changes
 Life funds Event Type Fund Name Fund Code Effective Date Fund Name and Description Change Schroder have informed us that their European Opportunities fund will be managed by a different portfolio manager
LONDON BOROUGH OF HARROW PENSION FUND INVESTMENT STRATEGY STATEMENT
 LONDON BOROUGH OF HARROW PENSION FUND INVESTMENT STRATEGY STATEMENT March 2017 CONTENTS Executive Summary 1. Introduction 2. Statutory background 3. Directions by Secretary of State 4. Advisers 5. Objective
The Russell 1000 Pure Domestic Exposure Index Targeted exposure to US economic growth
 Insights The Russell 1000 Pure Domestic Exposure Index Targeted exposure to US economic growth The economic outlook for the US is looking up. Since the Global Financial Crisis (GFC), the US economy has
DAC Wealth Builder: $10,000 Growth from Inception
 DAC Wealth Builder: $10,000 Growth from Inception $13,500 $13,416 $13,000 $12,500 $12,000 $11,500 $11,000 $10,500 $10,000 12/2014 03/2015 06/2015 09/2015 12/2015 03/2016 06/2016 09/2016 12/2016 03/2017
Investment Update. Secure Portfolio October 2018 RUSSELL INVESTMENTS
 RUSSELL INVESTMENTS Investment Update Secure Portfolio October 2018 This report is designed for use by the financial advisor to assist in making a personal recommendation or managing investments for the
DAC Short Term: $10,000 Growth from Inception
 DAC Short Term: $10,000 Growth from Inception $10,900 $10,909 $10,800 $10,700 $10,600 $10,500 $10,400 $10,300 $10,200 $10,100 $10,000 11/2014 02/2015 05/2015 08/2015 11/2015 02/2016 05/2016 08/2016 11/2016
Investment Report. Corporate Investment Proposition Passive Plus Funds Report. Standard Life
 Investment Report Standard Life Corporate Investment Proposition Q3 2017 Corporate Investment Proposition 1 Our Corporate Investment Proposition is made up of a family of carefully constructed risk-based
Office of the Treasurer of The Regents
 UCRP and GEP Quarterly Investment Risk Report Committee on Investments/ Investment t Advisory Group Quarter ending March 200 May 7, 200 Contents UCRP Asset allocation history 5 7 What are the fund s asset
DAC Wealth Protector: $10,000 Growth from Inception
 DAC Wealth Protector: $10,000 Growth from Inception $11,600 $11,661 $11,400 $11,200 $11,000 $10,800 $10,600 $10,400 $10,200 $10,000 12/2014 03/2015 06/2015 09/2015 12/2015 03/2016 06/2016 09/2016 12/2016
LONDON BOROUGH OF HARINGEY PENSION FUND INVESTMENT STRATEGY STATEMENT. 1. Introduction
 LONDON BOROUGH OF HARINGEY PENSION FUND INVESTMENT STRATEGY STATEMENT 1. Introduction Haringey Council is the Administering Authority for the Local Government Pension Scheme in the London Borough of Haringey
Statement of Investment Principles
 Statement of Investment Principles Cheshire Pension Fund November 2014 Page 1 of 15 Introduction The Cheshire Pension Fund ( The Fund ) is required to publish a Statement of Investment Principles (SIP)
Investment Strategy Statement: September 2018
 Investment Strategy Statement: September 2018 Introduction and background This is the Investment Strategy Statement ( ISS ) of the London Borough of Lewisham Pension Fund ( the Fund ), which is administered
Kent County Council Superannuation Fund
 Kent County Council Superannuation Fund Investment Strategy Statement 2018 www.kentpensionfund.co.uk Introduction 1. Regulation 7(1) of the Local Government Pension Scheme (Management and Investment of
WIP SPDR FTSE International Government Inflation- Protected Bond ETF
 WIP SPDR FTSE International Government Inflation- Protected Bond ETF ETF.com segment: Fixed Income: Global Ex-U.S. - Sovereign Inflation-Protected Competing ETFs: Related ETF Channels: Fixed Income, Sovereign,
Portfolio Peer Review
 Portfolio Peer Review Performance Report Example Portfolio Example Entry www.suggestus.com Contents Welcome... 3 Portfolio Information... 3 Report Summary... 4 Performance Grade (Period Ended Dec 17)...
FEATURE ARTICLE: LISTED INFRASTRUCTURE VERSUS LISTED PROPERTY A DEFENSIVE EQUITY SHOWDOWN
 JANUARY 2019 FEATURE ARTICLE: LISTED INFRASTRUCTURE VERSUS LISTED PROPERTY A DEFENSIVE EQUITY SHOWDOWN 1 Feature Article: Could Turkey s Economic Woes Cause Contagion? Introduction Listed property and
PRESS CONFERENCE 2 November 2012
 PRESS CONFERENCE 2 November 212 3Q 212 Fund s market value Quarterly numbers, 3 September 212. Billions of kroner 4 3 5 Asset class Value Percentage fund Equities 2 247 6.3% 3 723 4 3 5 3 Fixed Income
TEACHERS RETIREMENT BOARD. INVESTMENT COMMITTEE Item Number: 11
 TEACHERS RETIREMENT BOARD INVESTMENT COMMITTEE Item Number: 11 SUBJECT: Special Mandate Low Carbon Strategies CONSENT: ATTACHMENT(S): 2 ACTION: X DATE OF MEETING: / 20 mins. INFORMATION: PRESENTER(S):
Statement of Investment Principles
 Statement of Investment Principles This is the Statement of Investment Principles (the Statement ) made by Hermes Pension Trustees Limited, as Trustee (the Trustee ) of the Hermes Group Pension Scheme
Fund Management Index: Bonds
 Fund Management Index: Bonds Page X of 8 FundCalibre launched its Fund Manager Index earlier this year. The goal was to identify the fund groups whose actively managed equity funds consistently outperform
STATEMENT OF INVESTMENT PRINCIPLES Feb 2017
 1. Introduction 1.1 Local Government Pension Scheme (LGPS) Funds are required to publish a Statement of Investment Principles (SIP) 1 which must include the Fund's policy on the following: The types of
Kent County Council Superannuation Fund
 Kent County Council Superannuation Fund Investment Strategy Statement 2017 www.kentpensionfund.co.uk Introduction 1. Regulation 7(1) of the Local Government Pension Scheme (Management and Investment of
Managed Portfolio Service
 Managed Portfolio Service Defensive Portfolio Factsheet MARCH 2019 MARKET OVERVIEW The cautiously optimistic tones that have been heard across markets this year continued throughout the month of March.
MM Navigator Return Focused Range MM Lifestyle Risk Targeted Range
 CM15588 UK For professional investors only MM Navigator Return Focused Range MM Lifestyle Risk Targeted Range July 2018 Investment risks The value of investments and income derived from them can go down
Retirement Advantage. Quarterly Report. Quarter 4 January Executive Summary. Outcomes
 Retirement Advantage Quarterly Report Quarter 4 January 2018 Executive Summary There have been no changes to the list of funds over the final quarter of 2017. Six of the nine strategies continue to meet
MPI Quantitative Analysis
 MPI Quantitative Analysis a Mario H. Aguilar Director, Client Services, EMEA February 2011 Markov Processes International Tel +1 908 608 1558 www.markovprocesses.com ASSET CLASS ANALYSIS NORTH AMERICA
Risk-Free Rates of Return
 Risk-Free Rates of Return Malcolm Kemp, Andrew D Smith (Working Party Members) malcolm.kemp@threadneedle.co.uk AndrewDSmith8@deloitte.co.uk 16:00 16:50 3, 6, 18 & 25 November, 2008 Current Issues In Pensions
> Macro Investment Outlook
 > Macro Investment Outlook Dr Shane Oliver Head of Investment Strategy and Chief Economist October 214 The challenge for investors how to find better yield and returns as bank deposit rates stay low 9
London Borough of Barnet Superannuation Fund. Quarterly update to 30 September 2014
 Superannuation Fund Quarterly update to 30 September 2014 May 2014 Contents 1 Market update... 1 2 Total scheme performance... 6 3 Manager performance... 9 3.1 Newton Real Return Fund... 9 3.2 Schroder
ALPHA GENERATION IDENTIFYING TALENT
 ALPHA GENERATION IDENTIFYING TALENT Multi-Manager Academy, September 2015 ON THE PLANET TO PERFORM 1 Learning objectives Advisers should leave the presentation with: An understanding of the benefits of
UCRP and GEP Quarterly Investment Risk Report
 UCRP and GEP Quarterly Investment Risk Report Quarter ending June 2011 Committee on Investments/ Investment Advisory Group September 14, 2011 Contents UCRP Asset allocation history 5 17 What are the fund
Revisiting Core Principles
 FTSE RAFI All World 3000 - QSR Index (USD) As of 09/30/2017 Revisiting Core Principles The FTSE RAFI QSR Index series utilizes fundamental measures of company size (sales, cash flow, dividends, and book
West Midlands Pension Fund
 West Midlands Pension Fund Asset allocation and investment performance report Quarter to 31 March 2017 Jason Fletcher Chief Investment Officer This page is deliberately left blank 2 Contents page 4 page
Understanding Smart Beta Returns
 Understanding Smart Beta Returns October 2018 In this paper, we use a performance analysis framework to analyze Smart Beta strategies against their benchmark. We apply it to Minimum Variance Strategies
This guide is for our:
 Fund Choice Guide Closed Funds Quarter 2 2018 2 This guide is for our: Policies taken out after January 2007 (Current product range) Policies taken out between February 1994 and January 2007 (Portfolio
Revisiting Core Principles
 Russell RAFI Global All Co Index (USD) As of 06/30/2017 Revisiting Core Principles The Russell RAFI Index series utilizes fundamental measures of company size (adjusted sales, retained cash flow, and dividends
What are the changes to the funds available to me (UP960)?
?") What are the changes to the funds available to me (UP960)? The changes listed below will be made to the funds between July 2018 and the end of the year. We will update the information we have online with
What are the changes to the funds available to me (UP960)? The changes listed below will be made to the funds between July 2018 and the end of the year. We will update the information we have online with
Standard Bank International Funds Limited July 2016
 Standard Bank International Funds Limited July 2016 Standard Bank International Funds Limited Standard Bank International Funds Limited (the Fund ) is a registered Fund of Funds incorporated in Jersey
MULTI-ASSET CLASS 1 EQUITIES: DEVELOPED COUNTRIES 1 EQUITY EMERGING COUNTRIES 2
 10 2 3 6 8 9 13 14 MULTI-ASSET CLASS 1 EQUITIES: DEVELOPED COUNTRIES 1 EQUITY EMERGING COUNTRIES 2 Alpha Current Previous Alpha Current Previous Alpha Current Previous weight weight weight weight weight
YOUR INVESTMENT OPTIONS
 BNP PARIBAS RETIREMENT SAVINGS PLAN YOUR INVESTMENT OPTIONS VISTA RETIREMENT SAVINGS PLAN V I S T A ENTER The bank for a changing world CONTENTS DIFFERENT TYPES OF INVESTMENT...4 WHAT ARE THE MAIN RISKS?...5
Endowment Funds Performance (Year ending Sept 30 th, 2014)
") Endowment Funds Performance (Year ending Sept 30 th, 2014) prepared for University Board of Governors (Note: all returns and values are expressed in Canadian Dollars- CAD s) 1 Quarterly Market Overview
Endowment Funds Performance (Year ending Sept 30 th, 2014) prepared for University Board of Governors (Note: all returns and values are expressed in Canadian Dollars- CAD s) 1 Quarterly Market Overview
Global Equity Trading Volumes Surge 36% in 1 st half 2015 driven by Mainland China
 EMBARGO: :1BST/1:1CET/19:1EDT Global Equity Trading Volumes Surge 36% in 1 st half 215 driven by Mainland China Global Equity Trading Volumes Ex Mainland China Up 5% Mainland China Share Trading Vols Rise
Senior Secured UK Property Debt Investments Ltd Fact Sheet. As at 31 st October 2017
 Senior Secured UK Property Debt Investments Ltd Fact Sheet As at 31 st October 2017 Feb-13 Mar-13 Apr-13 May-13 Jun-13 Jul-13 Aug-13 Sep-13 Oct-13 Nov-13 Dec-13 Jan-14 Feb-14 Mar-14 Apr-14 May-14 Jun-14
ETF portfolio review, 31st July the ETF investment specialists
 ETF portfolio review, 31st July 2016 the ETF investment specialists market overview The defensive Secure Wealth Management ETF portfolios have performed strongly in 2016, with fixed-income up 7.6%, conservative