2015 MDRT Annual Meeting e Handout Material
|
|
|
- Dorcas Gaines
- 5 years ago
- Views:
Transcription
1 2015 MDRT Annual Meeting e Handout Material Title: Speaker: Diversified to the CORE: A Better Starting Point Craig L. Israelsen, Ph.D. Presentation Date: Tuesday, June 16, :30 5:00 p.m. The Million Dollar Round Table (MDRT) does not guarantee the accuracy of tax and legal matters and is not liable for errors and omissions. You are urged to check with tax and legal professionals in your state, province or country. MDRT also suggests you consult local insurance and security regulations and your company s compliance department pertaining to the use of any new sales materials with your clients. The information contained in this handout is unedited and errors, omissions and misspellings may exist. Content may be altered during the delivery of this presentation Million Dollar Round Table Million Dollar Round Table 325 West Touhy Ave. Park Ridge, IL USA
2


3 Go, Portfolio. Go! by C. L. Israelsen I Can Build it All By Myself Investment Primer
4 Go, Portfolio. Go! Big portfolios, little portfolios. Big investors, little investors. Do you like my investment portfolio? I do not. It is not diversified. Good-bye. No, don t go. I will teach you about diversification. Okay, but please make it short. Okay.

5 Diversified 7Twelve portfolio. Large US Developed Real Estate Natural Resources US Midcap US Emerging Inflation Protected Small Cap US This portfolio uses 12 different mutual funds.


6 Diversified portfolio results. 15-Year Growth of $,000 January 1, 2000 to December 31, % $13,498 0% $18,360 60% / 40% $22,044 0% $22,790 7Twelve Portfolio $29,448 More diversification is better.

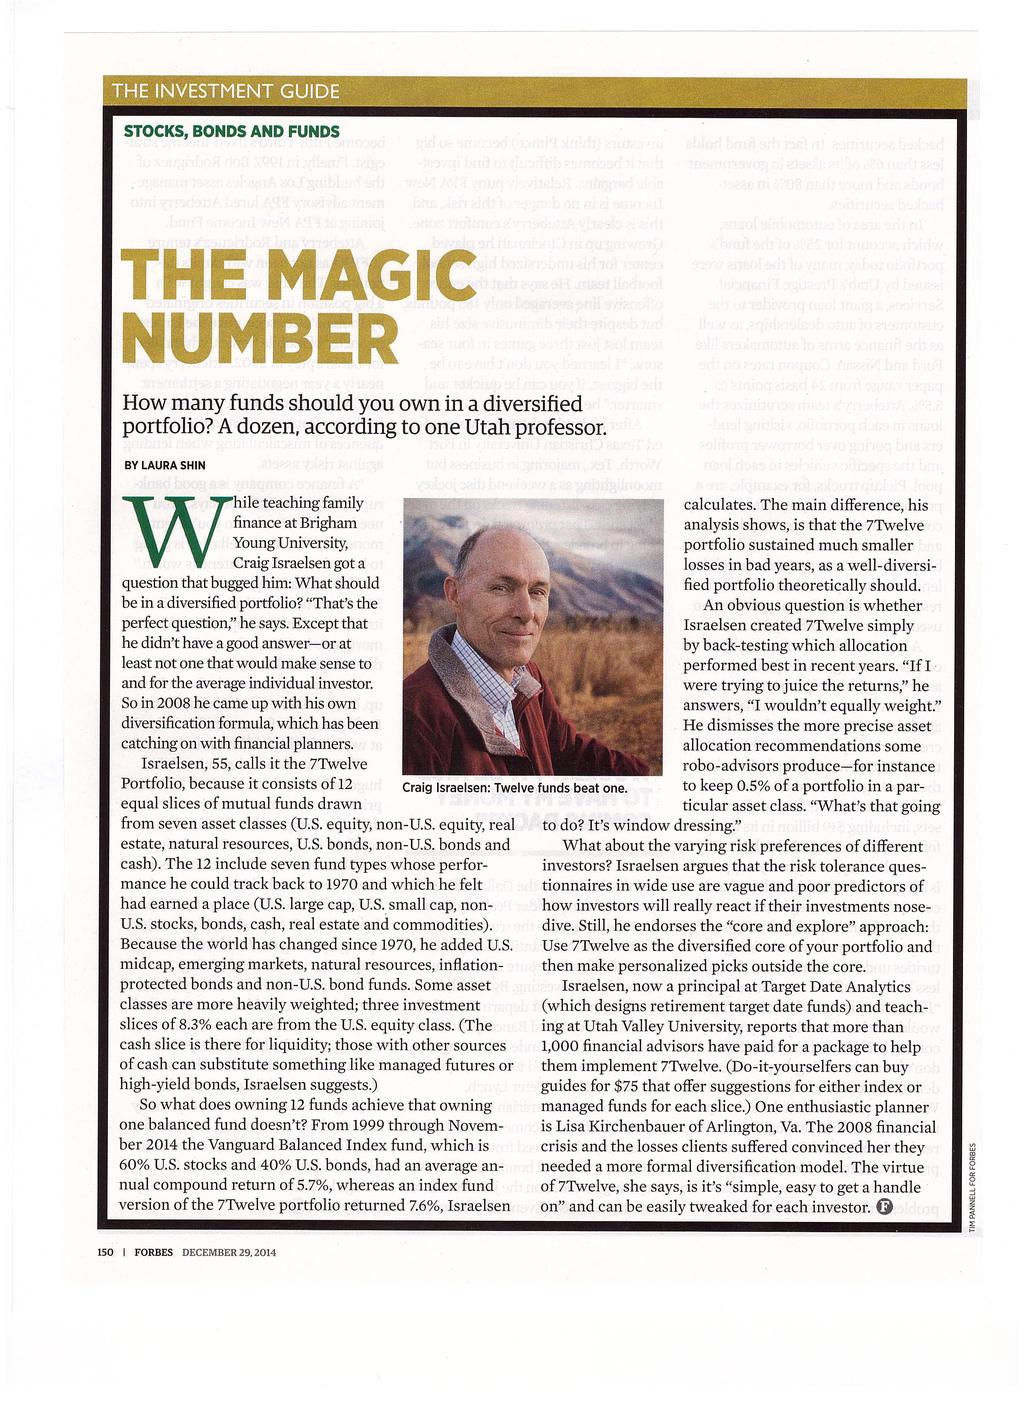
7 Big portfolios, little portfolios. Big investors, little investors. Do you like my investment portfolio? I do like your 7Twelve portfolio. It is more diversified. Good-bye. Good-bye. Craig L. Israelsen, Ph.D. has taught Personal and Family Finance at the University of Missouri and Brigham Young University. He now teaches in the Woodbury School of Business at Utah Valley University. He writes monthly for Financial Planning Magazine and is the developer of the 7Twelve Portfolio ( He is the author of 7Twelve: A Diversified Investment Portfolio with a Plan published by John Wiley & Sons which is available at Amazon.com.

 Craig L. Israelsen, Ph.D.")
8 This document is a research report presenting portfolio research and analysis. This document is neither investment advice nor an investment solicitation. Implementation of the 7Twelve portfolio is no guarantee of performance. As we all know past performance is no guarantee of future performance it could be better than we expect! Overview Part One provides a historical context of the benefits of a multi-asset, low correlation portfolio. 45-year history ( ) Craig L. Israelsen, Ph.D. Diversified to the CORE: A Better Staring Point This is a copyrighted document, copying for redistribution is prohibited unless written permission is obtained from Craig L. Israelsen 7Twelve is a registered trademark belonging to Craig L. Israelsen Copyright Craig L. Israelsen All rights reserved Part Two introduces the 7Twelve Portfolio, a multi-asset, low correlation balanced portfolio. 15-year performance period ( ) 1
9 Average Annualized % Return ( ) 5/8/ Year Historical Asset Returns 45-Year Period from Annualized Return (%) Std Dev of Annual Returns Growth of $,000 Real Estate ,444,413 US Small ,175,538 US Large ,941 International , ,280 (Aggregate) , ,030 Inflation (CPI) ,409 Data Large-cap US equity represented by the S&P 500 Index. Small-cap US equity represented by the Ibbotson Small Companies Index from , and the Russell 2000 Index starting in equity represented by the MSCI EAFE Index. Real estate represented by the NAREIT Index from and the Dow Jones US Select REIT Index starting in represented by the Goldman Sachs Index (GSCI). As of February 6, 2007, the GSCI became the S&P GSCI Commodity Index. U.S. Aggregate represented by the Ibbotson Intermediate Term Bond Index from and the Barclays Capital Aggregate Bond index starting in represented by 3-month Treasury Bills Year Risk/Return Analysis: REIT Small US Equity Large US Equity Equity Worst Three-Year Cumulative % Return ( )
10 Average Annualized % Return ( ) 5/8/ Year Risk/Return Analysis: Ideal risk and return zone REIT Large US Equity Small US Equity Equity To be diversified, a portfolio must combine multiple ingredients that have low correlation with each other. 45-Year Correlations of Major Asset Classes ( ) Small US Equity Equity Large US Equity 0.78 Small US Equity Equity US US REIT REIT Worst Three-Year Cumulative % Return ( ) Aggregate (Average) Correlation in Equal-Weighted 7-Asset Portfolio =
11 Large and Small US US and Rolling 5-Year Correlations Year Rolling Correlations: Large US to Small US Year Rolling Correlations: Large US to Using S&P 500 as comparison baseline index (0.20) (0.20) (0.40) (0.40) (0.60) (0.60) (0.80) (0.80) (1.00) (1.00) 4
12 US and REITs 5-Year Rolling Correlations: Large US to REIT US and 5-Year Rolling Correlations: Large US to Meaningful portfolio diversification requires Depth and Breadth (0.20) (0.40) (0.60) (0.80) (1.00) (0.20) (0.40) (0.60) (0.80) (1.00) Mutual Funds/ETFs = Depth Wide variety of funds = Breadth 5
13 Average 3-Year Reutrn ( ) Average 3-Year Reutrn ( ) 5/8/2015 The following slides demonstrate portfolio performance as diversity (or breadth) increases Year Risk/Return Analysis: Rolling 3-Year Periods Add (50% each) Add US (33% each) Add (14.3% each) Add US Sml (25% each) Add Real Estate (16.7% each) Add (20% each) Year Risk/Return Analysis: Rolling 3-Year Periods Add (50% each) Add US (33% each) Add (14.3% each) Add US Sml (25% each) Add Real Estate (16.7% each) Add (20% each) 0% Standard Deviation of 3-Year Average Annualized Returns 0% Standard Deviation of 3-Year Average Annualized Returns 6
14 When built correctly, a multi-asset portfolio achieves equity-like returns with bond-like risk Single Assets vs. Multi-Asset Portfolio Equally Large US Small US US Real Weighted Equity Equity Equity Estate 7-Asset Portfolio 45-Year Average Annualized % Return 45-Year Standard Deviation of Annual Returns Number of Years with Negative Returns Worst Three-Year Cumulative % (37.61) (42.24) (43.32) (35.61) (39.72) (13.40) Return Single Assets vs. Multi-Asset Portfolio Equally Large US Small US US Real Weighted Equity Equity Equity Estate 7-Asset Portfolio 45-Year Average Annualized % Return 45-Year Standard Deviation of Annual Returns Number of Years with Negative Returns Worst Three-Year Cumulative % (37.61) (42.24) (43.32) (35.61) (39.72) (13.40) Return 7
15 Average Annualized % Return ( ) Average Annualized % Return ( ) 5/8/ Year Risk/Return Analysis: Multi-Asset Portfolio - 60/40-20 REIT Large US Equity Worst Three-Year Cumulative % Return ( ) Small US Equity Equity Year Risk/Return Analysis: Multi-Asset Portfolio -20 Inflation Adjusted Returns 60/40-30 REIT Large US Equity -40 Worst Three-Year Cumulative % Return ( ) Small US Equity Equity () (20) (30) (40) (50) Annual Returns for Multi-Asset Portfolio 45-year Period:
16 50 Annual Returns for Multi-Asset Portfolio vs. S&P 500 Index 45-year Period: Annual Returns for Multi-Asset Portfolio vs. S&P 500 Index 45-year Period: Annual Returns for Multi-Asset Portfolio vs. S&P 500 Index 45-year Period: () () () (20) (20) (20) (30) (40) (50) (30) (40) (50) The S&P 500 is not the correct benchmark for a multi-asset portfolio but it will used as such by many investors (30) (40) (50) S&P 500 is better 56% of the time but when it s worse it is much worse
 (20) (30) (40) (50) Multi-Asset")


17 Annual Returns for Multi-Asset Portfolio vs. S&P 500 Index 45-year Period: Key to Long-Term Success Single Assets vs. Multi-Asset Portfolio Large US Small US US Real Equity Equity Equity Estate Equally Weighted 7-Asset Portfolio 20 0 () (20) (30) (40) (50) Multi-Asset Portfolio Annualized Return =.12% S&P 500 Index Annualized Return =.48% Reducing the frequency and magnitude of losses 45-Year Average Annualized % Return 45-Year Standard Deviation of Annual Returns Number of Years with Negative Returns Worst Three-Year Cumulative % Return (37.61) (42.24) (43.32) (35.61) (39.72) (13.40)
18 Single Assets vs. Multi-Asset Portfolio Large US Small US US Real Equity Equity Equity Estate Equally Weighted 7-Asset Portfolio The Math of Losses and Needed Gains Needed % Gain = [1 / (1 % Loss)] 1 Percentage Loss in Portfolio Portfolios Needed Percentage Gain to Restore Portfolio Building a Diversified Portfolio 45-Year Average Annualized % Return 45-Year Standard Deviation of Annual Returns Number of Years with Negative Returns Worst Three-Year Cumulative % Return (37.61) (42.24) (43.32) (35.61) (39.72) (13.40) -5% 5.3% -% 11.1% -15% 17.6% -20% 25.0% -27% Multi-Asset Portfolio in % -30% 42.9% -35% 53.8% -37% S&P 500 Index in % -40% 66.7% -45% 81.8% -50% 0.0% -55% 141 equity funds lost 50% 122.2% -60% or more in % -65% 185.7% -70% (funds with at least 60% equity) 233.3% -75% 300.0% 7Twelve 7 Core Asset Classes utilizing 12 Underlying Funds 11


19 Minimal Diversification The S&P 500 Index Two-Asset Diversification 60/40 Portfolio Good Diversification 7-Asset Portfolio Large US Large US US Large US Developed Real Estate US Small Cap US 12

20 Superior Diversification 12-Asset Portfolio 7Twelve Portfolio 7Twelve 7 Core Asset Classes Twelve Actual Holdings Large US Developed Real Estate Natural Resources US Large US Developed Real Estate Natural Resources US US Real Estate Resources US Midcap US Emerging Inflation Protected Midcap US Emerging Inflation Protected Large US Developed Real Estate Natural Resources US Small Cap Small Cap Midcap US Emerging Inflation Protected US US Small Cap US 13

21 7Twelve Equally-weighted exposure to 12 asset classes International 8.33% US 8.33% 8.33% TIPS 8.33% Natural Resources 8.33% 8.33% Large US 8.33% Real Estate 8.33% Mid Cap US 8.33% Emerging Markets 8.33% Small US 8.33% 8.33% Performance in 2014 Real Estate, 30.37% Large US, 13.46% Small US,.55% Mid US, 9.40% 7Twelve Portfolio, 1.38% Short Term, 1.37%, 0.01% Emerging, -0.07% Short Term TIPS, -1.41%, -2.52%, -6.20% Nat Resources, -.25%, -28.% -40.0% -30.0% -20.0% -.0% 0.0%.0% 20.0% 30.0% 40.0% Nat Resources, 7.01% TIPS, 5.96% US, 5.34%, 4.21% Large US, 4.17%, 2.35%, 2.02% Real Estate, 12.51% Small US,.61% Mid US, 9.37% 7Twelve Portfolio, 7.47%, 7.35% Emerging, 7.14% 15-Year Performance 0.0% 3.0% 6.0% 9.0% 12.0% 15.0% 14

22 , 2.2% US, 3.6% TIPS, 6.6%, 8.4% 15-Year Volatility $35,000 $30, Year Growth of $, Twelve Portfolio Eight Equity and Diversifying Holdings The Engines of the Portfolio 7Twelve 7Twelve Portfolio, 12.6% Large US, 19.1% Mid US, 19.5% Small US, 19.6% $25,000 $20,000 US Large Cap 60/40 Portfolio US Real Estate Resources US Real Estate, 20.4%, 21.4% $15,000, 22.2% Nat Resources, 23.8% $,000 Emerging, 33.2% $5, % 5.0%.0% 15.0% 20.0% 25.0% 30.0% 35.0% 40.0% $0 15
23 7Twelve Four Fixed Income Holdings The Brakes of the Portfolio US Real Estate Resources US Brakes Have Outperformed 1/3 of the time Engines Have Outperformed 2/3 of the time Year 7Twelve Brakes (4 ETFs) 7Twelve Engines (8 ETFs) Year Return Year Return Year Return Year Return Equities and Diversifiers: 8 ENGINES 65% of Overall Portfolio Allocation 7Twelve Fixed Income: 4 BRAKES 35% of Overall Portfolio Allocation US Real Estate Resources US 16
24 Stop Chasing Performance 15-Year Period from Investment Approach 15-Year Annualized Performance Stop Chasing Performance 15-Year Period from Investment Approach 15-Year Annualized Performance Stop Chasing Performance 15-Year Period from Investment Approach 15-Year Annualized Performance HARE: Performance Chasing by Investing 0% in Last Year s BEST Asset 0.09% HARE: Performance Chasing by Investing 0% in Last Year s BEST Asset 0.09% HARE: Performance Chasing by Investing 0% in Last Year s BEST Asset 0.09% HARE II: Performance Chasing by Investing 0% in Last Year s WORST Asset HARE II: Performance Chasing by Investing 0% in Last Year s WORST Asset 3.39% HARE II: Performance Chasing by Investing 0% in Last Year s WORST Asset 3.39% TORTOISE: Invest in the equally weighted 12-asset 7Twelve model TORTOISE: Invest in the equally weighted 12-asset 7Twelve model TORTOISE: Invest in the equally weighted 12-asset 7Twelve model 7.47% 17


25 15-Year Distribution Analysis: $250,000 Initial Account Value on Jan 1, % Initial Withdrawal 3% Annual Increase in Annual Withdrawal Total Withdrawal of $232,486 Ending Account Balance on December 31, 2014 Passive 7Twelve Portfolio 7Twelve Age Based Twelve Age Based Twelve Age Based 70 Plus Vanguard Balanced Index 8% 8% 7% 7% 6% 6% 5% 7Twelve Rebalancing Comparison as of Dec 31, % 7Twelve with Annual Rebalancing 5.88% 7Twelve with No Rebalancing 7.47% 7.13% Monthly Rebalancing 7Twelve 15-Year Period from Passive 7Twelve model Quarterly Rebalancing Annual Rebalancing Vanguard 500 Index 5% 0 50,000 0, , , , , , ,000 4% -Year Annualized Return 15-Year Annualized Return 18
26 7Twelve It s the recipe that matters, not where you buy the ingredients 7Twelve Models Active 7Twelve Passive Vanguard 7Twelve 7Twelve T. Rowe Price 7Twelve Fidelity Tax Efficient DFA 7Twelve 7Twelve 7Twelve 15-Year Annualized Return ( )
Building and Managing a Diversified Portfolio
 Building and Managing a Diversified Portfolio Craig L. Israelsen, Ph.D. Designer of the Portfolio Presentation AAII Silicon Valley Chapter April 14, 2018 Based on research by Craig L. Israelsen, Ph.D.
Portfolio The Benefits of Low Correlation
 The 7Twelve Portfolio The Benefits of Low Correlation Craig L. Israelsen, Ph.D. Brigham Young University www.7twelveportfolio TwelvePortfolio.com 41 slides 1 This document is a research report presenting
Building and Managing a Diversified Retirement Portfolio
 Building and Managing a Diversified Retirement Portfolio AAII Sarasota Craig L. Israelsen, Ph.D. 7Twelve Portfolio February 18, 2016 www.7twelveportfolio.com Key Concepts Retirement Account Multiple (or
Inflation and Asset Performance: A Review of the Past 48 Years
 Inflation and Asset Performance: A Review of the Past 48 Years Mar 1, 2018 / By Craig L. Israelsen, PhD This is a tale of two time periods: 24 years with high inflation and 24 with low inflation. We examine
A Better Balanced Benchmark Craig L. Israelsen, Ph.D. March 24, 2009
 A Better Balanced Benchmark Craig L. Israelsen, Ph.D. March 24, 2009 It s time for a better benchmark for Balanced funds. Way back when, there were two dominant investment assets: US stock and US bonds.
2017 MDRT Annual Meeting e-handout Material. Retirement Income Planning: Take your Wealth Management Business to the Next Level
 2017 MDRT Annual Meeting e-handout Material Title: Speaker: Retirement Income Planning: Take your Wealth Management Business to the Next Level Brad Brain, CFP, CLU Presentation Date: Tuesday, June 6, 2017
7Twelve. A Multi-Asset Balanced Portfolio. Craig L. Israelsen, Ph.D. 7Twelve. 7 Broad Asset Categories, 12 Funds
 7Twelve A Multi-Asset Balanced Portfolio www.7twelveportfolio.com Craig L. Israelsen, Ph.D. 7Twelve 7 Broad Asset Categories, 12 Funds Eight Equity and Diversifying Funds 65% of Overall Portfolio Allocation
Actively Passive or Passively Active?
 Actively Passive or Passively Active? May 18, 2010 by Craig L. Israelsen, Ph.D. Advisor Perspectives welcomes guest contributions. The views presented here do not necessarily represent those of Advisor
2016 MDRT Annual Meeting e-handout Material. 4th Generation Retirement Planning. 3:30 5:00 p.m.
 2016 MDRT Annual Meeting e-handout Material Title: Speaker: 4th Generation Retirement Planning Guy E. Baker, MSFS, CLU Presentation Date: Tuesday, June 14, 2016 Presentation Time: 10:00-11:30 a.m. AND
2017 MDRT Annual Meeting e-handout Material. It's Not What You Say; It s How You Say it
 2017 MDRT Annual Meeting e-handout Material Title: Speaker: It's Not What You Say; It s How You Say it Dale W. Martin, CLU, ChFC Presentation Date: Monday, June 5, 2017 Presentation Time: Session Room:
A data-driven look at the power of diversification
 A data-driven look at the power of diversification Renowned asset allocation expert Craig L. Israelsen, a Financial Planning contributing writer, explores how diversification can mitigate portfolio risk
2016 MDRT Annual Meeting e Handout Material. A Revolutionary Approach to Advising Clients
 2016 MDRT Annual Meeting e Handout Material Title: Speaker: A Revolutionary Approach to Advising Clients Tim Cestnick, FCA, FCPA Presentation Date: Tuesday, June 14, 2016 Presentation Time: 3:30 5:00 p.m.
2018 MDRT Annual Meeting e-handout Material. Best Practices for Nonqualified Deferred Compensation
 2018 MDRT Annual Meeting e-handout Material Title: Speaker: Best Practices for Nonqualified Deferred Compensation Kirk Wolf, CFA Presentation Date: Wednesday, June 27, 2018 Presentation Time: Session Room:
Building and Interpreting Custom Investment Benchmarks
 Building and Interpreting Custom Investment Benchmarks A White Paper by Manning & Napier www.manning-napier.com Unless otherwise noted, all figures are based in USD. 1 Introduction From simple beginnings,
Can We Lower Portfolio Volatility and Still Meet Equity Return Expectations?
 Can We Lower Portfolio Volatility and Still Meet Equity Return Expectations? Richard Yasenchak, CFA Senior Vice President, Client Portfolio Manager, INTECH FOR INSTITUTIONAL INVESTOR USE/NOT FOR PUBLIC
Risk Management and Target-Date Funds
 Risk Management and Target-Date Funds Speakers: John Galateria, Head of North America Institutional, J.P. Morgan Asset Management Dan Oldroyd, Portfolio Manager, J.P. Morgan Asset Management Participant-controlled
2018 MDRT Annual Meeting e-handout Material. Transferable Sales Ideas and Marketing Concepts for the Life Insurance Producer
 2018 MDRT Annual Meeting e-handout Material Title: Speaker: Transferable Sales Ideas and Marketing Concepts for the Life Insurance Producer Howard E. Sharfman Presentation Date: Wednesday, June 27, 2018
A Summary of the Rogers International Commodity Index 3 rd Quarter 2017
 A Summary of the Rogers International Commodity Index 3 rd Quarter 2017 The Rogers International Commodity Index (RICI ) was developed by Jim Rogers to be an international, diversified, investable raw
WHEREAS, at its meeting on December 14, 2017, the Board adopted a strategy and a manager for the NC TIPS Fund;
 SUPPLEMENTAL RETIREMENT PLAN OF NORTH CAROLINA WHEREAS, the North Carolina Department of State Treasurer and the Supplemental Retirement Board of Trustees (the Board ) administer the Supplemental Retirement
BROAD COMMODITY INDEX
 BROAD COMMODITY INDEX COMMENTARY + STRATEGY FACTS JULY 2018 100.00% 80.00% 60.00% 40.00% 20.00% 0.00% -20.00% -40.00% -60.00% CUMULATIVE PERFORMANCE ( SINCE JANUARY 2007* ) -80.00% ABCERI S&P GSCI ER BCOMM
BROAD COMMODITY INDEX
 BROAD COMMODITY INDEX COMMENTARY + STRATEGY FACTS JUNE 2017 80.00% CUMULATIVE PERFORMANCE ( SINCE JANUARY 2007* ) 60.00% 40.00% 20.00% 0.00% -20.00% -40.00% -60.00% -80.00% ABCERI S&P GSCI ER BCOMM ER
Emerging Markets Stocks Q STOCKS BONDS
 Q4 US Stock Market International Developed Stocks Emerging Markets Stocks Global Real Estate US Bond Market Global Bond Market ex US Q4 2017 STOCKS BONDS 6.34% 4.23% 7.44% 2.97% 0.39% 1.10% Since Jan.
BROAD COMMODITY INDEX
 BROAD COMMODITY INDEX COMMENTARY + STRATEGY FACTS AUGUST 2018 120.00% 100.00% 80.00% 60.00% 40.00% 20.00% 0.00% -20.00% -40.00% -60.00% CUMULATIVE PERFORMANCE ( SINCE JANUARY 2007* ) -80.00% ABCERI S&P
Forum Portfolio Investment Policy Statement
 Forum Portfolio Investment Policy Statement Prepared for John Smith and Mary Smith Sunday February 12, 2017 60% Equities / 40% Fixed Income Growth Portfolio I. Purpose This Investment Policy Statement
2016 MDRT Annual Meeting e Handout Material. Don t Worry, Retire Happy! 7 Steps to Retirement Security
 2016 MDRT Annual Meeting e Handout Material Title: Speaker: Don t Worry, Retire Happy! 7 Steps to Retirement Security Tom Hegna, CLU, ChFC Presentation Date: Tuesday, June 14, 2016 Presentation Time: 8:30
TIME TARGETED EQUITY PORTFOLIOS
 TIME TARGETED EQUITY PORTFOLIOS 1 3 Year 4 6 Year Equity 7 15 Year 15+ Year Global Diversification Exposure to a large number of securities around the world reduces the risk that any one stock or any one
RAFI. Delivering on the Promise of Smart Beta. September 18, 2014 Feifei Li, PhD, FRM
 RAFI Delivering on the Promise of Smart Beta September 18, 2014 Feifei Li, PhD, FRM Examining Smart Beta The Advantages of Passive Investing» Index funds are a compelling choice for investors Broad market
Pursuing a Better Investment Experience
 Pursuing a Better Investment Experience Last updated: February 2017 1. Embrace Market Pricing World Equity Trading in 2016 Daily Average Number of Trades 82.7 million Dollar Volume $346.4 billion The market
MINNESOTA STATE UNIVERSITY MOORHEAD ALUMNI FOUNDATION. Investment Policy. General Overview
 MINNESOTA STATE UNIVERSITY MOORHEAD ALUMNI FOUNDATION Policy General Overview The Minnesota State University Moorhead Alumni Foundation, Inc. is a publicly supported corporation that has been determined
Ben E. Keith Company Retirement Plans. Welcome to Empower Retirement!
 Ben E. Keith Company Retirement Plans Welcome to Empower Retirement! Agenda Who is Empower Retirement? Your new 401(k) plan at Empower Investment options Transfer of your Ben E. Keith Profit Sharing Plan
Schwab Indexed Retirement Trust Fund 2040
 Fund Facts Trustee Fund Type Charles Schwab Bank Collective Trust Fund Category Target Date 2036-2040 Benchmark 2040 Custom Index 1 Unit Class Inception Date Fund Inception Date 1/5/2009 Net Asset Value
BROAD COMMODITY INDEX
 BROAD COMMODITY INDEX COMMENTARY + STRATEGY FACTS APRIL 2017 80.00% CUMULATIVE PERFORMANCE ( SINCE JANUARY 2007* ) 60.00% 40.00% 20.00% 0.00% -20.00% -40.00% -60.00% -80.00% ABCERI S&P GSCI ER BCOMM ER
Navigating the ETF Landscape
 Navigating the ETF Landscape Daniel Prince, CFA Director, Head of ishares Product Consulting May 3, 2017 Agenda What are Exchange Traded Funds (ETFs) What is driving ETF usage ETF trends and innovation
COMMODITIES AND A DIVERSIFIED PORTFOLIO
 INVESTING INSIGHTS COMMODITIES AND A DIVERSIFIED PORTFOLIO As global commodity prices continue to linger in a protracted slump, investors in these hard assets have seen disappointing returns for several
QUARTERLY REVIEW REPORT
 QUARTERLY REVIEW REPORT For the Quarter Ending December 31, 2015 PGR Solutions, LLC 51 E. Campbell Ave., Ste. 124 Campbell CA 95008 (408) 871-1590 www.pgrsolutions.com Quarterly Market Review Fourth Quarter
2016 MDRT Annual Meeting e Handout Material. From the Edge of (Financial) Oblivion to Court of the Table
 Oblivion to Court of the Table") 2016 MDRT Annual Meeting e Handout Material Title: Speaker: From the Edge of (Financial) Oblivion to Court of the Table Douglas John Bennett, DipPFS Presentation Date: Wednesday, June 15, 2016 Presentation
2016 MDRT Annual Meeting e Handout Material Title: Speaker: From the Edge of (Financial) Oblivion to Court of the Table Douglas John Bennett, DipPFS Presentation Date: Wednesday, June 15, 2016 Presentation
Schwab Diversified Growth Allocation Trust Fund (Closed to new investors) Institutional Unit Class As of June 30, 2017
 Institutional Unit Class As of June 30, 2017") Fund Facts Trustee Fund Type Charles Schwab Bank Collective Trust Fund Morningstar Category Allocation - 50-70% Equity Benchmark Global Growth Custom Index 1 Unit Class Inception Date 3/7/2012 Fund Inception
Fund Facts Trustee Fund Type Charles Schwab Bank Collective Trust Fund Morningstar Category Allocation - 50-70% Equity Benchmark Global Growth Custom Index 1 Unit Class Inception Date 3/7/2012 Fund Inception
Real Estate Investment Trusts: An Industry Perspective
 Real Estate Investment Trusts: An Industry Perspective October 6, 2015 Naples, FL National Association of Real Estate Investment Trusts REITs: Building Dividends & Diversification 1875 I St, NW Suite 600,
Pursuing a Better Investment Experience
 Pursuing a Better Investment Experience Last updated: April 2016 1. Embrace Market Pricing World Equity Trading in 2015 Daily Average Number of Trades 98.6 million Dollar Volume $447.3 billion The market
State Universities Retirement System of Illinois (SURS) Investment Update
 Investment Update") State Universities Retirement System of Illinois (SURS) Investment Update December 2017 Volume 28, Issue 6 c\ Investment Update March 12, 2018 Volume 28, Issue 6 www.surs.org December Quarter Fiscal 1
State Universities Retirement System of Illinois (SURS) Investment Update December 2017 Volume 28, Issue 6 c\ Investment Update March 12, 2018 Volume 28, Issue 6 www.surs.org December Quarter Fiscal 1
INVESTMENT GUIDELINES FOR THE POOLED INVESTMENT FUND FOR THE EPISCOPAL CHURCH IN MINNESOTA
 INVESTMENT GUIDELINES FOR THE POOLED INVESTMENT FUND FOR THE EPISCOPAL CHURCH IN MINNESOTA The Episcopal Church in Minnesota is a network of faith communities called to transformation by engaging God s
Why and How to Pick Tactical for Your Portfolio
 Why and How to Pick Tactical for Your Portfolio A TACTICAL PRIMER Markets and economies have exhibited characteristics over the past two decades dissimilar to the years which came before. We have experienced
Geoff Considine, Ph.D.
 Choosing Your Portfolio Risk Tolerance Geoff Considine, Ph.D. Copyright Quantext, Inc. 2008 1 In a recent article, I laid out a series of steps for portfolio planning that emphasized how to get the most
Playing The Bull Market s Final Inning(s)
") Playing The Bull Market s Final Inning(s) Douglas Ramsey, CFA, CMT Mid-September 2013 FOR PROFESSIONAL USE ONLY. FURTHER DISTRIBUTION OF THE INFORMATION CONTAINED HEREIN IS PROHIBITED WITHOUT PRIOR PERMISSION.
Playing The Bull Market s Final Inning(s) Douglas Ramsey, CFA, CMT Mid-September 2013 FOR PROFESSIONAL USE ONLY. FURTHER DISTRIBUTION OF THE INFORMATION CONTAINED HEREIN IS PROHIBITED WITHOUT PRIOR PERMISSION.
THE REWARDS OF MULTI-ASSET CLASS INVESTING
 INVESTING INSIGHTS THE REWARDS OF MULTI-ASSET CLASS INVESTING Market volatility and asset class correlations have been on the rise in recent years, leading many investors to wonder if diversification still
Business Development Companies
 March 2018 Business Development Companies VanEck Vectors BDC Income ETF (BIZD ) ETF disclosure This material does not constitute an offer to sell or solicitation to buy any security, including shares of
BROAD COMMODITY INDEX
 BROAD COMMODITY INDEX COMMENTARY + STRATEGY FACTS JANUARY 2018 100.00% 80.00% 60.00% 40.00% 20.00% 0.00% -20.00% -40.00% -60.00% CUMULATIVE PERFORMANCE ( SINCE JANUARY 2007* ) -80.00% ABCERI S&P GSCI ER
Going Beyond Style Box Investing
 Going Beyond Style Box Investing NCPERS Presented by Erin Doyle Orekhov, Client Portfolio Manager May 22, 2017 For financial professional or qualified institutional investor use only. Not for inspection
GIPS List of Composite Descriptions
 GIPS List of Composite Descriptions Updated 5/12/14 Concentrated Growth Composite-330 Concentrated Growth portfolios, benchmarked to the Russell 1000 Growth Index, take concentrated positions in larger
Sample Custom Account (using SSgA Common Trust Funds) 3 rd Quarter 2013
 3 rd Quarter 2013") Sample Custom Account (using SSgA Common Trust Funds) 3 rd Quarter 2013 Endowment Management Solutions 70/30 Equities/Fixed Income 60/40 Equities/Fixed Income 50/50 Equities/Fixed Income 100/0 Fixed Income
Sample Custom Account (using SSgA Common Trust Funds) 3 rd Quarter 2013 Endowment Management Solutions 70/30 Equities/Fixed Income 60/40 Equities/Fixed Income 50/50 Equities/Fixed Income 100/0 Fixed Income
ETF portfolio review, 30th September ETF portfolios with ESG overlay. market overview. portfolio performance
 ETF portfolio review, 30th September 2017 market overview All our ETF portfolios performed better than s in September and all portfolios bar fixed-income continued to add to their gains year-to-date. Our
Sample Custom Account (using SSgA Common Trust Funds) 4th Quarter 2012
 4th Quarter 2012") Sample Custom Account (using SSgA Common Trust Funds) 4th Quarter 2012 Endowment Management Solutions 70/30 Equities/Fixed Income 60/40 Equities/Fixed Income 50/50 Equities/Fixed Income 100/0 Equities/Fixed
Sample Custom Account (using SSgA Common Trust Funds) 4th Quarter 2012 Endowment Management Solutions 70/30 Equities/Fixed Income 60/40 Equities/Fixed Income 50/50 Equities/Fixed Income 100/0 Equities/Fixed
Portfolio Construction Including ETFs: Impressive Opportunities and Clear Benefits
 Portfolio Construction Including ETFs: Impressive Opportunities and Clear Benefits Rohit Mehta Executive Vice-President, Distribution & Strategy First Asset Investment Management, Inc. ETF AUM over the
The Bull Market: Six Years Old And Not Over
 The Bull Market: Six Years Old And Not Over April 22-24, 2015 FOR PROFESSIONAL USE ONLY. FURTHER DISTRIBUTION OF THE INFORMATION CONTAINED HEREIN IS PROHIBITED WITHOUT PRIOR PERMISSION. Disclosures This
MANAGED FUTURES INDEX
 MANAGED FUTURES INDEX COMMENTARY + STRATEGY FACTS JUNE 2018 CUMULATIVE PERFORMANCE ( SINCE JANUARY 2007* ) 120.00% 100.00% 80.00% 60.00% 40.00% 20.00% 0.00% AMFERI BARCLAY BTOP50 CTA INDEX S&P 500 S&P
FAS Monthly Economic & Market Update
 FAS Monthly Economic & Market Update December 2016 As of Nov 30, 2016 Copyright 2016 Financial Advisory Service, Inc. 1 Contents Economic Conditions 3 Market Conditions 4 A Leg-Up for Active Management?.....
Agile Investments ETF PORTFOLIO MANAGEMENT
 Agile Investments ETF PORTFOLIO MANAGEMENT How Agile Is Your Portfolio? Agile Investments is a registered investment advisor that manages diversified portfolios on behalf of our clients. We construct portfolios
Drexel University Retirement Plan
 Drexel University Retirement Plan 23A 7% is the average saving rate at Vanguard. Source: Vanguard, How America Saves 2016. Vanguard recommends saving 12% 15%. Retirement Income Calculator How much
Aiming at a Moving Target Managing inflation risk in target date funds
 Aiming at a Moving Target Managing inflation risk in target date funds Executive Summary This research seeks to help plan sponsors expand their fiduciary understanding and knowledge in providing inflation
Risk-Efficient Investment Portfolios from AlphaSimplex Group. Strategies that put risk management first
 Risk-Efficient Investment Portfolios from AlphaSimplex Group Strategies that put risk management first Agenda About AlphaSimplex Group (ASG) The need for active risk management Introducing the AlphaSimplex
No one asset class perform at all times
 1 No one asset class perform at all times 60 50 Bond years Equity years Gold years 40 30 20 10 0-10 -20 '01 '02 '03 '04 '05 '06 '07 '08 '09 '10 '11 '12 '13 '14 Equity Bonds Gold Triple Asset 2 Past performance
Smart Beta Dashboard. Thoughts at a Glance. June By the SPDR Americas Research Team
 By the SPDR Americas Research Team Thoughts at a Glance Factor performance diverged across regions in Q2. In the US, all factors with the exception of underperformed broad US equities. As volatility in
Supplemental Income 401(k) Plan
 Plan") Supplemental Income 401(k) Plan This document contains important information concerning our retirement plan. The first section provides you with information about the plan in general, including any expenses
Supplemental Income 401(k) Plan This document contains important information concerning our retirement plan. The first section provides you with information about the plan in general, including any expenses
Target Date Strategies THE BENEFITS OF T. ROWE PRICE S TARGET DATE APPROACH
 Target Date Strategies THE BENEFITS OF T. ROWE PRICE S TARGET DATE APPROACH 1-yr 3-yr 5-yr Rolling Periods 10-yr We measured performance over a large number of periods covering the full track record of
KEEPING YOUR FUNDS ON TARGET
 Northern Trust KEEPING YOUR FUNDS ON TARGET INSIDE The details explained What changed and why How investment decisions are made What this means for you BELOW Terms to know CHANGES IN BRIEF During the first
Target Retirement Performance Update
 Target Retirement Update Q1 2017 CIT Strategy Highlights As of March 31, 2017 The State Street Target Retirement Collective Trust Strategies posted quarterly returns ranging from +2.44% (Income Strategy)
BRIGHAM YOUNG UNIVERSITY IDAHO
 BRIGHAM YOUNG UNIVERSITY IDAHO Investment Options Comparative Chart Your plan allows you to direct how your contributions are invested. When making investment decisions, you should keep in mind how long
Integrated Wealth Management. Portfolio management i financial planning i tax services
 Integrated Wealth Management Portfolio management i financial planning i tax services CRITICAL FACTORS FOR LONG TERM SUCCESS 1EMBRACE MARKET PRICING The market is an effective, information-processing machine.
Asset Allocation & Performance
 COMMUNITY FOUNDATION OF GREATER DES MOINES LONG TERM GROWTH Asset Allocation & Performance As of March, 208 Asset Allocation on March, 208 Actual $ Actual (%) Target (%) Equity $68,6,297 62.4 62.8 Fixed
North Carolina Supplemental Retirement Plans First Quarter 403 (b) Performance Review. June 2015
 Performance Review. June 2015") North Carolina Supplemental Retirement Plans First Quarter 403 (b) Performance Review June 2015 Agenda Capital Markets Review First Quarter Performance Appendix Capital Markets Review Performance Summary:
North Carolina Supplemental Retirement Plans First Quarter 403 (b) Performance Review June 2015 Agenda Capital Markets Review First Quarter Performance Appendix Capital Markets Review Performance Summary:
MANAGED FUTURES INDEX
 MANAGED FUTURES INDEX COMMENTARY + STRATEGY FACTS JANUARY 2019 CUMULATIVE PERFORMANCE ( SINCE JANUARY 2007* ) 140.00% 120.00% 100.00% 80.00% 60.00% 40.00% 20.00% 0.00% AMFERI BARCLAY BTOP50 CTA INDEX S&P
The Northern Trust Focus Funds Glidepath Exhibit
 N O R T H E R N T R U S T G L O B A L I N V E S T M E N T S The Northern Trust Focus Funds Glidepath Exhibit northerntrust.com Asset Allocation Framework Our asset allocation framework considers asset
MANAGED FUTURES INDEX
 MANAGED FUTURES INDEX COMMENTARY + STRATEGY FACTS JULY 2018 CUMULATIVE PERFORMANCE ( SINCE JANUARY 2007* ) 120.00% 100.00% 80.00% 60.00% 40.00% 20.00% 0.00% AMFERI BARCLAY BTOP50 CTA INDEX S&P 500 S&P
Fundamentally weighted index strategies: A primer on asset allocation in three core asset classes
 strategies: A primer on asset allocation in three core asset classes 1 2 3 Key takeaways strategies can serve as a complement to traditional cap-weighted index strategies. Combining fundamentally weighted
Diversification and Rebalancing. What the past 40 years have taught us
 Diversification and Rebalancing What the past 40 years have taught us A timely look at two timeless strategies The events of 2008 and early 2009 caused many investors to question some long-held beliefs
Schwab Diversified Growth Allocation Trust Fund
 Fund Facts Trustee Fund Type Charles Schwab Bank Collective Trust Fund Category Global Asset Allocation Benchmark Global Growth Custom Index 1 Unit Class Inception Date 11/21/2012 Fund Inception Date 3/7/2012
Tower Square Investment Management LLC Strategic Aggressive
 Product Type: Multi-Product Portfolio Headquarters: El Segundo, CA Total Staff: 15 Geography Focus: Global Year Founded: 2012 Investment Professionals: 12 Type of Portfolio: Balanced Total AUM: $1,422
Manning & Napier Fund, Inc. Target 2060 Series Class K
 Target 2060 Series Class K Fund Facts Ticker CUSIP MTKKX 56382R779 Inception Date 09/21/2015 Fund Manager Team Approach Investment Minimum* $2,000 Before Fee Waiver 10.50% After Fee Waiver** 1.13% *May
MANAGED FUTURES INDEX
 MANAGED FUTURES INDEX COMMENTARY + STRATEGY FACTS JULY 2017 CUMULATIVE PERFORMANCE ( SINCE JANUARY 2007* ) 120.00% 100.00% 80.00% 60.00% 40.00% 20.00% 0.00% AMFERI BARCLAY BTOP50 CTA INDEX S&P 500 S&P
ZACKS INTERNATIONAL MULTI- ASSET INCOME INDEX (ZAXIH)
") ZACKS INTERNATIONAL MULTI- ASSET INCOME INDEX (ZAXIH) Table of Contents 1. About Zacks 2. Index Summary 3. Index Methodology 3.1. Overview 3.2. Constituent Criteria 3.3. Rebalancing Frequency 4. Index
ZACKS INTERNATIONAL MULTI- ASSET INCOME INDEX (ZAXIH) Table of Contents 1. About Zacks 2. Index Summary 3. Index Methodology 3.1. Overview 3.2. Constituent Criteria 3.3. Rebalancing Frequency 4. Index
Premise Capital 3rd Quarter Investment Commentary
 Premise Capital 3rd Quarter Investment Commentary Premise Investors, Q3 2018 YTD Return Std Dev Return Std Dev BBgBarc US Agg Bond TR USD 0.02 2.84-1.60 3.40 BBgBarc US Treasury US TIPS TR USD -0.82 3.27-0.84
A Case for Dividend Growth Strategies
 RESEARCH Strategy CONTRIBUTORS Tianyin Cheng Director Strategy & ESG Indices tianyin.cheng@spglobal.com Vinit Srivastava Managing Director Strategy & ESG Indices vinit.srivastava@spglobal.com An allocation
DIVERSIFIED PROGRAM COMMENTARY + PORTFOLIO FACTS JULY 2018 INVEST WITH AUSPICE. AUSPICE Capital Advisors
 DIVERSIFIED PROGRAM COMMENTARY + PORTFOLIO FACTS 100% CUMULATIVE PERFORMANCE ( SINCE JANUARY 2007* ) 80% 60% 40% 20% 0% AUSPICE DIVERSIFIED BARCLAY BTOP50 CTA INDEX S&P 500 S&P / TSX 60 Correlation 0.69-0.20-0.11
Diversifying with the Defined Risk Strategy Executive Summary. Marc Odo, CFA, CAIA, CIPM, CFP
 Diversifying with the Defined Risk Strategy Executive Summary Marc Odo, CFA, CAIA, CIPM, CFP EXECUTIVE SUMMARY VERSION 2 This executive summary provides the key takeaways of applying the DRS to additional
Florida United Methodist Foundation Cautious As Of: September 30, 2017
 Cautious Low 0.85% The Cautious Portfolio is designed for a short-term investment horizon and/or risk-averse investor. It seeks a regular and constant income stream, high liquidity and muted volatility.
Target Date Fund Selection: More Than Simply Active vs. Passive
 Target Date Fund Selection: More Than Simply Active vs. Passive May 2018 Not FDIC Insured May Lose Value No Bank Guarantee INVESTMENT MANAGEMENT Table of Contents Executive Summary 2 Introduction 2 Glide
Commercial Real Estate s Correlation to Other Asset Classes June 2015
 Commercial Real Estate s Correlation to Other Asset Classes June 2015 Executive Summary The theory of diversification (Markowitz 1952) suggests that putting all of your eggs in one basket (or asset class)
White. Paper. The Panic-Proof Portfolio A Bear Attack Survival Guide. DiMeo Schneider & Associates, L.L.C. By: Matt Rice, CFA AUGUST 2008
 White Paper The Panic-Proof Portfolio A Bear Attack Survival Guide DiMeo Schneider & Associates, L.L.C. By: Matt Rice, CFA AUGUST 2008 How to Survive a Bear Attack 1. Don t run 2. Drop to ground in fetal
Factual Studies on Managed Futures Interaction with Stocks
 Factual Studies on Managed Futures Interaction with Stocks Trading futures and options involves substantial risk of loss and is not suitable for all investors. The use of the phrase Managed Futures refers
Constructing Investor Benchmarks for Responsible Investors
 Constructing Investor Benchmarks for Responsible Investors JULIA KOCHETYGOVA Senior Director, Product Management RI Asia Conference Tokyo. March 6, 2014 For Financial Professionals. Not for Public Distribution.
2017 MDRT Annual Meeting e-handout Material. Seminars: Your Entryway to Court and Top of the Table
 2017 MDRT Annual Meeting e-handout Material Title: Speaker: Seminars: Your Entryway to Court and Top of the Table James William Johnson Presentation Date: Wednesday, June 7, 2017 Presentation Time: Session
QUARTERLY REVIEW REPORT
 QUARTERLY REVIEW REPORT For the Quarter Ending June 30, 2017 PGR Solutions, LLC 51 E. Campbell Ave., Ste. 124 Campbell CA 95008 (408) 871-1590 www.pgrsolutions.com Quarterly Market Review Second Quarter
MANAGED FUTURES INDEX
 MANAGED FUTURES INDEX COMMENTARY + STRATEGY FACTS JANUARY 2018 CUMULATIVE PERFORMANCE ( SINCE JANUARY 2007* ) 120.00% 100.00% 80.00% 60.00% 40.00% 20.00% 0.00% AMFERI BARCLAY BTOP50 CTA INDEX S&P 500 S&P
What Institutional Investors are Looking for from Hedge Funds. CTA-EXPO Chicago September 2015
 What Institutional Investors are Looking for from Hedge Funds CTA-EXPO Chicago September 2015 let s look briefly at: The role hedge funds are playing in institutional portfolios Why are Institutions adding
Capital Markets Outlook 100 LOWDER BROOK DRIVE SUITE 1100 WESTWOOD MA FAX
 M E K E T A I N V E S T M E N T G R O U P 00 LOWDER BROOK DRIVE SUITE 00 WESTWOOD MA 02090 78 47 3500 FAX 78 47 34 Investors are faced with three primary issues in the near-term: ) historically low bond
FOR 2018 GLOBAL MARKET OUTLOOK PRESS BRIEFING. PROVIDED TO DESIGNATED MEMBERS OF THE PRESS ONLY, NOT FOR FURTHER DISTRIBUTION.
 2018 Global Market Outlook Press Briefing U.S. EQUITIES Ann M. Holcomb, CFA Portfolio Manager November 14, 2017 FOR 2018 GLOBAL MARKET OUTLOOK PRESS BRIEFING. PROVIDED TO DESIGNATED MEMBERS OF THE PRESS
September 30, 2013
 www.cempindex.com September 30, 2013 Compass Efficient Model Portfolios Compass EMP was founded in 1996. Compass EMP has served as consultants to large institutions such as governments, endowments, foundations,
MANAGED FUTURES INDEX
 MANAGED FUTURES INDEX COMMENTARY + STRATEGY FACTS SEPTEMBER 2018 CUMULATIVE PERFORMANCE ( SINCE JANUARY 2007* ) 140.00% 120.00% 100.00% 80.00% 60.00% 40.00% 20.00% 0.00% AMFERI BARCLAY BTOP50 CTA INDEX
KP Retirement Path 2050 Fund: KPRHX. KP Retirement Path 2055 Fund: KPRIX. KP Retirement Path 2060 Fund: KPRJX. KP Large Cap Equity Fund: KPLCX
 The KP Funds KP Retirement Path 2015 Fund: KPRAX KP Retirement Path 2020 Fund: KPRBX KP Retirement Path 2025 Fund: KPRCX KP Retirement Path 2030 Fund: KPRDX KP Retirement Path 2035 Fund: KPREX KP Retirement
North Carolina Supplemental Retirement Plans. Performance Review First Quarter 2017
 North Carolina Supplemental Retirement Plans Performance Review First Quarter 2017 Asset Allocation Summary Current Asset Allocation As of March 31, 2017 Prior Period Asset Allocation As of December 31,