Building and Managing a Diversified Portfolio
|
|
|
- Brook Hudson
- 6 years ago
- Views:
Transcription
1 Building and Managing a Diversified Portfolio Craig L. Israelsen, Ph.D. Designer of the Portfolio Presentation AAII Silicon Valley Chapter April 14, 2018 Based on research by Craig L. Israelsen, Ph.D. Performance as of December 31,
2 In 1970 you started investing: For 48 years you invested money into In Jan 2018 your account balance was (you saved 10% of your income each year) Bucket in your room earning 0% interest $365,429 Savings account ( Cash ) 7-Asset Diversified Portfolio of Stock, Bonds, Cash, Real Estate, Commodities $35,000 starting salary in 1970, 3% annual increase over 48 years 2
3 In 1970 you started investing: For 48 years you invested money into In Jan 2018 your account balance was (you saved 10% of your income each year) Bucket in your room earning 0% interest $365,429 Savings account ( Cash ) $823,677 7-Asset Diversified Portfolio of Stock, Bonds, Cash, Real Estate, Commodities $35,000 starting salary in 1970, 3% annual increase over 48 years 3
4 In 1970 you started investing: For 48 years you invested money into In Jan 2018 your account balance was (you saved 10% of your income each year) Bucket in your room earning 0% interest $365,429 Savings account ( Cash ) $823,677 7-Asset Diversified Portfolio of Stock, Bonds, Cash, Real Estate, Commodities $4,018,504 $35,000 starting salary in 1970, 3% annual increase over 48 years 4
5 What s in a diversified portfolio? 5

6 Building an investment portfolio is like making salsa we add different ingredients together. 6
7 Large US Stock Minimal Diversification The S&P 500 Index
8 Two-Asset Diversification 60/40 Portfolio Large US Stock US Bonds
9 Diversified Portfolio 7-Asset Portfolio Large US Stock Developed Non-US Stock Real Estate US Bonds Cash Commodities Small Cap US Stock
10 In 1970 you started investing: For 48 years you invested money into In Jan 2018 your account balance was (you saved 10% of your income each year) Bucket in your room earning 0% interest $365,429 Savings account ( Cash ) $823,677 7-Asset Diversified Portfolio of Stock, Bonds, Cash, Real Estate, Commodities $4,018,504 $35,000 starting salary in 1970, 3% annual increase over 48 years 10

11 Multi-Asset Portfolio 7 Asset Classes Equally Weighted Rebalanced Annually US Cash Large Cap US Equity Small Cap US Equity Non-US Equity US Bonds Real Estate Commodities 11
12 Why invest in a diversified, multi-asset portfolio? Because we don t know the future. If we did, we would certainly NEVER diversify. (The real answer) 12
13 Why invest in a diversified, multi-asset portfolio? Because we don t know the future. If we did, we would certainly NEVER diversify. (The real answer) 13
14 Why invest in a diversified, multi-asset portfolio? To achieve equity-like returns with less volatility than an all-equity portfolio (The technical answer) 14
15 Multi-Asset Portfolio Equity-like return Large US Equity Small US Equity Non-US Equity US Bonds Cash Real Estate Commodities Equally Weighted 7-Asset Portfolio 48-Year Average Annualized % Return 48-Year Standard Deviation of Annual Returns Number of Years with Negative Returns Worst Three-Year Cumulative % Return (37.61) (42.24) (43.32) (35.61) (55.60) (13.37) 15
16 Multi-Asset Portfolio Lower volatility Large US Equity Small US Equity Non-US Equity US Bonds Cash Real Estate Commodities Equally Weighted 7-Asset Portfolio 48-Year Average Annualized % Return 48-Year Standard Deviation of Annual Returns Number of Years with Negative Returns Worst Three-Year Cumulative % Return (37.61) (42.24) (43.32) (35.61) (55.60) (13.37) 16
17 Multi-Asset Portfolio Fewer and smaller losses Large US Equity Small US Equity Non-US Equity US Bonds Cash Real Estate Commodities Equally Weighted 7-Asset Portfolio 48-Year Average Annualized % Return 48-Year Standard Deviation of Annual Returns Number of Years with Negative Returns Worst Three-Year Cumulative % Return (37.61) (42.24) (43.32) (35.61) (55.60) (13.37) 17
18 Indexes Used in Performance Calculations (Indexes have no cost, but all mutual funds and ETFs have annual expenses) Data Source: Steele Mutual Fund Expert Large-cap US equity represented by the S&P 500 Index. Small-cap US equity represented by the Ibbotson Small Companies Index from , and the Russell 2000 Index starting in Non-US equity represented by the MSCI EAFE Index. Real estate represented by the NAREIT Index from and the Dow Jones US Select REIT Index starting in (1970 and 1971 returns from research by Chan, Erickson, and Wang in Real Estate Investment Trusts: Structure, Performance, and Investment Opportunities, Table 2.2) Commodities represented by the Goldman Sachs Commodities Index (GSCI). As of February 6, 2007, the GSCI became the S&P GSCI Commodity Index. U.S. Aggregate Bonds represented by the Ibbotson Intermediate Term Bond Index from and the Barclays Capital Aggregate Bond index starting in Cash represented by 3-month Treasury Bills. 18
19 Will a diversified, multi-asset portfolio always win? No. 19
20 20 (50) (40) (30) (20) (10) Annual Returns for Multi-Asset Portfolio 48-year Period:
21 50 Annual Returns for Multi-Asset Portfolio vs. S&P 500 Index 48-year Period: (10) (20) (30) (40) (50) Multi-Asset Portfolio Annualized Return = 9.84% S&P 500 Index Annualized Return = 10.54%
22 50 Annual Returns for Multi-Asset Portfolio vs. S&P 500 Index 48-year Period: (10) (20) (30) (40) (50) Multi-asset portfolio delivers similar performance with 40% less risk
23 The Impact of Annual Portfolio Costs The annual expense ratio of the funds in your portfolio represents an on-going annual cost. Recall that raw indexes have no cost, but actual funds do. 23
24 The impact of annual portfolio costs: For 48 years you invested money into Bucket in your room earning 0% interest Savings account ( Cash ) 7-Asset Diversified Portfolio of Stock, Bonds, Cash, Real Estate, Commodities No portfolio cost $365,429 $823,677 $4,018,504 In Jan 2018 your account balance was (you saved 10% of your income each year) $35,000 starting salary in 1970, 3% annual increase over 48 years 24
25 The impact of annual portfolio costs: For 48 years you invested money into Bucket in your room earning 0% interest Savings account ( Cash ) 7-Asset Diversified Portfolio of Stock, Bonds, Cash, Real Estate, Commodities No portfolio cost In Jan 2018 your account balance was (you saved 10% of your income each year) 50 basis points $365,429 $365,429 $823,677 $716,026 $4,018,504 $3,388,114 $35,000 starting salary in 1970, 3% annual increase over 48 years 25
26 The impact of annual portfolio costs: For 48 years you invested money into Bucket in your room earning 0% interest Savings account ( Cash ) 7-Asset Diversified Portfolio of Stock, Bonds, Cash, Real Estate, Commodities In Jan 2018 your account balance was (you saved 10% of your income each year) No portfolio cost 50 basis points 100 basis points $365,429 $365,429 $365,429 $823,677 $716,026 $625,029 $4,018,504 $3,388,114 $2,861,645 Over $526,000 lost by paying 100 bps compared to 50 bps $35,000 starting salary in 1970, 3% annual increase over 48 years 26
27 $1,000,000 starting balance in retirement portfolio Combinations of fund expenses and advisory fee Total Portfolio Cost (aggregate expense ratio of funds and advisory fee) Average Annual Withdrawal from a Retirement Portfolio between the ages of 70 to 95* (using RMD guidelines) Increase in Monthly Retirement Income for Retiree Total fund expenses of 100 bps Advisory Fee of 100 bps 200 bps $124,
28 $1,000,000 starting balance in retirement portfolio Combinations of fund expenses and advisory fee Total Portfolio Cost (aggregate expense ratio of funds and advisory fee) Average Annual Withdrawal from a Retirement Portfolio between the ages of 70 to 95* (using RMD guidelines) Increase in Monthly Retirement Income for Retiree Total fund expenses of 100 bps Advisory Fee of 100 bps 200 bps $124, Total fund expenses of 50 bps Advisory Fee of 100 bps 150 bps $133,927 $800
29 $1,000,000 starting balance in retirement portfolio Combinations of fund expenses and advisory fee Total Portfolio Cost (aggregate expense ratio of funds and advisory fee) Average Annual Withdrawal from a Retirement Portfolio between the ages of 70 to 95* (using RMD guidelines) Increase in Monthly Retirement Income for Retiree Total fund expenses of 100 bps Advisory Fee of 100 bps 200 bps $124, Total fund expenses of 50 bps Advisory Fee of 100 bps 150 bps $133,927 $800 Total fund expenses of 10 bps Advisory Fee of 90 bps 100 bps $144,361 $1,670
30 $1,000,000 starting balance in retirement portfolio Combinations of fund expenses and advisory fee Total Portfolio Cost (aggregate expense ratio of funds and advisory fee) Average Annual Withdrawal from a Retirement Portfolio between the ages of 70 to 95* (using RMD guidelines) Increase in Monthly Retirement Income for Retiree Total fund expenses of 100 bps Advisory Fee of 100 bps 200 bps $124, Total fund expenses of 50 bps Advisory Fee of 100 bps 150 bps $133,927 $800 Total fund expenses of 10 bps Advisory Fee of 90 bps 100 bps $144,361 $1,670 Total Fund expenses of 10 bps Advisory fee of 40 bps 50 bps $155,695 $2,614
31 Moving from 7 assets to Twelve assets 31
32 Good Diversification 7-Asset Portfolio Large US Stock Developed Non-US Stock Real Estate US Bonds Cash Commodities Small Cap US Stock 32
33 Superior Diversification 12-Asset Portfolio Large US Stock Developed Non-US Stock Real Estate Natural Resources US Bonds Non-US Bonds Cash Midcap US Stock Emerging Non-US Stock Commodities Inflation Protected Bonds Small Cap US Stock 33
34 7Twelve 7 Core Asset Classes Twelve Actual Holdings US Stock Non-US Stock Real Estate Resources US Bonds Non-US Bonds Cash Large US Stock Developed Non-US Stock Real Estate Natural Resources US Bonds Non-US Bonds Cash Midcap US Stock Emerging Non-US Stock Commodities Inflation Protected Bonds Small Cap US Stock 7Twelve Portfolio performance history is from 1998-present. TIPS history is the limiting factor. 34

35 7Twelve Equally-weighted exposure to 12 asset classes International Bonds 8.33% TIPS 8.33% Cash 8.33% Large US Stock 8.33% Mid Cap US Stock 8.33% Small US Stock 8.33% US Bonds 8.33% Non-US Stock 8.33% Commodities 8.33% Natural Resources 8.33% Real Estate 8.33% Emerging Markets 8.33% 35
36 20-Year Growth of $10, [ Using Indexes ] $42,000 $40,000 $38,000 $36,000 $34,000 US Large Cap Stock (VFINX) $39,372 60/40 Portfolio (VBINX) $36,602 7-Asset Portfolio, $37,161 Index-Based 7Twelve, $41,201 $32,000 $30, Year Standard Deviation 36
![20-Year Growth of $10,000 1998-2017 [----------------Using ETFs-----------------] $42,000 $40,000 $38,000 $36,000 $34,000 US Large Cap Stock (VFINX)](/docs-images/76/74451522/images/37-0.jpg "$39,372 60/40 Portfolio (VBINX) $36,602 7-Asset Portfolio, $36,658 Passive ETF 7Twelve, $40,714 $32,000 $30,000 17.9 10.6 10.7 11.")
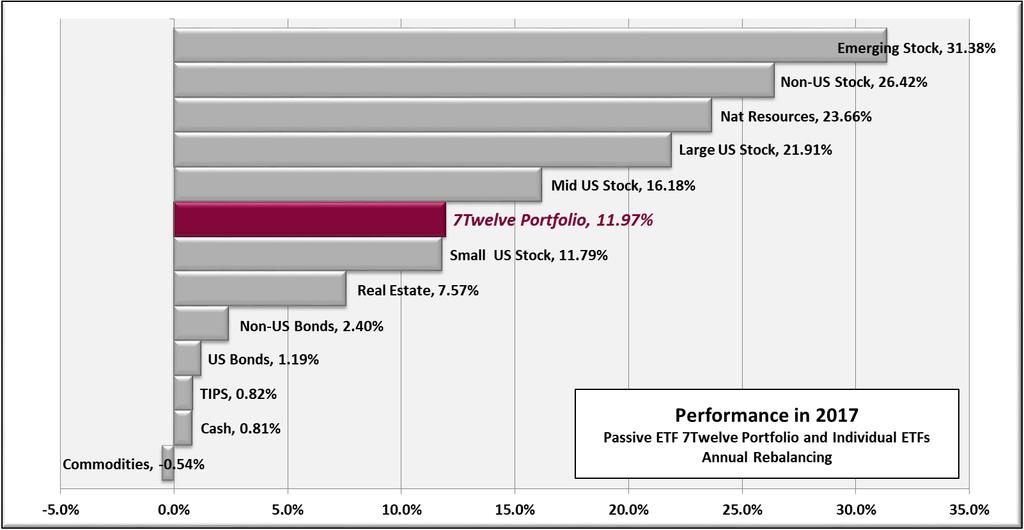
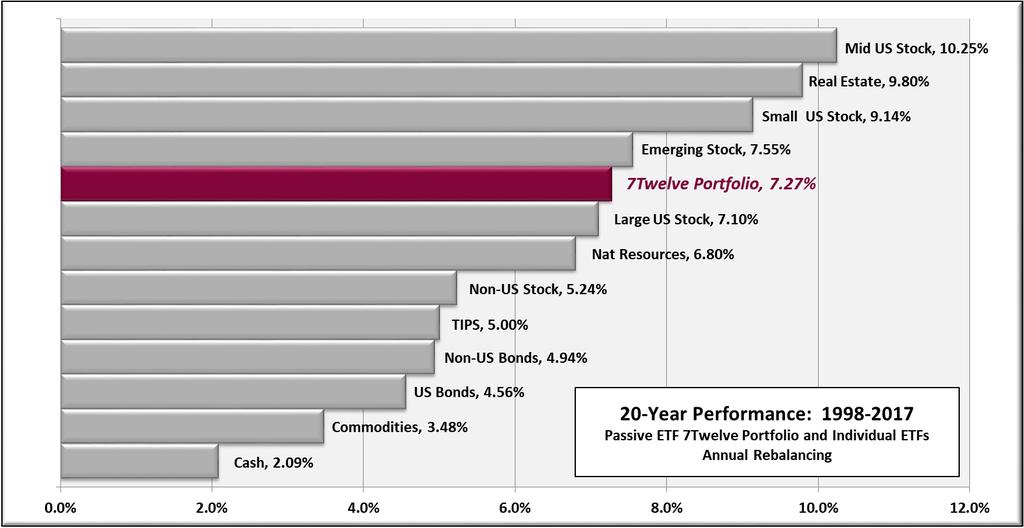
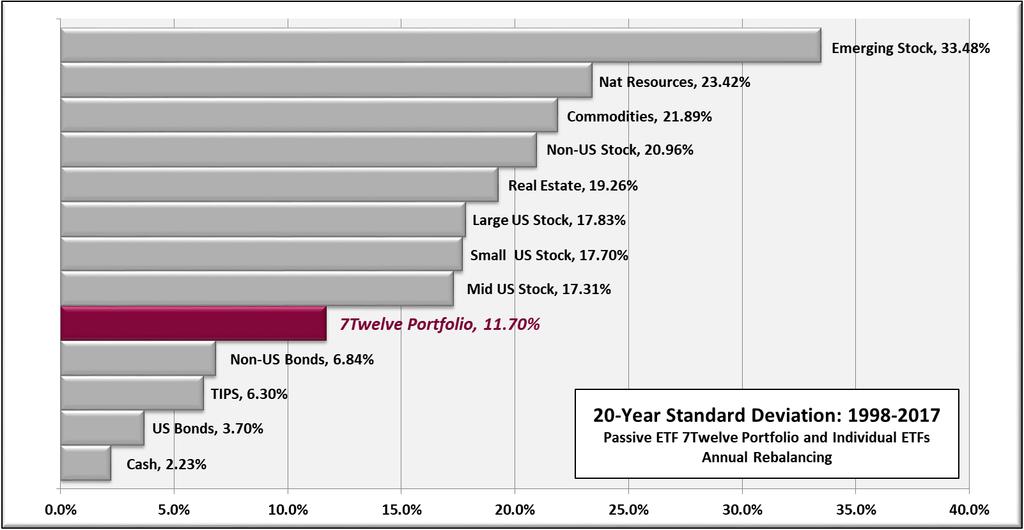
37 20-Year Growth of $10, [ Using ETFs ] $42,000 $40,000 $38,000 $36,000 $34,000 US Large Cap Stock (VFINX) $39,372 60/40 Portfolio (VBINX) $36,602 7-Asset Portfolio, $36,658 Passive ETF 7Twelve, $40,714 $32,000 $30, Year Standard Deviation 37
38 Asset Classes Take Turns Being the Star (in Indexes in the 7Twelve Portfolio ) Don t chase them! Year Large US Stock Midcap US Stock Small Cap US Stock Developed Non-US Stock Emerging Non-US Stock Real Estate Natural Resources Commodities US Bonds TIPS Non-US Bonds Cash 7Twelve Portfolio Equal Allocation to all 12. Annual rebalance Year Ave Annualized % Return 9.92% 12.00% 12.27% 8.11% 12.68% 10.15% 8.74% 3.81% 4.15% 4.43% 4.02% 1.20% 8.46% 15-Year Std Dev of Annual Returns 16.35% 18.37% 18.23% 20.50% 32.61% 22.23% 24.37% 21.29% 2.56% 5.96% 6.18% 1.64% 12.99% 38
39 Stop Chasing Performance Passive ETF 7Twelve Portfolio with annual rebalancing Investment Approach HARE: Performance Chasing by Investing 100% in Last Year s BEST ETF 15-Year Annualized Performance ( ) 4.59 HARE II: Performance Chasing by Investing 100% in Last Year s WORST ETF TORTOISE: Invest in the equally weighted 12-asset 7Twelve ETF model 39
40 Stop Chasing Performance Passive ETF 7Twelve Portfolio with annual rebalancing Investment Approach HARE: Performance Chasing by Investing 100% in Last Year s BEST ETF 15-Year Annualized Performance ( ) 4.59 HARE II: Performance Chasing by Investing 100% in Last Year s WORST ETF 5.44 TORTOISE: Invest in the equally weighted 12-asset 7Twelve ETF model 40
41 Stop Chasing Performance Passive ETF 7Twelve Portfolio with annual rebalancing Investment Approach HARE: Performance Chasing by Investing 100% in Last Year s BEST ETF 15-Year Annualized Performance ( ) 4.59 HARE II: Performance Chasing by Investing 100% in Last Year s WORST ETF 5.44 TORTOISE: Invest in the equally weighted 12-asset 7Twelve ETF model
42 Stop Chasing Performance Passive ETF 7Twelve Portfolio with annual rebalancing Investment Approach 15-Year Annualized Performance ( ) 20-Year Annualized Performance ( ) HARE: Performance Chasing by Investing 100% in Last Year s BEST ETF HARE II: Performance Chasing by Investing 100% in Last Year s WORST ETF TORTOISE: Invest in the equally weighted 12-asset 7Twelve ETF model
43 Retirement Portfolio Survival Test The Withdrawal Phase During Retirement 43
44 Assumptions 5% initial withdrawal rate 3% annual cost of living (COLA) increase in withdrawal Analysis Ending Balance After 20 Years as of Dec 31, Twelve Portfolio cannot be evaluated prior to 1998 as some ingredients do not have performance history prior to that. 44

45 Risk Level Very Conservative Retirement Portfolio Survival Analysis 20-Year Period from Asset Allocation Models 20-Year Annualized IRR (%) Remaining Balance After 20-Years Starting balance of $250,000 Total Withdrawal of $335, % Cash ,054 Conservative Moderate Moderate 50% Cash 50% Bonds 60% US Stock 40% Bonds Diversified ETF- Based 7Twelve Portfolio , , ,565 Aggressive 100% US Stock ,847 45
46 Risk Level Very Conservative Retirement Portfolio Survival Analysis 20-Year Period from Asset Allocation Models 20-Year Annualized IRR (%) Remaining Balance After 20-Years Starting balance of $250,000 Total Withdrawal of $335,880 Remaining Balance After 20-Years Starting balance of $500,000 Total Withdrawal of $671, % Cash ,054 18,108 Conservative Moderate Moderate 50% Cash 50% Bonds 60% US Stock 40% Bonds Diversified ETF- Based 7Twelve Portfolio , , , , , ,131 Aggressive 100% US Stock , ,694 46
47 Risk Level Very Conservative Retirement Portfolio Survival Analysis 20-Year Period from Asset Allocation Models 20-Year Annualized IRR (%) Remaining Balance After 20-Years Starting balance of $250,000 Total Withdrawal of $335,880 Remaining Balance After 20-Years Starting balance of $500,000 Total Withdrawal of $671,760 Remaining Balance After 20-Years Starting balance of $1,000,000 Total Withdrawal of $1,343, % Cash ,054 18,108 36,215 Conservative Moderate Moderate 50% Cash 50% Bonds 60% US Stock 40% Bonds Diversified ETF- Based 7Twelve Portfolio , , , , , , , ,131 1,498,261 Aggressive 100% US Stock , , ,388 47
48 A Primer on the Efficient Frontier 48
49 RETURN 8 Add Commodities Add REIT Add Emerging Stock 7 6 Add US Smallcap Stock Add Midcap US Stock Add Large Cap US Stock Add Developed Intl Stock Add Natural Resources 100% Large Cap US Stock 5 4 Add Intl Bonds Add TIPS 50% Cash 50% Large Cap US Stock Add Bonds % Cash 90% Cash 10% Large Cap US Stock RISK 49
50 20-Year Average Annualized Return as of Dec 31, Year Standard Deviation of Annual Returns as of Dec 31,
51 20-Year Average Annualized Return as of Dec 31, % Large Cap US Stock % Cash 50% Large Cap US Stock % Cash Year Standard Deviation of Annual Returns as of Dec 31,
52 20-Year Average Annualized Return as of Dec 31, % Large Cap US Stock % Cash 50% Large Cap US Stock % Cash Year Standard Deviation of Annual Returns as of Dec 31,
53 20-Year Average Annualized Return as of Dec 31, % Large Cap US Stock % Cash 50% Large Cap US Stock % Cash Year Standard Deviation of Annual Returns as of Dec 31,
54 20-Year Average Annualized Return as of Dec 31, % Large Cap US Stock % Cash 50% Large Cap US Stock % Cash 90% Cash 10% Large Cap US Stock Year Standard Deviation of Annual Returns as of Dec 31,
55 20-Year Average Annualized Return as of Dec 31, % Large Cap US Stock % Cash 50% Large Cap US Stock % Cash 90% Cash 10% Large Cap US Stock Year Standard Deviation of Annual Returns as of Dec 31,
56 20-Year Average Annualized Return as of Dec 31, % Large Cap US Stock % Cash 50% Large Cap US Stock % Cash 90% Cash 10% Large Cap US Stock Year Standard Deviation of Annual Returns as of Dec 31,
57 20-Year Average Annualized Return as of Dec 31, % Large Cap US Stock % Cash 50% Large Cap US Stock % Cash 90% Cash 10% Large Cap US Stock Year Standard Deviation of Annual Returns as of Dec 31,
58 20-Year Average Annualized Return as of Dec 31, More return than cash % Large Cap US Stock % Cash 50% Large Cap US Stock 3 More risk than cash % Cash 90% Cash 10% Large Cap US Stock Year Standard Deviation of Annual Returns as of Dec 31,
59 20-Year Average Annualized Return as of Dec 31, Classic 2-asset Efficient Frontier: Cash and US Large Stock 6 100% Large Cap US Stock % Cash 50% Large Cap US Stock % Cash 90% Cash 10% Large Cap US Stock Year Standard Deviation of Annual Returns as of Dec 31,
60 Let s explore the Multi-Asset Effective Frontier
61 12 Asset Classes Index used in this analysis 20-Year Standard Deviation of Annual Returns Year Average Annualized Return Cash USTREAS Stat US T-Bill 90 Day 2.06% 1.92% US Bonds Barclays US Aggregate Bond Index 3.50% 4.98% TIPS Barclays U.S. Treasury US TIPS Index 6.11% 5.48% Non-US Bonds Barclays Global Treasury Index 7.32% 4.39% Small Cap stock S&P Small Cap 600 Index 17.17% 9.73% Midcap stock S&P Midcap 400 Index 17.35% 10.58% Large cap stock S&P 500 Index 17.89% 7.20% REIT S&P Global REIT Index 20.30% 8.88% Developed Non-US stock MSCI EAFE Index NR 21.02% 5.25% Commodities Deutsche Bank Liquid Commodity Optimum Yield Diversified Commodity Index Total Return 22.28% 3.94% Natural Resources S&P North American Natural Resources Index 23.42% 6.09% Emerging stock MSCI EM Index GR 34.06% 8.10% We will now build a 12-asset portfolio in order of standard deviation (lowest to highest)
62 20-Year Average Annualized Return as of Dec 31, Add Commodities Add REIT Add Emerging Stock 7 6 Add US Smallcap Stock Add Midcap US Stock Add Large Cap US Stock Add Developed Intl Stock Add Natural Resources 100% Large Cap US Stock 5 Add Intl Bonds 4 Add TIPS Add Bonds % Cash 1 Start by adding US bonds to cash forming a 50% cash/50% bond portfolio Year Standard Deviation of Annual Returns as of Dec 31,
63 20-Year Average Annualized Return as of Dec 31, Add Commodities Add REIT Add Emerging Stock 7 6 Add US Smallcap Stock Add Midcap US Stock Add Large Cap US Stock Add Developed Intl Stock Add Natural Resources 100% Large Cap US Stock 5 Add Intl Bonds 4 Add TIPS Add Bonds % Cash 1 Next, TIPS are added. Now we have 1/3 cash, 1/3 bonds, and 1/3 TIPS Year Standard Deviation of Annual Returns as of Dec 31,
64 20-Year Average Annualized Return as of Dec 31, Add Commodities Add REIT Add Emerging Stock 7 6 Add US Smallcap Stock Add Midcap US Stock Add Large Cap US Stock Add Developed Intl Stock Add Natural Resources 100% Large Cap US Stock 5 Add Intl Bonds 4 Add TIPS Add Bonds % Cash 1 Non-US bonds are added. Four asset classes 25% in each Year Standard Deviation of Annual Returns as of Dec 31,
65 20-Year Average Annualized Return as of Dec 31, Add Commodities Add REIT Add Emerging Stock 7 6 Add US Smallcap Stock Add Midcap US Stock Add Large Cap US Stock Add Developed Intl Stock Add Natural Resources 100% Large Cap US Stock 5 Add Intl Bonds 4 Add TIPS Add Bonds % Cash 1 Small Cap US stock added. Five asset classes 20% in each Year Standard Deviation of Annual Returns as of Dec 31,
66 20-Year Average Annualized Return as of Dec 31, Add Commodities Add REIT Add Emerging Stock 7 6 Add US Smallcap Stock Add Midcap US Stock Add Large Cap US Stock Add Developed Intl Stock Add Natural Resources 100% Large Cap US Stock 5 Add Intl Bonds 4 Add TIPS 3 Add Bonds Remaining asset classes added. 12 asset classes in total with 8.33% in each % Cash Year Standard Deviation of Annual Returns as of Dec 31,
67 20-Year Average Annualized Return as of Dec 31, Add Commodities Add REIT 7Twelve Portfolio 7 6 Add US Smallcap Stock Add Midcap US Stock Add Large Cap US Stock Add Developed Intl Stock Add Natural Resources 100% Large Cap US Stock 5 Add Intl Bonds 4 Add TIPS Add Bonds % Cash Year Standard Deviation of Annual Returns as of Dec 31,
68 20-Year Average Annualized Return as of Dec 31, Add US Smallcap Stock Add Midcap US Stock Add Commodities Add REIT Add Large Cap US Stock Add Developed Intl Stock 7Twelve Portfolio 34% less risk Add Natural Resources 100% Large Cap US Stock 5 Add Intl Bonds 4 Add TIPS Add Bonds % Cash Year Standard Deviation of Annual Returns as of Dec 31,
69 69
70 70
71 71
72 7Twelve Eight Equity and Diversifying Holdings The Engines of the Portfolio US Stock Non-US Stock Real Estate Resources US Bonds Non-US Bonds Cash Large US Stock Developed Non-US Stock Real Estate Natural Resources US Bonds Non-US Bonds Cash Midcap US Stock Emerging Non-US Stock Commodities Inflation Protected Bonds Small Cap US Stock 72
73 7Twelve Four Fixed Income Holdings The Safety Brakes of the Portfolio US Stock Non-US Stock Real Estate Resources US Bonds Non-US Bonds Cash Large US Stock Developed Non-US Stock Real Estate Natural Resources US Bonds Non-US Bonds Cash Midcap US Stock Emerging Non-US Stock Commodities Inflation Protected Bonds Small Cap US Stock 73
74 Year 7Twelve Brakes (4 ETFs) 7Twelve Engines (8 ETFs) (1.85) (5.30) (6.96) (38.98) (4.59) (3.61) (7.85) Year Ave. Annualized Return Year Standard Deviation
75 Year 7Twelve Brakes (4 ETFs) 7Twelve Engines (8 ETFs) (1.85) (5.30) (6.96) (38.98) (4.59) (3.61) (7.85) Year Ave. Annualized Return Year Standard Deviation Brakes have outperformed 35% of the time 75
76 Year 7Twelve Brakes (4 ETFs) 7Twelve Engines (8 ETFs) (1.85) (5.30) (6.96) (38.98) (4.59) (3.61) (7.85) Year Ave. Annualized Return Year Standard Deviation Brakes have outperformed 35% of the time Engines have outperformed 65% of the time 76

77 7Twelve A Multi-Asset Balanced Strategy Equities and Diversifiers: 8 ENGINES 65% of Overall Portfolio Allocation Fixed Income: 4 BRAKES 35% of Overall Portfolio Allocation US Stock Non-US Stock Real Estate Resources US Bonds Non-US Bonds Cash Large US Stock Developed Non-US Stock Real Estate Natural Resources US Bonds Non-US Bonds Cash Midcap US Stock Emerging Non-US Stock Commodities Inflation Protected Bonds Small Cap US Stock 77
78 Year 7Twelve Brakes (4 ETFs) 7Twelve Engines (8 ETFs) Full 7Twelve Model (12 ETFs) (1.85) (5.30) (1.94) (6.96) (0.64) (38.98) (25.16) (4.59) (1.00) (3.61) (7.85) (5.07) Year Ave. Annualized Return Year Standard Deviation Full 7Twelve model delivers 88% of the performance of the engines with only 66% of the risk thanks to the brakes. Just like your car, 7Twelve maintains a constant commitment to engines AND brakes. 78
79 7Twelve Age-Based Models Portfolio Allocations 7Twelve Core Model 7Twelve Age-Based Twelve Age-Based Twelve Age-Based 70+ Large US Stock 8.33% 6.67% 5.00% 3.33% Mid Cap US Stock 8.33% 6.67% 5.00% 3.33% Small US Stock 8.33% 6.67% 5.00% 3.33% Non-US Stock 8.33% 6.67% 5.00% 3.33% Emerging Markets 8.33% 6.67% 5.00% 3.33% Real Estate 8.33% 6.67% 5.00% 3.33% Natural Resources 8.33% 6.67% 5.00% 3.33% Commodities 8.33% 6.67% 5.00% 3.33% US Bonds 8.33% 6.67% 5.00% 3.33% Inflation Protected Bonds 8.33% 6.67% 5.00% 3.33% International Bonds 8.33% 6.67% 5.00% 3.33% Cash 8.33% 26.67% 45.00% 63.33% 79

80 7Twelve Growth of $10,000 over 20 Years from Core 7Twelve model and Age-Based Models -8.40% % % % Performance in

81 20-Year Retirement Portfolio Analysis: $250,000 Initial Account Value on Jan 1, 1998 in Passive ETF 7Twelve Models 5% Initial Withdrawal 3% Annual Increase in Annual Withdrawal Total Withdrawal of $335,880 81

82 7Twelve Rebalancing Comparison as of Dec 31, 2017 using Passive ETF 7Twelve Model Annualized Return as of December 31,
83 7Twelve Passive ETF 7Twelve model Rebalancing Frequency 20-Year Annualized Return No Rebalancing Monthly Rebalancing Quarterly Rebalancing Semi-annual Rebalancing Annual Rebalancing
84 Low-Cost 7Twelve Models 12-Asset Class 7Twelve Portfolio 12 Actively Managed Mutual Funds (Active 7Twelve) 12 ETFs from various fund families (Passive 7Twelve) 12 Vanguard Mutual Funds 12 Vanguard ETFs 12 Fidelity Mutual funds 12 ETFs available at Schwab Portfolio Aggregate Annual Expense Ratio
85 Low-Cost 7Twelve Models 12-Asset Class 7Twelve Portfolio 12 Actively Managed Mutual Funds (Active 7Twelve) 12 ETFs from various fund families (Passive 7Twelve) 12 Vanguard Mutual Funds 12 Vanguard ETFs 12 Fidelity Mutual funds 12 ETFs available at Schwab Portfolio Aggregate Annual Expense Ratio Year Average Annualized Return ( ) Research reports available that outline the funds used to build each of these 7Twelve models
86 Disclosures Performance in the past is not a guarantee of performance in the future. Raw data source: Steele Mutual Fund Expert Calculations: Craig Israelsen, Ph.D. Performance of the individual ETFs and the Passive ETF 7Twelve Portfolio in the prior slides in this section generally reflects the performance of the following indexes. The actual performance of the indexes below is shown on the following slide. US Large cap US Mid Cap US Small Cap Non-US Developed Emerging Real Estate Natural Resources Commodities US Bonds TIPS Non-US Bonds Cash S&P 500 Index (TR) S&P Midcap 400 Index (TR) S&P Small Cap 600 Index (TR) MSCI EAFE Index NR USD MSCI EM Index GR USD S&P Global REIT Index TR USD S&P North American Natural Resources Index TR Deutsche Bank Liquid Commodity Optimum Yield Diversified Commodity Index Total Return Barclays US Aggregate Bond Index TR USD Barclays U.S. Treasury US TIPS Index TR USD Barclays Global Treasury Index TR USTREAS Stat US T-Bill 90 Day TR 86
87 The 7Twelve Portfolio Craig L. Israelsen, Ph.D. Web: 87
2015 MDRT Annual Meeting e Handout Material
 2015 MDRT Annual Meeting e Handout Material Title: Speaker: Diversified to the CORE: A Better Starting Point Craig L. Israelsen, Ph.D. Presentation Date: Tuesday, June 16, 2015 3:30 5:00 p.m. The Million
Building and Managing a Diversified Retirement Portfolio
 Building and Managing a Diversified Retirement Portfolio AAII Sarasota Craig L. Israelsen, Ph.D. 7Twelve Portfolio February 18, 2016 www.7twelveportfolio.com Key Concepts Retirement Account Multiple (or
Portfolio The Benefits of Low Correlation
 The 7Twelve Portfolio The Benefits of Low Correlation Craig L. Israelsen, Ph.D. Brigham Young University www.7twelveportfolio TwelvePortfolio.com 41 slides 1 This document is a research report presenting
Inflation and Asset Performance: A Review of the Past 48 Years
 Inflation and Asset Performance: A Review of the Past 48 Years Mar 1, 2018 / By Craig L. Israelsen, PhD This is a tale of two time periods: 24 years with high inflation and 24 with low inflation. We examine
7Twelve. A Multi-Asset Balanced Portfolio. Craig L. Israelsen, Ph.D. 7Twelve. 7 Broad Asset Categories, 12 Funds
 7Twelve A Multi-Asset Balanced Portfolio www.7twelveportfolio.com Craig L. Israelsen, Ph.D. 7Twelve 7 Broad Asset Categories, 12 Funds Eight Equity and Diversifying Funds 65% of Overall Portfolio Allocation
A Better Balanced Benchmark Craig L. Israelsen, Ph.D. March 24, 2009
 A Better Balanced Benchmark Craig L. Israelsen, Ph.D. March 24, 2009 It s time for a better benchmark for Balanced funds. Way back when, there were two dominant investment assets: US stock and US bonds.
Premise Capital 3rd Quarter Investment Commentary
 Premise Capital 3rd Quarter Investment Commentary Premise Investors, Q3 2018 YTD Return Std Dev Return Std Dev BBgBarc US Agg Bond TR USD 0.02 2.84-1.60 3.40 BBgBarc US Treasury US TIPS TR USD -0.82 3.27-0.84
RBC Strategic Asset Allocation Models
 Page 1 of 7 United States Traditional Fixed Income Only Last updated: March 218 Fixed Income Only The focus is capital preservation. The portfolio is only invested in fixed income asset classes. The investor
Actively Passive or Passively Active?
 Actively Passive or Passively Active? May 18, 2010 by Craig L. Israelsen, Ph.D. Advisor Perspectives welcomes guest contributions. The views presented here do not necessarily represent those of Advisor
A data-driven look at the power of diversification
 A data-driven look at the power of diversification Renowned asset allocation expert Craig L. Israelsen, a Financial Planning contributing writer, explores how diversification can mitigate portfolio risk
RBC Strategic Asset Allocation Models
 Page 1 of United States Core Very conservative Last updated: April 17 Risk Profile 1 The focus is capital preservation. The portfolio will typically be invested mainly in fixed income and other low volatility
TEL FAX cookstreetconsulting.com
 TEL 303.333.7770 1.800.318.7770 FAX 303.333.7771 cookstreetconsulting.com Contents 1 Market Review 2 Plan Overview 3 Investment Due Diligence Appendix Appendix 3 1 Market Review 5 Q2 2017 Economic Review
Florida United Methodist Foundation Cautious As Of: September 30, 2017
 Cautious Low 0.85% The Cautious Portfolio is designed for a short-term investment horizon and/or risk-averse investor. It seeks a regular and constant income stream, high liquidity and muted volatility.
Schwab Intelligent Portfolios. Investing has changed forever.
 Schwab Intelligent Portfolios. Investing has changed forever. Technology that will change the way you invest. Schwab Intelligent Portfolios is an automated investment advisory service that builds, monitors,
INVESTMENT PLAN. Sample Client. For. May 04, Prepared by : Sample Advisor Financial Consultant.
 INVESTMENT PLAN For Sample Client May 04, 2012 Prepared by : Sample Advisor Financial Consultant sadvisor@loringward.com Materials provided to approved advisors by LWI Financial Inc., ( Loring Ward ).
Schwab Diversified Growth Allocation Trust Fund (Closed to new investors) Institutional Unit Class As of June 30, 2017
 Institutional Unit Class As of June 30, 2017") Fund Facts Trustee Fund Type Charles Schwab Bank Collective Trust Fund Morningstar Category Allocation - 50-70% Equity Benchmark Global Growth Custom Index 1 Unit Class Inception Date 3/7/2012 Fund Inception
Fund Facts Trustee Fund Type Charles Schwab Bank Collective Trust Fund Morningstar Category Allocation - 50-70% Equity Benchmark Global Growth Custom Index 1 Unit Class Inception Date 3/7/2012 Fund Inception
Community Foundation of Northern Virginia - Pooled Investment Fund
 //207 through 3/3/207 Quarterly Performance Report 207 Black Diamond Performance Reporting, LLC - 42008 Page of 3 Portfolio Overview Portfolio Value Summary Month Quarter Year to Date Last 2 Months Last
Schwab Indexed Retirement Trust Fund 2040
 Fund Facts Trustee Fund Type Charles Schwab Bank Collective Trust Fund Category Target Date 2036-2040 Benchmark 2040 Custom Index 1 Unit Class Inception Date Fund Inception Date 1/5/2009 Net Asset Value
WHEREAS, at its meeting on December 14, 2017, the Board adopted a strategy and a manager for the NC TIPS Fund;
 SUPPLEMENTAL RETIREMENT PLAN OF NORTH CAROLINA WHEREAS, the North Carolina Department of State Treasurer and the Supplemental Retirement Board of Trustees (the Board ) administer the Supplemental Retirement
Schwab Diversified Growth Allocation Trust Fund
 Fund Facts Trustee Fund Type Charles Schwab Bank Collective Trust Fund Category Global Asset Allocation Benchmark Global Growth Custom Index 1 Unit Class Inception Date 11/21/2012 Fund Inception Date 3/7/2012
Drexel University Retirement Plan
 Drexel University Retirement Plan 23A 7% is the average saving rate at Vanguard. Source: Vanguard, How America Saves 2016. Vanguard recommends saving 12% 15%. Retirement Income Calculator How much
Forum Portfolio Investment Policy Statement
 Forum Portfolio Investment Policy Statement Prepared for John Smith and Mary Smith Sunday February 12, 2017 60% Equities / 40% Fixed Income Growth Portfolio I. Purpose This Investment Policy Statement
Pursuing a Better Investment Experience
 Pursuing a Better Investment Experience Last updated: February 2017 1. Embrace Market Pricing World Equity Trading in 2016 Daily Average Number of Trades 82.7 million Dollar Volume $346.4 billion The market
Pursuing a Better Investment Experience
 Pursuing a Better Investment Experience Last updated: April 2016 1. Embrace Market Pricing World Equity Trading in 2015 Daily Average Number of Trades 98.6 million Dollar Volume $447.3 billion The market
Security Benefit Advisor Mutual Fund Program
 Security Benefit Advisor Mutual Fund Program Quarterly Performance Report as of June 30, 2011 You should consider the investment objectives, risks, charges, and expenses of the mutual funds carefully before
Annual Fee Disclosure Statement Important Information About Your Investment Options, Fees, and Other Expenses for the Ricoh USA, Inc.
 Fee Disclosure Statement Important Information About Your Investment Options, Fees, and Other Expenses for the Ricoh USA, Inc. RSP The Ricoh USA, Inc. Retirement Savings Plan (the RSP or Plan ) is a great
THE FUNDAMENTALS OF ASSET CLASS
 INVESTING THE FUNDAMENTALS OF ASSET CLASS INVESTING Solving the Investment Problem The first goal of your financial plan should be to avoid outliving your money Investing Is About You We Are Living Longer
SOLVING THE INVESTMENT PROBLEM
 SOLVING THE INVESTMENT PROBLEM The Fundamentals of Asset Class Investing FOCUS ON INVESTING Investing Is About You We Are Living Longer No matter what your age, you can expect to live much longer than
PALM TRAN, INC./ATU LOCAL 1577 PENSION FUND INVESTMENT PERFORMANCE PERIOD ENDING MARCH 31, 2011
 PALM TRAN, INC./ATU LOCAL 1577 PENSION FUND INVESTMENT PERFORMANCE PERIOD ENDING MARCH 31, 2011 NOTE: For a free copy of Part II (mailed w/i 5 bus. days from request receipt) of Burgess Chambers and Associates,
Smart Beta: Why the popularity and what s under the bonnet?
 APPLIED FINANCE CENTRE Faculty of Business and Economics Smart Beta: Why the popularity and what s under the bonnet? SLAVA PLATKOV PORTFOLIO MANAGER, DIMENSIONAL FUND ADVISORS Sydney CBD, 27 February 2018
457 Deferred Compensation Plan
 457 Deferred Compensation Plan Third Quarter Plan Executive Summary October 31, Kristin Finney-Cooke, CAIA Senior Consultant Kristen Jackson, CFA Senior Analyst Metropolitan St. Louis Sewer District Deferred
Mastering the New World of Advanced Asset Allocation. Michael Nairne, CFP, CFA
 Mastering the New World of Advanced Asset Allocation Michael Nairne, CFP, CFA Our Agenda Alpha Beta Separation Serving the Free Lunch Asset Liability Management A Taxing Matter Integrating Strategic and
A Smarter Way to Manage Your Retirement Plan
 A Smarter Way to Manage Your Retirement Plan United of Omaha Life Insurance Company A Mutual of Omaha Company Introducing SmartPlan Enterprise SM SmartPlan is a quick and easy way to learn about your retirement
Risk-Efficient Investment Portfolios from AlphaSimplex Group. Strategies that put risk management first
 Risk-Efficient Investment Portfolios from AlphaSimplex Group Strategies that put risk management first Agenda About AlphaSimplex Group (ASG) The need for active risk management Introducing the AlphaSimplex
Invest Confidently for Your Future
 Invest Confidently for Your Future OPENING Getting started Saving for retirement Buying a new home Helping pay for college Paying off debt OPENING Building and maintaining a portfolio STEP 1 STEP 2 STEP
GIPS List of Composite Descriptions
 GIPS List of Composite Descriptions Updated 5/12/14 Concentrated Growth Composite-330 Concentrated Growth portfolios, benchmarked to the Russell 1000 Growth Index, take concentrated positions in larger
Emerging Markets Stocks Q STOCKS BONDS
 Q4 US Stock Market International Developed Stocks Emerging Markets Stocks Global Real Estate US Bond Market Global Bond Market ex US Q4 2017 STOCKS BONDS 6.34% 4.23% 7.44% 2.97% 0.39% 1.10% Since Jan.
Building a Diversified Portfolio
 American Association of Individual Investors presents Financial Planning Workshop Building a Diversified Portfolio Fred Smith fred@fredsmithfinance.com Financial Planning Workshops Fundamentals of Investing
QUARTERLY REVIEW REPORT
 QUARTERLY REVIEW REPORT For the Quarter Ending December 31, 2015 PGR Solutions, LLC 51 E. Campbell Ave., Ste. 124 Campbell CA 95008 (408) 871-1590 www.pgrsolutions.com Quarterly Market Review Fourth Quarter
North Carolina Supplemental Retirement Plans. Performance Review First Quarter 2017
 North Carolina Supplemental Retirement Plans Performance Review First Quarter 2017 Asset Allocation Summary Current Asset Allocation As of March 31, 2017 Prior Period Asset Allocation As of December 31,
plan investment review performance summary
 CASH AND EQUIVALENTS - MONEY MARKET Vanguard Federal Money Market Investor 0.54% 1.78% 0.81% 0.30% 0.04% 0.01% 0.02% 1.78% 0.96% 0.59% 0.34% ICE BofA ML US Treasury Bill 3 Mon USD 0.56% 1.87% 0.86% 0.33%
Summit Strategies Group
 As of December 3, 203 US Equity: All Cap Russell 3000 Index 2.64 0.0 33.55 33.55 6.24 8.7 6.50 7.88 7.09 Dow Jones US Total Stock Market Index 2.63 0. 33.47 33.47 6.23 8.86 6.68 8.0 6.90 US Equity: Large
Supplemental Income 401(k) Plan
 Plan") Supplemental Income 401(k) Plan This document contains important information concerning our retirement plan. The first section provides you with information about the plan in general, including any expenses
Supplemental Income 401(k) Plan This document contains important information concerning our retirement plan. The first section provides you with information about the plan in general, including any expenses
INVESTMENT PERFORMANCE ANALYSIS
 CONSULTING TEAM George Hauptfuhrer Jeffrey Croteau INVESTMENT ANALYST Travis Unger PERFORMANCE ANALYST David Mesa CLIENT SERVICE CONTACT pbacfcv@primebuchholz.com Fourth Quarter 2017 INVESTMENT PERFORMANCE
BROAD COMMODITY INDEX
 BROAD COMMODITY INDEX COMMENTARY + STRATEGY FACTS JULY 2018 100.00% 80.00% 60.00% 40.00% 20.00% 0.00% -20.00% -40.00% -60.00% CUMULATIVE PERFORMANCE ( SINCE JANUARY 2007* ) -80.00% ABCERI S&P GSCI ER BCOMM
PART TWO: PORTFOLIO MANAGEMENT HOW EXPOSURE TO REAL ESTATE MAY ENHANCE RETURNS.
 PART TWO: PORTFOLIO MANAGEMENT HOW EXPOSURE TO REAL ESTATE MAY ENHANCE RETURNS. MAY 2015 Burland East, CFA CEO American Assets Capital Advisers Creede Murphy Vice President, Investment Analyst American
3Q17 Investment Review Presented to Lisle Woodridge FPD Pension Fund
 3Q17 Investment Review Presented to Lisle Woodridge FPD Pension Fund November 20th 2017 Jon Willhite, CIMA UBS Institutional Consulting 1780 Hughes Landing Blvd., Ste 200 The Woodlands, TX 77380 281-362-2250
Safe Withdrawal Rates from your Retirement Portfolio
 American Association of Individual Investors Silicon Valley Chapter presents Financial Planning Workshop Safe Withdrawal Rates from your Retirement Portfolio Fred Smith fred@fredsmithfinance.com Financial
Performance Report. September 30, 2015
 Performance Report September 30, 2015 About ASC Trust Corporation ASC Trust Corporation is the leader of retirement plan management in Micronesia. With a team of over 60,in three locations throughout the
Agile Investments ETF PORTFOLIO MANAGEMENT
 Agile Investments ETF PORTFOLIO MANAGEMENT How Agile Is Your Portfolio? Agile Investments is a registered investment advisor that manages diversified portfolios on behalf of our clients. We construct portfolios
State Universities Retirement System of Illinois (SURS) Investment Update
 Investment Update") State Universities Retirement System of Illinois (SURS) Investment Update December 2017 Volume 28, Issue 6 c\ Investment Update March 12, 2018 Volume 28, Issue 6 www.surs.org December Quarter Fiscal 1
State Universities Retirement System of Illinois (SURS) Investment Update December 2017 Volume 28, Issue 6 c\ Investment Update March 12, 2018 Volume 28, Issue 6 www.surs.org December Quarter Fiscal 1
Through March, the 2012
 Model Mutual Fund and ETF Portfolios: Choosing a Benchmark Isn t Easy By James B. Cloonan Through March, the 2012 equity market has been a friendlier place than we have seen for a while. The S&P 500 index
A Summary of the Rogers International Commodity Index 3 rd Quarter 2017
 A Summary of the Rogers International Commodity Index 3 rd Quarter 2017 The Rogers International Commodity Index (RICI ) was developed by Jim Rogers to be an international, diversified, investable raw
Are you better off with commission-free ETFs?
 Are you better off with commission-free ETFs? James DiLellio, PhD Pepperdine University Phil Goldfeder, PhD Northwestern University Introduction Competition amongst discount brokers continues to reduce
THE REWARDS OF MULTI-ASSET CLASS INVESTING
 INVESTING INSIGHTS THE REWARDS OF MULTI-ASSET CLASS INVESTING Market volatility and asset class correlations have been on the rise in recent years, leading many investors to wonder if diversification still
ETF portfolio review, 30th September ETF portfolios with ESG overlay. market overview. portfolio performance
 ETF portfolio review, 30th September 2017 market overview All our ETF portfolios performed better than s in September and all portfolios bar fixed-income continued to add to their gains year-to-date. Our
Capital Markets Outlook 100 LOWDER BROOK DRIVE SUITE 1100 WESTWOOD MA FAX
 M E K E T A I N V E S T M E N T G R O U P 00 LOWDER BROOK DRIVE SUITE 00 WESTWOOD MA 02090 78 47 3500 FAX 78 47 34 Investors are faced with three primary issues in the near-term: ) historically low bond
Personalized Investment Proposal
 Personalized Investment Proposal Client: Mr. Moderate Conservative Prepared on: 11/13/2016 Advisor Name Financial Advisor Advisor Address Advisor City, St zip Advisor Phone Advisor@email.com ATIA Advisor:
Asset Allocation with Exchange-Traded Funds: From Passive to Active Management. Felix Goltz
 Asset Allocation with Exchange-Traded Funds: From Passive to Active Management Felix Goltz 1. Introduction and Key Concepts 2. Using ETFs in the Core Portfolio so as to design a Customized Allocation Consistent
Financial Fitness Forever
 4/11/2016 10:46:22 AM Financial Fitness Forever Five Steps to More Money, Less Risk and More Peace of Mind by Paul Merriman President, The Merriman Financial Education Foundation Page 1 of 88 4/11/2016
ASSET ALLOCATION: DECISIONS & STRATEGIES
 ASSET ALLOCATION: DECISIONS & STRATEGIES Keith Brown, Ph.D., CFA November 21st, 2007 The Asset Allocation Decision A basic decision that every investor must make is how to distribute his or her investable
BROAD COMMODITY INDEX
 BROAD COMMODITY INDEX COMMENTARY + STRATEGY FACTS JUNE 2017 80.00% CUMULATIVE PERFORMANCE ( SINCE JANUARY 2007* ) 60.00% 40.00% 20.00% 0.00% -20.00% -40.00% -60.00% -80.00% ABCERI S&P GSCI ER BCOMM ER
BROAD COMMODITY INDEX
 BROAD COMMODITY INDEX COMMENTARY + STRATEGY FACTS APRIL 2017 80.00% CUMULATIVE PERFORMANCE ( SINCE JANUARY 2007* ) 60.00% 40.00% 20.00% 0.00% -20.00% -40.00% -60.00% -80.00% ABCERI S&P GSCI ER BCOMM ER
Capital Market Review
 Capital Market Review September 3, 215 Percent Percent MARKET/ECONOMIC OVERVIEW Risk Reprices Rapidly 2,2 1,9 1,6 1,3 S&P 5 April 29, 211 to Oct 3, 211 157 Days -19.4% May 21, 215 to Sep 3, 215 132 Days
BROAD COMMODITY INDEX
 BROAD COMMODITY INDEX COMMENTARY + STRATEGY FACTS AUGUST 2018 120.00% 100.00% 80.00% 60.00% 40.00% 20.00% 0.00% -20.00% -40.00% -60.00% CUMULATIVE PERFORMANCE ( SINCE JANUARY 2007* ) -80.00% ABCERI S&P
Discretionary Asset Management Mandates
 Discretionary Asset Management Mandates FFA Asset Management Department May 2016 FFA Private Bank Group FFA Private Bank Founded in 1994 Privately held Shareholder s equity of USD 39 million Basel III
49 Employ a Moderate Portfolio
 206 # 49 Employ a Moderate Portfolio By Peggy Creveling, CFA The moderate portfolio shifts up the risk, volatility, and return scale when compared with the conservative portfolio, including perhaps more
A MarketRiders Special Report
 A MarketRiders Special Report Aggregate Mutual Fund Fee Report US IRA Accounts 2009 1 www.marketriders.com Aggregate Mutual Fund Fee Report: US IRA Accounts 2009 As of September 30, 2009, US Households
Larry and Kelly Example
 Asset Allocation Plan Larry and Kelly Example Prepared by : Sample Advisor Financial Advisor January 04, 2010 Table Of Contents IMPORTANT DISCLOSURE INFORMATION 1-6 Results Comparison 7 Your Target Portfolio
Lincoln Investor Advantage SM
 WealthProtection Expertise Lincoln Investor Advantage SM Protecting wealth through tax-efficient investing Not a deposit Not FDIC-insured May go down in value Not insured by any federal government agency
PROFESSIONALLY MANAGED INVESTMENT SOLUTIONS THROUGH EXCHANGE TRADED FUNDS
 PROFESSIONALLY MANAGED INVESTMENT SOLUTIONS THROUGH EXCHANGE TRADED FUNDS CALING THE HEIGHTS SCALING THE HEIGHTS I WITH EXCHANGE TRADED FUNDS Y THE INVESTMENT CREATED FOR INSTITUTIONS IS NOW AVAILABLE
Liberty Mutual 401(k) Plan Annual Fee Disclosure Statement
 Plan Annual Fee Disclosure Statement") Liberty Mutual 401(k) Plan Annual Fee Disclosure Statement Important information about Your Options, Fees and Other Expenses The Liberty Mutual 401(k) Plan (the Plan ) is a great way to build savings for
Liberty Mutual 401(k) Plan Annual Fee Disclosure Statement Important information about Your Options, Fees and Other Expenses The Liberty Mutual 401(k) Plan (the Plan ) is a great way to build savings for
White. Paper. The Panic-Proof Portfolio A Bear Attack Survival Guide. DiMeo Schneider & Associates, L.L.C. By: Matt Rice, CFA AUGUST 2008
 White Paper The Panic-Proof Portfolio A Bear Attack Survival Guide DiMeo Schneider & Associates, L.L.C. By: Matt Rice, CFA AUGUST 2008 How to Survive a Bear Attack 1. Don t run 2. Drop to ground in fetal
BOYNTON BEACH POLICE PENSION FUND INVESTMENT PERFORMANCE PERIOD ENDING MARCH 31, 2011
 BOYNTON BEACH POLICE PENSION FUND INVESTMENT PERFORMANCE PERIOD ENDING MARCH 31, 2011 NOTE: For a free copy of Part II (mailed w/i 5 bus. days from request receipt) of Burgess Chambers and Associates,
20,000 - Check, What s next?
 1 11 21 31 41 51 61 71 81 91 101 111 121 131 141 151 161 171 181 191 201 211 221 231 241 251 20,000 - Check, What s next? The Dow Jones Industrial Average crossed the psychological 20,000 barrier on January
Summit Strategies Group
 April 0, 205 US Equity: All Cap Russell 000 Index 0.45 5.9 2.26 2.74 6.86 4. 8.68 8.66 Dow Jones US Total Stock Market Index 0.46 5.9 2.27 2.67 6.78 4.7 8.78 8.8 US Equity: Large Cap Russell 000 Index
Getting Retirement-Ready: Have your cake and eat it too!
 This firm is not a CPA firm. Getting Retirement-Ready: Have your cake and eat it too! The 2017 Spring Accounting Expo May 22, 2017 Steven R. Goodman, CPA, CFP www.goodmanfinancial.com Have your cake and
COMMODITIES AND A DIVERSIFIED PORTFOLIO
 INVESTING INSIGHTS COMMODITIES AND A DIVERSIFIED PORTFOLIO As global commodity prices continue to linger in a protracted slump, investors in these hard assets have seen disappointing returns for several
Jean M. Lown, Ph.D. Family, Consumer, & Human Development. Thanks to: Barbara O Neill, Ph.D., CFP, Rutgers Cooperative Extension
 Ready, Set Retire next year or in 30 years Jean M. Lown, Ph.D. Family, Consumer, & Human Development Thanks to: Barbara O Neill, Ph.D., CFP, Rutgers Cooperative Extension 1 Overview Understanding risk
Wells Fargo Target Date CITs E3
 All information is as of 12-31-17 unless otherwise indicated. Overview General fund information Fund sponsor and manager: Wells Fargo Bank, N.A. Fund advisor: Wells Capital Management Inc. Portfolio manager:
Retirement Plan Quarterly Investment Review Summary
 Retirement Plan Quarterly Investment Review Summary Prepared for: Plan Name: Quarter Ending: Pepperdine University Retirement Plan December 31, 2008 Table of Contents Introduction: Asset Allocation by
PROFESSIONALLY MANAGED INVESTMENT SOLUTIONS THROUGH EXCHANGE TRADED FUNDS
 PROFESSIONALLY MANAGED INVESTMENT SOLUTIONS THROUGH EXCHANGE TRADED FUNDS SCALING THE HEIGHTS SCALING THE HEIGHTS I WITH EXCHANGE TRADED FUNDS AN ETF-BASED DISCIPLINED PROCESS TO HELP YOU ACHIEVE YOUR
Asset Allocation & Performance
 COMMUNITY FOUNDATION OF GREATER DES MOINES LONG TERM GROWTH Asset Allocation & Performance As of March, 208 Asset Allocation on March, 208 Actual $ Actual (%) Target (%) Equity $68,6,297 62.4 62.8 Fixed
Building and Interpreting Custom Investment Benchmarks
 Building and Interpreting Custom Investment Benchmarks A White Paper by Manning & Napier www.manning-napier.com Unless otherwise noted, all figures are based in USD. 1 Introduction From simple beginnings,
Sample Custom Account (using SSgA Common Trust Funds) 3 rd Quarter 2013
 3 rd Quarter 2013") Sample Custom Account (using SSgA Common Trust Funds) 3 rd Quarter 2013 Endowment Management Solutions 70/30 Equities/Fixed Income 60/40 Equities/Fixed Income 50/50 Equities/Fixed Income 100/0 Fixed Income
Sample Custom Account (using SSgA Common Trust Funds) 3 rd Quarter 2013 Endowment Management Solutions 70/30 Equities/Fixed Income 60/40 Equities/Fixed Income 50/50 Equities/Fixed Income 100/0 Fixed Income
The Advantages of Diversification and Rebalancing
 Portfolio Strategies The Advantages of Diversification and Rebalancing By Charles Rotblut, CFA Article Highlights Rebalancing a properly diversifi ed portfolio provides measurable benefi ts. Three portfolios
NOTICE OF AUTOMATIC ENROLLMENT AND INVESTMENT MACY S, INC. 401(k) RETIREMENT INVESTMENT PLAN
 RETIREMENT INVESTMENT PLAN") NOTICE OF AUTOMATIC ENROLLMENT AND INVESTMENT MACY S, INC. 401(k) RETIREMENT INVESTMENT PLAN This notice informs you of the automatic enrollment feature of the 401(k) Plan. Because you may have been subject
NOTICE OF AUTOMATIC ENROLLMENT AND INVESTMENT MACY S, INC. 401(k) RETIREMENT INVESTMENT PLAN This notice informs you of the automatic enrollment feature of the 401(k) Plan. Because you may have been subject
Fourth Quarter 2015 Market Review. March 2016
 Fourth Quarter 2015 Market Review March 2016 Agenda Market Review Investment Outlook and Portfolio Positioning 2 2015 was a Challenging Year for Investment Returns Last year was the first time since 2001
Disclosure Statement Supplement to the Disclosure Statement dated December 19, 2011 No. 73 Goldman Sachs Bank USA $12,366,000 Contingent Coupon
 Disclosure Statement Supplement to the Disclosure Statement dated December 19, 2011 No. 73 Goldman Sachs Bank USA $12,366,000 Contingent Coupon Index-Linked Certificates of Deposit due 2019 (Linked to
The Northern Trust Focus Funds Glidepath Exhibit
 N O R T H E R N T R U S T G L O B A L I N V E S T M E N T S The Northern Trust Focus Funds Glidepath Exhibit northerntrust.com Asset Allocation Framework Our asset allocation framework considers asset
Supplemental Income 401(k) Plan
 Plan") Supplemental Income 401(k) Plan This document contains important information concerning our retirement plan. The first section provides you with information about the plan in general, including any expenses
Supplemental Income 401(k) Plan This document contains important information concerning our retirement plan. The first section provides you with information about the plan in general, including any expenses
FlexChoice Access. Investment Line-up by Asset Class or Category
 FlexChoice Access Investment Line-up by Asset Class or Category Simplifying the FlexChoice Access Fund Choices With FlexChoice Access, you now have the opportunity to design a portfolio to help meet client
Asset Allocation Study
 Asset Allocation Study The Metropolitan St. Louis Sewer District August 2016 Pavilion Advisory Group Inc. 227 W. Monroe Street, Suite 2020 Chicago, IL 60606 Phone: 312-798-3200 Fax: 312-902-1984 www.pavilioncorp.com
Trend Report 12/2017
 Trend Report 12/2017 Table of Contents Business Cycle ISM Manufacturing: Growing ECRI Leading Economic Indicators: Growing Market Trends Stocks vs. Bonds: Stocks Stocks vs. Gold: Stocks High Yield vs.
Sample Custom Account (using SSgA Common Trust Funds) 4th Quarter 2012
 4th Quarter 2012") Sample Custom Account (using SSgA Common Trust Funds) 4th Quarter 2012 Endowment Management Solutions 70/30 Equities/Fixed Income 60/40 Equities/Fixed Income 50/50 Equities/Fixed Income 100/0 Equities/Fixed
Sample Custom Account (using SSgA Common Trust Funds) 4th Quarter 2012 Endowment Management Solutions 70/30 Equities/Fixed Income 60/40 Equities/Fixed Income 50/50 Equities/Fixed Income 100/0 Equities/Fixed
Investment Policies and Objectives. of the
 Investment Policies and Objectives of the Lower Colorado River Authority 401(k) Plan And the Lower Colorado River Authority Deferred Compensation Plan Effective as of August 17, 2015 The Lower Colorado
Geoff Considine, Ph.D.
 Choosing Your Portfolio Risk Tolerance Geoff Considine, Ph.D. Copyright Quantext, Inc. 2008 1 In a recent article, I laid out a series of steps for portfolio planning that emphasized how to get the most
Sample Portfolio. Bret R. Tackett, MS, CFP 304 W. Venice Ave, Suite 218 Venice, FL /13/2009 through 9/30/2013 Portfolio Review
 This report is intended to illustrate the quality of reporting we provide our clients each quarter. It is not an advertisement of performance. Performance reflected in this report is not indicative of
DUKE UNIVERSITY FACULTY AND STAFF RETIREMENT PLAN Plan Number Plan Information as of 03/26/2015
 DUKE UNIVERSITY FACULTY AND STAFF RETIREMENT PLAN Plan Number 091156 Plan Information as of 03/26/2015 This legally required notice includes important information to help you compare the investment options
Portfolio Allocation Models. for Lincoln Financial Group s Variable Life Insurance Products
 Portfolio Allocation Models for Lincoln Financial Group s Variable Life Insurance Products 40% (Conservative) Allocation Model M s Portfolio Allocation Models for Lincoln Financial Group s Variable Insurance