Portfolio Construction Including ETFs: Impressive Opportunities and Clear Benefits
|
|
|
- Dinah Holmes
- 6 years ago
- Views:
Transcription

1 Portfolio Construction Including ETFs: Impressive Opportunities and Clear Benefits Rohit Mehta Executive Vice-President, Distribution & Strategy First Asset Investment Management, Inc.
2 ETF AUM over the next five years According to the 2 nd Annual Global ETF Survey from 2015: 41% of survey participants predict that global ETF AUM will reach at least US$7 trillion by Historical AUM ($T) Projected AUM ($T) Source: PwC and etfgi.com
3 Presentation agenda 01 Industry highlights Extraordinary momentum About First Asset AUM growth First Asset ETFs 02 ETF structure and trading NAV of an ETF Market making ETF trading tips 03 Smart beta Evolution of ETFs First Asset s smart beta Risk/return 04 Building portfolios 05 Putting it all together Portfolio construction Combining factors Why it works Followed by summary and Q&A
4 Extraordinary momentum During Number of ETFs Number of Listings % increase % increase $3.10 $3.00 $2.90 $2.80 $2.70 $2.60 AUM ( $US Trillion) 7% increase Providers 15% increase Source: etfgi.com
5 First Asset In 2015, First Asset became a CI Financial Company, joining the ranks of many wellrespected financial services partners that form one of Canada s largest investment management companies. Founded as an independent investment management firm in 1996, First Asset has maintained its focus on helping financial advisors achieve their clients goals through aiming to deliver superior riskadjusted investment returns to Canadian investors. ETF industry leader An established ETF leader in Canada offering proven methodologies, award winning ETFs, and access to best in-class portfolio managers. ETF solutions We offer smart beta, actively managed, covered call, core solutions, fixed income, and corporate class ETFs that span across all developed markets. ETF experts Our extensive expertise in ETFs allows us to assist advisors every day when assessing, selecting and integrating ETFs for client portfolios. - Barry Gordon, President and CEO President & CEO
6 First Asset ETF growth vs. ETF industry growth ETF Industry AUM ($B) ETF Industry Growth vs First Asset Growth (%) $100 $95 $90 $85 $80 400% 350% 300% 250% 300 First Asset Growth Industry Growth $75 $70 $65 $60 $55 200% 150% 100% 50% $50 Dec Dec Dec Dec % Dec Dec Dec Dec Source: First Asset, CETFA. As at December 31, 2015.
7 A comprehensive suite of ETF solutions First Asset has a comprehensive suite of over 35 ETFs, which cover all major asset classes and developed markets, including: Smart Beta Take advantage of factors derived from extensive historical analysis. Active Management Benefit from traditional active portfolio management. Covered Calls Attractive tax-effective income and seeks to lower the overall volatility of returns. Core Solutions Multi-factor solutions aimed at minimizing single-factor risk and maximizing risk-adjusted returns. Fixed Income Include index-based ETFs, as well as an actively managed fixed-income ETF Corporate Class Offering tax efficient distributions and tax deferred growth
8 ETF structure and trading


9 Net asset value (NAV) of an ETF Based on the underlying securities and tracked in real time throughout the trading day. $1.65 $1.35 $1.80 $1.75 $1.55 $1.95 $1.30 Total ETF NAV $11.35
10 Trading, subscriptions and redemptions Individual Investors (Buyer) Exchange Seller Secondary Market ETF Market Maker Cash or in-kind transfer of securities ETF units Primary Market ETF Provider (First Asset) Source: RBC Capital Markets
11 Market makers Price 9:30 9:40 9:50 10:00 10:10 10:20 10:30 10:40 10:50 11:00 11:10 11:20 11:30 11:40 11:50 12:00 12:10 12:20 12:30 12:40 12:50 13:00 13:10 13:20 13:30 13:40 13:50 14:00 14:10 14:20 14:30 14:40 14:50 15:00 15:10 15:20 15:30 15:40 15:50 16:00 16:10 DB bid/db ask act as goal posts during the day $20.15 $20.10 $20.05 $20.00 $19.95 DB acts as goal posts for ETF trading Can buy/sell as much as desired at bid/ask $19.90 $19.85 $19.80 Other buyers/sellers in market inside DB bid/ask $19.75 DB Bid DB Ask Trading Day Time
12 ETF trading tips Avoid trading in the first and last 15 minutes of each trading day Always use limit orders Ensure your quote screen shows the volume across all markets Get to know your firm s ETF trading desk to help with fills, especially large orders Get to know our sales team Volume doesn't equal liquidity
13 Smart beta


14 The evolution of ETFs Simple Beta Equal Weight, Sector, etc. Factor Beta Actively Managed The first exchange traded product the Toronto 35 Index Participation units (TIPs) was listed on the Toronto Stock Exchange in March Source: TSX
15 Yesterday s alpha is today s beta Alpha Portfolio Return Alpha Beta Factor Beta Regional Beta Country Beta Sector Beta 1970s 1980s 2000s Source: MSCI
16 Factor-based strategies Value Size Yield Quality Volatility Momentum Combines the benefits of active and passive management Cost-effective, transparent, rules-based ways to capture factors Factor-Based Indexes Benchmarks Factor Indexes Active Mandates Strategic Factor Tilt Market Return Transparent & Cost- Effective Active Returns Active Value Add Cap-Weighted ACWI IMI Tactical Asset Allocation Security Selection Market Timing Cap-weighted Indexes Active Management Tactical Factor Tilt and Overlays
17 Diversifying factor exposure U.S Overview: Annual Index Returns % Value 38.60% Value 28.08% Value 19.59% Dividend 19.37% Momentum % Risk-Weight 45.95% Value 33.18% Momentum 11.90% Risk-Weight 29.69% Value 47.17% Value 19.87% Risk-Weight 5.26% Risk-Weight 52.73% Momentum 23.38% Core 27.27% Momentum 18.53% Core 8.45% Dividend % Dividend 31.62% Dividend 23.50% Value 7.39% Dividend 22.20% Momentum 43.01% Momentum 17.04% Value 2.32% Momentum 39.94% Core 21.98% Momentum 17.16% Core 18.11% Value 5.51% Core % Core 28.90% Core 22.70% Core 4.51% Core 17.08% Core 36.10% Core 13.80% Dividend 1.38% Cap-Weight 28.68% Cap-Weight 17.28% Risk-Weight 4.91% Cap-Weight 17.17% Risk-Weight 5.49% Cap-Weight % Value 26.46% Cap-Weight 22.05% Dividend 2.11% Cap-Weight 16.00% Cap-Weight 32.39% Cap-Weight 13.69% Cap-Weight 0.10% Core 23.73% Risk-Weight 13.81% Dividend 3.68% Risk-Weight 15.79% Cap-Weight -0.31% Value % Cap-Weight 19.20% Momentum 15.06% Cap-Weight 1.20% Value 11.18% Risk-Weight 28.50% Dividend 13.48% Core -2.73% Dividend 23.21% Dividend 10.88% Cap-Weight 3.13% Dividend 15.52% Momentum -3.86% Risk-Weight % Momentum 16.41% Risk-Weight 13.47% Risk-Weight -0.83% Momentum 7.70% Dividend 25.03% Risk-Weight 5.64% Momentum -6.24% Value Momentum Morningstar US Target Momentum Index Risk-Weight MSCI USA Risk Weighted Top 150 Index Core First Asset U.S Core ETF Portfolio Cap-Weight S&P 500 Index Value Morningstar US Target Value Index Dividend Morningstar US Target Dividend Index Source: Morningstar Direct. As at December 31, 2015
18 Building portfolios
19 Advisor challenges Many advisors we ve spoken with, cite the following: Too much time spent administering, rather than growing, their business Insufficient tools/software for proper analysis, portfolio construction and reporting Too many funds to follow Orphan/legacy positions on the books Need guidance on how to effectively convert to fee-based
20 Benefits of model portfolios Streamlines administrative/maintenance work, freeing up more time Scalable and repeatable Clean and concise Allocations become more disciplined; less emotional and reactionary Effective way for advisors to be more competitive on fees Ability to outsource portfolio construction and reporting to First Asset/CI
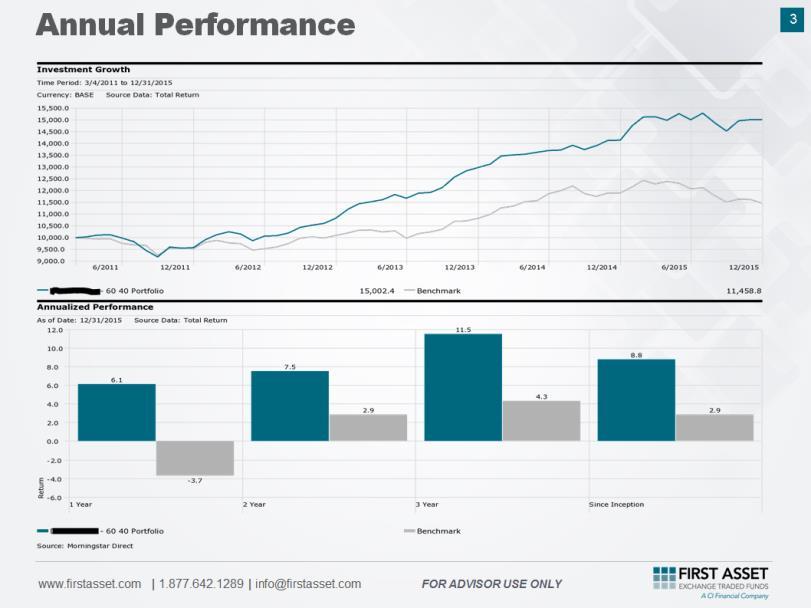
21 ETF model All Equity ETF Model % Canadian Value 8 Canadian Momentum 7 20 Canadian REIT 5 U.S. Value 13 U.S. Momentum International Value 15 International Momentum Global Low-Volatility $40,000 $35,000 $30,000 $25,000 $20,000 $15,000 $10,000 Performance (%) Model Benchmark $5, yr 3 yr 5 yr 10 yr SI * Up Capture Down Capture Risk Metrics Std Dev Sharpe Ratio 35,145 21,675 Sortino Ratio Model *Inception date = 11/16/2004. Source: Morningstar, as of August 31, Reference indices were used to demonstrate a longer track record. Canadian Value = Morningstar Canada Target Value Index, Canadian Momentum = Morningstar Canada Target Momentum Index, Canadian REITs = First Asset Canadian REIT ETF (RIT), US Value = Morningstar US Target Value Index (Unhedged), US Momentum = Morningstar US Target Momentum Index (Unhedged), International Value = Morningstar Developed Markets ex. North America Target Value Index (CAD Hedged), International Momentum = Morningstar Developed Markets ex. North America Target Momentum Index (CAD Hedged) and Global Low-Volatility = MSCI World Risk Weighted Top 200 Index (CAD Hedged). Benchmark consists of 20% S&P/TSX Composite Index, 25% S&P 500 Index (Unhedged), 30% MSCI EAFE Index (CAD Hedged) and 25% MSCI World Index (CAD Hedged). Model and benchmark assume annual rebalancing on January 1 st. Benchmark For illustrative Purposes Only
22 Mutual fund model Model Benchmark Mutual Fund Model % $25,000 Cambridge Canadian Equity Corporate Class 20 Cambridge U.S. Dividend Fund 20 Black Creek International Equity Fund 20 Signature Canadian Bond Fund 25 Signature Global Bond Fund $20,000 $15,000 $10,000 $5,000 09/ / / / / / / / ,161 19,108 Performance (%) Risk Metrics 1 yr 2 yr 3 yr 5yr SI * Up Capture Down Capture Std Dev Sharpe Ratio Sortino Ratio Model Benchmark *Inception date = 10/1/2008. Source: Morningstar, as of August 31, Benchmark consists of 20% S&P/TSX Composite Index, 20% S&P 500 Index (Unhedged), 20% MSCI EAFE Index (Unhedged), 25% FTSE TMX Canada Universe Bond Index and 15% Barclays Global Aggregate Bond Index (Unhedged). Model and benchmark assume annual rebalancing on January 1 st. For illustrative Purposes Only
23 ETF and mutual fund model ETF & Mutual Fund Model % Canadian Value 5 Canadian Momentum 4 Canadian REIT 3 U.S. Value 8 U.S. Momentum 7 International Value 9 International Momentum 9 Global Low-Volatility Signature Canadian Bond Fund 25 Signature Global Bond Fund $30,000 $25,000 $20,000 $15,000 $10,000 $5, Performance (%) 1 yr 3 yr 5 yr 10 yr SI * Up Capture Down Capture Risk Metrics Std Dev Sharpe Ratio Sortino Ratio Model Benchmark *Inception date = 11/16/2004. Source: Morningstar, as of August 31, Reference indices were used to demonstrate a longer track record. Canada Value = Morningstar Canadian Target Value Index, Canadian Momentum = Morningstar Canada Target Momentum Index, Canadian REITs = First Asset Canadian REIT ETF (RIT), US Value = Morningstar US Target Value Index (Unhedged), US Momentum = Morningstar US Target Momentum Index (Unhedged), International Value = Morningstar Developed Markets ex. North America Target Value Index (CAD Hedged), International Momentum = Morningstar Developed Markets ex. North America Target Momentum Index (CAD Hedged) and Global Low-Volatility = MSCI World Risk Weighted Top 200 Index (CAD Hedged). Benchmark consists of 12% S&P/TSX Composite Index, 15% S&P 500 Index (Unhedged), 18% MSCI EAFE Index (CAD Hedged), 15% MSCI W orld Index (CAD Hedged), 25% FTSE TMX Canada Universe Bond Index and 15% Barclays Global Aggregate Bond Index (Unhedged). Model and benchmark assume annual rebalancing on January 1 st. Model Benchmark For illustrative Purposes Only $28,502 $21,335
24 Portfolio construction: Putting it all together
25 Portfolio construction service Existing Portfolio Mutual Funds ETFs Stocks Analysis Historical riskreturn profile Asset coverage Correlation Common holdings Optimization Efficient frontier Macro themes Portfolio objectives Proposed Portfolio Better performance Lower volatility Better diversity Advisor Output For Illustrative Purposes Only
26 Solutions-based allocations Determination of portfolio objective is paramount. Objectives and Tactics Alpha Alpha Value Momentum Stability Diversified Multi-Factor Portfolio Income Stability Low Volatility Quality Long Duration Bonds Income Dividends High Yield REITs Preferred Shares Covered Calls Tax Efficiency
27 Efficient frontier optimization
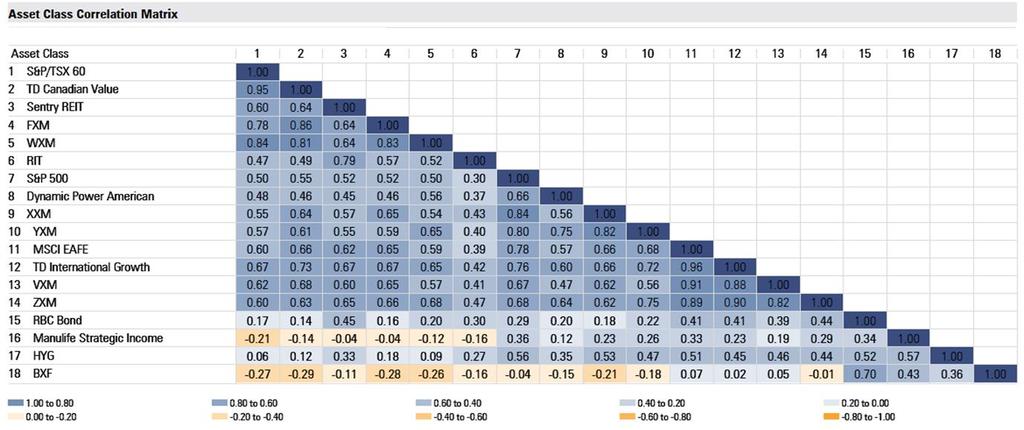
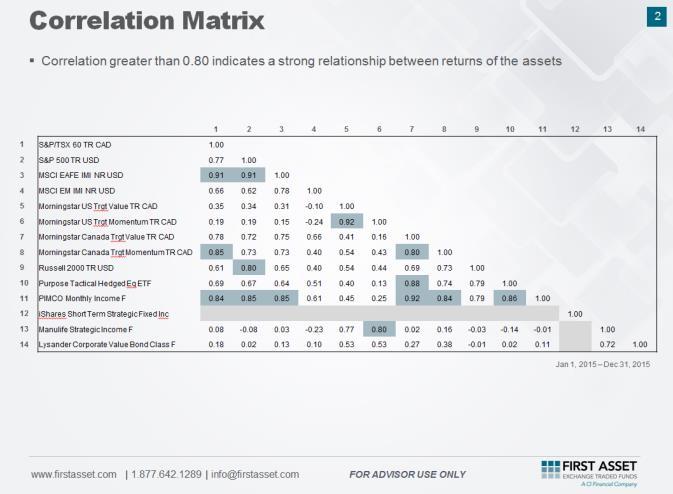
28 Correlation

29 Common holdings
30 Qualitative overlay Strategy recommendations based on macro themes: Examples: U.S. housing recovery Canadian oil and currency implications Interest rate positioning High-yield bond credit spreads Implications of Brexit vote Quantitative easing in Europe and Japan Small caps and value stocks should lead in rebounding markets.

31 Advisor output
32 Customized reporting solutions
33 Summary First Asset, a CI Financial Company, is an innovative investment management firm providing value-added ETF solutions. ETFs have grown to become more than traditional cap-weighted instruments, now providing access to active management strategies. First Asset offers bespoke portfolio construction, analysis and reporting.

34 Questions & Answers
35 Disclaimer This communication is confidential and for the exclusive use of registered dealers and their representatives. The contents may not be reproduced or distributed to any clients or potential clients of such dealers or to the public generally or to the press. Canadian securities legislation, including National Instrument Investment Funds, prohibits any such distribution. This communication is not intended to be a sales communication within the meaning of that Instrument and accordingly has not been designed to comply with the requirements of that Instrument relating to sales communications. Returns of an index do not represent the Fund s returns and do not include any costs of investing. An investor cannot invest directly in an index. All performance data for all indices assumes the reinvestment of all distributions. Morningstar and MSCI index performance data results are hypothetical prior to December 26, 2013, for the MSCI World RW Top 200 Index (Hedged), and prior to September 12, 2013 for the Morningstar US Target Momentum Index and Morningstar US Target Value Index; and prior to February 6, 2012, for the Morningstar Canada Target Value Index, Morningstar Canada Target Momentum Index and prior to November 14, 2014 for the Morningstar International Target Value Index and Morningstar International Target Momentum Index but are calculated using the same methodology that has been in use by the index provider since the index was first published. Information regarding the Morningstar and MSCI indexes, including the applicable index methodology, is available at and As a result of the risks and limitations inherent in hypothetical performance data, hypothetical results may differ from actual index performance. Morningstar is a trademark of Morningstar, Inc. and has been licensed for use for certain purposes by First Asset Investment Management Inc. First Asset ETFs are not sponsored, endorsed, sold or promoted by Morningstar or any of its affiliates (collectively, Morningstar ), and Morningstar makes no representation regarding the advisability of investing in First Asset ETFs. MSCI is a trademark of MSCI Inc. The MSCI indexes have been licensed for use for certain purposes by First Asset. The funds or securities referred to herein are not sponsored, endorsed, or promoted by MSCI, and MSCI bears no liability with respect to any such funds or securities or any index on which such funds or securities are based. The prospectus of the funds contains a more detailed description of the limited relationship MSCI has with First Asset and any related funds. The Funds are managed by First Asset Investment Management Inc., a subsidiary of First Asset Capital Corp. (FA Capital). TM First Asset and its logo are trademarks of FA Capital, a wholly owned subsidiary of CI Financial Corp. which is listed on the Toronto Stock Exchange under the symbol CIX. CI FINANCIAL is a registered trademark of CI Investment Inc., used under license. Published September FOR ADVISOR USE ONLY NOT FOR DISTRIBUTION TO CLIENTS
36 Performance as of August 31, 2016 YR 1 YR 3 YR 5 YR 10 Since Inception Cambridge Canadian Equity Corporate Class (Class A) 10.50% 11.40% 13.60% N/A 8.20% Inception date: Dec Cambridge U.S. Dividend Fund US$ (Class A) 8.10% N/A N/A N/A 4.10% Inception date: Mar Black Creek International Equity Fund (Class A) 2.10% 10.10% 13.60% N/A 14.60% Inception date: Aug Signature Canadian Bond Fund (Class A) 4.60% 4.90% 3.60% 4.00% 5.50% Inception date: Jan Signature Global Bond Fund (Class A) 8.50% 8.90% 5.40% 5.60% 4.40% Inception date: Aug Source: RBC Investor
BMO Exchange Traded Funds
 BMO Exchange Traded Funds June 2012 Alfred Lee, CFA, CMT, DMS Vice President & Investment Strategist BMO BMO Global Asset Management Agenda The Growing ETF Landscape Institutional Usage of ETFs Mechanics
Implementing Portable Alpha Strategies in Institutional Portfolios
 Expected Return Investment Strategies Implementing Portable Alpha Strategies in Institutional Portfolios Interest in portable alpha strategies among institutional investors has grown in recent years as
CI MOSAIC ETF PORTFOLIOS
 CI MOSAIC ETF PORTFOLIOS Greater access. Greater potential opportunity Successful investing comes down to many things, including access to a broad range of investment options. Historically, mutual funds
BROAD COMMODITY INDEX
 BROAD COMMODITY INDEX COMMENTARY + STRATEGY FACTS JANUARY 2018 100.00% 80.00% 60.00% 40.00% 20.00% 0.00% -20.00% -40.00% -60.00% CUMULATIVE PERFORMANCE ( SINCE JANUARY 2007* ) -80.00% ABCERI S&P GSCI ER
INTERNATIONAL INVESTING CAPTURE THE OPPORTUNITIES. REDUCE THE RISK.
 INTERNATIONAL INVESTING CAPTURE THE OPPORTUNITIES. REDUCE THE RISK. INTERNATIONAL INNOVATION Approximately 97% of the world s investment opportunities are outside Canada 1 and the majority of them are
Portfolio Series Balanced Fund. Portfolio Review Fourth Quarter 2017
 Portfolio Review Fourth Quarter 2017 Q4 Portfolio Performance (Class F) 1 Month 3 Months 6 Months 1 Year 3 Years 5 Years 10 Years Since Inception (November 1988) -0.6% 2.8% 3.3% 7.5% 6.2% 9.2% 6.0% 5.9%
BROAD COMMODITY INDEX
 BROAD COMMODITY INDEX COMMENTARY + STRATEGY FACTS JULY 2018 100.00% 80.00% 60.00% 40.00% 20.00% 0.00% -20.00% -40.00% -60.00% CUMULATIVE PERFORMANCE ( SINCE JANUARY 2007* ) -80.00% ABCERI S&P GSCI ER BCOMM
CIBC Wood Gundy Recommended Funds
 Investment Strategy Group Funds Research December 2015 Daniel Arsenault, CFA, FRM Director, Investment Funds CIBC Wood Gundy Recommended Mutual Funds Summary Recommended Funds - Equities ISG Funds Research
BROAD COMMODITY INDEX
 BROAD COMMODITY INDEX COMMENTARY + STRATEGY FACTS APRIL 2017 80.00% CUMULATIVE PERFORMANCE ( SINCE JANUARY 2007* ) 60.00% 40.00% 20.00% 0.00% -20.00% -40.00% -60.00% -80.00% ABCERI S&P GSCI ER BCOMM ER
BROAD COMMODITY INDEX
 BROAD COMMODITY INDEX COMMENTARY + STRATEGY FACTS JUNE 2017 80.00% CUMULATIVE PERFORMANCE ( SINCE JANUARY 2007* ) 60.00% 40.00% 20.00% 0.00% -20.00% -40.00% -60.00% -80.00% ABCERI S&P GSCI ER BCOMM ER
Advisor Guide FOR ADVISOR USE ONLY NOT FOR DISTRIBUTION TO CLIENTS
 Advisor Guide FOR ADVISOR USE ONLY NOT FOR DISTRIBUTION TO CLIENTS Managed solutions can provide many benefits to your practice. Their convenience allows you to shift your time from portfolio construction
BROAD COMMODITY INDEX
 BROAD COMMODITY INDEX COMMENTARY + STRATEGY FACTS AUGUST 2018 120.00% 100.00% 80.00% 60.00% 40.00% 20.00% 0.00% -20.00% -40.00% -60.00% CUMULATIVE PERFORMANCE ( SINCE JANUARY 2007* ) -80.00% ABCERI S&P
Innovative Solutions to Navigate the Market
 BMO Global Asset Management Innovative Solutions to Navigate the Market BMO ETF Based Mutual Funds ETFs are extremely efficient tools that provide great flexibility to our Asset Allocation Team in quickly
Global Opportunities. CI Global Solutions
 Global Opportunities CI Global Solutions Global Opportunities Where can investors find the best opportunities today? From 2000 to 2010, the Canadian stock market consistently outperformed its global counterparts.
Understanding Exchange-Traded Funds (ETFs) A guide to TD Asset Management Inc. s (TDAM) ETF solutions
 A guide to TD Asset Management Inc. s (TDAM) ETF solutions") Understanding Exchange-Traded Funds (ETFs) A guide to TD Asset Management Inc. s (TDAM) ETF solutions Understanding ETFs Investment in exchange-traded funds (ETFs) has boomed in recent years, with the
Understanding Exchange-Traded Funds (ETFs) A guide to TD Asset Management Inc. s (TDAM) ETF solutions Understanding ETFs Investment in exchange-traded funds (ETFs) has boomed in recent years, with the
Diversified Growth Funds IIES 2017
 Diversified Growth Funds IIES 2017 Agenda Background Overview of Diversified Growth Funds (DGFs) DGF Example & Comparison Appendix 1 Background A Challenging Environment Has Led to New Investor Realities
Why Evolution Private Managed Accounts?
 Advisor Guide Why Evolution Private Managed Accounts? Be empowered by an innovative solution tailor-made for your clients. Experience holistic wealth management customized to meet your clients needs today
Portfolio Series Conservative Balanced Fund. Portfolio Review Fourth Quarter 2017
 Portfolio Review Fourth Quarter 2017 Q4 Portfolio Review Fourth Quarter 2017 as at December 31, 2017 Portfolio Performance (Class F) 1 Month 3 Months 6 Months 1 Year 3 Years 5 Years 10 Years Since Inception
CI Portfolios. Portfolio Review First Quarter 2018 ivari CI Growth Portfolio
 CI Portfolios Portfolio Review First Quarter 2018 ivari CI Growth Portfolio Portfolio Performance ivari CI Portfolios are available as Guaranteed Investment Portfolios within select ivari segregated funds
Tactical Income ETF. Investor Presentation N ORTHC OAST I NVESTMENT A DVISORY T EAM NORTHCOASTAM. COM
 Tactical Income ETF Investor Presentation N ORTHC OAST I NVESTMENT A DVISORY T EAM 203.532.7000 INFO@ NORTHCOASTAM. COM NORTHCOAST ASSET MANAGEMENT An established leader in the field of tactical investment
Diversification Opportunities From Capturing China as an Asset Class An Overview of the KraneShares MSCI All China Index ETF (Ticker: KALL)
") KALL 9/30/2018 Diversification Opportunities From Capturing as an Asset Class An Overview of the KraneShares MSCI All Index ETF (Ticker: KALL) Info@kraneshares.com Diversification may not protect against
KALL 9/30/2018 Diversification Opportunities From Capturing as an Asset Class An Overview of the KraneShares MSCI All Index ETF (Ticker: KALL) Info@kraneshares.com Diversification may not protect against
Your Sophisticated, Yet Simple Portfolio CLIENT GUIDE
 Your Sophisticated, Yet Simple Portfolio CLIENT GUIDE fieramilano complex, Milano, Italy Sophisticated, Yet Simple Portfolio Series is a family of seven portfolio funds, each carefully crafted to match
Select 60i40e Managed Portfolio. Portfolio Review Fourth Quarter 2017
 Select 60i40e Managed Portfolio Portfolio Review Fourth Quarter 2017 Q4 Portfolio Review Fourth Quarter 2017 as at December 31, 2017 Portfolio Performance (Class F) 1 Month 3 Months 6 Months 1 Year 3 Years
Going Beyond Style Box Investing
 Going Beyond Style Box Investing NCPERS Presented by Erin Doyle Orekhov, Client Portfolio Manager May 22, 2017 For financial professional or qualified institutional investor use only. Not for inspection
Select 40i60e Managed Portfolio. Portfolio Review First Quarter 2018
 Select 40i60e Managed Portfolio Portfolio Review First Quarter 2018 Q1 Portfolio Review First Quarter 2018 as at March 31, 2018 Portfolio Performance (Class F) 1 Month 3 Months 6 Months 1 Year 3 Years
RBC SELECT PORTFOLIOS. Precision-built with investors in mind. 30years. Celebrating
 RBC SELECT PORTFOLIOS Precision-built with investors in mind. Celebrating 30years RBC SELECT PORTFOLIOS RBC Select Portfolios Being a successful investor takes knowledge, time and patience. With RBC Select
Portfolio Series Income Fund. Portfolio Review Second Quarter 2015
 Portfolio Review Second Quarter 2015 Q2 Portfolio Review Second Quarter 2015 as at June 30, 2015 Portfolio Performance (Class A) 1 Month 3 Months 6 Months 1 Year 3 Years 5 Years 10 Years Since Inception
The Top 10 Innovations in ETFs
 The Top 10 Innovations in ETFs Dan Stanley Vice President, BMO ETFs Kevin Prins Vice President, BMO ETFs Rob Butler Vice President, BMO ETFs Mark Webster Vice President, BMO ETFs Agenda BMO ETFs Top 10
Building Efficient Return Seeking Portfolios Reassessing the Equity Allocation
 Building Efficient Return Seeking Portfolios Reassessing the Equity Allocation Paul M. Martin, CFA Vice President & Portfolio Manager Phillips, Hager & North Investment Management Sources of Risk in a
Smart Beta ETFs: 3 ways to address investor needs
 Smart Beta ETFs: 3 ways to address investor needs Help achieve investor goals with smart beta ETFs This guide highlights three ways investors are using ishares smart beta ETFs: 1 Lower volatility can help
2017 Kerns Capital Management, Inc. July 2017 Investor Presentation
 July 2017 Investor Presentation Table of Contents 1. Executive Summary.............. 1.1 History.......... 1.2 Buy/Sell Discipline........ 2. Investment Strategy... 2.1 Assessment and Implementation 2.2
NewGen Trading Fund Equity long-short trading strategy
 NewGen Trading Fund Equity long-short trading strategy Disclaimer The information in this document is furnished on a confidential basis exclusively for your use and retention and, by accepting this document,
Comparing Exchange Traded Funds to Mutual Funds and Stocks and Bonds
 ETFs 101 Comparing Exchange Traded Funds to Mutual Funds and Stocks and Bonds In an era when investment options may appear endless, the growing popularity of Exchange Traded Funds (ETFs) has taken the
Alpha investing the quest for exceptional performance
 Alpha investing the quest for exceptional performance The focus on absolute returns, management expertise unleashed United Financial focuses on partnering with investment managers who add value beyond
Portfolio Select Series. Portfolio Review First Quarter 2017
 Portfolio Select Series Portfolio Review First Quarter 2017 Q1 Q4 3 Select Income Managed Portfolio 6 Select 80i20e Managed Portfolio 10 Select 70i30e Managed Portfolio 14 Select 60i40e Managed Portfolio
Additional series available. Morningstar TM Rating. Funds in category. Equity style Fixed inc style. of fixed income allocation
 Sun Life Granite Conservative Class Series A Additional series available NOTE: This Fund is a class of mutual fund shares of Sun Life Global Investments Corporate Class Inc. $11.5381 Net asset value per
ETFs Evolved: The Next Generation of ETFs
 ETFs Evolved: The Next Generation of ETFs February 2013 HorizonsETFs.com ETF solutions for every investor Member of Financial Group Evolution: Cheaper, Faster and Better 2 ETFs Explained What is an ETF?
Fixed Income: The Game Has Changed. Marc-André Gaudreau & the Dynamic Fixed Income Credit Team
 Fixed Income: The Game Has Changed Marc-André Gaudreau & the Dynamic Fixed Income Credit Team Yields Near Historic Lows Traditional approach to fixed income will be challenged HISTORICAL YIELDS: 10-YR
Building Efficient Return Seeking Portfolios. Jim C. Cole, VP - Fixed Income Étienne Dubé, VP - Fixed Income
 Building Efficient Return Seeking Portfolios Jim C. Cole, VP - Fixed Income Étienne Dubé, VP - Fixed Income Dec-01 Dec-02 Dec-03 Dec-04 Dec-05 Dec-06 Dec-07 Dec-08 Dec-09 Dec-10 Dec-11 Dec-12 Dec-13 Solvency
MANAGED FUTURES INDEX
 MANAGED FUTURES INDEX COMMENTARY + STRATEGY FACTS JANUARY 2019 CUMULATIVE PERFORMANCE ( SINCE JANUARY 2007* ) 140.00% 120.00% 100.00% 80.00% 60.00% 40.00% 20.00% 0.00% AMFERI BARCLAY BTOP50 CTA INDEX S&P
It s easy to get started
 Client Guide It s easy to get started You and your advisor create an investor profile based on your discussions and responses to the Portfolio Select Series questionnaire. Based on the profile, you and
Introducing BlackRock's Target Allocation ETF Models
 Introducing BlackRock's Target Allocation ETF Models Eve Cout Director, Managed Accounts Business Thomas Wood, CFA Lead Strategist, US Model Portfolios Tuesday January 23 rd, 2018 BENEFIT # 1 Scale and
Pooled Fund Annualized Returns Periods Ending March 31, 2018
 Pooled Fund Annualized Returns Periods Ending March 31, 2018 SHORT TERM 25 20 15 10 5 1 YEARS YEARS YEARS YEARS YEARS YEAR Short Term Fund 1 2.9 2.4 1.7 0.9 0.8 0.8 FTSE TMX Canada 30 Day Treasury Bill
Utilizing ETFs To Build Your Business
 Utilizing ETFs To Build Your Business Capitalizing on the Popularity and Efficiencies of ETFs Chris McHaney, CFA Vice President & Portfolio Manager BMO ETFs & Global Structured Investments BMO Asset Management
ETF liquidity 202: Beyond the basics
 ETF liquidity 202: Beyond the basics Dean Allen Head of product and ETF capital markets Vanguard Investments Canada Inc. June 2015 About Vanguard The Vanguard Group, Inc. Founded: 1975 Corporate headquarters:
WisdomTree U.S. High Dividend Index CAD Russell 1000 Value Index (CAD) Russell 1000 Value Index (CAD) 7.36% 11.94%
 Russell 1000 Value Index (CAD) 7.36% 11.94%") WisdomTree U.S. High Dividend Strategy HID/HID.B In the past few decades, index-based investment strategies have gained traction for obtaining exposure to broad asset classes. Numerous benefits including
WisdomTree U.S. High Dividend Strategy HID/HID.B In the past few decades, index-based investment strategies have gained traction for obtaining exposure to broad asset classes. Numerous benefits including
MANAGED FUTURES INDEX
 MANAGED FUTURES INDEX COMMENTARY + STRATEGY FACTS SEPTEMBER 2018 CUMULATIVE PERFORMANCE ( SINCE JANUARY 2007* ) 140.00% 120.00% 100.00% 80.00% 60.00% 40.00% 20.00% 0.00% AMFERI BARCLAY BTOP50 CTA INDEX
Discover the power. of ETFs. Not FDIC Insured May May Lose Lose Value Value No No Bank Bank Guarantee
 Discover the power of ETFs Not FDIC Insured May May Lose Lose Value Value No No Bank Bank Guarantee Discover exchange-traded funds (ETFs) Financial television programs and publications continue to give
PIMCO Global Optima Index
 PIMCO Global Optima Index Dynamically Blending Global Equity and U.S. Fixed Income Markets to Help Deliver Upside Growth Potential Issued by American General Life Insurance Company (AGL), an American International
BAROMETER PRIVATE POOLS
 OFFERING MEMORANDUM November 9, 2018 BAROMETER PRIVATE POOLS Offering Class A, F and O Units of: BAROMETER EQUITY POOL BAROMETER TACTICAL BALANCED POOL BAROMETER TACTICAL INCOME POOL BAROMETER TACTICAL
Portfolio Review xxx Quarter 20xx. Evolution 50i50e Model Portfolio Portfolio Review Third Quarter 2018
 Portfolio Review xxx Quarter 20xx Evolution 50i50e Model Portfolio Portfolio Review Third Quarter 2018 Q3 Overview Diversified portfolios capture gains from asset classes and security types that are performing
WisdomTree.com Currency Hedged Equities Q2 2018
 WisdomTree.com 866.909.9473 Q2 2018 Ratio of MSCI to S&P The Dollar s Impact on Equities: ACWX (Unhedged) Relative to the S&P 500 1.7 1.6 1.5 1.4 1.3 U.S. Dollar Depreciation Cumulative: -25.52% Annualized:
ETF Mechanics. Matthew Tucker, CFA. Managing Director, Head of ishares Fixed Income Strategy
 ETF Mechanics Matthew Tucker, CFA Managing Director, Head of ishares Fixed Income Strategy The Changing Fixed Income Market As the corporate bond market grows, trading volume declines Since 2005, the size
Additional series available. Morningstar TM Rating. Funds in category. Equity style Market cap %
 Sun Life BlackRock Canadian Composite Equity Class Series A $11.6889 CAD Net asset value per security (NAVPS) as of August 31, 2018 $-0.0752-0.64% Benchmark S&P/TSX Capped Composite Index Fund category
Portfolio Series Conservative Fund. Portfolio Review Second Quarter 2015
 Portfolio Review Second Quarter 2015 Q2 Portfolio Performance (Class A) 1 Month 3 Months 6 Months 1 Year 3 Years 5 Years 10 Years Since Inception (December 1997) -1.4% -2.0% 3.7% 6.8% 8.9% 8.0% 5.0% 5.4%
The Equity Imperative
 The Equity Imperative Factor-based Investment Strategies 2015 Northern Trust Corporation Can You Define, or Better Yet, Decipher? 1 Spectrum of Equity Investing Techniques Alpha Beta Traditional Active
ETF Research: Understanding Smart Beta KNOW Characteristics: Finding the Right Factors Research compiled by Michael Venuto, CIO
 ETF Research: Understanding Smart Beta KNOW Characteristics: Finding the Right Factors Research compiled by Michael Venuto, CIO In this paper we will explore the evolution of smart beta investing through
How to index invest in the new world
 How to index invest in the new world Pollyanna Rhodes BlackRock Selecting Best Beta Pollyanna Rhodes October 2012 FOR FINANCIAL PROFESSIONAL USE ONLY. NOT TO BE RELIED UPON BY INDIVIDUAL INVESTORS. 1 Agenda
Additional series available. Morningstar TM Rating. Funds in category 363. Fixed income % of fixed income allocation
 Sun Life BlackRock Canadian Balanced Fund Investment objective Series A $12.4584 Net asset value per security (NAVPS) as of August 20, 2018 $0.0128 0.10% Benchmark Blended benchmark Fund category Canadian
Franklin Templeton Investment Funds Franklin Templeton Global Allocation Fund
 Franklin Templeton Investment Funds Franklin Templeton Global Allocation Fund Fund Details Inception Date 29 July 2011 Investment Style Benchmark(s) Asset Allocation 50% MSCI All Country World Index 35%
Early on, your needs were simple. The memory of
 Client Guide Early on, your needs were simple. The memory of investing your first hard-earned dollars is etched in your mind. As you established yourself and began to experience success, your needs changed.
Navigating the ETF Landscape
 Navigating the ETF Landscape Daniel Prince, CFA Director, Head of ishares Product Consulting May 3, 2017 Agenda What are Exchange Traded Funds (ETFs) What is driving ETF usage ETF trends and innovation
GOAL ENGINEER SERIES PORTFOLIO HIGHLIGHTS:
 GOAL ENGINEER SERIES The Goal Engineer Series combines Northern Trust s asset allocation, portfolio construction and risk management expertise with Engineered Equity TM and active fixed income strategies
MUTUAL TRADABLE DURING THE DAY. ETFs
 TOOL KIT Exchange Traded Funds (ETFs) can help change the way you manage your investments. ETFs combine features of mutual funds and stocks, offering you diversified, efficient, cost-effective and transparent
VANGUARD TOTAL WORLD STOCK ETF (VT)
") VANGUARD TOTAL WORLD STOCK ETF (VT) $71.53 USD Risk: Low Zacks ETF Rank 3 - Hold Fund Type Issuer Benchmark Index World ETFs VANGUARD FTSE GLOBAL ALL CAP INDEX VT Sector Weights Date of Inception 06/24/2008
VANGUARD TOTAL WORLD STOCK ETF (VT) $71.53 USD Risk: Low Zacks ETF Rank 3 - Hold Fund Type Issuer Benchmark Index World ETFs VANGUARD FTSE GLOBAL ALL CAP INDEX VT Sector Weights Date of Inception 06/24/2008
Additional series available. Morningstar TM Rating. Funds in category Fixed income % of fixed income allocation
 Sun Life Granite Moderate Portfolio Series A $12.0677 CAD Net asset value per security (NAVPS) as of January 15, 2019 $0.0353 0.29% Benchmark Blended benchmark Fund category Global Neutral Balanced Additional
Please note that in the following document any reference to HRS Capital should be treated as a mention of Fiera Capital _E (11/16)
") Client Guide Effective November 1, 2016, Fiera Capital assumed responsibility for the funds risk management overlay strategy. CI has appointed Fiera Capital to replace HRS Capital ( HRS ) following a change
Client Guide Effective November 1, 2016, Fiera Capital assumed responsibility for the funds risk management overlay strategy. CI has appointed Fiera Capital to replace HRS Capital ( HRS ) following a change
100% Absolute Return*
 A final base shelf prospectus containing important information relating to the securities described in this document has been filed with the securities regulatory authorities in each of the provinces and
The Evolution of Index and ETF Strategies: Going beyond Passive vs. Active
 0.75 CE Credits The Evolution of Index and ETF Strategies: Going beyond Passive vs. Active FOR ADVISOR USE ONLY Agenda Evolution of indexing Market Capitalization Indexing Equal Weighted Indexing Fundamental
MANAGED FUTURES INDEX
 MANAGED FUTURES INDEX COMMENTARY + STRATEGY FACTS JUNE 2018 CUMULATIVE PERFORMANCE ( SINCE JANUARY 2007* ) 120.00% 100.00% 80.00% 60.00% 40.00% 20.00% 0.00% AMFERI BARCLAY BTOP50 CTA INDEX S&P 500 S&P
Additional series available. Morningstar TM Rating. Funds in category 960. Fixed income % of fixed income allocation
 Sun Life Granite Moderate Portfolio Investment objective Series A $12.6002 Net asset value per security (NAVPS) as of April 20, 2018 $-0.0024-0.02% Benchmark Blended benchmark Fund category Global Neutral
MSCI EAFE Index (CAD) MSCI EAFE Index CAD 5.06% 12.90%
 MSCI EAFE Index CAD 5.06% 12.90%") WisdomTree International Quality Dividend Growth Strategy IQD/IQD.B/DQI In today's fast-paced environment, investment approaches and international opportunities are constantly evolving. Approximately 95%
WisdomTree International Quality Dividend Growth Strategy IQD/IQD.B/DQI In today's fast-paced environment, investment approaches and international opportunities are constantly evolving. Approximately 95%
Select 50i50e Managed Portfolio Corporate Class. Portfolio Review Third Quarter 2018
 Portfolio Review Third Quarter 2018 Q3 Portfolio Review Third Quarter 2018 as at September 30, 2018 Portfolio Performance (Class F) 1 Month 3 Months 6 Months 1 Year 3 Years 5 Years 10 Years Since Inception
Mastering the New World of Advanced Asset Allocation. Michael Nairne, CFP, CFA
 Mastering the New World of Advanced Asset Allocation Michael Nairne, CFP, CFA Our Agenda Alpha Beta Separation Serving the Free Lunch Asset Liability Management A Taxing Matter Integrating Strategic and
Portfolio Review xxx Quarter 20xx. Evolution 70i30e Model Portfolio Portfolio Review Third Quarter 2018
 Portfolio Review xxx Quarter 20xx Evolution 70i30e Model Portfolio Portfolio Review Third Quarter 2018 Q3 Evolution 70i30e Model Portfolio Standard geographic asset allocation and blend of investment styles
MANAGED FUTURES INDEX
 MANAGED FUTURES INDEX COMMENTARY + STRATEGY FACTS JULY 2018 CUMULATIVE PERFORMANCE ( SINCE JANUARY 2007* ) 120.00% 100.00% 80.00% 60.00% 40.00% 20.00% 0.00% AMFERI BARCLAY BTOP50 CTA INDEX S&P 500 S&P
IDOG ALPS INTERNATIONAL SECTOR DIVIDEND DOGS ETF VALUE, INCOME, DIVERSIFICATION
 ALPS INTERNATIONAL SECTOR DIVIDEND DOGS ETF VALUE, INCOME, DIVERSIFICATION analysis diversification discipline IDOG provides the potential opportunity to capture above-market returns and high dividend
Claymore Presentation. Som Seif President & CEO Claymore Investments, Inc.
 Claymore Presentation Som Seif President & CEO Claymore Investments, Inc. Claymore ETFs: Intelligent ETFs for Canada Claymore Investments (Canada) is a subsidiary of Claymore Group (US) Designed for Canadian
BMO Value ETFs Enhanced Access to the Value Factor
 BMO Exchange Traded Funds BMO Value ETFs Enhanced Access to the Value Factor BMO Value Index ETF (ZVC) BMO MSCI USA Value Index ETF (ZVU) Defining the Value Factor Value factor investing- the pursuit of
Early on, your needs were simple. The memory of
 Client Guide Early on, your needs were simple. The memory of investing your first hard-earned dollars is etched in your mind. As you established yourself and began to experience success, your needs changed.
Portfolio Review xxx Quarter 20xx. Evolution 100i Model Portfolio Portfolio Review First Quarter 2018
 Portfolio Review xxx Quarter 20xx Evolution 100i Model Portfolio Portfolio Review First Quarter 2018 Q1 Evolution 100i Model Portfolio Standard geographic asset allocation and blend of investment styles
PRELIMINARY AND PRO FORMA PROSPECTUS. Initial Public Offering and Continuous Distribution September 4, 2012
 This is a preliminary prospectus in respect of each of Vanguard FTSE Canadian High Dividend Yield Index ETF, Vanguard FTSE Canadian Capped REIT Index ETF, Vanguard Canadian Short-Term Corporate Bond Index
Performance Review. University of Guelph Endowment Funds. 2 nd Quarter 2018
 Performance Review University of Guelph Endowment Funds 2 nd Quarter 208 Prepared by: Pavilion Advisory Group Ltd. 250 René-Lévesque Blvd. West, Suite 4030 Montreal, Quebec H3B 4W8 Canada Endowment Funds
Morgan Stanley ETF-MAP 2 Index Information
 Morgan Stanley ETF-MAP 2 Index Information Investing in instruments linked to the Morgan Stanley ETF-MAP 2 Index involves risks not associated with an investment in other instruments. See Risk Factors
PROSPECTUS. Initial Public Offering and Continuous Offering February 2, 2018
 No securities regulatory authority has expressed an opinion about these securities and it is an offence to claim otherwise. PROSPECTUS Initial Public Offering and Continuous Offering February 2, 2018 This
Additional series available. Morningstar TM Rating. Funds in category 321. Fixed income % of fixed income allocation
 Sun Life Granite Conservative Portfolio Investment objective Series A $11.4092 Net asset value per security (NAVPS) as of August 21, 2018 $-0.0023-0.02% Benchmark Blended benchmark Fund category Global
Factor Investing by ishares
 Factor Investing by ishares Smart Beta strategies for the core of your portfolio ICRMH0219U-732979-1/24 Active funds are under pressure Underperformance. High fees. Capital gains distributions. Active
Additional series available. Morningstar TM Rating. Funds in category. Fixed income %
 Sun Life Granite Conservative Portfolio Series A $11.2161 Net asset value per security (NAVPS) as of April 04, 2018 $0.0083 0.07% Benchmark Blended benchmark Fund category Global Fixed Income Balanced
BMO Exchange Traded Funds (ETFs)
") #ETFsymp @IFAMagazine The ETF evolution Simon Cordery Bank of Montreal For professional investors only BMO Exchange Traded Funds (ETFs) The ETF Evolution June 2016 1 Agenda History Innovation Market growth
#ETFsymp @IFAMagazine The ETF evolution Simon Cordery Bank of Montreal For professional investors only BMO Exchange Traded Funds (ETFs) The ETF Evolution June 2016 1 Agenda History Innovation Market growth
Additional series available. Morningstar TM Rating. Funds in category 797. Fixed income % of fixed income allocation
 Sun Life Granite Growth Portfolio Investment objective Series A $14.1960 CAD Net asset value per security (NAVPS) as of September 14, 2018 $0.0440 0.31% Benchmark Blended benchmark Fund category Global
a glance
 Investments @ a glance We ve made saving for a brighter retirement easier with simple, low-cost investments solutions designed specifically for your plan. Sun Life Financials investment solutions provide
Portfolio Series Conservative Balanced Fund. Portfolio Review Second Quarter 2015
 Portfolio Review Second Quarter 2015 Q2 Portfolio Performance (Class A) 1 Month 3 Months 6 Months 1 Year 3 Years 5 Years 10 Years Since Inception (December 2001) -1.5% -1.9% 4.0% 7.0% 10.3% 8.8% 5.1% 5.2%
Additional series available. Morningstar TM Rating. Funds in category 437. Fixed income % of fixed income allocation
 Sun Life Granite Conservative Portfolio Investment objective Series A $11.3234 CAD Net asset value per security (NAVPS) as of April 18, 2019 $0.0289 0.26% Benchmark Blended benchmark Fund category Global
Portfolio Review xxx Quarter 20xx. Evolution 40i60e Model Portfolio Portfolio Review First Quarter 2018
 Portfolio Review xxx Quarter 20xx Evolution 40i60e Model Portfolio Portfolio Review First Quarter 2018 Q1 Overview Diversified portfolios capture gains from asset classes and security types that are performing
Exchange Traded Fund Strategies
 Exchange Traded Fund Strategies 221 W. 6 th Street, Suite 1210 Austin, Texas 78701 Phone 512.477.3110 Fax 512.472.1046 Teresa Finney Senior Vice President, Investments Richard A. Funk, CFP First Vice President,
Additional series available. Morningstar TM Rating. Funds in category. Fixed income % of fixed income allocation
 Sun Life Granite Balanced Portfolio Series A $13.1649 Net asset value per security (NAVPS) as of November 27, 2017 $-0.0102-0.08% Benchmark Blended benchmark Fund category Global Neutral Balanced Additional
Additional series available. Morningstar TM Rating - Funds in category. Equity style Market cap % Micro 0.2. as of October 31, 2018
 Sun Life Excel India Fund Series A Additional series available Note: On June 18, 2018, the Excel India Fund changed its name to the Sun Life Excel India Fund. $35.1566 CAD Net asset value per security
Maximize your clients income. CI Income Solutions
 Maximize your clients income CI Income Solutions Maximize your clients income with CI Today s investors may be facing low interest rates and a lack of yield but they aren t facing lack of choice to maximize
CONNECTING INVESTORS TO GLOBAL MARKETS. An Advisor s Guide to Trading ETFs
 FOR INSTITUTIONAL USE ONLY NOT FOR PUBLIC DISTRIBUTION CONNECTING INVESTORS TO GLOBAL MARKETS An Advisor s Guide to Trading ETFs Accurate knowledge of the liquidity and trading mechanics of ETFs helps
Asset allocation and goals-oriented solutions
 Asset allocation and goals-oriented solutions James Dutkiewicz, CFA Chief Investment Strategist and Senior Portfolio Manager Disclaimer Commissions, trailing commissions, management fees and expenses all