COMMISSION OF THE EUROPEAN COMMUNITIES COMMISSION STAFF WORKING DOCUMENT
|
|
|
- Claude Howard
- 5 years ago
- Views:
Transcription
1 COMMISSION OF THE EUROPEAN COMMUNITIES Brussels, SEC(2008) 2750 COMMISSION STAFF WORKING DOCUMENT ACCOMPANYING THE REPORT FROM THE COMMISSION TO THE COUNCIL AND THE EUROPEAN PARLIAMENT on the financial instruments of the multiannual programme for enterprise and entrepreneurship, and in particular for small and medium-sized enterprises (SMEs) ( ) End report as at (including key results as at ) (pursuant to Article 5(1) of Council Decision 2000/819/EC, as amended by Decisions 593/2004/EC and 1776/2005/EC of the European Parliament and of the Council) {COM(2008)708 final} EN EN
2 Table of contents 1. Section I Tables and Figures SME Guarantee Facility 4 Figure 1 Cumulative evolution of EIF operations (per year) 4 Figure 2 Commitments to Financial Intermediaries (per year) 5 Table 1 Leverage effect (gearing) and Note: Estimation of enhanced access to finance for SMEs 6 Table 2 Calls received and recoveries 9 Table 3 Financial Intermediaries Loan Guarantee Window Micro-credit and Equity Guarantee Windows 12 Table 4 Beneficiary SMEs Breakdown by country 13 Table 5 Beneficiary SMEs Breakdown by country and size class 14 Figure 3 Beneficiary SMEs Breakdown by sector All windows Loan Guarantee Micro-credit Equity 16 Table 6 Estimated investment volume by window ETF Start-up Facility 17 Figure 4 Cumulative evolution of EIF operations (per year) 17 Table 7 VC funds with contractual agreements with the EIF Seed capital action 22 Figure 5 Cumulative evolution of EIF operations (per year) 22 Table 8 VC Funds with contractual agreements with the EIF 22 2 Section II Maps 23 EN 2 EN
3 3 Section III SME Guarantee Facility, ETF Start-up Facility, Seed Capital Action: description and specific conclusions 4 Section IV Joint European Venture (JEV) programme: specific information Section V Successor Programme CIP 35 EN 3 EN
4 1. SECTION I TABLES AND FIGURES 1.1. SME Guarantee Facility Figure 1: SME Guarantee Facility - Cumulative evolution of EIF operations (per year), data referring to the last quarter of the corresponding year EUR million Total budget reached nearly EUR 300 million 300,00 250,00 200,00 150,00 100,00 50,00 0,00 Q4/2001 Q4/2002 Q4/2003 Q4/2004 Q4/2005 Q4/2006 Total budget Guarantee call payments pursuant to defaulted loans EIF signatures to FIs EIF commitments to FIs Budget available for commitments to FIs (net of EIF fees) Interest and other income Source: PMS/Report/Strategic/Commitment Overview/SMEG01 Data extraction: EN 4 EN
5 Figure 2: SME Guarantee Facility Commitments to Financial Intermediaries (per year) Still commitments at the end of the programme EUR million EIF commitments to Financial Intermediaries Source: PMS/Report/Strategic/Commitment Overview/SMEG01 Data extraction: EN 5 EN
6 Table 1: SME Guarantee Facility - Leverage effect (gearing) Leverage effect achieved at with the Community funds in the terms of: (a) Estimated volume of loans (b) Guaranteed amounts Cap Amounts 1 Estimated underlying loan volume supported Maximum EIF Guarantee Amount Leverage effect Leverage effect EUR million EUR million EUR million (a) (b) Loan guarantee window Micro-credit window Equity guarantee window Total , , Source: EIF Quarterly Report 31 December 2006 SMEG 2001 Facility Report issued: Note: Estimation of enhanced access to finance for SMEs (a) Methodological background Basic approach Under the SME Guarantee Facility ("SMEG"), the EU provides guarantees to Financial Intermediaries ("EU Guarantees") with a view to increasing and improving access to finance for SMEs. This is referred to here as "enhanced access to finance" ("EAF"). EAF is a complex issue that can rarely be studied directly. Looking back, it is impossible to know with precision what would have happened in the absence of the programme. In the literature, this is referred to as the counterfactual problem of measurement. A detailed analysis of the EAF can only be carried out in the context of an evaluation (see point 3 on the planned evaluation). The purpose of this report is to provide an estimate that can serve as an input to such an analysis. Here a quantitative approach is taken, based on data available from EIF. This approach is subject to certain constraints and limitations set out below. 1 Corresponds to cap amounts signed between the EIF and Financial Intermediaries. EN 6 EN
7 It should be noted that EAF can also be estimated by other methods, for example surveys that ask beneficiary SMEs about the loans they would have received/not received with/without support by the SMEG. 2 The basis for calculations The following definitions, considerations and assumptions have been used in order to estimate the EAF achieved under the SMEG as at the reporting date: The EAF should be measured by comparing the actual volumes (AV) 3 of financing, guarantees and counter-guarantees provided for the benefit of SMEs against a baseline, called the Reference Loan or Guarantee Volume (RLV): EAF = AV RLV (1) The RLV represents an estimate of the amount of guarantees or financing that the Financial Intermediary could reasonably be expected to achieve during the availability period in the absence of the EU Guarantee, having regard to comparable products, and subject to, inter alia, prevailing market conditions, where applicable. The RLV and the EAF are established by the EIF using its professional judgement and experience. There are however certain limitations that should be kept in mind: EAF is based on the EIF ex-ante estimate of the funding that Intermediaries could reasonably have been expected to provide in the absence of an EU Guarantee, there are limitations to a simple extrapolation of past finance volumes : historic data could be incomplete, market conditions can change, a modified or entirely new lending product offered by an intermediary in response to the EU guarantee is likely to result in a different level of credit risk from that previously covered by the Intermediary, etc. figures reflect the situation as at the reporting date; actual volumes can still change until the end of the latest availability period (usually ), thus impacting EAF. Gearing is then calculated by comparing EAF to the total cap 4 amounts: Gearing = EAF/total cap amounts actually paid (2) Regarding formula (2), it should be kept in mind that the denominator will be known with precision only once all the EU Guarantees have expired and all payments due under the Facility will have been made. Taking into account these considerations, the estimation of EAF has been made using the approach set out below. (b) Calculations All calculations are based on figures provided by the EIF. EAF Calculation of the difference between the actual volume of loans and guarantees extended with the EU support, and the Reference Loan Volume: These other methods will also be taken into account in the context of the planned evaluation. Actual volume: means the volume of financing, guarantees and counter-guarantees included in the portfolios benefiting from the EU Guarantee. The cap amount is the maximum aggregate amount which the EC is liable to pay to the financial intermediary under the SMEG. EN 7 EN
8 Reference Loan Volume (RLV) Actual Portfolio Volume (AV) of financial intermediaries extended with EU support 5 2,100 million EUR 8,359 million EUR Difference 6,259 million EUR It is therefore estimated, that thanks to the EU intervention, an additional volume of loans, guarantees and counter-guarantees of nearly EUR 6.3 billion has been created by financial intermediaries to support final beneficiaries. Extrapolation of the loan volume Taking into account the risk sharing arrangements between the EIF and intermediaries, EIF's reported data on the total loan volume supported and EIF's calculations of RLV, the following extrapolations can be made, based on the ratio resulted from the calculation under 2.1: Extrapolated loan volume that would have been extended by financial intermediaries without EU support (estimate) Loan volume to final beneficiaries extended with EU support 6 (estimate) Difference 4,384 million EUR 17,449 million EUR 13,065 million EUR Based on these figures and assumptions, the EU intervention helped to support an estimated additional financing volume to final beneficiaries (SMEs) of more than 13 billion EUR. Gearing Based on the EIF figures, the gearing attributed to this additional loan volume can be estimated as follows: (a) Additional loan (b) Cap amounts Gearing: (a)/(b) 13,065 million EUR million EUR 50 7 (c) Planned evaluation The Terms of Reference prepared for the interim evaluation of the "Entrepreneurship and Innovation Programme" under the successor programme CIP foresee a more detailed analysis by the external evaluators of the results and impacts of the previous MAP programme, including an assessment of the financial instruments, which will cover the gross and net results achieved in terms of enhanced access to finance. This evaluation is scheduled to be completed in December Actual Portfolio Volume extended with EU support. This volume could further increase up to the Maximum Portfolio Volume (MPV - EUR 10,666 million), which under MAP will stabilize at the end of the latest availability period. It follows that the ratio of Actual used Portfolio Volume/Reference Loan Volume could further increase in the next few years. 6 Estimate at the end of This estimated volume might still slightly increase until the end of the last availability period (usually ). 7 In case the payments actually made are below the total cap amounts, the gearing would increase. EN 8 EN
9 Table 2: SME Guarantee Facility - Calls received and recoveries Amount (EUR) Calls received 46,843,834 Recoveries received - 6,819,064 Net called guarantees (*) 40,024,770 (*) Calls received less recoveries received Source: EIF Quarterly Report 31 December 2006 SMEG 2001 Facility Report issued: EN 9 EN
10 Table 3: SME Guarantee Facility Financial Intermediaries Overview by window and by country; approvals as of (3.1) Loan Guarantee Window Name Country Cap amount EUR million Max EIF guarantee amount EUR million FIs with contract under previous Growth and Employment initiative LOAN Austria Wirtschaftsservice (AWS) Austria Yes Fonds de Participation (FdP) Belgium Yes Encouragement Bank Bulgaria No Raiffeisen Bank Bulgaria Bulgaria No Cyprus Development Bank Cyprus No Czech Moravian Bank Czech Rep No Ceska Sporitelna Czech Rep No The Danish Investment Fund Denmark Yes KredEx Estonia No Finnvera Finland Yes Siagi France No SOCAMA France No Sofaris France Yes KfW (ex DtA) Germany Yes TEMPME Greece No HVB Bank Hungary No Rural Credit Guarantee Foundation Hungary No Artigiancredit Lombardia Italy Yes ATI Allenza di Garanzia Italy No ATI Controgaranzia /APEROL Italy No ATI Garanzia Diretta Italy No EN 10 EN
11 (3.1 continues) Name Country Cap amount EUR million Max EIF guarantee amount EUR million FIs with contract under previous Growth and Employment initiative LOAN ATI Sistema Garanzia Umbria Marche Italy No Mediocredito Centrale Italy Yes Mortgage and Land Bank (Hipoteku B.) Latvia No INVEGA Lithuania No Malta Enterprise Corporation Malta No BBMKB Netherlands Yes Innovation Norway Norway No Bank BPH SA Poland No Polfund Poland No SPGM Portugal Yes BRD Romania No Raiffeisen Bank Romania No Tatra Banka AS Slovakia No VUB Slovakia No Slovene Enterprise Fund Slovenia No Banco Santander Central Hispano Spain No CERSA Spain No Almi Sweden Yes KGF Turkey No Total EN 11 EN
12 (3.2) Micro-credit and Equity Guarantee Windows Name Country Cap amount EUR million Max EIF guarantee amount EUR million FIs with contract under previous Growth and Employment initiative MICROCREDIT Fonds de Participation (FdP) Belgium Yes ADIE France No KfW (ex DtA) Germany Yes First Step Ireland No Cultura Sparebank Norway No ICO Spain No La Caixa Spain No The Enterprise Fund Spain No The Prince's Trust and Prince's Scottish Youth Business Trust UK Yes Total EQUITY Austria (AWS) Wirtschaftsservice Austria Yes Sofaris France Yes Total Sources: PMS/Reports/Report/Project; Data extraction: EIF quarterly report - SMEG 2001 Facility, EN 12 EN
13 Table 4: SME Guarantee Facility Beneficiary SMEs Breakdown by country Number of SMEs, Average loan amount All windows: Loan Guarantee, Micro-credit, Equity As of Number of Average loan amount Country beneficiary SMEs in EUR Austria 3, , Belgium 2,140 40, Bulgaria , Cyprus 5 85, Czech Republic 2, , Denmark , Estonia , Finland 2, , France 43,977 27, Germany 15,770 26, Greece , Hungary , Ireland 96 10, Italy 69,964 76, Latvia , Lithuania , Malta , Netherlands 3, , Norway , Poland 5,662 27, Portugal , Romania , Slovakia , Slovenia , Spain 20, , Sweden 7,110 46, Turkey , United Kingdom 13,495 3, All 193,790 62, Source: EIF; data extraction: EN 13 EN
14 Table 5: SME Guarantee Facility Beneficiary SMEs Breakdown by country and size class Number of SMEs All windows: Loan Guarantee, Micro-credit, Equity As of Country Total Austria 2, ,029 Belgium 2, ,140 Bulgaria Cyprus Czech Republic 1, ,146 Denmark Estonia Finland 2, ,350 France 42,705 1, ,977 Germany 15, ,770 Greece Hungary Ireland Italy 62,963 6, ,964 Latvia Lithuania Malta Netherlands 2, ,340 Norway Poland 4,202 1, ,662 Portugal Romania Slovakia Slovenia Spain 18,077 1, ,088 Sweden 6, ,110 Turkey United Kingdom 13, ,495 All 177,625 14,413 1, ,790 Source: EIF; data extraction: EN 14 EN
15 Figure 3: SME Guarantee Facility Beneficiary SMEs Breakdown by sector as of Source: EIF, data extraction: Figure 3.1: All windows: Loan Guarantee, Micro-credit, and Equity in %; total number: 193,790 SMEs Wholesale and retail trade; repair ; 21.59% Transport, storage and telecommunications 6,02% Others; 0.10% SMEG- all windows Agriculture, hunting and forestry, fishing, mining and quarrying; 2.64% Community, social and personal service activities; 9.72% Construction; 17.01% Education; Health and social w ork; 2.33% Real estate, renting, other businesses activities; 8.05% Financial intermediation; 0.29% Activities of households; 3.35% Manufacturing; 22.19% Hotels and restaurants; 6.43% Electricity, gas and w ater supply; 0.27% Figure 3.2 Loan Guarantee in %; total number: 162,939 SMEs Wholesale and retail trade; repair ; 19.69% Transport, storage and telecommunications 6,66% SMEG - Loan Guarantee Others; 0.105% Agriculture, hunting and forestry, fishing, mining and quarrying; 2.15% Construction; 18.48% Community, social and personal service activities; 8.26% Education; Health and social w ork; 2.22% Real estate, renting, other businesses activities; 7.54% Activities of households; 2.79% Manufacturing; 24.86% Hotels and restaurants; 6.70% Electricity, gas and w ater supply; 0.25% Financial intermediation; 0.28% EN 15 EN
16 Figure 3.3: Micro-credit (in %; total number: 30,552 SMEs) Wholesale and retail trade; repair; 31.83% Transport, storage and telecommunications 2,64% SMEG - Micro-credit Others; 0.05% Agriculture, hunting and forestry, fishing, mining and quarrying; 5.29% Community, social and personal service activities; 17.54% Construction; 9.31% Education; Health and social w ork; 2.92% Real estate, renting, other businesses activities; 10.38% Activities of households; 6.33% Manufacturing; 7.94% Hotels and restaurants; 5.04% Electricity, gas and w ater supply; 0.37% Financial intermediation; 0.37% Figure 3.4: Equity (in %; total number: 299 SMEs) Community, social and personal service activities; 1,34% Wholesale and retail trade; repair ; 11,71% Transport, storage and telecommunications 4,348% Others; 4,35% MAP - EQUITY Construction; 2,34% Real estate, renting, other businesses activities; 52,51% Education; Health and social w ork; 0,67% Electricity, gas and w ater supply; 0,33% Financial intermediation; 0,33% Manufacturing; 22,07% Table 6: SME Guarantee Facility - Investment volume by window As of Investment EUR million Loan Guarantee Micro credit 437 Equity Guarantee 270 Total SMEG Source: EIF Quarterly Report 31 December 2006 SMEG 2001 Facility Report issued: EN 16 EN
17 1.2. ETF Start-up Facility Figure 4: ETF Start-up Facility Cumulative evolution of EIF operations (per year) Data referring to the last quarter of the corresponding year Total budget more than EUR 220 million EUR million Q4/2001 Q4/2002 Q4/2003 Q4/2004 Q4/2005 Q4/2006 Total budget Budget available for commitments to FIs (net of EIF fees) EIF Commitment to FIs EIF Signatures to FIs Disbursements to FIs Interest and other income Source: PMS/Report/Strategic/Commitment overview/esu01 Data extraction: EN 17 EN
18 Table 7: ETF Start-up Facility Venture Capital funds with contractual agreements with the EIF Situation as of (*) Projects approved but still to be signed. (**) Legal seat may differ Name Country of headquarters (**) Geographical orientation Sector focus Establishment year Duration (years) Fund size (EUR million) Current Target Adara Ventures SICAR Spain Spain Communications, Computer related Aescap Venture Netherlands Northern Europe with emphasis on Benelux and Germany Biotechnology, Medical/health related Auriga Ventures III France France (50%) EU countries (25%), Switzerland, USA, Israel (25%) Biotechnology, Communications, Computer related, Medical/health related, Other Electronics related Big Bang Ventures II Belgium Flander region Communications, (60-80%), Computer Related remaining part in the Benelux countries (*) Capital-E Belgium Flander region Microelectronics (*) (60), remaining part in the rest of Europe Creandum II L.P. Sweden Sweden (70- Communications, 80%) and nearby Nordic Computer related countries including Denmark, Finland and Norway (*) EN 18 EN
19 (Table 7, continued) Name Country of headquarters (**) Geographical orientation Sector focus Establishment year Duration (years) Fund size (EUR million) Current Target Creathor Germany Germany (70%), France (20%, other European countries (10%) incl. small percentage to Switzerland Communications, Computer related, Optics, Microand Nanotech and new materials Crescent Capital II UK UK Technology related sector Debaeque II FCR Spain Primarily in Spain (80%) and opportunistically in other countries (20%) which may include nonparticipating countries on an exceptional basis Communications, Computer related (85 %(, life science (15%) (*) Eden LP One UK UK Communications, Computer related, Other Electronic related EMBL Technology Fund Germany EMBL member states Biotechnology, Medical/health related Gilde Healthcare II Netherlands Multi-regional orientation: Benelux, France, United Kingdom, Spain and Germany Biotechnology, Medical/health related EN 19 EN
20 (Table 7, continued) Name Country of headquarters (**) Geographical orientation Sector focus Establishment year Duration (years) Fund size (EUR million) Current Target Innogest Capital Italy Northern Italy Innovation driven technology sector IP Venture Fund United Kingdom United Kingdom and pan-european Biotechnology, Chemicals and Materials, Communications, Energy, Industrial Automation, Medical/health related New VCF II Tech Luxembourg Multi-country Communications, Computer related Pontis Venture Partners I Beteiligungs- Invest AG Austria Austria Biotechnology, Communications, Computer Related, Industrial Automation, Industrial Products and Services, Medical/health Related, Other Electronics Related Talde Capital II Spain Spain Generalist, Biotechnology, Communications, Computer Related The Environment Technologies Fund UK EU, Clean predominantly technologies and UK, D, Nordic services countries, Benelux and CH EN 20 EN
21 (Table 7, continued) Name Country of headquarters (**) Geographical orientation Sector focus Establishment year Duration (years) Fund size (EUR million) Current Target T-Source France France Communications, Computer related, Other Electronic Related VIVES Belgium Belgium Biotechnology, Communications, Computer related Wellington Partners III Life Sciences Fund L.P. Germany Mainly Germany and German speaking countries and on a coinvestment basis in other European countries Biotechnology TOTAL ,264.6 Sources: PMS/Reports/VC; extraction date: EIF, Quarterly Report ETF Start-up, ; issued EN 21 EN
22 1.3. Seed capital action Figure 5: Seed capital action Cumulative evolution of EIF operations (per year) Data referring to the last quarter of the corresponding year 6,00 Performance remains low 5,00 EUR million 4,00 3,00 2,00 1,00 0,00 Q4/2001 Q4/2002 Q4/2003 Q4/2004 Q4/2005 Q4/2006 Total budget EIF Commitment to FIs Budget available for commitments to FIs (net of EIF fees) EIF signatures to FIs Disbursements to FIs Source: PMS/Report/Strategic/Commitment/Overview/SCA01 Data extraction: Table 8: Seed Capital Action Venture Capital Funds with contractual agreements with the EIF As of Name Country of headquarters Geographical orientation Sector focus Establishment year Duration (years) Fund size (EUR million) Current Target EMBL Technology Fund Germany EMBL member Biotechnology, states Medical/health related Pentech Fund I United Kinddom United Kingdom Computer related Total Source: EIF, Quarterly Report, Seed Capital Action, ; issued EN 22 EN
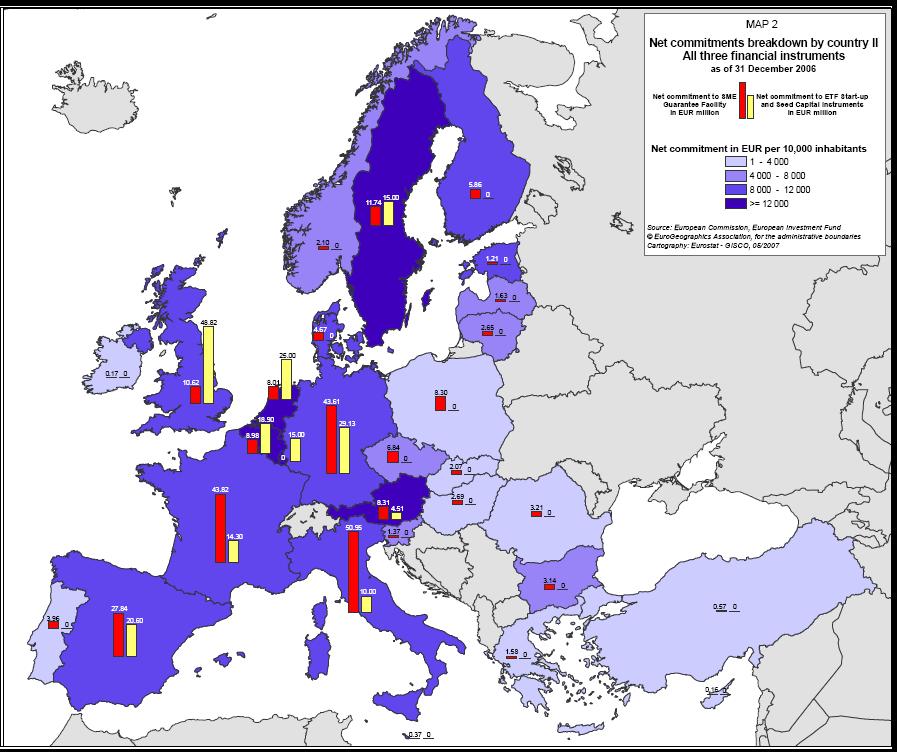
23 2. SECTION II: MAPS Map 1, page 18 Shows the geographical coverage of the MAP, based on the EC net commitments as at , all three financial instruments included. In addition, map 1 shows the relation of the EC net commitment to the GDP for each participating country. Map 2, page 19 Shows the relation between EC net commitments and the population figures per country. It also indicates both the amounts spent from the SMEG facility and from the ETF + SCA, for each country. Map 3, page 20 Illustrates the number of beneficiary SMEs per country, also in relation to the population. EN 23 EN

24 EN 24 EN
25 EN 25 EN

26 EN 26 EN
27 3. SECTION III: DESCRIPTION OF FINANCIAL INSTRUMENTS AND CONCLUSIONS 3.1. SME Guarantee Facility Description The objective of this Facility was to promote entrepreneurship and to enhance growth and competitiveness, by improving the financial environment for business, especially for SMEs. The Facility provided support for higher volumes of guarantees for the existing guarantee products of the Financial Intermediaries (FIs) 8 and guarantees for riskier loans, thus facilitating access to financing for a larger number of small companies for a wider variety of investments. It also supported the creation and development of new guarantee schemes, by covering part of the losses incurred under the guarantees, up to a pre-determined amount (the cap" 9 ). The Facility is managed by the EIF on behalf of the European Commission. The EIF identified, evaluated and selected potential FIs for the Facility in accordance with the relevant Guarantee Policy. Some FIs may employ stricter SME eligibility criteria, depending on their specific guarantee or loan products. In all cases, the origination and risk assessment as well as monitoring and recovery actions with regard to the final SME beneficiaries remain the full responsibility of the selected Financial Intermediaries. The following windows were available under the SME Guarantee Facility: Loan Guarantees: aimed at enterprises with growth potential and with 100 or fewer employees. Under this window, the EIF issues partial guarantees or counterguarantees to cover portfolios of loans or guarantees. Micro-credit Guarantees: supports micro-loans for very small enterprises with 10 or fewer employees. Here, the EIF issues partial guarantees to cover portfolios of micro-loans. Equity Guarantees: counter- or co-guarantees offered to guarantee schemes to cover equity investments in SMEs (no direct guarantees to Venture Capital funds). ICT Guarantees: this window was intended to cover portfolios of loans specifically dedicated to the financing of IT equipment, software and training to promote the use of the internet and e-commerce. No projects have been approved under the ICT window. There was no demand for this window, since ICT loans can also be guaranteed under the Loan Guarantee window, so the ICT window was discontinued for the CIP programme Conclusions for the SME Guarantee Facility The SME Guarantee Facility has had a strong impact over the entire programme period and has undoubtedly improved access to finance for SMEs. 8 9 Direct lending provided by commercial and promotional banks was also supported. The cap is a pre-set amount, fixed both in Euro and as a percentage, and defines EIF s maximum liability towards a FI. The cap is based on expected losses. The financial risk to the Community s budget is limited in the first instance by the cap and in the second by the guarantee rate approved by the Commission for a given intermediary (typically 50%). EN 27 EN
28 The entire budget has been used and nearly 194,000 enterprises, representing about 1 % of existing European enterprises, have benefited 10. This figure also represents more than 10 % of newly created enterprises 11. The SME Guarantee Facility allowed Financial Intermediaries to increase substantially the volume of loans they granted to SMEs and to take on higher risk. There is further added value, particularly in the Micro-credit Window, where "disadvantaged" groups have also benefited from the programme. The Facility has a high leverage effect, especially under the Loan Guarantee Window, where for each EUR 1,000 of EC money committed, there is more than EUR 80,000 of loan volume. (cf. chapter of the main report and Section I, Table 1, of this Staff Working Document). The rather flexible, market-driven structure of the SME Guarantee Facility has meant it could be easily adapted to different market, national and regional conditions, allowing it to achieve both a wide range of application and a broad geographical distribution. A higher level of transparency has been achieved by increased monitoring and reporting requirements, which must be carried through all the way down to the final beneficiaries. Visibility of the EU contribution was ensured through a requirement for the FIs to mention the EU support in the loan agreements with SMEs. The Loan Guarantee window proved to be an appropriate scheme for most Financial Intermediaries, allowing them to significantly increase their financing to SMEs. It is by far the most used of all windows in terms of monies committed. The Micro-credit window allowed some of the Financial Intermediaries to enter into the field lending to micro-enterprises, which may have been previously excluded from access to finance. It also improved access to finance for the self-employed and some disadvantaged groups. The Equity Guarantee window was little used. It guarantees larger investments for fastgrowing high-tech companies, which means that the target group is similar to that of Venture Capital funds and therefore limited overall. There were also some technical constraints. The ICT Loan Guarantee window, designed as a sectoral window, did not attract any demand, due to its narrow focus. It is assumed that part of such ICT investments are covered by the "general" Loan Guarantee window ETF Start-up Facility Description The objective of ETF Start-up was to increase the availability of risk capital to innovative SMEs during their creation and their early stage development. Under ETF Start-up, the EIF invests EU money in specialised Venture Capital (VC) funds established to provide equity or other forms of risk capital to SMEs. The funds considered under this Facility are typically small or newly established, including funds operating at regional level, those focusing on specific industries or technologies and funds that finance the commercialisation of R&D results According to Eurostat there are about 18.8 million enterprises in EU-27 (figures for 2004), and % of these are SMEs. According to Eurostat: Statistics in Focus 48/2007, the newly created enterprises accounted for 9.2 %, on average, of the total of active enterprises (figures for 2003) EN 28 EN
29 The EIF examines the fund proposals based on criteria that include size, level of involvement from the private sector, investment strategy, target market, deal flow, proposed terms, expected rate of return, management team and the extent to which the EIF investment in the VC fund is expected to have a catalytic effect in raising funds. The ETF Start-up investments in risk capital funds are made on equal terms ( pari passu ) with private investors. The ETF Start-up Investment Guidelines specify that investments under the Facility must represent between 10% and 25% of the total capital of a VC fund or business incubator, or 50% in exceptional cases, such as new funds where a particularly strong catalytic role in the development of VC markets for a specific technology or in a specific region is probable. Investments can be made up to a maximum amount of EUR 10 million. In exceptional, duly substantiated cases the amount committed may be higher, but will not in any case exceed EUR 15 million. Where the investment policy of a VC fund foresees investments outside the eligible countries, the EIF's participation is reduced by the appropriate corresponding percentage. In all cases the majority of the capital fund must be invested in eligible countries Conclusions for the ETF Start-up Facility The facility is tailored to the strategically important area of seed and early stage investments in mainly high tech enterprises with high growth potential, where there is a are generally accepted market failure. ETF Start-up thus played an important role in contributing to the implementation of the Lisbon strategy. The demand for early stage funding remains strong and European technology centres (especially research centres and universities) continue to generate valuable results in terms of concepts and intellectual property rights. The entire budget allocated to ETF Start-up has been used. ETF Start-up has often had a catalytic effect in the establishment of early stage VC funds making it possible to attract more investors and thereby allowing funds to invest larger amounts, to have more resources available for follow-on investments in selected SMEs and to achieve a more commercially viable size. In several cases, VC funds would not have materialised without the investment made under the ETF Start-up Facility since the minimum size for a viable fund would not have been reached. The improved market cycle in 2006 resulted in the recovery of the venture capital market, with a significant impact on the number of new investments under ETF-Start-up, although investors remained much more reluctant to invest in early stage enterprises than later those in later stages of development. The EIF s investment in VC funds under ETF Start-up also gave a degree of reassurance regarding the quality of the funds, thus helping to attract other investors Seed Capital Action Description The Seed Capital Action (SCA) aimed to stimulate the supply of capital for the creation of innovative new businesses with growth and job-creation potential, including those in traditional economic sectors, through support for seed funds, incubators and similar schemes. The SCA is managed by the EIF on behalf of the European Commission. The action provides support for the long-term recruitment of additional investment managers to reinforce the capacity of the venture capital industry to cater for investments in seed capital. SCA provides grants covering management costs up to EUR 100,000 per newly recruited manager and for a maximum of 3 new staff per beneficiary. EN 29 EN
30 Conclusions for the Seed Capital Action The demand for this instrument was significantly below expectations. Constraints in terms of eligibility criteria and difficult market conditions for seed capital meant that demand was limited. Based on this experience, the instrument will therefore be modified under the CIP programme. EN 30 EN
31 4. SECTION IV: JOINT EUROPEAN VENTURE (JEV) PROGRAMME 4.1. Description of the JEV programme The JEV programme aimed to encourage joint ventures between European SMEs in the European Economic Area 12, thereby helping them to benefit from the opportunities offered by the single market. Following the decision (593/2004/EC) of the European Parliament and the Council of 21 July 2004 to phase out the JEV programme, no new submissions have been accepted since 29 December The contribution was intended to cover some of the expenses related to the setting up of a joint venture (Facility for preparatory work and investment). The amount (maximum EUR 100,000 per project) and the terms of this contribution were as follows: The first part of the contribution covered up to 50 % of the eligible expenses with a maximum ceiling of EUR 50,000. Eligible expenses included the expenses of the market survey, the preparation of the legal framework and the business plan, the analysis of the environmental impact, and any other expenses that are essential for the setting up of the joint venture. The second part of the contribution covered up to 10 % of the total amount of the investment made. In addition, initially JEV supported actions promoting the programme (Promotion Facility). The maximum amount of a contribution for the Promotion Facility was EUR 10,000 for promotional action material and EUR 20,000 for events intended to stimulate co-operation. It consisted of 50% of all eligible expenses and was in the form of a grant. Entities which were eligible to apply for a JEV Promotion Facility contribution were financial intermediaries, European, national or regional associations of SMEs, Chambers of Commerce, Euro-Info- Centres, the Business & Innovation Centres, and all other non-profit entities from European Union, such as trade and industry associations, public agencies and other entities, promoting investments eligible for the JEV Programme. In autumn 2001, the Commission suspended support for the Promotion Facility as the JEV Programme was undergoing a review and internal evaluation Budgetary situation The budgetary allocations for the JEV programme totalled EUR 57 million, including EUR 5 million allocated in 1997 for the JEV pilot action. Due to the very low utilisation of the programme, EUR 37.2 million were decommitted during the operational period of JEV in budgetary terms. With regard to the projects, at the end of 2006, the Commission services had committed EUR 19.8 million of the available budgetary resources to final beneficiary SMEs on the basis of approved applications. The total disbursements to beneficiary SMEs amounted to EUR 3.7 million Financial Intermediaries The JEV programme was implemented through a network of financial institutions. This network, constituted following a call for expressions of interest (Official Journal S 42 of 28 February 1998), comprised in total 31 financial intermediaries. 12 Decision of the EEA Joint Committee n 72/1999 of 15 June 1999 EN 31 EN
32 The table below gives an overview of the financial intermediaries by country: Table 1: Breakdown of financial intermediaries by country Country Number of financial intermediaries Austria 3 Belgium 1 Finland 1 France 1 Germany 6 Italy 11 Luxembourg 2 Portugal 2 Spain 3 Sweden 1 Total 31 An SME that wished to submit an application under this scheme had to contact one of the financial intermediaries in the network. This intermediary was entrusted with evaluating the application and passing it on to the Commission services. The latter then verified the eligibility of the application and the possible impact on employment. Out of the 31 financial intermediaries that remained in the network at the end of 2005, about one third never submitted an application for a joint venture project. Of the active financial intermediaries, one quarter accounted for more than three-quarters of the joint venture projects Review of the projects From the start of the programme in 1998 until 31 December 2006, after an in-depth assessment of potential projects by the financial intermediaries, 323 projects were received by the Commission services, of which 230 were approved. Of these, 54 were promotion projects and 176 were preparatory work and investment projects. The first year of the JEV programme (1998) was used by the Commission services to build the network of financial intermediaries and to implement the scheme. By the second year of the programme 104 projects had been received. In 2000 and in 2001 the number of new applications received remained at about the same level as the year before. This was lower than expected. In 2003 the number of new applications being received was on average one per month. In 2004, a 300% increase was seen but this was probably due to a last minute rush after the announcement of the closure of the programme. Almost one in three projects was refused by the Commission or withdrawn by the financial intermediary. Most refusals were due to non-compliance with the eligibility criteria or to insufficient impact as regards the setting-up of new economic activities involving investment EN 32 EN
33 and job creation. Most of the withdrawals were due to the level of administrative requirements related to the processing of the files and the resulting delays. Table 2: Employment in lead and partner SMEs Number of Employees Number of SMEs (cumulative figures) /2006 < Total Out of the 370 partner SMEs, 57 % had fewer than 10 employees, while 30 % had between 10 and 49 employees and 13% had more than 50 employees Employment With only 45 joint ventures created and reported so far, the effect on employment has been limited. At the end of 2006 only 19 applications had resulted in the investment grant being awarded based on investments realised in the newly created joint ventures. In each of the grant request cases, only about 20% of the job creation foreseen in the initial application forms had been realised. However, it should be taken into account that the job creation figures given in the grant application only reflect the current situation. Creation of, and investment in a joint venture is often a long process and it may be that further jobs will be created as the business progresses. There is also no information available on any jobs that may have been created within the partners enterprises as a result of the joint venture. The great majority of the joint ventures created and reported so far opted not to apply for the investment grant. The general opinion is that the procedures were too lengthy and complicated. Another reason for not applying for the investment grant is that the joint ventures have invested only limited amounts in fixed assets, so the 10% support has not been considered as incentive enough to justify the administrative effort. It can reasonably be assumed that jobs have also been created in the joint ventures that have decided not to apply for an investment grant but, in view of the actual job creation figures available for the four grants submitted, the numbers are probably rather limited Conclusions Demand for JEV from the market was much lower than originally expected. The programme was originally conceived, partly in response to requests from SME representative organisations, to complement the (then) existing ECIP (European Community Investment Partners) and JOP (Joint Venture Programme Phare/Tacis) joint venture programmes, which covered the ALAMEDSA and CEEC/NIS countries respectively. ECIP was closed at the end of 1999 and JOP during One effect of this was that some financial intermediaries who had offered ECIP, JOP and JEV to their SME clients scaled down or ceased their activities, EN 33 EN
34 since JEV alone did not provide them with a sufficient volume of projects to justify dedicated staff. The remuneration paid to financial intermediaries for submitting files was regarded by many as insufficient in view of the administrative obligations that the financial intermediaries have assumed when concluding the Framework Agreement with the Commission. Although the logic behind the JEV programme was considered sound, time has shown that there was in fact relatively little demand from SMEs for support for the creation of transnational joint ventures in the EU. In reality, SMEs investing in other Member States often preferred to create subsidiaries rather than joint ventures, or to enter into looser cooperation agreements without the obligation to create a new legal entity. Take-up of the programme may also have been affected by the need to impose thorough controls on the processing of applications in order to ensure sound financial management and reduce the risk of irregularities to the minimum. As a result, file processing times were longer than expected by the SME target group. EN 34 EN
35 5. SECTION V: SUCCESSOR PROGRAMME CIP The Competitiveness and Innovation Framework Programme (2007 to 2013) (CIP), successor programme of the MAP, is a coherent response to the objectives of the growth and jobs strategy. The legal base for the CIP entered into force on 29 November The CIP brings together into a single framework specific Community support programmes, and relevant parts of other Community programmes, in the fields most critical to boosting European productivity, innovation capacity and sustainable growth, whilst also addressing environmental concerns. It combines Community actions in the fields of entrepreneurship, SMEs, industrial competitiveness, innovation, ICT development and use, environmental technologies and intelligent energy. The CIP will help enterprises to grow and innovate, including by supporting private equity and loan guarantee schemes; improving the conditions for innovation, including ecoinnovation; stimulating the new converging markets for electronic networks, media content and digital technologies, and encouraging the uptake of new and renewable energies and promoting energy efficiency. The CIP comprises three specific programmes: the Entrepreneurship and Innovation Programme (EIP), which includes the CIP financial instruments; the ICT Policy Support Programme (ICTP); and the Intelligent Energy Europe Programme (IEEP). The CIP financial instruments further strengthens support for SMEs investing in ICT and innovation, including eco-innovation, as well as supporting SMEs in traditional sectors. A particular aim is to help SMEs, especially high-growth innovative companies in their early and expansion stages of development, to have easier access to finance. The CIP financial instruments build on those of the MAP and further extend support for access to finance. New elements have been introduced to reflect market developments, such as the possibility to support the provision of mezzanine finance for SMEs, and a window for securitisation. The instruments are: The High Growth and Innovative SME Facility (GIF): this instrument includes 2 windows: GIF1 for early stage investments (which already existed under ETF Start-up) and a new GIF2 window for expansion stage investments. Particular attention is also paid to VC funds whose main investment focus is on ecoinnovation. The SME Guarantee (SMEG) Facility: In the area of financial guarantees, the Loan and Micro-credit windows have been retained. Mezzanine financing is eligible under an extended Equity & Quasi-Equity window and there is also a new Securitisation window. The Capacity Building Scheme: This covers both the Seed Capital Action and the Partnership Action. The revised, more flexible Seed Capital Action provides grants to VC funds to cover start-up costs and costs related to the recruitment of additional staff. 13 Decision No 1639/2006/EC of the European Parliament and of the Council of 24 October 2006 establishing a Competitiveness and Innovation Framework Programme (2007 to 2013), OJ L310/15, EN 35 EN
36 The financial instruments are managed by the EIF on behalf of the Commission, except for the Capacity Building Scheme, which may also be implemented by other international financial institutions, including the European Bank for Reconstruction and Development (EBRD), the European Investment Bank (EIB) and the Council of Europe Development Bank (CEB). EN 36 EN
COMMISSION OF THE EUROPEAN COMMUNITIES REPORT FROM THE COMMISSION TO THE EUROPEAN PARLIAMENT AND THE COUNCIL
 COMMISSION OF THE EUROPEAN COMMUNITIES Brussels, 01.07.2002 COM(2002) 345 final REPORT FROM THE COMMISSION TO THE EUROPEAN PARLIAMENT AND THE COUNCIL Growth and Employment Initiative Measures on financial
COMMISSION OF THE EUROPEAN COMMUNITIES REPORT FROM THE COMMISSION TO THE COUNCIL AND THE EUROPEAN PARLIAMENT
 EN EN EN COMMISSION OF THE EUROPEAN COMMUNITIES Brussels, 7.11.2008 COM(2008) 708 final REPORT FROM THE COMMISSION TO THE COUNCIL AND THE EUROPEAN PARLIAMENT on the financial instruments of the multiannual
REPORT FROM THE COMMISSION TO THE EUROPEAN PARLIAMENT, THE COUNCIL, THE EUROPEAN ECONOMIC AND SOCIAL COMMITTEE AND THE COMMITTEE OF THE REGIONS
 EUROPEAN COMMISSION Brussels,.4.29 COM(28) 86 final/ 2 ANNEXES to 3 ANNEX to the REPORT FROM THE COMMISSION TO THE EUROPEAN PARLIAMENT, THE COUNCIL, THE EUROPEAN ECONOMIC AND SOCIAL COMMITTEE AND THE COMMITTEE
COMMUNICATION FROM THE COMMISSION
 EUROPEAN COMMISSION Brussels, 20.2.2019 C(2019) 1396 final COMMUNICATION FROM THE COMMISSION Modification of the calculation method for lump sum payments and daily penalty payments proposed by the Commission
PUBLIC PROCUREMENT INDICATORS 2011, Brussels, 5 December 2012
 PUBLIC PROCUREMENT INDICATORS 2011, Brussels, 5 December 2012 1. INTRODUCTION This document provides estimates of three indicators of performance in public procurement within the EU. The indicators are
InnovFin SME Guarantee
 InnovFin SME Guarantee Implementation Update Reporting date: 30/09/2017 Disclaimer This presentation contains general information about the implementation results of InnovFin SME Guarantee, a facility
NOTE. for the Interparliamentary Meeting of the Committee on Budgets
 NOTE for the Interparliamentary Meeting of the Committee on Budgets THE ROLE OF THE EU BUDGET TO SUPPORT MEMBER STATES IN ACHIEVING THEIR ECONOMIC OBJECTIVES AS AGREED WITHIN THE FRAMEWORK OF THE EUROPEAN
L 201/58 Official Journal of the European Union
 L 201/58 Official Journal of the European Union 30.7.2008 DECISION No 743/2008/EC OF THE EUROPEAN PARLIAMENT AND OF THE COUNCIL of 9 July 2008 on the Community s participation in a research and development
A. INTRODUCTION AND FINANCING OF THE GENERAL BUDGET. EXPENDITURE Description Budget Budget Change (%)
") DRAFT AMENDING BUDGET NO. 2/2018 VOLUME 1 - TOTAL REVENUE A. INTRODUCTION AND FINANCING OF THE GENERAL BUDGET FINANCING OF THE GENERAL BUDGET Appropriations to be covered during the financial year 2018
DRAFT AMENDING BUDGET NO. 2/2018 VOLUME 1 - TOTAL REVENUE A. INTRODUCTION AND FINANCING OF THE GENERAL BUDGET FINANCING OF THE GENERAL BUDGET Appropriations to be covered during the financial year 2018
EIF s activities in support of SMEs
 Richard Pelly Chief Executive European Investment Fund EIF s activities in support of SMEs This presentation was prepared by EIF. Any estimates and projections contained herein involve significant elements
2017 Figures summary 1
 Annual Press Conference on January 18 th 2018 EIB Group Results 2017 2017 Figures summary 1 European Investment Bank (EIB) financing EUR 69.88 billion signed European Investment Fund (EIF) financing EUR
EU BUDGET AND NATIONAL BUDGETS
 DIRECTORATE GENERAL FOR INTERNAL POLICIES POLICY DEPARTMENT ON BUDGETARY AFFAIRS EU BUDGET AND NATIONAL BUDGETS 1999-2009 October 2010 INDEX Foreward 3 Table 1. EU and National budgets 1999-2009; EU-27
The Eureka Eurostars Programme
 The Eureka Eurostars Programme 29/03/2011 Terence O Donnell, Eureka National Project Co-ordinator What is EUREKA? > 2 > EUREKA is a public network supporting R&D-performing businesses > Established in
COSME Loan Guarantee Facility
 COSME Loan Guarantee Facility Gunnar Mai Head of Division, EU Guarantee Facilities Tirana, 22 November 2017 The material in this presentation has been prepared by EIF and is general background information,
ANNUAL REVIEW BY THE COMMISSION. of Member States' Annual Activity Reports on Export Credits in the sense of Regulation (EU) No 1233/2011
 No 1233/2011") EUROPEAN COMMISSION Brussels, 7.2.2017 COM(2017) 67 final ANNUAL REVIEW BY THE COMMISSION of Member States' Annual Activity Reports on Export Credits in the sense of Regulation (EU) No 1233/2011 EN EN
EUROPEAN COMMISSION Brussels, 7.2.2017 COM(2017) 67 final ANNUAL REVIEW BY THE COMMISSION of Member States' Annual Activity Reports on Export Credits in the sense of Regulation (EU) No 1233/2011 EN EN
For further information, please see online or contact
 For further information, please see http://ec.europa.eu/research/sme-techweb online or contact Lieve.VanWoensel@ec.europa.eu Sixth Progress Report on participation in the 7 th R&D Framework Programme Statistical
How to complete a payment application form (NI)
") How to complete a payment application form (NI) This form should be used for making a payment from a Northern Ireland Ulster Bank account. 1. Applicant Details If you are a signal number indemnity holder,
How to complete a payment application form (NI) This form should be used for making a payment from a Northern Ireland Ulster Bank account. 1. Applicant Details If you are a signal number indemnity holder,
Public consultation on EU funds in the area of investment, research & innovation, SMEs and single market
 Public consultation on EU funds in the area of investment, research & innovation, SMEs and single market Fields marked with * are mandatory. Public consultation on EU funds in the area of of investment,
Business Angel Financing An EU Perspective. Juho Aminoff 14 March 2018
 Business Angel Financing An EU Perspective Juho Aminoff 14 March 2018 EIF facilitates European SMEs access to finance Europe s largest and most influential investor in European Venture Capital Pan-European
Report on EIB operations Inside the EU With the three pillar Assessment methodology. SMEs. Employment and growth
 Report on EIB operations Inside the EU 2015 With the three pillar Assessment methodology SMEs Employment and growth 1 SMEs and Midcaps finance SMEs and Midcaps are vital to the wellbeing of Europe s economy.
EVCA Private Equity Activity Survey 2007 Europe
 EVCA Private Equity Activity Survey 2007 Europe 31 Europe 2006 Highlights: Demonstrating confidence in the European private equity sector with a record fundraising level of 112.3 billion in 2006, a significant
EU-28 RECOVERED PAPER STATISTICS. Mr. Giampiero MAGNAGHI On behalf of EuRIC
 EU-28 RECOVERED PAPER STATISTICS Mr. Giampiero MAGNAGHI On behalf of EuRIC CONTENTS EU-28 Paper and Board: Consumption and Production EU-28 Recovered Paper: Effective Consumption and Collection EU-28 -
CFA Institute Member Poll: Euro zone Stability Bonds
 CFA Institute Member Poll: Euro zone Stability Bonds I. About the Survey... 2 a. Background... 2 b. Purpose and Methodology... 2 II. Full Results... 2 Q1: Requirement of common issuance of sovereign bonds...
Live Long and Prosper? Demographic Change and Europe s Pensions Crisis. Dr. Jochen Pimpertz Brussels, 10 November 2015
 Live Long and Prosper? Demographic Change and Europe s Pensions Crisis Dr. Jochen Pimpertz Brussels, 10 November 2015 Old-age-dependency ratio, EU28 45,9 49,4 50,2 39,0 27,5 31,8 2013 2020 2030 2040 2050
DRAFT AMENDING BUDGET N 6 TO THE GENERAL BUDGET 2014 GENERAL STATEMENT OF REVENUE
 EUROPEAN COMMISSION Brussels, 17.10.2014 COM(2014) 649 final DRAFT AMENDING BUDGET N 6 TO THE GENERAL BUDGET 2014 GENERAL STATEMENT OF REVENUE STATEMENT OF EXPENDITURE BY SECTION Section III Commission
Official Journal of the European Union L 172. Legislation. Non-legislative acts. Volume July English edition. Contents REGULATIONS
 Official Journal of the European Union L 172 English edition Legislation Volume 61 9 July 2018 Contents II Non-legislative acts REGULATIONS Commission Implementing Regulation (EU) 2018/963 of 6 July 2018
EUROPEAN COMMISSION DIRECTORATE-GENERAL FOR RESEARCH & INNOVATION
 EUROPEAN COMMISSION DIRECTORATE-GENERAL FOR RESEARCH & INNOVATION Directorate A - Policy Development and Coordination A.4 - Analysis and monitoring of national research and innovation policies References
Cross-border mergers and divisions
 Cross-border mergers and divisions Cross-border mergers and divisions Consultation by the European Commission, DG MARKT INTRODUCTION Preliminary Remark The purpose of this questionnaire is to collect information,
Credit guarantee schemes in Central, Eastern and South-Eastern Europe - a survey
 Vienna Initiative 2 Credit guarantee schemes in Central, Eastern and South-Eastern Europe - a survey EBA-EIB-EIF seminar on Synthetic Securitisation and Financial Guarantees, 31 May 2016, London Áron Gereben
For further information, please see online or contact
 For further information, please see http://ec.europa.eu/research/sme-techweb online or contact Lieve.VanWoensel@ec.europa.eu Seventh Progress Report on SMEs participation in the 7 th R&D Framework Programme
FINANCIAL PLAN for CONSTRUCTION and EXPLOITATION PHASE
 FINANCIAL PLAN for CONSTRUCTION and EXPLOITATION PHASE Deliverable 8S-2.2 June 2011 Editors: Bente Maegaard, Steven Krauwer Contributor: Peter Wittenburg All rights reserved by UCPH on behalf of CLARIN
ANNUAL REVIEW BY THE COMMISSION. of Member States' Annual Activity Reports on Export Credits in the sense of Regulation (EU) No 1233/2011
 No 1233/2011") EUROPEAN COMMISSION Brussels, 17.3.2015 COM(2015) 130 final ANNUAL REVIEW BY THE COMMISSION of Member States' Annual Activity Reports on Export Credits in the sense of Regulation (EU) No 1233/2011 EN EN
EUROPEAN COMMISSION Brussels, 17.3.2015 COM(2015) 130 final ANNUAL REVIEW BY THE COMMISSION of Member States' Annual Activity Reports on Export Credits in the sense of Regulation (EU) No 1233/2011 EN EN
The Future of the COSME Programme
 The Future of the COSME Programme Annual meeting of the European Entrepreneurial Regions 29 June 2017 Directorate-General for Internal Market, Industry, Entrepreneurship and SMEs Unit H3: Ciprian Cristea
Venture and enterprise capital: Smart finance for SMEs Dörte Höppner, secretary general Brussels, 6 th October, 2011
 Venture and enterprise capital: Smart finance for SMEs Dörte Höppner, secretary general Brussels, 6 th October, 2011 Introducing EVCA Established in 1983 at the instigation of the European Commission We
Eurofound in-house paper: Part-time work in Europe Companies and workers perspective
 Eurofound in-house paper: Part-time work in Europe Companies and workers perspective Presented by: Eszter Sandor Research Officer, Surveys and Trends 26/03/2010 1 Objectives Examine the patterns of part-time
REPORT FROM THE COMMISSION TO THE EUROPEAN PARLIAMENT AND THE COUNCIL
 EN EN EN EUROPEAN COMMISSION Brussels, 28.2.2011 COM(2011) 84 final REPORT FROM THE COMMISSION TO THE EUROPEAN PARLIAMENT AND THE COUNCIL on the implementation and application of certain provisions of
LENDING FACILITIES Hire Purchase (HP) 1% % on a case by case basis (fee set by AgriFinance Ltd)
 1% % on a case by case basis (fee set by AgriFinance Ltd)") Our Charges This brochure gives a brief description of tariffs as charged by AgriBank plc on some of its products and services. For tariffs on products or services which are not listed in this brochure,
Our Charges This brochure gives a brief description of tariffs as charged by AgriBank plc on some of its products and services. For tariffs on products or services which are not listed in this brochure,
With regard to the expenditure side, the following modifications are proposed:
 Council of the European Union Brussels, 8 November 2016 (OR. en) 13583/16 BUDGET 29 EXPLANATORY MEMORANDUM Subject: Draft amending budget No 4 to the general budget for 2016: Update of appropriations to
A. Definitions and sources of data
 Poland A. Definitions and sources of data Data on foreign direct investment (FDI) in Poland are reported by the National Bank of Poland (NBP), the Polish Agency for Foreign Investment (PAIZ) and the Central
CANADA EUROPEAN UNION
 THE EUROPEAN UNION S PROFILE Economic Indicators Gross domestic product (GDP) at purchasing power parity (PPP): US$20.3 trillion (2016) GDP per capita at PPP: US$39,600 (2016) Population: 511.5 million
REPORT FROM THE COMMISSION TO THE EUROPEAN PARLIAMENT AND THE COUNCIL. on the quality of fiscal data reported by Member States in 2016
 EUROPEAN COMMISSION Brussels, 9.3.2017 COM(2017) 123 final REPORT FROM THE COMMISSION TO THE EUROPEAN PARLIAMENT AND THE COUNCIL on the quality of fiscal data reported by Member States in 2016 EN EN REPORT
Approach to Employment Injury (EI) compensation benefits in the EU and OECD
 compensation benefits in the EU and OECD") Approach to (EI) compensation benefits in the EU and OECD The benefits of protection can be divided in three main groups. The cash benefits include disability pensions, survivor's pensions and other short-
Approach to (EI) compensation benefits in the EU and OECD The benefits of protection can be divided in three main groups. The cash benefits include disability pensions, survivor's pensions and other short-
EU State aid: Guidelines on State aid for environmental protection and energy making of -
 EU State aid: Guidelines on State aid for environmental protection and energy 2014-2020 - making of - NHO Seminar Oslo, 5 November 2014 Guido Lobrano, Senior Legal Adviser Summary What is BUSINESSEUROPE?
The Eurostars Programme
 The Eurostars Programme The EU-EUREKA joint funding programme for R&D-performing SMEs What is EUREKA? > 2 > EUREKA is a public network supporting R&D-performing businesses > Established in 1985 by French
BRIEFING ON THE FUND FOR EUROPEAN AID FOR THE MOST DEPRIVED ( FEAD )
") BRIEFING ON THE FUND FOR EUROPEAN AID FOR THE MOST DEPRIVED ( FEAD ) August 2014 INTRODUCTION The European Union has set up a new fund, the Fund for European Aid for the Most Deprived ( FEAD ). It will
BRIEFING ON THE FUND FOR EUROPEAN AID FOR THE MOST DEPRIVED ( FEAD ) August 2014 INTRODUCTION The European Union has set up a new fund, the Fund for European Aid for the Most Deprived ( FEAD ). It will
Non-financial corporations - statistics on profits and investment
 Non-financial corporations - statistics on profits and investment Statistics Explained Data extracted in May 2018. Planned article update: May 2019. This article focuses on investment and the distribution
Electricity & Gas Prices in Ireland. Annex Business Electricity Prices per kwh 2 nd Semester (July December) 2016
 2016") Electricity & Gas Prices in Ireland Annex Business Electricity Prices per kwh 2 nd Semester (July December) 2016 ENERGY POLICY STATISTICAL SUPPORT UNIT 1 Electricity & Gas Prices in Ireland Annex Business
Electricity & Gas Prices in Ireland Annex Business Electricity Prices per kwh 2 nd Semester (July December) 2016 ENERGY POLICY STATISTICAL SUPPORT UNIT 1 Electricity & Gas Prices in Ireland Annex Business
Enterprise Europe Network SME growth outlook
 Enterprise Europe Network SME growth outlook 2018-19 een.ec.europa.eu 2 Enterprise Europe Network SME growth outlook 2018-19 Foreword The European Commission wants to ensure that small and medium-sized
Gross domestic product of Montenegro in 2016
 MONTENEGRO STATISTICAL OFFICE R E L E A S E No:174 Podgorica 29 September 2017 When using the data pleaase name the source Gross domestic product of Montenegro in 2016 Real growth rate of gross domestic
Europe s Leading Developer of Risk Financing for Entrepreneurship & Innovation
 Marc Schublin European Investment Fund Europe s Leading Developer of Risk Financing for Entrepreneurship & Innovation This presentation was prepared by EIF. The information included in this presentation
EMPLOYMENT RATE Employed/Working age population (15-64 years)
") 1 EMPLOYMENT RATE 1980-2003 Employed/Working age population (15-64 years 80 % Finland (Com 75 70 65 60 EU-15 Finland (Stat. Fin. 55 50 80 82 84 86 88 90 92 94 96 98 00 02 9.9.2002/SAK /TL Source: European
1 EMPLOYMENT RATE 1980-2003 Employed/Working age population (15-64 years 80 % Finland (Com 75 70 65 60 EU-15 Finland (Stat. Fin. 55 50 80 82 84 86 88 90 92 94 96 98 00 02 9.9.2002/SAK /TL Source: European
EIOPA Statistics - Accompanying note
 EIOPA Statistics - Accompanying note Publication references: Published statistics: [Balance sheet], [Premiums, claims and expenses], [Own funds and SCR] Disclaimer: Data is drawn from the published statistics
European Investment Fund Venture Capital Portfolio. Performance EIF own resources Vintage and Team Location As at 30/06/17
 European Investment Fund Venture Capital Portfolio Performance EIF own resources Vintage and Team Location As at 30/06/17 Context All data provided comprise the performance of investments made using EIF
Trends in the European Investment Fund Industry. in the Third Quarter of 2018
 Quarterly Statistical Release December 2018 N 75 This release and other statistical releases are available on Efama s website (www.efama.org) Trends in the European Investment Fund Industry in the Third
Fiscal rules in Lithuania
 Fiscal rules in Lithuania Algimantas Rimkūnas Vice Minister, Ministry of Finance of Lithuania 3 June, 2016 Evolution of National and EU Fiscal Regulations Stability and Growth Pact (SGP) Maastricht Treaty
Communication on the future of the CAP
 Communication on the future of the CAP The CAP towards 2020: meeting the food, natural resources and territorial challenges of the future Tassos Haniotis, Director Agricultural Policy Analysis and Perspectives
EIOPA Statistics - Accompanying note
 EIOPA Statistics - Accompanying note Publication reference: Published statistics: [Balance sheet], [Premiums, claims and expenses], [Own funds and SCR] Disclaimer: Data is drawn from the published statistics
Horizon 2020 Partnerships and resulting opportunities
 Horizon 2020 Partnerships and resulting opportunities W. Wittke DG Research & Innovation Partnerships and platforms in the context of Horizon 2020 Public-public partnerships (P2P): ERA-NET/ERA-NET Plus/
3 Labour Costs. Cost of Employing Labour Across Advanced EU Economies (EU15) Indicator 3.1a
 Indicator 3.1a") 3 Labour Costs Indicator 3.1a Indicator 3.1b Indicator 3.1c Indicator 3.2a Indicator 3.2b Indicator 3.3 Indicator 3.4 Cost of Employing Labour Across Advanced EU Economies (EU15) Cost of Employing Labour
3 Labour Costs Indicator 3.1a Indicator 3.1b Indicator 3.1c Indicator 3.2a Indicator 3.2b Indicator 3.3 Indicator 3.4 Cost of Employing Labour Across Advanced EU Economies (EU15) Cost of Employing Labour
THE IMPACT OF THE PUBLIC DEBT STRUCTURE IN THE EUROPEAN UNION MEMBER COUNTRIES ON THE POSSIBILITY OF DEBT OVERHANG
 THE IMPACT OF THE PUBLIC DEBT STRUCTURE IN THE EUROPEAN UNION MEMBER COUNTRIES ON THE POSSIBILITY OF DEBT OVERHANG Robert Huterski, PhD Nicolaus Copernicus University in Toruń Faculty of Economic Sciences
Council conclusions on "First Annual Report to the European Council on EU Development Aid Targets"
 COUNCIL OF THE EUROPEAN UNION Council conclusions on "First Annual Report to the European Council on EU Development Aid Targets" 3091st FOREIGN AFFAIRS Council meeting Brussels, 23 May 2011 The Council
Gross domestic product of Montenegro in 2011
 MONTENEGRO STATISTICAL OFFICE R E L E A S E No: 257 Podgorica, 28 September 2012 When using the data please name the source Gross domestic product of Montenegro in 2011 Real growth rate of gross domestic
EIB Financing for Social and Affordable Housing
 EIB Financing for Social and Affordable Housing Andrea Colantonio, Urban Development Division, European Investment Bank Affordable housing for inclusive cities, 16 th May 2018 Brussels European Investment
Study on the Contribution of Sport to Economic Growth and Employment in the EU
 Study on the Contribution of Sport to Economic Growth and Employment in the EU Study commissioned by the European Commission, Directorate-General Education and Culture Executive Summary August 2012 SportsEconAustria
Lithuania: in a wind of change. Robertas Dargis President of the Lithuanian Confederation of Industrialists
 Lithuania: in a wind of change Robertas Dargis President of the Lithuanian Confederation of Industrialists 2017 06 15 Lithuanian Confederation of Industrialists - the largest business organisation in Lithuania
Evaluation of the implementation of transparency in CAP beneficiaries
 Evaluation of the implementation of transparency in CAP beneficiaries In the years since farmsubsidy.org s early victories in Denmark, the UK, the Netherlands and Sweden, EU member states have come a long
Gross domestic product of Montenegro for period
 MONTENEGRO STATISTICAL OFFICE RELEASE No: 211 Podgorica, 30. September 2015 When using these data, please name the source Gross domestic product of Montenegro for period 2010-2014 Real growth rate of gross
LENDING FACILITIES Hire Purchase (HP) 1% % on a case by case basis (fee set by AgriFinance Ltd)
 1% % on a case by case basis (fee set by AgriFinance Ltd)") Our Charges This brochure gives a brief description of tariffs as charged by AgriBank plc on some of its products and services. For tariffs on products or services which are not listed in this brochure,
Our Charges This brochure gives a brief description of tariffs as charged by AgriBank plc on some of its products and services. For tariffs on products or services which are not listed in this brochure,
Burden of Taxation: International Comparisons
 Burden of Taxation: International Comparisons Standard Note: SN/EP/3235 Last updated: 15 October 2008 Author: Bryn Morgan Economic Policy & Statistics Section This note presents data comparing the national
Consumer Credit. Introduction. June, the 6th (2013)
") Consumer Credit in Europe at end-2012 Introduction Crédit Agricole Consumer Finance has published its annual survey of the consumer credit market in 27 European Union countries (EU-27) for the sixth year
Consumer Credit in Europe at end-2012 Introduction Crédit Agricole Consumer Finance has published its annual survey of the consumer credit market in 27 European Union countries (EU-27) for the sixth year
23 January Special Report No 16/2017. Rural Development Programming: less complexity and more focus on results needed
 23 January 2018 EP Com. on Agriculture and Rural Development Special Report No 16/2017 Rural Development Programming: less complexity and more focus on results needed Janusz Wojciechowski ECA Member Page
Aim Higher EUROSTARS. Funding excellence in innovation. Eligibility guidelines for applications. December 2015 Version 2.0
 EUROSTARS Funding excellence in innovation December 2015 Version 2.0 This document provides applicants with an explanation of the eligibility criteria imposed on projects by Eurostars and the method of
REPORT FROM THE COMMISSION TO THE EUROPEAN PARLIAMENT AND THE COUNCIL. on the quality of fiscal data reported by Member States in 2017
 EUROPEAN COMMISSION Brussels, 8.3.2018 COM(2018) 112 final REPORT FROM THE COMMISSION TO THE EUROPEAN PARLIAMENT AND THE COUNCIL on the quality of fiscal data reported by Member States in 2017 EN EN REPORT
DG TAXUD. STAT/11/100 1 July 2011
 DG TAXUD STAT/11/100 1 July 2011 Taxation trends in the European Union Recession drove EU27 overall tax revenue down to 38.4% of GDP in 2009 Half of the Member States hiked the standard rate of VAT since
Trends in the European Investment Fund Industry. in the Third Quarter of 2016
 Quarterly Statistical Release December 2016, N 67 This release and other statistical releases are available on Efama s website (www.efama.org) Trends in the European Investment Fund Industry in the Third
COMMISSION STAFF WORKING DOCUMENT Accompanying the document
 EUROPEAN COMMISSION Brussels, 9.10.2017 SWD(2017) 330 final PART 13/13 COMMISSION STAFF WORKING DOCUMENT Accompanying the document REPORT FROM THE COMMISSION TO THE EUROPEAN PARLIAMENT, THE COUNCIL, THE
12608/14 IS/sh 1 DG G II A
 Council of the European Union Brussels, 2 September 2014 (OR. en) 12608/14 BUDGET 16 EXPLANATORY MEMORANDUM Subject: Draft budget of the European Union for the financial year 2015: Council position of
Report Penalties and measures imposed under the UCITS Directive in 2016 and 2017
 Report Penalties and measures imposed under the Directive in 206 and 207 4 April 209 ESMA34-45-65 4 April 209 ESMA34-45-65 Table of Contents Executive Summary... 3 2 Background and relevant regulatory
EUREKA Programme A European Research Programme. > Not an EU-Programme (but complementarity and co-operation - ERA)
") EUREKA EUREKA Programme...... Shaping tomorrow s innovations today EUREKA in glance > 2 A European Research Programme > Not an EU-Programme (but complementarity and co-operation - ERA) > Bottom-up project
EUREKA EUREKA Programme...... Shaping tomorrow s innovations today EUREKA in glance > 2 A European Research Programme > Not an EU-Programme (but complementarity and co-operation - ERA) > Bottom-up project
Guidelines on regional state aid for
 Guidelines on regional state aid for 2014-2020 Bojana VRCEK DG COMP- Regional state aid 2 July 2015 Structure of presentation 1. Regional State aid & Cohesion 2. Regional aid: Where? 3. Regional aid: What
EMPLOYMENT RATE IN EU-COUNTRIES 2000 Employed/Working age population (15-64 years)
") EMPLOYMENT RATE IN EU-COUNTRIES 2 Employed/Working age population (15-64 years EU-15 Denmark Netherlands Great Britain Sweden Portugal Finland Austria Germany Ireland Luxembourg France Belgium Greece Spain
EMPLOYMENT RATE IN EU-COUNTRIES 2 Employed/Working age population (15-64 years EU-15 Denmark Netherlands Great Britain Sweden Portugal Finland Austria Germany Ireland Luxembourg France Belgium Greece Spain
Brussels, COM(2015) 451 final. ANNEXES 1 to 4 ANNEXES
 451 final. ANNEXES 1 to 4 ANNEXES") EUROPEAN COMMISSION Brussels, 9.9.2015 COM(2015) 451 final ANNEXES 1 to 4 ANNEXES accompanying the Proposal for a Council decision establishing provisional measures in the area of international protection
EUROPEAN COMMISSION Brussels, 9.9.2015 COM(2015) 451 final ANNEXES 1 to 4 ANNEXES accompanying the Proposal for a Council decision establishing provisional measures in the area of international protection
Reforming Policies for Regional Development: The European Perspective
 Business & Entrepreneurship Journal, vol.3, no.1, 2014, 57-62 ISSN: 2241-3022 (print version), 2241-312X (online) Scienpress Ltd, 2014 Reforming Policies for Regional Development: The European Perspective
EIOPA Statistics - Accompanying note
 EIOPA Statistics - Accompanying note Publication references: and Published statistics: [Balance sheet], [Premiums, claims and expenses], [Own funds and SCR] Disclaimer: Data is drawn from the published
3 Labour Costs. Cost of Employing Labour Across Advanced EU Economies (EU15) Indicator 3.1a
 Indicator 3.1a") 3 Labour Costs Indicator 3.1a Indicator 3.1b Indicator 3.1c Indicator 3.2a Indicator 3.2b Indicator 3.3 Indicator 3.4 Cost of Employing Labour Across Advanced EU Economies (EU15) Cost of Employing Labour
3 Labour Costs Indicator 3.1a Indicator 3.1b Indicator 3.1c Indicator 3.2a Indicator 3.2b Indicator 3.3 Indicator 3.4 Cost of Employing Labour Across Advanced EU Economies (EU15) Cost of Employing Labour
The Architectural Profession in Europe 2012
 The Architectural Profession in Europe 2012 - A Sector Study Commissioned by the Architects Council of Europe Chapter 2: Architecture the Market December 2012 2 Architecture - the Market The Construction
Definition of Public Interest Entities (PIEs) in Europe
 in Europe") Definition of Public Interest Entities (PIEs) in Europe FEE Survey October 2014 This document has been prepared by FEE to the best of its knowledge and ability to ensure that it is accurate and complete.
Definition of Public Interest Entities (PIEs) in Europe FEE Survey October 2014 This document has been prepared by FEE to the best of its knowledge and ability to ensure that it is accurate and complete.
The PATLIB network in Europe An overview of the existing practice. Directorate for International Co-operation
 The PATLIB network in Europe An overview of the existing practice Pascal Phlix Directorate for International Co-operation 02.12.2015 As an introduction 2 Our mission Please do not use photos for which
Composition of capital IT044 IT044 POWSZECHNAIT044 UNIONE DI BANCHE ITALIANE SCPA (UBI BANCA)
") Composition of capital POWSZECHNA (in million Euro) Capital position CRD3 rules A) Common equity before deductions (Original own funds without hybrid instruments and government support measures other than
Composition of capital POWSZECHNA (in million Euro) Capital position CRD3 rules A) Common equity before deductions (Original own funds without hybrid instruments and government support measures other than
Quarterly Gross Domestic Product of Montenegro 3 rd quarter 2017
 MONTENEGRO STATISTICAL OFFICE R E L E A S E No: 224 Podgorica, 22 December 2017 When using the data, please name the source Quarterly Gross Domestic Product of Montenegro 3 rd quarter 2017 The release
EUROPA - Press Releases - Taxation trends in the European Union EU27 tax...of GDP in 2008 Steady decline in top corporate income tax rate since 2000
 DG TAXUD STAT/10/95 28 June 2010 Taxation trends in the European Union EU27 tax ratio fell to 39.3% of GDP in 2008 Steady decline in top corporate income tax rate since 2000 The overall tax-to-gdp ratio1
European Advertising Business Climate Index Q4 2016/Q #AdIndex2017
 European Advertising Business Climate Index Q4 216/Q1 217 ABOUT Quarterly survey of European advertising and market research companies Provides information about: managers assessment of their business
Trends in the European Investment Fund Industry. in the First Quarter of 2017
 Quarterly Statistical Release June 2017, N 69 This release and other statistical releases are available on Efama s website (www.efama.org) Trends in the European Investment Fund Industry in the First Quarter
FSMA_2017_05-01 of 24/02/2017
 FSMA_2017_05-01 of 24/02/2017 This Communication is addressed to Belgian alternative investment fund managers who intend to market, to professional investors, units or shares of European Economic Area
May 2012 Euro area international trade in goods surplus of 6.9 bn euro 3.8 bn euro deficit for EU27
 108/2012-16 July 2012 May 2012 Euro area international trade in goods surplus of 6.9 3.8 deficit for EU27 The first estimate for the euro area 1 (EA17) trade in goods balance with the rest of the world
STAT/12/ October Household saving rate fell in the euro area and remained stable in the EU27. Household saving rate (seasonally adjusted)
") STAT/12/152 30 October 2012 Quarterly Sector Accounts: second quarter of 2012 Household saving rate down to 12.9% in the euro area and stable at 11. in the EU27 Household real income per capita fell by
STAT/12/152 30 October 2012 Quarterly Sector Accounts: second quarter of 2012 Household saving rate down to 12.9% in the euro area and stable at 11. in the EU27 Household real income per capita fell by
Courthouse News Service
 14/2009-30 January 2009 Sector Accounts: Third quarter of 2008 Household saving rate at 14.4% in the euro area and 10.7% in the EU27 Business investment rate at 23.5% in the euro area and 23.6% in the
Study on the framework conditions for High Growth Innovative Enterprises (HGIEs)
") Study on the framework conditions for High Growth Innovative Enterprises : framework conditions selected, measurement, data availability and contingency measures : Innovation, high-growth and internationalization
Study on the framework conditions for High Growth Innovative Enterprises : framework conditions selected, measurement, data availability and contingency measures : Innovation, high-growth and internationalization
Committee on Agriculture and Rural Development
 EUROPEAN PARLIAMT 2009-2014 Committee on Agriculture and Rural Development 24.7.2013 2013/0117(COD) ***I DRAFT REPORT on the proposal for a regulation of the European Parliament and of the Council laying
First estimate for 2011 Euro area external trade deficit 7.7 bn euro bn euro deficit for EU27
 27/2012-15 February 2012 First estimate for 2011 Euro area external trade deficit 7.7 152.8 deficit for EU27 The first estimate for the euro area 1 (EA17) trade in goods balance with the rest of the world