GRAÑA Y MONTERO S.A.A.
|
|
|
- Claude Richardson
- 5 years ago
- Views:
Transcription
1 U.S. SECURITIES AND EXCHANGE COMMISSION Washington, D.C FORM 20-F REGISTRATION STATEMENT PURSUANT TO SECTION 12(b) OR (g) OF THE SECURITIES EXCHANGE ACT OF 1934 OR ANNUAL REPORT PURSUANT TO SECTION 13 OR 15(d) OF THE SECURITIES EXCHANGE ACT OF 1934 For the fiscal year ended December 31, 2014 OR TRANSITION REPORT PURSUANT TO SECTION 13 OR 15(d) OF THE SECURITIES EXCHANGE ACT OF 1934 OR SHELL COMPANY REPORT PURSUANT TO SECTION 13 OR 15(d) OF THE SECURITIES EXCHANGE ACT OF 1934 Commission file number GRAÑA Y MONTERO S.A.A. (Exact name of Registrant as specified in its charter) N/A (Translation of Registrant s name into English) Republic of Peru (Jurisdiction of incorporation or organization) Av. Paseo de la República 4667 Surquillo Lima 34, Peru (Address of principal executive offices) Claudia Drago Morante, Chief Legal Officer Tel Av. Paseo de la República 4667 Surquillo Lima 34, Peru (Name, telephone, and/or facsimile number and address of company contact person) Title of each class Common Shares, par value s./1.00 per share, American Depositary Shares, each representing five Common Shares Securities registered pursuant to Section 12(b) of the Act: Securities registered pursuant to Section 12(g) of the Act: None Securities for which there is a reporting obligation pursuant to Section 15(d) of the Act: Name of each exchange on which registered New York Stock Exchange* New York Stock Exchange * Not for trading purposes, but only in connection with the registration on the New York Stock Exchange of the American Depositary Shares representing those common shares.
2 None Indicate the number of outstanding shares of each of the issuer s classes of capital or common stock as of the close of the period covered by the annual report: Indicate by check mark if the Registrant is a well-known seasoned issuer, as defined in Rule 405 of the Securities Act. Yes No If this report is an annual or transition report, indicate by check mark if the registrant is not required to file reports pursuant to Section 13 or 15(d) of the Securities Exchange Act of Yes No Indicate by check mark whether the Registrant (1) has filed all reports required to be filed by Section 13 or 15(d) of the Securities Exchange Act of 1934 during the preceding 12 months (or for such shorter period that the Registrant was required to file such reports), and (2) has been subject to such filing requirements for the past 90 days. Yes No Indicate by check mark whether the Registrant has submitted electronically and posted on its corporate website, if any, every interactive data filed required to be submitted and posted pursuant to Rule 405 of Regulation S-T ( of this chapter) during the preceding 12 months (or for such other period that the Registrant was required to submit and post such files) Yes No Note: Not required for Registrant. Indicate by check mark whether the Registrant is a large accelerated filer, an accelerated filer, or a non-accelerated filer. See definition of accelerated filer and large accelerated filer in Rule 12b-2 of the Exchange Act. (Check one): Indicate by check mark which basis of accounting the Registrant has used to prepare the financial statements included in this filing: U.S. GAAP International Financial Reporting Other Standards as issued by the International Accounting Standards Board If Other has been checked in response to the previous question, indicate by check mark which financial statement item the Registrant has elected to follow. Item 17 Item 18 At December 31, ,053,790 shares of common stock Large accelerated filer Accelerated filer Non-accelerated filer If this is an annual report, indicate by check mark whether the registrant is a shell company (as defined in Rule 12b-2 of the Exchange Act). Yes No
3 TABLE OF CONTENTS Page PART I INTRODUCTION 1 ITEM 1. IDENTITY OF DIRECTORS, SENIOR MANAGEMENT AND ADVISERS 5 ITEM 2. OFFER STATISTICS AND EXPECTED TIMETABLE 5 ITEM 3. KEY INFORMATION 5 A. Selected Financial Data 5 B. Capitalization and Indebtedness 15 C. Reasons for the Offer and Use of Proceeds 15 D. Risk Factors 15 ITEM 4. INFORMATION ON THE COMPANY 37 A. History and Development of the Company 37 B. Business Overview 39 C. Organizational Structure 98 D. Property, Plant and Equipment 100 ITEM 5. OPERATING AND FINANCIAL REVIEW AND PROSPECTS 101 A. Operating Results 101 B. Liquidity and Capital Resources 133 C. Research and Development, Patents and Licenses 138 D. Trend Information 138 E. Off-Balance Sheet Arrangements 142 F. Tabular Disclosure of Contractual Obligations 142 G. Safe Harbor 143 ITEM 6. DIRECTORS, SENIOR MANAGEMENT AND EMPLOYEES 143 A. Directors and Senior Management 143 B. Compensation 149 C. Board Practices 150 D. Employees 153 E. Share Ownership 155 ITEM 7. MAJOR SHAREHOLDERS AND RELATED PARTY TRANSACTIONS 155 A. Major Shareholders 155 B. Related Party Transactions 156 C. Interests of Experts and Counsel 158 ITEM 8. FINANCIAL INFORMATION 158 A. Consolidated Statements and Other Financial Information. 158 B. Significant Changes. 159 i
4 ITEM 9. THE OFFER AND LISTING 159 A. Offer and Listing Details 159 B. Plan of Distribution 161 C. Markets 161 D. Selling Shareholders 163 E. Dilution 163 F. Expenses of the Issue 163 ITEM 10. ADDITIONAL INFORMATION 163 A. Share Capital 163 B. Memorandum and Articles of Association 163 C. Material Contracts 168 D. Exchange Controls 168 E. Taxation 168 F. Dividends and Paying Agents 173 G. Statement by Experts 173 H. Documents on Display 173 I. Subsidiary Information 174 ITEM 11. QUANTITATIVE AND QUALITATIVE DISCLOSURES ABOUT MARKET RISK 174 ITEM 12. DESCRIPTION OF SECURITIES OTHER THAN EQUITY SECURITIES 175 A. Debt Securities 175 B. Warrants and Rights 175 C. Other Securities 175 D. American Depositary Shares 175 PART II 186 ITEM 13. DEFAULTS, DIVIDEND ARREARAGES AND DELINQUENCIES 186 ITEM 14. MATERIAL MODIFICATIONS TO THE RIGHTS OF SECURITY HOLDERS AND USE OF 186 PROCEEDS ITEM 15. CONTROLS AND PROCEDURES 186 A. Disclosure Controls and Procedures 186 B. Management s Annual Report on Internal Control Over Financial Reporting 187 C. Attestation Report of the Registered Public Accounting Firm 187 D. Changes in Internal Control Over Financial Reporting 187 ITEM 16. [RESERVED] 187 ITEM 16A. AUDIT COMMITTEE FINANCIAL EXPERT 187 ITEM 16B. CODE OF BUSINESS CONDUCT AND ETHICS 188 ITEM 16C. PRINCIPAL ACCOUNTANT FEES AND SERVICES 188 ITEM 16D. EXEMPTIONS FROM THE LISTING STANDARDS FOR AUDIT COMMITTEES 189 ii
5 ITEM 16E. PURCHASES OF EQUITY SECURITIES BY THE ISSUER AND AFFILIATED PURCHASERS 189 ITEM 16F. CHANGE IN REGISTRANT S CERTIFYING ACCOUNTANT 189 ITEM 16G. CORPORATE GOVERNANCE 189 ITEM 16H. MINE SAFETY DISCLOSURE 190 ITEM 17. FINANCIAL STATEMENTS 190 ITEM 18. FINANCIAL STATEMENTS 190 ITEM 19. EXHIBITS 190 iii
6 PART I INTRODUCTION Certain Definition All references to we, us, our, our company, the group and Graña y Montero in this annual report are to Graña y Montero S.A.A., a publicly-held corporation (sociedad anónima abierta) organized under the laws of Peru. In this annual report, we refer to our principal subsidiaries as follows: (i) in our Engineering and Construction (E&C) segment: GyM S.A. as GyM ; Stracon GyM S.A. as Stracon GyM ; Vial y Vives - DSD S.A. as Vial y Vives - DSD ; GMI S.A. as GMI ; and Morelco S.A. ( Morelco ); (ii) in our Infrastructure segment: Norvial S.A. as Norvial ; Survial S.A. as Survial ; Concesión Canchaque S.A. as Canchaque ; GyM Ferrovías S.A. as GyM Ferrovías ; Concesionaria La Chira S.A. as La Chira ; Concesionaria Via Expresa Sur S.A. as Via Expresa Sur ; GMP S.A. as GMP ; (iii) in our Real Estate segment: Viva GyM S.A. as Viva GyM ; Inmobiliaria Almonte S.A.C. as Almonte ; (iv) in our Technical Services segment, GMD S.A. as GMD ; Concar S.A. as Concar ; and CAM Chile S.A. as CAM ; and (v) Compañía Operadora de Gas del Amazonas (joint controlled) as COGA. The term U.S. dollar and the symbol US$ refer to the legal currency of the United States; the term nuevo sol and the symbol S/. refer to the legal currency of Peru; the term Chilean peso and the symbol CLP refer to the legal currency of Chile; and the term Colombian peso and the symbol COP refer to the legal currency of Colombia. Financial Information Our consolidated financial statements included in this annual report have been prepared in nuevos soles and in accordance with International Financial Reporting Standards ( IFRS ) issued by the International Accounting Standards Board ( IASB ). Our annual consolidated financial statements for the years ended December 31, 2012, 2013 and 2014 have been audited by Gaveglio, Aparicio y Asociados S.C. de R.L., a member firm of PricewaterhouseCoopers in accordance with the standards of the Public Company Accounting Oversight Board (United States). We have also included in this annual report certain financial information for years prior to 2010 which have been prepared in accordance with generally accepted accounting principles in Peru ( Peruvian GAAP ). In accordance with Peruvian law, we were required to present our financial statements under IFRS beginning with our financial statements for the year ended December 31, Peruvian GAAP differs in certain respects from IFRS. Accordingly, our financial information presented in accordance with Peruvian GAAP is not directly comparable to our financial information prepared in accordance with IFRS. We manage our business in four segments: Engineering and Construction (E&C); Infrastructure; Real Estate; and Technical Services. For information on our results of operations per our business segments, see note 6 to our audited annual consolidated financial statements. In this annual report, we present Adjusted EBITDA, a non-gaap financial measure. A non-gaap financial measure is generally defined as one that purports to measure financial performance, financial position or cash flows but excludes or includes amounts that would not be so adjusted in the most comparable IFRS measure. We present Adjusted EBITDA because we believe it provides readers with a supplemental measure of the financial performance of our core operations that facilitates period-to-period comparisons on a consistent basis. Our management uses Adjusted EBITDA, among other measures, for internal planning and performance measurement purposes. Adjusted EBITDA should not be construed as an alternative to net profit or operating profit, as an indicator of operating performance, as an alternative to cash flow provided by operating activities or as a measure of liquidity (in each case, as determined in accordance with IFRS). Adjusted EBITDA, as calculated by us, may not be comparable to similarly titled measures reported by other companies. For our definition Adjusted EBITDA and a reconciliation of Adjusted EBITDA to the most directly comparable IFRS financial measure, see Item 3.A. Key Information Selected Financial Data Non-GAAP Financial Measure and Reconciliation. We have translated some of the nuevos soles amounts contained in this annual report into U.S. dollars for convenience purposes only. Unless otherwise indicated or the context otherwise requires, the rate used to translate nuevos soles amounts to U.S. dollars was S/ to US$1.00, which was the exchange rate reported for December 1
7 31, 2014 by the Peruvian Superintendency of Banks, Insurance and Private Pension Fund Administrators (Superintendencia de Banca, Seguros y AFPs, or SBS ). We present our backlog in U.S. dollars. For contracts denominated in nuevos soles or other local currencies, amounts have been converted into U.S. dollars based on the exchange rate published by the SBS on December 31 of the corresponding year. When we present our ratios of backlog and revenues in this annual report, we similarly convert our revenues, which are reported in nuevos soles, into U.S. dollars based on the exchange rate reported for December 31 of the corresponding year. For conversions of macroeconomic indicators (particularly in Item 5.D. Operating and Financial Review and Prospects Trend Information in this annual report), average annual exchange rates for the currencies of each of the countries addressed are used. The Federal Reserve Bank of New York does not report a noon buying rate for nuevos soles. The U.S. dollar equivalent information presented in this annual report is provided solely for convenience of the reader and should not be construed as implying that the nuevos soles or other currency amounts represent, or could have been or could be converted into, U.S. dollars at such rates or at any other rate. See Item 3.A. Key Information Selected Financial Data Exchange Rates for information regarding historical exchange rates of nuevos soles to U.S. dollars. Certain figures included in this annual report have been subject to rounding adjustments. Accordingly, figures shown as totals in certain tables may not be arithmetic aggregations of the figures that precede them. Backlog This annual report includes our backlog for our Engineering and Construction, Infrastructure, Real Estate and Technical Services segments. We do not include backlog in this annual report in our Infrastructure segment for: (i) our Norvial toll road concession because its revenues from the concession are derived from toll fees charged to vehicles using the highway, and, as a result, such revenues are dependent on vehicular traffic levels; (ii) our Energy line of business because: (a) its revenues from hydrocarbon extraction services are dependent on the amounts of oil and gas we produce and market prices, which fluctuate significantly; (b) our revenues from our gas processing plant are dependent on the amount of gas we process and market prices for natural gas liquids, which fluctuate significantly; and (c) our revenues from our fuel storage terminal operation partially depend on the volume of fuel dispatched; and (iii) COGA, which is not consolidated because it is jointly controlled. When we present backlog on a segment basis, we do not include eliminations that are included in our consolidated backlog. Backlog is not a measure defined by IFRS, and our methodology for determining backlog may not be comparable to the methodology used by other companies in determining their backlog. For our definition of backlog, see Item 4.B. Information on the Company Business Overview Backlog. See also Item 3.D. Key Information Risk Factors Risks Related to our Company Our backlog and our ratio of historical backlog to revenues may not be reliable indicators of future revenues or profit. Reserves Estimates This annual report includes our estimates for proved reserves in Blocks I and V where GMP provides hydrocarbon extraction services to Perupetro S.A. ( Perupetro ). These reserves estimates for Blocks I and V were prepared internally by our team of engineers and have not been audited or reviewed by any independent external engineers. On December 12, 2014, we were awarded license contracts for a 30-year term for Blocks III and IV and we began operations on April 5, Considering the recent initiation of operations, we have not yet prepared our own reserves estimates for those blocks. As a result, we have not included in this annual report reserve estimates for Blocks III and IV; instead, we have included production levels of prior contractors in Blocks III and IV based on information published by Perupetro. For further information on these reserves estimates, see Item 3.D. Key Information Rights Relating to Our Company Additional Risks Related to our Infrastructure Business and Item 4.B. Information on the Company Business Overview Infrastructure Principal Infrastructure Lines of Business Energy Oil and Gas Production. Market Information We make estimates in this annual report regarding our competitive position and market share, as well as the market size and expected growth of the engineering and construction, infrastructure, real estate and technical services industries in Peru and elsewhere in Latin America. We have made these estimates on the basis of our management s knowledge and statistics and other information, which we believe to be the most recently available as of the date of this annual report, from government agencies, industry professional organizations, industry 2
8 publications and other sources. While we believe these estimates to be accurate as of the date of this annual report, we have not independently verified the data from third-party sources and our internal data has not been verified by any independent source. In addition, our director, Hugo Santa María Guzmán, is a partner in APOYO Consultoría, and Roberto Abusada Salah, a director of our subsidiaries GMD and GMP, is a director of the Peruvian Economy Institute. We paid Great Place to Work Institute ( Great Place to Work ), a human resources consulting, research and training firm, for our employees to participate in their market survey referenced in this annual report (Copyright 2014 Great Place to Work Institute, Inc. All rights reserved.). In this annual report we present gross domestic product ( GDP ) both on a nominal and real basis. Real GDP is nominal GDP adjusted to exclude the effect of inflation. Unless otherwise indicated, references to GDP are to real GDP. Measurements and Other Data In this annual report, we use the following measurements: m means one meter, which equals approximately feet; m 2 means one square meter, which equals approximately square feet; km means one kilometer, which equals approximately miles; hectare means one hectare, which equals approximately acres; tonne means one metric ton, which equals approximately 2,204.6 pounds; bbl or barrel of oil means one stock tank barrel, which is equivalent to approximately cubic meters; boe means one barrel of oil equivalent, which equals approximately cubic meters, determined using the ratio of 5,658 cubic feet of natural gas to one barrel of oil; cf means one cubic foot; M, when used before bbl, boe or cf, means one thousand bbl, boe and cf, respectively; MM, when used before bbl, boe or cf, means one million bbl, boe and cf, respectively; MW means one megawatt, which equals one million watts; and Gwh means one gigawatt hour, which equals one billion watt hours. In this annual report, we use the term accident incident rate with respect to our E&C segment, which is calculated as the number of injuries divided by the total number of hours worked by all full-time employees of our E&C segment during the relevant year divided by 200,000 (which reflects 40 hours worked per week in a 50-week year by 100 equivalent full-time workers). Forward-Looking Statements This annual report contains forward-looking statements. Forward-looking statements convey our current expectations or forecasts of future events. These statements involve known and unknown risks, uncertainties and other factors, including those listed under Item 3.D. Key Information Risk Factors, which may cause our actual results, performance or achievements to differ materially from the forward-looking statements that we make. 3
9 Forward-looking statements typically are identified by words or phrases such as may, will, expect, anticipate, aim, estimate, intend, project, plan, believe, potential, continue, is/are likely to, or other similar expressions. Any or all of our forward-looking statements in this annual report may turn out to be inaccurate. Our actual results could differ materially from those contained in forward-looking statements due to a number of factors, including, among others: global macroeconomic conditions, including commodity prices, and economic, political and social conditions in the markets in which we operate, particularly in Peru; major changes in Peruvian government policies at the national, regional or municipal levels, including in connection with infrastructure concessions, investments in infrastructure and affordable housing subsidies; social conflicts in Peru that disrupt infrastructure projects, particularly in the mining sector; interest rate fluctuations, inflation and devaluation or appreciation of the nuevo sol in relation to the U.S. dollar (or other currencies in which we receive revenue); our ability to continue to grow our operations, both in Peru and internationally; our backlog may not be a reliable indicator of future revenues or profit; the level of capital investments and financings available for infrastructure projects of the types that we perform, both in the private and public sectors; competition in our markets, both from local and international companies; our ability to complete acquisitions on favorable terms or at all and to integrate acquired businesses and manage them effectively post-acquisition; performance under contracts, where a failure to meet schedules, cost estimates or performance targets on a timely basis could result in reduced profit margins or losses and impact our reputation; developments, some of which may be beyond our control, that affect our reputation in our markets, including a deterioration in our safety record; industry-specific operational risks, such as operator errors, mechanical failures and other accidents; availability and costs of energy, raw materials, equipment and labor; our ability to obtain financing on favorable terms; our ability to attract and retain qualified personnel; our ability to enter into joint operations, and rules involved in operating under joint operation or similar arrangements; our exposure to potential liability claims and contract disputes, including as a result of environmental damage alleged to have been caused by our operations; our and our clients compliance with environmental, health and safety laws and regulations, and changes in government policies and regulations in the countries in which we operate; 4
10 negotiations of claims with our clients of cost and schedule variances and change orders on major projects; volatility in global prices of oil and gas; the cyclical nature of some of our business segments; limitations on our ability to operate our concessions profitably, including changes in traffic patterns, and limitations on our ability to obtain new concessions; our ability to accurately estimate the costs of our projects; changes in real estate market prices, customer demand, preference and purchasing power, and financing availability and terms; our ability to obtain zoning and other license requirements for our real estate development; changes in tax laws; natural disasters, severe weather or other events that may adversely impact our business; and other factors identified or discussed under Item 3.D. Key Information Risk Factors. The forward-looking statements in this annual report represent our expectations and forecasts as of the date of this annual report. Except as required by law, we undertake no obligation to update or revise publicly any forward-looking statements, whether as a result of new information, future events or otherwise, after the date of this annual report. ITEM 1. IDENTITY OF DIRECTORS, SENIOR MANAGEMENT AND ADVISERS Not applicable. ITEM 2. OFFER STATISTICS AND EXPECTED TIMETABLE Not applicable. ITEM 3. KEY INFORMATION A. Selected Financial Data The following selected consolidated financial data should be read together with Part I. Introduction Financial Information, Item 5. Operations and Financial Review and Prospects and our consolidated financial statements included in this annual report. The following selected financial data as of December 31, 2013 and 2014 and for the years ended December 31, 2012, 2013 and 2014 have been derived from our audited annual consolidated financial statements included in this annual report. The following selected financial data as of December 31, 2011 and for the years ended December 31, 2010 and 2011 have been derived from our audited annual consolidated financial statements not included in this annual report. Our annual consolidated financial statements for the years ended December 31, 2010, 2011, 2012, 2013 and 2014 have been audited by Gaveglio, Aparicio y Asociados S.C. de R.L., a member firm of PricewaterhouseCoopers, in accordance with the standards of the Public Company Accounting Oversight Board (United States). We applied the accommodation provided by the SEC in respect of first-time application of IFRS and the following information does not include our selected consolidated financial information as of December 31, Prior to 2010, we prepared our financial statements in accordance with Peruvian GAAP. Under Peruvian law, we were required to present our financial statements under IFRS beginning with our financial statements for the year ended December 31, Peruvian GAAP differs in certain aspects from IFRS. 5
11 Year ended (in millions of S/.) (in millions of US$)(2) Income Statement Data: (1) Revenues 2, , , , , ,344.8 Cost of sales (2,057.8) (3,609.5) (4,519.8) (4,963.4) (6,057.1) 2,026.5 Gross profit , Administrative expenses (123.2) (199.6) (257.2) (361.8) (421.4) (141.0) Other income and expenses (3) Profit from sale of investments Other (losses) gains, net 0.2 (2.8) (0.3) (0.7) (0.1) Gain from business combination (3) 45.2 Operating profit Financial (expense) income, net (4) (10.0) (6.2) (10.3) (112.4) (91.4) (30.6) Share of the profit and loss obtained by associates under the equity method of accounting Profit before income tax Income tax (124.3) (141.4) (154.6) (182.3) (146.2) 48.9 Net profit Net profit attributable to controlling interest (5) Net profit attributable to non-controlling interest (5) (1) Includes the results of operations of CAM since February 2011, Vial y Vives since October 2012 and DSD since August See Item 5.A. Operating and Financial Review and Prospects Operating Results Factors Affecting our Results of Operations Acquisitions. (2) Calculated based on an exchange rate of S/ to US$1.00 as of December 31, (3) In 2011, relates to gains recorded in connection with the CAM business acquisition as a result of the excess of the fair value of the assets and liabilities we acquired in the acquisition of a controlling interest in CAM over the consideration paid and, in 2012, 2013 and 2014, the reversal of provisions of CAM. See Item 5.A. Operating and Financial Review and Prospects Operating Results Factors Affecting Our Results of Operations Acquisitions and notes 27 and 31 to our audited annual consolidated financial statements. (4) In 2013 and 2014, we had higher exchange losses due to the depreciation of the nuevo sol against the U.S. dollar and our higher U.S. dollar denominated liability. (5) We consolidate the results of our subsidiaries in our financial statements and we reflect the profit corresponding to the minority interests in our subsidiaries under net profit attributable to non-controlling interests in our income statement. With respect to our joint operations, we recognize in our financial statements the revenue and expenses including our share of any asset, liability, revenue or expense we hold jointly with partners. We reflect the results of our associated companies under the equity method of accounting in our financial statements under the line item share of the profit and loss in associates in our income statement. See Item 5.A. Operating and Financial Review and Prospects Operating Results Factors Affecting Our Results of Operations Acquisitions, General Accounting for Subsidiaries, Joint Operations and Associated Companies and note 2.2 to our audited annual consolidated financial statements included in this annual report. As of December 31, (in millions of Balance Sheet Data: (in millions of S/.) US$)(1) Total current assets 2, , , , ,551.0 Cash and cash equivalents Accounts receivables , , Outstanding work in progress , Inventories (2) Total non-current assets 1, , , , ,035.2 Long-term accounts receivables (3) Property, plant and equipment , Intangible assets (4) Total current liabilities 1, , , , ,270.0 Short-term borrowings , Accounts payables (5) 1, , , , Total non-current liabilities Long-term borrowings Capital Stock (6) Shareholders equity 1, , , , Non-controlling interest
12 (1) Calculated based on an exchange rate of S/ to US$1.00 as of December 31, (2) Includes investments for the purchase of land by our Real Estate segment. These investments in land are recorded at acquisition cost and are not marked-tomarket for changes in fair value. See note 14 to our audited annual consolidated financial statements included in this annual report. (3) Includes payments required to be made by the Peruvian government for the amounts we invest to purchase trains and other infrastructure for the Lima Metro. See Item 5.A. Operating and Financial Review and Prospects Operating Results Results of Operations General Infrastructure and note 10 to our audited annual consolidated financial statements included in this annual report. (4) We recognize our investments in the construction of the highway of our Norvial concession as intangible assets. See note 2.16(c) to our audited annual consolidated financial statements included in this annual report. (5) Includes S/ million, S/ million, S/ million and S/ million in advance payments made by our clients as of December 31, 2011, 2012, 2013 and 2014, respectively, in connection with our E&C and Operation and Maintenance of Infrastructure Assets contracts. See Item 5.A. Operating and Financial Review and Prospects Operating Results Results of Operations General Engineering and Construction and Technical Services and note 20 to our audited annual consolidated financial statements included in this annual report. (6) Reflects as of December 31, 2013 and 2014 our initial public offering of American Depositary Shares ( ADSs ) in the United States, which was consummated on July 29, As of and for the year ended December 31, Other Data: (1) (in US$)(2) Adjusted EBITDA(3) (in millions of S/. or US$) , Gross margin 17.8 % 14.9 % 13.6 % 16.8 % 13.6 % Adjusted EBITDA margin(4) 22.1 % 15.6 % 14.8 % 17.3 % 13.0 % Outstanding shares(5) 558, , , , ,054 Profit per share (in S/.or US$) Profit attributable to controlling interest per share (in S/.or US$) Dividend per share (in S/.or US$) Net debt/ Adjusted EBITDA ratio (0.6)x (0.2)x 0.1x (0.2)x 1.0x Backlog (in millions of US$)(6) 1, , , , , ,259.8 Backlog/revenues ratio(6) 1.7x 1.7x 2.2x 1.9x 1.6x (1) Includes the results of operations of CAM since February 2011, Vial y Vives since October 2012 and DSD since August See Item 5.A. Operating and Financial Review and Prospects Operating Results Factors Affecting our Results of Operations Acquisitions. (2) Calculated based on an exchange rate of S/ to US$1.00 as of December 31, (3) For further information on the definition of Adjusted EBITDA, see Non-GAAP Financial Measure and Reconciliation. (4) Reflects Adjusted EBITDA as a percentage of revenues. (5) Reflects as of December 31, 2013 and 2014 our initial public offering of ADSs in the United States, which was consummated on July 29, (6) For further information on our backlog, see Item 4.B. Business Overview Backlog. Does not include, in our Infrastructure segment, our Norvial toll road concession or our Energy line of business, or our jointly controlled COGA venture. Backlog is calculated as of the last day of the applicable year. Revenues are calculated for that year and converted into U.S. dollars based on the exchange rate published by the SBS on December 31 of the corresponding year, which was S/.2.81 to US$1.00 as of December 31, 2010, S/.2.70 to US$1.00 as of December 31, 2011, S/.2.55 to US$1.00 as of December 31, 2012, S/ to US$1.00 as of December 31, 2013 and S/ to US$1.00 as of December 31, Includes revenues only for businesses included in our backlog. The following tables set forth summary financial data for each of our business segments. For more information on the results of operations of our segments, see Item 5.A. Operating and Financial Review and Prospects Operating Results Results of Operations and note 6 to our audited annual consolidated financial statements included in this annual report. 7
13 1. Engineering & Construction Year ended December 31, (in millions of S/.) (in millions of US$, except as indicated)(1) Income Statement Data: Revenues 1, , , , , ,684.7 Cost of sales (1,469.6) (2,454.9) (3,116.6) (3,515.2) (4,500.3) (1,505.6) Gross profit Administrative expenses (82.5) (104.4) (159.8) (217.9) (258.6) (86.5) Other income and expenses (1.5) 4.8 (1.9) 10.8 (9.8) (3.2) Other (losses) gains, net 3.0 (2.2) 1.3 Operating profit Financial (expense) income, net (26.6) (62.4) (20.9) Share of the profit or loss in associates under the equity method of accounting Profit before income tax Income tax (49.0) (71.5) (87.9) (111.2) (59.3) (19.8) Net profit Net profit attributable to controlling interest Net profit attributable to non-controlling interest As of December 31, (in millions of (in millions of S/.) US$)(1) Balance Sheet Data: Total current assets 1, , , , Cash and cash equivalents Accounts receivables , Outstanding work in progress , Other current assets Total non-current assets , Long-term accounts receivables Property, plant and equipment Other non-current assets Total current liabilities 1, , , , Short-term borrowings Accounts payables(2) , , , Total non-current liabilities Long-term borrowings Other long-term liabilities Shareholders equity Non-controlling interest Infrastructure Year ended December 31, (in millions of S/.) (in millions of US$)(1) Income Statement Data: Revenues Cost of sales (222.4) (258.0) (351.8) (494.2) (639.2) (213.9) Gross profit Administrative expenses (19.8) (25.6) (30.5) (31.0) (40.3) (13.5) Other income and expenses 2.2 (0.2) (0.8) (3.1) (3.2) (1.1) Profit from the sale of investments 17.0 Other (losses) gains, net (2.8) (2.1) (1.6) 0.3 Operating profit Financial (expense) income, net (10.7) (6.0) (17.3) (44.6) (25.5) (8.5)
14 Year ended December 31, (in millions of S/.) (in millions of US$)(1) Share of the profit or loss in associates under the equity method of accounting Profit before income tax Income tax (30.5) (30.8) (38.4) (35.4) (57.4) (19.2) Net profit Net profit attributable to controlling interest Net profit attributable to non-controlling interest As of December 31, (in millions of (in millions of S/.) US$)(1) Balance Sheet Data: Total current assets Cash and cash equivalents Accounts receivables Outstanding work in progress Other current assets Total non-current assets , , Long-term accounts receivables(3) Property, plant and equipment Other non-current assets Total current liabilities , Short-term borrowings Accounts payables Total non-current liabilities Long-term borrowings Other long-term liabilities Shareholders equity Non-controlling interest Real Estate Year ended December 31, (in millions of S/.) (in millions of US$)(1) Income Statement Data: Revenues Cost of sales (185.3) (106.9) (153.4) (200.0) (162.1) (54.2) Gross profit Administrative expenses (6.8) (10.1) (17.4) (21.0) (21.1) (7.0) Other income and expenses 0.2 (0.4) (1.7) (0.7) (0.8) 0.3 Other (losses) gains, net (1.0) Profit from the sale of investments 3.2 Operating profit Financial (expense) income, net (0.1) (0.5) (2.3) (13.8) (14.7) (4.9) Share of the profit or loss in associates under the equity method of accounting Profit before income tax Income tax (8.7) (10.2) (20.0) (21.4) (11.5) (3.8) Net profit Net profit attributable to controlling interest(4) Net profit attributable to non-controlling interest(4)
15 As of December 31, (in millions of (in millions of S/.) US$)(1) Balance Sheet Data: Total current assets Cash and cash equivalents Accounts receivables Other current assets(5) Total non-current assets Long-term accounts receivables Property, plant and equipment Investment property Other non-current assets Total current liabilities Short-term borrowings Accounts payables Total non-current liabilities Long-term borrowings Other long-term liabilities Shareholders equity Non-controlling interest(4) Technical Services As of December 31, (in millions of S/.) (in millions of US$)(1) Income Statement Data: Revenues , , , Cost of sales (223.9) (867.3) (979.4) (989.9) (1,065.8) (356.6) Gross profit Administrative expenses (23.0) (72.1) (105.4) (132.5) (122.5) (41.0) Other income and expenses (0.1) (2.7) Gain from business combination 45.2 Other (losses) gains, net 0.4 (2.1) (0.7) Operating profit Financial (expense) income, net (1.8) (8.5) (5.1) (15.9) (25.6) (8.6) Share of the profit or loss in associates under the equity method of accounting Profit before income tax Income tax (11.3) (19.8) (5.6) (16.7) (5.8) (1.9) Net profit (5.1) (1.7) Net profit attributable to controlling interest (5.3) (1.8) Net profit attributable to non-controlling interest As of December 31, (in millions of Balance Sheet Data: (in millions of S/.) US$)(1) Total current assets Cash and cash equivalents Accounts receivables Outstanding work in progress Other current assets Total non-current assets Long-term accounts receivables Property, plant and equipment Other non-current assets Total current liabilities Short-term borrowings Accounts payables Total non-current liabilities
16 As of December 31, (in millions of Balance Sheet Data: (in millions of S/.) US$)(1) Long-term borrowings Other long-term liabilities Shareholders equity Non-controlling interest (1) Calculated based on an exchange rate of S/ to US$1.00 as of December 31, (2) Includes advance payments, which reflects advance payments made by our clients in connection with our E&C and Operation and Maintenance of Infrastructure Assets contracts. See Item 5.A. Operating and Financial Review and Prospects Operating Results Results of Operations General Engineering and Construction and Technical Services and note 20 to our audited annual consolidated financial statements included in this annual report. (3) Includes long-term accounts receivables, which includes payments required to be made by the Peruvian government for the amounts we invest to purchase trains and other infrastructure for the Lima Metro. See Item 5.A. Operating and Financial Review and Prospects Operating Results Results of Operations General Infrastructure and note 10 to our audited annual consolidated financial statements included in this annual report. (4) The net profit attributable to controlling interests of our Real Estate segment is significantly affected by the financing and commercial arrangements we use to purchase land and to develop real estate projects. Depending on the level of non-controlling interests used to finance our real estate projects, our Real Estate segment tends to have significant net profit attributable to non-controlling interests. See Item 5.A. Operating and Financial Review and Prospects Operating Results Results of Operations General Real Estate. (5) Includes inventories, which includes investments for the purchase of land by our Real Estate segment. These investments in land are recorded at book value and are not marked-to-market for changes in fair value. See note 14 to our audited annual consolidated financial statements included in this annual report. Non-GAAP Financial Measure and Reconciliation In this annual report, we present Adjusted EBITDA, a non-gaap financial measure. A non-gaap financial measure is generally defined as one that purports to measure financial performance, financial position or cash flows but excludes or includes amounts that would not be so adjusted in the most comparable IFRS measure. We define Adjusted EBITDA as net profit plus: financial (expense) income, net; income tax; depreciation and amortization; and certain other adjustments described below. Our Adjusted EBITDA includes the following other adjustments: (i) in our Infrastructure segment, in Mass Transit, we add back to net profit the components of our tariff for the Lima Metro that relate to the Peruvian government s repayment of the amounts we invest to purchase trains and other infrastructure, since we do not amortize these investments, and the interest we charge the Peruvian government in connection with the amounts we invest for such purposes. For a description of the components of our tariff for the Lima Metro, see Item 5.A. Operating and Financial Review and Prospects Operating Results Factors Affecting our Results of Operations Infrastructure; and (ii) in our Real Estate segment, we add back to net profit the portion of our costs of sales related to our cost to purchase land, as we recognize land purchases as inventory and, accordingly, do not mark-to-market or depreciate the value of our land. We present Adjusted EBITDA because we believe it provides readers with a supplemental measure of the financial performance of our core operations that facilitates period-to-period comparisons on a consistent basis. Our management uses Adjusted EBITDA, among other measures, for internal planning and performance measurement purposes. Adjusted EBITDA should not be construed as an alternative to net profit or operating profit, as an indicator of operating performance, as an alternative to cash flow provided by operating activities or as a measure of liquidity (in each case, as determined in accordance with IFRS). Adjusted EBITDA, as calculated by us, may not be comparable to similarly titled measures reported by other companies. The following table sets forth the reconciliation of our net profit to Adjusted EBITDA on a consolidated basis. 11
17 Year ended December 31, The following tables set forth the reconciliation of our net profit to Adjusted EBITDA for each of our business segments and certain of our lines of business or subsidiaries within these segments. 12 (in millions of S/.) (in millions of US$)(2) Net profit(1) Financial expense (income), net Income tax Depreciation and amortization Other adjustments (described above) Adjusted EBITDA , Engineering & Construction Year ended December 31, (in millions of S/.) (in millions of US$)(2) Net profit Financial expense (income), net (2.7) (5.3) (19.7) Income tax Depreciation and amortization Adjusted EBITDA (3) Infrastructure 2.1 Full Segment Year ended December 31, (in millions of S/.) (in millions of US$)(2) Net profit Financial expense (income), net Income tax Depreciation and amortization Other adjustments (described above) Adjusted EBITDA All Toll Roads Year ended December 31, (in millions of S/.) (in millions of US$)(2) Net profit Financial expense (income), net Income tax Depreciation and amortization Adjusted EBITDA
18 2.2(a) Norvial Year ended December 31, (in millions of S/.) (in millions of US$)(2) Net profit Financial expense (income), net Income tax Depreciation and amortization Adjusted EBITDA Mass Transit Year ended December 31, (in millions of S/.) (in millions of US$)(2) Net profit(4) (8.5) (11.0) (13.1) Financial expense (income), net (1.9) Income tax (4.7) (3.6) (0.6) (10.8) 3.6 Depreciation and amortization Other adjustments (described above) Adjusted EBITDA (15.0) (10.2) Energy Year ended December 31, (in millions of S/.) (in millions of US$)(2) Net profit Financial expense (income), net Income tax Depreciation and amortization Adjusted EBITDA Real Estate Year ended December 31, (in millions of S/.) (in millions of US$)(2) Net profit Financial expense (income), net Income tax Depreciation and amortization Other adjustments (described above) Adjusted EBITDA
19 4. Technical Services 4.1 Full Segment Year ended December 31, (in millions of S/.) (in millions of US$)(2) Net profit (5.1) (1.7) Financial expense (income), net Income tax Depreciation and amortization Adjusted EBITDA Concar Year ended December 31, (in millions of S/.) (in millions of US$)(2) Net profit (26.5) (8.9) Financial expense (income), net (0.2) (0.5) (0.6) (0.1) Income tax (0.8) (0.3) Depreciation and amortization Adjusted EBITDA (15.3) (5.1) 4.3 GMD Year ended December 31, (in millions of S/.) (in millions of US$)(2) Net profit Financial expense (income), net Income tax Depreciation and amortization Adjusted EBITDA CAM Year ended December 31, 2011(1) (in millions of S/.) (in millions of US$)(2) Net profit Financial expense (income), net Income tax (0.2) (5.9) Depreciation and amortization Adjusted EBITDA (1) Includes the results of operations of CAM since February 2011, Vial y Vives since October 2012 and DSD since August See Item 5.A. Operating and Financial Review and Prospects Operating Results Factors Affecting Our Results of Operations Acquisitions. (2) Calculated based on an exchange rate of S/ to US$1.00 as of December 31,
20 (3) Our E&C segment Adjusted EBITDA includes S/.7.7 million, S/.5.1 million, S/.9.2 million, S/.42.0 million and S/.48.2 million in 2010, 2011, 2012, 2013 and 2014, respectively, which represents GyM s 39.0% equity interest in Viva GyM s net profit. (4) In the second half of 2011, we incurred expenses during the pre-operational phase of the Lima Metro, a period during which we did not generate revenues. In 2012 and 2013, we generated losses as a result of the limited number of trains we initially operated. Currently we have 24 trains operating (including two backup trains). For more information on our Lima Metro, see Item 5.A. Operating and Financial Review and Prospects Operating Results Factors Affecting Our Results of Operations Infrastructure. Exchange Rates The Peruvian nuevo sol is freely traded in the exchange market. Current Peruvian regulations on foreign investment allow foreign equity holders of Peruvian companies to receive and repatriate 100% of the cash dividends distributed by these companies. Non-Peruvian equity holders are allowed to purchase foreign currency at free market currency rates through any member of the Peruvian banking system and transfer such foreign currency outside Peru without restriction. Peruvian law in the past, however, has imposed restrictions on the conversion of Peruvian currency and the transfer of funds abroad, and we cannot assure you that Peruvian law will continue to permit such payments, transfers, conversions or remittances without restrictions. The following table sets forth, for the periods indicated, certain information regarding the exchange rates for nuevos soles per U.S. dollar, as published by the SBS. The Federal Reserve Bank of New York does not report a noon buying rate for nuevos soles. High Low Average Period end : October November December : January February March April (through April 27) B. Capitalization and Indebtedness Not applicable. C. Reasons for the Offer and Use of Proceeds Not applicable. D. Risk Factors Risks Related to Our Company Global economic conditions could adversely affect our financial performance The global financial crisis and ensuing global recession in 2008 and 2009 had a significant adverse effect on the development of large-scale infrastructure and real estate projects worldwide. More recently, economic concerns in Europe, slower growth in China and declines in global commodity, in particular oil and gas, prices has generated economic uncertainty which could adversely affect private- and public-sector investments. Future global economic conditions, in particular fluctuations in commodity prices and financings costs, may impact our clients 15
21 investment decisions. Should our clients choose to postpone or suspend new investments, or delay or cancel the execution of existing projects, as a result of global economic conditions, demand for our products and services, including our backlog, would decline, which may result in a decline in revenues and in under-utilization of our capacity. In addition, our business may be impacted by adverse economic developments even after economic conditions have improved because of the lag time between when investments decisions are made and the projects are executed. Furthermore, financial difficulties suffered by our clients, joint operation partners, subcontractors or suppliers due to global economic conditions could result in payment delays or defaults, or increase our costs or adversely impact our project execution. Accordingly, a global economic downturn could have a material adverse effect on our financial performance. We may not be able to continue the historic growth of our business We have experienced rapid growth in our operations in recent years and our strategy is to continue to grow our operations, including through international expansion. However, we may not be able to continue to grow our business at the same pace as in recent years, or at all. Our organic revenues (i.e., excluding the results of all acquisitions since 2011) grew at a CAGR of 23.0% from 2010 to 2014 (under IFRS). Our organic revenues grew 10.6% in 2014 from The pace at which we are able to grow our business could be adversely affected by numerous factors, some of which are beyond our control, including, among others, a slowdown in Peru s recent rapid economic growth and its substantial investment in infrastructure, increased competition, and our capacity to increase scale and manage growth in our company. Growth can place significant demands on our management and operating structure, and too rapid growth may overwhelm our operating capacity. In addition, sustained growth will require us to recruit a large number of talented professionals and we cannot assure you that we will be able to hire sufficient engineers or other personnel with the expertise and experience we require. Nor can we assure you that as our company continues to grow we will be able to maintain our performance standards and corporate values across our entire organization. Failure to manage our growth effectively could adversely affect the quality of our products and services, which would have a material adverse effect on our business. We face significant competition in each of our markets Each of the markets in which we operate is competitive. We compete on the basis of, among other factors, price, performance, product and service quality, skill and execution capability, client relations, reputation and brand, and health, safety and environmental record. We face significant competition from both local and international players. Some of these competitors may have greater resources than us or specialized expertise in certain sectors. In addition, a portion of our business is derived from open bidding processes which can be highly competitive. Certain of our markets are highly fragmented with a large number of companies competing for market share. Our competitors may be more inclined to take greater or unusual risks or accept terms and conditions in a contract that we might not deem acceptable. Moreover, we cannot assure you that we will not face new competition from industry players entering or expanding their operations in our markets. If we are unable to compete effectively, our ability to continue to grow our business or maintain our market share would be affected. In addition, because one of the factors on which we generally compete is price, increased competition could impact our operating margins. Accordingly, our business and financial performance could be adversely affected by competition in our markets. A major change in Peruvian government policies could affect our business Our business is significantly affected by national, regional and municipal government policies and regulation, including with respect to infrastructure concessions or similar contracts to the private sector, public spending in infrastructure investment, and government housing subsidies, among others. Any adverse change in government policies with respect to these matters could result in a material adverse effect on our business and financial performance. 16
22 Social conflicts may disrupt infrastructure projects Despite Peru s ongoing economic growth and stabilization, high levels of poverty and unemployment and social and political tensions continue to be pervasive problems in the country. Peru has, from time to time, experienced social and political turmoil, including riots, nationwide protests, strikes and street demonstrations. In recent years certain regions experienced strikes and protests related mainly to the environmental impact of mining activities, which resulted in commercial disruptions, including in the departments of Cajamarca and Arequipa. These protests may lead to the suspension of mining projects. Social conflicts may disrupt, delay or suspend infrastructure projects in the future, which could have a material adverse effect on our business and financial performance. New projects may require the prior approval of local indigenous communities In September 2011, Peru enacted Law No. 29,785, regarding the Prior Consultation Right of Local Indigenous Communities, in accordance with the International Labor Organization Convention No. 169 (Ley del Derecho a la Consulta Previa a los Pueblos Indígenas y Originarios, Reconocido en el Convenio 169 de la Organización Internacional del Trabajo). This law establishes a prior consultation procedure (procedimiento de consulta previa) that the Peruvian government must carry out with local indigenous communities, whose rights may be directly affected by new legislative or administrative measures, including the granting of certain permits or new concessions or similar contracts such as for mining, energy and oil and gas projects. Local indigenous communities do not have a veto right; upon completion of this prior consultation procedure, the Peruvian government retains the discretion to approve or reject the applicable legislative or administrative measure. We cannot assure you that these consultation procedures will not adversely affect new projects and concessions. Accordingly, our business and financial performance may be materially and adversely affected. We may not be able to successfully expand outside of Peru One of our key strategies is to continue to expand our operations outside of Peru, particularly in Chile and Colombia, and we expect that our international operations will become a more significant part of our consolidated business in future. We cannot assure you that we will be able to replicate our success in Peru in other countries. Our international expansion is subject to additional challenges, including: our ability to assimilate cultural differences and practices; our limited familiarity with local laws, regulators and contractors; our ability to attract and manage foreign personnel; the absence of a local workforce formed in our corporate values and familiar with our operations; competition in foreign markets, including from industry players with significantly greater local experience and reputation; and other risks specific to these countries. Many countries in Latin America have suffered significant economic, political and social crises in the past, and these events may occur again in the future. If we are unable to overcome these challenges, we may not be able to successfully expand internationally. We may not be able to make successful acquisitions Part of our strategy is to evaluate strategic acquisition opportunities to expand our operations and geographic footprint, especially in Chile and Colombia. We may not be able to identify appropriate acquisition opportunities, or, if we do, we may overpay for these acquisitions or may not otherwise be able to negotiate terms and conditions that are acceptable to us. We may also face difficulties obtaining financing to pay for acquisitions. In addition, we may not be able to obtain regulatory approvals, including antitrust approvals, required to consummate acquisitions. Furthermore, even if we are able to successfully consummate an acquisition, we may encounter challenges in integrating the acquired business effectively and profitably into our operations. The integration of an acquisition involves a number of factors that may affect our operations, including diversion of management s attention, difficulties in retaining personnel and entry into unfamiliar markets. Acquired businesses may not achieve the levels of productivity anticipated or otherwise perform as expected. Acquisitions may bring us into businesses we have not previously conducted and expose us to additional business risks that are different from those we have traditionally experienced, including new geographic, market, operating and financial risks. Moreover, acquisitions involve special risks, including the potential assumption of unanticipated liabilities and contingencies. Even if such liabilities are assumed by the sellers, we may have difficulties enforcing our rights, contractual or otherwise. We cannot assure you that future acquisitions will meet our strategic objectives. 17
23 Our backlog and our ratio of historical backlog to revenues may not be reliable indicators of future revenues or profit Our backlog amount is subject to revision over time and our ability to realize revenues from our backlog is subject to a number of uncertainties. Cancellations, scope adjustments or deferrals may occur, from time to time, with respect to contracts reflected in our backlog and could reduce the amount of our backlog and the revenue and profits that we actually earn. Contracts may also remain in our backlog for an extended period of time and poor performance could also impact our profit from the contracts in our backlog. In addition, our backlog is expressed in U.S. dollars based on period-end exchange rates while a significant portion of our contracts are payable in nuevos soles or other local currencies. As a result, any depreciation of local currency would diminish the amount of revenues eventually earned relative to backlog. Moreover, one client, Ecopetrol, concentrates 86.4% of Morelco s backlog, and another client, Rio Alto, concentrates 39.2% of Stracon s backlog. Accordingly, the amount of our backlog is not necessarily indicative of future revenues or profits related to the performance of the related contracts. Our backlog may not grow at recent historic rates and may decline. We cannot assure you that we will be able to continue obtaining sufficient contracts in the future in number and magnitude to continue to grow our backlog. Additionally, the amount of new contracts signed can fluctuate significantly from period to period due to factors that are beyond our control. The ratio of our historical backlog to revenues earned in subsequent years is volatile and substantially affected by a number of factors, some of which are outside our control, including levels of contract scope adjustments and our ability to enter into new contracts (which are substantially influenced by general economic conditions), delays and cancellations, foreign exchange rate movements, and our ability to increase the scale of our operations to expand the amount of work we carry out beyond that previously contracted. Accordingly, historical correlations between backlog and revenues may not recur in future periods. In particular, you should not assume that the ratio of our future E&C segment revenues for 2015 and 2016 to backlog as of December 31, 2014 that is currently expected to be realized in each of those years will be comparable to our historic ratios shown in Item 4.B. Information on the Company Business Overview Backlog E&C Backlog. Our success depends on key personnel Our success depends, to a significant degree, upon the services of our senior management, board of directors and other key personnel (including, among others, our Chairman and our Chief Executive Officer). Members of our management team are not subject to long-term employment agreements or non-competition agreements with us. We cannot assure you that we will be successful in retaining our current senior management or members of our board of directors, nor can we assure you that, in such event, we would be able to find suitable replacements. The loss of the services of some of our senior management or members of our board of directors could have a material adverse effect on our business and financial performance. In addition, the success of our business depends on our ongoing ability to attract, train and retain qualified engineers and other personnel. In recent years, the availability in Peru of qualified personnel who have the necessary expertise and experience has been lower than demand and, therefore, competition for human resources has become intense. We cannot assure that we will be able to hire and retain the number of qualified personnel required to meet the needs of, or to grow, our business. If we are unable to attract, train and retain the qualified personnel that we require at reasonable cost, our business and financial performance could be adversely affected. Our success depends, to a large extent, on our reputation for the quality, reliability, timely delivery and safety of our products and services We believe our track record and reputation are key factors in our clients evaluation of whether to engage our services and purchase our products, encouraging key industry players to partner with us, and recruiting and retaining talented personnel to our company. Our reputation is based, to a large extent, on the quality, reliability, timeliness and safety of our products and services. If our products do not meet expected standards or we fail to meet our deadlines, our relationship with our clients and partners could suffer, the reputation of our company could be adversely affected, we may not be invited to new bidding processes and our ability to capture new business could be severely diminished. 18
24 The nature of our business exposes us to potential liability claims and contract disputes We may be subject to a variety of legal or administrative proceedings, liability claims or contract disputes. The government, clients and other third parties may present claims against us for injury or damage caused, directly or indirectly, by our operations, for example for alleged failures in our engineering and construction, the operation of our infrastructure concessions (such as our toll roads or the Lima Metro), and real estate developments we sell. Although we have adopted a range of insurance, risk management and risk avoidance programs designed to reduce potential liabilities, a catastrophic event resulting from the services we have performed or products we have provided could result in significant professional or product liability, warranty or other claims against us as well as reputational harm, especially if public safety is impacted. We may in the future be named as a defendant in legal proceedings where our clients or third parties may make a claim for damages or other remedies with respect to our projects or other matters. Any liability not covered by our insurance, or in excess of our insurance limits, could result in a significant loss for us, which may affect our financial performance. We are susceptible to operational risks that could affect our business and financial performance Our business is subject to numerous industry-specific operational risks, including natural disasters, adverse weather conditions, operator error or other accidents, mechanical and technical failures, explosions and other events, many of which are beyond our control. Such occurrences could result in injury or loss of life, severe damage to and destruction of property and equipment, business interruption, pollution and other environmental damage, clean-up responsibilities, regulatory requirements, investigations and penalties, and potential liability claims and contractual disputes. In addition, such occurrences could materially impact our reputation. Although we maintain comprehensive insurance covering our assets and operations at levels that our management believes to be adequate, our insurance coverage will not be sufficient in all circumstances or to protect against all hazards. The occurrence of such an operational risk could have a material adverse effect on our business and financial performance. Deterioration in our safety record could adversely affect our business and financial performance Our ability to retain existing clients and attract new business is dependent on our ability to safely operate our business. Existing and potential clients consider the safety record of their services providers to be of high importance in their decision to award service contracts. Some of our activities, in particular in our E&C segment, as well as our electricity networks services line of business, can be high risk by their nature. If one or more accidents were to occur at a site, the affected client may terminate or cancel our contract and may be less likely to continue to use our services. We cannot assure you that we will not experience accidents in the future, causing our safety record to deteriorate. Accidents may be more likely as we continue to grow, particularly if we are required to hire less experienced employees due to shortages of skilled labor. Moreover, often times we do not perform these activities by ourselves and accidents can happen due to errors committed by partners and subcontractors over whom we have no control. Because many of our clients require us to report our safety metrics to them as part of the bidding process and because a substantial part of our client base is comprised of major companies with high safety standards, a general deterioration in our safety record could have a material adverse impact on our business including our ability to bid for new contracts. Any safety incidents or deterioration in our safety record could adversely impact our ability to attract and retain qualified employees. In addition, we could also be subject to liability for damages as a result of accidents and could incur penalties or fines for violations of applicable safety laws and regulations. Increases in the prices of energy, raw materials, equipment or wages could increase our operating costs Our business requires significant purchases of energy, raw materials and components, including, among others, large quantities of fuel, cement and steel, as well as purchases or leases of equipment. Certain of these inputs used in our operations are susceptible to significant fluctuations in prices, over which we may have little control. The prices of some of these inputs are affected to a significant extent by the prices of commodities, such as oil and iron. Substantial increases in the prices of such commodities generally result in increases in our suppliers operating costs and, consequently, lead to increases in the prices they charge for their products. Moreover, we do not have long-term contracts for the supply of our key inputs, and, as result, if prices increase significantly or if we are required to find alternative suppliers, our costs to procure these inputs may increase significantly. In addition, 19
25 growing demand for labor, especially when coupled with shortages of qualified employees in the countries where we operate, may result in significant wage inflation. To the extent that we are unable to pass along to our clients increases in the prices of our key inputs or increases in the wages that we must pay, our operating margins could be materially adversely impacted. We may not be able to obtain financing on favorable terms Our ability to undertake large investments (particularly in our Infrastructure and Real Estate segments) or consummate significant acquisitions will depend on the availability of equity and debt financing. We cannot assure you that we will be able to obtain new financings in the future on favorable terms or at all. Our ability to obtain financings will depend in part upon prevailing conditions in credit and capital markets, which are beyond our control. In 2008 and 2009, global markets suffered turmoil, which significantly constrained the availability of new financings. In addition, our ability to obtain new financing, or refinance existing debt, may at certain times be adversely affected by the cyclicality of our business, particularly our E&C segment, as has occurred in the past. Furthermore, in response to the ensuing global economic recession in 2009, many countries, in particular the United States as well as the countries where we operate, have maintained target interest rates at very low levels, and we cannot assure you that these interest rates will not rise significantly in the future, which would impact our costs of funding. The U.S. Federal Reserve has made statements that it intends to commence increasing target interest rates in 2015, which, if implemented, could lead to higher interest rates globally, including in Peru. If adequate funds are not available, or are not available on favorable terms, we may not be able to make future investments or take advantage of acquisitions or other opportunities. We may not be able to recover on claims against clients for payment If a client fails to pay our invoices on time or defaults in making its payments to us, we could incur significant losses. We occasionally bring claims against clients, principally the government, for delayed payments, additional costs that exceed the contract price or for amounts not included in the original contract price, including change orders. These types of claims can occur due to matters such as owner-caused delays or changes from the initial project scope, and, occasionally, they can be the subject of lengthy proceedings. When these types of events occur and unresolved claims are pending, we may invest significant working capital in projects to cover cost overruns pending the resolution of the relevant claims. Moreover, we have recently encountered difficulties collecting on claims even once we have won awards in arbitration proceedings, particularly claims against the government. A failure to promptly recover on these types of claims and change orders could have a material adverse effect on our financial performance. If we are unable to enter into joint operations or other strategic alliances, our ability to compete for new business may be adversely affected We may join with other companies to form joint operations or other strategic alliances to compete for a specific concession or contract, including with partners that contribute expertise in a specific field. Because a joint operation or alliance can often offer stronger combined qualifications than a company on a stand-alone basis, these arrangements can be important to the success of a particular bid. If we are unable to enter into joint operations or other strategic alliances, our ability to compete for new business may be adversely affected. Our joint operations and other strategic alliances may be affected by disputes with, or the unsatisfactory performance by, our partners Joint operations and other strategic alliances that we enter into as part of our business, including arrangements where operating control may be shared with unaffiliated third parties, may involve risks not otherwise present when we operate independently, including: sharing approval rights over major decisions; responsibility for our partners unpaid obligations or liabilities; and inconsistencies in our and our partners economic or business interests or goals. Any disputes between us and our partners may result in delays, litigation or operational impasses. We may also incur liabilities as a result of action taken by our partners. In addition, if we participate in joint operations or other strategic alliances where we are not the controlling party, we may have limited control over operation decisions and actions and the success of the joint operation or other strategic alliance will depend largely on the performance of our partners. These risks could adversely affect our ability to transact the business that is the 20
26 subject of such joint operation or other strategic alliance, and could result in the termination of the applicable concession or contract. Under these circumstances, we may be required to make additional investments and provide additional services to ensure adequate performance and delivery. These additional obligations could result in reduced profits or, in some cases, increased liabilities or significant losses for us. In addition, failure by a partner to comply with applicable laws or regulations could negatively impact our business and, in the case of government contracts, could result in fines, suspension or even debarment from participating in bidding processes. As a result, our business and financial performance could be adversely affected by disputes involving our joint operation or other strategic alliances. We are dependent upon third parties to complete many of our contractual obligations We rely on third-party suppliers to provide much of the materials and equipment used in our businesses. A portion of the work performed under our infrastructure concessions and, to a lesser extent, other contracts is performed by third-party subcontractors. As a result, the timely completion and quality of our projects may depend on factors beyond our control, including the quality and timeliness of the delivery of materials supplied for use in the project and the technical skills of subcontractors hired for the project. If we are unable to find qualified suppliers or hire qualified subcontractors, our ability to meet our contractual obligations could be impaired. In addition, if the amount we are required to pay for supplies, equipment or subcontractors exceeds what we have estimated, we may suffer losses under our contract. If a supplier or a subcontractor fails to provide supplies, equipment or services as required under a negotiated arrangement for any reason, or provides supplies, equipment or services that are not of an acceptable quality, we may be required to source those supplies, equipment or services on a delayed basis or at a higher price than anticipated, which could impact our financial performance. In addition, faulty materials or equipment could result in claims against us for failure to meet contractual specifications, and failure by suppliers or subcontractors to comply with applicable laws and regulations could negatively impact our reputation and our business and, in the case of government contracts, could result in fines, suspension or even debarment from participating in bidding processes. These risks may be intensified during economic downturns if these suppliers or subcontractors experience financial difficulties. As a result, our business and financial performance may be adversely affected by our dependence on third party providers. Debarment from participating in government bidding processes would have a material adverse effect on our business and financial performance We would face debarment from participating in government bidding processes for one to three years if we were found to have violated certain provisions of the Peruvian State Contracting Law (Ley de Contrataciones del Estado). We are required to comply with a large number of contractual obligations with the government in our business, and we cannot assure you that we will be in full compliance at all times. Moreover, such a debarment would affect the ability of our entire company (including any of our subsidiaries), and not just the line of business where the alleged violation took place, to participate in government bids under the Peruvian State Contracting Law. In December 2011, SUNAT (Superintendencia Nacional de Aduanas y Administración Tributaria), the Peruvian tax and customs authority, provided us with notice that they had terminated one of GMD s contracts in our Technical Services segment, which resulted in the elimination of approximately US$4.2 million from our backlog as of such date, alleging a number of service deficiencies. In response to SUNAT s contract termination, we initiated an arbitration against SUNAT and SUNAT counterclaimed for the payment of performance bonds in an aggregate amount of S/.1.6 million. A negative outcome in this arbitration, if we do not resolve the dispute with SUNAT, would also affect our company s, including any of our subsidiaries, participation in government bidding processes under the Peruvian State Contracting Law. Additionally, in April 2013, Perupetro initiated an administrative proceeding against a subsidiary in our E&C segment, claiming that the subsidiary had submitted a bid to provide engineering services while not being in compliance with certain technical requirements. We lost the administrative proceeding at the end of 2013 and we immediately commenced judicial action to contest this decision. Although we believe that the likelihood of an adverse outcome in this proceeding is remote, an adverse outcome would affect our company s, including any of our subsidiaries, participation in government bidding processes under the Peruvian State Contracting Law. Furthermore, in March 2014, the regional government of Cusco provided us with a notice that they had terminated one of Concar s toll road operation and maintenance contracts, representing a backlog loss of US$48.4 million. We believe this termination is invalid, since we had previously terminated the contract due to a lack of payment and failure to provide access to the related road. All of these procedures remain pending as of the date of this annual report. A significant part of our revenues on a consolidated basis is derived from public sector contracts in Peru. As a result, if our company is debarred from participating in government bidding processes, our business and financial performance would be materially and adversely affected. 21
27 Failure to comply with, or changes in, laws or regulations could have a material adverse effect on our business and financial performance We operate in highly regulated industries. Our business and financial performance depends on our and our clients ability to comply on a timely and efficient basis with extensive national, regional and municipal laws and regulations relating to, among other matters, environmental, health and safety, building and zoning, labor, tax and other matters. The cost of complying with these laws and regulations can be substantial. In addition, compliance with these laws and regulations can cause scheduling delays. Although we believe we are in compliance with all applicable concessions, other similar contracts, laws and regulations in all material respects, we cannot assure you we have been or will be at all times in full compliance. Failure by us or our clients to comply with our concessions, similar contracts or these laws and regulations could result in a range of adverse consequences for our business, including subjecting us to significant fines, civil liabilities and criminal sanctions, requiring us to comply with costly restorative orders, the shutdown of operations, and revocation of permits and termination of concessions or similar contracts. In addition, we cannot assure you that future changes to existing laws and regulations, or stricter interpretation or enforcement of existing laws and regulations, will not impair our ability to comply with such laws and regulations or increase our compliance costs. Moreover, on July 11, 2014, the Peruvian government enacted a new State Contracting Law, which is not in effect yet and for which implementing regulation has not been published. We do not believe that this new law will have a material effect on our business, but we cannot assure you that it will not. Accordingly, existing or future regulation in our markets could have a material adverse effect on our business and financial performance. We may be held liable for environmental damage caused by our operations The nature of certain of our operations requires us to assume risks of causing environmental and other damages. We may be held liable for the environmental damage we cause, including the incidental consequences of human exposure to hazardous substances or other environmental damage. We may be subject to clean up costs or penalties in the event of certain discharges into the environment and/or environmental contamination and damage. Our environmental liability insurance may not be sufficient or may not apply to certain types of environmental damage. Any substantial liability for environmental damage could have a material adverse effect on our financial performance. New environmental regulation as a result of climate change could impact our business and financial performance Growing concerns about climate change could result in the imposition of additional or more stringent environmental requirements or regulations. For example, there are ongoing international efforts to address greenhouse emissions, such as the Kyoto Protocol, which are in various stages of negotiation and implementation. If more stringent environmental regulation is adopted in the countries where we operate, we may be obliged to incur higher expenditures than anticipated, adversely affecting our financial performance. In addition, future remediation requirements in the event that we are found responsible for environmental damage may be substantial, which could impact our financial condition. Moreover, more stringent environmental regulation could increase the costs of projects for our clients or, in some cases, prevent a project from going forward, thereby potentially reducing the demand for our services. Accordingly, new environmental regulation could have a material adverse effect on our business and financial performance. We may not be able to effectively protect against financial market risks Our operations are exposed to financial market risks, such as risks related to exchange rates, commodity prices and, to a lesser extent, interest rates. Fluctuations in currency, commodity prices or interest rates could adversely affect our financial performance. We cannot assure you that derivative financial instruments will protect us from the adverse effects of financial market risks. While hedging transactions are intended to reduce market risks, such transactions may expose us to other risks, such as counterparty risk. We may not be able to adequately protect ourselves against financial market risks and may not ultimately realize an economic benefit from our hedging strategy. 22
28 The loss of a key client in some of our lines of business may affect our business and financial performance In some of our lines of business, such as our Infrastructure and Technical Services segments, a substantial amount of the revenue we receive is concentrated among a limited number of clients, including the Peruvian government. If one or more of these major clients fail or delay in paying our fees, or if there is a significant reduction or cancellation of business by one or more of these major clients, our business and financial performance may be adversely affected. In particular we cannot assure you that Enersis, from whom we acquired our electricity networks services line of business in 2011, will not reduce its use of our services. If we are not able to capture new clients to replace the loss of business from existing key clients, our financial performance may be adversely affected. Our use of the percentage-of-completion method of accounting for our Engineering and Construction segment could result in a reduction of previously recorded profits In accordance with IFRS, we measure and recognize a large portion of our revenues under the percentage-of-completion accounting methodology. This methodology allows us to recognize revenues ratably over the life of a contract, without regard to the timing of receipt of cash payments, by comparing the amount of the costs incurred to date against the total amount of costs expected to be incurred. The effect of revisions to estimated costs, and thus revenues, is recorded when the amounts are known and can be reasonably estimated. These revisions can occur at any time and could be material. On a historical basis, we believe that we have made reasonably reliable estimates of the progress towards completion on our long-term contracts. However, given the uncertainties associated with these types of contracts and inherent in the nature of some of the industries in which we operate, it is possible for actual costs to vary from estimates previously made, which may result in reductions or reversals of previously recorded profits. Labor unrest could adversely affect our financial performance All of our manual laborers and a portion of our employees are members of labor unions. Our practice is generally to extend benefits we offer our unionized employees to non-unionized employees. In our E&C segment, collective bargaining agreements are negotiated at two levels, on an annual basis between the Peruvian National Federation of Civil Construction and the Peruvian Chamber of Construction, without our direct involvement, and on a per project basis directly between the unions and us in accordance with such annual agreement. We also have collective agreements with our employees in certain of our business segments, which are also negotiated periodically. Although we consider that our relationship with unions are currently positive, we cannot assure you that we will not experience work slowdowns, work stoppages, strikes or other labor disputes in the future, which could result in the interruption or delay of our operations. Such interruptions or delays could have an adverse impact on our business, including on the cost of our projects and our ability to make timely delivery. Moreover, our operations may also be affected by labor unrest in our clients or our partners workforce. The proceeds from our insurance policies may not be sufficient and we may not be insured against all risks We maintain insurance coverage both as a corporate risk management strategy and in order to satisfy the requirements under certain regulations and contracts. We cannot assure you that proceeds from our insurance policies, however, will be sufficient to cover the damages resulting from any event covered by such policies. Certain risks are not covered under the terms of our insurance policies, such as interruption of operations. In such event, we may incur significant expenses to rebuild our facilities, repair or replace our equipment, or cover other damages. In addition, if any of our third party insurers fail, abruptly cancel our coverage or otherwise cannot satisfy their insurance requirements to us, then our overall risk exposure and operational expenses could be increased. Moreover, we may not be able to renew our insurance policies on favorable terms, or at all. Although we have in the past been generally able to cover our insurance needs, we cannot assure you that we will be able to secure all necessary insurance in the future. 23
29 An increase in import duties and controls may have a material adverse effect on our financial performance Our future success depends in part on our ability to select and purchase quality mechanical instruments and equipment at attractive prices. While we have historically been able to do so, such instruments and equipment may become subject to higher import taxes than currently apply. We cannot assure you that there will not be further increases in import taxes, changes in laws related to imports or the imposition of quotas by countries from which we import mechanical instruments and equipment, which could have a material adverse effect on our business. The government may declare the nullity of public bidding processes after we have been awarded a project or concession. Even if we win the public biding for a project or concession, the government may subsequently declare the process void for political, budgetary or other reasons and may withdraw the project or concession awarded to us. For example, in June 2014, we were determined the winner of a public bidding for a concession to operate the fare collection system of Lima s integrated transportation system for a period of sixteen years. However, in January 2015, the Municipality of Lima notified us that the board of directors of the Instituto Metropolitano Protransporte de Lima Protransporte had declared the nullity of the public biding process, based on a report issued by the Peruvian Ministry of Economy and Finance, which concluded that the Ministry should have pronounced itself with respect to the concession prior to the bidding process instead of afterwards. The declaration of nullity of projects or concessions awarded to us could affect our future results of operations. Moreover, the uncertainty that results from these type of decisions may adversely impact investor confidence in Peru and our business. Additional Risks Related to our Engineering and Construction Business We are vulnerable to the cyclical nature of the end-markets we serve Demand for our engineering and construction services is dependent on conditions in the end-markets we serve, which include, among others, the mining, power, oil and gas, transportation, real estate and other infrastructure sectors in Peru, as well as the mining sector in Chile and the energy sector in Colombia. Consequently, our engineering and construction business is closely linked to the performance and growth of these sectors, and it is exposed to many of the risks faced by our clients operating in these sectors, over which we have no control. These industries tend to be cyclical in nature and, as a result, although downturns can impact our entire company, our engineering and construction business has historically been subject to periods of very high and low demand. For example, between 2000 and 2003, there was a significant decline in activity in the Peruvian real estate and construction sectors, which consequently affected our and our competitors business and financial performance during that time. Factors that can affect these sectors include, among others, macroeconomic conditions, climate conditions, the level of private and public investment, the availability of credit, changes in laws and regulations, and political and social stability. The mining and oil and gas sectors, in particular, are also driven by worldwide demand for the underlying commodities, including, among others, silver, gold, copper, oil and gas, which can be affected by such other factors as global economic conditions and geopolitical affairs. A decline in prices for minerals or oil and gas (including the recent steep decline in global oil and gas prices) can have a significant impact on our clients exploration and production activities and, as a result, on their demand for our engineering and construction services. Accordingly, adverse developments in the end-markets served by our engineering and construction business could have a material adverse effect on our financial performance. Decreases in capital investments by our clients may adversely affect the demand for our services Our engineering and construction business is directly affected by changes in private-sector and, to a lesser extent, publicsector investments for large-scale infrastructure projects. In addition, our engineering and construction business is directly affected by the availability and cost of financings for these projects. In the markets where we operate, investments and financings for large-scale projects have historically been influenced by macroeconomic and other factors which are beyond our control, including in the case of public-sector investment, government spending levels. As a result, we cannot assure you that clients will not choose to limit or not undertake new projects or delay, suspend or cancel existing projects. Reductions in anticipated capital investments or available financing for large-scale projects could have a material adverse effect on our financial performance. 24
30 Our revenues may fluctuate based on project cycles, which we may not control The substantial majority of the revenues from our engineering and construction business is generated from project awards, the timing of which may be unpredictable and outside of our control, especially considering the highly competitive bidding processes and complex and lengthy negotiations they involve. These processes can be impacted by a wide variety of outside factors including governmental approvals, financing contingencies and overall market and economic conditions. Moreover, because a significant portion of our revenues is generated from large-scale projects, our results of operations can fluctuate quarterly or yearly depending on whether and when project awards occur and the commencement and progress of work under awarded contracts. As a result, we are subject to the risk that revenues may not be derived from awarded projects as quickly as anticipated. Our business may be adversely affected if we incorrectly estimate the costs of our projects We conduct our engineering and construction business under various types of contractual arrangements where costs are estimated in advance. In some of our contracts (i.e., lump-sum, unit price and EPC) we bear the risk of some or all unanticipated cost overruns, including due to inflation or certain unforeseen events. Risks under contracts which could result in cost overruns include: difficulties in performance of our subcontractors, suppliers, or other third parties; changes in laws and regulations or difficulties in obtaining permits or other approvals; unanticipated technical problems; unforeseen increases in the cost of inputs, components, equipment, labor, or the inability to obtain these on a timely basis; delays caused by weather conditions; incorrect assumptions related to productivity or scheduling estimates; and project modifications that create unanticipated costs or delays. These risks tend to be exacerbated for longer term contracts since there is increased risk that the circumstances under which we based our original bid could change. In many of our contracts, we may not be able to obtain compensation for additional work performed or expenses incurred. Our failure to estimate accurately the resources and time required to complete a project could adversely affect our profitability. Even under our cost-plus contracts, our inability to complete projects within the estimated budget could affect our relationship with our clients and negatively impact awards of future contracts. As a result, if we incorrectly estimate the costs of our projects, our business and financial performance could be adversely affected. We may be unable to deliver our services in a timely manner The success of our engineering and construction business depends on our ability to meet the standards and schedules required by our clients. Significant delays that prevent us from providing our services on agreed time frames could adversely affect our client relations and reputation. Delays may occur for a number of reasons, including as a result of our inability to adequately foresee the needs of our clients; delays caused by our joint operation partners, subcontractors or suppliers; insufficient production capacity; equipment failure; shortage of qualified workers; changes to customs regulations; and natural disasters. Failure to finish construction by the contractual completion date set forth in the contract could result in costs that reduce our projected profit margins, including a requirement to pay daily penalties and damages. If we are unable to meet deadlines, either due to internal problems or as a result of events over which we have no control, we may lose the trust of our clients and, therefore, experience a decrease in the demand for our services. In such event, our business and financial performance could be adversely affected. We may not be able to obtain compensation for additional work or expenses incurred as a result of client-requested change orders Clients often determine, after commencement of the project, to change various elements of the project. Some of our contracts may also require that clients provide us with design or engineering information or with equipment or materials to be used on the project, and, in some cases, the client may provide us with deficient design or engineering information or equipment or materials or may provide the information or equipment or materials to us later than required by the project schedule. Our project contracts generally require the client to compensate us for additional work or expenses incurred due to client requested change orders or failure of the client to provide us with specified design or engineering information or equipment or materials. Under these circumstances, we generally negotiate with the client with respect to the amount of additional time required to make these changes and the compensation to be paid to us. We are subject to the risk that we are unable to obtain, through negotiation, arbitration, litigation or otherwise, adequate amounts to compensate us for the additional work or expenses incurred 25
31 by us due to client-requested change orders or failure by the client to timely provide required items. A failure to obtain adequate compensation for these matters could require us to record an adjustment to amounts of revenue and gross profit that were recognized in prior periods. Any such adjustments, if substantial, could have a material adverse effect on our financial performance. We may have difficulty obtaining performance bonds that we require in the normal course of our operations In our engineering and construction business, it is industry practice for customers to require performance bonds or other forms of credit enhancement to secure, among other things, bids, advance payments and performance. We cannot assure you that in the future we will not encounter difficulties in obtaining such performance bonds or credit enhancements. The Peruvian market for these types of credit instruments is small; moreover, under Peruvian banking regulations, lenders are required to impose limits on the amount of credit they extend to a group of affiliated companies. Failure to provide performance bonds or credit enhancements on terms required by clients may result in our inability to compete for or win new projects. Additional Risks Related to our Infrastructure Business A substantial or extended decline in oil prices may adversely affect our financial performance A substantial part of the revenues of our infrastructure business depends upon prevailing prices for oil. Historically, oil prices and markets have been volatile and are likely to continue to be volatile in the future. Moreover, global oil prices have declined significantly in recent months, with the average Brent crude prices declining from US$ in 2012, US$ in 2013 and US$99.02 in 2014 to US$55.79 per barrel in March Oil is a commodity and its price is subject to wide fluctuations in response to relatively minor changes in supply and demand for oil, market uncertainty, and a variety of additional factors beyond our control. Those factors include, among others: global demand and supply; political developments in producing regions; weather conditions; governmental regulations; international conflicts and acts of terrorism; the price and availability of alternative sources of energy; and overall local and global economic conditions. Moreover, lower oil prices may not only decrease our revenues on a per unit basis, but may also reduce the amount of oil we can produce economically, if any, and, as such, may have a negative impact on the reserves of the fields in which we operate. As result, our financial performance could be materially and adversely affected by declines in oil prices. Our reserves estimates depend on many assumptions that may turn out to be inaccurate and are not subject to review by independent reserve auditors The process of estimating oil and gas reserves is complex, although the fields where we produce oil and gas are mature (Block I has been in production for over 100 years and Block V for over 50 years). In order to prepare our reserves estimates for Blocks I and V presented in this annual report, we must project production rates and timing of development expenditures as well as analyze available geological, geophysical, production and engineering data, and the extent, quality and reliability of this data can vary. The process also requires economic assumptions about matters such as oil prices, drilling and operating expenses, capital expenditures, taxes, and availability of funds. Therefore, estimates of reserves are inherently imprecise. Moreover, our reserve estimates for Blocks I and V included in this annual report have been prepared internally by our team of engineers, and have not been audited or reviewed by independent engineers. Actual future production, oil and gas prices, revenues, taxes, development expenditures, operating expenses and quantities of recoverable reserves will most likely vary from the estimates presented in this annual report, and those variances may be material. Any significant variance could materially affect the estimated reserves of the fields in which we operate. On December 12, 2014, we were awarded license contracts for a 30-year term for Blocks III and IV and we began operations on April 5, Considering the recent initiation of operations, we have not yet prepared our own reserve estimates for these blocks. As a result, we have not included in this annual report reserve estimates for Blocks III and IV; instead, we have included production levels of prior contractors for in Blocks III and IV based on information published by Perupetro. We cannot assure you what the reserves estimates for Blocks III and IV will be once we complete our evaluation. 26
32 Our return on our investment in our concessions may not meet estimated returns Our return on any investment in a concession is based on the terms and conditions of the concession, its duration and the amount of capital invested as well as the amount of revenues collected, debt service costs, payment of penalties and other factors. For example, traffic volume at toll roads may be affected by a number of factors beyond our control, including security conditions; general economic conditions; demographic changes; fuel prices; reduction in commercial or industrial activities in the regions served by the roads; and natural disasters. Decreased traffic at Norvial could adversely affect our financial performance. Although some of our concessions allow for adjustments based on economic conditions, certain concessions provide that adjustment requests be approved only if certain limited events specified in our concession contracts have occurred. If a request of adjustment is not granted, our financial performance could be affected. Given these factors and the possibility that governmental authorities could implement policies that affect our contractual return on investment in a way that we did not anticipate, we cannot assure you that our return on any investment under any concession will meet our estimates. Governmental entities may terminate prematurely our concessions and similar contracts under various circumstances, some of which are beyond our control Our ability to continue operating our concessions and similar public-sector contracts depends on governmental authorities, which may revoke the agreement for certain reasons set forth in the relevant documentation contract and in applicable legislation, including the failure to comply with any contractual terms (including the concessionaire s default on debt) or applicable law. Moreover, the relevant governmental authority may terminate and/or repossess a concession at any time, if, in accordance with applicable law, it determines that it is in the public interest to do so. The relevant governmental authority may also assume the operation of a concession in certain emergency situations, such as war, public disturbance or threat to national security. In addition, in the case of force majeure, the relevant governmental authority may require us to implement certain changes to our operations. If the government terminates any of our concessions, under Peruvian law it is generally required to compensate us for the amount of our unrecovered investment, unless the concession is revoked pursuant to applicable law or the terms of the concession which would imply a serious breach of the concession s terms by us. Such compensation process is likely to be time consuming and the amount paid to us may not fully compensate us. We cannot assure you that we would receive such compensation on a timely basis or in an amount equivalent to the value of our investment in a concession plus lost profits. We are exposed to risks related to the operation and maintenance of our concessions and similar contracts The operation and maintenance requirements under our concessions could encounter delays or cause us to exceed our budgeted costs for such projects, which could limit our ability to realize the expected return on these projects, increase our operating or capital expenses and adversely affect our business and financial performance. In addition, our operations may be adversely affected by interruptions or failures in the technology and infrastructure systems that we use to support our operations, including toll road collection and traffic measurement systems. The Lima Metro in particular may be susceptible to outages due to power loss, telecommunications failures and similar events. The failure of any of our technology systems may cause disruptions in our operations, adversely affecting our profitability. While we have business continuity plans in place to reduce the adverse impact of information technology system failures on our operations, we cannot assure you that these plans will be effective. Furthermore, accidents and natural disasters may also disrupt the construction, operation or maintenance of our projects and concessions, which could adversely affect our business and financial performance. We may not be successful in obtaining new concessions The market for infrastructure concessions in Peru is competitive. We compete with Peruvian and foreign companies for infrastructure concessions in Peru, some of whom may have greater financial and other resources or particular expertise pertinent to a specific concession. Moreover, our public-sector clients may face budget deficits that may prohibit the development of infrastructure concessions, which could affect our business. We may also not be able to obtain additional concessions if the government decides not to award new concessions, due to budget constraints or policy changes or because alternative financing mechanisms are used. Our inability to bid for or obtain new concessions may adversely affect our business and financial performance. 27
33 Our contract with Petroperú S.A. ( Petroperú ) for fuel storage at the South terminal is currently scheduled to expire in August 2015, with a new public biding expected to take place in May. Moreover, we cannot assure you whether or when we will undertake any of the projects that have been awarded to us but for which contract negotiations are ongoing, in particular the concession for the Via Expresa Javier Prado. A contract for the Via Expresa Javier Prado was approved by the City of Lima s Council in November 2013 and was submitted to the Peruvian Ministry of Economy and Finance, which requested additional studies related to traffic volumes prior to approving the project. Such studies are currently being prepared. We cannot assure you that the Ministry will approve the contract under the current terms or at all. We may not be able to negotiate contracts terms that are favorable to us or at all. In addition, these projects may suffer long delays or suspension as a result of political considerations or other factors. Additional Risks Related to our Real Estate Business We are exposed to risks associated with the development of real estate Our real estate business is subject to the risks that generally affect the real estate industry, such as availability and prices of suitable land, environmental and zoning regulations, interruptions in supply and volatility of the prices of construction materials and equipment, and changes in the demand for real estate. Our real estate business is specifically affected by the following risks: macroeconomic conditions in Peru that may impact the growth of the real estate sector as a whole, particularly in the residential market, including an increase in unemployment or a decrease in wage levels; an increase in prevailing interest rates or lack of available credit; changes in government subsidies for affordable housing; unfavorable real estate market conditions, such as an oversupply of residential units or scarcity of suitable land in particular areas; the level of customer interest in our new projects or the sales price per unit necessary to sell the unit may be lower than expected; customer perception of the security, convenience and attractiveness of our projects and the areas in which they are located; cost overruns, many of which may be beyond our control, that exceed our estimates and affect our profit margins, including the price of labor, land, insurance, taxes and public charges; the construction and sale of units may not be completed on schedule; bankruptcy or significant financial difficulties of large industry players, which cause a loss of confidence in the industry; and restrictions on real estate development imposed by local, regional and national laws and regulations. The occurrence of any of the above events may have a material adverse effect on our business and financial performance. Real estate prices may not continue to rise and may decline Real estate prices in Peru have risen significantly over the last decade. We cannot assure you that this increase in real estate prices does not represent a bubble. Real estate prices in Peru may not continue to rise or may decline significantly, particularly if financing costs rise or consumer confidence in the real estate market erodes. If real estate prices decline significantly, our business and financial performance could be materially and adversely affected. Our business may be adversely affected if we are not able to obtain the necessary licenses and/or authorizations for our developments in due time Real estate development requires obtaining certain licenses, authorizations and registrations. In Peru, local authorities are responsible for issuing most of the licenses that are required during the development stage, including zoning, demolition and construction licenses, among others. Currently, we have approximately 19 real estate projects in various stages of development. We have not yet initiated the administrative processes before the appropriate authorities, or such procedures are pending approval, for two of these developments, including our Project Espacio (formerly Cuartel San Martín), a multi-use development project, as they are still in the early stages of development. A denial or an extended delay by applicable administrative authorities may render land unsuitable for development or delay the completion of planned projects, increase our costs and adversely affect our business and financial performance. 28
34 Scarcity of financing and/or an increase in interest rates could decrease the demand for real estate properties The scarcity of financing and/or an increase in interest rates may adversely affect the ability or willingness of prospective buyers to purchase our real estate properties. In most cases, the purchasers of our residential or commercial properties finance at least part of the purchase price with mortgage loans. In 2014, 67.8% of our residential units was sold to purchasers who received government subsidies to finance the purchase homes. An increase in interest rates, whether as a result of market conditions or government action or otherwise, may cause a decrease in the demand for our residential and commercial properties and for land development, as well as an increase of our own financing costs, which may adversely affect our business and financial performance. We may experience difficulties in finding desirable land and increases in the price of land may increase our cost of sales and decrease our earnings The continued growth of our real estate business depends in large part on our ability to continue to acquire land and to do so at a reasonable cost. As more developers enter or expand their operations in the Peruvian real estate sector, land prices could rise significantly and suitable land could become scarce due to increased demand or decreased supply. A resulting rise in land prices may increase our cost of sales and decrease our earnings. We may not be able to acquire suitable land at reasonable prices in the future, which may have a negative impact on our financial performance. Changing market conditions may adversely affect our ability to sell home inventories in our land and at expected prices There is a lag between the time we acquire land and the time that we can bring the developed properties to market. Lag time varies on a project-by-project basis. As a result, we face the risk that demand for real estate may decline or that other developments may occur during this period that affect market conditions, and that we will not be able to dispose of developed properties or undeveloped land at expected prices or profit margins or within anticipated time frames or at all. Significant expenditures associated with investments in real estate, such as maintenance costs, construction costs and debt payments, cannot generally be reduced if changes in market conditions cause a decrease in expected revenues from our properties. Moreover, the market value of home inventories and undeveloped land can fluctuate significantly because of changing market conditions. As a result of these and other factors beyond our control, we may be forced to sell properties or land at a loss or for prices that generate lower profit margins than we anticipate. Determinations by INDECOPI may adversely affect our ability to enforce binding contracts In resolving consumer protection complaints in the real estate and insurance sectors, INDECOPI has made determinations against real estate developers that in effect altered their contractual arrangements with purchasers, including one determination against Viva GyM which we are currently challenging in the judicial system. Moreover, some purchasers of our real estate have recently filed complaints against us before INDECOPI and/or made claims in the media with the objective of obtaining not only compensation for alleged deficiencies in housing construction but also improved terms from those that they originally agreed to, which may have a negative impact on our real estate business. An increase in consumer complaints and consumer protective measures, particularly those that alter contractual terms, if we are not able to counter these claims, may affect our ability to enforce our contracts under existing terms, which may have a negative impact on our real estate business. Additional Risks Related to our Technical Services Business Our engagements with clients may not be profitable or may be terminated or not renewed The pricing and other terms of many of our client contracts in our technical services business necessarily require us to make estimates and assumptions at the time we enter into these contracts that could differ from actual results. These estimates reflect our best judgments regarding the nature of the engagement and our expected costs to provide the contracted services. Because of the competitive nature of the markets in which we operate, particularly in IT services, the risks related to errors in these estimates are heightened. Any increased or unexpected costs of 29
35 unanticipated delays or complications in connection with the performance of these engagements, including delays caused by factors outside our control, could make these contracts less profitable or not profitable, which would have an adverse effect on our profit margin. Our exposure to this risk increases generally in proportion to the scope of services provided under a contract. In addition, the success of our technical services business is dependent on our ability to retain our clients. In our electricity networks services line of business in particular, Enersis, from whom we acquired control of the business in 2011 remains a key client; however, we cannot assure you that they will continue to use our services in the future. Also, in our IT services business in particular, we may lose clients due to their conversion to in-house service providers. We are also vulnerable to reduced volumes from our clients due to business downturns or for other reasons, which can reduce the scope and price of services we provide. A contract termination by a major client could cause us to experience a higher than expected number of unassigned employees, which would affect our profitability until we are able to reduce or reallocate our personnel. We may not be able to replace any client that elects to terminate or not renew its contract with us, and the termination or non-renewal of a significant number of our agreements, or of our most important contracts, may adversely affect our business and financial performance. In addition, non-compliance on a contract with a publicsector client may lead to debarment from participating in government bidding processes and, consequently, inability to contract with other public-sector clients, not just for the line of business where the alleged violation took place, but also for all of our other businesses. We may not be successful in obtaining new government contracts We compete to provide services to the Peruvian government, and some of our competitors may have greater financial and other resources or particular expertise pertinent to a specific contract. In addition, we may not be able to obtain additional government service contracts if the government decides not to award additional public-sector road contracts or, to a lesser extent, contracts for the provision of IT and electrical networks services, due to budget constraints, policy changes or otherwise. Our inability to obtain new government contracts may adversely affect our business and financial performance. We face risks related to the delivery of products and services by our suppliers In the course of our IT services and electricity networks services, we depend on technology providers that may commit errors or omissions related to the delivery or the quality of equipment, services or products that are essential to our business. A significant error or failure to deliver such equipment, products or services made by one of our suppliers, particularly in our IT services business where we may have an exclusive arrangement with a specific supplier for a client, may adversely affect our business and financial performance. Our IT security measures may be breached or compromised and we may sustain system outages We rely on encryption, authentication technology and firewalls to provide security for confidential information, including personal data, transmitted to and by us over the internet. A breach of our network security measures could result in the misappropriation of proprietary or personal information or cause interruptions in our IT services or operations, could damage our reputation and harm our ability to deliver services to our clients. This may result in client dissatisfaction and a loss of business. Our security measures may be inadequate to prevent security breaches, and we may be required to expand significant capital and other resources to protect against the threat of security breaches and to alleviate problems caused by breaches as well as by any unplanned unavailability of our IT systems caused by other reasons, which may adversely affect our business and financial performance. Our services may infringe upon the intellectual property rights of others Our IT services, or third-party products we offer our clients, may infringe the intellectual property rights of third parties, and we may have infringement claims asserted against us. These claims may harm our reputation, increase our costs and prevent us from offering certain services or products. Any claims or litigation relating to intellectual property, even if ultimately decided in our favor, could be time-consuming and costly, injure our reputation or require us to enter into royalty or licensing arrangements. Any limitation on our ability to provide a service or product could result in our loss of revenue-generating opportunities and require us to incur additional expenses to develop new or modified solutions for future projects, which may adversely affect our business and financial performance. 30
36 Risks Relating to Peru Economic, social and political developments in Peru could adversely affect our business and financial performance The substantial majority of our operations are conducted in Peru and depend on economic and political developments in the country. As a result, our business may be materially and adversely affected by economic downturns, currency depreciation, inflation, interest rate fluctuation, government policies, regulation, taxation, social instability, political unrest, terrorism and other developments in or affecting the country, over which we have no control. In the past, Peru has experienced periods of severe economic recession, large currency devaluation and high inflation. We cannot assure you that Peru will not experience similar adverse economic developments in the future. In addition, Peru has experienced periods of political instability that has included a succession of regimes with differing economic policies and programs. Previous governments have imposed controls on prices, exchange rates, local and foreign investments and international trade, restricted the ability of companies to dismiss employees, expropriated private-sector assets and prohibited the remittance of profits to foreign investors. We cannot assure you that the Peruvian government will continue to pursue business-friendly and open-market policies that stimulate economic growth and social stability. Fluctuations in the value of the nuevo sol could adversely affect financial performance Fluctuations in the value of the nuevo sol relative to the U.S. dollar could adversely affect Peru s economy. In addition, fluctuations in the value of the nuevo sol to the U.S. dollar can materially adversely affect our results of operations. In 2014, 37.2% and 55.7% of our revenues were denominated in nuevos soles and U.S. dollars, respectively, whereas 70.1% and 23.1% of our costs of sales were denominated in nuevos soles and U.S. dollars, respectively. In the past the exchange rate between the nuevo sol and the U.S. dollar has fluctuated significantly. We cannot assure you that the value of nuevo sol against other currencies will not fluctuate significantly in the future, which could adversely affect the Peruvian economy and our business, financial condition and results of operations. In addition, although Peruvian law currently imposes no restrictions on the ability to convert nuevos soles to foreign currency and transfer foreign currency outside of the country, in the 1980s and early 1990s, Peru imposed exchange controls, including controls affecting the remittance of dividends to foreign investors. We cannot assure you that exchange controls in Peru will not be implemented in the future. The imposition of exchange controls could have an adverse effect on the economy and on your ability to receive dividends from us as a holder of ADSs. Inflation could adversely affect our financial performance In the past, Peru has suffered through periods of hyperinflation, which have materially undermined the Peruvian economy and the government s ability to create conditions that support economic growth. A return to a high inflation environment would also undermine Peru s foreign competitiveness, with negative effects on the level of economic activity and employment. As a result of reforms initiated in the 1990s, Peruvian inflation decreased significantly from four-digit inflation during the 1980s. The Peruvian economy experienced annual inflation of 2.1% in 2010, 4.7% in 2011, 2.6% in 2012, 2.9% in 2013 and 3.2% in 2014, as measured by the Peruvian Consumer Price Index (Índice de Precios al Consumidor del Perú). If Peru experiences substantial inflation in the future, our costs of sales and administrative expenses could increase which could affect our operating margins. Inflationary pressures may lead to governmental intervention in the economy, including the introduction of government policies that may adversely affect the overall performance of the Peruvian economy. For example, in response to increased inflation, the Peruvian Central Bank, which sets the Peruvian basic interest rate, may increase or decrease the basic interest rate in an attempt to control inflation or foster economic growth. 31
37 Changes in tax laws may increase our tax burden and, as a result, negatively affect our financial performance The Peruvian congress and government regularly implement changes to tax laws that may increase our tax burden. These changes may include modifications in our tax rates and, on occasions, the enactment of temporary taxes that in some cases have become permanent taxes. Tax reforms related to the Peruvian income tax, value added tax and tax code have recently been approved, but we are unable to estimate the impacts that these reforms may have on business. The effects of any tax reforms that could be proposed in the future and any other changes that result from the enactment of additional reforms have not been, and cannot be, quantified. However, any changes to our tax regime may result in increases in our overall costs and/or our overall compliance costs, which could negatively affect our financial performance. Earthquakes, severe weather and other natural disasters could adversely affect our business and financial performance Peru is located in an area that experiences seismic activity and occasionally is affected by earthquakes. For example, in 2007, an earthquake with a magnitude of 7.9 on the Richter scale struck the central coast of Peru, severally damaging the region south of Lima. Such conditions may result in physical damage to our properties and equipment, closure of one or more of our project sites and infrastructure concessions, inadequate work forces in our markets and temporary disruptions in the supply of construction materials. In addition, Peru has also experienced adverse climate conditions (due to climate change or otherwise) and adverse weather patterns, such as El Niño, an oceanic and atmospheric phenomenon that causes a warming of temperatures in the Pacific Ocean, resulting in heavy rains off the coast of Peru and potentially flooding. Poor weather conditions can have significant adverse effects on our engineering and construction activities as well as on our operation and maintenance of infrastructure assets business. Any of these factors may materially adversely affect the Peruvian economy and our business and financial performance. A resurgence of terrorism in Peru could adversely affect the Peruvian economy and, as a result, our business and results of operations In the past, Peru experienced severe terrorist activity that reached its peak of violence against the government and private sector in the late 1980s and early 1990s. In the mid-1990s, terrorist groups suffered significant defeats, including the arrest of leaders, resulting in considerable limitations in their activities. Despite the suppression of terrorist activity, we cannot assure you that a resurgence of terrorism in Peru will not occur, or that if there is such a resurgence, it will not disrupt the economy of Peru and our business. The Peruvian economy could be affected by adverse economic developments in regional or global markets Financial and securities markets in Peru are influenced, to varying degrees, by economic and market conditions in regional or global markets. Although economic conditions vary from country to country, investors perceptions of events occurring in one country may adversely affect cash flows and securities from issuers in other countries, including Peru. For example, the Peruvian economy was adversely affected by the political and economic events that occurred in several emerging economies in the 1990s, including in Mexico in 1994, the Asian crisis in 1997, the economic crisis in Russia in 1998, the Brazilian currency devaluation in 1999 and the Argentine crisis in 2001, which affected the market value of securities issued by companies from markets throughout Latin America. In addition, Peru s economy continues to be affected by events in the economies of its major regional partners and in developed economies that are trading partners or that affect the global economy. The global economic recession, principally driven by the subprime mortgage market in the United States, substantially affected the international financial system, including Peru s securities market and economy. Additionally, economic concerns in Europe, slower growth in China and declines in global commodity, in particular oil and gas, prices may reduce the confidence of foreign investors, which may cause volatility in the securities markets and affect the ability of companies to obtain financing globally. The worsening of current global conditions or a new economic or financial crisis could affect Peru s economy, and, consequently, materially adversely affect our business and financial performance. 32
38 Risks relating to Chile, Colombia and other Latin American Countries We face risks relating to our operations outside of Peru Latin American economic, political and social conditions may adversely affect our business. Our financial performance may be significantly affected not only by general economic, political and social conditions in Peru but also in other markets where we operate or intend to operate, including Chile and Colombia. These countries have suffered significant economic, political and social crises in the past, and these events may occur again in the future. We cannot predict whether changes in current administrations will result in changes in governmental policy and whether such changes will affect our business. Instability in the region has been caused by many different factors, including: significant governmental influence over local economies; substantial fluctuations in economic growth; high levels of inflation; changes in currency values; exchange controls or restrictions on expatriation of earnings; high domestic interest rates; wage and price controls; changes in governmental economic or tax policies, including retroactive changes; imposition of trade barriers, including import duties on information technology equipment; electricity rationing; liquidity of domestic capital and lending markets; unexpected changes in regulation; expropriations; and high levels of organized crime, terrorism and social conflicts, as well as overall political, social and economic instability. More recently, tax and other governmental reforms in Chile have led to concerns about potential negative effects on the Chilean economy, and the decline in global oil prices has also led to concerns about potential negative effects on the Colombian economy. Risks Relating to our ADSs The market price of our ADSs may fluctuate significantly, and you could lose all or part of your investment Volatility in the market price of our ADSs may prevent you from being able to sell your ADSs at or above the price you paid for them. The market price and liquidity of the market for our ADSs may be significantly affected by numerous factors, some of which are beyond our control and may not be directly related to our operating performance. These factors include, among others: actual or anticipated changes in our results of operations, quarterly fluctuations, or failure to meet expectations of financial market analysts and investors; investor perceptions of our prospects or our industries; operating performance of companies comparable to us and increased competition in our industries; new laws or regulations or new interpretations of laws and regulations applicable to our business; general economic trends in Peru; catastrophic events, such as earthquakes and other natural disasters; and developments and perceptions of risks in Peru and in other countries. Substantial sales of ADSs or common shares could cause the price of our ADSs or common shares to decrease Significant shareholders hold a large number of our common shares. These securities are eligible for sale. The market price of our ADSs could decline significantly if we or our significant shareholders sell securities in our company or the market perceives that we or our significant shareholders intend to do so. We may raise additional capital in the future through the issuance of equity securities, which may result in dilution of the interests of our shareholders We may need to raise additional capital and may opt for obtaining such capital through the public or private placement of debt securities or securities convertible into our common shares. In the event of a public or private debt financing, or the financing through the issuance of securities convertible into our common shares, such additional funds may be obtained with the exclusion of the preemptive rights of our shareholders, including the investors in our common shares, which may dilute the percentage interests of investors in our common shares. No shareholder or group of shareholders holds a majority of our common shares Our directors and senior management, directly and indirectly, own approximately 32.17% of our common shares as of December 31, 2014, and our Chairman owns, directly and indirectly, 17.81% of our common shares. No shareholder or group of shareholders currently owns a majority of our common shares. In addition, there is no 33
39 shareholders agreement among any of our significant shareholders. Accordingly, no shareholder or group of shareholders may on its own determine the outcome of substantially all matters submitted for a vote to our shareholders. In addition, a new investor or group of investors may in the future seek to acquire a significant stake in, or control of, our company, subject to compliance with Peruvian tender offer requirements which require that a tender offer be made to all shareholders upon, among other matters, acquisition of 25%, 50% and 60% of our voting rights. If a new investor or group of investors acquires a significant stake in, or control of, our company, we cannot assure you that such investor or group of investors will not seek to change how our business is managed. Holders of ADSs may be unable to exercise voting rights with respect to our common shares underlying the ADSs at our shareholders meetings As a holder of ADSs representing common shares being held by the depositary in your name, you may exercise voting rights with respect to the common shares represented by the ADSs only in accordance with the deposit agreement relating to the ADSs. Holders of our common shares will receive notice of shareholders meetings through publication of a notice twenty-five days in advance, in accordance with Peruvian law, in the official gazette in Peru, a Peruvian newspaper of general circulation and the website of the Peruvian Securities Commission, and will be able to exercise their voting rights by either attending the meeting in person or voting by proxy. ADS holders will not receive notice directly from us. Instead, pursuant to the deposit agreement, we will notify the depositary, who will mail to holders of ADSs the notice of the meeting and a statement as to the manner in which voting instructions may be given. To exercise their voting rights, ADS holders must instruct the depositary how to exercise the voting rights for the common shares which underlie their ADSs. Due to these additional procedural steps involving the depositary, the process for exercising voting rights may take longer for ADS holders than for holders of our common shares. Holders of ADSs also may not receive voting materials in time to instruct the depositary to vote the common shares underlying their ADSs. In addition, the depositary and its agents are not responsible for failing to carry out voting instructions of the holders of ADS or for the manner of carrying out such instructions, unless such failure can be attribute to gross negligence, bad faith or willful misconduct on the part of the depositary or its agents. Accordingly, holders of ADSs may not be able to exercise voting rights, and they will have little, if any, recourse if the underlying common shares are not voted as requested. Our shareholders ability to receive cash dividends may be limited Our shareholders ability to receive cash dividends may be limited by the ability of the depositary to convert cash dividends paid in nuevos soles into U.S. dollars. Under the terms of our deposit agreement with the depositary for the ADSs, the depositary will convert any cash dividend or other cash distribution we pay on the common shares underlying the ADSs into U.S. dollars, if it can do so on a reasonable basis and can transfer the U.S. dollars to the United States. If this conversion is not possible or if any government approval is needed and cannot be obtained, the deposit agreement allows the depositary to distribute the foreign currency only to those ADR holders to whom it is possible to do so. If the exchange rate fluctuates significantly during a time when the depositary cannot convert the foreign currency, you may lose some or all of the value of the dividend distribution. Holders of ADSs may be unable to exercise preemptive or accretion rights with respect to the common shares underlying their ADSs Under Peruvian corporate law, if we issue new common shares as part of a capital increase, unless otherwise agreed to by holders of 40% of our subscribed voting common shares and, provided that such capital increase does not favor, directly or indirectly, certain shareholders to the detriment of others, our shareholders will generally have the right to subscribe to a proportional number of common shares of the class held by them to maintain their existing ownership percentage, which is known as preemptive rights. In addition, shareholders are entitled to the right to subscribe for the unsubscribed common shares at the end of a preemptive rights offering, on a pro rata basis, which is known as accretion rights. You may not be able to exercise the preemptive or accretion rights relating to common shares underlying your ADSs unless a registration statement under the Securities Act is effective with respect to those rights or an exemption from the registration requirements of the Securities Act is available. We are not obligated to file a registration statement with respect to the common shares relating to these preemptive and accretion rights, and we cannot assure you that we will file any such registration statement. Unless 34
40 we file a registration statement or an exemption from registration is available, you may receive only the net proceeds from the sale of your preemptive and accretion rights by the depositary or, if the preemptive and accretion rights cannot be sold, they will be allowed to lapse. As a result, U.S. holders of our ADSs may suffer dilution of their interest in our company upon future capital increases. We are entitled to amend the deposit agreement and to change the rights of ADS holders under the terms of such agreement, without the prior consent of the ADS holders We are entitled to amend the deposit agreement and to change the rights of the ADS holders under the terms of such agreement, without the prior consent of the ADS holders. Any change related to an increase in deposits or charges for book-entry securities services or any modification that might hinder the rights of the ADS holders will be effective within 30 days after the ADS holders have received notice of such change or modification and such holders will have no right to any compensation whatsoever. If we are unable to maintain effective internal control over financial reporting in the future, our results of operations and the price of our ADSs could be adversely affected Beginning in 2014 we undertook a formal assessment of our internal controls over financial reporting in compliance with Section 404 of the U.S. Sarbanes Oxley Act of Any failure to maintain controls, or implement required new or improved controls, could harm our operating results or cause us to fail to meet our reporting obligations. If, in subsequent years, we are unable to conclude that we have effective internal control over financial reporting, or if our independent registered public accounting firm is unable to provide us with an unqualified opinion regarding the effectiveness of our internal control over financial reporting as required by Section 404, investors could lose confidence in the reliability of our consolidated financial statements, which could result in a decrease in the value of our ADSs. As a result of errors we found in our consolidated statement of cash flow for the year ended December 31, 2012, we identified a material weakness in our internal control over financial reporting and restated our consolidated statement of cash flow. These errors did not have any effect on the net increase (decrease) in cash for the year ended December 31, Furthermore, all underlying transactions were properly recorded in the 2012 statement of financial position, income statement, statement of comprehensive income and statement of changes in shareholders equity, which did not need to be revised or restated. A material weakness is a deficiency, or combination of deficiencies, in internal controls such that there is a reasonable possibility that a material misstatement in financial statements will not be prevented or detected in a timely basis. We implemented certain measures to address this material weakness, including: enhancing the IFRS knowledge base of our accounting personnel through additional training; additional training for our accounting personnel specifically in the preparation of cash flow statements and completing the implementation of Hyperion, an automated consolidation system. We may in the future discover other areas of our internal controls that need improvement, particularly with respect to businesses that we acquire. Peru has different corporate disclosure and accounting standards than those you may be familiar with in the United States Financial reporting and securities disclosure requirements in Peru differ in certain significant respects from those required in the United States. There are also material differences among IFRS, Peruvian GAAP and U.S. GAAP. Accordingly, the information about us available to you will not be the same as the information available to holders of shares issued by a U.S. company. In addition, the Peruvian Securities Market Law, which governs open or publicly listed companies, such as us, imposes disclosure requirements that are more limited than those in the U.S. in certain important respects. Although Peruvian law imposes restrictions on insider trading and price manipulation, applicable Peruvian laws are different from those in the United States, and the Peruvian securities markets are not as highly regulated and supervised as the U.S. securities markets. 35
41 Our status as a foreign private issuer allows us to follow alternate standards to the corporate governance standards of the New York Stock Exchange, which may limit the protections afforded to investors We are a foreign private issuer within the meaning of the New York Stock Exchange corporate governance standards. Under New York Stock Exchange rules, a foreign private issuer may elect to comply with the practices of its home country and not to comply with certain corporate governance requirements applicable to U.S. companies with securities listed on the exchange. We currently follow certain Peruvian practices concerning corporate governance and intend to continue to do so. Accordingly, holders of our ADSs will not have the same protections afforded to shareholders of companies that are subject to all New York Stock Exchange corporate governance requirements. For example, the New York Stock Exchange listing standards provide that the board of directors of a U.S. listed company must have a majority of independent directors at the time the company ceases to be a controlled company. Under Peruvian corporate governance practices, a Peruvian company is not required to have a majority of independent members on its board of directors. The listing standards for the New York Stock Exchange also require that U.S. listed companies, at the time they cease to be controlled companies, have a nominating/corporate governance committee and a compensation committee (in addition to an audit committee). Each of these committees must consist solely of independent directors and must have a written charter that addresses certain matters specified in the listing standards. Under Peruvian law, a Peruvian company may, but is not required to, form special governance committees, which may be composed partially or entirely of non-independent directors. In addition, New York Stock Exchange rules require the independent non-executive directors of U.S. listed companies to meet on a regular basis without management being present. There is no similar requirement under Peruvian law. The New York Stock Exchange s listing standards also require U.S. listed companies to adopt and disclose corporate governance guidelines. In July 2002, the Peruvian Securities Commission and a committee comprised of regulatory agencies and associations prepared and published a list of suggested non-mandatory corporate governance guidelines called the Principles of Good Governance for Peruvian Companies. Although we have implemented these measures, we are not legally required to comply with the corporate governance guidelines, only disclose whether or not we are in compliance. Minority shareholders in Peru are not afforded equivalent protections as minority shareholders in other jurisdictions and investors may face difficulties in commencing judicial and arbitration proceedings against our company or the controlling shareholder Our company is organized and existing under the laws of Peru. Accordingly, investors may face difficulties in serving process on our company, our officers and directors or our significant shareholders in the United States of certain other jurisdictions, and in enforcing decisions granted by courts located in other jurisdictions against our company, our officers and directors or our significant shareholders that are based on securities laws of jurisdictions other than Peru. In Peru, there are no proceedings to file class action suits or shareholder derivative actions with respect to issues arising between minority shareholders and an issuer, its controlling shareholders or directors and officers. Furthermore, the procedural requirements to file actions by shareholders differ from those of other jurisdictions, such as in the United States. As a result, it may be more difficult for our minority shareholders to enforce their rights against us, our directors, officers or significant shareholders as compared to the shareholders of a U.S. company. The deposit agreement provides that the depositary has no obligation to commence or become involved in any judicial proceedings and any other legal actions relating to the ADSs or the deposit agreement, either on behalf of the ADS holders or on behalf of any other person. Judgments of Peruvian courts with respect to our common shares will be payable only in nuevos soles If proceedings are brought in the courts of Peru seeking to enforce our obligations in respect of the common shares, we will not be required to discharge our obligations in a currency other than nuevos soles. Under Peruvian exchange control limitations, an obligation in Peru to pay amounts denominated in a currency other than nuevos soles may be satisfied in Peruvian currency only at the exchange rate, as determined by the Peruvian Central Bank, in effect on the date the judgment is obtained, and such amounts are then adjusted to reflect exchange rate variations through the effective payment date. The then prevailing exchange rate may not afford non-peruvian investors with full compensation for any claim arising out of or related to our obligations under the ADSs. 36
42 If securities or industry analysts publish unfavorable research about our business or if they cease to follow our business, the price and trading volume of the ADSs could decline The trading market for the ADSs will depend, in part, on the research and reports that securities or industry analysts publish about us or our business. If one or more of the analysts who covers us downgrades the ADSs or publishes unfavorable research about our business, the price of the ADSs would likely decline. If one or more of these analysts ceases coverage of our company or fails to publish reports on us regularly, demand for the ADSs could decrease, which could cause the price and trading volume of the ADSs to decline. ITEM 4. INFORMATION ON THE COMPANY A. History and Development of the Company Graña y Montero has been operating in Peru since 1933 and it is listed on the Lima Stock Exchange since 1997 and the New York Stock Exchange since Set forth below are key highlights in our company s history: Graña y Montero traces its origins to its predecessor company GRAMONVEL, founded 81 years ago by, and named after, engineers Alejandro Graña Garland, Carlos Montero Bernales and Carlos Graña Elizalde. We began primarily as a construction company. We expanded our operations internationally in 1943 with our contract to build a Nestle factory in Venezuela. In 1948, we began one of our largest projects since our founding-the construction of the city of Talara for the International Petroleum Company, which was completed in In 1949, GRAMONVEL merged with Morris y Montero to form Graña y Montero Contratistas Generales S.A. (now GyM S.A., our construction subsidiary), expanding its service offerings and increasing its capacity to undertake largescale infrastructure projects. In 1968, José Graña Miró Quesada joined GyM S.A., and eventually became its chief executive officer in 1982, instilling our core corporate values of quality, professionalism, reliability and efficiency. In 1983, we began a diversification strategy by developing complementary lines of business. In 1984, we founded GMP, our oil and gas subsidiary. In 1985, we partnered with Sonda S.A. (a Chilean IT services company) to form GMD, our IT services subsidiary. Beginning in 1987, we founded our real estate development business, currently Viva GyM. In 1996, we reorganized our subsidiaries and founded Graña y Montero, which became the principal shareholder of all our subsidiaries. In 1997, we listed our company on the Lima Stock Exchange. In 1998, the company built Larcomar, a landmark shopping center in Lima that has become a popular tourist destination, which we sold in In 2003, 2006 and 2007, we were awarded the concessions for the construction, operation and maintenance of the Norvial, Canchaque and Survial toll roads, respectively. In 2007, we also developed the first large-scale affordable housing project in Lima, consisting of 3,400 apartment units and located in the district of El Agustino. 37
43 In 2011, Graña y Montero acquired 75.0% of CAM, a leading company in the electricity sector based in Chile, and formerly part of the Latin American power generation and distribution company Enersis. In 2012, we began operating the Lima Metro. In July 2013, we listed our company on the New York Stock Exchange. In 2012 and 2013, Graña y Montero acquired 74.0% and 6.4%, respectively, of Ingeniería y Construcción Vial y Vives S.A. ( Vial y Vives ), an engineering and construction company specializing in the Chilean mining sector. In August 2013, we acquired 86.0% of DSD Construcciones y Montajes S.A. ( DSD Construcciones y Montajes ), a Chilean engineering and construction company specialized in providing services to the energy, oil and gas, cellulose and mining sectors in Chile and Latin America. In July 2014, our subsidiary Vial y Vives merged with DSD Construcciones y Montajes to form Vial y Vives - DSD S.A. ( Vial y Vives - DSD ), with our subsidiary GyM Chile SpA holding a 82.0% interest in Vial y Vives - DSD. In January 2014, we acquired 1.04% of Transportadora de Gas Natural del Peru. With that acquisition, we hold an interest of 1.64% in that company. In March 2014, we acquired control of Coasin Instalaciones Ltda. ( Coasin ) for an amount of US$2.1 million. In September 2014, our subsidiary Norvial issued its first bond program for a maximum amount of S/. 380 million or its equivalent in US dollars. In October 2014, our subsidiary GyM S.A. acquired 13.5% of Stracon GyM. With that acquisition, our subsidiary GyM S.A. holds an interest of 87.6% in Stracon GyM S.A. In December 2014, our subsidiary GyM S.A. acquired 70% of the share capital of Morelco S.A. ( Morelco ), a Colombian engineering and construction company specialized in the oil and gas and other energy sectors. In December 2014, we formalized an agreement with Enagas International, S.L. ( Enagas ) and Canada Pension Plan Investment Board ( CPPIB ) whereby we acquired 51% of Tecgas N.V. ( Tecgas ), the current operator of Transportadora de Gas del Perú and owner of 100% of the shares of Compañía Operadora de Gas del Amazonas ( COGA ). Enagas International, S.L. acquired 30% of Tecgas and CPPIB maintained a 19% participation. Graña y Montero, S.A.A. was incorporated in 1996 and is a publicly-held corporation (sociedad anónima abierta) organized under the laws of Peru. Our principal executive office is located at Avenida Paseo de la República 4667, Lima 34, Peru, and our main telephone number is Our website address is Information contained on, or accessible through, our website is not incorporated in this annual report, and you should not consider any such information part of this annual report. For information on our organizational structure, see Item 4.C. Information on the Company Organizational Structure. For information on our capital expenditures and divestitures, see Item 5.B. Operating and Financial Review and Prospect Liquidity and Capital Resources Capital Expenditures. 38
44 B. Business Overview Overview We are the largest engineering and construction company in Peru as measured by revenues during 2014, and the largest publicly-traded engineering and construction company in Latin America as measured by market capitalization as of December 31, 2014, with strong complementary businesses in infrastructure, real estate and technical services. With more than 80 years of operations, we have a long track record of successfully completing the engineering and construction of many of Peru s landmark private- and public-sector infrastructure projects, such as the Lima International Airport and the Peru LNG gas liquefaction plant, and we believe we have earned a reputation for operational excellence in our markets. We have developed a highly-experienced management team, a talented pool of more than 4,000 engineers and a skilled work force that share our core corporate values of quality, professionalism, reliability and efficiency. As a company listed on the Lima Stock Exchange since 1997 and the New York Stock Exchange since 2013, we also abide by the highest corporate governance standards in Peru. Beginning in the mid-1980s, we leveraged our engineering and construction expertise into complementary lines of business, such as the development, ownership, operation and maintenance of infrastructure assets (including the Lima Metro, Peru s only urban railway system), real estate development, and the provision of technical services primarily to infrastructure-related assets. We believe our business mix creates significant opportunities across our lines of business, generates more stable revenues and earnings on a consolidated basis, and provides additional financial stability to our company. As a result of our performance in Peru, we have been requested by clients to undertake the engineering and construction of large and complex projects outside our home market, such as the Pueblo Viejo gold mine for Barrick Gold in the Dominican Republic. Through the successful execution of those projects, we have developed operational experience in other Latin American countries. We have further expanded our activities in other key markets of the region through the acquisition of businesses with solid positions in those markets. In February 2011, we acquired a controlling interest in Compañía Americana de Multiservicios (CAM), which is headquartered in Chile and provides technical services to power utility companies in Chile, Peru, Colombia and Brazil. In October 2012, we acquired a controlling interest in Vial y Vives, an engineering and construction company specializing in the Chilean mining sector, and in August 2013, we acquired a controlling interest in DSD Construcciones y Montajes, a Chilean engineering and construction company specialized in providing services to the energy, oil and gas, cellulose and mining sectors in Chile and Latin America. In December 2014, we acquired a controlling interest in Morelco, an engineering and construction company specialized in the Colombian oil and gas and other energy sectors. We expect to continue to selectively undertake projects and pursue acquisitions and strategic alliances in Latin America to further expand our company outside Peru, with a particular focus on Chile and Colombia. The tables below show the growth in our backlog, revenues and Adjusted EBITDA from 2010 to Backlog (in millions of S/.) Revenues (in millions of S/.) Adjusted EBITDA (in millions of S/.) (1) Includes US$349 million of backlog from a business we acquired in December During 2014, we generated revenues of S/.7,008.7 million (US$ 2,344.8 million), Adjusted EBITDA of S/ million (US$305.1 million), and net profit of S/ million (US$120.9 million) including net profit attributable to controlling interest of S/ million (US$100.2 million). From 2010 through 2014, our revenues and Adjusted EBITDA grew at a compounded annual growth rate (CAGR) of 29.4% (23.0% excluding acquisitions) and of 12.3% (7.6% excluding acquisitions), respectively. From 2013 through 2014, our revenues and Adjusted EBITDA grew 17.5% (10.6% excluding acquisitions) and 12.3% (7.6% excluding acquisitions), respectively. 39
45 Our Strengths We believe our company s strengths provide us with significant competitive advantages. Our principal strengths include the following: Leader in fast-growing markets We are the largest engineering and construction company in Peru as measured by revenues during 2014, and the largest publicly-traded engineering and construction company in Latin America as measured by market capitalization as of December 31, Peru is undergoing a period of unparalleled development, with over 5.0% average annual real GDP growth between 2009 and 2014 and significant private and public investments in the mining, power, oil and gas, transportation, real estate and other infrastructure sectors. We have completed some of the most complex and large-scale infrastructure projects in the country, and we believe we are an integral part of Peru s ongoing transformation with projects that contribute to the overall economic development of the country. We believe our expertise, reputation, scale and operational capabilities in Peru position us to take advantage of the country s favorable economic conditions and growth opportunities. We believe we are also a significant infrastructure concessionaire in Peru, the largest apartment building developer in Peru, and a leading IT company in Peru. We believe we are well-positioned to leverage our platform in the Peruvian market to continue to grow our business in other countries in Latin America, primarily Chile and Colombia. Throughout our history, we have undertaken complex E&C projects in the region and have recently completed acquisitions in Chile and Colombia. Moreover, we believe we are one of the leading mining E&C companies in Latin America. Long-standing track record and reputation for operational excellence During our more than 80-year history, we have focused on the successful and on-time execution of complex projects, through our deliver before deadline and lean construction initiatives. Our extensive experience has allowed us to gain deep market knowledge and expertise, which help us better serve our clients and manage risks in our contractual arrangements. We believe we have a reputation for operational excellence, and were named among the top ten most admired companies in Peru by PwC in In addition, KPMG ranked us seventh out of 100 companies with the best reputations in Peru in 2012, 2013 and We believe that our track record and the reputation we have earned in our markets are key factors in winning new and repeat business, as well as in partnering with strategic industry players and attracting top talent to our company. Complementary lines of business which generate more stable cash flows and create additional business opportunities across our segments We have expanded our company by developing complementary lines of business, many of which have become leaders in their respective markets. These lines of business create significant business opportunities across our segments, enabling us to capture a greater share of infrastructure spending, and also generate cost synergies. One example is Norvial, a toll-road concession operated within our Infrastructure segment. In addition to managing the concession, we used our E&C segment to design and construct the expansion of the highway and, once constructed, we are now using our Technical Services segment to operate and maintain the highway. In addition to increasing our levels of consolidated activity, many of these lines of business enable us to achieve more stable cash flows through medium and long-term client service contracts and concessions, which counter in part the cyclicality of the engineering and construction business. 40
46 Growth and profitability with strong financial position Our operations have grown over the last several years, with our consolidated revenues and Adjusted EBITDA growing at CAGR of 29.4% (23.0% excluding acquisitions) and 12.3% (7.6% excluding acquisitions) from 2010 to 2014, respectively. We have achieved this growth with low levels of indebtedness, relying mainly on cash flow from operations to fund our growth. As of December 31, 2014, our net debt to Adjusted EBITDA ratio was 1.0x, with net debt of S/.(933.2) million (US$(312.2) million). In 2014, we achieved an Adjusted EBITDA margin (i.e., Adjusted EBITDA as a percentage of revenues) of 13.0%. Robust backlog and significant additional potential projects We have a robust backlog which amounted to US$ million as of December 31, We believe that our backlog, which as of December 31, 2014 represented approximately 1.7x our related 2014 revenues, provides visibility as to our potential for growth in the coming years, although backlog may not always be an accurate indicator of future revenues. See Item 3.D. Key Information Risk Factors Risks Related to our Company Our backlog and our ratio of historical backlog to revenues may not be reliable indicators of future revenues or profit. Moreover, we believe our backlog is strategically targeted to our key end-markets. Approximately, 85.8% of our backlog as of December 31, 2014 is comprised of contracts with the private sector, strategically targeted to our key end-markets, such as mining, infrastructure, power, energy and real estate. In addition to our backlog, we also have significant potential projects in our pipeline. We have already been awarded a concession for the Via Expresa Javier Prado project, for which we are currently in the contract negotiation stage. We are also in the process of obtaining the necessary licenses to begin construction of our Project Espacio (formerly Cuartel San Martín), a large multi-use real estate development. Furthermore, we continuously evaluate bidding on contracts arising from the significant ongoing private and public investments in Latin America. Proven ability to create and grow businesses organically and through acquisitions We have proven our ability to extend our engineering and construction capabilities into complementary lines of business in a diverse range of industries, some of which began as innovative start-ups in response to client needs. For example, in 1984, we created a new IT business division, which grew and evolved through the years to become the second largest IT company in Peru. Additionally, we also have successfully acquired and integrated new businesses. In February 2011, we acquired a controlling interest in CAM, our electricity services business headquartered in Santiago, Chile, and have integrated its operations and personnel into our company, while improving its operational performance. In October 2012, we acquired Vial y Vives, an engineering and construction company specializing in the Chilean mining sector which complements our leading E&C practice in the mining sector. In August 2013, we acquired a controlling interest in DSD Construcciones y Montajes, a Chilean engineering and construction company whose main focus is electromechanical works and assemblies in construction projects related to oil refineries, pulp and paper, power plants and mining plants. More recently, in December 2014 we acquired a controlling interest in Morelco, an engineering and construction company specialized in the Colombian oil and gas and other energy sectors. We believe that our proven ability to create new businesses, develop businesses organically and acquire and successfully integrate new businesses into our platform is a key competitive advantage as we continue to expand our operations in Latin America. Highly experienced management, talented engineers and skilled workforce, with shared core corporate values Our senior management team has an average tenure within our company of approximately 20 years. In March 2014, Euromoney recognized us as the best managed company in Latin America, the first time a Peruvian company has received this recognition, and the best managed company in the construction and cement sectors in Latin America. For the third consecutive year, we were recognized by PWC as one of the ten most admired companies in Peru, with an outstanding ranking in the corporate governance category. Also, we received an award from LatinFinance magazine for being the corporate with the best equity market strategy, as well as the Andean corporate with the best capital markets strategy, as part of the 2014 LatinFinance Best Corporates survey. In addition, for the third year (2014, 2010, 2009) we were granted the Llave de la BVL award by the Lima Stock Exchange for good corporate governance as well as for the liquidity of our shares. We motivate our management through performance-based compensation, which align their interests with those of our shareholders. In addition, through our efforts to attract, train and retain our workforce, we have built a talented team of employees, including more than 4,000 engineers. We also have access to a network of approximately 83,000 manual laborers throughout Peru that can supplement our workforce when required by our construction pipeline. Thanks to our extensive and talented team, we have the capability and scale to undertake large and complex projects in Peru and elsewhere. 41
47 We have been listed on the Lima Stock Exchange since 1997 and the New York Stock Exchange since We abide by the highest corporate governance standards in Peru, and we are one of only 15 companies in Latin America, and one of only three in Peru, that form part of the Company s Circle, which recognizes companies for their high corporate governance standards and is sponsored by the International Finance Corporation (IFC), the Organization for Economic Co-operation and Development (OECD) and the Global Corporate Governance Forum. In addition, we have developed a strong corporate culture based on principles of high-quality, professionalism, reliability and efficiency. We employ rigorous safety standards and procedures and emphasize environmental sustainability and social responsibility. In 2014, our engineering and construction subsidiary GyM had an accident incidence rate of 0.57, calculated over 91,180,467 hours worked. Our Strategies Our vision is to be the most reliable engineering services company in Latin America. Our key strategies to achieve this vision include the following: Be the contractor of choice for large-scale and complex projects in Peru and other key Latin American markets We intend to enhance our position as a contractor of choice for large-scale and complex infrastructure projects in Peru and other key Latin American markets, by (i) utilizing the scale, expertise and market knowledge we have accumulated during our more than 80-year operating history to strengthen and expand our E&C segment; (ii) maintaining and further developing our long-standing client relationships based on our ongoing pursuit of operational excellence; (iii) continuing to strategically partner with global industry leaders, such as Bechtel and Fluor, with complementary capabilities for specific projects that we undertake; and (iv) leveraging our expertise in the mining sector with a view to becoming the premier mining services provider throughout Latin America. Further expand our infrastructure-related businesses to increase activity across our business segments and generate more stable cash flows We plan to continue to expand our infrastructure-related businesses to capitalize on private and public investments in Peru, including in toll roads, airports, ports, railroads, hospitals, water utility companies, and other power and oil and gas infrastructure assets. In addition to providing more recurring and predictable cash flows, our Infrastructure segment generates additional business opportunities for our E&C and Technical Services segments. Maintain highly capitalized balance sheet We seek to maintain a prudent and sustainable capital structure and a strong financial position to allow us to capitalize on additional business opportunities as they arise. We intend to remain financially disciplined by limiting substantially all our debt incurrence to identified projects with repayment sources. Selectively pursue international opportunities, focusing on Chile and Colombia We intend to leverage the capabilities and experience we have in Peru, particularly providing engineering and construction services to the mining, oil and gas and infrastructure end-markets, to continue evaluating and selectively pursuing opportunities in other markets. We expect to focus our efforts primarily on Chile and Colombia, which we believe offer attractive opportunities in these end-markets. We intend to evaluate other international opportunities on a case-by-case basis. Continue fostering our core corporate values throughout the organization We will continue to instill our core corporate values throughout our organization, while also transmitting these values to surrounding communities. We will continue to attract and develop our human capital through various training, mentorship and reward programs in order to maintain our position as the best company in Peru to learn and work in the engineering and construction field. We also seek to promote social welfare by fostering relationships with the communities that surround our areas of operation. In 2012, the Inter-American Federation of the Construction Industry recognized us for our corporate strategy and promotion of citizenship with the Latin American 42

48 Social Responsibility award. In addition, in 2014, KPMG ranked us eleventh among the 100 most responsible companies and with the best corporate governance in Peru. We strive to promote our corporate values to strengthen our organization and improve our performance as well as to have a positive impact on the markets where we operate. Engineering and Construction Our E&C segment has a more than 80-year track record and is the largest player in Peru as measured by revenues during 2014, according to our estimates based on Peru: The Top 10,000 Companies 2013, undertaking a broad range of activities relating to: engineering; civil construction; electromechanic construction; building construction; and contract mining. We provide E&C services for a diverse range of end-markets, focusing on the mining, power, oil and gas, transportation, real estate and other infrastructure sectors. The following chart sets forth our 2014 revenues by end-market E&C Revenues by End-Market We mainly undertake private-sector projects, particularly projects with a high degree of complexity, which enable us to develop innovative and tailor-made solutions to our clients. We provide our clients with an integral service offering by leveraging our various areas of expertise and engaging in virtually all aspects of project execution, thereby capturing a larger share of investment projects. In 1999, we began adopting the lean construction philosophy as a pillar in our design and construction projects. Lean construction aims to create value for customers by better understanding and considering clients needs to improve project design, functionality and cost optimization. Lean construction also provides techniques and tools that significantly reduce construction waste by improving planning reliability, process design, coordination and collaboration. Although we primarily undertake engineering and construction projects in Peru, our clients often ask us to undertake the engineering and construction of large and complex projects in other countries such as Mexico, the Dominican Republic, Bolivia, Panama and Chile. As a result, we have developed extensive experience executing projects throughout Latin America. To further capitalize on our capabilities and expertise, we have decided to expand our activities into other key markets, such as Chile and Colombia, which are benefitting from high levels of investment and are aligned with our areas of strategic focus. In 2014, approximately US$282.7 million of our E&C revenues were derived from international projects outside of Peru. 43

49 The acquisition of Vial y Vives - DSD has solidified our presence in Chile. While we have been undertaking projects in Chile since 1995, such as the construction of the transmission line and crusher of the Caserones mine for SCM Minera Lumina Copiapo, we believe we will benefit from the established and long-lasting presence in the country of both Vial y Vives and DSD Construcciones y Montajes. Moreover, through the acquisition in December 2014 of Morelco, an engineering and construction company focused on the oil and gas and other energy sectors, we established our presence in the Colombian market. Given the prevalence of mining operations in our principal markets Peru and Chile together are estimated to have projected investment flows of approximately US$96 billion between 2013 and 2016, according to the Peruvian Ministry of Energy and Mines, Cochilco, and APOYO Consultoria we have significant expertise with respect to specialized engineering and construction services for the mining sector. As a result, we believe we are one of the leading mining construction companies in Latin America and we leverage this expertise both within our principal markets as well as to selectively undertake complex projects across the region. The table below sets forth selected financial information for our E&C business segment. As of and for the year ended December 31, (in millions of S/., except as indicated) (in millions of US$)(2) Revenues 3, , , ,684.7 Adjusted EBITDA Adjusted EBITDA margin 11.0% 13.4% 9.1% Net profit Net profit attributable to controlling interest Backlog (in millions of US$)(1) 2, , ,835.3 Backlog/revenues ratio(1) 2.1x 2.1x 1.7x (1) For more information on our backlog, see Backlog. Backlog is calculated as of the last day of the applicable year. Revenues are calculated for such year and converted into U.S. dollars based on the exchange rate published by the SBS on December 31 of the corresponding year. (2) Calculated based on an exchange rate of S/ to US$1.00 as of December 31, Principal Engineering and Construction Activities The following chart sets forth our 2014 revenues by E&C activity E&C Revenues by Activities 44
50 Engineering Services Our engineering activities consist of a broad range of services relating to engineering, supervision, geometrics and environmental consultancy, including pre-investment studies, pre-feasibility studies, process design, project development, supervision of executive designs and construction management, including construction site reviews. Civil Construction Our civil construction activities focus on infrastructure projects, including earthworks, the construction of roads, highways, transportation facilities (e.g., mass transit systems such as the Lima Metro), dams, hydroelectric plants, water supply and sewage projects, excavation, structural concrete construction and tunneling. Our civil construction projects are generally large and complex, requiring the use of large construction equipment and sophisticated managerial and engineering techniques. Electromechanic Construction Our electromechanic construction activities include the construction and assembly of concentrator plants, pipelines, transmission lines, gas and oil networks, and substations, predominantly for energy projects and industrial plants. Building Construction Through our building construction activities, we respond to the demands of the Peruvian real estate market with a focus on the construction of hotels, affordable housing projects, residential buildings, office buildings, shopping centers, and industrial plants. Contract Mining Our contract mining activities consist of mine planning, development, construction works, operation (including earthworks, blasting, loading and hauling ore) and mine closure. Major Projects We have played an active role in the development of the infrastructure sector in Peru, as well as other countries in Latin America, including the construction of roads, hotels, hospitals, shopping centers, housing developments, concentrator plants, hydroelectric power plants, thermal power plants and transmission lines as well as water supply and sewage projects, irrigation projects and dam building, among others. Throughout our history, we have participated, on our own or through minority or majority interests in joint operations, in a diverse range of landmark projects, including the following: in 1948, Talara city in northern Peru for the International Petroleum Company, consisting of 2,000 homes, schools, churches, a movie theater and airport; in 1950, a 430 km stretch of the Panamericana Sur highway; in 1952, the Rebagliati hospital, the largest public hospital in Peru; in 1960, the Cañón del Pato hydroelectric power plant, the second largest hydroelectric plant in Peru in terms of installed capacity; in 1961, the Jorge Chavez International Airport, Peru s first international airport, located in Lima; in 1969, the Cuajone mining project, the largest copper mine and smelter complex in the world at that time and, in 1997, the Ilo smelter and refinery for Southern Copper Corporation; 45
51 in 1974, the Sheraton Hotel in Lima, and, in 1995, the Sheraton Hotel in Santiago, Chile; in 1988, the Chavimochic irrigation project, the most significant irrigation project in Peru; in 1992, the Four Seasons Hotel in Mexico City, Mexico; in 1995, the U.S. Embassy in Peru; in 1998, the Mantaro-Socobaya 605 km transmission line, which connected the country s electrical grids; in 2000, the Marriot Hotel in Lima; in 2002, began providing open pit mining services, which are ongoing, to Brocal; in 2004, the Ralco hydroelectric power plant in Chile; in 2004, the gas fractionation plant and, in 2008, its expansion for Consorcio Camisea, Camisea project, the largest energy project in Peru s history; in 2005, the San Cristobal concentrator plant in Bolivia; in 2005, the Cerro Verde mine concentrator plant for Phelps Dodge; in 2008, the Cerro Corona concentrator plant for GoldFields; in 2008, the Parque Agustino real estate development project, the first major affordable housing project in Peru, which consists of 3,400 units; in 2009, the Westin Lima Hotel, currently the tallest building in Peru; in 2010, the Melchorita liquefaction plant for Peru LNG, Camisea project; in 2010, the Bayóvar plant for Vale; in 2010, the Gran Teatro Nacional, the most modern theater in Peru; in 2011, Pueblo Viejo Mine concentrator plant for Barrick Gold Corp. in the Dominican Republic; in 2011, the first stretch of Line One of the Lima Metro for the Peruvian Ministry of Transport and Communications; in 2012, for project manager Bechtel, the Antapaccay copper concentrator developed by Xstrata Copper, the world s fourth largest copper producer; in 2013, expansion of the plant for Cementos Lima, the largest cement producer in Peru; in 2013, the Huanza hydroelectric plant for Compañía de Minas Buenaventura; in 2013, the leaching pad La Quinua for the Yanacocha mine; in 2014, the second stretch of Line One of the Lima Metro for the Peruvian Ministry of Transport and Communications; 46
52 in 2014, construction of a natural gas distribution network for Contugas, providing access to natural gas for five districts south of Lima; in 2014, construction of the Nueva Fuerabamba city, an integral real estate development project for the population surrounding the Las Bambas mining project; in 2014, construction of a concentrator plant for the Toromocho copper mine, developed by Chinalco Mining; and in 2014, construction of a primary crusher for Mina Caserones, developed by Minera Lumina Copiapo, which is expected to have a daily production capacity of 144,230 tonnes. We currently have a diversified portfolio of ongoing projects, on our own or through majority or minority interests in joint operations, in a wide range of sectors in Peru and the other countries where we operate, including the following: construction of a copper concentrator plant for the Las Bambas mining project, managed by Bechtel and developed by Xstrata Copper. Upon its scheduled completion in the third quarter of 2015, the project is expected to have a daily processing capacity of 140,000 tonnes; engineering, procurement and construction of the 510 MW Cerro del Águila S.A hydroelectric plant for IC Power, which is expected to represent approximately 10% of Peru s installed generation capacity. The project, which is scheduled to be completed in the first quarter of 2016 is expected to include the construction of a 75 meter high dam and a 6 km tunnel; construction of a 99.9 MW expansion of the Machu Picchu hydroelectric plant for Egemsa, which is expected to be completed in the second quarter of 2015; engineering, procurement and construction of La Chira, a waste water treatment plant for the city of Lima for which we also have the concession through a joint operation with Acciona Agua. This project, which is scheduled to be completed in the fourth quarter of 2015, is expected to include a 3.5 km submarine pipeline; engineering, procurement and construction of a concentrator plant for the La Inmaculada silver and gold project, developed by Hochschild Mining. This project, which is scheduled to be completed in the third quarter of 2015, is expected to have a daily processing capacity of 3,500 tonnes; construction of access facilities and a tailings dam for the Mina Constancia project, which is scheduled to be completed in 2017 and is being developed by Hudbay Minerals Inc.; design, engineering, procurement and construction of the new stock pile and 10,000 conveyor belts for the Escondida Mine, managed by Bechtel, which is scheduled to be completed in 2016; construction of a tailings dam for the Mina de Cobre Panamá project, developed by First Quantum Minerals. This project, which is scheduled to be completed in 2016, is the second largest foreign investment project in Panama s history, after the Panama Canal; expansion of the process plant for the Cerro Verde mine, one of the biggest concentrator plants in Latin America. This project is scheduled to be completed in the fourth quarter of 2016; construction of the Via Expresa Sur, which includes the construction of a 4.5 Kms extension of an urban road in the city of Lima, as well as the equipment required for the operation of the toll. The road is scheduled to be completed in 2018; 47
53 design and construction of the third phase of the hydraulic works (or irrigation) for Chavimochic project. This infrastructure project will incorporate 63,000 hectares for modern agriculture and will improve the irrigation of 47,000 hectares in northern Peru. This project is scheduled to be completed in 2018; construction and design of a luxury business complex consisting of offices and a shopping mall, with state-of-the-art technology which will make it a smart building. This project is scheduled to be completed in 2018; engineering, procurement and construction of Guyana Goldfields Aurora gold project in Guyana. The scope of works includes a 1.75 Mt/a processing plant, power station and integration management. This project is scheduled to reach commercial production by the end of 2015; construction of civil works for Ñuble de Pasada hydroelectric plant for the client Hidroeléctrica Ñuble SpA (subsidiary of Eléctrica Puntilla S.A.). The project consists of the execution of all the necessary civil works for the proper functioning of the Ñuble hydroelectric plant, including construction of the water intake, abduction canal, discharge piping and machine house. This project is scheduled to be completed in the third quarter of 2015; construction of civil works and electromechanical assembly of the combined cycle power plant in the Kelar combined cycle thermoelectric plant located in Mejillones, Antofagasta Region, Chile. The project consists of performing structural excavations, foundations to insert and close perimeter, as well as the complete assembly, which includes structural, mechanical, piping and electrical assembly, in addition to instrumentation of both gas and steam turbines, as well as of the balance plant (BOP). This project is scheduled to be completed in 2016; and construction of the civil earthworks, pad and waste dump for the Shahuindo Gold Mine located in Cajabamba, province of Cajamarca. This project is scheduled to be completed in Clients We believe we have developed long-term relationships with many clients as a result of our performance over the years and are focused on the successful and on-time execution of complex projects, through our deliver before deadline and lean construction initiatives. Our extensive experience has earned us a reputation for operational excellence and allowed us to gain deep market knowledge and expertise, which help us better serve our clients. The principal clients of our E&C segment include renowned domestic and multinational mining, power, oil and gas, transportation and infrastructure development companies, such as Xstrata, Hochschild, Buenaventura, Luz del Sur, Kallpa, Transelec, Union Andina de Cementos S.A.A., Rio Alto, Chinalco Mining, Minera Lumina Copiapo, Hudbay Minerals, among others. We have a well-diversified client base, as none of our engineering and construction clients accounted for 15% or more of our consolidated revenues in Project Selection and Bidding We win new engineering and construction contracts through public bidding processes or direct negotiation, from a variety of sources, including potential client requests, proposals from existing or former clients, opportunities sought by our commercial team and from requests by the Peruvian government. More than 80% of our 2014 revenues came from private-sector projects. The Peruvian government and its agencies typically award construction contracts through a public bidding process conducted in accordance with the Peruvian State Contracting Law (Ley de Contrataciones del Estado). In the private sector, in addition to obtaining new projects, another important source of revenue involves increases in the scope of work to be performed in connection with already existing projects. These arrangements are typically negotiated directly with the client, often during the course of the work we are already performing for that client. 48
54 We have a designated team that oversees the management of project proposals and a commercial team that reviews and evaluates potential projects in order to estimate costs. In considering whether to bid for a potential project, we principally consider the following factors: competition and the probability of being awarded the project; project size; the client; our experience undertaking similar projects; and the availability of resources, including human resources. As part of the project selection process, our commercial team performs a detailed cost analysis utilizing sophisticated software we developed to assist in determining whether the project is viable and cost-effective. If we choose to pursue a project, a budget leader is assigned to prepare the offer that is eventually presented to our potential client. Despite the budgeting risks generally associated with engineering and construction contracts, our management believes that our experience generally allows us to estimate our project costs accurately. Our project management teams also periodically review project budgets for inconsistencies between budgeted and actual costs in order to recover for cost variations through contract renegotiation. Budgeting risks are also mitigated through advance payments. Considering that we receive advance payments for most of our E&C contracts, our E&C projects typically do not require significant working capital investment. Our E&C segment secures financing primarily to purchase machinery and equipment for our construction and contract mining services. We are required, in the majority of our construction contracts, to provide a performance bond to guarantee project performance and completion, which remain in effect for the contract s duration. We are also required to provide performance bonds to secure any advance payments provided to us by our clients. These bonds are periodically reduced during the project s execution in accordance with project advancement. After the expiration of the contract term, we are typically required to provide an additional performance bond that remains valid for one year. Contracts We principally enter into four types of engineering and construction contracts: Cost-plus fee contracts. The contract price is based upon actual costs incurred for time and materials plus a fee, which may be a percentage of the costs incurred or a pre-determined fee. Sometimes, cost-plus fee contracts include a target price, and a contractual arrangement that determines our responsibility in the event the total cost of the project exceeds the target price or the benefit we receive if the total contract price results in cost savings. Cost-plus fee contracts tend to involve the least budgeting risk for us. Unit price contracts. The contract price is based upon a price per unit (i.e., variable quantities of work priced at defined unit rates). Each line item of the project budget, such as cubic meter of earth excavated or cubic meter of concrete poured, has a defined price, but the quantities of the units may vary. Our bid price reflects our estimate of the costs that we expect to incur for each work unit. These contracts typically include an escalation clause which is essentially an adjustment mechanism to account for Peruvian inflation. Lump-sum contracts. The contract price is fixed. Our bid is meant to cover all costs and include a profit. The principal risk in these types of contracts are errors in calculating our costs, including those of raw materials; miscalculation of the number of units or workers needed to complete the project; unanticipated technical complexities; or other unexpected events or circumstances that may increase our costs. Engineering, procurement and construction (EPC) contracts. EPC contracts, known as single source or turn-key contracts, are also lump-sum contracts. Pursuant to EPC contracts, we provide a broad range of basic and detailed engineering services, including preparation of the technical project specifications, detailed drawings and construction specifications; technical studies; and identification of lists of materials and equipment necessary for the project. These contracts, which we utilize predominantly for our mining contracts, require a high-level of expertise and generally involve the most budgetary risks for us. 49
55 For further information, see Item 5.A. Operating and Financial Review and Prospects Operating Results Results of Operations. Raw Materials The principal inputs we use in our E&C segment are, among others, fuel, cement and steel. These and the other products we require in our E&C segment may be subject to the availability of raw materials, such as oil and iron, and commodity pricing fluctuations, which we monitor on a regular basis. We typically aim to enter into master supply agreements for a period of six months to one year. Although we obtain the majority of our inputs needs in Peru, we believe we have access to numerous global supply sources. The availability of these inputs, however, may vary significantly from year to year due to various factors including client demand, producer capacity, market conditions, transport costs and specific material shortages, and we may incur additional costs in obtaining them. We purchase and lease the equipment we require for our E&C segment business from several local and international suppliers, currently with no significant concentration with any particular suppliers. While we do not have difficulty obtaining the equipment we need, we may face difficulties finding skilled personnel who are able to operate certain equipment and machinery. Competition We generally compete with some of the largest contractors in Peru and the other countries where we operate. Because the E&C sector is highly competitive, the markets served by our business generally require substantial resources and highly-skilled and experienced technical personnel. The principal competitors of our E&C segment include Besalco S.A., Odebrecht S.A., Andrade Gutierrez S.A., Obrascón Huarte Lain S.A., JJC Contratistas Generales S.A., Cosapi S.A., Techint SAC, SSK Montajes e Instalaciones S.A.C., Skanska del Perú S.A., Mota-Engil Peru S.A., Grupo San Jose, Salfacorp S.A., Constructores Interamericanos S.A.C. (COINSA), and San Martín Contratistas Generales. For certain projects, due to the size of the project, expertise required and other factors, we may choose to partner with our competitors, including the aforementioned companies. Competition for our E&C segment is driven by performance, skill and project execution capabilities for completing complex projects in a safe, timely and cost-efficient manner, as well as price. Infrastructure We are an important toll road concessionaire in Peru, operating three toll roads. Moreover, we are the concessionaire for the Lima Metro, the largest mass-transit rail system in Peru, and a waste water treatment plant. Additionally, we operate multiple fuel storage facilities, two producing oil fields under long-term government contracts and a gas processing plant. The table below sets forth selected financial information for our Infrastructure business segment. As of and for the year ended December 31, (in millions of S/., except as indicated) (in millions of US$)(2) Revenues Adjusted EBITDA Adjusted EBITDA margin 40.5% 35.9% 34.9% Net profit Net profit attributable to controlling interest Backlog (in millions of US$)(1) Backlog/revenues ratio(1) 7.0x 3.4x 2.7x (1) For more information on our backlog, see Backlog. Does not include our Norvial toll road concession, our Energy line of business and our jointly controlled COGA venture. Backlog is calculated as of the last day of the applicable year. Revenues are calculated for such year and converted into U.S. dollars based on the exchange rate published by the SBS on December 31 of the corresponding year. Includes revenues only for businesses included in backlog. (2) Calculated based on an exchange rate of S/ to US$1.00 as of December 31,
56 Our strategy is to pursue concessions with the potential to generate business opportunities across our organization. Once we obtain a concession, our goal is to be involved virtually in all aspects of project execution through the participation of our different business segments, from the design and construction to the operation and maintenance of the infrastructure asset. Through our Infrastructure segment we participate in a number of joint operations with the objective of bidding for government concessions or other long-term contracts. When bidding, we occasionally look for partners to reduce our risks and achieve the level of expertise needed to meet the demands of each particular project The following table shows selected information about our current concessions and long-term contracts as of December 31, Project Year Granted Initiated Operations Expiration Characteristics % Owned by Us Status Toll Roads: Norvial km 67.0% Operating Survial km 99.9% Operating Canchaque km 99.9% Operating 2018 (expected) km 100.0% Under construction Via Expresa Sur 2013 Mass Transit: Lima Metro km 75.0% Operating Water Treatment: December 2015 (expected) 2037 Avg. treatment capacity of Under La Chira m3/sec (expected) 50.0% construction thousand hectares to Under Chavimochic 2013 (expected) 2038 irrigate 26.5% construction Energy(1): Avg. daily production of Oil Production Block I ,460 bbl (2013) 100% Operating Avg. daily production of Block V bbl (2013) 100% Operating Avg. daily processing Gas Processing(2) N/A capacity of 84 MMcf 100% Operating Aggregate storage capacity North and Central Fuel Terminals of 2.2 MMbbl 50.0% Operating August Aggregate storage capacity South Fuel Terminals (3) of 1.4 MMbbl 50.0% Operating COGA ,430km of gas pipelines 51.0% Operating (1) Percentages owned in Energy reflect GMP s ownership. We own 95% of GMP. (2) We own a gas processing plant and have a long-term delivery and gas processing contract with EEPSA. (3) Bidding for the South Fuel Storage Terminal is scheduled to commence in May * This table does not include awarded concessions or contracts for Trujillo, Blocks III and IV and Via Expresa Javier Prado. On November 11, 2013, we entered into a memorandum of understanding with Canada Pension Plan Investment Board ( CPPIB ), to create an alliance regarding a partnership to invest in infrastructure projects in Latin America, mainly Peru, Chile and Colombia. This alliance is non-exclusive and investments will be determined on a case-by-case basis. In December 2014, we undertook our first large investment with CPPIB, by formalizing an agreement with Enagas and CPPIB whereby we acquired 51% of Tecgas, the current operator of TGP and owner of 100% of the shares of COGA, while Enagas acquired 30% and CPPIB maintained 19% of the participation. COGA is dedicated to the management, operation, maintenance, and integrity management of transport and distribution hydrocarbon pipelines and installations as well as industrial plants and ancillary installations. COGA operates and maintains more than 1,430km of pipelines, one compression plant with 72,000 horse power and four pump stations with 19,200 horse power each. COGA operates two pipelines: one which is 730 km and transports natural gas (GN) 51

57 with a 1,275 MM cubic feet per day capacity; and the other one which is 530 km and transports natural gas liquids (NGL) with a 130,000 barrels per day capacity. Both pipelines run from Cusco to Ayacucho and Huancavelica, with the GN pipeline extending to Lurin and the NGL pipeline continuing to the Pisco fractionation plant. Principal Infrastructure Lines of Business Toll Roads Peru s economic development is underpinned by a strong government commitment to infrastructure investment, with a particular focus on improving the country s road system through the award of new concessions to the private sector. The Peruvian Ministry of Transports and Comunications has forecasted a total investment of up to US$ 17.7 billion in transport infrastructure projects for We believe this investment offers significant opportunities to our Infrastructure segment. Our Infrastructure segment currently has three toll road concessions through our subsidiaries Norvial, Survial and Canchaque. All three toll roads are currently in operation and we have the authorizations, permits and licenses necessary to fulfill our obligations under each concession, including releases of rights of way. All of our toll road concessions have utilized the construction services of our E&C segment and the roads are currently operated and maintained by our Technical Services segment. The table below sets forth selected financial information relating to our toll roads. Year ended December 31, (in millions of S/.) (in millions of US$)(1) Revenues Adjusted EBITDA Adjusted EBITDA margin 58.0% 36.1% 24.5% (1) Calculated based on an exchange rate of S/ to US$1.00 as of December 31, The pie charts below set forth the breakdown of our revenues and Adjusted EBITDA from our toll road concessions for Norvial 52

58 Under our Norvial concession, we operate and maintain part of the only major highway that connects Lima to the northwest of Peru. This 183-km road, known as Red Vial 5, runs from the cities of Ancón to Pativilca and has three toll stations. The concession was awarded to Norvial in 2003 for a 25-year term. We own 67% of Norvial; and our partner in this concession is JJC Contratistas Generales. The following map shows the location of the Red Vial 5 road in Peru. Norvial s revenue derives from the collection of tolls. For the Norvial toll road, the toll rate is set out in the Norvial concession agreement and adjusted in accordance with a contractual formula that takes into account the nuevo sol/u.s. dollar exchange rate and Peruvian and U.S. inflation. We are required to transfer 5.5% of our monthly toll revenue to the Peruvian Ministry of Transport and Communications and pay a 1% regulatory fee to the Peruvian Supervisory Agency for Investment in Public Transportation Infrastructure. Our obligations under the concession include expanding the already existing road by, among other things, adding two additional lanes. The first stage of construction was completed in 2008, and the second stage commenced in the second quarter of 2014 and is expected to be completed in the second quarter of We estimate that our capital investment for the second stage will be approximately US$105 million. When the construction of the second stage begins, we will also be required to pay a one-time estimated fee of approximately US$1.8 million to the Peruvian Supervisory Agency for Investment in Public Transportation Infrastructure. Unlike other toll roads in Peru, Norvial charges toll fees in both directions. Our road is highly transited both by heavy vehicles, primarily for the purpose of transporting goods, and also by passenger vehicles, which typically use the road to access tourist destinations. The following table sets forth average daily traffic volume and average toll fees charged for vehicle equivalents in respect to the Norvial toll road concession for 2012, 2013 and Year ended December 31, Average daily traffic by vehicle equivalents(1) 17,847 19,002 19,750 Average toll fee charged for vehicle equivalents (in S/.)

59 (1) Each automobile is counted as one equivalent vehicle and commercial vehicles (such as trucks or buses) represent the number of equivalent vehicles equal to the ratio between the toll rate applicable to commercial vehicles and that which is applicable to one automobile. The table below sets forth selected financial information relating to Norvial. Year ended December 31, (in millions of S/.) (in millions of US$)(1) Revenues Adjusted EBITDA Adjusted EBITDA margin 77.9% 64.6% 35.0% Net profit (1) Calculated based on an exchange rate of S/ to US$1.00 as of December 31, Survial Under our Survial concession, we operate and maintain a 750 km road from the San Juan de Marcona port to Urcos, Peru, which is connected to an interoceanic road that runs up to the Peruvian-Brazilian border. The road has five toll stations and three weigh stations. The concession was awarded to Survial in 2007 for a 25-year term. We own 99.9% of Survial. The following map shows the location of the road in Peru. Our obligations under the concession include the construction of the road, which was completed in Our revenue from this concession consists of an annual fee paid to Survial by the Peruvian Ministry of Transport and Communications in consideration for the operation and maintenance of the road, which fee can vary depending on the amount of maintenance required due to road damages. In 2012, 2013 and 2014, the fee amounted 54
60 to US$37.5 million, US$20.7 million and US$8.9 million, respectively. Our revenue in this concession does not depend on traffic volume. Additionally, we had a one-time income in 2013 for catastrophic events relating to heavy rains that impacted the highway in prior years, which amounted to US$15.8 million. Canchaque Under our Canchaque concession, we operate and maintain a 78 km road from the towns of Buenos Aires to Canchaque, in Peru. The road has one toll station. The concession was awarded to Canchaque in 2006 for a 15- year term. We own 99.9% of Canchaque. Our obligations under the concession include the construction of the road, which was completed in Our revenue from this concession consists of an annual fee paid by the Peruvian Ministry of Transport and Communications in consideration for the operation and maintenance of the road, which fee can vary depending on the amount of road maintenance required due to road wear and tear. In 2012, 2013 and 2014, the fee amounted to US$1.7 million, US$1.8 million and US$1.4 million, respectively. Our revenue in this concession does not depend on traffic volume. Additional Toll Road Projects We continuously evaluate infrastructure projects and strategically present public-private partnership proposals and participate in bidding processes for road concessions. In 2012 we were awarded, and in 2013 we signed the contract for, a 40-year concession for a 4.6 km extension of Via Expresa Sur, one of the main roads in Lima, which crosses the city from north to south. The road will connect downtown Lima to Panamericana Sur, a highway that runs from Ecuador to Chile. Our estimate of the total investment under the concession, as submitted in our bid, is of approximately US$200 million. Such investment will be made during the construction phase, which is expected to be completed in Our revenue will derive from the collection of a toll fee upon completion of the construction. The concession is expected to guarantee a minimum annual revenue of US$18 million during the first two years of the concession term and US$19.6 million for the third year and for an additional period, the term of which is being negotiated. If in a particular year, our annual revenue is lower than the minimum guaranteed, we expect the government to compensate us for the difference, up to an amount not to exceed US$10 million. Completion of the project is subject to expropriation of the land necessary for the construction of the road. A joint operation in which we have a 50% interest has been awarded, and is in the process of negotiating the terms for, a 37- year concession for Via Expresa Javier Prado, a 20 km toll road that crosses Lima from east to west, traversing through eight districts. A project contract was approved by the City of Lima s Council in November 2013 and was submitted to the Peruvian Ministry of Economy and Finance, which requested additional studies prior to approving the project. Such studies are currently being prepared. We cannot assure you that the Ministry will approve the contract under the current terms or at all. According to estimates from the Municipality of Lima, the total investment in the concession is expected to amount to approximately US$790 million. Such investment will be made during the construction phase which is expected to take between five to seven years. Our revenue will derive from the collection of a toll fee upon completion of the construction. This concession was awarded to the joint operation at the end of the 1990s and negotiations were discontinued but were resumed in We cannot assure you if or when the concession contract will be agreed or whether the contractual terms will be favorable to us. See Item 3.D. Key Information Risk Factors Risks Related to our Infrastructure Business. Mass Transit Lima Metro In 2011, we were awarded a 30-year concession for the operation of Line One of the Lima Metro, Peru s only urban railway system. The concession was awarded to our subsidiary GyM Ferrovías, in which we hold a 75% ownership interest, with the other 25% being held by Ferrovías S.A.C. Our obligations under the contract include: (i) the operation and maintenance of the five trains provided by the government; (ii) the acquisition of 19 new trains on behalf of the Peruvian government, which will be the legal owner of such trains; (iii) the operation and maintenance of the 19 new trains (24 trains in the aggregate); and (iv) the design and construction of the railway maintenance and repair yard, which was built by our E&C segment. We currently have all 24 trains (including two backup trains) in operation. The construction of the second stretch of Line One was completed in July 2014, and started operations on July 25th of

61 The construction of the first and second stretches of Line One was carried out by our Engineering and Construction segment. The operation and maintenance of the trains is carried out by our Technical Services segment. The map below shows the route of Line One. As of December 31, 2014, GyM Ferrovías had spent a total of S/ million (US$196.6 million) in capital expenditures in connection with the Lima Metro. Our revenue from this concession consists of a quarterly fee that we receive from the Ministry of Transport and Communications based on the kilometers travelled per train and adjusted for inflation, with the fee per kilometer, the number of trains required to be in operation and the number of kilometers that we are required to travel established by the terms of the concession. Our revenues do not depend on passenger traffic volume. We currently operate 24 trains (including two backup trains) on the first and second stretches which enable us to travel 2,603,453 kms per year based on required schedule and frequency. The full Line One consists of 33.1 kilometers. The average frequency of the trains is 6 to 10 minutes and the fee per kilometer travelled is S./ Pursuant to the concession, we must comply with certain requirements in the operation of the trains. According to the concession, at least 95% of our trains must be running and available for use and not less than 85% of our trains that are available for use must arrive to destination on scheduled time. The table below shows our monthly average results during
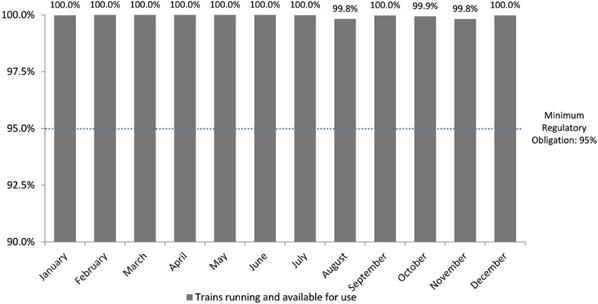
62 57
63 Trujillo Urban Transportation In October 2014, our subsidiary GMD S.A. was awarded a concession for the electronic collection of public transportation fares in the city of Trujillo in northern Peru for a period of twenty years. The concession includes equipping buses with communication systems, GPS, video and fare collection systems; managing a bus fleet control center (for speed, punctuality, and observance of the routes); installing card sale and charge points; and conducting inspections onboard buses. The estimated initial investment for the first three years is US$22 million. Nonetheless, we have committed to renew the equipment upon its wear down due to common use. Such technological renovation is estimated at US$ 18 million, which will be paid over the following eight years. The signing of the contract, which we are currently negotiating, is expected to take place in August Water Treatment In 2012, we were awarded a 25-year concession for the construction, operation and maintenance of La Chira waste water treatment plant in the south of Lima. The project is aimed at addressing Lima s environmental problems caused by sewage discharged directly into the sea. We hold a 50% share in this project and our partner Acciona Agua holds the remaining 50%. The plant is expected to be operational in December We estimate that La Chira s total investment in the concession will amount to approximately US$83.1 million. Once the project is completed, La Chira will be entitled to collect (i) an annual payment for the investment made in the construction of the project for an amount of S/.24.2 million (approximately US$9.3 million), and (ii) and annual payment for the operation and maintenance of the project for an amount of S/.6.8 million. These fees will be paid by Sedapal S.A., the public utility company responsible for the supervision of the water service in Lima, for a period of 25 years. We funded our construction costs related to La Chira through the sale of government certificates to financial institutions, and, as a result, will not receive future cash flows from item (i). See Item 5.A. Operating and Financial Review and Prospects Operating Results Factors Affecting Our Results of Operations Infrastructure. A joint operation in which our E&C segment participates is undertaking the construction of the waste water treatment plant. Energy We currently operate three energy businesses within our Infrastructure segment. We have two long-term hydrocarbon extraction service contracts with Perupetro, the Peruvian entity responsible for the administration and supervision of all exploration and production contracts in Peru, under which we operate two onshore oil producing fields in northern Peru. Aggregate average production of these fields in 2014 was of approximately 1,754 bbl per day. We also own and operate a gas processing plant which processes and fractions natural gas from its liquids in northern Peru and delivers dry gas to a gas-fired power generation company under a long-term processing and fractionation agreement. In addition, we are a 50% partner in Consorcio Terminales and Terminales del Peru both of which have contracts with Petroperú, the other state owned oil and gas company, to operate fuel storage terminals. The table below sets forth selected financial information relating to our Energy line of business. Year ended December 31, (in millions of S/.) (in millions of US$)(1) Revenues Adjusted EBITDA Adjusted EBITDA margin 47.5% 41.4% 46.2% Net profit (1) Calculated based on an exchange rate of S/ to US$1.00 as of December 31,
 located in the province of Talara in northern Peru.")
64 2014. The pie charts below set forth the breakdown of our revenues and Adjusted EBITDA from our Energy line of business for Revenues ADJUSTED EBITDA Oil and Gas Production Block I and Block V We operate and extract oil from two fields (Block I and Block V) located in the province of Talara in northern Peru. Both fields are operated under long-term service contracts in which we provide hydrocarbon extraction services to Perupetro. Hydrocarbons extracted from each field belong to Perupetro, which in turn pays us a variable fee per barrel of lifted hydrocarbons, which fee is based on a basket of international crude prices and the level of production. The fee is paid on a monthly basis. Our activities are focused on proved reserves development and production and are conducted in mature oil fields, which have been producing oil for over 100 years in the case of Block I and over 50 years in the case of Block V. We believe our activities in these fields bear limited exploration risk. The following table shows selected information about our fields. Property Basin GMP s Ownership Expiration Developed Acres Undeveloped Acres Block I Talara 100% ,154 4,110 Block V Talara 100% ,320 2,220 Block I: We operate and extract oil and natural gas from Block I under a 20-year hydrocarbon extraction service contract with Perupetro, which was extended for an additional 10-year term and expires in December Average daily production during 2014 was 1,623 barrels of crude oil. We operate 208 wells using various oil extraction systems and operate a network of production batteries and pipelines to collect, measure and deliver oil in fiscalization point close to the Talara refinery. The field is located in the province of Talara, department of Piura, in northern Peru, approximately five miles from the Talara refinery, the second largest refinery in the country. Block I is the oldest oil producing field in Peru and has been producing oil since around Block V: We operate and extract oil and natural gas from Block V under a 20-year hydrocarbon extraction service contract with Perupetro, which was extended for an additional 10-year term and expires in October Average daily production during 2014 in this field was 132 barrels of crude oil. We operate 47 wells in this field using various oil extraction systems. The Block V field is located in the province of Los Organos, department of Piura, Peru, close to the border with Ecuador. Block V has been producing oil since the 1950s. 59

65 The map below shows the geographic location of our oil producing blocks in northern Peru. Under our hydrocarbon extraction service contracts, we are entitled to a variable fee, which is based on the level of production of each field and a basket of international crude prices, which include Fortis Blend, Suez Blend and Oman crudes. During 2012, 2013 and 2014, we received an average fee of US$86.13, US$84.99 and US$77.33 per barrel of extracted oil, which was equivalent to approximately 77.1%, 78.2% and 78.1%, respectively, of average Brent crude prices in the same years. According to our hydrocarbons development contracts, we are required to deliver all the oil and gas we produce, regardless of its quantity, to Perupetro. Therefore, we are not committed to provide a fixed and determinable quantity of oil or gas in the near future under existing contracts. We produce natural gas as a byproduct of the production of crude oil. In Block I, we provide natural gas to Perupetro, which in turn sells it to EEPSA, and pays us a fee which varies depending on market conditions. In Block V, we reinject that natural gas produced into the wells. Our revenues for the sale of natural gas are not material relative to our oil production revenues. Estimated Proved Reserves: The following table sets forth estimated proved crude oil and natural gas reserves in Blocks I and V as of December 31, We have only included estimates of proved and have not included any estimates of probable and possible reserves. 60 Crude Oil (Mbbl) Natural Gas (MMcf) Crude Oil Equivalents (MBoe) Block 1: Proved developed producing 2, , ,922.1 Proved developed non-producing , Proved undeveloped , ,645.9 Total proved reserves 3, , ,198.7 Block V: Proved developed producing Proved developed non-producing Proved undeveloped Total proved reserves Total: Proved developed producing 2, , ,288.1 Proved developed non-producing , Proved undeveloped 1, , ,969.9 Total proved reserves 4, , ,976.7
66 Proved reserves are those quantities of oil and natural gas which, by analysis of geosciences and engineering data, can be estimated with reasonable certainty to be economically producible from a given date forward, from known reservoirs, and under existing economic conditions, operating methods, and government regulations. The term reasonable certainty implies a high degree of confidence that the quantities of oil and/or natural gas actually recovered will equal or exceed the estimate. To achieve reasonable certainty, we employed methodologies that have been demonstrated to yield results with consistency and repeatability. The methodologies and economic data used in the estimation of the proved reserves in the fields include, but are not limited to, well logs, geologic maps and available down hole and production data, seismic data, and well test data. Reserve amounts were determined based on the 12-month unweighted arithmetic average of the first-day-of-the-month Brent crude price for each month in the period January through December 2014, which, pursuant to our contractual agreements, resulted in oil and gas prices of US$77.33 per barrel and US$3.22 per Mcf, respectively, that for the purpose of reserve amount estimation were assumed to remain constant throughout the remaining terms of our service contracts. Proved undeveloped reserves in the fields as of December 31, 2014 were 1,969.9 Mboe, consisting of 1,126.0 Mbbl of crude oil and 4,748.0 MMcf of natural gas. We estimate that during 2014 approximately 1,076.6 Mboe (590.0 Mbbl of crude oil and 2,737.7 MMcf, or Mboe, of natural gas) of proved undeveloped reserves were converted into proved developed reserves. We estimate that during 2014 proved undeveloped reserves declined by 13.52%, or Mboe, consisting of a decline of 48.0 Mboe (270.0 MMcf) of natural gas and a decrease of Mbbl of crude oil. Capital expenditures, for both drilling activities and workovers, made during 2014 to convert undeveloped reserves to prove developed reserves amounted to approximately US$25.6 million. The principal changes in proved undeveloped reserves during 2014 were: Crude oil reserves: proved undeveloped crude oil reserves decreased 260 Mbbl during 2014 as a result of less drilling locations to drill and one year less to the termination of our contract, mainly in Block I; and Natural gas reserves: proved undeveloped natural gas reserves decreased 48.0 Mboe (270.0 MMcf) during 2014 as a result of reviews of production behavior of wells (lower natural gas/crude oil relationship). For changes in proved developed and undeveloped reserves from December 31, 2011 to December 31, 2014, see supplementary data (unaudited) annexed to our audited annual consolidated financial statements included in this annual report. Qualifications of Technical Persons and Internal Controls Over Reserves Estimation Process: The reserves estimates shown in this annual report have been prepared internally by our engineers in accordance with the definitions and guidelines of the SEC. Our reservoir engineers and geoscience professionals have worked to ensure the integrity, accuracy and timeliness of the data, methods and assumptions used in the preparation of the reserves estimates. Mr. Victor Salirrosas is our Reservoir Engineer and head of our staff of reservoir engineers and geoscience professionals. The reserves estimate report was submitted to our Committee of Reserves Development, which is formed by Mr. Iván Miranda Zuzunaga (Exploration and Production Manager), Mr. Jose Pisconte Lomas (Chief of Geology) and independent consultants (including Mr. Humberto Barbis Valderrama, GMP s former Exploration and Production Manager until December 2013). The Committee of Reserves Development reviews the report and relays it for approval to the board of directors of GMP together with its recommendations with respect to the estimation and categorization of reserves. Mr. Salirrosas holds a Petroleum Engineering degree from Universidad Nacional de Ingeniería in Lima, Peru and has 40 years of experience, most of it as a reservoir engineer at Perupetro and GMP. Mr. Salirrosas is also a professor of reservoir engineering and enhanced oil recovery in the Petroleum Engineering School of Universidad Nacional de Ingeniería in Lima, Peru. In addition, Mr. Miranda Zuzunaga, our Exploration and Production Manager, holds a degree in Petroleum Engineering from Universidad Nacional de Ingeniería in Lima and a Petroleum Engineering Master s degree from 61
67 Texas A&M University of Texas, and has 31 years of experience in the oil industry. Mr. Pisconte Lomas, Chief of Geology, holds a Geologist Engineering degree and a Regional Geology master s degree from Universidad Nacional Mayor de San Marcos and has 24 years of experience in the oil industry. Furthermore, the board of directors of GMP has in the past contracted two independent extraction consultants who are highly experienced in the oil and gas industry and who review the methodology used for the estimation of reserves. Production, Revenues, Prices and Costs: The following table sets forth information regarding our production, revenues, prices and production costs for 2012, 2013 and Year ended December 31, Production volumes(1): Crude oil (Mbbl) Block I Block V Total (crude oil Mbbl) Natural gas (MMcf) Block I 2, , ,238.3 Block V Total (natural gas MMcf) 2, , ,395.8 Crude oil equivalents (Mboe) Total Company , ,244.5 Average sales prices(2): Crude oil (US$/bbl) Natural Gas (US$/Mcf) Crude oil equivalents (US$/boe) Costs and expenses(2): Production expenses (US$/boe) General and administrative expenses (US$/boe) Depreciation, depletion, amortization and accretion expenses (US$/boe) (1) Hydrocarbons extracted from our fields belong to Perupetro, which in turns pays us a per barrel fee for lifted hydrocarbons. (2) Crude oil sales volume differs from total production volume due to operational circumstances such as the inventory of product stored in our field batteries at the end of each monthly measurement. Average sales prices refers to the fees received in consideration for our extraction services, which do not equal the sales prices of crude oil. Average sales prices have been calculated using a basket price formula according to the service contracts of each block. Such formulation is at a discount to global oil prices and we do not otherwise pay royalties on the oil and gas extracted. Per unit costs have been calculated using sales volumes. Acreage, Productive and Development Wells, Drilling: The following table sets forth certain information regarding the total developed and undeveloped acreage as of December 31, Formation Developed Acreage Undeveloped Acreage Block I Pariñas 2, Mogollón 2, Basal Salina 1, Mesa 1,485 1,650 Total Block I 8,189 2,140 Block V Verdún Ostrea Mogollón 1, Total Block V 2, Total 10,244 3,025 62
68 As of December 31, 2014, we had a total of 253 producing wells. Our wells are oil wells, many of which also produce natural gas. We do not have interests in wells that only produce natural gas. The following table shows the number of development and exploratory wells drilled during 2012, 2013 and 2014 in both Block I and Block V. Year ended December 31, Development Wells Productive Dry Total Exploratory Wells Productive 16 Dry Total 16 During 2012, 2013 and 2014 we invested US$18.7 million, US$17.8 million and US$25.6 million, respectively, in drilling activities. Twenty five of the twenty six development wells drilled during 2014 were located in Block I with a depth average of approximately 6,587 foot. All of them are productive wells and they partially explain our production volume increase registered during 2014 compared to The company is drilling an average of 2.16 wells per month in its quest to accelerate the recovery of proved reserves. Most of the drilling is done in Block I where environmental permits allow us to drill up to 96 new wells. From time to time, based on geological analysis, we try to obtain more oil by increasing the depth of our productive formations. In this way, we minimize exploratory risks. Under the terms of our service contracts, at the time the contract terminates, we are required to close non-producing wells that we have drilled. As of December 31, 2014, we estimated that we will be required to close 65 wells in Block I in December 2021 and 13 wells in Block V in October 2023, out of approximately 332 wells currently not in production. We have created a provision in our financial statements for the costs relating to those well closings. See note 16 to our audited annual consolidated financial statements included in this annual report. Block III and IV In December 12, 2014 we were awarded license contracts for 30 years for Blocks III and IV located in the Talara basin, in the region of Piura, near our Blocks I and V. The contracts will require us to drill 230 development wells in Block III and 330 development wells in Block IV in a period of 10 years, representing an estimated total investment of US$560 million for both blocks. Operations of both blocks began April 5, 2015, at which date production is expected to be approximately 1,700 barrels per day, with our commitment to begin drilling commencing one year after the start of operations. Based on information published by Perupetro, the aggregate production of oil in Bock III was 819,715 bbl in 2012, 708,845 bbl in 2013 and 569,296 bbl in 2014, and the aggregate production of oil in Block IV was 282,382 bbl in 2012, 259,804 bbl in 2013 and 244,528 bbl. We have not verified these production levels however. Moreover, we cannot assure you that we will be able to maintain or improve these production levels. Gas Processing Plant We own a gas processing plant located 7 km north of the city of Talara in Piura, Peru. We currently have under a long-term delivery and gas processing and fractioning contract with EEPSA, according to which EEPSA delivers wet natural gas that it purchases from onshore and offshore gas operators in the area. We then process and 63
69 fraction the gas into two products: (i) dry natural gas, which can be used as fuel in EEPSA s gas-fired turbine; and (ii) natural gas liquids, which are sold in the Peruvian market. Under the terms of the agreement, we are responsible for all operating costs of the gas processing plant but are also entitled to keep revenues from the sale of the natural gas liquids to third parties after payment of a variable royalty, based on the volume of gas processed, to EEPSA. Our current gas processing and fractionation contract with EEPSA expires in Our gas processing plant has the capacity to process up to 44 MMcf per day. We processed 26.3 MMcf per day during 2012, 18.1 MMcf per day during 2013 and 27.3 MMcf per day during Volumes processed by our gas processing plant ultimately depend upon gas volumes demanded by EEPSA for its gas-fired turbines. These volumes vary per month and depend upon the power dispatch curve of EEPSA among Peruvian power generation plants. In rainy months (December to April) where hydroelectric power generation in Peru is typically higher, gas volumes demanded by EEPSA are lower than in dryer months (May to November) in which activity of thermal generators tends to be higher. COGA is dedicated to the management, operation, maintenance and integrity management of transport and distribution hydrocarbon pipelines and installations as well as industrial plants and ancillary installations. COGA operates and maintains more than 1,430 km of pipelines, one compression plant with 72,000 horse power and four pump stations with 19,200 horse power each. Fuel Storage Terminals We are a 50% partner in Consorcio Terminales with a Peruvian affiliate of Oiltanking GmbH, one of the world s largest operators of independent terminals for bulk liquid storage. Consorcio Terminales had a contract with Petroperú to operate the North and South Fuel Terminals in Peru, which expired in August In May 2014, there was a public bidding for the operation of the North, Center and South Terminals. In June 2014, Consorcio Terminales del Perú ( Terminales del Perú ), a consortium integrated by our subsidiary GMP S.A. and Oiltanking Peru was awarded a concession for the operation of the North and Central Fuel Terminals for Petroperú. The contracts have a 20-year term and consist of the operation of four terminals in the north and one terminal in the center of the country, providing storage and dispatching bulk liquid fuel. The total amount of the committed investment for both projects is approximately US$ 37.2 million, while the total amount of the additional investment, which will be reimbursed, is approximately US$ 186 million. There was no winner in the public bidding for the operation of the South Fuel Terminals and the contract of Consorcio Terminales was extended for an additional year until August A new public biding will take place in May We cannot assure you that we will be awarded the new contract or that the terms of such potential new contract will not differ materially from those of our current contract. Our open-access terminals are equipped with modern technologies and offer our customers dependable and critical handling and storage services for refined petroleum liquid products, maintaining high quality, safety and environmental standards. We provide storage, handling and loading and uploading services for a broad range of refined petroleum liquid products, including gasoline, aircraft fuel, diesel and heavy fuel oil. We deliver the liquids into two types of transportation systems, railroad cars and cistern trucks. Because of the strategic location of our assets, our deep-water access, inland terminals and our aggregate storage capacity of 2.2 MMbbl in the North and Central Terminals and of 1.4 MMbbl in the South Terminals, we believe that we are well-positioned to cover the needs of our clients, the two principal refineries in Peru. The map below shows the location of each of our fuel storage terminals in Peru. 64
. The storage fee per barrel, is based upon reserved volumes whether they are received or not.")
70 Under the current contracts, Consorcio Terminales and Terminales del Perú receive revenues paid in connection with monthly reserved volume in tanks for refined crude products (storage fee) and for volumes loaded and delivered into railroad cars or cistern trucks to each terminal (throughput fee). The storage fee per barrel, is based upon reserved volumes whether they are received or not. The throughput fee is paid based on effective barrels delivered per month. During 2012, 2013 and 2014, Consorcio Terminales and Terminales del Perú generated revenues of US$49.1 million, US$48.7 million and US$44.5 million (we are entitled to 50% of the joint operation revenues), respectively. Under the contracts, Consorcio Terminales and Terminales del Perú are responsible for paying the fuel terminals operating costs and also paying a royalty fee to Petroperú based on effective barrels delivered each month. At the current stage of the contracts, any capital expenditure we invest in the fuel storage terminals can be recouped from any present and future royalties we owe to Petroperú. Other Terminal Operations We are a 50% partner in Oiltanking Andina Services S.A.C. ( OTAS ). This subsidiary operates a fuel terminal named Terminal Marino Pisco Camisea under a contract subscribed with Pluspetrol to operate an export terminal for gasoline, diesel, propane and butane. In 2014, this terminal dispatched 30.6 million barrels of natural gas liquids. Additionally, through OTAS, we are also a 25% partner in Logística Químicos del Sur S.A. ( LQS ), that operates the Terminal de Químicos de Matarani, which in 2014 dispatched 33,663 tonnes of sodium hydrosulfide for international mining companies. During 2012, 2013 and 2014, these activities generated revenues in the aggregate of approximately US$4.3 million, US$4.2 million and US$4.1 million, respectively. Competition Our ability to grow through successful bids for new infrastructure concessions or other long-term contracts could be affected as a result of competition. We view our competition as including both Peruvian and international infrastructure concession operators including joint operations with partners with specialized expertise in the relevant sector. Competition varies on a case-by-case basis, depending on the main purpose of the concession. 65
71 Real Estate Our Real Estate segment is one of the largest apartment building developer in Peru, in terms of number of units sold and value of sales in 2014, and is focused on the development and sale of affordable housing and housing as well as other real estate projects. Since commencing our operations in 1987, we have developed approximately 609,899 m2 of affordable housing (approximately 9,134 units); approximately 309,480 m2 of housing (approximately 1,522 units); approximately 138,948 m2 of office space (approximately 820 offices); and approximately 43,000 m2 of shopping centers (three shopping centers). Moreover, we are currently building approximately 47,000 m2 of affordable housing (approximately 788 units); approximately 3,900 m2 of housing (approximately 40 units); and approximately 65,000 m2 of office space (approximately 222 offices, with an average size of 316 m2 each). Our Real Estate segment also owns significant land parcels in Lima, comprising of approximately 812 hectares as of December 31, 2014, and we have sold undeveloped land in the past and intend to continue such sales in the future. The table below sets forth selected financial information for our Real Estate business segment. Year ended December 31, (in millions of S/., except as indicated)) (in millions of US$)(1) Revenues Adjusted EBITDA Adjusted EBITDA margin 37.9% 43.1% 32.5% Net profit Year ended December 31, (in millions of S/., except as indicated)) (in millions of US$)(1) Net profit attributable to controlling interest Backlog (in millions of US$)(2) Backlog/revenues ratio(2) 1.2x 0.8x 1.1x (1) Calculated based on an exchange rate of S/ to US$1.00 as of December 31, (2) For more information on our backlog, see Backlog. Backlog is calculated as of the last day of the applicable period. Revenues are calculated for such period and converted into U.S. dollars based on the exchange rate published by the SBS at such period. We undertake a significant amount of the activities in our Real Estate segment with partners through financing and commercial arrangements we use to purchase land and to develop real estate projects. See Financing. As a result, a significant amount of our net profit in the Real Estate segment is attributable to the non-controlling interest of our partners. See also Item 5.A. Operating and Financial Review and Prospects Operating Results Results of Operations General Real Estate. Principal Real Estate Activities Our real estate developments include the following products: affordable housing; housing; and commercial real estate. 66
72 We began developing affordable housing projects in 2001, following the Peruvian government s efforts to address the country s housing deficit, particularly for low-income families. We launched the first major affordable housing project in Peru in 2007, Parque Agustino in Lima s El Agustino neighborhood. Since 2001, we have completed 14 affordable housing projects. As of December 31, 2014, we are developing nine affordable housing projects, which are in various stages of development, including two which are in the construction phase and six for which we have purchased land, but are still in the process of obtaining the required approvals and permits. One of our ongoing affordable housing projects consist of expansions of projects previously completed by us. Affordable housing consists of apartments, usually ranging between 50 and 72 m2, that are purchased through government subsidies. The Peruvian government has adopted the Nuevo Crédito Mi Vivienda and Techo Propio programs, among others, which promote access to affordable housing in Peru by providing government subsidies to individuals for the purchase of homes. In order for a unit to qualify for the Nuevo Crédito MiVivienda program, its selling price must range between 14 UIT and 70 UIT (approximately between S/.53,900 and S/.192,000). In order for a unit to qualify for the Techo Propio program, its selling price must range between 5.5 UIT and 20 UIT (approximately between S/.21,115 and S/.77,000). In order to be eligible for an affordable housing subsidy under the Nuevo Crédito MiVivienda program, a purchaser must not own any other home or have benefitted from a housing subsidy program in the past, among other requirements. A purchaser must also provide a down payment between 10% and 30% of the total purchase amount. Housing subsidies under this program fluctuate between S/.12,500 and S/.17,000, which incentivize purchasers with reduced monthly rates so long as they pay their mortgage loan payments on a timely basis. In order to be eligible for an affordable housing subsidy under the Techo Propio program, a purchaser must have a monthly income that does not exceed 0.48 UIT (approximately S/.1,860) and must not have received any other government-sponsored housing benefit in the past, among other requirements. A Techo Propio purchaser must also show proven savings equal to at least 10% of the total purchase amount. Housing subsidies under this program fluctuate between four UIT and five UIT (approximately between S/.15,400 and S/.19,250). Purchasers of subsidized housing under both programs are also not required to pay a value-added tax normally applicable to residential purchases. We develop substantially all of our affordable housing projects on land purchased from the private sector. To the extent these projects meet the requirements of a particular government subsidy program, purchasers can purchase units with government subsidies. Some of our affordable housing projects, however, such as Parque Agustino, are developed through government bidding processes. Government subsidy programs like Nuevo Crédito MiVivienda and Techo Propio have driven the demand for affordable housing in Peru, which has in turn increased our sales of affordable housing units. Our housing developments consist of residential buildings comprised of apartments with a mid- to high-price range that do not qualify for government subsidies. Since 1987, we have developed 38 housing developments. As of December 31, 2014, we are developing three housing projects, including one which is in the construction stage and two for which we have purchased land, but are still in the process of obtaining the required approvals and permits. Our housing units typically range between 130 and 400 m2 in size. Substantially all of our affordable housing and housing development projects are located in Lima. We have also purchased land to develop four affordable housing projects in Piura, Chiclayo, Chimbote and Huancayo, three cities north of Lima and one in the center of the country. We intend to develop affordable housing projects in other cities outside of Lima. The table below sets forth number of units sold and not yet delivered and number of units delivered, as well as the value of units sold and our sales revenue for the periods indicated. Year ended December 31, Number of Units Delivered(1): Affordable Housing 1,255 1, Housing Total 1,368 1, Number of Units Sold and Not Yet Delivered(1): Affordable Housing 1,940 1,
73 Housing Total 2,017 1, Total m2 Delivered: Affordable Housing 127, ,538 49,150 Housing 13,730 18,000 14,539 Total 141, ,538 63,689 Total m2 Sold and Not Yet Delivered: Affordable Housing 123,958 87,948 36,257 Housing 10,109 6,660 15,619 Total 134,067 94,608 51,875 Value of Units Delivered (in millions of S/.): Affordable Housing Housing Total (1) We typically pre-sell our affordable housing and housing units before construction begins and continue to sell during construction, although we recognize revenues at the time of delivery of units. We develop and sell office and commercial buildings, such as shopping centers. On certain occasions, we have operated our commercial real estate and later sold it, such as Larcomar, a landmark shopping center which we built in 1998 and sold in We have also developed commercial real estate buildings in connection with our affordable housing and housing projects, such as the Parque Agustino shopping center. Since 1987, we have developed 13 office buildings, three shopping centers and one medical center. We are currently in the process of developing three office buildings in Lima: two of which are in the construction phase: Navarrete project, a 18-floor office building (32% of which is owned by us and 68% of which is owned by SURA S.A.), and Panorama project, two 17-floor towers of office buildings including a shopping zone (35% of which is owned by us and 65% of which is owned by Inversiones Maje S.A.); and one for which we have purchased land, but are still in the process of obtaining the requires approvals and permits Real Dos Project (30% of which is owned by us and 70% of which is owned by Inversiones Centenario S.A.A.). Land Bank We typically purchase land to develop real estate projects with the intention to begin construction within a 12- to 18-month period after the purchase of the land. We may also, from time to time, purchase land for subsequent resale. As of December 31, 2014, we owned approximately 893 hectares, of which 96% is located in Lima and 4% outside of Lima. We continually evaluate opportunities to purchase new land for our real estate development projects. We have a 50.0% interest in Project Espacio (formerly known as Cuartel San Martín) with Urbi Propiedades S.A. of Intergroup Financial Services Corp. owning the remaining 50.0%. Espacio Project is a 68,000 m2 former ex-military base located in Lima s upscale Miraflores district, where we plan to invest approximately US$680 million to develop a premium mixed-use development consisting of approximately 98,000 m2 of housing, 68,000 m2 of office towers, a 61,000 m2 shopping mall, and a 48,000 m2 luxury hotel and conference center. Although we are still in the pre-construction approval phase and have not yet obtained all required building permits, we plan to begin construction of this project in the first half of 2016 and expect to complete the project through multiple stages within seven years. We have a 50.4% interest in Almonte, which owns approximately 812 hectares of undeveloped land in Lurin, located 30 km south of Lima. We previously sold 24 hectares of the land for industrial use, and we expect to sell 71 hectares of the remaining land for industrial use in the next five years. We also expect to develop affordable housing projects on the land once water and sewage services become available. We also own a minority interest (approximately 20.8%) in Promoción Inmobiliaria del Sur S.A. (PRINSUR) of Inversiones Centenario, which owns approximately hectares of undeveloped land also located in Lurin. We expect to develop affordable housing projects on the land once water and sewage services become available. Our proportional interest in this land is not included in our land bank. 68
74 Financing We generally fund land purchases for our housing and commercial real estate projects through cash from our operations. For our affordable housing projects, we generally partner with real estate investment funds and insurance companies that provide between 60% and 70% of the total capital required to purchase the land and cover certain pre-construction costs in exchange for equity in the project. Once we acquire land for a particular real estate development project, we obtain working capital through a credit line from a financial institution, which we utilize to finance additional project needs as they arise. We also obtain financing through preconstruction sales for our affordable housing and housing projects and, to a lesser extent, our commercial real estate projects. Our affordable housing and housing projects generally require less outside financing because they are generally financed with preconstruction sales. Sales and Marketing We typically pre-sell our affordable housing and housing units prior to and during construction, and use the related proceeds we receive to finance the construction of the units. Our commercial and sales processes differ depending on the type of development and market segment of the development. We primarily sell our real estate development projects through an internal sales force that is assigned to particular projects and, to a lesser extent, external brokers on a non-exclusive, commission-fee basis. Our marketing efforts primarily consist of newspaper advertisements, radio and television commercials, billboards and promotional offers for referrals. We also advertise our real estate projects on our website. We believe our brand is associated with product quality, professional operations and reliable post-sale customer service. We provide customer service call centers through which residents can report complaints or defects. Engineers respond with site visits, and repairs are made as long as the property continues to be covered by the applicable warranty or guarantee. For our affordable housing projects, we provide post-sale customer service through our Ayni program, which aims to preserve the longterm value of our affordable housing developments by promoting a cooperative community life. Through this program, we distribute manuals that teach best practices for living in communities, offer leadership workshops, budget workshops, promote small business development, facilitate conflict resolution and provide other services. These services are provided for a six- to eight-month period following project delivery. In 2012, we initiated the Ayni contest for residents of our affordable housing projects with the aim of stimulating the sustainability of their community. Participants present an enhancement project for their community, such as a recreation center, and a jury selects the best project, which we fund and construct. Competition The Peruvian real estate development industry is highly competitive. The market is fragmented and no single company has a significant share of the national market. The principal competitors for our Real Estate segment are Paz Centenario Global S.A., Paz Centenario Inmobiliaria, Corporación Líder Perú S.A., Urbana Perú, Los Portales, Inmobiliari S.A., Imagina Grupo Inmobiliario, ENACORP, Besco S.A. and Gerpal. In the coming years, we expect more competition from domestic and foreign real estate development companies who recognize the growth potential in the Peruvian residential market. The main factors that drive competition are product design and amenities, price, location and post-sale service offerings. Technical Services Our Technical Services segment undertakes a broad range of activities, including (i) the operation and maintenance of infrastructure assets; (ii) information technology (IT) services for private clients and the government; and (iii) electricity networks services. Characterized by mid-to long-term contracts, our Technical Services segment further adds a more stable cash flow stream to our consolidated activities. The table below sets forth selected financial information for our Technical Services business segment. 69
 (1.7) Net profit attributable to controlling interest 50.6 34.3 (5.3) (1.8) Backlog (in millions of US$)(2) 873.7 619.0 646.")
75 As and for the year ended December 31, (in millions of S/., except as indicated) (in millions of US$)(1) Revenues 1, , , Adjusted EBITDA Adjusted EBITDA margin 10.3 % 9.4 % 5.3 % Net profit (5.1) (1.7) Net profit attributable to controlling interest (5.3) (1.8) Backlog (in millions of US$)(2) Backlog/revenues ratio(2) 2.1x 1.5x 1.6x (1) Calculated based on an exchange rate of S/ to US$1.00 as of December 31, (2) For more information on our backlog, see Backlog. Backlog is calculated as of the last day of the applicable year. Revenues are calculated for such year and converted into U.S. dollars based on the exchange rate published by the SBS on December 31 of the corresponding year. The pie charts below set forth the breakdown of our revenues and Adjusted EBITDA from our Technical Services for Revenues Adjusted EBITDA Operation and Maintenance of Infrastructure Assets We began providing our operation and maintenance of infrastructure assets services in 1994 when we were awarded the concession for the Arequipa Matarani highway in southern Peru. With this experience, in 2003, we began providing operation and maintenance services to Norvial. In 2007, the Peruvian government initiated Proyecto Peru, a program aimed at maintaining roads not under concession to ensure their longevity. Proyecto Peru allowed us to develop new business opportunities providing maintenance services to more than 4,000 km of public roads in Peru. We believe the experience we have gained operating highway and transportation concessions positioned the company to capitalize on the Peruvian government s initiatives to increase infrastructure development. 70

76 Our revenue in the operation and maintenance of infrastructure assets is generated either from fees we charge to Norvial, Survial, Canchaque and the Lima Metro to operate and maintain our concessions or from government payments through maintenance service contracts we have been awarded. As depicted in the chart below, we operate and maintain more than 3,400 km of Peruvian roads and highways, including our own highway concessions, in addition to the Lima Metro. Operation and Maintenance of Infrastructure Assets Total 3,459 KM The table below sets forth selected financial information for our operation and maintenance of infrastructure assets activities. Year ended December 31, (in millions of US$)(1) (in millions of S/.) Revenues Adjusted EBITDA (15.3) (5.1) Adjusted EBITDA margin 9.6% 4.2% (4.2%) Net profit (26.5) (8.9) (1) Calculated based on an exchange rate of S/ to US$1.00 as of December 31,
77 The below map illustrates the roads in Peru for which we currently provide operation and maintenance services. We provide the following road operation and maintenance services: We also administer toll stations and weighing stations; offer road patrolling services; operate assistance call centers; and provide emergency medical services. The operation and maintenance services we provide to the Lima Metro aim to preserve the mass transit system through ongoing maintenance, including cleaning of the trains and stations and providing train operators, among other services. With respect to operation and maintenance contracts with the Peruvian government, we obtain new contracts through public bidding. With respect to contracts with our Infrastructure segment, we participate in direct negotiation. Contract length typically ranges from three to five years. IT Services Routine Maintenance. These services aim to preserve roads through ongoing maintenance, including: road demarcation; cleaning; drainage; road fissure treatment, which seals cracks in roads to prevent water infiltration; slurry sealing; and micro-paving, which seals asphalt to prevent aging and improve resistance to water and surface wear. Periodic Maintenance. These services entail activities that are performed periodically, intended to prevent the occurrence or exacerbation of defects, conserve the structural integrity of roads and correct major defects. Emergency maintenance. This maintenance work is performed whenever the need arises, such as when natural disasters damage road surfaces. We began our IT services business in 1984 providing computer equipment to companies and evolved into a technology solutions provider in In the early 1980s, Sonda, one of the main IT services providers in Latin America, was looking for a partner to represent Digital Equipment Corp. (currently, Hewlett-Packard) for the sale of 72
78 hardware in Peru. Sonda s need coincided with our diversification strategy and, therefore, we decided to jointly constitute GMD. In 1994, we bought out Sonda. Nowadays our main focus is the provision of business process and IT outsourcing services, and providing the necessary corresponding equipment, to well-known large companies and public institutions in Peru. The infrastructure through which we operate our business includes two call centers with a total of 180 workstations and three data centers. In addition, we have successfully entered into strategic partnerships with key international IT vendors such as Cisco Systems, Microsoft, Hewlett-Packard, Oracle, SAP, IBM, Citrix, VMware, CA Technologies and Louis Berger Group. The table below sets forth selected financial information relating to our IT services. Year ended December 31, (in millions of US$)(1) (in millions of S/.) Revenues Adjusted EBITDA Adjusted EBITDA margin 16.6% 15.4% 13.9% Net profit (1) Calculated based on an exchange rate of S/ to US$1.00 as of December 31, Services We provide the following services to our clients: Systems Integration: includes installation and maintenance of hardware; 24-hour technical service; monitoring performance of IT systems; implementation of information recovery systems; and installation of systems that enable collaboration across multiple platforms such as Windows, Apple, Android and Blackberry, among others. For example, we provide equipment maintenance services to Backus, an affiliate of SABMiller. Our technology solutions optimize the reliability and performance of our client s infrastructure with the goal of helping them reduce costs, improve security and integrate new technologies. IT Outsourcing: includes servers on demand in the cloud (our internet network) which provide virtual memory, processing and storage capacities; virtual working spaces, including operating systems and databases; accounts on the cloud; technical support help desk; among others. For example, we provide help desk services to Barrick Gold Corporation, serving a total of 3,700 users in four countries. Moreover, all of the trading transactions on the Lima Stock Exchange are electronically processed through our facilities. Our outsourcing services are designed to facilitate our clients operational continuity by means of an appropriate IT platform, managed in accordance with high standards of security and quality. Application Outsourcing: includes corrective and continued maintenance of software; development of customized software (software factory); software testing and certification; and functional support through a service desk platform. For example, we have a software factory contract with an affiliate of Telefónica. Our application outsourcing services enable our clients to shift the burden of supporting, maintaining and operating their business software and systems. Business Processes Outsourcing: consists of the outsourcing of specific business processes including billing, payments and collection; customer care services such as management of complaints; organization and control of voting processes; inventory, shipping and custody of documents; among others. For example, we provide billing services to an affiliate of Repsol, and provide document authentication services to BBVA Banco Continental. Moreover, in the latest local and regional presidential elections, we provided voting processing services to the Peruvian government. 73

79 The pie chart below shows our revenues by service for Revenues by Service Clients We provide services to our clients pursuant to service level agreements which enable us to customize each contract to the needs of the particular client. We set specific parameters and standards which can include maximum times for response and levels of equipment performance, among others. The average term of our contracts is three to five years and we have achieved a significant level of contract renovation. We have built a strong client base in Peru, including local affiliates of global companies, spanning a broad range of industries, including key clients from the energy, government, banking, insurance, pension funds, industrial, commercial, education and mining sectors. Our principal clients are affiliates of Barrick Gold Corporation, Repsol, BBVA Banco Continental, Honda, Telefónica, the Peruvian National Office of Electoral Processes (Oficina Nacional de Procesos Electorales), the Peruvian National Pension System (Sistema Nacional de Pensiones), the Peruvian SUNAT, AFP Integra- Sura Group, Backus, BELCORP and UNIQUE. Competition The IT services industry is highly competitive. The market includes both international companies and local or regional companies. Our main competitors, which are sometimes also our partners, include companies such as IBM, Tata Consultancy Services, Sonda, Indra, among others. Electricity Networks Services We offer field and specialized services consisting of installation and routine operation and maintenance of electricity infrastructure, primarily for power utility companies in Chile and, to a lesser extent, Colombia, Brazil and Peru. Field services include day-to-day services and troubleshooting required to maintain the electric grid. Specialized services require more sophisticated and more tailored technology and expertise. With over 20 years operating experience developing, installing, operating and maintaining metering systems, we have also developed a broad range of specialized solutions to reduce electricity theft, one of the main concerns for power utility companies in Latin America. 74

80 The table below sets forth selected financial information for our Electricity Networks Services. The field services we provide include, among others, installing and maintaining medium- and high-voltage electricity networks and public lighting networks; connecting new residential, commercial and industrial customers to the electrical grid; disconnecting and reconnecting the power supply of our clients customers; meter reading; verification of electricity theft; and the installation of meters and antitheft solutions. We also provide services that include changing and repairing damaged electrical equipment and maintaining, transferring and expanding the electrical grid. We have developed a sophisticated management system to monitor the efficiency of the field services we provide and increase the daily productivity of our field crews. We also provide specialized services, which involve more technical expertise and specialized equipment, including the monitoring of electrical consumption for approximately 420,000 industrial, commercial and residential customers. We have developed specialized metering systems and anti-theft solutions for the Latin American markets. We believe we are one of two companies with a relevant market penetration of these antitheft solutions for power utility companies in our markets. We also operate laboratories that offer an array of services in response to local regulation requirements, such as meter certification, equipment testing and theft reports. In Brazil and Chile, we also operate the warehouse facilities of local power utility companies, which store and distribute the necessary equipment for operations, such as cables, insulators and meters. In addition, in Chile, we lease residential electricity meters to a power utility company, for which we also provide maintenance services. We have formed strategic alliances with equipment manufacturers in order to develop and commercialize specialized metering systems and anti-theft solutions. The chart below sets forth the percentage of our 2014 revenues in each of the countries where we operate. Revenue by Country Year ended December 31, (in millions of S/.) (in millions of US$)(1) Revenues Adjusted EBITDA Adjusted EBITDA margin 8.5% 11.1% 7.5% Net profit (1) Calculated based on an exchange rate of S/ to US$1.00 as of December 31,
81 Contracts and Clients We typically provide our services pursuant to long-term contracts ranging between three and five years. Most of our contracts are awarded through a non-public bidding process, although some contracts are negotiated directly with the client. Our principal clients are power utility companies and, to a lesser extent, industrial clients, predominantly in the private sector. In Peru, we also provide services to the telecommunications industry. Our principal clients are the distribution companies of Enersis. Over the years, we have worked with the principal power utility companies in the region, including Chilectra, Saesa, Chilquinta, AES, E-CL, Endesa Chile, Ampla, Coelce, Cemig, Coelba, Elektro, Light, Codensa, Emgesa, EEC, Enertolima, Emcalo, Edelnor, Electrocentro, Enosa, Claro and Telefonica. Competition The market for electricity networks services is highly fragmented and no single company has a significant share of the national market in the countries where we operate. We primarily compete with small, local privately-held service companies. We expect competition to increase in the coming years as electricity consumption grows in response to the economic growth, and relatively low per capita consumption, in the countries where we operate. The main factors that drive competition are safety; product and service quality; reliability; price; and ability to respond to increased industry regulations. Backlog We define our backlog as the U.S. dollar equivalent value of revenue we expect to realize in the future as a result of performing work under multi-period contracts that we have entered into. Backlog is not a measure defined by IFRS, and our methodology for determining backlog may not be comparable to the methodology used by other companies in determining their backlog. For contracts denominated in nuevos soles or other local currencies, amounts have been converted into U.S. dollars based on the exchange rate published by the SBS on December 31 of the corresponding year. We do not include backlog in this annual report in our Infrastructure segment for: (i) our Norvial toll road concession because its revenues from the concession are derived from toll fees charged to vehicles using the highway, and, as a result, such revenues are dependent on vehicular traffic levels; and (ii) our Energy line of business because: (a) its revenues from hydrocarbon extraction services are dependent on the amounts of oil and gas we produce and market prices, which fluctuate significantly; (b) our revenues from our gas processing plant are dependent on the amount of gas we process and market prices for natural gas liquids, which fluctuate significantly; and (c) our revenues from our fuel storage terminal operation partially depend on the volume of fuel dispatched; and (iii) COGA venture, which is not consolidated because it is jointly controlled. When we present backlog on a segment basis, we do not include eliminations that are included in our consolidated backlog. For a description of how we calculate our backlog, see our segment backlog presented below. Our consolidated backlog as of December 31, 2014 was US$3,765 million. We expect to recognize as revenues 49% of our backlog by December 31, 2015, 31% of our backlog by December 31, 2016 and 21% of our backlog thereafter. The following table sets forth the growth of our consolidated backlog from December 31, 2009 to December 31,


82 Backlog Growth (in US$ million) Our backlog may not grow at recent historic rates and may decline. We cannot assure you that we will be able to continue obtaining sufficient contracts in the future in number and magnitude to continue to grow our backlog. Additionally, the amount of new contracts signed can fluctuate significantly from period to period due to factors that are beyond our control. The chart below sets forth our consolidated backlog breakdown by end-market, geography and client sector as of December 31, Backlog by End-Market Backlog by Geography Backlog by Client Type 77

83 E & C Backlog To include an engineering and construction contract in our backlog, we assume that each party will satisfy all of its respective obligations under the contract. We also make assumptions, in agreement with the client, regarding the total expected contract price in the case of unit price and cost-plus fee contracts and the amount of the contract that will be completed in each year. We adjust our backlog periodically to account for developments related to each project. For projects related to joint operations, we only include our percentage ownership of the joint operation s backlog. Our E&C segment backlog does not include intersegment eliminations. Our E&C backlog as of December 31, 2014 was US$2,835 million. We expect to recognize as revenues 51% of our backlog by December 31, 2015, 29% of our backlog by 2016 and 19% of our backlog thereafter. The following table sets forth the growth of our E&C backlog from December 31, 2009 to December 31, E&C Backlog Growth (in US$ million) The number and amounts of new contracts signed can fluctuate significantly from period to period. For example, two large mining services contracts were signed in the fourth quarter of 2012 for an aggregate amount of backlog of US$1.1 billion. During that same quarter we also recorded US$259 million in backlog from our Vial y Vives acquisition. These contracts and acquisition accounted for a significant portion of the extraordinary growth in our E&C backlog between December 31, 2011 and December 31, 2012 and explain in part the more gradual growth between December 31, 2012 and December 31,


84 The following pie charts set forth our E&C backlog breakdown by end-market, geography, client sector and contract type as of December 31, Backlog by End-Market Backlog by Geography Backlog by Client Type Backlog by Client Type The table below sets forth our ending E&C backlog for 2012, 2013 and 2014, accounting for opening backlog for each year, annual contract bookings and adjustments and annual revenues recognized (in millions of US$) Opening backlog (end of prior year) 1, , ,044.0 Contract bookings and adjustments during the year 2, , ,476.1 Revenues recognized during the year (1,361.4) (1,457.5) (1,684.7) Ending backlog (end of current year) 2, , ,
85 Infrastructure Backlog In reflecting an Infrastructure contract in our backlog, we assume that each party will satisfy all of its respective obligations under the contract. For our Infrastructure backlog, we only include contracted revenues expected to be paid during the next three years following the backlog calculation date. Infrastructure backlog in this annual report does not include our Norvial toll road concession or our Energy line of business. Our Infrastructure segment backlog does not include intersegment eliminations. We calculate our Infrastructure backlog as follows: for the Lima Metro, our Infrastructure backlog assumes that for 2015, 2016 and 2017 we will operate our 24 trains in both the first and second stretches of Line One, which in the aggregate will travel 2,603,453 for that year, per fare per year; for our Survial and Canchaque concessions, we assume our contractually agreed upon annual fee, adjusted for inflation. For our 2015 and 2016 backlog, we utilize the same adjustment amount that was utilized for our 2014 fee, which has already been negotiated; and for La Chira, the agreed-upon fee that the government will pay for the construction of the waste water treatment plant is reflected as backlog for For 2016 and 2017, backlog is calculated to include the fees we will receive under the concession for our operation and maintenance, with no adjustment for inflation because 2015 is expected to be the plant s first year of operations. Our Infrastructure backlog as of December 31, 2014 was US$311.6 million. We expect to recognize as revenues 43% of our backlog by December 31, 2015, 27% of our backlog by December 31, 2016 and 30% of our backlog in The following chart sets forth the growth of our Infrastructure backlog from December 31, 2010 to December 31, Infrastructure Backlog Growth (in US$ million) The following pie chart sets forth our Infrastructure backlog breakdown by line of business as of December 31,
. 2012 2013 2014 (in millions of US$) Opening backlog (end of prior year) 195.9 413.4 320.")
86 Backlog by Line of Business The table below sets forth our ending Infrastructure backlog for 2012, 2013 and 2014, accounting for opening backlog for each year, annual contract bookings and adjustments and annual revenues recognized (excluding Norvial and our Energy line of business) (in millions of US$) Opening backlog (end of prior year) Contract bookings and adjustments during the year Revenues recognized during the year (58.6) (94.9) (115.6) Ending backlog (end of current year) Real Estate Backlog Our Real Estate segment backlog reflects sales contracts with buyers for units that have not yet been delivered and will be recognized as revenues once they are delivered. Our Real Estate segment backlog as of December 31, 2014 was US$81.4 million. We expect to recognize as revenues 42% of our backlog by December 31, 2015, 54% of our backlog in 2016 and 5% of our backlog thereafter The following pie chart sets forth our Real Estate backlog breakdown by type of real estate activities as of December 31, 81
87 The table below sets forth our ending Real Estate backlog for 2012, 2013 and 2014, accounting for opening backlog for each year, annual contract bookings and adjustments and annual revenues recognized (in millions of US$) Opening backlog (end of prior year) Contract bookings and adjustments during the year Revenues recognized during the year (92.7) (112.2) (75.1) Ending backlog (end of current year) Technical Services Backlog In reflecting a Technical Services contract in our backlog, we assume that each party will satisfy all of its respective obligations under the contract and that work under the contract will be completed on a straight-line basis. Our Technical Services segment backlog does not include intersegment eliminations. Our Technical Services backlog as of December 31, 2014 was US$646.3 million. We expect to recognize as revenues 41% of our backlog by December 31, 2015, 34% of our backlog in 2016 and 26% of our backlog thereafter. The following chart sets forth the growth of our Technical Services backlog from December 31, 2009 to December 31, Technical Services Backlog Growth (in US$ million) * Includes CAM, which we acquired on February 24, The table below sets forth our ending Technical Services backlog for 2012, 2013 and 2014, accounting for opening backlog for each year, annual contract bookings and adjustments and annual revenues recognized (in millions of US$) Opening backlog (end of prior year) Contract bookings and adjustments during the year Revenues recognized during the year (418.4) (418.1) (404.2) Ending backlog (end of current year)


88 The following pie charts set forth our Technical Services backlog breakdown by geography, end-market and client sector as of December 31, Backlog by End-Market Backlog by Geography Backlog by Client Sector Warranties For certain of our contracts, we are required to provide performance bonds to ensure compliance with contractual obligations such as construction works, operation and maintenance of infrastructure assets, among others. The amount of the performance bond varies on a case-by-case basis, depending on the value of the project. Performance bonds are usually renewed annually until the contractual obligation which they intend to guarantee is fully satisfied. As part of our real estate sales contracts, we provide a six-months warranty for latent defects, which covers hidden flaws not discoverable through inspection. The warranty extends to a five-year term if the defects are caused by: (i) the use of materials below the requisite quality standards; (ii) poor execution; or (iii) faulty land. We also provide a five-year warranty for structural defects, and assume the terms and conditions of our finishes suppliers warranties. We provide warranties in connection with our IT services. All government contracts include a latent defects clause, in accordance with Article 51 of the Procurement Act which establishes a minimum warranty of one year, although, for some contracts, we provide warranties for two or three years. For contracts involving the sale of equipment or licensing, we provide the manufacturer s warranty and, if a claim arises, we transfer the claim to the manufacturer unless we provided an extended warranty. For software development contracts, we provide a one to three years good performance warranty. We have had no material disbursement or expenditure related to our warranties in the recent past. Quality Assurance The quality of our services is backed by the following certifications: Engineering and Construction: ISO and ISO 9001 Infrastructure: GMP: ISO and ISO 9001 Technical Services: Operation and Maintenance of Infrastructure Assets: ISO 9001 IT Services: ISO 9001, ISO and CMMI-3 Electricity Networks Services: ISO and ISO
89 Corporate Social Responsibility We aim to attract and develop our human capital through various training, mentorship and rewards programs in order to maintain our position as the best place to learn and work in the engineering field in Peru. We also seek to promote social good by continuing to foster relationships with the communities that surround the areas of operation of each of our business segments. As part of our citizenship building efforts, among other things, we provide: necessary tools for improving the employability and economic livelihood of citizens; create basic infrastructure to promote the use of public spaces as cultural spaces and training grounds for citizens; and create spaces that not only provide benefits, but also encourage citizens to actively participate in their maintenance. Our social responsibility efforts have been recently recognized by the award of prizes such as: The Infrastructure 360 Award in 2014, given by the Inter-American Development Bank, for work in the Lima Metro Line 1, as the project demonstrated the most comprehensive implementation of a sustainability strategy; The Socially Responsible Company Award 2013, given by the Mexican Center for Philantropy and by Perú 2021; Perú 2021 Award for Corporate Sustainable Development 2013, given by Perú 2021, in the categories of clients and multistakeholders, which was awarded to us for our Metro Culture program; Good Public Management Practices Award 2013, which considers citizen service in private entities that manage public assets, and was awarded to us for our Metro Culture program; and Business Creativity Award 2013, given by the Universidad Peruana de Ciencias Aplicadas, in the categories of real estate, construction and equipment, awarded to us for our social support program Ayni. Our model of sustainable development is based upon building relationships of trust. In our projects we consider the needs of local communities with respect to generating employment; the expectations of our customers regarding the particular goals of the project; the demand of the state for a trained service provider; and investors who wish to entrust their capital to a company that follows best practices in corporate governance and social responsibility. The following is description of our main corporate social responsibility projects: Our social support program Ayni is intended to achieve the sustainability of our affordable housing projects by encouraging the responsible and committed participation of the owners of the units. This program has provided social training to more than 7,500 families in order to strengthen their leadership skills, integration and mutual respect. Through our Metro Culture program, we transform our trains and train stations into centers of social and cultural education. According to two 2014 polls, taken in June and November, in average 87% of the Lima Metro users think that we have contributed to generate better citizens. Our Road Management program provides members of surrounding communities with the necessary civic and technical tools to make use of the roads and contribute to their maintenance by, for example, providing education on road safety and environmental protection. Moreover, we work on turning regular roads into touristic routes through the development and dissemination of guides, websites and training local communities to help develop skills in tourism. Our Development of Local Labor Capacity program (Programa Desarrollando Capacidades Laborales en las Zonas de Influencia) improves the employability of the local population, providing training that directly promotes their employment in our projects as well as providing other construction-related workshops which contribute to their development in community affairs. Since its creation in 2006, 20,000 persons have participated in this program, receiving more than 919,000 hours of training. 84
90 Regulatory Matters Set forth below is a description of the regulatory framework applicable to our company. We believe we are in compliance, in all material respects, with applicable laws and regulations in all of our business segments. Engineering and Construction Regulatory Framework Applicable to Contracts with the Public Sector As of the date of this annual report, Peru s State Contracting Law, approved by Legislative Decree No (Ley de Contrataciones del Estado) and its regulation approved by Supreme Decree No EF, govern services and construction agreements entered into with public entities. Article 10 of the Supreme Decree No EF establishes that, at the beginning of the contracting process, the contracting public entity must prepare a technical file describing the characteristics of the services it intends to purchase and the selection process for its counterparts, among other specifications such as a feasibility statement in accordance with the Peruvian Public Investment National System. The selection processes are established in Articles 15, 16, 17 and 18 of Peru s State Contracting Law as follows: public biddings (licitación pública) applicable to goods, supplies and works; public tenders (concurso público) applicable to services; direct award (adjudicación directa) applicable to goods, services and works, which can be public or directed at select participants depending if the value is equal to or higher than 50% of the maximum amount set forth in the state budget regulation for direct award; and lowest amount award (adjudicación de menor cuantía) applicable to goods, services and works whose value is lower than one-tenth of the minimum limit established by the state budget regulation. With the exception set forth in Article 22 of the Supreme Decree No EF, the selection processes include the following phases: notice; registration of participants; submission and reply of inquiries; submission and reply of comments; preparation of the terms and conditions of the selection process; submission of bids; evaluation and qualification of bids; and adjudication. Article 9 of Peru s State Contracting Law establishes that participants of any of the foregoing selection processes must be registered in the Peruvian National Registry of Suppliers (Registro Nacional de Proveedores) and must not be disqualified from contracting with the state. Article 252 of the Supreme Decree No EF establishes that this registration is renewable as long as a request is submitted to the Peruvian National Registry of Suppliers 60 days prior to expiration of the registry. Bidders may participate in the selection process as part of a joint operation, in which case all members of the joint operation must be registered in the Peruvian National Registry of Suppliers and will be jointly liable for all consequences arising from the joint operation s participation in the selection process and the execution of the agreement. GyM and GMI are registered in the Peruvian National Registry of Suppliers as a construction and a consulting company, respectively. 85
91 Article 40 of the Supreme Decree No EF establishes the types of contracts that may be entered into by public entities: lump-sum (sistema a suma alzada), applicable when the amounts, magnitudes and quality are determined in the terms and conditions of the selection process. The bidder submits its proposal indicating a fixed amount and a term for the completion of the agreement; unit price, rates or percentages (sistema de precio unitario, tarifas o porcentajes), applicable when the nature of the service to be provided does not allow accurate determination of the required quantities; and lump-sum and unit price, rates or percentages mix (esquema mixto de suma alzada y precios unitarios), applicable when accurate determination of the quantities required for some of the components cannot be made. Article 41 of the Supreme Decree No EF establishes that, in the case of goods and works, the terms and conditions of the selection process must indicate the execution type of the agreement as follows: turn-key (llave en mano), when completion is subject to the construction, equipment and operations, and, if applicable, the submission of the technical file in connection with the bidding process; and bid contest (concurso oferta), when completion is subject to the submission of the technical file, the completion of the work or land, as applicable. This completion type is only applicable to lump-sum contracts and public bidding selection process. Peru s State Contracting Supervising Agency (Organismo Supervisor de las Contrataciones del Estado, or OSCE ), a publicsector entity within the Peruvian Ministry of Economy and Finance, supervises and oversees the selection processes carried out by public entities; manages the Peruvian National Registry of Suppliers; imposes penalties to suppliers that violate the provisions set forth in Peru s State Contracting Law, its regulation and other related provisions; and informs the government s General Controller (Contraloría General de la República) regarding violations to the regulation when damages are caused against the state. On July 11, 2014 a new Peru State Contracting Law, approved by Law No (Nueva Ley de Contrataciones del Estado). As established in its Second Supplementary Final Provision, Law No will enter into effect 30 calendar days from the publication of its regulation (expected to be published in the first semester of 2015). Until then, Peru s State Contracting Law and Supreme Decree No EF remains in effect. At this time we do not believe this change in the law will have a material impact on our business. However, the implementing regulation has not been published yet. Regulatory Framework Applicable to Contracts with the Private Sector Parties to a private-sector agreement may freely determine the contract type and its contents as long as it complies with certain legal requirements, including the provisions set forth in Article 1353 of the Peruvian Civil Code. GyM, GMI and Stracon GyM participate in private-sector contracts for engineering and constructions. Construction Activities in Peru Legal Framework Peru s Law for the Promotion of Private Investment in Construction, approved by Legislative Decree No. 727 (Ley de Promoción de la Inversión Privada en Construcción), declared that construction activities in Peru are in the public interest and of preferential national interest. According to Section F of the Fourth review of the United Nations International Statistical Industrial Classification (ISIC), construction activities typically consist of the construction of dwellings, buildings and stores; and the construction of large scale infrastructure projects such as highways, bridges, tunnels, railways, irrigation systems, sewage systems, industrial facilities, pipelines and electric lines, among others. GyM has developed numerous projects in the construction sector. Currently, the company focuses on buildings (ISIC Division 41), civil works (ISIC Division 42) and specialized activities (ISIC Division 43). 86
92 Construction entities must comply with the National Building Regulation, approved by Supreme Decree No VIVIENDA (Reglamento Nacional de Edificaciones), which establishes that urban allotments and buildings must be developed in compliance with the rules governing safety, functionality, accessibility, habitability and environmental impact. According to Article 25 of the National Building Regulation, construction companies, such as GyM and GMI, are responsible for (i) executing works in accordance with project specifications and applicable regulation; (ii) possessing the organization and infrastructure that guarantee the feasibility of the project; (iii) appointing the party responsible for the construction to assume its technical representation; (iv) providing the resources and materials to complete the project pursuant to the terms of the agreement and required standards and within the approved budget; (v) executing subcontracts within contractual limitations; and (vi) delivering to the client documented information regarding the executed works. Notwithstanding any legal actions that the construction company may take against suppliers, manufacturers or subcontractors, the construction company may be responsible for the construction including the work executed by subcontractors and for the use of defective materials or supplies. Penalties for violating the National Building Regulation are determined by the municipal government in the jurisdiction where the project is developed, and set forth in its corresponding regulations. In addition, they may also pursue criminal actions or civil claims if applicable. Safety Regulation in Construction Projects The Law on Safety and Health at Work (Law No ) is intended to promote workplace accident prevention and applies to all business sectors. The principal safety rules applicable to construction projects include the following: companies with 20 or more employees must establish a committee for the promotion of workplace safety and health that oversees the implementation of the required internal safety and health regulation policy; all projects must have a safety and health plan consisting of all the technical and administrative mechanisms to guarantee the physical integrity and health of workers and third parties during project execution; occupational diseases detected during project execution must be recorded and the competent authority must be notified in accordance with the regulation of the Law on Safety and Health at Work, approved by Supreme Decree No TR, and with Occupational Health Manual, approved by Ministerial Resolution No MINSA; companies must provide for medical examinations of its employees prior to, during and at the termination of their employment; companies must show a safety and health plan; an index of frequency; and the company s performance in safety and health in order to be awarded public and private projects; use of individual protective equipment, including gloves, safety goggles, boots and helmets, is mandatory when risks to safety and health cannot be prevented by other means; and personnel responsible for safety must comply with all requirements in Rule NTP for fire prevention. 87
93 The Peruvian Ministry of Labor and Employment Promotion and the Peruvian Ministry of Health are the competent organisms in the safety and health fields, respectively. Safety Regulations Applicable to Subsectors In addition to the Law on Safety and Health at Work applicable to all our business sectors, our Engineering and Construction segment must also comply with the regulations set forth below. Power and Utilities GyM and CAM Peru must comply with the Rules of Safety and Health at Work with Electricity, approved by Ministerial Resolution No MEM-DM, for its activities relating to the construction of hydroelectric plants, transmission lines and substations. OSINERGMIN is the authority responsible for supervising and enforcing compliance of the foregoing rules. The most relevant of the safety rules with which GyM and CAM Peru must comply include: (i) providing employees with necessary information regarding safety measures related to the tasks they perform; (ii) providing employees with adequate safety equipment; and (iii) evaluating and remedying potential sources of danger. Mining GyM and Stracon GyM must comply with the Mining Occupational Health and Safety Regulation, approved by Supreme Decree No EM, and other related regulations for their mining-related construction activities including the construction of mineral processing plants and other mining-related buildings, among others. In developing mining projects, our subsidiaries personnel must follow the safety programs and be familiar with internal rules from their mining client. The Peruvian Ministry of Labor and Employment Promotion and OSINERGMIN are the authorities responsible for supervising and enforcing compliance of the foregoing rules. The most relevant of the safety rules with which GyM and Stracon GyM must comply include: (i) creating an internal safety and health regulation policy and selecting a manager responsible for its implementation; (ii) monitoring and recording workplace accidents and occupational diseases; (iii) providing information to employees regarding the safety risks related to their work; (iv) providing employees necessary first aid and medical attention in the event of a workplace accident; (v) providing employees the necessary tools, equipment or materials to perform their activities safely; (vi) evaluating risks in order to establish accident prevention and mitigation plans. Oil and Gas GyM must comply with the Hydrocarbons Occupational Health and Safety Regulation, approved by Supreme Decree No EM, for its activities relating to the construction of gas processing plants. The Peruvian Ministry of Labor and Employment Promotion is the authority responsible for supervising and enforcing compliance of the foregoing rules. See Infrastructure Peruvian Hydrocarbon Regulation Environmental Regulation for more information on environmental regulation applicable to the oil and gas sector. The most relevant of the safety rules with which GyM must comply include: (i) assuring that senior project managers are responsible for the safety and health of workers; (ii) assigning specialized personnel responsible for safety and health matters; and (iii) monitoring and recording workplace accidents on a monthly basis. Industrial Construction GyM must comply with the Industrial Safety Regulation, approved by Supreme Decree No. 42-F (Reglamento de Seguridad Industrial), for its activities relating to the construction of industrial plants. The most relevant of the safety rules with which GyM must comply include: (i) overseeing that worksites are constructed, equipped and managed to provide security and protection to employees; (ii) instructing employees about risks to which they are exposed related to their work and adopting necessary measures to avoid accidents and damage to employee health; and (iii) overseeing inspections to verify the proper installation of safety equipment. 88
94 Registries and Permits According to Supreme Decree No TR, civil contractors must be registered in the National Civil Construction Works Registry, and comply with the rules of Ministerial Resolution No TR which establishes the requirements for registration, including registering through the corresponding local agency and filing an affidavit indicating compliance with the registration requirements before the effective date of registration. GyM and Stracon GyM are currently registered in the National Civil Construction Contractors and Subcontractor Registry. According to Supreme Decree No EM mining contractors must register with the National Mining Contractors and Specialized Companies Registry. GyM and Stracon GyM are currently registered. Proper registration requires the filing of a request with the Regional Agency of Energy and Mines with jurisdiction in the area where the mining activities will take place. In addition, within five days upon commencement of construction, GyM and Stracon GyM must provide in writing their employees with the following information: (i) the company s legal name; (ii) the scope of the contract; (iii) the place of execution; (iv) the applicable health and safety regulations; (v) the Safe Work Written Procedures (PETS); and, (vi) risk insurance policies. Labor Law Requirements in Civil Construction Labor law requirements in civil construction consist of the specific legal framework for civil construction workers and the general legal framework applicable to the administrative personnel in the civil construction sector set forth in the Single Revised Text of the Labor Productivity and Competitiveness, approved by Supreme Decree No TR. Seasonality of services is one of the main features in the specific legal framework due to the temporary nature of construction contracts. Consequently, certain general rules such as the trial period are not applicable to construction workers. The principal terms and conditions relating to collective bargaining from our civil construction workers have been agreed upon and recorded in the agreement, dated August 16, 2012, and entered into between the Peruvian Chamber of Construction and the Federation of Civil Construction Workers (Federación de Trabajadores en Construcción Civil). The agreement included the following benefits: (i) remuneration increase; (ii) bonuses and premiums rewarding high specialization degrees; (iii) bonuses for workers that work at elevations above 3,000 meters or below zero-level elevation (below a second basement or five meters under the zero-level elevation). The Supreme Decree No SA, Law No and Supreme Decree No SA require construction companies to have complementary high risk insurance for workers that perform high risk tasks. As of the date of this annual report, GyM and Stracon GyM have this insurance coverage. Environmental Regulations Section 24 of the General Environmental Law, approved by Law No (the General Environmental Law ), provides that all human activity likely to cause significant environmental impact is subject of regulation by the National System of Environmental Impact Assessment. The Peruvian Ministry of the Environment, through the Environmental Supervising and Enforcement Agency (Organismo de Evaluación y Supervisión Ambiental, or OEFA ) supervises the compliance and enforces environmental rules related to mining, oil and gas, and electricity. In addition to being responsible for the impact that their activities, by action or omission, may cause the environment, GyM and Stracon GyM are also subject to an environmental impact assessment and must obtain an environmental certification necessary to obtain project permits or licenses. These companies must also adopt measures for the management of hazardous materials intrinsic to their activities to mitigate the negative environmental impact their activities may have. 89
95 Civil Construction The Supreme Decree No VIVIENDA regulates the environmental aspects of projects related to housing, urbanism, construction and sanitation activities in urban or rural areas. The National Directorate of Housing, Urbanism, Construction and Sanitation supervises the compliance and enforces the applicable rules. Projects are categorized according to their environmental impact during and after their execution and different rules are established for each category including compliance with the following environmental studies prior to initiating construction works: (i) projects expected to cause minor environmental impacts require an environmental impact statement; (ii) projects expected to cause moderate environmental impacts require an semi-detailed environmental impact assessment; and (iii) projects expected to cause a major environmental impact require a detailed environmental impact assessment. Other Subsectors Depending on the subsector in which they operate, GyM and Stracon GyM are required to follow specific environmental provisions issued by the competent authorities. Tax Legal Regime Applicable to Construction Section 63 of Peruvian Income Tax Law, approved by Supreme Decree No EF, establishes that construction companies engaged in construction contracts for a period longer than one fiscal year can choose to be taxed under any of the following systems: allocate to each fiscal year the gross income resulting from applying the percentage of gross margin estimated for the work over the amounts collected for the same work; or allocate to each fiscal year the gross income calculated by deducting the costs corresponding to the tasks performed during that year from the amount collected or that is expected to be collected corresponding to that work. In both situations, a special accounting registry must be kept for each project, which is meant to keep a record of the costs, expenses and income of each project in an account separate from the general analytical accounts (cuentas analíticas de gestión). Until December 31, 2012, construction companies could defer revenues related to each individual project until the total completion of the project, provided the project was completed in three years or less. In such cases, the income was to be recognized in the fiscal year in which the project concluded or was delivered. In case the project was scheduled to conclude in a period exceeding three years, the results would be determined in the third year in accordance with the progress of the works over the three-year period. Beginning in the fourth year, results were determined following the foregoing methods. Starting on January 1, 2013, in accordance with Legislative Decree No. 1112, which amended the Peruvian Income Tax Law, construction companies that adopted the deferral method are authorized to continue with the use of such method only with respect to income arising from the execution of work contracts initiated prior to January 1, 2013, until its completion and for execution of work contracts initiated on or after January 1, 2013 the deferral method is no longer accepted. The Peruvian Income Tax Law also provides that the difference that may result from a comparison between the real gross income and the income assessed pursuant to any of the methods described above shall be allocated to the fiscal year in which the work concluded. Additionally, the company must apply the same system to all its construction contracts and must receive prior authorization from tax authorities to change the applied system. Prevention of Money Laundering and Financing of Terrorism Regulations for money laundering and terrorism financing prevention, approved by SBS Resolution No , require construction and real estate companies to implement a money laundering and terrorism financing prevention system, including the appointment of a compliance officer, setting up a registry of operations and notifying the Financial Intelligence Unit of the SBS, the entity responsible for of supervising and enforcing compliance, of any suspicious activity. 90
96 Infrastructure Private Investment in Public Infrastructure and Services In Peru, promotion of private investment in public infrastructure and services is undertaken by Proinversión and commonly awarded through multi-party concession agreements among the concessionaire, Proinversión and the respective public entity. Private investment in public infrastructure is regulated by the Single Revised Text, approved by Supreme Decree No PCM (Texto Único Ordenado or TUO ), and its additional regulation, approved by Supreme Decree No EF. In accordance with the TUO and its regulation, concessionaires are entitled to receive from the state: (i) in the case of selffinancing projects, fees and tolls charged to end-users; (ii) in the case of co-financed projects, subsidies and payments from the public entity awarding the concession; and (iii) any other financing structure agreed upon by the parties. The regulation of private-public partnerships allows public entities to participate, together with private investors, in the development or operation of public infrastructure and services. The regulation of private-public partnerships establishes that projects classified as self-financing and those classified as co-financed must comply with the requirements and procedures set forth in the Public Investment National System Law (Ley del Sistema Nacional de Inversión Pública) and in the Indebtedness National System law (Ley del Sistema Nacional de Endeudamiento) as amended. Each of our subsidiaries Norvial, Survial, Canchaque and GyM Ferrovías has entered into a concession agreement with Proinversión and the Peruvian Ministry of Transport and Communications. La Chira has entered into concession agreements with Proinversión and Sedapal S.A. The abovementioned agreements were entered into in accordance with the provisions set forth in the TUO and its regulation, and with the regulation of private-public partnerships when applicable. Infrastructure Construction and Safety Infrastructure concessionaires must assure that the construction companies they hire to construct infrastructure projects comply with the foregoing rules relating to construction projects. In addition, companies engaged in road construction must comply with the guidelines issued by the Road and Railways General Directorate of the Peruvian Ministry of Transport and Communications and with the National Road Infrastructure Management Regulation regarding road construction, maintenance and safety. These regulations establish procedures for authorizing road construction and approving work contracts, among others. Environmental Regulations Peruvian environmental laws and regulations have become increasingly stringent over the last decade. All industries and projects are subject to Peruvian laws and regulations concerning water, air and noise pollution, and the discharge of hazardous substances. The principal legislation governing environmental matters is the General Environmental Law; the Law of the National System of the Environmental Impact Evaluation, approved by Law No (the SEIA ); the regulations of the SEIA Law, approved by Supreme Decree No MINAM; and several environmental regulations that have been issued under the General Environmental Law, SEIA and other laws by the government with the collaboration of the Peruvian Ministry of the Environment. Since the enactment of the General Environmental Law in October 15, 2005, several technical environmental regulations have been issued and this environmental regulatory framework is generally revised and updated regularly. Some regulations apply generally to Peruvian industries and some technical regulations are issued for specific industries. 91
97 The main environmental rules applicable to infrastructure projects include those described above in Engineering and Construction Environmental Regulation. Peruvian Hydrocarbon Regulation Our hydrocarbon operations are subject to governmental regulations as described below. Exploration and Production GMP is engaged in two major activities relating to the exploration and production of oil and gas: exploration and production of oil fields; and providing services to the oil industry. Exploration and Production of Oil Fields Peru s hydrocarbon legislation regarding oil and gas exploration and production activities includes, among others, the Hydrocarbon Organic Law and the regulations governing the qualification of petroleum companies; the exploration and production of hydrocarbons; the transportation of hydrocarbons; hydrocarbons pipelines and safety requirements in such activities. The foregoing regulations define the roles of Peruvian government agencies which regulate the oil and gas industry; provides the framework for the promotion and development of hydrocarbon activities based on the principles of private-sector competition and access to all economic activities; and sets the safety and security standards as well as the legal proceedings for carrying out operations. The Peruvian Constitution establishes that the government is the sole proprietor of underground hydrocarbons within its national territory. However, the Peruvian government has granted Perupetro, a state-owned company authorized to negotiate and enter into agreements for the exploration and/or production of hydrocarbons, the ownership right over the hydrocarbons extracted which allows Perupetro to enter into such agreements. Furthermore, the Peruvian Ministry of Energy and Mines, the Environmental Evaluation and Supervision Agency ( OEFA ) and OSINERGMIN constitute public entities that play an active role in oil and gas regulation. The Peruvian Ministry of Energy and Mines is responsible for devising energy and mining policies; supervising activities in the energy and mining sectors; and promoting investments in those sectors. Within the Peruvian Ministry of Energy and Mines, the General Directorate of Hydrocarbons ( DGH ) is responsible for regulating the development of oil and gas fields and the General Directorate of Energy-Related Environmental Affairs ( DGAAE ) is responsible for reviewing and approving regulations related to environmental risks associated with hydrocarbon exploration and production activities. OEFA is a public entity ascribed to the Peruvian Ministry of the Environment and is responsible for evaluating and ensuring compliance with applicable environmental rules covering hydrocarbon activities, as well as for sanctioning proceedings. OSINERGMIN is a public entity ascribed to the Presidency of the Council of Ministers office and is responsible for ensuring compliance with safety and security standards in the hydrocarbon industry, as well as for sanctioning proceedings. GMP is subject to the supervision, authority and regulations enacted by the foregoing agencies. Regarding hydrocarbon exploration and production activities, companies are required to enter into either a licensing or a services agreement with Perupetro; other contractual arrangements are permitted with prior approval from the Peruvian Ministry of Energy and Mines. The foregoing agreements are governed by private law and must be approved by the Peruvian Ministry of Energy and Mines and the Peruvian Ministry of Economy and Finance. In licensing agreements, licensees obtain authorizations to explore and produce hydrocarbons in a determined area, are granted ownership over the extracted hydrocarbons and are subject to the payment of royalties. Licensees may trade the hydrocarbons with no limitations on sales prices, except in the event of a national emergency. 92
98 Services agreements grant contractors the right to perform hydrocarbon exploration and production activities in a determined area and receive compensation according to the production of hydrocarbons. The contractor is technically and financially responsible for the operations, but Perupetro maintains the ownership over the hydrocarbons extracted. These are the type of contracts GMP is party to, with respect to Block I and Block V. Services agreements are intended for the development, production and transportation of hydrocarbons, as well as for certain storage activities. Services agreement commonly include a minimum performance schedule guaranteed by performance bonds and require corporate guarantees to be issued to secure the contractor s compliance to the provisions established by the parties. Additionally, a company must be qualified by Perupetro prior to entering into hydrocarbon exploration and production agreements. In order to qualify, a company must meet the standards under the Regulations on the Qualification of Petroleum Companies, requiring companies to demonstrate that they have the technical, legal and financial capacity to comply with all the obligations they will assume under the agreement with Perupetro. Such capacities are measured according to the characteristics of the area to be explored or produced, the expected investment required for the project, and the strict fulfillment of the rules regarding prior consultation, citizen participation and environmental issues related to the operation s performance. Upon a positive evaluation, the company is issued a qualification certificate that allows it to initiate the negotiations of the agreement; notwithstanding the company remains responsible for obtaining all other licenses, permits and approvals required by applicable regulation. Under the current regulation, 30 years is the maximum term of services agreements for the production of crude oil. On the other hand, natural gas and condensates-related services agreement have a maximum term of 40 years. Graña y Montero acts as GMP s guarantor in both our Block I and Block V production services agreements. GMP must comply with Supreme Decree No EM for its activities relating to exploration and production of hydrocarbons. The Peruvian Ministry of Labor and Employment Promotion is the authority responsible for the supervision and enforcement of the foregoing rules. See Infrastructure Peruvian Hydrocarbon Regulation Environmental Regulation for more information on environmental regulation applicable to the oil and gas sector. Services to the Petroleum Industry Peruvian regulation provides that all companies that enter into a service agreement with any company that holds a licensing or services agreement must be registered as a subcontractor in the Hydrocarbons Public Registry in case they render any of the following services: (i) geological studies, geophysical studies, petroleum engineering related to drilling operations, production and well services; or (ii) construction of oil pipelines, gas pipelines, refineries and their maintenance, and specialized transportation by land, air, sea or river. In order to register a company as a subcontractor in the Hydrocarbons Public Registry, prior authorization from the General Directorate of Hydrocarbons ( DGH ) of the Peruvian Ministry of Energy and Mines is required. On June 1, 2004, GMP was included as a subcontractor for the petroleum industry in the Hydrocarbons Registry of Lima s Public Registry of Legal Entities; such registry remains in force as of the date of this annual report. Environmental Regulations The Peruvian Ministry of Energy and Mines is responsible for enacting environmental regulation for the oil and gas sector. The Oil and Gas Environmental Protection Regulation, approved by Supreme Decree No EM, sets out the legal framework and specific rules applicable to the exploration, production, refinement, processing, transportation, commercialization, storage and distribution of hydrocarbons, with the aim of preventing, controlling and remedying the negative environmental impacts arising from the foregoing activities. 93
99 The Peruvian Ministry of the Environment establishes general rules applicable to different activities in several sectors, in contrast to the specific rules enacted by the Peruvian Ministry of Energy and Mines regarding the oil and gas sector. Environmental laws and regulations are enforced by the National Environmental Enforcement Agency, OEFA (Organismo de Evaluación y Fiscalización Ambiental) which was created in Sanctions range from warnings and fines to suspensions of activities and mitigation of environmental damages, among others. In this regard, a breach of the obligations contemplated in the Environmental Impact Assessments in the hydrocarbons sector may originate fines up to 30,000 Tax Units (approximately US$42 million) according to the applicable law. The main environmental rules applicable to GMP s hydrocarbon projects include: filing environmental impact study or adopting the necessary measures to prevent and/or mitigate the environmental impact resulting from their activities; meeting minimum size, environmental and safety requirements applicable to worksites; handling and storing of hydrocarbons pursuant to safety and environmental requirements; establishing programs to monitor environmental issues; and providing training on environmental matters related to employee and personnel activities and responsibilities, especially with respect to regulations and procedures established for environmental protection and the environmental and legal consequences of non-compliance. Operation of Terminals In accordance with the Glossary, Acronyms and Abbreviations for the Hydrocarbons Subsector approved by Supreme Decree No EM, a terminal is a facility that includes storage tanks, submarine lines or docks for receiving or dispatching liquid hydrocarbons and facilities related to activities of storage and reception and/or dispatch of liquid hydrocarbon from/to vessels. Consorcio Terminales is a joint operation among GMP and Oiltanking Peru S.A.C. which currently operates nine of Petroperú s terminals in Peru: (i) the South Terminals of Pisco, Mollendo, Ilo, Juliaca and Cuzco; and (ii) the North Terminals of Eten, Salaverry, Chimbote and Supe. Consorcio Terminales provides hydrocarbons handling and storage services in Peru for gasoline, aviation fuel and diesel, among others. The operation of both the South and North Terminals, was granted through the South Terminal Operation Agreement and the North Terminal Operation Agreement (the Operation Agreements ) dated February 2, 1998, by and among Petroperú and Consorcio Terminales. The Operation Agreements resulted from two tenders in accordance with Legislative Decree No. 674, and mandate that Consorcio Terminales, as operator of the terminals, be responsible for the storage, handling, additivation and dispatch of hydrocarbons in such facilities. The initial term of the Operation Agreements was fifteen years; however the parties agreed to extend the duration of the agreement to an additional eighteen months ending in August The purpose of this extension was to undertake the additional investments that were necessary to satisfy the national demand increase and to perform operative and safety-related improvements to the facilities. In executing its operations, Consorcio Terminales is committed to develop and follow a work program which must include an investment schedule. The work program performed included the installation of fire protection systems and loading systems, among others and was secured by a performance bond. GMP s activities as a part of Consorcio Terminales fall under the scope of the Hydrocarbons Storage Safety Regulation, approved by Supreme Decree No EM. Consorcio Terminales is registered in the Hydrocarbon Registry of OSINERGMIN and is authorized to perform transportation activities such as loading and unloading hydrocarbons from vessels on the terminals. This regulation establishes the conditions under which GMP can operate and maintain storage facilities for hydrocarbons. For instance, the regulation specifies the technical requirements for storage systems, which vary depending upon the kinds of hydrocarbons stored. Moreover, pursuant to this regulation, GMP must establish procedures to minimize potential risks that these facilities present for employees, third parties and properties. 94
100 Gas Processing Plants In accordance with the Glossary, Acronyms and Abbreviations for the Hydrocarbons Subsector, approved by Supreme Decree No EM, a processing plant is a facility where the natural characteristics of hydrocarbons are changed to break them into the different compounds that comprise them, as well as the subsequent transformations to convert the hydrocarbons into fuel of specific qualities and suitable for transportation. This includes the facilities where the impurities, hydrogen sulfide, carbon dioxide, water and hazardous components are removed from natural gas. Our processing and fractionation activities fall under the scope of regulations governing hydrocarbons refinement and processing including regulations on the design, construction, operation and maintenance of refineries and hydrocarbons processing plants, the oil refining process, the manufacture of natural asphalts, oil and lubricants, basic petrochemical activities and the processing of natural gas and condensates. In order to comply with these regulations, GMP must take cautionary measures in order to protect the safety of its employees and its facilities, protect the environment, preserve energy resources and ensure the quality of the products or services it delivers. For instance, GMP s plant operations must be authorized by the General Direction of Hydrocarbons and comply with fire safety regulations. In the event of an accident, GMP must notify the Peruvian Ministry of Energy and Mines, the Peruvian Ministry of Labor and the Peruvian Social Security Administration. Terms of our Concessions Our concessions are subject to certain terms and conditions established in each concession agreement. During the term of the concessions, we are responsible for the construction and maintenance of the infrastructure necessary to their operation. The concession agreements establish minimum capital stock requirements for our concessionaire subsidiaries as follows: US$15 million, US$8 million, US$0.8 million, S/.46 million and S/.100 million for Norvial, Survial, Canchaque, La Chira and the Lima Metro, respectively. The concession agreements establish grounds for termination including mutual agreement of the parties thereto, force majeure and breach of certain contractual obligations. Additionally, in the case of La Chira and the Lima Metro, the agreement can be terminated unilaterally by the grantor, with the payment of compensation. On the expiration date, all of the assets that are essential for the operation of the concession are considered the state s property and no compensation is paid to the concessionaire. In the event that changes in legislation or regulations that are exclusively related to the financial conditions of the earnings and/or costs associated with the investment, operation or conservation of the infrastructure, affect the economic terms of the contract by 10% or more, the concession agreements set forth economic terms adjustment mechanisms aimed at restoring the economic and financial equilibrium. See Infrastructure Principal Infrastructure Lines of Business. Real Estate Since 1987, we have been operating in the Peruvian real estate sector. In 2008, we incorporated Viva GyM to concentrate the group s activities in this sector including promoting and managing real estate projects including affordable housing and housing and commercial real estate projects. Zoning Regulations Article 79 of the Municipalities Organic Law (Law No ) establishes that municipal governments are the exclusive authority responsible for approving urban and rural development plans, as well as the zoning of the urban areas under their jurisdiction. Peruvian regulation establishes that urban zoning refers to the division of a municipal jurisdiction in zones for specific usages, such as residential, commercial, industrial or mixed-use. 95
101 The main zoning rules applicable to our real estate projects include the following: Environmental Regulations The Environmental Protection Regulation for real estate, urbanism, construction and regularization related projects, approved by Supreme Decree No VIVIENDA, sets out to prevent, mitigate, control and remedy negative environmental impacts that may arise from real estate developments. Prior to initiating construction works, companies are required to obtain an environmental authorization from the Housing, Urbanism, Regularization or Construction National Directorate of the Peruvian Ministry of Housing, Construction and Sanitation and to comply with the provisions set forth in the corresponding environmental impact assessment. Licenses obtaining a construction license from the corresponding local municipality before commencing construction, reconstruction, conservation or repair of any property; and obtaining an inspection certificate issued by National Institute of Civil Defense ( INDECI ), the entity in charge of supervising that companies comply with the National Construction Regulation nationwide. The main environmental rules applicable to our real estate projects include the following: undertaking an environmental impact assessment; and requesting the environmental classification of our projects, which depends on the environmental risks associated therewith. Article 10 of the Regulation of Urban Habilitation and Buildings Law, approved by Law No , establishes the license requirements for urban habilitation and construction, depending on land size, the dimensions of the work to be undertaken and the financial target. met: Upon completion of the real estate development and construction, as the case may be, the following requirements must be for urban development, the reception of the works (recepción de la obra) must be requested to the corresponding municipal government in compliance with Article 19 of the Habilitation and Construction Law; and for construction, the conformity of the works (conformidad de obra) must be requested to the corresponding municipal government in compliance with Article 28 of the Habilitation and Construction Law, accompanying the request with the construction plans and the construction statement (a description of the technical conditions and characteristics of the work performed). Exclusive and Common Property Real Estate Units Regimes The Regularization Buildings Factory Declaration Proceeding and Real Estate Units Regimen of Exclusive and Common Property Law, approved by Law No , establishes the legal regime applicable to real estate comprised of assets with exclusive and common property, including, among others, (i) apartment buildings; (ii) condominiums; (iii) units under co-ownership; and (iv) commercial spaces, such as galleries and malls. The foregoing construction projects must include internal by-laws prepared or approved by the sponsor or builder, or by the owners with the vote of the majority of participating owners, the content of which is regulated in Article 42 of the Regularization Buildings Factory Declaration Proceeding and Real Estate Units Regimen of Exclusive and Common Property Law. Articles 40 and 41 of the foregoing law itemize the assets and services that qualify as common. 96
102 Owners of the real estate units have the opportunity to choose between the exclusive and common property regime, and the independent and co-ownership regime. The internal by-laws, the owner s assembly minutes, all construction plans, architectural division plans, perimetric boundaries and the construction statement must be registered in the Real Estate Registry of the corresponding jurisdiction. Upon completion of the proper registries, units are registered independently from one another. Fondo Mivivienda The acquisition of affordable housing units developed by Viva GyM is often financed by Fondo Mivivienda S.A., a publicly owned financial institution established in 1998 by Law No , with the purpose of (i) promoting and financing the acquisition, bettering and construction of houses, especially those of social interest; (ii) carrying out activities related to the fostering of capital flows to the housing financing market; (iii) participating in the primary and secondary markets of mortgage credits; and (iv) contributing to the development of the capital markets. Prevention of Money Laundering and Financing of Terrorism SBS Resolution No , as amended from time to time, requires construction and real estate companies to implement a money laundering and terrorism financing prevention system, including appointing a compliance officer, setting a registry of operations and notifying the Financial Intelligence Unit of the SBS, the entity responsible for supervising and enforcing compliance to the resolution referred to herein, of any suspicious activity. Technical Services Public- and Private-Sector Contracts Concar provides services in compliance with Peru s State Contracting Law and its regulation, approved by Supreme Decree No EF, as amended, when dealing with public counterparties; and with the regulation set forth in the Civil Code when dealing with private counterparties. Such regulations establish the different types of selection processes which companies may undergo when contracting with the state, as well as the rules and conditions applicable to such processes. They also establish general rules applicable to contractual relationships among private parties. See Engineering and Construction for more information on the applicable legal frameworks. Concar is registered with the Peruvian National Registry of Suppliers, required to act as supplier for public entities. Intellectual Property Certain operations of GMI and GMD are protected by Peruvian Copyright Law, approved by Legislative Decree No. 822, specifically the engineering drawings and software registered in the INDECOPI Copyright Registry. However, the company s business and profitability are not dependent on patents or licenses; industrial, commercial or financial contracts; or new manufacturing processes. Dimension Testing Services CAM Peru S.R.L. provides the dimension testing service of electrical meters, for which it must be a registered testing entity as provided by Technical and Commercial Regulations Commission Resolution No /INDECOPI-CRT. As of the date of this annual report, Cam Peru S.R.L, is registered as an accredited dimension testing of electrical meters services provider. The pertaining registration can be renewed for consecutive periods, provided that a request is filled 60 days prior to expiration. If Cam Peru S.R.L. does not comply with the rules approved by the INDECOPI, said governmental authority may impose a suspension or revoke the registry. 97

103 C. Organizational Structure The following organizational chart sets forth our principal operating subsidiaries within our four business segments. The following charts set forth the principal activities of each of our four business segments: The following is a brief description of our principal operating subsidiaries: Engineering and Construction: GyM S.A. ( GyM ), incorporated in Peru, is one of the oldest and largest construction companies in Peru. Graña y Montero owns 98.2% of GyM; the remaining 2.0% is held by former and current company executives. Stracon GyM S.A. ( Stracon GyM ), incorporated in Peru, provides services to the mining and construction industries. GyM owns 87.6% of Stracon GyM; the remaining 12.4% is held by the current chief executive officer of Stracon GyM. Vial y Vives - DSD S.A. ( Vial y Vives - DSD ), incorporated in Chile, is an engineering and construction company specialized in the mining sector and in providing services to the energy, oil and gas, and cellulose sector. GyM owns 82.0% of Vial y Vives - DSD; Inversiones VyV S.A., a company controlled by the founders of Ingeniería y Construcción Vial y Vives S.A. (now Vial y Vives - DSD) who owns 12.2%; and the remaining 6.8% is held by third parties. GMI S.A. ( GMI ), incorporated in Peru, is primarily engaged in engineering consultancy for projects in the mining, hydrocarbons, electrical, agricultural, industrial, tourism and transportation sectors. Graña y Montero owns 89.4% of GMI; 4.0% is held by current and former company executives; and the remaining 6.6% is held by third parties. 98
104 Morelco S.A. ( Morelco ), incorporated in Colombia, is a recognized specialist in electromechanical assemblies, civil works, and services for the oil and gas and other energy sectors. Our subsidiary GyM S.A. owns 70.0% of Morelco, and the remaining 30% is held by the Serna family in trust. Infrastructure: Toll Roads: Norvial S.A. ( Norvial ), incorporated in Peru, is the concessionaire of the 183 km stretch between Ancón and Pativilca of the Panamericana Norte road. Graña y Montero owns 67.0% of Norvial and JJC Contratistas Generales S.A., a Peruvian construction company, owns the remaining 33.0%. Survial S.A. ( Survial ), incorporated in Peru, is the concessionaire of the 750 km highway between Marcona and Urcos in Peru. Graña y Montero owns 99.9% of Survial. Concesión Canchaque S.A.C. ( Canchaque ), incorporated in Peru, is the concessionaire of the 78 km highway between the towns of Buenos Aires and Canchaque in Peru. Graña y Montero owns 99.97% of Canchaque. Concesionaria Vía Expresa Sur S.A. ( Vesur ), incorporated in Peru, is the concessionaire of the Via Expresa Sur highway which will connect downtown Lima city and the Panamericana Sur highway, through 4.5 kms. including 5 bridges, 2 connecting lines, 6 entrance ramps and 5 exit ramps. Graña y Montero owns 100% of Vesur. Mass Transit: GyM Ferrovías S.A. ( GyM Ferrovías ), incorporated in Peru, is the concessionaire of the Lima Metro. Graña y Montero owns 75.0% of GyM Ferrovías; the other 25.0% is held by Ferrovías Participaciones S.A., a railway infrastructure company. Water Treatment: Concesionaria La Chira S.A. ( La Chira ), incorporated in Peru, is the concessionaire of La Chira waste water treatment plant in southern Lima, Peru. Graña y Montero owns 50.0% of La Chira; the other 50.0% is held by Acciona Agua S.A, an affiliate of a waste water treatment and distribution company. Energy: Real Estate: GMP S.A. ( GMP ), incorporated in Peru, is engaged in the oil and gas business and currently provides hydrocarbon extraction services to Perupetro S.A., a Peruvian state oil company; owns a gas processing plant; and, through a joint operation with a Peruvian affiliate of Oiltanking GmbH, operates nine fuel terminals in Peru. Graña y Montero owns 95.0% of GMP; the remaining 5.0% is held by a company executive. Viva GyM S.A. ( Viva GyM ), incorporated in Peru, is focused on the development and sale of affordable housing and housing, as well as other real estate projects such as office buildings and shopping centers. Graña y Montero directly owns 60.6% of Viva GyM, with GyM owning an additional 39.0%; and the other 0.4% is owned by a company executive. 99
105 Inmobiliaria Almonte S.A.C. ( Almonte ), incorporated in Peru, is a real estate company which owns 800 hectares of land in southern Lima. Viva GyM owns 50.4% of Almonte; Inversiones Sur S.A., which is part of a Chilean economic group, owns 22.0%; and the other 27.6% is owned by third parties. Technical Services: GMD S.A. ( GMD ), incorporated in Peru, is a provider of IT services and business solutions. Graña y Montero owns 89.1% of GMD; 5.5% is held by company executives; and the remaining 5.5% is held by one of our directors. Concar S.A. ( Concar ), incorporated in Peru, is engaged in the operation and maintenance of infrastructure assets. Graña y Montero owns 99.7% of Concar. CAM Chile S.A. ( CAM ), incorporated in Chile, provides field and specialized electrical services in Chile as well as in Brazil, Colombia, and Peru. Graña y Montero owns 75.0% of CAM; and the other 25% is held by El Condor Combustibles S.A., which is part of a Chilean economic group. Other: Tecgas N.V. ( Tecgas ) is the current operator of Transportadora de Gas del Perú and owns 100% of shares of Compañía Operadora de Gas del Amazonas ( COGA ). Graña y Montero owns 51.0% of Tecgas, while Enagas International, S.L. ( Enagas ) holds a 30.0% interest and Canada Pension Plan Investment Board ( CPPIB ) maintains 19.0% of the participation. D. Property, Plant and Equipment Approximately 73% of our assets is located in Peru, with the balance located primarily in Chile. At December 31, 2014, the book value of all our land (excluding real estate inventories) and buildings, machinery and equipment was US$384.3 million. We currently lease certain machinery and equipment from vendors. The term of our leasing contracts ranges from two to five years, depending on the nature of the equipment. Leased machinery and equipment are capitalized for accounting purposes. Our principal executive offices, which we lease, are located at Av. Paseo de la República 4667, Surquillo, Lima 34, Peru. Insurance and Contingency Planning We have insurance coverage for fire; strike, riot, malicious damage, vandalism and terrorism; loses or damages to construction machinery and equipment; destruction or disappearance of property; civil liability, including physical harm to third parties; professional liability; transportation; vehicle theft, collision, rollover, fire and accidents; and directors and officers liability. Additionally, we carry different policies for specific risks related to our business segments. Our management considers this coverage to be sufficient to cover probable losses and damages, taking into consideration the nature of our activities, the risks involved in our transactions and the advice of our insurance brokers. We also have contingency plans in place in order to protect our company and the interests of our clients. In the event of an emergency, we have procedures in place designed to minimize any resulting interruption in service to our most critical business processes. Moreover, in the event of an emergency, we have systems and procedures in place that minimize the impact of unplanned downtime to our IT services clients. Our data centers have redundant facility systems and infrastructure to provide continued operation on each of them, complying with international standards such as ISO/IEC and ISO
106 ITEM 4A. Unresolved Staff Comments Not applicable. ITEM 5. OPERATING AND FINANCIAL REVIEW AND PROSPECTS The following discussion should be read in conjunction with our consolidated financial statements included in this annual report,, which have been prepared in accordance with IFRS issued by the IASB. The following discussion contains forward-looking statements that involve risks and uncertainties. Our actual results may differ materially from those discussed in the forward-looking statements as a result of various factors, including, without limitation, those set forth under Part I. Introduction Forward-Looking Statements and Item 3.D. Key Information Risk Factors. A. Operating Results Overview We are the largest engineering and construction company in Peru as measured by revenues during 2014, and the largest publicly traded engineering and construction company in Latin America as measured by market capitalization as of December 31, 2014, with strong complementary businesses in infrastructure, real estate and technical services. With more than 80 years of operations, we have a long track record of successfully completing the engineering and construction of many of the country s landmark private and public sector infrastructure projects. Beginning in the mid-1980s, we decided to leverage our engineering and construction expertise into complementary lines of business. We have also undertaken the engineering and construction of large and complex projects outside our home market throughout our history. More recently, we decided to expand our activities into other key markets of the Latin American region through the acquisition of businesses with solid positions in those markets. Factors Affecting Our Results of Operations General Peruvian and Chilean Economic Conditions 82.7%, 85.0% and 80.1% of our revenues in 2012, 2013 and 2014 were derived from activities in Peru. Accordingly, our results of operations are substantially affected by economic conditions in the country and our growth is driven in significant part by growth in the Peruvian economy. In addition, 12.6%, 10.6% and 14.4% of our revenues in 2012, 2013 and 2014 were derived from activities in Chile. Our percentage of Chilean revenues has grown as a result of our acquisition of Vial y Vives in October 2012 and DSD Construcciones y Montajes in August We expect our revenues from Colombia to grow in the future as a result of our acquisition of Morelco in December The Peruvian economy has been one of the fastest growing economies globally over the past decade, with the Peruvian real GDP growing at an average rate of 4.6% during the three years from 2012 to 2014 as a result of, among other factors, robust domestic demand and increased private and public investment. With increasing disposable income and an expanding middle class, private consumption grew at an average annual rate of 5.0% in real terms from 2012 to In 2012 and 2013 private investment increased at an average rate of 13.6% and 4.3% in real terms, respectively, driven by an increase in projects primarily in the mining, oil and gas, energy, transportation, telecommunications and manufacturing sectors. In 2014, private investment decreased at an average rate of 1.5% in real terms primarily due to lower investment in mining. Inflation in Peru, as measured by the change in the consumer price index, was 2.6% in 2012, 2.9% in 2013 and 3.2% in The nuevo sol appreciated versus the U.S. dollar by 5.4% in 2012, and depreciated by 9.6% in 2013 and 6.9% in Given its recent performance with regard to fiscal balance, debt/gdp ratio, net reserves and high liquidity, Peru s sovereign debt is rated investment grade and was upgraded to BBB+ by S&P and Fitch in August 2013 and October 2013, respectively, and Baa2 by Moody s in August According to the IMF the Peruvian economy is projected to grow at rates of 3.5% and 4.9% in 2015 and 2016, respectively. 101
107 The Chilean economy grew at an average annual rate of 3.9% during the three years from 2012 to 2014 in real terms, mainly driven by strong domestic demand. Total fixed investment grew at an annual average rate of 1.1% in real terms during the three years from 2012 to Inflation in Chile, as measured by the change in the consumer price index, was 1.5% in 2012, 3.0% in 2013 and 4.6% in The Chilean peso fluctuated versus the U.S. dollar, increasing by 8.2% in 2012 and decreasing 9.4% in 2013 and 16% in Chilean sovereign debt was rated A+ by Fitch in October 2013, AA- by S&P in December 2013 and Aa3 by Moody s in October 2013, the highest sovereign debt ratings in Latin America. From 2010 to 2014 our revenues grew at a CAGR of 29.4% (23.0% excluding acquisitions) under IFRS. Our organic revenues grew 10.6% in 2014 from We expect, but cannot assure you, that in the future our business will tend to grow in line with the performance of and investment in the end-markets we serve. Fluctuations in Exchanges Rates We estimate that in 2014, 37.2%, 55.7% and 7.1% of our revenues were denominated in nuevos soles, U.S. dollars and other currencies (principally Chilean pesos), respectively, while 70.1%, 23.1% and 6.8% of our cost of sales during the year were denominated in nuevos soles, U.S. dollars and other currencies. In addition, as of December 31, 2014, 44.7%, 47.8% and 7.5% of our total debt was denominated in nuevos soles, U.S. dollars and other currencies, respectively. Accordingly, fluctuations in the value of these currencies can materially affect our results of operations. When the nuevo sol appreciates against the U.S. dollar, our operating margins tend to decrease; when the nuevo sol depreciates against the U.S. dollar, our operating margins tend to increase. Conversely, the appreciation of the nuevo sol against the U.S. dollar tends to decrease our indebtedness and financial expenses as expressed in nuevos soles; and the depreciation of the nuevo sol against the U.S. dollar tends to increase our indebtedness and financial expenses as expressed in nuevos soles. We enter into derivatives, from time to time, to hedge part of our financial exposure to currency fluctuations. The value of the nuevo sol to the U.S. dollar appreciated in 2012 and depreciated in 2013 and 2014, which impacted our results of operations. See Item 3.A. Key Information Selected Financial Data Exchange Rates. We have included estimates of the approximate effects of fluctuations in exchange rates on our consolidated and segment revenues and costs of sales in Results of Operations. These estimates were calculated based on daily average exchange rates and estimated aggregate revenues and cost of sales denominated in U.S. dollars and Chilean pesos, and were not calculated on a transaction by transaction basis. For additional information on the effect of exchange rate fluctuations on our results of operations, see Item 11. Quantitative and Qualitative Disclosures about Market Risk Exchange Rate Risk. Cost of Labor, Third Party Services and Inputs The largest components of our costs are: labor, which in 2014 represented 30.8% of our cost of sales and 49.8% of our administrative expenses; services provided by third parties, which in 2014 represented 34.8% of our cost of sales and 28.6% of our administrative expenses; and inputs (including raw materials), which in 2014 represented 19.0% of our cost of sales. For a breakdown of our cost of sales and administrative expenses, see note 25 to our audited annual consolidated financial statements included in this annual report. Our cost of labor is influenced by, among other factors, the number of our employees, as well as inflation, competition we face for personnel in each of our business segments and the availability of qualified candidates. From 2012 to 2013 our personnel charges increased by 4.7% and from 2013 to 2014 our personnel charges increased by 22.1%. Services provided by third parties include: subcontracting in our E&C segment, such as carpentry work; advisory and consultancy work, including external audit and legal services; and renting of equipment. From 2012 to 2013 our costs related to services provided by third parties increased by 9.4% and from 2013 to 2014 our costs related to services provided by third parties increased by 38.5%. The principal inputs we use are fuel, cement and steel, which in the aggregate represented a majority of our total input costs in Our costs for these inputs are affected by, among other factors, the growth of our operations, market prices, including global prices in the case of fuel, and transportation costs. We do not have long-term contracts for the supply of our key inputs. From 2012 to 2013 our input costs decreased by 0.4% and from 2013 to 2014, our input costs increased by 1.1%. 102
108 Acquisitions We acquired a 75.0% interest in CAM in February 2011 for US$10.8 million, after post-closing adjustments. In 2011, as a result of the excess of the fair value of the assets and liabilities we acquired in the CAM acquisition over the consideration paid, we recognized a gain of S/.45.2 million, which is reflected in gain from business combination. In 2012, 2013 and 2014, we reversed provisions amounting to S/.68.0 million, S/.13.7 million and S/.9.4 million, respectively, relating to labor and tax contingencies and trade liabilities that we had reflected on our balance sheet in connection with the CAM acquisition because we determined that the underlying contingencies and liabilities had become remote, expired or been resolved; these reversals are reflected under other income (expenses). For further information, see notes 27 and 31 to our audited annual consolidated financial statements included in this annual report. In addition, we acquired a 74.0% interest in Vial y Vives in October 2012 for US$55.6 million and an additional 6.4% interest in Vial y Vives between June and August 2013 for US$3.4 million. Accordingly, Vial y Vives results are only fully reflected in our results of operations for two months in 2012 and for the full year in The inclusion of Vial y Vives further increased and diversified our revenues, in addition to complementing our expertise in the E&C mining sector; however, the historic operating margins of Vial y Vives have tended to be lower than those of our E&C segment because of its relatively higher administrative expenses. In August 2013, we acquired an 86.0% interest in DSD Construcciones y Montajes for US$37.2 million. DSD Construcciones y Montajes is an entity domiciled in Chile whose main business activities are electromechanical works and assemblies in construction projects of oil refineries, pulp and paper, power plants and mining plants in Chile and Latin America. This acquisition is part of our plan to increase our presence in markets that present high growth potential, such as Chile, and in attractive industries, such as energy and mining. Accordingly, DSD Construcciones y Montajes results are only reflected in our results of operations for four months in 2013 and for the full year in In 2014, Vial y Vives - DSD represented 9.7% of our consolidated revenues, 10.9% of our consolidated gross profit and 8.4% of our consolidated operating income. In December 2013, we acquired an additional 16.9% interest in Norvial from the former shareholder Besco S.A. for S/.51.4 million (US$18.4 million), increasing our stake in Norvial to 67.0%. In November 2014, we acquired an additional 13.5% interest of Stracon GyM for S/.74.7 million (US$25 million), increasing our stake in Stracon GyM to 87.6%. In March 2014, we acquired control of Coasin for an amount of US$2.1 million. In December 2014, we acquired a 70% interest in Morelco for S/ million (US$93.7 million). Morelco is an engineering and construction company focused in the Colombian oil and gas and other energy sectors. This transaction represents our first acquisition in Colombia, which is a key part of our international strategy. The results of Morelco are expected to impact our results of operations beginning in In December 2014, we acquired 51% of the share capital of Tecgas, which holds 100% the share capital of COGA for a total of S/.75.8 million (US$25.4 million). This investment includes goodwill resulting from the purchase amounting to S/.61.4 million. COGA is a jointly controlled entity and accordingly we will reflect its results in Share of the profit or loss in associates and joint ventures under the equity method of accounting. For a description of our alliance with CCPIB, see Item 4.B. Information on the Company Business Overview Infrastructure. Cyclicality Our Engineering and Construction segment is cyclical as a result of being closely linked to the conditions, performance and growth of the end-markets we serve, which include, among others, the mining, power, oil and gas, transportation, real estate and other infrastructure sectors in Peru, as well as the mining sector in Chile and, in the future, the energy sector in Colombia. These industries tend to be cyclical in nature and tend to be affected by factors such as macroeconomic conditions, climate conditions, the level of private and public investment, the availability of credit, changes in laws and regulations and political and social stability. As a result, although downturns impact our entire company, our Engineering and Construction segment has historically been subject to periods of very high and low demand. For example, between 2000 and 2003, there was a significant decline in 103
109 activity in the Peruvian real estate and construction sectors, which consequently affected our and our competitors business and financial performance during that time. The mining and oil and gas sectors, in particular, are also driven by worldwide demand for the underlying commodities, including, among others, silver, gold, copper, oil and gas, which can be affected by such other factors as global economic conditions and geopolitical affairs. Furthermore, prevailing prices and expectations about future prices for minerals or oil and gas, costs of exploration, production and delivery of product and similar factors can have a significant impact on our clients exploration and production activities and, as a result, on their demand for our engineering and construction services. Our Real Estate segment is also cyclical and is significantly affected by changes in general and local economic conditions, such as employment levels and job growth, availability of financing for home buyers, interest rates, foreclosure rates, inflation, consumer confidence and housing demand. In addition, in our Infrastructure segment, our Energy line of business is cyclical and affected by global supply and demand for oil. Seasonality Our business, on a consolidated basis, has not historically experienced seasonality. In our Infrastructure segment, we have experienced moderate seasonality at (i) Norvial, due to heightened vehicular traffic activity during the summer season in the first quarter of the year, and (ii) GMP s gas processing plant, which typically closes for maintenance during the rainy season in the first quarter of the year, as demand for gas is lower during this time. Engineering and Construction The principal driver of our E&C results is economic growth in Peru, particularly private and public investment in the country s mining, power, oil and gas, transportation, real estate and other infrastructure sectors. See Peruvian and Chilean Economic Conditions. Appropriate pricing and budgeting of our engineering and construction projects is also key to our results of operations in our E&C segment and can be affected by such factors as competition, direct negotiations with clients as opposed to competitive bidding processes, the accuracy of our estimation of project costs and unexpected cost overruns. The types of contracts in this segment consist of cost-plus fee, unit price, lump-sum and EPC contracts. For a description of our E&C contracts, see Item 4.B. Information on the Company Business Overview Engineering and Construction Contracts. The nature of our contractual arrangements can affect our margins, both because, depending on the type of contract, the burden of cost overruns may be placed on the client or on us, and because certain contractual arrangements tend to have lower gross margins. For the years from 2012 to 2014, our E&C segment has trended towards contractual arrangements that pose less risk for us (i.e., cost plus fee and, to a lesser extent, unit price), which provide more stability to our results but lower gross margins. The types of contractual arrangements we enter into in our E&C segment vary significantly from period to period. Infrastructure Traffic and Fees for Toll Roads The majority of our toll roads revenues derive from the Norvial concession. Unlike our other toll road concessions, our revenues from the Norvial concession depend on traffic volume. Traffic volume on the Norvial road increased 5.0% from 2012 to 2013 and 2.4% from 2013 to 2014 (based on vehicle equivalents, as defined in Item 4.B. Information on the Company Business Overview Infrastructure Principal Infrastructure Activities Toll Roads Norvial ) and such increases are largely driven by economic activity levels in Peru. For the Norvial toll road, the toll rate is set out in the Norvial concession agreement and adjusted in accordance with a contractual formula that takes into account the nuevo sol/u.s. dollar exchange rate and Peruvian and United States inflation. Under our Survial and Canchaque road concessions, our revenues consist of annual fees paid by the Peruvian Ministry of Transport and Communications in consideration for the operation and maintenance of the roads, which can vary depending on the amount of road maintenance required due to road wear and tear. 104
110 Under the Norvial concession, we are required to expand certain stretches of the highway, by, among other things, adding two additional lanes. The first stage of construction was completed in 2008 and the second stage started on April 2014 and is expected to be completed in first quarter of We estimate that Norvial s capital investment for the second stage will be approximately US$105 million. On August 8, 2013, we obtained a 40-year term concession for designing, financing, building, operating and maintaining the infrastructure associated with the Vía Expresa Sur project. This project involves the second stage expansion of the Via Expresa - Paseo de la República, between Av. República de Panamá and Panamericana highway. The estimated investment in this concession is expected to be US$196.8 million. The contract gives us the right to charge public service users according to a pre-defined price list; however, the grantor (government) has agreed to pay the difference if the revenues generated during the operation stage are lower than US$18 million in the first two years and US$19.7 million from the third year until the fifteenth year. Revenue for the construction activities and other initial activities are accounted for as a financial asset for the portion that the government guarantees, and as an intangible for the unguaranteed investment. Mass Transit We generate revenue from our Lima Metro concession based on kilometers travelled per train, with the fee per kilometer, the number of trains required to be in operation and the number of kilometers that we are required to travel established by the terms of the concession. Our revenues do not depend on passenger traffic volume. Our results in this concession between 2012 and 2014 were influenced by the timely acquisition, set up, reliability and proper operation of our trains as well as by the timing of the government s completion of the 12.1 kilometer second stretch of Line One. In 2012, we generated losses as a result of the limited number of trains (five) we initially operated. In 2013, we also generated losses as a result of delays in the start of operations of new trains, which was postponed because of delays in approvals from the Ministry of Transportation. However, during the fourth quarter of 2013, with a larger quantity of trains in operation, our results improved and generated operating profits for the year. We currently have all 24 trains in operation (including two backup trains). In addition, the second tranche of Line One was completed in the third quarter of As of December 31, 2014, GyM Ferrovías has spent a total of S/ million (US$196.6 million) in capital expenditures in connection with the Lima Metro. Energy A significant part of the revenues in our Infrastructure segment depends on global prices for oil. Under our hydrocarbon extraction service contracts, we are entitled to a variable fee, which is based on the level of production of each field and a basket of international crude oil prices. Historically, oil prices have been volatile and are likely to be volatile again in the future. During 2012, 2013 and 2014, average Brent crude prices were approximately US$111.65, US$ and US$99.02 per barrel and the average fee we received in these years was US$86.13, US$84.99 and US$77.33 per barrel of extracted oil, respectively. Because our activities are conducted in mature oil fields, which have been producing oil for over 100 years in the case of Block I and over 50 years in the case of Block V, our oil production depends primarily on the level of our capital expenditures undertaken for drilling and production purposes. On April 5, 2015, we began oil and gas production in Blocks III and IV, and, as a result, we expect energy revenues to increase. Conversely, global oil prices have decreased significantly in recent months, with the average Brent crude price in March 2015 declining to US$55.79 per barrel. Our gas processing plant has a long-term delivery and gas processing and fractionation contract with Empresa Eléctrica de Piura S.A. ( EEPSA ), a thermal power generation subsidiary of the Endesa group. Under the contract, EEPSA delivers wet natural gas that it purchases from onshore and offshore gas operators in the area. We are responsible for all operating costs of the gas processing plant but are entitled to keep revenues from the sale of all resulting natural gas liquids to third parties after delivery of all dry gas and payment of a variable royalty to EEPSA. Volumes processed by our gas processing plant depend upon gas volumes demanded by EEPSA for its gas-fired turbines, which can vary significantly. Prices for natural gas liquids can also fluctuate significantly and are affected by market prices for crude oil. We processed 26.3 MMcf per day during 2012, 18.1 MMcf per day during 2013 and 27.3 MMcf per day during Volumes processed by our gas processing plant ultimately depend upon gas volumes demanded by EEPSA for its gas-fired turbines. These volumes vary per month and depend upon the power dispatch curve of EEPSA among Peruvian power generation plants. In rainy months (December to April) where hydroelectric power generation in Peru is typically higher, gas volumes demanded by EEPSA are lower than in dryer months (May to November) in which activity of thermal generators tends to be higher. 105
111 In connection with our fuel storage terminal business, under a contract with Petroperú, we receive revenues related to monthly reserved volume in storage tanks for refined crude products (storage fee) and for volumes loaded and delivered into railroad cars or cistern trucks to each terminal (throughput fee). These fees are adjusted annually to account for U.S. inflation. Our fuel storage activities in the North and Central terminals are carried out under 20-year contracts, which expire in 2034; however, our contract for the operation of the South terminals expires in August Awarding and Timing of Infrastructure Concessions and Government Contracts The results of operations of our Infrastructure segment are affected by our ability to win new concessions and government contracts, which depend in part on government policies and our ability to compete effectively. As of December 31, 2014, we have seven concessions as well as long-term government contracts in this segment, including the concession for Via Expresa Sur, the terms of which was agreed in August 2013 and the concession for Chavimochic, which was agreed in May Joint operations in which we participate have been awarded one additional concession for Via Expresa Javier Prado for the expansion of another major highway within the city of Lima and we are currently awaiting for the preparation of new studies related to traffic volumes which have been requested by the Peruvian Ministry of Economy and Finance prior to the project s approval. We believe this concession will increase the results of operations of our Infrastructure segment. However, we cannot assure you that we will be able to negotiate this contract on favorable terms or at all. In addition, our government contract to operate the South fuel storage terminal is scheduled to expire in August 2015, and we cannot assure you that it will be extended or renewed on favorable terms or at all. Our results in our Infrastructure segment are also affected by the timing of the commencement of operations under our concessions, as well as when we were required to undertake significant capital investments or major construction works under the terms of our concessions. Under our Norvial and Lima Metro concessions, we are required to undertake capital investments during the initial years of the concessions for which we are compensated throughout the term of the concessions by our toll rate in the case of the Norvial concession and tariffs in the case of the Lima Metro concession. Under our Survial, Canchaque and La Chira concessions, we generate revenues in our Infrastructure segment from our construction activities during the pre-operational phase, and once operations commence we generate revenues from fees related to operation and maintenance. Survial, Canchaque and La Chira have financed their construction costs through the sale of government certificates of construction to financial institutions at a discount from face value. Certificates of construction are negotiable instruments that the Peruvian government typically delivers upon completion of each stage of a project and which entitle the holder to receive payment from the government equal to the capital investment made in the corresponding stage upon completion of the entire project. Accordingly, the results of our Infrastructure segment may be affected by the discount rates obtained on the sale of government certificates of construction. For more information on our obligations and compensation under our concessions, see Item 4.B. Information on the Company Business Overview Infrastructure. Real Estate The results of operations of our Real Estate segment are driven by the number of units we develop and deliver in a reporting period, our mix of unit sales (affordable housing versus housing), unit prices, land purchase prices and our costs of construction. These results are also affected by a number of factors that may impact the Peruvian real estate sector as a whole, including: the availability of government subsidies for affordable housing; prices of suitable land in particular areas; regulation of real estate development imposed by national, regional and local laws and regulators, and the time required to obtain applicable construction permits and licenses; the unemployment rate and wage levels; prevailing interest rates and availability of financing; the supply in the market; the level of customer interest in our new projects; and our costs, such as the price of labor, materials, insurance, taxes and other public charges. We delivered 1,368, 1,757 and 831 units in 2012, 2013 and 2014, respectively. In 2014, the delivery of real estate units was impacted by deceleration of economic growth in Peru. The results of operations of our Real Estate segment are also significantly affected by our sales of land parcels. Due to the appreciation of land prices in Peru, and because we record our land holdings at book value (i.e., without marking to market), our recent land sales have resulted in high margins. 106
112 In addition, the net profit attributable to controlling interests of our Real Estate segment is significantly affected by the financing and commercial arrangements we use to purchase land and to develop real estate projects. Depending on the level of noncontrolling interests used to finance our real estate projects, our Real Estate segment tends to have significant net profit attributable to non-controlling interests. See Results of Operations General Real Estate. Technical Services The results of operations of our Technical Services segment, especially our activities relating to IT and electricity networks services, are affected by the economic growth of the countries in which we operate. As companies expand in response to economic growth, they tend to outsource certain activities in order to focus on their core businesses. Our results in the operation and maintenance of infrastructure assets depend on our ability to obtain contracts from the government or infrastructure concessionaires, such as those in our Infrastructure segment, which depend on government policies and our ability to compete effectively. We obtained three public-sector road contracts at the end of 2010 as well as three new public-sector road contracts at the end of 2012; however, two public sector road contracts expired in December 2012 and were not renewed until May and June, respectively, of 2013, and, as a result, impacted our results of operations during We had one of the contracts with a regional government terminated in 2014, which impacted our results of operations for the year. We typically obtain higher revenues from these contracts during the commencement of services as we bring the road to proper operating condition, and lower revenues at the end of the contract term as services wind down. Critical Accounting Estimates and Judgments Estimates and judgments used in connection with the preparation of our financial statements are continuously evaluated and are based on historical experience and other factors, including expectations of future events that are believed to be reasonable under the circumstances. Critical Accounting Estimates and Assumptions We make estimates and assumptions concerning our future economic performance. These estimates and assumptions are required to be made because the information used in the presentation of the financial information is currently not available, is dependent on future events, or cannot be calculated with a high degree of accuracy. The resulting accounting estimates will, by definition, seldom equal the related actual results. If outcomes in the next fiscal year are much different than current assumptions, a material adjustment might be required to the carrying amount of the assets and liabilities. The estimates and assumptions that have a significant risk of causing a material adjustment to the carrying amounts of assets and liabilities in subsequent years are addressed below. Estimated Impairment of Goodwill and Other Intangible Assets with Indefinite Useful Life Impairment reviews are undertaken annually, or more frequently if there is a triggering event, to determine if goodwill arising from business acquisitions and other intangible assets with indefinite useful life have suffered any impairment, in accordance with the policy described in note 2.16 to our audited annual consolidated financial statements included in this annual report. For this purpose, goodwill is attributed to the different cash-generating units to which it relates, while other intangible assets with indefinite useful life are assessed individually. The recoverable amounts of the cash-generating units and of other intangible assets with indefinite useful life have been determined based on their value-in-use. This evaluation requires the exercise of our management s professional judgment to analyze any potential indicators of impairment as well as the use of estimates in determining the value in use, including the preparation of future cash flows, macro-economic forecasts as well as defining the interest rate at which said cash flows will be discounted. Value in use is usually determined on the basis of discounted estimated future net cash flows. Determination as to whether and how much an asset is impaired involves our management estimates of highly uncertain matters such as future commodity prices, the effects of inflation on operating expenses, discount rates, production profiles and the outlook for global or regional market supplyand-demand conditions for crude oil, natural gas and refined products. 107
113 If we experience a significant drop in revenues or a drastic increase in costs or changes in other factors the fair value of business units might decrease. If our management determines the factors that reduce the fair value of the business are permanent, those economic factors will be taken into consideration to determine the recoverable amount of the business units and, therefore, goodwill as well as other intangible assets with indefinite useful life may be deemed to be impaired, which may cause their writedown to be necessary. Based on the impairment tests performed by our management, no goodwill nor intangible (trademarks) impairment losses were required to be recognized because the recoverable amount of the cash-generating units subject to testing was substantially higher than their related carrying amounts. We have not had any impairment to goodwill or intangibles over the last three years. The most significant assumptions are gross margin, growth rate and discount rate which are included in note 17 of our audited annual consolidated financial statements included in this annual report. We have performed a sensitivity analysis on the gross margin and discount rate which is included below: a. Gross Margin: Our fair value is above its carrying amount and, if the gross margin were adjusted down by 10%, the fair value would be 26.04% higher than the carrying amount and, if the gross margin were adjusted up by 10%, the fair value would be 88.26% higher than carrying amount. Therefore our businesses would still be greater than the carrying amount even under a significant decline in our gross margin and we would not need to impair our goodwill. b. Discount Rate: Our fair value is significantly above its carrying amount and, if the discount rate were adjusted down by 10%, the fair value would be 76.64% higher than the carrying amount, and if the discount rate were adjusted up by 10%, the fair value would be 39.42% higher than carrying amount. Therefore our businesses would still be greater than the carrying amount even under a significant upward adjustment to the discount rate in value and we would not need to impair our goodwill. Income Taxes Determination of the tax obligations and expenses requires interpretations of the applicable tax laws and regulations. We seek legal tax counsel s advice before making any decision on tax matters. Although our management considers its estimates to be prudent and appropriate, differences of interpretation may arise with tax authorities (mainly Peruvian, Chilean and Colombian authorities) which may require future tax adjustments. Deferred tax assets and liabilities are calculated by taking the temporary differences of the tax basis of assets and liabilities and the financial statement basis using the tax rates in effect for each of the years in which the difference is expected to reverse. Any change in tax rates will affect the deferred tax assets and liabilities. This change will be recognized in income in the period the change takes effect. Deferred income tax assets are recognized only to the extent that it is probable that future taxable profit will be available against which the temporary differences and tax loss carryforwards can be utilized. For this purpose, we take into consideration all available positive and negative evidence, including factors such as historical data, projected income, current operations and tax planning strategies. A tax benefit related to a tax position is only recognized if it is more likely than not that the benefit will ultimately be realized. Our maximum exposure related to tax contingencies amounts to S/.37.5 million (US$12.5 million). Percentage-of-Completion Revenue Recognition Revenue from construction contracts is recognized under the percentage-of-completion method which requires the final margin from construction contracts to be estimated. Projections of these margins are performed by our management based on work execution budgets and adjusted periodically based on updated information reflecting the actual performance of work. The estimated contract revenue and total cost estimates are reviewed 108
114 often as work progresses and is approved. In this regard, our management considers that the estimates made at the year-end closing are reasonable. When unapproved change orders occur, revenue is recognized equal to costs incurred (no profit component recognized) until the additional work is approved. Contract revenue is recognized as revenue in the income statement in the accounting periods in which the work is performed. Contract costs are recognized as cost of sales in the income statement in the accounting period in which the work to which they relate is performed. However, any expected and probable excess of total contract costs over total contract revenue for the contract is expensed immediately. Furthermore, any changes in contract estimates are recognized as a change in accounting estimates and recognized in the period the change is made and in future periods as applicable. In certain construction contracts, the terms of these agreements allow for an amount to be withheld by the customers until construction has been completed. Under these contracts the full amount may not be recognized until the next operating cycle. As of December 31, 2012, 2013 and 2014, a sensitivity analysis was performed considering a 10% increase/decrease in our gross margins as follows: Sales 3,341,539 3,820,393 4,749,159 Gross profit 371, , ,771 % Increase 10% Increase in profit before taxes 37,185 46,597 41, , , , Decrease 10% Decrease in profit before taxes (37,185) (46,597) (41,387) 334, , ,384 Provision for Well Closure Costs We estimate the present value of our future obligation for well closure costs, or well closure liability, and increases the carrying amount of the asset that will be withdrawn in the future and that is shown under the heading of intangibles in our statement of financial position. The discount pre-tax rate used for the present value calculation was 2.17% based on the 10-year bond rate as of December, 2014 (2.74% as of December, 2013). As of December 31, 2014 the present value of the estimated provision for closure activities for 78 wells amounted to S/ million (S/.4.85 million as of December 31, 2013 for closure activities for 83 wells). The well closure liability is adjusted to reflect the changes that resulted from the passage of time and from revisions of either the date of occurrence or the amount of the present value of the obligations originally estimated. If, at December 31, 2014, the estimated rate would have increased or decreased by 10%, with all variables held constant, the pre-tax profit for the year would have been as follows: Impact in pretax profit 2013 Impact in pretax profit % (59) (59) -10% During 2014, we recorded a provision amounting to S/.2.7 million, with charge to intangibles to reflect the estimated obligation to close productive wells included in the service agreements for Blocks I and V. 109
115 Critical Judgments in Applying Accounting Policies Consolidation of Entities in Which We Holds Less Than 50% We own certain direct and indirect subsidiaries that we control even though we have less than 50% of the voting rights. These are mainly related to indirect subsidiaries in our Real Estate segment that are owned through Viva GyM, where, even though we hold an interest between 30% and 50%, we have the ability to influence the relevant activities that mostly impact such subsidiaries returns. Additionally, we have de facto control of Promotora Larcomar S.A. in which we hold 42.8% of equity interest, considering the fact that the ownership of the other 57.2% is disperse. New Accounting Pronouncements, Amendments and Interpretations New and Amended Standards Adopted by us in 2014 The following standards have been adopted by us for the first time for our 2014 financial statements. Most of the impact of the adoption of these standards was restricted to presentation and disclosures in our financial statements: Amendment to IAS 32, Financial Instruments: Presentation. This amendment clarifies that the right of set-off must not be contingent on a future event. It must also be legally enforceable for all counterparties in the normal course of business, as well as in the event of default, insolvency or bankruptcy. The amendment also considers settlement mechanisms. The amendment did not have a significant effect on our consolidated financial statements. Amendments to IAS 36, Impairment of assets. This amendment removed some disclosure requirements regarding: (a) eliminating the requirement about disclosing the recoverable value when a cash generating unit (CGU) contains a goodwill or indefinite life intangible assets, but that has not been impaired; (b) disclosing the recoverable value of an asset CGU when an impairment loss has been recognized or reversed and (c) detailed disclosures about how the recoverable value less costs of sales has been measured when an impairment loss has been recognized or reversed. We have applied the amendment and consequently there has been no significant impact on our consolidated financial statements. Amendments to IAS 39 Financial instruments: Recognition and measurement. This amendment requires to discontinue the hedging accounting when a hedging instrument expires or is sold, finished or exercised, unless the replacement or incorporation of a hedging instrument in another hedging instrument is part of the hedging strategy documented by the entity. We have applied the amendment and consequently there has been no significant impact on our consolidated financial statements. Amendment to IAS 19 Employee Benefits. The amendment applies to contributions from employees or third parties to defined benefit plans and clarifies the treatment of such contributions. The amendment distinguishes between contributions that are linked to service only in the period in which they arise and those linked to service in more than one period. The objective of the amendment is to simplify the accounting for contributions that are independent of the number of years of employee service, for example employee contributions that are calculated according to a fixed percentage of salary. Entities with plans that require contributions that vary with service will be required to recognize the benefit of those contributions over employee s working lives. We have applied the amendment and consequently there has been no significant impact on our consolidated financial statements. IFRIC 21, Levies, sets out the accounting for an obligation to pay a levy if that liability is not income tax. The interpretation addresses what the obligating event is that gives rise to pay a levy and when a liability should be recognized. We are not currently subjected to significant levies so the impact on our company is not material. Other standards, amendments and interpretations which are effective for the financial year beginning on January 1, 2014 are not material to our company. 110
116 New Standards and Interpretations Not Yet Effective and Not Early Adopted A number of new standards and amendments to standards and interpretations are effective for annual periods beginning after January 1, 2014, and have not been applied in preparing the consolidated financial statements included in this annual report. None of these is expected to have a significant effect on the consolidated financial statements of our company, except the following set out below: IFRS 9, Financial instruments, addresses the classification, measurement and recognition of financial assets and financial liabilities. The complete version of IFRS 9 was issued in July It replaces the guidance in IAS 39 that relates to the classification and measurement of financial instruments. IFRS 9 retains but simplifies the mixed measurement model and establishes three primary measurement categories for financial assets: amortized cost, fair value through other comprehensive income and fair value through profit and loss. The basis of classification depends on the entity s business model and the contractual cash flow characteristics of the financial asset. Investments in equity instruments are required to be measured at fair value through profit or loss with the irrevocable option at inception to present changes in fair value in other comprehensive income not recycling. There is now a new expected credit losses model that replaces the incurred loss impairment model used in IAS 39. For financial liabilities, there were no changes to classification and measurement except for the recognition of changes in own credit risk in other comprehensive income, for liabilities designated at fair value through profit or loss. IFRS 9 relaxes the requirements for hedge effectiveness by replacing the bright line hedge effectiveness tests. It requires an economic relationship between the hedged item and hedging instrument and for the hedged ratio to be the same as the one management actually use for risk management purposes. Contemporaneous documentation is still required but is different to that currently prepared under IAS 39. The standard is effective for accounting periods beginning on or after January 1, Early adoption is permitted. We have not yet assessed IFRS 9 s full impact. IFRS 15, Revenue from Contracts with Customers deals with revenue recognition and establishes principles for reporting useful information to users of financial statements about the nature, amount, timing and uncertainty of revenue and cash flows arising from an entity s contracts with customers. Revenue is recognised when a customer obtains control of a good or service and thus has the ability to direct the use and obtain the benefits from the good or service. The standard replaces IAS 18 Revenue and IAS 11 Construction contracts and related interpretations. The standard is effective for annual periods beginning on or after 1 January 2017 and earlier application is permitted. We are in the process of assessing the impact of IFRS 15, whose application is expected to impact several operating segments of our company. As part of this assessment, we are evaluating the transition options established by IFRS 15 and the effect on the current contracts entered into by the different subsidiaries. Amendments to IFRS 10 Consolidated Financial Statements and IAS 28 Investments in associates, prospectively applicable from January 1, Amendments will only be applicable to transactions in which the investor sells or transfers of assets to its associates or joint ventures. Amendments are not intended to take into account the accounting that an investor will apply in selling or transfer of assets transactions to joint ventures. The resulting impact is that the investor will recognize all the profit or loss in cases in which non-monetary assets constitute a business. If assets do not meet the business definition, the investor will recognize the profit or loss up to the limit of the interest of the other investors in the associate or joint venture. We are evaluating the impact of these amendments. There are no other IFRS or IFRIC interpretations that are not yet effective that would be expected to have a significant impact on our financial statements. 111
117 Results of Operations General Accounting for Subsidiaries, Joint Operations and Associated Companies Results of our subsidiaries, joint operations and associated companies are reflected in our financial results. We refer to our subsidiaries as those entities over which we exercise control. We consolidate the results of our subsidiaries in our financial statements and we reflect the profit corresponding to the minority interests in our subsidiaries under profit attributable to non-controlling interests in our income statement. We refer to business activities in which we share control with unrelated entities as joint operations. Our joint operations are conducted through an agreement with a third party to carry out specific projects. We contribute our assets to these projects and derive revenue from their use. In our financial statements we recognize, in relation to our interest in a joint operation, our assets and liabilities, including our share of any asset or liability we hold jointly with our partner, as well as our share of revenue and expense from the joint operation. We refer to our associated companies as those entities over which we have significant influence but do not control. We reflect the results of our associated companies under the equity method of accounting in our financial statements under the line item share of the profit and loss in associates in our income statement. For further information, see note 2.2 to our audited annual consolidated financial statements included in this annual report. Intersegment Transactions Some of our segments from time to time provide services to our other segments. In 2014, we obtained 2.6% of the revenues in our E&C segment from the construction of La Chira waste water treatment plant for our Infrastructure segment and the construction of real estate for our Real Estate segment; 23.4% of the revenues in our operation and maintenance of infrastructure assets line of business derived from services provided to Norvial, Survial, Canchaque and the Lima Metro; and 8.9% of the revenues in our IT services line of business derived from IT and outsourcing services provided to several of our other lines of businesses. Accordingly, in such circumstances, the segment providing services recognizes revenues and the segment receiving such services recognizes costs of sales relating to the services provided. For example, in the case of La Chira, in which our E&C segment provides services to our Infrastructure segment, our E&C segment recognizes revenues and our Infrastructure segment recognizes costs of sales with respect to the fees charged by our E&C segment for those services. In consolidation, these intersegment revenues and cost of sales are eliminated in our financial results. Nonetheless, our Infrastructure segment, in particular, may recognize gross profits or losses based on the difference between the fees the segment charges in accordance with concession terms and costs it incurs relating to services provided by our other segments. For more information on our segments, see note 6 to our audited annual consolidated financial statements. Engineering and Construction We obtain revenues in our E&C segment from the engineering and construction services we provide to our clients, which we recognize under the percentage-of-completion method of accounting. For further information, see note 2.26 to our audited annual consolidated financial statements included in this annual report. We receive unrestricted client advances in a substantial majority of our E&C projects, on average equal to approximately 12% of the contract price, which we record as an account payable. We typically invoice our clients on a periodic basis as each project progresses, deducting from the related advances on a proportional basis. For further information, see note 20 to our audited annual consolidated financial statements included in this annual report. Our cost of sales in our E&C segment includes labor, subcontractor expenses, materials, equipment, and project-specific general expenses. 112
118 Infrastructure In our Infrastructure segment, we recognize revenues and cost of sales as follows: (1) Toll Roads: For Norvial, we obtain revenues for toll fees collected, minus deductions required to be transferred to the government as described in Item 4.B. Information on the Company Business Overview Infrastructure Principal Infrastructure Activities Toll Roads Norvial, which we recognize upon receipt. Cost of sales for Norvial include fees paid to third parties (primarily our subsidiary Concar) for operation and maintenance services as well as the amortization of the road concession registered as an intangible asset in our financial statements; and For Survial and Canchaque, we obtain revenues for routine and periodic maintenance services, which we recognize in the period in which the services are performed. Cost of sales for Survial and Canchaque include fees paid to third parties (primarily our subsidiary Concar) for operation and maintenance services. We do not recognize the Survial and Canchaque concessions as intangible assets and therefore do not amortize the concessions. On August 8, 2013, we obtained the concession for a 40-year term for designing, financing, building, operating and maintaining the infrastructure associated with Vía Expresa Sur. We are currently working to obtain the necessary rights of way for the highway. Revenue for the construction activities and other initial activities are accounted for as a financial asset for the portion that the government guarantees to us, and as an intangible for the unguaranteed investment. For further information, see notes 2.16(c) and 17 to our audited annual consolidated financial statements included in this annual report. (2) Mass Transit: We obtain revenues from our Lima Metro concession based on a tariff per kilometer traveled by our trains in operation in accordance with a schedule established in our concession agreement, which we recognize in the period in which the services are performed. Under the concession, the tariff is comprised of three components: (i) fees related to our operation and maintenance services; (ii) fees related to the Peruvian government s repayment of the amounts we invest to purchase trains and other infrastructure for the Peruvian government; and (iii) fees related to interest we charge the Peruvian government in connection with the amounts we invest to purchase such trains and other infrastructure. In 2014, the fees related to items (i), (ii) and (iii) were S/ million, S/.0.0 million and S/.41.4 million, respectively. We only recognize in our income statement the portion of the tariff that relates to items (i) and (iii). We record the amounts paid by us that relate to item (ii) as long-term accounts receivables from the Peruvian government. Accordingly, tariff payments received relating to item (ii) reduce our accounts receivables but do not impact our income statement, and we do not amortize our investments in our income statement as our investment in the concession is recorded as an account receivable with the government rather than a depreciable investment. For further information, see note 10 to our audited annual consolidated financial statements included in this annual report. Cost of sales for the Lima Metro include fees paid to third parties (primarily our E&C segment, our subsidiary Concar and other subcontractors) for construction and operation and maintenance services, energy, and our financing costs related to the purchase of trains. (3) Water Treatment: Beginning in March 2012, we obtained revenues from the engineering design and construction of La Chira waste water treatment plant, which we recognize based on the percentage-of-completion method of accounting. Once the plant begins operations, which is expected to occur at the beginning of 2016, we will obtain revenues only for operation and maintenance services, which we will recognize in the period in which the services are performed. During the construction phase, cost of sales for La Chira includes fees paid to third parties, primarily our E&C segment, for engineering and construction services. During the operation phase, cost of sales for La Chira will include personnel charges and maintenance of infrastructure. (4) Energy: We obtain revenues from extraction services related to oil and gas production, fuel storage services, and the sale of natural gas liquids derived from our gas processing and fractionation services, which we recognize in the period in which the services are performed and, in the case of sale of natural gas liquids, when the sale is made. Cost of sales for our energy line of business includes labor, materials, amortization of oil wells, depreciation of the gas plant, maintenance and general expenses. 113
119 Terminales del Perú acquired the right to operate the North and Central terminals for a 20-year period for an amount of S/.12.2 million, and Consorcio Terminales del Sur renewed its right to operate the South terminals for one year for S/.1.2 million; In December 2014, we acquired 51% of the share capital of Tecgas N.V. (current strategic partner of Transportadora de Gas del Perú), owner of 100% of the shares of COGA for a total of S/.75.8 million. This investment includes goodwill resulting from the purchase amounting to S/.61.4 million. Real Estate We obtain revenues in our Real Estate segment from sales of affordable housing and housing units, commercial buildings and land parcels, which we recognize at the time of delivery of the unit or building and, in the case of land parcels, at the time of the sale. We typically pre-sell our affordable housing and housing units prior to and during construction, and use the related proceeds we receive to finance the construction of the units. These pre-sale funds are restricted and released from escrow to us periodically as construction progresses. Our Real Estate cost of sales includes the cost to purchase land, costs of architectural design and construction (which usually includes payments to third parties, primarily our E&C segment), licensing and permit costs, personnel costs, and fees to third parties related to sanitation or electrical engineering. In 2014, our cost of land that is allocated to units delivered during these periods amounted to S/.27.6 million. We recognize land purchases as inventory, and, accordingly, do not mark-to-market the value of our land for changes in fair value. For further information, see note 14 to our audited annual consolidated financial statements included in this annual report. In our Real Estate segment, we have significant net profit attributable to non-controlling interests. We hold a significant portion of our land bank through Almonte in which we have a 50.4% interest, and we consolidate Almonte s results in our financial statements. In addition, we undertake a significant number of our real estate projects through entities in which we may have a majority interest, co-equal interest or minority interest; when we have control over these entities, we consolidate their results in our financial statements regardless of whether we own a majority of the capital. Furthermore, in connection with our affordable housing projects, we generally partner with real estate investment funds and insurance companies that provide between 60% and 70% of the total capital required to purchase the land and cover certain pre-construction costs in exchange for equity in the project. Although we typically own a minority interest in these projects, we consolidate their results in our financial statements because we exercise control over the project. Accordingly, we reflect the profit corresponding to our real estate partners under net profit attributable to noncontrolling interests in our income statement. See Accounting for Subsidiaries, Joint Operations and Associated Companies. Technical Services In our Technical Services segment, we recognize revenues and cost of sales as follows: (1) Operation and Maintenance of Infrastructure Assets: We obtain revenues from our operation and maintenance of infrastructure assets line of business for the operation and maintenance services we provide to the government and concessionaires (currently concessions within our Infrastructure segment), which we recognize in the period in which the services are performed. We receive unrestricted advances with respect to our service contracts with the government, that vary from approximately 10% to 30% of the contract price, which we record as an account payable. We typically invoice our clients on a periodic basis as the project progresses, deducting from the related advances on a proportional basis. For further information, see note 20 to our audited annual consolidated financial statements included in this annual report. Our cost of sales in this line of business includes personnel costs, services provided by third parties, machinery and other materials (primarily trucks), and depreciation of equipment utilized to provide services. (2) IT Services: We obtain revenues from our IT services line of business for IT and outsourcing services we perform for government and private sector clients, which we recognize in the period in which the services are performed. Our IT services cost of sales includes personnel costs, services provided by third parties, equipment and other materials, depreciation of equipment utilized to provide services, and amortization of software. 114
120 (3) Electricity Networks Services: We obtain revenues from the electrical services we provide to our clients, which we recognize in the period in which the services are performed. Our cost of sales in this line of business includes personnel costs, services provided by third parties, machinery and other materials (primarily trucks and meters), and depreciation of equipment utilized to provide services. Comparison of Results of Operations of 2013 and 2014 Revenues The following table sets forth the components of our consolidated income statement for 2013 and Year ended December 31, Variation (in millions of S/.) % Revenues 5, , Cost of sales (4,963.4) 6, Gross profit 1, (5.2) Administrative expenses (361.8) (421.4) 16.5 Other income (expenses) (41.5) Other (losses) gains, net (0.7) (0.1) (85.7) Profit from sale of investments N/M Operating profit (19.0) Financial (expense) income, net (112.4) (91.4) (19.5) Share of profit and loss in associates Profit before income tax (14.5) Income tax (182.3) (146.2) (19.8) Net profit (12.1) Net profit attributable to controlling interest (6.3) Net profit attributable to non-controlling interest (33.2) Our total revenues increased by 17.4%, or S/.1,041.2 million, from S/.5,967.5 million for 2013 to S/.7,008.7 million for This increase was due mainly to growth in our E&C segment, primarily due to an increase in electromechanic construction and civil construction activities. In addition, we experienced growth in our Infrastructure segment, primarily due to an increase in revenues from the Lima Metro, as a result of the increase in trains in operation, Survial, as a result of higher levels of maintenance for the road, and Norvial, as a result of the recognition of the work progress for the second stage of the road. We estimate that fluctuations among the nuevo sol and the U.S. dollar and the Chilean peso between the 2013 and 2014 resulted in an increase in our consolidated revenues, as expressed in nuevos soles, of approximately S/ million, or 3.1%, during 2014, as the nuevo sol depreciated against the U.S. dollar by approximately 6.9% and appreciated against the Chilean peso by approximately 7.7%. The following table sets forth a breakdown of our revenues by segment for 2013 and Year ended December 31, Variation (in millions (in millions of S/.) % of Total of S/.) % of Total % Engineering and Construction 4, , Infrastructure Real Estate (28.4) Technical Services 1, , Corporate Eliminations (323.1) (5.4) (397.7) (5.7) 23.1 Total 5, ,
121 Cost of Sales Our total cost of sales increased by 22.0%, or S/.1,093.7 million, from S/.4,963.4 million for 2013 to S/.6,057.1 million for This increase was related to the growth in our revenues as well as in our E&C segment an increase in cost in certain civil construction projects. We estimate that fluctuations among the nuevo sol and the U.S. dollar and the Chilean peso between 2013 and 2014 resulted in an increase in our consolidated cost of sales, as expressed in nuevos soles, of approximately S/.56.4 million, or 0.9%, during Gross Profit Our gross profit decreased by 5.2%, or S/.52.5 million, from S/.1,004.1 million for 2013 to S/ million for Our gross margin for 2014 was 13.6% compared to 16.8% for This decrease in our gross margin was mainly due to lower gross margins in our E&C segment, primarily due to lower margins in certain civil construction projects, our Technical Services segment, primarily due to the impact of the cancellation of one of the road maintenance contracts, and our Real Estate segment, primarily due to lower margins in the units delivered and the lower number of units. The following table sets forth a breakdown of our gross profit by segment for 2013 and Administrative Expenses Our administrative expenses increased by 16.5%, or S/.59.6 million, from S/ million for 2013 to S/ million for 2014, primarily due to the increase of administrative expenses in the E&C segment, specifically in Vial y Vives DSD; and an increase in administrative expenses in our Infrastructure segment, specifically our subsidiaries GyM Ferrovías and Canchaque. As a percentage of revenues, our administrative expenses decreased to 6.0% in 2014 from 6.1% in Other Income (Expenses) Year ended December 31, Variation (in millions (in millions of S/.) % of Total of S/.) % of Total % Engineering and Construction (4.3) Infrastructure Real Estate (45.1) Technical Services (20.6) Corporate (4.0) (0.4) (7.6) (0.8) 90.0 Eliminations (31.1) (3.1) (26.5) (2.8) (14.8) Total 1, (5.2) Our other income (expenses) decreased S/.10.2 million, from S/.25.3 million for 2013 to S/.15.1 million for This decrease was primarily due to a decrease in our E&C segment, from a S/.10.5 million profit to a S/. 9.9 million loss, as a result of a lower reversal of provisions in connection with the Vial y Vives acquisition and a lower reversal of provisions in connection with the CAM acquisition, as well as a lower reversal of provisions in connection with tax and labor-related contingencies. For further information, see Factors Affecting Our Results of Operations Acquisitions. 116
122 Operating Profit Our operating profit decreased 19.0% or S/ million, from S/ million for 2013 to S/ million for Our operating margin (i.e., operating profit as a percentage of revenues) was 7.8% for 2014 compared to 11.3% for This decrease is primarily due to the decrease in gross profit and by the increase in administrative expenses in our E&C and Infrastructure segments and lower other income (expenses). The following table sets forth a breakdown of our operating profit by segment for 2013 and The following table sets forth a breakdown of our operating profit by segment for 2013 and The following discussion analyzes our key results of operations on a segment basis. For further information on our business segments, see note 6 to our audited annual consolidated financial statements included in this annual report. Engineering and Construction The table below sets forth selected financial information related to our E&C segment. Year ended December 31, Variation (in millions (in millions of S/.) % of Total of S/.) % of Total % Engineering and Construction (24.2) Infrastructure Real Estate (57.0) Technical Services (64.0) Corporate (12.8) (1.9) (21.0) (3.9) 64.1 Eliminations Total (19.0) Year ended December 31, Variation (in millions of S/.) % Revenues 4, , Gross profit (4.3) Operating profit (24.2) Revenues. Our E&C revenues increased 23.6%, or S/ million, from S/.4,075.3 million for 2013 to S/.5,035.7 million for 2014, primarily due to the growth in revenues in our electromechanic and civil works activities and, to a lesser extent, to contract mining activity as well as the S/ million in revenues from Vial y Vives - DSD in which we acquired controlling interests in October 2012 and August 2013, respectively. We estimate that fluctuations among the nuevo sol and the U.S. dollar between 2013 and 2014 resulted in an increase in our E&C revenues, as expressed in nuevos soles, of approximately S/ million, or 4.4%, during
123 The following describes variations in our E&C revenues by business activities, types of contracts and end-markets: E&C Activities: For 2014, approximately 7.2%, 21.6%, 35.0%, 26.2% and 10.1% of our E&C revenues were derived from: engineering services; electromechanic construction; civil construction; contract mining; and building construction activities, respectively. For 2013, approximately 6.4%, 17.8%, 29.5%, 29.3% and 17.0% of our E&C revenues were derived from: engineering services; electromechanic construction; civil construction; contract mining; and building construction activities, respectively. Despite variations in the proportional weight of our various E&C activities, the revenues derived from most of our E&C activities increased in absolute terms during 2014, except for building construction activity which decreased 31.3%. For a description of our E&C business activities, see Item 4.B. Information on the Company Business Overview Engineering and Construction Principal Engineering and Construction Activities ; E&C Contracts: For 2014, approximately 43.9%, 29.5%, 11.4% and 15.3% of our E&C revenues were derived from: costplus fee; unit price; lump-sum; and EPC contracts, respectively. For 2013, approximately 53.0%, 30.9%, 7.3% and 8.8% of our E&C revenues were derived from: cost-plus fee; unit price; lump-sum; and EPC contracts, respectively. During 2014 we continued to derive significant revenues from cost-plus fee and unit price contracts, with a significant increase in EPC and lump-sum contracts. For a description of our contractual arrangements, see Item 4.B. Information on the Company Business Overview Engineering and Construction Contracts and Factors Affecting our Results of Operations Engineering and Construction ; and E&C End-Markets: For 2014, approximately 70.4%, 10.4%, 10.2%, 2.6%, 4.2%, 1.2% and 1.1%, of our E&C revenues were derived from: mining; real estate buildings; power; oil and gas; transportation; water and sewage; and other end-markets, respectively. For 2013, approximately 54.5%, 17.1%, 7.6%, 6.6%, 9.3%, 4.4% and 0.6%, of our E&C revenues were derived from: mining; real estate buildings; power; oil and gas; transportation; water and sewage; and other end-markets, respectively. During 2014 we experienced growth in the revenues from the mining and power end-markets. Revenues in 2014 derived from the real estate buildings, oil and gas, water and transportation end-market decreased in comparison with The breakdown of E&C revenues by different business activities, types of contracts and end-markets tends to vary from period to period due to a variety of factors, including the timing of the execution of larger projects in any particular period, which is typically outside of our control. Gross Profit. Our E&C gross profit decreased 4.3%, or S/.24.1 million, from S/ million for 2013 to S/ million for Our E&C gross margin for 2014 was 10.6% compared to 13.7% for This decrease in E&C gross margin was primarily due to lower margins in two civil construction projects as a result of higher than expected costs. We estimate that fluctuations among the nuevo sol and the U.S. dollar between 2013 and 2014 resulted in an increase in our E&C cost of sales, as expressed in nuevos soles, of approximately S/.71.5 million, or 1.6%, during Operating Profit. Our E&C operating profit decreased 24.2%, or S/.85.4 million, from S/ million for 2013 to S/ million for Our E&C administrative expenses increased 18.6%, or S/.40.6 million, which resulted in administrative expenses as a percentage revenues of 5.1% for 2014 compared to 5.3% for 2013, due to the increase in administrative expenses of Vial y Vives DSD as a result of the consolidation of DSD in 2014 (in 2013 it was consolidated as from September 2013). Our E&C operating profit for 2014 was negatively impacted by S/.9.9 million in other income, mainly resulting from the reversal of provisions in connection with the Vial y Vives acquisition. Our E&C operating margin for 2014 was 5.3% compared to 8.6% for In addition, our E&C segment had S/.48.2 million in profit from minority interests held by Vial y Vives in several of its projects undertaken in 2014 in Chile, as well as the minority participation of GyM in Viva GyM reflected under share of profit and loss in associates in our audited annual consolidated financial statements. 118
124 Infrastructure The table below sets forth selected financial information related to our Infrastructure segment. Year ended December 31, Variation (in millions of S/.) % Revenues Gross profit Operating profit Revenues. The table below sets forth the breakdown of our Infrastructure revenues by principal lines of business. Year ended December 31, Variation (in millions of S/.) % Toll Roads Mass Transit Water Treatment (35.6) Energy Total Our Infrastructure revenues increased 29.9% or S/ million, from S/ million for 2013 to S/ million for The variation in our Infrastructure revenues principally reflected the following: Toll Roads: a 72.6%, or S/ million, increase in revenues, from S/ million for 2013 to S/ million for 2014, primarily due to the recognition of the work progress for the second stage of the Norvial toll road and an increase in the revenues of Survial due to higher levels of maintenance activities, specifically construction activities in the area of Urcos and related to catastrophic events that occurred in 2010; Mass Transit: a 40.9%, or S/.48.5 million, increase in revenues, from S/ million for 2013 to S/ million for 2014, primarily due to the increase of trains in operation from five trains in 2012 to 14 (including two backup trains) beginning in September 2013 to 24 trains (including the back up trains) in September 2014; Water Treatment: a 35.6%, or S/.16.2 million, decrease in revenues, from S/.45.5 million for 2013 to S/.29.3 million for 2014, primarily due to progress in the construction of the La Chira waste water treatment plant; and Energy: a 9.1%, or S/.29.2 million, increase in revenues, from S/ million for 2013 to S/ million for 2014 primarily due to a 10.0% growth in our barrel daily production (BDP 1,754 vs BDP 1,595 in 2013) resulting from increased drilling of wells and the performance of certain wells, despite a decrease in international oil prices (average price per basket of oils of US$97.1 bbl vs. US$107.4 bbl), in addition to higher processing levels at the our gas processing plant which increased from 6,603.4 MMcf in 2013 to 9,999.2 MMcf in We estimate that fluctuations among the nuevo sol and the U.S. dollar between 2013 and 2014 resulted in an increase in our Infrastructure revenues, as expressed in nuevos soles, of approximately S/.25.8 million, or 2.9%, during Gross Profit. The table below sets forth the breakdown of our Infrastructure gross profit by principal lines of business. 119
125 Year ended December 31, Variation (in millions of S/.) % Toll Roads Mass Transit Water Treatment (27.9) Energy Total Our Infrastructure gross profit increased 31.4%, or S/.58.7 million, from S/ million for 2013 to S/ million for Our Infrastructure gross margin was 27.8% for 2014 compared to 27.4% for The variation in our Infrastructure gross profit principally reflected the following: Toll Roads: a 15.3%, or S/.10.2 million, increase in gross profit, from S/.66.5 million for 2013 to S/.76.7 million for This increase was primarily due to the increase in revenues from Norvial and Survial. Our Toll Roads gross margin was 22.7% for 2014 compared to 33.9% for 2013, primarily due to the recognition of revenues from construction activities in Norvial which have lower margins and impact the overall margins in Toll Roads. Mass Transit: a 113.8%, or S/.22.4 million increase in gross profit, from a S/.19.7 million gross profit for 2013 to S/.42.1 million for 2014, primarily due to an increase in revenues, with the increase in trains in operation beginning in Our Mass Transit gross margin for 2014 was 25.2% compared to 16.6% for Water Treatment: a 27.9%, or S/.0.9 million, decrease in gross profit for 2014, from S/.3.2 million gross profit for 2013 to S/.2.3 million gross profit for 2014, primarily due to weather effects on our revenues. Our Water Treatment gross margin was 7.9% for 2014 compared to 7.0% for Our Water Treatment gross margin was impacted due to the inclusion of certain financial costs in cost of sales. Energy: a 27.7%, or S/.27.0 million, increase in gross profit, from S/.97.5 million for 2013 to S/ million for 2014, primarily due to the higher oil production and higher processing levels in the gas processing plant. Our Energy gross margin was 35.5% for 2014 compared to 30.4% for Operating Profit. The table below sets forth the breakdown of our Infrastructure operating profit by principal lines of business. Year ended December 31, Variation (in millions of S/.) % Toll Roads Mass Transit Water Treatment (32.5) Energy Total Our Infrastructure operating profit increased 32%, or S/.48.9 million, from S/ million for 2013 to S/ million for Our Infrastructure operating margin was 22.8% for 2014 compared to 22.5% for The variation in our Infrastructure operating profit principally reflected the following: Toll Roads: a 14.8%, or S/.8.9 million, increase in operating profit, from S/.59.8 million for 2013 to S/.68.7 million for 2014, primarily due to the increase in gross profit in Norvial and Survial. Our Toll Roads operating margin was 20.3% for 2014 compared to 30.5% for 2013, primarily due to the recognition of revenues from construction activities in Norvial which have lower margins and impact the overall margins in Toll Roads. 120
126 Real Estate Mass Transit: a 120.9%, or S/.15.0 million, increase in operating profit, from an operating profit of S/.12.4 million for 2013 to S/.27.4 million for 2014, primarily due to the increase in gross profit. Our Mass Transit operating margin for 2014 was 16.4% compared to 10.5% for Water Treatment: a 32.5%, or S/.1.0 million, decrease in operating profit, from to an operating profit of S/.3.0 million for 2013 to S/.2.0 million for 2014, due to the decrease in gross profit. Our Water Treatment operating margin for 2014 was 6.8% compared to 6.5% for Energy: a 33.5%, or S/.26.0 million, decrease in operating profit, from S/.77.8 million for 2013 to S/ million for 2014, primarily due to the increase in gross profit. Our Energy operating margin was 29.6% for 2014 compared to 24.2% for The table below sets forth selected financial information related to our Real Estate segment. Year ended December 31, Variation (in millions of S/.) % Revenues (28.4) Gross profit (45.1) Operating profit (57.0) Revenues. Our Real Estate revenues decreased 28.4%, or S/.89.1 million, from to S/ million for 2013 to S/ million for This decrease was primarily due to a 52.7% decrease in the number of units delivered, with 831 units delivered in 2014 compared to 1,757 units delivered in This decrease in delivered units is due to the timing of completion of units and the effects of the deceleration of the Peruvian economy. In addition, this decrease in revenues of our Real Estate segment results from sales by Almonte in 2013 of S/.16.3 million compared to S/.0.6 million in We estimate that fluctuations among the nuevo sol and the U.S. dollar between 2013 and 2014 resulted in an increase in our Real Estate revenues, as expressed in nuevos soles, of approximately S/.3.4 million, or 1.5%, during Gross Profit. Our Real Estate gross profit decreased 45.1%, or S/.51.3 million, from S/ million for 2013 to S/.62.4 million for 2014, mainly as a result of the decrease in the number of units delivered and lower margins in units delivered in 2014 compared to 2013, when more affordable housing units with higher margins were delivered. Our Real Estate gross margin was 27.8% for 2014 compared to 36.2% for We estimate that fluctuations among the nuevo sol and the U.S. dollar between 2013 and 2014 resulted in an increase in our Real Estate cost of sales, as expressed in nuevos soles, of approximately S/.1.2 million, or 0.8%, during Operating Profit. Our Real Estate operating profit decreased 57.0%, or S/.53.7 million, from S/.94.2 million for 2013 to S/.40.5 million for 2014, primarily as a result of the decrease in our Real Estate gross profit. Technical Services The table below sets forth selected financial information related to our Technical Services segment. Year ended December 31, Variation (in millions of S/.) % Revenues 1, , Gross profit (20.6) Operating profit (64.0) 121
127 Revenues. The table below sets forth the breakdown of our Technical Services revenues by principal lines of business. Year ended December 31, Variation (in millions of S/.) % Operation and Maintenance of Infrastructure Assets (15.0) IT Services Electricity Networks Services Total 1, , Our Technical Services revenues increased 3.3%, or S/.39.1 million, from S/.1,169.1 million for 2013 to S/.1,208.2 million for The variation in our Technical Services revenues principally reflected the following: Operation and Maintenance of Infrastructure Assets: a 15.0%, or S/.64.5 million, decrease in revenues, from S/ million for 2013 to S/ million for 2014, primarily due to the termination of a contract with the regional government of Cusco and the periodic maintenance of Survial; IT Services: a 9.5%, or S/.21.5 million, increase in revenues, from S/ million for 2013 to S/ million for 2014, primarily as a result of the increase in IT outsourcing service; and Electricity Networks Services: a 16.0%, or S/.82.1 million, increase in revenues, from S/ million for 2013 to S/ million for 2014, primarily due to the acquisition of Coasin in Chile in March We estimate that fluctuations among the nuevo sol and the U.S. dollar between 2013 and 2014 resulted in an increase in our Technical Services revenues, as expressed in nuevos soles, of approximately S/.7.6 million, or 1.2%, during We estimate that fluctuations among the nuevo sol and the Chilean peso between 2013 and 2014 resulted in a decrease in our Technical Services revenues, as expressed in nuevos soles, of approximately S/.42.1 million, or 7.1%, during Gross Profit. The table below sets forth the breakdown of our Technical Services gross profit by principal lines of business. Year ended December 31, Variation (in millions of S/.) % Operation and Maintenance of Infrastructure Assets (82.3) IT Services (1.3) Electricity Networks Services Total (20.6) Our Technical Services gross profit decreased 20.6%, or S/.36.8 million, from S/ million for 2013 to S/ million for Our Technical Services gross margin was 11.8% for 2014 compared to 15.3% for The variation in our Technical Services gross profit principally reflected the following: Operation and Maintenance of Infrastructure Assets: a 82.3%, or S/.38.1 million, decrease in gross profit, from S/.46.3 million for 2013 to S/.8.2 million for 2014, primarily due to the impact generated because of the cancellation of one of our road maintenance contracts. Our Operation and Maintenance of Infrastructure Assets gross margin was 2.2% for 2014 compared to 10.8% for 2013; 122
128 IT Services: a 1.3%, or S/.0.6 million, decrease in gross profit, from S/.47.1 million for 2013 to S/.46.5 million for 2014, primarily related to lower margins in systems integration and business processes outsourcing services. Our IT Services gross margin was 18.7% for 2014 compared to 20.8% for 2013; and Electricity Networks Services: a 2.2%, or S/.1.9 million, increase in gross profit, from S/.85.9 million for 2013 to S/.87.7 million for 2014, primarily due to lower margins in projects in Chile and Colombia and termination of certain contracts. Our Electricity Networks Services gross margin was 14.7% for 2014 compared to 16.7% for We estimate that fluctuations among the nuevo sol and the U.S. dollar between 2013 and 2014 resulted in an increase in our Technical Services cost of sales, as expressed in nuevos soles, of approximately S/.6.7 million, or 1.2%, during We estimate that fluctuations among the nuevo sol and the Chilean peso between 2013 and 2014 resulted in an decrease in our Technical Services cost of sales, as expressed in nuevos soles, of approximately S/.36.0 million, or 7.1%, during Operating Profit. The table below sets forth the breakdown of our Technical Services operating profit by principal lines of business. Year ended December 31, Variation (in millions of S/.) % Operation and Maintenance of Infrastructure Assets 12.4 (22.4) (280.6) IT Services (18.6) Electricity Networks Services (18.4) Total (64.0) Our Technical Services operating profit decreased 64.0%, or S/.45.7 million, from S/.71.4 million for 2013 to S/.25.7 million for Our Technical Services operating margin for 2014 was 2.1% compared to 6.1% for The variation in our Technical Services operating profit principally reflected the following: Operation and Maintenance of Infrastructure Assets: a 280.6%, or S/.34.8 million, decrease in operating profit, from a S/.12.4 million profit for 2013 to a S/.22.4 million loss for 2014, primarily due to the impact generated because of the cancellation of one of the road maintenance contracts. Our Operation and Maintenance of Infrastructure Assets operating margin was -6.1% for 2014 compared to 2.9% for 2013; IT Services: a 18.6%, or S/.3.6 million, decrease in operating profit, from S/.19.4 million for 2013 to S/.15.8 million for 2014, primarily due to the decrease in the gross profit. Our IT Services operating margin was 6.4% for 2014 compared to 8.6% for 2013; and Electricity Networks Services: a 18.4%, or S/.7.3 million, decrease in operating profit, from S/.39.6 million for 2013 to S/.32.3 million for 2014, primarily due to lower reversal of provisions in 2014 (S/.9.4 million) than in 2013 (S/.13.6 million) in connection with the CAM acquisition which offset the increase in gross profit between the two periods; and also explained by the sale of CAM Peru, with a loss of S/2.1, as described in Factors Affecting Our Results with Operation Acquisitions. Our Electricity Network Services operating margin was 5.4% for 2014 compared to 7.7% for
129 Financial (Expense) Income, Net Our net financial expense decreased S/.21.0 million from net financial expenses of S/ million in 2013 to net financial expenses of S/.91.4 million in Excluding foreign exchange differences, our net financial expense increased 9.0%, or S/.3.9 million, from net financial expenses of S/.43.2 million for 2013 to net financial expenses of S/.47.1 million for This increase was primarily due to additional debt incurred in the Lima Metro for project financing and the E&C segment for working capital purposes. Our exchange difference, net decreased S/.26.1 million, from a loss of S/.70.4 million for 2013 to a loss of S/.44.3 million for This decrease is due to both the depreciation of the nuevo sol against the U.S. dollar from 2013 to 2014, partially offset by the replacement of dollar-denominated debt to nuevos soles. Share of Profit and Loss in Associates Our share of profit and loss in associates increased S/.18.7 million from a profit of S/.33.6 million in 2013 to a profit of S/.53.4 million in This increase is primarily due to our Real Estate segment, the sale of a parcel of land in the south of Lima, property of Prinsur, company where we hold minority participation, as well as certain engineering and construction projects in Vial y Vives where we have a minority participation. Income Tax Our income tax decreased 19.8%, or S/.36.1 million, from S/ million for 2013 to S/ million for This decrease in income tax was primarily due to a decrease in profit before tax. Our effective tax rates for 2013 and 2014 were 30.7% and 28.8%, respectively. Net Profit Our net profit decreased 12.4%, or S/.51.0 million, from S/ million for 2013 to S/ million for Net profit attributable to controlling interests decreased 6.3%, while net profit attributable to non-controlling interests decreased 33.2%. Net profit attributable to non-controlling interests decreased primarily due to our E&C and Real Estate segments. See General Accounting for Subsidiaries, Joint Operations and Associated Companies. Comparison of Results of Operations of 2012 and 2013 The following table sets forth the components of our consolidated income statement for 2012 and Year ended December 31, Variation (in millions of S/.) % Revenues 5, , Cost of sales (4,519.8) (4,963.4) 9.8 Gross profit , Administrative expenses (257.2) (361.8) 40.7 Other income (expenses) (65.7) Other (losses) gains, net (0.3) (0.7) Profit from sale of investments 5.7 N/M Operating profit Financial (expense) income, net (10.3) (112.4) Share of profit and loss in associates ,683.3 Profit before income tax Income tax (154.6) (182.3) 17.9 Net profit Net profit attributable to controlling interest Net profit attributable to non-controlling interest
130 Revenues Our total revenues increased by 14.1%, or S/ million, from S/.5,231.9 million for 2012 to S/.5,967.5 million for This increase was due mainly to growth in our E&C segment, primarily due to an increase in contract mining, as a result of the timing of the development stages of the mining projects and, to a lesser extent, the revenues of Vial y Vives and DSD Construcciones y Montajes, companies acquired in October 2012 and August 2013, respectively. In addition, we experienced growth in our Infrastructure segment, primarily due to an increase in revenues from the Lima Metro, as a result of the increase in trains in operation, and Survial, as a result of higher levels of maintenance for the road, as well as growth in our Real Estate segment, primarily due to an increase in units delivered. We estimate that fluctuations among the nuevo sol and the U.S. dollar and the Chilean peso between the 2012 and 2013 resulted in an increase in our consolidated revenues, as expressed in nuevos soles, of approximately S/ million, or 5.3%, during 2013, as the nuevo sol depreciated against the U.S. dollar by approximately 9.6% and appreciated against the Chilean peso by approximately 0.4%. Cost of Sales The following table sets forth a breakdown of our revenues by segment for 2012 and Our total cost of sales increased by 9.8%, or S/ million, from S/.4,519.8 million for 2012 to S/.4,963.4 million for This increase was related to the growth in our revenues. We estimate that fluctuations among the nuevo sol and the U.S. dollar and the Chilean peso between 2012 and 2013 resulted in an increase in our consolidated cost of sales, as expressed in nuevos soles, of approximately S/ million, or 2.2%, during Gross Profit Year ended December 31, Variation (in millions (in millions of S/.) % of Total of S/.) % of Total % Engineering and Construction 3, , Infrastructure Real Estate Technical Services 1, , Corporate Eliminations (185.2) (3.5) (323.1) (5.4) 74.5 Total 5, , Our gross profit increased by 41.0%, or S/ million, from S/ million for 2012 to S/.1,004.1 million for Our gross margin for 2013 was 16.8% compared to 13.6% for This increase in our gross margin was mainly due to higher gross margins in our E&C segment, primarily due to higher margins in contract mining activities as a result of the stage of execution of certain projects, our Technical Services segment, primarily due to higher margins in CAM as a result of the improvement of operating processes implemented since its acquisition and higher margins in the units delivered in our Real Estate segment. The following table sets forth a breakdown of our gross profit by segment for 2012 and Year ended December 31, Variation (in millions (in millions of S/.) % of Total of S/.) % of Total % Engineering and Construction Infrastructure Real Estate
131 Administrative Expenses Our administrative expenses increased by 40.7%, or S/ million, from S/ million for 2012 to S/ million for 2013, primarily due to the consolidation of Vial y Vives and DSD Construcciones y Montajes, in which we acquired controlling interests in October 2012 and August 2013, respectively, and which increased our administrative expenses by S/.13.5 million; the increase of administrative expenses in the E&C segment is in line with the growth in revenues in this segment; and, to a lesser extent, an increase in administrative expenses in our Technical Services segment as a result of the preparation of concession bids. As a percentage of revenues, our administrative expenses grew to 6.1% in 2013 from 4.9% in Other Income (Expenses) Our other income (expenses) decreased S/.49.9 million, from S/.75.9 million for 2012 to S/.26.0 million for This decrease was primarily due to a lower reversal of provisions in connection with the CAM acquisition from S/.68.0 million in 2012 to S/.13.6 million in For further information, see Factors Affecting Our Results of Operations Acquisitions. Operating Profit Our operating profit increased 26.9% or S/ million, from S/ million for 2012 to S/ million for Our operating margin (i.e., operating profit as a percentage of revenues) was 11.3% for 2013 compared to 10.1% for Despite the increase in administrative expenses in our E&C and Technical Services segments and lower other income (expenses), our operating profit increased in 2013 due to higher gross profit, mainly in our E&C and Real Estate segments. The following table sets forth a breakdown of our operating profit by segment for 2012 and Business Segments Year ended December 31, Variation (in millions (in millions of S/.) % of Total of S/.) % of Total % Technical Services Corporate (0.0) 0.0 (4.0) (0.4) N/M Eliminations (59.2) (8.3) (31.1) (3.1) (47.5) Total , Year ended December 31, Variation (in millions (in millions of S/.) % of Total of S/.) % of Total % Engineering and Construction Infrastructure Real Estate Technical Services (1.1) Corporate (12.8) (1.9) (390.9) Eliminations (0.9) (0.2) (1,800.0) Total The following discussion analyzes our key results of operations on a segment basis. For further information on our business segments, see note 6 to our audited annual consolidated financial statements included in this annual report. 126
132 Engineering and Construction The table below sets forth selected financial information related to our E&C segment. Year ended December 31, Variation (in millions of S/.) % Revenues 3, , Gross profit Operating profit Revenues. Our E&C revenues increased 15.6%, or S/ million, from S/.3,524.6 million for 2012 to S/.4,075.3 million for 2013, primarily due to the growth in revenues in our contract mining and civil works activities and, to a lesser extent, the S/ million in revenues from Vial y Vives and S/.84.6 million in revenues from DSD Construcciones y Montajes in 2013, in which we acquired controlling interests in October 2012 and August 2013, respectively. Excluding revenues from Vial y Vives and DSD Construcciones y Montajes, our E&C revenues increased 8.7% in 2013 as compared to We estimate that fluctuations among the nuevo sol and the U.S. dollar between 2012 and 2013 resulted in an increase in our E&C revenues, as expressed in nuevos soles, of approximately S/ million, or 6.8%, during The following describes variations in our E&C revenues by business activities, types of contracts and end-markets: E&C Activities: For 2013, approximately 6.4%, 17.8%, 29.5%, 29.3% and 17.0% of our E&C revenues were derived from: engineering services; electromechanic construction; civil construction; contract mining; and building construction activities, respectively. For 2012, approximately 5.0%, 25.0%, 32.4%, 18.8% and 18.7% of our E&C revenues were derived from: engineering services; electromechanic construction; civil construction; contract mining; and building construction activities, respectively. Despite variations in the proportional weight of our various E&C activities, the revenues derived from each of our E&C activities increased in absolute terms during 2013, with contract mining increasing significantly due to an increase in project awards. For a description of our E&C business activities, see Item 4.B. Information on the Company Business Overview Engineering and Construction Principal Engineering and Construction Activities ; E&C Contracts: For 2013, approximately 53.0%, 30.9%, 7.3% and 8.8% of our E&C revenues were derived from: cost-plus fee; unit price; lump-sum; and EPC contracts, respectively. For 2012, approximately 37.9%, 48.5%, 5.0% and 8.6% of our E&C revenues were derived from: cost-plus fee; unit price; lump-sum; and EPC contracts, respectively. During 2013 we continued to derive significant revenues from cost-plus fee and unit price contracts, with a significant increase in cost-plus fee contracts. For a description of our contractual arrangements, see Item 4.B. Information on the Company Business Overview Engineering and Construction Contracts and Factors Affecting our Results of Operations Engineering and Construction ; and E&C End-Markets: For 2013, approximately 54.5%, 17.1%, 7.6%, 6.6%, 9.3%, 4.4% and 0.6%, of our E&C revenues were derived from: mining; real estate buildings; power; oil and gas; transportation; water and sewage; and other end-markets, respectively. For 2012, approximately 40.0%, 18.7%, 16.2%, 8.6%, 9.4%, 2.2% and 4.8%, of our E&C revenues were derived from: mining; real estate buildings; power; oil and gas; transportation; water and sewage; and other end-markets, respectively. During 2013 we experienced growth in the revenues from the mining end-market, and we maintain substantially similar levels in real estate buildings and transportation end-markets. Revenues in 2013 derived from the power and oil and gas end-market decreased in comparison with
133 The breakdown of E&C revenues by different business activities, types of contracts and end-markets tends to vary from period to period due to a variety of factors, including the timing of the execution of larger projects in any particular period, which is typically outside of our control. Gross Profit. Our E&C gross profit increased 37.1%, or S/ million, from S/ million for 2012 to S/ million for Our E&C gross margin for 2013 was 13.7% compared to 11.6% for This increase in E&C gross margin was due to both the growth in revenue in this segment as well as higher margins in contract mining due to the stage of execution of certain projects, as we typically obtain higher margins during the early stages of these projects. We estimate that fluctuations among the nuevo sol and the U.S. dollar between 2012 and 2013 resulted in an increase in our E&C cost of sales, as expressed in nuevos soles, of approximately S/.78.6 million, or 2.2%, during Operating Profit. Our E&C operating profit increased 42.3%, or S/ million, from S/ million for 2012 to S/ million for Our E&C administrative expenses increased 36.3%, or S/.58.1 million, which resulted in administrative expenses as a percentage revenues of 5.3% for 2013 compared to 4.5% for 2012, due in part to the consolidation of Vial y Vives and DSD Construcciones y Montajes, in which we acquired a controlling interest in October 2012 and August 2013, respectively, in addition to an increase of administrative expenses in line with the growth of revenues for the period. Our E&C operating profit for 2013 was positively impacted by S/.10.5 million in other income, mainly resulting from the reversal of provisions amounting to S/.4.8 million relating to labor contingencies in Vial y Vives and S/.1.1 million from the recovery of insurance claims in Stracon GyM. Our E&C operating margin for 2013 was 8.6% compared to 7.0% for In addition, our E&C segment had S/.42.0 million in profit from minority interests held by Vial y Vives in several of its projects undertaken in Chile, as well as the minority participation of GyM in Viva GyM reflected under share of profit and loss in associates in our audited annual consolidated financial statements. Infrastructure The table below sets forth selected financial information related to our Infrastructure segment. Year ended December 31, Variation (in millions of S/.) % Revenues Gross profit Operating profit Revenues. The table below sets forth the breakdown of our Infrastructure revenues by principal lines of business. Year ended December 31, Variation (in millions of S/.) % Toll Roads Mass Transit Water Treatment Energy Total
134 Our Infrastructure revenues increased 29.8% or S/ million, from S/ million for 2012 to S/ million for The variation in our Infrastructure revenues principally reflected the following: Toll Roads: a 58.9%, or S/.72.6 million, increase in revenues, from S/ million for 2012 to S/ million for 2013, due to a 5.0% increase in vehicular traffic in Norvial and higher levels of maintenance of Survial since June 2013; Mass Transit: a 62.1%, or S/.45.4 million, increase in revenues, from S/.73.1 million for 2012 to S/ million for 2013, primarily due to the increase of trains in operation from five trains in 2012 to 14 trains (including two backup trains) beginning in July 2013; Water Treatment: a 11.0%, or S/.4.5 million, increase in revenues, from S/.41.0 million for 2012 to S/.45.5 million for 2013, primarily due to progress in the construction of the La Chira waste water treatment plant; and Energy: a 11.9%, or S/.34.1 million, increase in revenues, from S/ million for 2012 to S/ million for 2013 primarily due to a 10.8% growth in our barrel daily production (BDP 1,775 vs BDP 1,1601 in 2012) resulting from increased drilling of wells and the performance of certain wells, while the international oil prices remained relatively stable (average price per basket of oils of US$ bbl vs. US$ bbl), partially offset by lower processing levels at the our gas processing plant which declined from 9,597.5 MMcf during 2012 to 6,603.4 MMcf in 2013 due to higher hydroelectric production rather than termic production in the country. We estimate that fluctuations among the nuevo sol and the U.S. dollar between 2012 and 2013 resulted in an increase in our Infrastructure revenues, as expressed in nuevos soles, of approximately S/.32.9 million, or 4.9%, during Gross Profit. The table below sets forth the breakdown of our Infrastructure gross profit by principal lines of business. Year ended December 31, Variation (in millions of S/.) % Toll Roads Mass Transit (2.7) Water Treatment (71.6) Energy (12.0) Total Our Infrastructure gross profit increased 8.2%, or S/.14.2 million, from S/ million for 2012 to S/ million for Our Infrastructure gross margin was 27.4% for 2013 compared to 32.9% for The variation in our Infrastructure gross profit principally reflected the following: Toll Roads: a 24.7%, or S/.13.2 million, increase in gross profit, from S/.53.3 million for 2012 to S/.66.5 million for This increase was primarily due to the increase in revenues from Norvial and the periodic maintenance of Survial. Our Toll Roads gross margin was 33.9% for 2013 compared to 43.2% for Mass Transit: a 828.5%, or S/.22.4 million increase in gross profit, from a S/.2.7 million gross loss for 2012 to S/.19.7 million gross profit for 2013, primarily due to an increase in revenues, due to an increase in trains in operation beginning in July Water Treatment: a 71.6%, or S/.8.0 million, decrease in gross profit for 2013, from S/.11.2 million gross profit for 2012 to S/.3.2 million gross profit for 2013, primarily due to the costs related to the construction of the La Chira waste water treatment plant. Our Water Treatment gross margin was 7.0% for 2013 compared to 27.3% for Our water treatment gross margin was impacted due to the inclusion of certain financial costs in cost of sales. 129
135 Operating Profit. The table below sets forth the breakdown of our Infrastructure operating profit by principal lines of business. Our Infrastructure operating profit increased 9.6%, or S/.13.4 million, from S/ million for 2012 to S/ million for Our Infrastructure operating margin was 22.5% for 2013 compared to 26.6% for The variation in our Infrastructure operating profit principally reflected the following: Real Estate Energy: a 12.0%, or S/.13.3 million, decrease in gross profit, from S/ million for 2012 to S/.97.5 million for 2013, primarily due to the lower processing levels in the gas processing plant. Our Energy gross margin was 30.4% for 2013 compared to 38.6% for Year ended December 31, Variation (in millions of S/.) % Toll Roads Mass Transit (10.7) Water Treatment (69.0) Energy (16.9) Total Toll Roads: a 27.1%, or S/.12.8 million, increase in operating profit, from S/.47.0 million for 2012 to S/.59.8 million for 2013, primarily due to the increase in gross profit in Norvial and Survial. Our Toll Roads operating margin was 30.5% for 2013 compared to 38.2% for Mass Transit: a 216.3%, or S/.23.1 million, increase in operating profit, from an operating loss of S/.10.7 million for 2012 to an operating profit of S/.12.4 million for 2013, primarily due to the increase in gross profit. Water Treatment: a 69.0%, or S/.6.7 million, decrease in operating profit, from S/.9.7 million for 2012 to an operating profit of S/.3.0 million for 2013, due to the decrease in gross profit. Our Water Treatment operating margin for 2013 was 6.6% compared to 23.6% for Energy: a 16.9%, or S/.15.8 million, decrease in operating profit, from S/.93.6 million for 2012 to S/.77.8 million for 2013, primarily due to the decrease in gross profit. Our Energy operating margin was 24.2% for 2013 compared to 32.6% for The table below sets forth selected financial information related to our Real Estate segment. Year ended December 31, Variation (in millions of S/.) % Revenues Gross profit Operating profit Revenues. Our Real Estate revenues increased 30.7%, or S/.73.6 million, from S/ million for 2012 to S/ million for This increase was primarily due to a 29.0% increase in the number of affordable housing units delivered, with 1,619 units delivered in 2013 compared to 1,255 units delivered in This increase in delivered units is due to the timing of completion of units. 130
136 We estimate that fluctuations among the nuevo sol and the U.S. dollar between 2012 and 2013 resulted in an increase in our Real Estate revenues, as expressed in nuevos soles, of approximately S/.2.5 million, or 0.8%, during Gross Profit. Our Real Estate gross profit increased 31.1%, or S/.27.0 million, from S/.86.7 million for 2012 to S/ million for 2013, mainly as a result of the increase in the number of affordable housing units delivered. Our Real Estate gross margin was 27.0% for 2013 compared to 31.1% for We estimate that fluctuations among the nuevo sol and the U.S. dollar between 2012 and 2013 resulted in an increase in our Real Estate cost of sales, as expressed in nuevos soles, of approximately S/.2.6 million, or 1.3%, during Operating Profit. Our Real Estate operating profit increased 39.3%, or S/.26.6 million, from S/.67.6 million for 2012 to S/.94.2 million for 2013, primarily as a result of the increase in our Real Estate gross profit. Technical Services The table below sets forth selected financial information related to our Technical Services segment. Year ended December 31, Variation (in millions of S/.) % Revenues 1, , Gross profit Operating profit (1.1) Revenues. The table below sets forth the breakdown of our Technical Services revenues by principal lines of business. Year ended December 31, Variation (in millions of S/.) % Operation and Maintenance of Infrastructure Assets IT Services Electricity Networks Services (18.8) Total 1, , Our Technical Services revenues increased 7.9%, or S/.85.8 million, from S/.1,083.3 million for 2012 to S/.1,169.1 million for The variation in our Technical Services revenues principally reflected the following: Operation and Maintenance of Infrastructure Assets: a 76.6%, or S/ million, increase in revenues, from S/ million for 2012 to S/ million for 2013, primarily due to the increase in revenues from three road maintenance contracts that were awarded at the end of 2012 and the periodic maintenance of Survial; IT Services: a 8.8%, or S/.18.4 million, increase in revenues, from S/ million for 2012 to S/ million for 2013, primarily as a result of the increase in IT outsourcing service and application outsourcing, specifically software factory projects; and Electricity Networks Services: a 18.8%, or S/ million, decrease in revenues, from S/ million for 2012 to S/ million for 2013, primarily due to the closure of CAM s electrical products sales division as part of our restructuring of the business. 131
137 We estimate that fluctuations among the nuevo sol and the U.S. dollar between 2012 and 2013 resulted in an increase in our Technical Services revenues, as expressed in nuevos soles, of approximately S/.8.0 million, or 1.2%, during We estimate that fluctuations among the nuevo sol and the Chilean peso between 2012 and 2013 resulted in a decrease in our Technical Services revenues, as expressed in nuevos soles, of approximately S/.1.8 million, or 0.4%, during Gross Profit. The table below sets forth the breakdown of our Technical Services gross profit by principal lines of business. Year ended December 31, Variation (in millions of S/.) % Operation and Maintenance of Infrastructure Assets IT Services Electricity Networks Services Total Our Technical Services gross profit increased 72.4%, or S/.75.2 million, from S/ million for 2012 to S/ million for Our Technical Services gross margin was 15.3% for 2013 compared to 9.6% for The variation in our Technical Services gross profit principally reflected the following: Operation and Maintenance of Infrastructure Assets: a 12.4%, or S/.5.1 million, increase in gross profit, from S/.41.2 million for 2012 to S/.46.3 million for 2013, primarily due to the increase in revenues, partially offset by an increase in the cost of sales due to higher costs in regional Cuzco roads as a result of ongoing discussions with the regional government. Our Operation and Maintenance of Infrastructure Assets gross margin was 10.8% for 2013 compared to 16.9% for 2012; IT Services: a 20.5%, or S/.8.0 million, increase in gross profit, from S/.39.0 million for 2012 to S/.47.1 million for 2013, primarily related to growth in revenues and, in particular, higher margin services. Our IT Services gross margin was 20.8% for 2013 compared to 18.8% for 2012; and Electricity Networks Services: a 261.6%, or S/.62.1 million, increase in gross profit, from S/.23.7 million for 2012 to S/.85.9 million for 2013, primarily due to better margins as a consequence of the improvement in the operating processes implemented since the acquisition of CAM. Our Electricity Networks Services gross margin was 16.7% for 2013 compared to 3.8% for We estimate that fluctuations among the nuevo sol and the U.S. dollar between 2012 and 2013 resulted in an increase in our Technical Services cost of sales, as expressed in nuevos soles, of approximately S/.10.3 million, or 1.8%, during We estimate that fluctuations among the nuevo sol and the Chilean peso between 2012 and 2013 resulted in an decrease in our Technical Services cost of sales, as expressed in nuevos soles, of approximately S/.1.5 million, or 0.4%, during Operating Profit. The table below sets forth the breakdown of our Technical Services operating profit by principal lines of business. Year ended December 31, Variation (in millions of S/.) % Operation and Maintenance of Infrastructure Assets (31.5) IT Services Electricity Networks Services Total (1.1) Our Technical Services operating profit decreased 1.1%, or S/.0.8 million, from S/.72.2 million for 2012 to S/.71.4 million for Our Technical Services operating margin for 2013 was 6.1% compared to 6.7% for The variation in our Technical Services operating profit principally reflected the following: 132
138 Financial (Expense) Income, Net Our net financial expense increased S/ million from net financial expenses of S/.10.3 million in 2012 to net financial expenses of S/ million in Excluding foreign exchange differences, our net financial expense increased 37.6%, or S/.11.8 million, from net financial expenses of S/.31.4 million for 2012 to net financial expenses of S/.43.2 million for This increase was primarily due to financial expenses from our syndicated loan, which we repaid in September Our exchange difference, net decreased S/.91.5 million, from a gain of S/.21.1 million for 2012 to a loss of S/.70.4 million for This decrease is due to both the depreciation of the nuevo sol against the U.S. dollar from 2012 to 2013, as well as our higher U.S. dollar liabilities in Share of Profit and Loss in Associates Our share of profit and loss in associates increased S/.34.1 million from a profit of S/.0.6 million in 2012 to a profit of S/.34.7 million in This increase is primarily due to the results from engineering and construction projects in which Vial y Vives, which we acquired in October 2012, has a minority participation. Income Tax Our income tax increased 17.9%, or S/.27.7 million, from S/ million for 2012 to S/ million for This increase in income tax was primarily due to an increase in profit before tax. Our effective tax rates for 2012 and 2013 were 29.7% and 30.7%, respectively. Net Profit Operation and Maintenance of Infrastructure Assets: a 31.5%, or S/.5.7 million, decrease in operating profit, from S/.18.1 million for 2012 to S/.12.4 million for 2013, primarily due to an increase in costs related to the preparation of infrastructure concession bids. Our Operation and Maintenance of Infrastructure Assets operating margin was 2.9% for 2013 compared to 7.5% for 2012; IT Services: a 4.3%, or S/.0.8 million, increase in operating profit, from S/.18.6 million for 2012 to S/.19.4 million for 2013, primarily due to the increase the gross profit, partially offset by an increase in administrative expenses. Our IT Services operating margin was 8.6% for 2013 compared to 8.9% for 2012; and Electricity Networks Services: a 11.5%, or S/.4.1 million, increase in operating profit, from S/.35.5 million for 2012 to S/.39.6 million for 2013, primarily due to an increase in gross profit, partially offset by lower reversal of provisions in 2013 (S/.13.6 million) than in 2012 (S/.68.0 million) in connection with the CAM acquisition which offset the increase in gross profit between the two periods, as described in Factors Affecting Our Results with Operation Acquisitions. Our Electricity Network Services operating margin was 7.7% for 2013 compared to 5.6% for Our net profit increased 12.5%, or S/.45.9 million, from S/ million for 2012 to S/ million for Net profit attributable to controlling interests increased 10.3%, while net profit attributable to non-controlling interests increased 20.7%. Net profit attributable to non-controlling interests increased primarily as a result of the consolidation of Vial y Vives for a complete year in 2013 and consolidation of DSD Construcciones y Maquinaria for the last two months of 2013, which were not included in See General Accounting for Subsidiaries, Joint Operations and Associated Companies. B. Liquidity and Capital Resources Our principal sources of liquidity have historically been cash flows from operating activities and, to a lesser extent, indebtedness. Our principal uses of cash (other than in connection with our operating activities) have historically been: capital expenditures in all our business segments, including acquisitions and investments in our infrastructure concessions; servicing of our debt; and payment of dividends. We believe that these sources of cash will be sufficient to cover our working capital needs in the ordinary course of business. We believe that our cash 133
139 from operations, the net proceeds from our offering of ADSs in July 2013 and our current financing sources are sufficient to satisfy our current capital expenditures and debt service obligations through the next four years. We anticipate financing future acquisitions, infrastructure investments and land purchases with a combination of cash from operations, net proceeds from our offering of ADSs in July 2013, additional indebtedness and/or financial contributions from partners. At December 31, 2014, our cash and cash equivalents totaled S/ million (US$273.8 million), of which S/.33.1 million (US$11.1 million) was held by our foreign subsidiaries. We currently intend to distribute these funds to our company to the extent we believe they are not required for the local operations. We are not currently required to accrue or pay any material taxes associated with the repatriation of these funds. In addition, our foreign subsidiaries have no contractual restrictions, and we are not aware of any material legal restrictions, on their ability to transfer funds to us in the form of cash dividends, loans or advances. Cash Flows The table below sets forth certain components of our cash flows for 2012, 2013 and Year ended December 31, (in millions of S/.) Net cash provided by (used in) operating activities (367.7) (40.5) Net cash provided by (used in) investing activities (400.0) (340.0) (546.0) Net cash provided by (used in) financing activities (20.8) Net increase (net decrease) in cash (138.6) Cash Flow from Operating Activities Net cash flow used in operating activities in 2014 was lower than in For 2014 this reflects an increase in accounts payable of S/ million mainly related to the reduction of the advance payments from clients in our E&C segment, and the increase in accounts receivables of S/ million mainly due to our E&C segment. Net cash flow used in operating activities in 2013 was higher than in For 2013 this reflects a decrease in other accounts payable of S/ million mainly related to the reduction of the advance payments from clients in our E&C segment, and the increase in accounts receivables. Additionally, cash flow provided by operating activities was used to pay taxes in the amount of S/ million. Cash Flow from Investing Activities Net cash flow used in investing activities in 2014 was higher than in This primarily reflects the purchase of machinery and equipment, and acquisition of COGA, Morelco, Coasin and the additional stake in Stracon GyM. Net cash flow used in investing activities in 2013 was lower than in It mainly includes the purchase of machinery and equipment, the acquisition of DSD Construcciones y Maquinaria, and the acquisition of an additional stake in Norvial and TGP. Cash Flow from Financing Activities Net cash flow provided by financing activities in 2014 was lower than in This is primarily due to the issuance of ADSs in In 2014, we financed our investing activities with the proceeds from the issuance of ADSs plus an increase in our indebtedness. Net cash flow provided by financing activities in 2013 was higher than in This primarily reflects our issuance of ADSs in July 2013, partially offset by the cancelation of our syndicated loan in September
140 Indebtedness As of December 31, 2014, we had a total outstanding indebtedness of S/.1,751.6 million (US$586.0 million) as set forth in the table below. Range of Maturity Currency Dates Segment Type (in millions of US$) (in millions of S/.) (in millions of CLP)(1) (in millions of COP) Total in millions of S/. Total in millions of US$ Weighted average interest rate Earliest Latest Engineering and Construction: Leasing , , /01/ /02/2023 Promissory note , /02/ /26/2018 Infrastructure: Leasing /01/ /01/2017 Long-term loan /15/ /31/2020 Promissory note /30/ /25/2019 Real Estate: Leasing /01/ /01/2022 Promissory note /06/ /14/2015 Technical Services: Leasing , /31/ /28/2020 Promissory note , /01/ /15/2018 Corporate: Leasing /04/ /04/2018 Total , , , (1) Includes debt held by CAM and its subsidiaries that is denominated in Chilean pesos, Colombian pesos and Brazilian reais, all of which is presented in Chilean pesos in the table above. As of March 31, 2015, S/ million (US$325.4 million) of our total indebtedness indicated in the table above has matured, of which S/ million (US$219.9 million) was repaid and S/ million (US$105.4 million) was renewed by extending the maturities. The weighted average interest rate of this renewed indebtedness and additional indebtedness was 4.8% and the maturity dates ranged from April 13, 2015 to March 21, Norvial entered into two loans with the Inter-American Development Bank and with the International Finance Corporation in April 2005, each in an outstanding principal amount of US$7.6 million as of December 31, These loans accrued interest at an annual rate of 6.9% and were scheduled to mature in November These loans benefitted from a trust through which the cash flows from Norvial s toll fees are collected. The proceeds of these loans were used for the construction, rehabilitation and maintenance of the Norvial road. In January 2014, we repaid this loan in full. Below is a description of our material outstanding indebtedness as of March 31, As of such date, we were in compliance in all material respects with the financial covenants corresponding to our outstanding indebtedness. Leasing. As of December 31, 2014, we were party to numerous leasing agreements with several financial institutions which in the aggregate amounted to approximately S/ million (US$109.6 million). We entered into such agreements primarily for the purpose of leasing the equipment and other assets necessary to run our operations. Upon maturity of each leasing agreement, we have the option to purchase or return the equipment or assets to the lessor. The amounts owed under these leasing agreements are generally repaid in monthly installments, subject to a minimum guaranteed payment corresponding to the minimum amount for which the equipment or assets could be sold to a third-party. Citibank, N.A. Secured Loan. Our subsidiary GMP has a secured loan with Citibank, N.A. under a loan agreement dated September 19, 2008 and amended on August 27, 2012 in an outstanding principal amount of S/.60.4 million (US$20.2 million) as of December 31, This loan accrues interest at an annual rate of three month LIBOR plus: (i) 1.75% if, at the installment payment date, the exchange rate between the nuevo sol and U.S. dollar remains between S/.2.60 to S/.2.75 per US$1.00 or (ii) 1.95%, if otherwise. The loan matures in August The proceeds of the loan were used by our subsidiary GMP to finance the construction, equipment and operation of the Gas Pariñas plant in Talara. The agreement is secured by certain land, equipment and accounts receivable of GMP. The agreement contains certain customary covenants, including restrictions on the ability of GMP to pay dividends if it is in default under the loan and the obligation by GMP to maintain the following financial covenants during the term of the agreement: (1) Leverage Ratio (as defined therein) shall not be greater than 1.50; (2) Debt 135
141 Service Coverage Ratio (as defined therein) shall not be less than 1.20; (3) Liquidity Ratio (as defined therein) shall not be less than 1.10; and (4) Debt Coverage Ratio (as defined therein) shall not be greater than As of the date of this annual report, we were in compliance with these financial covenants. BCP Loan. In January 2014, Norvial signed a short-term loan agreement with Banco de Crédito del Perú (BCP) for a total S/.150 million. As of December 31, 2014, we had S/.85 million of debt outstanding under this credit facility with an annual interest rate of 6.37% and a maturity of four months. This loan is expected to be repaid with the issuance of bonds to be placed in the Peruvian capital market to finance the construction of the second phase of Ancón - Huacho Pativilca highway. Senior Secured Notes. In June 2014, GyM Ferrovias signed a short term loan with BBVA Continental of S/.200 million, with an interest rate of 5.75% and a maturity of December In December 2014, the short term loan with BBVA Continental was refinanced with a short term loan provided by Banco Central del Peru ( BCP ) due in February 2015 with an annual interest rate of 5.90%. Additionally, in August 2014, GyM incurred another short term loan with BCP of S/.200 million with an interest rate of 5.90% and a maturity of January Both loans have been reapaid with an international bond issuance under the Regulation S placed in February In February 2015, GyM Ferrovias issued a total of S/.629,000,000 Series A Senior Secured VAC-Indexed Notes due 2039, with an annual interest rate of 4.75% plus adjustments for inflation. Derivative Financial Instruments In February 2012, our subsidiary GyM Ferrovías entered into a forward rate agreement with BBVA S.A. for an initial amount of EUR 98.6 million to hedge the foreign exchange risk pertaining to expenditures incurred in euros to a foreign supplier for the development, maintenance and operation of the Lima Metro. GyM Ferrovías received EUR39.2 million outstanding under the agreement at a fixed exchange rate of S/ per euro beginning in March 2013 and up to S/ per euro in January In August 2012, our subsidiary GMP entered into two interest rate swaps with Citibank, N.A. to hedge its exposure to fluctuations in LIBOR under its unsecured loan with Citibank, N.A. described above. These interest rate swaps establish a fixed annual rate of 5.05%, payable at each interest payment date under the loan. In September 2012, our subsidiary Viva GyM entered into a forward foreign exchange agreement with Banco de Crédito del Peru to hedge the foreign exchange risk on the amount to be received in U.S. dollars as proceeds from a loan agreement with Banco de Crédito del Peru in connection with the construction of the Torre Real 8 project. Under the agreement, Viva GyM received in nuevos soles the equivalent of US$3.6 million in 12 equal installments payments of US$300,000 determined at a fixed exchange rate of S/ per U.S. dollar on the first installment in October 2012 and up to S/ per U.S. dollar on the final installment in September In February 2013, Viva GyM settled a second forward exchange agreement with Banco de Crédito related to the same project pursuant to which it received in nuevos soles the equivalent of US$3.3 million in scheduled installments (between July 2013 and January 2014). For additional information about our derivative financial instruments and borrowings, see notes 7.1 and 18 to our audited annual consolidated financial statements included in this annual report. Capital Expenditures The table below provides our total capital expenditures incurred in 2012, 2013 and Year ended December 31, (in millions of US$) (in millions of S/.) Engineering and Construction(1)(2) Infrastructure(3) Real Estate(4)
142 Capital expenditures for our E&C segment of approximately S/ million (US$163.5 million), S/ million (US$73.1 million) and S/ million (US$162.2 million) in 2012, 2013 and 2014, respectively, primarily correspond to the purchase of equipment and machinery and, to a lesser extent, investments relating to mining services contracts. In 2012 and 2013, capital investments in this segment also include S/ million (US$55.6 million) and S/.9.1 million (US$3.3 million) respectively, with respect to the acquisition of a majority stake in Vial y Vives, in 2013, S/ million (US$37.2 million) with respect to the acquisition of DSD Construcciones y Montajes in 2013; and in 2014, S/74.7 million (US$25 million) with respect to additional stake of Stracon GyM, S/.17.9 million (US$ 6 million) with respect to an additional stake in CAM Peru and S/ million (US$ 78.4 million) with respect to the acquisition of Morelco. Capital expenditures for our Infrastructure segment of approximately S/ million (US$118.3 million), S/ million (US$130.8 million) and S/ million (US$75.9 million), in 2012, 2013 and 2014, respectively, correspond to periodic maintenance relating to our Norvial toll road concession and, in our Energy line of business, oil development drilling activities as well as improvements for our gas processing plant and investments in Metro de Lima. In 2012, 2013 and 2014, capital expenditures for our Infrastructure segment also included the purchase of trains for Line One of the Lima Metro and the construction of the railway maintenance and repair yard. Capital expenditures for our Real Estate segment of approximately S/ million (US$50.3 million), S/.75.7 million (US$27.1 million) and S/ million (US$ 40.0 million) in 2012, 2013 and 2014, respectively, primarily correspond to the purchase of land for real estate projects, including the Villa El Salvador, Barranco, San Isidro office building and Parques de Callao projects in 2012, the Pezet, Nuevo Chimbote, Canta Callao and Chiclayo Bolognesi projects in 2013 and El Tigre, Panorama and Huancayo projects in Capital expenditures for our Technical Services segment of approximately S/.39.8 million (US$15.6 million) and S/.37.5 million (US$13.4 million) and S/ million (US$40.4 million) in 2012, 2013 and 2014, respectively, primarily correspond to maintenance of equipment relating to Concar, CAM and GMD. In 2014, Corporate segment investments include S/.75.8 million (US$ 25.4 million) for the acquisition of COGA and S/.88.3 million (US$ 29.5 million) for additional stake in GyM and Viva GyM. plus the construction of the new office building for corporate use. 137 Year ended December 31, (in millions of US$) (in millions of S/.) Technical Services(2)(5) Corporate Total , (1) In our consolidated financial statements, in accordance with IFRS, we record in cash flow used in investing activities with respect to equipment leases only the amounts paid during the period as opposed to the total amount of lease payments, which is included in the table above. In 2012, 2013 and 2014, the differences between the amounts reflected in the table above and the amounts reflected in our consolidated cash flow statements for our E&C segment amounted to S/.(23.2) million, S/.(33.1) million and S/.(195.9) million,, respectively. (2) Includes S/ million, S/ and S/ million of capital expenditures related to acquisitions in 2012 and 2013 and 2014, respectively. (3) Includes our disbursements of S/ million in 2012, S/ million in 2013 and S/.7.3 million in 2014, for the purchase of 19 additional trains and the construction of the maintenance and repair yard for the Lima Metro, which in accordance with IFRS accounting for public service concessions are recorded in our consolidated financial statements as a long-term accounts receivable. See Item 5.A. Operating and Financial Review and Prospects Operating Results Results of Operations General Infrastructure. (4) Includes S/.126.8, S/.74.2 million and S/ million, in investments in 2012, 2013 and 2014 respectively, for the purchase of land by our Real Estate segment, which in accordance with IFRS are recorded in our consolidated financial statements as inventory. (5) In our consolidated financial statements, in accordance with IFRS, we record as cash flow used in investing activities with respect to equipment leases only the amounts paid during the period as opposed to the total amount of lease payments which is included in the table above. In 2012, 2013 and 2014, the differences between the amounts reflected in the table above and the amounts reflected in our consolidated cash flow statements for our Technical Services segment amounted to S/.(9.2) million, S/.(6.6) million and S/.(49.1) million, respectively.
143 Divestitures in 2012 consisted of approximately S/.23.5 million (US$9.2 million) relating to the sale of equipment from GyM to Stracon GyM. Divestitures in 2013 consisted of approximately S/.22.7 million (US$8.1 million) relating to sale of equipment of GyM and Stracon GyM and sale of our participation in a parking lot located in San Isidro, Lima. Divestitures in 2014 consisted of approximately S/.43.0 million (US$14.4 million) relating to sale of equipment by GyM and Stracon GyM. We have budgeted S/.1,144.6 million (US$382.9 million) in capital expenditures for Our current plans for our E&C segment contemplate capital expenditures in 2015 of approximately S/ million (US$62.6 million) mainly for the purchase of equipment and machinery. Our current plans for our Infrastructure segment contemplate capital expenditures in 2015 of approximately S/ million (US$158.8 million) principally for the construction of the second stage of Norvial, investments in our new concession Via Expresa Sur, and for investments in oil development drilling activities. Our current plans for our Real Estate segment contemplate capital expenditures in 2015 of approximately S/.98.6 million (US$33.0 million) for the purchase of land for real estate development projects. Our current plans for our Technical Services segment contemplate capital expenditures in 2015 of approximately S/ million (US$49.5 million) principally for the purchase of equipment used in our operations. Our current plans for our Corporate segment contemplate capital expenditures in 2015 of approximately S/ million (US$79.0 million), including S/ million (US$75.0 million) for potential acquisitions and S/.11.9 million (US$4.0 million) for corporate purposes. As we determine the capital expenditures currently reflected in our Corporate segment, we will assign these expenditures to the corresponding segment. These estimates are subject to change. We routinely evaluate acquisitions, new infrastructure concessions, land purchases and other investment opportunities that are aligned with our strategic goals, particularly in Peru, Chile and Colombia. We cannot assure you that we will find opportunities on terms that we consider to be favorable to us, whether we will be able to take advantage of such opportunities should they arise, or the timing of and funds required by such opportunities. In addition, we expect to finance these opportunities with a combination of cash on hand, net proceeds from our offering of ADSs in July 2013, new borrowings and/or financial contributions from partners, depending on a variety of commercial considerations at such time. See Part I. Introduction Forward-Looking Statements. C. Research and Development, Patents and Licenses Not applicable. D. Trend Information Our Main Market: Peru Overview of the Peruvian Economy Our results are substantially affected by economic conditions prevailing in Peru. The Peruvian economy has been one of the fastest growing economies globally during the period from 2009 to According to the Peruvian Central Bank, Peruvian real GDP grew at an average rate of 5.8% during that period, the highest rate in South America. The economic expansion during this period was a result of robust domestic demand, increase in investment, price stability, increase in foreign direct investment, improvement in public finances, and lower external debt, among other factors. In addition, the country s strong economic growth has led to a 48.0% increase in GDP per capita from US$4,361 in 2009 to US$6,457 in Average annual inflation, measured by the change in the CPI index, was 2.6% in the period from 2009 to Peru s price stability has also been reflected in its currency, the nuevo sol, which appreciated from an average of S/.3.01 per US$1.00 in 2009 to an average of S/.2.84 per US$1.00 in 2014, an appreciation of 5.7%. Peru s sovereign debt has been granted investment grade rating by S&P, Fitch and Moody s. At the end of 2014, Peruvian sovereign debt had one of the highest credit ratings in the South American region, rated BBB+ by S&P (August 2013) and Fitch (October 2013) and A3 by Moody s (July 2014). 138
144 The following table sets forth the main economic indicators of the Peruvian economy from 2009 to In US$ billion, unless stated otherwise Nominal GDP Nominal GDP / capita (US$) 4, , , , , ,456.5 Real growth rates (% based on local currency GDP 0.9% 8.8% 6.9% 6.3% 5.0% 2.4% Private consumption 2.4% 6.3% 6.2% 5.8% 5.2% 4.1% Private investment (15.1%) 22.1% 11.4% 13.5% 3.9% (1.6%) Foreign direct investment (7.1%) 31.5% (2.6%) 48.7% (16.9%) (25.2%) Public expenditure (consumption and investment) 18.1% 14.8% (3.5%) 13.3% 9.4% 3.0% Total private and public fixed investment(1) (9.2%) 23.2% 4.8% 14.8% 5.9% (2.0%) Exports (3.2%) 1.3% 8.8% 5.9% 1.0% (0.3%) Imports (18.6%) 24.0% 9.8% 10.4% 5.1% (1.4%) Inflation (measured by change in CPI) 0.2% 2.1% 4.7% 2.6% 2.9% 3.2% Average exchange rate (S/./US$) End of period exchange rate (S/./US$) Central Bank interest rate (end of period) 1.25% 3.00% 4.25% 4.25% 4.00% 3.50% Population (million)(1) Unemployment rate(1) 8.4% 7.9% 7.7% 6.8% 6.0% 6.0% Total public debt Public debt/nominal GDP (%) 26.0% 23.5% 21.4% 19.7% 19.2% 20.1% Net reserves Net reserves/nominal GDP (%) 26.1% 28.7% 27.7% 32.1% 31.8% 30.7% Fiscal surplus (deficit)/nominal GDP (%) (1.3%) (0.2%) 2.0% 2.1% 0.8% (0.1%) Source: Peruvian Central Bank, SBS, Ministry of Economy and Finance, National Statistical Institute of Peru (INEI), IMF. (1) 2014 projected by IMF. The following table sets forth real gross domestic product by expenditure for the years indicated. GDP by Expenditure (% of GDP unless otherwise stated) Government consumption Private consumption Total fixed investment Public sector Private sector Change in inventories (1) (2.1) Exports of goods and services Imports of goods and services Net exports (1.2) (1.6) GDP (in billions of US$) Source: Peruvian Central Bank (1) Defined as the difference between the volume at the end of the period and the volume at the beginning of the period; valued at the average price over the period. Key Industry Sectors Relating to Our Business in Peru Construction and Infrastructure The Peruvian construction industry GDP is estimated at US$13.9 billion and accounted for 6.8% of the country s nominal GDP in 2014 according to the Peruvian Central Bank. Construction GDP grew at an average of 12.7% annually in nominal terms during the six years from 2009 to The following table illustrates that from 2009 to 2014, the average real growth rate in both private investment and construction in Peru was approximately two times the average real GDP growth rate, historically moving in the same direction as the change in the growth rate of overall real GDP. 139
145 Growth of Real Private Investment GDP and Real Construction Sector GDP vs. Real GDP Source: Peruvian Central Bank. Mining Mining Peru is a poly-metallic resources producer and exports several metals including silver, copper, zinc, gold and lead, among others. Peru is also a major contributor to global metal reserves. According to the U.S. Geological Survey of 2015, Peru holds 18.7% of global silver reserves, 12.6% of global zinc reserves, 9.7% of global copper reserves and 3.8% of global gold reserves as of January According to the Peruvian Central Bank, mining exports reached approximately US$20.4billion and represented 51.9% of total Peruvian exports in Upcoming mining projects comprise estimated capital expenditures of approximately US$18.9 billion from 2015 to 2017, according to APOYO Consultoría. As of February 2015, the Peruvian Ministry of Energy and Mines estimates 51 mining projects at various stages of development involving an estimated investment of US$63.9 billion. Mining Investment Projects by Level of Development Number of Projects US$ billion Expansion With approved Environmental Impact Assessment ( EIA ) With EIA under evaluation Exploration Total Source: Peruvian Ministry of Energy and Mines. Power and Utilities The power and utilities market in Peru has shown sustained growth with maximum electricity demand reaching 5,737 MW and growing at an average annual rate of 5.4% during the six years from 2009 to 2014, according to the Economic Operations Committee of Peru s National Interconnected System. The growth of the power and utilities market has led to the construction of power generation facilities, as well as the expansion of the power transmission and distribution network. According to the Peruvian Ministry of Energy and Mines, Peru had an installed generation capacity of 8,681 MW as of The Peruvian market is served by 31 major generation companies. As of December 2013, the nation s power transmission network spanned approximately 20,585 kilometers, according to OSINERGMIN. As of March 2014, there were 22 electric distribution companies across Peru. Oil and Gas The oil and gas industry has been one of the most dynamic sectors in Peru with a sector nominal GDP average annual growth rate of 9.2% during the six years from 2009 to Oil and gas activity includes the exploration and production, and transportation and commercialization of hydrocarbon products and derivatives. 140

146 According to the Peruvian Ministry of Energy and Mines, during 2014, local production of hydrocarbons was approximately 27 MMbbl, 38 MMboe of liquefied natural gas (LNG) and 80 MMboe of natural gas. These levels have grown an average of 9.2% annually from 2009 to Peruvian gas production increased considerably since 2004, when the Camisea project, the largest gas project in Peruvian history, began operations. The Peruvian Ministry of Energy and Mines reports that as of 2013 proven reserves of oil and gas amount to 4,125 MMboe. These reserves have increased since 2008, due to increased exploration activities, as evidenced in the chart below. The Peruvian government s reserves methodology may differ materially from the one mandated by the SEC. Hydrocarbons Proven Reserves and Production Evolution in Peru (in MMboe) Source: Peruvian Ministry of Energy and Mines. Our Other Markets: Chile and Colombia Chile Overview of the Chilean Economy Our activities in Chile span across the E&C and power services sectors. The following table sets forth the main economic indicators of the Chilean economy for the period from 2009 to Values in nominal US$ billion unless otherwise stated Nominal GDP Nominal GDP / capita (US$) 10, , , , , ,579.4 Real GDP growth rate (%) (0.9%) 6.1% 5.9% 5.6% 4.1% 1.9% Inflation (%, measured by change in CPI) (1.4%) 3.0% 4.4% 1.5% 3.0% 4.6% Total private and public fixed investment Average exchange rate (CLP/US$) End of period exchange rate (CLP/US$) Values in nominal US$ billion unless otherwise stated Population (million) (1) Unemployment rate Public Debt / nominal GDP (%) 20.8% 19.4% 27.4% 26.2% 25.5% 24.9% Net reserves / nominal GDP (%) 14.7% 12.9% 16.9% 15.5% 14.8% 15.7% Fiscal surplus (deficit) / nominal GDP (%) (4.3%) (0.5%) 1.3% 0.6% (0.6%) (1.6%) Source: Chilean Central Bank, Chilean Government Budget Office, IMF, Global Insight. (1) 2014 Projected by the IMF. 141
147 The Chilean economy grew at an average annual rate of 3.8% during the six years from 2009 to 2014 in real terms. Considering only the post-crisis period (the four years from 2010 to 2014), the annual growth rate rises to 4.7%, one of the highest in South America. This expansion was mainly driven by a strong domestic demand in real terms: fixed investment grew on average at 3.7% per year and total consumption grew on average at 5.3% per year during the six years from 2009 to Inflation has remained stable since 2010, averaging 2.5% between 2009 and 2014, in line with the Chilean Central Bank s inflation target of 3% +/- 1%. Chile s sovereign debt has the highest rating in the region, rated AA- by S&P (December 2012), Aa3 by Moody s (October 2013) and A+ by Fitch (October 2013). Colombia Overview of the Colombian Economy Our current activities in Colombia involve technical services provided primarily to the power services sector. The following table sets forth the main economic indicators of the Colombian economy for the period from 2009 to Values in nominal US$ billion unless otherwise stated Nominal GDP Nominal GDP / capita (US$) 5, , , , , ,019.1 Real GDP growth rate (%) 1.7% 4.0% 5.9% 4.0% 4.9% 4.6% Inflation (%, measured by change in CPI) 2.0% 3.2% 3.7% 2.4% 1.9% 3.7% Total private and public fixed investment (1) Average exchange rate (COP/US$) 2, , , , , ,001.1 End of period exchange rate (COP/US$) 2, , , , , ,392.5 Population (million) (2) Unemployment rate (2) 12.0% 11.8% 10.8% 10.4% 10.3% 9.7% Public Debt / nominal GDP (%) 35.0% 35.0% 33.8% 32.5% 34.5% 37.7% Net reserves / nominal GDP (%) 10.8% 9.9% 9.7% 10.1% 11.5% 12.5% Fiscal surplus (deficit) / nominal GDP (%) (3.8)% (3.5)% (2.1)% (1.8%) (2.2%) (2.6%) Source: Colombian National Department of Administration of Statistics (DANE), Colombian Central Bank, Colombian Treasury Department, IMF, Global Insight. Colombian real GDP grew at an average annual rate of 4.3% during the six years from 2009 to The country s strong economic growth is evidenced by an increase in GDP per capita from US$5,200 in 2009 to US$8,019 in Inflation has remained stable over recent years, averaging 2.8% per year from 2009 to 2014, in line with the Colombian Central Bank s inflation target of 3% +/- 1%. Additionally, Colombia s price stability has also been reflected in its currency, the Colombian peso, which appreciated from an average of COP 2,157.6 per US$1.00 in 2009 to an average of COP 2,001.1 per US$1.00 in Colombia s sovereign debt currently holds BBB rating from Fitch (December 2013) and S&P (April 2013), and Baa2 from Moody s (July 2014). Colombia is also recognized for its investor-friendly legal regime. E. Off-Balance Sheet Arrangements As of December 31, 2014, we did not have off-balance sheet arrangements that have or are reasonably likely to have a current or future effect on the company s financial condition, changes in financial condition, revenues or expenses, results of operations, liquidity, capital expenditures or capital resources that is material to investors. As of December 31, 2013, we had off-balance sheet arrangements relating to our acquisition and sale of interests in TGP, a Peruvian entity that operates gas transportation systems. As of December 31, 2012, our shares in TGP represented 0.6% of TGP s capital. In December 2013, we acquired from one of the TGP s shareholders, Pluspetrol, an additional 1.0% interest in TGP for US$20 million. As of December 31, 2013, the fair value of our interest in TGP equaled S/.88.3 million. The change in fair value from 2012 to 2013 of S/.19.1 million, net of the income tax of S/.8.2 million, is recorded within other comprehensive income. Together with the acquisition of the 1.0% interest, we acquired from Pluspetrol on behalf of the CPPIB an additional indirect interest of 11.3% in TGP. This investment for US$217 million was funded by CPPIB, and the risk and rewards of the investment were assumed by CPPIB. Given the features of the transaction, we have treated this acquisition and sale as an off-balance transaction because, in effect, we acted as an agent for CPPIB. Therefore, we have not recognized neither this investment in TGP nor any obligation to CPPIB. This transaction is part of an alliance entered into with CPPIB, whereby both parties commit themselves to initiate and develop projects in the oil and gas industry. On December 27, 2013 we announced our intention to transfer the previously acquired interest of 11.34% in TGP to two companies, CPPIB (10.43%) and to Corporación Financiera de Inversiones CFI (0.91%), if none of the existing TGP shareholders exercised their right of first refusal. The transfer of interest to these entities took place in February 2014.
148 F. Tabular Disclosure of Contractual Obligations The following table sets forth our contractual obligations with payment terms as of December 31, Payments Due By Period (in millions of S/.) More Less than 1 year 1-3 years 3-5 years than 5 Years Total Indebtedness(1) 1, ,419.4 Capitalized Lease Obligations(1) Interest(2) Purchase Obligations(3) Total(4) 1, ,
149 (1) Includes principal only of our indebtedness and capitalized lease obligations. (2) Includes the effect of our interest swap agreements described in Derivative Financial Instruments. (3) Includes the payments due with respect to the increase in our interest in Almonte in Excludes S/.1,168.3 million (US$390.9 million) accounts payable within 90 days, except for certain material accounts payable, such as the purchase of land. (4) Excludes building leases, which are not material. G. Safe Harbor See Part I. Introduction Forward-Looking Statements. ITEM 6. DIRECTORS, SENIOR MANAGEMENT AND EMPLOYEES A. Directors and Senior Management General Our business and affairs are managed by our board of directors in accordance with our by-laws, shareholder meeting rules of procedure, board of directors rules of procedure, internal rules of conduct and Peruvian Corporate Law No ( Peruvian Corporate Law ). Our bylaws provide for a board of directors of between five and nine members. Our shareholders may appoint an alternate director for each director to act on his or her behalf when absent from meetings or unable to exercise his or her duties. Alternate directors have the same responsibilities, duties and powers of directors to the extent they are called to replace them. Directors are elected at a shareholders meeting and hold office for three years. Directors may be elected to multiple terms. Our current board of directors is composed of nine directors and no alternates. If a director resigns or otherwise becomes unable to continue with the duties, a majority of our directors may appoint one of the alternate directors, or in the absence of alternate directors, any other person, to serve as director for the remaining term of the board. In the first board meeting held after the annual shareholders meeting where members of the board are elected, the board of directors must elect among its members a chairman and a vice chairman if the shareholders meeting did not elect them. The board of directors typically meets in regularly scheduled quarterly meetings and when called by any director or our Chief Executive Officer. Resolutions must be adopted by a majority of the directors present at the meeting and the chairman is entitled to cast the deciding vote in the event of a tie. Duties and Liabilities of Directors Pursuant to Article 177 of Peruvian Corporate Law, directors are jointly and severally liable to a corporation, shareholders and third parties for any damages caused by abuse of power, fraud, willful misconduct or gross negligence. In addition, pursuant to Article 3 of Law No , as amended, directors of companies with common shares listed on the Lima Stock Exchange are liable to the company and its shareholders for damages caused by resolutions which are favorable to their individual interest (or the interest of a related party) to the detriment of the company s interest if: (i) the listed company is a party to the transaction; (ii) the controlling shareholder of the listed company controls the legal entity acting as counterparty; (iii) the transaction is not carried out on an arm s length basis; and (iv) at least 10% of the listed company s assets are involved in the transaction. A director cannot be found liable if he/she did not participate in the respective meeting or if the director s express disagreement is noted in the corresponding record. Article 180 of the Peruvian Corporate Law requires a director with a conflicting interest on a specific matter to disclose such interest and abstain from the deliberation and decision-making process with respect to such matter. A director who violates this requirement is liable for any damages caused to us and may be removed by a majority of the board of directors upon request of any member of the board or by a majority vote of the shareholders. 143
150 Pursuant to Article 181 of Peruvian Corporate Law, shareholders are entitled to protect the interest of a company through derivative law suits against directors in order to remedy or prevent a wrong to the corporation. In addition, pursuant to Article 4 of Law No , with respect to companies listed on the Lima Stock Exchange, a shareholder holding shares which represent at least 10% of the paid capital may bring said action against the directors. Board of Directors The following sets forth our directors and their respective positions as of the date of this annual report. All directors were elected at our annual shareholders meeting held on March 28, 2014, and their term expires in March 2017, on the third anniversary from the date of election. Name Position Year of Birth Year of First Appointment José Graña Chairman of the Board Carlos Montero Vice Chairman of the Board Federico Cúneo Director (Independent) José Chlimper Director (Independent) Pedro Errazuriz Director (Independent) Hugo Santa María Director (Independent) Mark Hoffmann Director (Independent) Hernando Graña Director Mario Alvarado Director, Chief Executive Officer The following sets forth selected biographical information for each of the members of our board of directors. The business address of each of our current directors is Av. Paseo de la República 4667, Surquillo, Lima 34, Perú. José Graña. Mr. Graña joined the group in 1968 and has been a director and Chairman of our board of directors since August He is an architect and graduated from Universidad Nacional de Ingeniería. For graduate studies, he attended ESAN and the Universidad de Piura Senior Management Program. In addition, Mr. Graña served as Chairman of the board of directors of our subsidiary Viva GyM and as a director of our subsidiaries GyM and GMD. In addition, Mr. Graña serves as a director of Empresa Editora El Comercio S.A., Prensa Popular S.A., Servicios Especiales de Edicion S.A. and Mexichem Amanco Holding. He has previously served as a member of the board of directors of our subsidiaries Concar, GMP, as well as GMI Refinería La Pampilla S.A.A., Edegel S.A.A. and Telefónica S.A.A. He served as Chairman and First Executive of Graña y Montero S.A.A. until March 2011, when he decided to retire from his executive responsibilities and the position of President was eliminated. Carlos Montero. Mr. Montero has been a director since August 1996 and is currently the Vice Chairman of our board of directors. He graduated from Universidad Nacional de Ingeniería as a civil engineer. For graduate studies, he attended the Universidad de Piura Senior Management Program. Mr. Montero is also the Chairman of the board of directors of our subsidiary Concar and a director of our subsidiary GMP S.A. He has previously served as Vice Executive Chairman of our subsidiary GyM until Federico Cúneo. Mr. Cúneo has been a director of Graña y Montero since march Since 2006 he has been a Partner and Director of Amrop Peru, Panama, Costa Rica and Ecuador, leading search assignments for senior executives and board members for national and international companies, from 2003 to 2005 he served as a Business Director in Ernst & Young and between 1996 and 2002 he served as CFO in the Boston Bank. He has a BBA degree in Accounting at the Eastern Michigan University, USA and postgrade work at Escuela Superior de Administración de Negocios (ESAN), Universidad de Piura y Harvard Business School, and the IMD. Mr. Cúneo has been Chairman of Peru 2021 and Forum Empresa and a Member of the Board of Mesa de Concertacion de Lucha contra la Pobreza (Executive Board of Agreement for the fight against poverty), Programa Juntos, Spirit in Business, IPAE, Ethos Brazil and Repsol s La Pampilla Refinery where he headed the Audit Committee (RELAPASA-REPSOL). He is currently the Vice Chairman of Amcham Peru, member of the Investment Committee of Apoyo Capitales and Member of the Board of Peru 2021, Graña y Montero, Tununga Forestry Investments, Osaka Holding, and Chairman of Sporting Cristal Football Club. 144
151 José Chlimper. Mr. Chlimper has been a director since March He received a degree in Economics and Business Administration from North Carolina State University. In addition, Mr. Chlimper is the Chairman of the board of directors and CEO of Agrokasa S.A. and a member of the board of directors of Corporación Drokasa S.A., Maestro Home Center Perú S.A., Aeropuertos del Perú S.A., ComexPerú and the Instituto de Formación Bancaria (IFB). He is Chairman of the board of directors of Compec. He is a member of the Agrarian Consultative Council for the master s degree in Agrobusiness at Universidad del Pacífico. He has previously served as councilman for the municipality of Lima, President of the Fondo de Las Américas, Peru s Minister of Agriculture and member of the board of directors of the Peruvian Central Bank. Pedro Errazuriz. Mr. Errazuriz is currently a director of Graña y Montero SAA. He is a Civil Engineer from the Universidad Catolica de Chile, he have a Master s Degree in Science Engineering from the same university and a Master s Degree in Science Operations Research (Finance) from the London School of Economics. He is currently partner of Veta Tres. Until March 2014 he served as Minister of Transport and Telecommunications in Chile, a position he assumed in He has been director of several companies on behalf of Holding Ontario Teachers Pension Plan, Fund of which he was general manager between 2009 and In the same period he served as Chairman of Biodiversa, Esval, Aguas del Valle and SAESA- Group. He was the CEO and Chairman of water utility ESSBIO. He was General Manager of LanExpress between 2000 and 2006 and Vice President of Corporate Planning of Lan Chile between 1999 and Hugo Santa María. Mr. Santa María has been a director since March He is an Economist from Universidad del Pacífico and has a doctorate in Economics from Washington University in St. Louis, Missouri. Mr. Santa María previously served as director of Fondo Consolidado de Reserva (FCR), Compañía Minera Atacocha and between 2007 and 2012 he served as an independent director at Mibanco and it s President of the Board of Directors until He is also a director of APOYO Comunicación Corporativa, as well as a partner and chief economist at APOYO Consultoría and director of Banco Santander. Mark Hoffmann. Mr. Hoffmann is currently director of Grana y Montero S.A.A. and President of Amazonas Infraestructura. He has been CEO of Duke Energy from 2008 to 2013, CEO of Electroandes from 2003 to 2007, among others. He is Industrial Engineering from Georgia Institute of Technology in Atlanta, Georgia, USA and holds an MBA in Finance from Cornell University, Ithaca, NY. He is currently a board member since 2012 in Financial Qapaq, since 2014 IPAE, from 2010 Radio Philharmonic and since 2007 from Markham College. Mr. Hoffmann has previously served as a member of the boards of Luz del Sur, Electroandes, AmCham and served as Vice President of Caminando Juntos and the National Society of Mining, Petroleum and Energy. Hernando Graña. Mr. Graña joined the group in 1977 and has been director since august He is an Industrial Engineer graduated from Texas A&M University. Mr. Graña also completed post-gradute studies in Mine Engineering at the University of Minnesota, EEUU. In addition, he is the President of the Board of Directors of our subsidiaries GyM and Stracon GyM as well as director of our subsidiaries Vial y Vives-DSD, GMI, CAM and Transportadora de Gas del Perú. Mr. Graña has participated as Director-Manager of GyM since Mario Alvarado Pflucker. Mr. Alvarado joined the group in 1980 and has been Chief Executive Officer of Graña y Montero since 1996 and a director since April He is a Civil Engineer with a master s degree in Administration Engineering from George Washington University and graduate studies in the CEO Management program at Kellogg School of Management, Northwestern University. In addition, he is a member of the board of directors of our subsidiaries Viva GyM S.A. He is also a member of the Consultive Council of the Tecnológico de Monterrey (Peru Site). Mr. Alvarado has previously served as member of the board of directors of Amerika Financiera S.A. Executive Officers Our executive officers oversee our business and are responsible for the execution of the decisions of the board of directors. The following table presents information concerning the current executive officers of the company and their respective positions: 145
152 Name Position Year of Birth Year of Appointment Year of First Employment at the Company Mario Alvarado Chief Executive Officer Mónica Miloslavich Chief Financial Officer Antonio Rodriguez Chief Commercial Officer Claudia Drago Chief Legal and Corporate Affairs Officer José Ascarza Chief Human Resources Officer Dennis Gray Corporate Finance and Investor Relations Officer Jorge Izquierdo Operational Excellence Manager Gonzalo Ferraro President of the Infrastructure Area Hernando Graña Executive President of GyM Francisco Dulanto Executive President of GMP Juan Lambarri Corporate Engineering and Construction Officer Luis Díaz Chief Operational Officer Jaime Dasso Corporate Technical Services Officer Walter Silva Santisteban Executive President of GMI Jaime Targarona Chief Executive Officer of CONCAR Rolando Ponce Chief Executive Officer of Viva GyM Corporate Real Estate Officer Renato Rojas Chief Executive Officer of GyM Hugo González Chief Executive Officer of GMD Maritza Zavala Corporative Technology Manager Reynaldo Llosa Chief Executive Officer of GMP Eduardo Villa Corta Chief Executive Officer of GMI Klaus Winkler Executive Vice President of CAM; Country Manager Chile * César Neyra Manager of Internal Auditing and Management Processes Octavio Cabrera Javier Prado Project Manager Nuria Esparch Chief Officer of Institutional Relations * Appointed by CAM in The following sets forth selected biographical information for each of our executive officers: Mario Alvarado Pflucker. See Board of Directors. Mónica Miloslavich. Ms. Miloslavich joined the group in 1993 and she has been our Chief Financial Officer since She is an Economist graduated from Universidad de Lima and received a postgraduate diploma from Tecnológico de Monterrey. She previously served as Chief Financial Officer of Graña y Montero Edificaciones S.A.C. from 1998 to 2004 and Chief Financial Officer of our subsidiary GyM from 2004 to Additionally, Ms. Miloslavich is a member of the board of directors of our subsidiary GyM Ferrovías. Antonio Rodriguez. Mr. Rodriguez joined the group in 1999 and he has been our Chief Commercial Officer since January He is an Accountant graduated from the Universidad de Lima, with a master s degree in Business Administration from ESAN and a master s degree in Business Administration from The Birmingham Business School in the United Kingdom. He previously served as Chief Investment Officer since 2010 and as Chief Executive Officer of Larcomar from 1999 to Currently, he is a director of our subsidiaries Concar, CAM and GMD. Claudia Drago. Ms. Drago joined the group in 1997 and she has been our Chief Legal and Corporate Affairs Officer since January She is a lawyer from Universidad de Lima and pursued postgraduate studies in Finance and Corporate Law at ESAN, received a postgraduate diploma from Tecnológico de Monterrey and completed the Management Program for Lawyers at Yale School of Management. She previously served as Chief Legal Officer since 2007, She has previously served as Legal Counsel of Graña y Montero from 2000 to 2007 and of our subsidiary GMD from 1997 to Ms. Drago is Graña y Montero s representative to the Lima Stock Exchange and the Secretary of the board of directors. 146
153 José Ascarza. Mr. Ascarza joined the group in 2004 and has been our Chief Human Resources Officer since He is an Industrial Engineer graduated from the Universidad de Lima and received a postgraduate diploma from Tecnológico de Monterrey. He previously served as Human Resources Manager at our subsidiary GyM from 2007 to Dennis Gray. Mr. Gray joined the group in 2011 and has been our Corporate Finance and Investor Relations Manager. He is an Economist with a degree from the Universidad del Pacífico specializing in Finance and received a postgraduate diploma from Tecnológico de Monterrey. He previously served as Corporate Vice President of Finance at Citibank del Perú, General Manager of Citicorp Perú S.A.B. and Product Development Manager at Banco de Crédito del Perú. Mr. Gray is Graña y Montero s representative to the Lima Stock Exchange and in the Ney York Stock Exchange. Jorge Izquierdo. Mr. Izquierdo joined the group in 1999 and is our Manager Operational Excellence and has been since 2011 our Corporate Learning Center Manager, having previously served as manager of the Project Management Officer. He is a Civil Engineer with a degree from the Pontificia Universidad Católica del Perú and a master s degree in Construction Management from the University of California, Berkeley. Gonzalo Ferraro. Mr. Ferraro joined the group in 1996 and has been President of the Infrastructure Area since April He has also held a number of managerial positions, including Corporate Infrastructure Manager from 2010 to He is an Industrial Engineer, having graduated from Universidad de Lima, with studies at Universidad Nacional de Ingeniería, and he completed additional graduate studies at the Universidad de Piura Senior Management Program and received a postgraduate diploma from Tecnológico de Monterrey. Mr. Ferraro is currently the Chairman of the board of directors of subsidiaries Survial, Norvial, La Chira, GyM Ferrovías, as well as Concesionaria Vía Expresa Sur, and a member of the board of directors of our subsidiary GMP. Hernando Graña. See Board of Directors. Francisco Dulanto. Mr. Dulanto joined the group in 1974 and is the Executive President and Chairman of the board of directors of GMP. He graduated from Universidad Nacional de Ingeniería and pursued graduate studies at ESAN and the Universidad de Piura Senior Management Program. He also received a postgraduate diploma from Tecnológico de Monterrey. He served as Chief Executive Officer of our subsidiary GMP between 1984 and 2011; as well as President of the Society of Petroleum Engineers (SPE), Lima Section, in 1991; and director of the Sociedad Nacional de Minería y Petróleo y Energía. Juan Lambarri. Mr. Lambarri joined the group in 1982 and is our Corporate Engineering and Construction Area Officer, having previously served as Chief Executive Officer of our subsidiary GyM since He is a Civil Engineer graduated from Pontificia Universidad Católica del Perú. He also pursued graduate studies from Universidad de Piura Senior Management Program and received a postgraduate diploma from Tecnológico de Monterrey. He is currently a member of the board of directors of our subsidiaries GyM, Stracon GyM, Vial y Vives-DSD and GMI. Luis Díaz. Mr. Díaz joined the group in 1993 and is our Chief Operational Officer since January 2015, having previously served as Corporate Infrastructure Area Officer since April 2013 and as Chief Executive Officer of our subsidiary GMP from March 2011 to He is an Industrial Engineer with a master s degree in Business Administration from the University of Pittsburgh and received a postgraduate diploma from Tecnológico de Monterrey. Mr. Diaz previously served as Deputy Chief Executive Officer of GMP from 2009 to 2011, Chief Financial Officer of Graña y Montero from 2004 to 2009, and Financial Manager of our subsidiary GyM from 2001 to He is also a member of the board of directors of GMP, GyM Ferrovias, Norvial, La Chira, Survial and Via Expresa Sur. 147
154 Jaime Dasso. Mr. Dasso joined the group in 1991 and is our Corporate Service Area Officer, having previously served as Chief Executive Officer of our subsidiary GMD since He is an electronic engineer and received a master s degree in Software Development from Stevens Institute of Technology in the United States of America and a postgraduate diploma from Tecnológico de Monterrey. He previously served as Commercial Manager of GMD from 1994 to Currently, he is a member of the board of directors of GMD, Concar and CAM and the President of the board of directors of our subsidiary GSD. Walter Silva Santisteban. Mr. Silva Santisteban joined the group in 1981 and has been the Chief Executive Officer of our subsidiary GMI since He is a Civil Engineer graduated from Universidad Nacional de Ingeniería and received a postgraduate diploma from Tecnológico de Monterrey. Currently, he is a member of the board of directors of GMI. Jaime Targarona. Mr. Targarona joined the group in 1996 and has been the Chief Executive Officer of Concar since He is a Civil Engineer graduated from Universidad Autónoma de Guadalajara (Mexico), with a master s degree in Business Administration from Universidad San Ignacio de Loyola. He also completed the Universidad de Piura Senior Management Program and received a postgraduate diploma from Tecnológico de Monterrey. He previously held positions as Civil Engineer on different projects, Commercial Manager of our subsidiary GyM s Special Projects Divisions and as Chief Executive Officer of Graña y Montero Mexico. Additionally, Mr. Targarona is a member of the board of directors of our subsidiaries Concar. Rolando Ponce. Mr. Ponce joined the group in 1993 and has been the Chief Executive Officer of our subsidiary Viva GyM since 2008 and Corporate Real Estate Officer since February He is a Civil Engineer graduated from Universidad Ricardo Palma and received a master s degree in Construction and Real Estate Business Management from Pontificia Universidad Católica de Chile Politécnica de Madrid (Spain) and a postgraduate diploma from Tecnológico de Monterrey. He has previously served as manager of GyM s Real Estate Division. Mr. Ponce joined the group in 1993 and is currently a member of the board of directors of our subsidiaries Viva GyM and Almonte. Renato Rojas. Mr. Rojas joined us in 1995 and is the Chief Executive Officer of GyM since February He previously served as Manager of the Civil Works Division of GyM from 2010 to 2014, Sub Manager of the same Division from 2002 to Mr. Rojas holds a degree in civil engineering from Pontificia Universidad Catolica del Peru. He also completed a Master s degree in Company Management at the Universidad de Piura. He is currently a member of the board of directors of GMI and GyM. Hugo González. Mr. González joined us in 1997 and is the Chief Executive Officer of GMD since February He previously served as Manager of the Technology Solutions Division of GMD from 2008 to 2014, Manager of the Outsourcing Technology Division from 2005 to He holds a degree in system engineering from Lima University. He also completed a Master s degree in General and Strategic Management, with double degree at Maastricht School of Management (MSM) and Pontificia Universidad Católica del Perú (Centrum Catolica). He is currently a member of the board of directors of GMD. Maritza Zavala. Ms. Zavala, joined us in 1997 and is the Corporative Technology Manager since September She holds a degree in industrial engineering from University of Lima, with a Master s degree in International Business Administration from Nova Southeastern University. Reynaldo Llosa. Mr. Llosa joined us in 2014 and is the Chief Executive Officer of GMP since February He holds a degree mechanical engineering graduated from the University of Houston and holds a Senior Executive MBA from Universidad de Piura. He has completed extensive technical and management executive education programs including Certificate Programs at Rice University and Northwestern Kellogg School of Management. He previously served as deputy general manager at BPZ Energy from 2010 to 2013, and was employed by Schlumberger for 25 years where he held several management positions over the most recent 15 years. Eduardo Villa Corta. Mr. Villa Corta joined the Group in 1995 and is the Chief Executive Officer of GMI since February He previously served as Technical Manager of GyM from 2010 to 2014, Manager of the Industry Division from 2003 to In the year 2000 he joined GyM Mexico as the General Director. He holds a degree in civil engineering from Catholic University of Peru. He also completed a MBA from University of Piura. He is currently a board member of our subsidiaries GMI and Vial y Vives- DSD. 148
155 Klaus Winkler. Mr. Winkler joined the group in 2011 and has been the Executive Vice President of CAM Chile S.A. since 2007 as well as Country Manager Chile since April He is a Commercial Engineer graduated from Universidad Gabriela Mistral in Chile. He also has a master s degree in Business Administration from Stanford University and a postgraduate diploma from Tecnológico de Monterrey. He previously served as Chief Executive Officer of Compañía Americana de Multiservicios Ltda. (currently, CAM Chile) from 2007 to 2011; and held several managerial positions over 15 years in Endesa group in Chile, Spain and the United States. He is currently a member of the board of directors of Vial y Vives - DSD. César Neyra. Mr. Neyra joined the group in 2003 and has been our Manager of Internal Auditing and Management Processes since He received an Accounting degree from Universidad Nacional Federico Villareal and a master s degree in Business Administration and Finance from Universidad del Pacífico. He has also studied Quality Improvement Systems and graduated from the Six Sigma Methodology program at Caterpillar University in Mexico and the United States of America. Octavio Cabrera. Mr. Cabrera joined the Group in March 1974 and has been our Javier Prado project manager since January Previously he served as Chief Executive Officer of Stracon GyM since January 2012, and as Division Manager of Civil Works since Mr. Cabrera has a degree in Civil Engineering from the National University of Engineering and a Masters in Executive Management Program from the University of Piura. He is currently a board member of Stracon Gym. Nuria Esparch. Ms. Esparch joined the group in September 2014 and is our Chief Officer of Institutional Relations. She is a lawyer of the Pontificia Universidad Catolica del Perú with a master s degree in Public Administration from Maxwell School of Citizenship and Public Affairs at Syracuse University in New York. Ms. Esparch was Senior Manager of Communications and External Relations Rio Tinto Project Farm and previously spent two years doing research and consulting for public and research affiliate at GRADE as well as in Apoyo. Executive Commission The Executive Commission is currently comprised by our Chief Executive Officer, the Business Segment Executive Officer for each of the four segments, and the President of the Infrastructure Area. The Executive Commission evaluates, at the management level, among other matters, our strategic plan, annual budget and annual investment plan. Business Segments Executive Commission The Business Segments Executive Commissions are comprised by the Business Segment Executive Officer and the CEOs of the companies in each of the relevant business segments. Each Business Segment Executive Commission evaluates the applicable business segment s annual budget, finances and operations as well as a summary of the information discussed in the Executive Commission. Kinship Mr. José Graña Miró Quesada, Chairman of the Board of Directors, has first-degree kinship by blood with Maria Teresa Graña Canepa, a shareholder of our company and director of our subsidiaries Viva GyM, GMD, GyM Ferrovías and GMI; thirddegree kinship by blood with Ms. Yamile Brahim Graña, a shareholder of our company; and fourth-degree kinship by blood with the director and shareholder Hernando Graña Acuña, who also holds the position of Chairman of the board of our subsidiaries GyM and Stracon GyM and of director of our subsidiaries Vial y Vives-DSD S.A., GMI, CAM and Transportadora de Gas del Perú. B. Compensation Compensation of Directors and Executive Officers Director compensation must be approved by a majority of shareholders at our annual shareholders meeting. 149
156 In 2014, total compensation paid to our board of directors amounted to S/.2,264,892 including compensation paid to directors that serve on our subsidiaries board of directors. In 2014, total compensation paid to our executive officers amounted to S/.24,262,749. See Item 4.B Information on the Company Business Overview Regulatory Matters Labor Regulations for additional information on profit sharing regulatory requirements. Neither we nor any of our subsidiaries have entered into any agreement that provides for any benefit or compensation to any director or senior executive upon expiration of his or her term or termination of employment. Under Peruvian law, unless we dismiss someone for justified cause, we are required to pay the dismissed employee (but not directors) 1.5x annual salary for every year with the company for a period not to exceed 12 years. We are not required to make such payments in the event of voluntary termination. Although we have no ongoing obligation to do so, in the past we have provided, and in the future we may provide, such benefits to our executive officers upon their retirement. We have not set aside or reserved any amounts to provide for pension, retirement or other similar benefits. Executive Compensation Plan We establish and pay executive compensation in compliance with applicable labor and tax regulations and corporate governance standards and in accordance with market conditions. We establish pay scales taking into consideration executives responsibilities, including the degree of complexity of those responsibilities, power of decision-making and scope of supervision entrusted. The fixed salary component of compensation is established for each position based on a pay scale. Fixed salary includes family allowance and cost of living payments, if applicable. We evaluate executives at least once a year to develop action plans in furtherance of continuously improving management performance. The variable component of compensation is paid to executives and other employees for meeting specific goals, and is related both to his or her performance and our financial results. Variable compensation is typically paid as an annual bonus. In addition, labor regulation establishes a mandatory profit sharing provision of 5% of our total annual taxable income, to be distributed among all employees, calculated based on a formula established by law that considers the days worked in the year and remuneration. Our executives also receive additional benefits, typically non-pecuniary. The benefits granted include: (i) a vehicle owned and maintained by the company, with the purpose of facilitating transportation of executives in the performance of their functions; (ii) a fuel allowance to offset transportation costs in the performance of their functions; and (iii) an insurance policy, including work accident and high risk coverage. In addition, we have established a plan for certain executives effective March 2013 that awards cash bonuses for the exclusive use of purchasing shares of our company or of our subsidiaries. The executive must agree to hold the shares for a specific period. If the executive is no longer employed with the company during such period, we are entitled to repurchase the shares at the original purchase price. This benefit is awarded at the discretion and subject to the approval of the Human Resource Management and Social Responsibility Committee of our board of directors. C. Board Practices Board Committees We have three board committees comprised of members of our board of directors. 150
157 Audit and Process Committee Our Audit and Process Committee is comprised of three directors, all of which are independent in accordance with the SEC rules applicable to foreign private issuers. The current members of our Audit and Process Committee are Mr.Federico Cúneo, Mr. José Chlimper and Mr. Hugo Santa Maria. These directors have extensive business and economic experience in Peru; however, in accordance with SEC rules, we disclose that only Mr. Federico Cúneo qualifies as a financial expert. Our Audit and Process Committee oversees our corporate accounting and financial reporting process. The Audit and Process Committee is responsible for: reviewing our financial statements; evaluating our internal controls and procedures, and identifying deficiencies; recommending to our annual shareholders meeting the appointment of our external auditors, determining their compensation, retention and oversight, and resolving any disagreements that may arise between management and our external auditors; evaluating the company s compliance with the Board of Director s internal regulation, as well as with general principles of corporate governance; informing our board of directors regarding any issues that arise with respect to the quality or integrity of our financial statements, our compliance with legal or regulatory requirements, the performance and independence of the external auditors, or the performance of the internal audit function; establishing procedures for the reception, retention and treatment of complaints regarding accounting, internal controls or other auditing matters, including the confidential, anonymous submission by our employees of concerns regarding questionable accounting or auditing matters; independently engaging its own counsel and any other advisers it deems necessary to fulfill its functions; and establishing policies and procedures to pre-approve audit and permissible non-audit services. Our board of directors has adopted a written charter for our Audit and Process Committee, which is available on our website at Human Resource Management and Social Responsibility Committee Our Human Resource Management and Social Responsibility Committee is comprised of three directors, all of which are independent in accordance with SEC rules applicable to foreign private issuers. The current members of the committee are Mr. José Chlimper, Mr. Federico Cúneo and Mr. Mark Hoffman. The Human Resource Management and Social Responsibility Committee is responsible for: reporting to our board of directors on the appointment and dismissal of senior executives; reviewing and approving corporate goals and objectives relevant to CEO compensation, evaluating the CEO s performance in light of those goals and objectives, and determining and approving CEO compensation; establishing compensation arrangements for senior executives in accordance with the financial results of the company; proposing measures to ensure transparency in the remuneration of directors and senior executives; evaluating our human resources policies; 151
158 reporting to our board of directors on matters regarding related party transactions that could result in a conflict of interest; establishing our social responsibility policies; appointing third party independent compensation consultants, and establishing the compensation of and overseeing the third party independent compensation consultants; and supervising and reporting to our board of directors on social responsibility practices and management. As a foreign private issuer, we are not required to maintain a compensation committee that complies with all of the U.S. laws and regulations and NYSE requirements applicable to U.S. issuers. Investment and Risk Committee Our Investment and Risk Committee is comprised of three directors. The current members of the committee are Mr. José Graña, Mr. Hugo Santa Maria and Mr. Pedro Errazuriz. The Investment and Risk Committee is responsible for: establishing our investment policies; approving our annual investment plan; analyzing the projects that would require an investment greater than US$5 million; and assessing and seeking to mitigate the risks encountered by our company. Operating Board Committees We also have four operating board committees that meet monthly and are comprised of members of our board of directors, including at least one independent member per committee. Engineering and Construction Committee Our Engineering and Construction Committee supervises the operations of our E&C segment, and is comprised of five directors. The current members of the committee are Mr. José Graña, Mr. Mario Alvarado, Mr. José Chlimper, Mr. Hernando Graña and Mr. Carlos Montero. Infrastructure Committee Our Infrastructure Committee supervises the operations of our Infrastructure segment and is comprised of five directors. The current members of the committee are Mr. José Graña, Mr. Mario Alvarado, Mr. Hugo Santa María, Pedro Errazuriz and Mr. Hernando Graña. Real Estate Committee Our Real Estate Committee supervises the operations of the Real Estate segment and is comprised of three directors. The current members of the committee are Mr. José Graña, Mr. Mario Alvarado and Mr. Mark Hoffman. Technical Services Committee Our Technical Services Committee supervises the operations of our Technical Services segment and is comprised of four directors. The current members of the committee are Mr. José Graña, Mr. Mario Alvarado, Mr. Federico Cúneo and Mr. Carlos Montero. 152

159 D. Employees We have developed an extensive and talented team, including more than 4,100 engineers, that gives us the capability and scale to undertake large and complex projects. We also have access to a network of approximately 24,000 manual laborers throughout Peru that can supplement our workforce when required by our projects. Moreover, we have the flexibility to engage our own workers on projects outside Peru, avoiding the need to seek new employees in other countries. As of December 31, 2014, we had a total of 46,762 full-time employees, including approximately 24,200 manual laborers, a number that fluctuates depending on our project backlog. At such date, we also worked with 5,257 employees of subcontractors. Occasionally, we employ subcontractors for particular aspects of our projects, such as carpenters, specialists in elevator installation and specialists in glassworks. We are not dependent upon any particular subcontractor or group of subcontractors. As of December 31, 2014, 29% of our employees worked outside Peru. The following table sets forth a breakdown of our employees by category as of December 31, Salaried Employees Engineering and Construction Infrastructure Real Estate Technical Services Corporate Total Engineers 2, , ,152 Other professionals 1, , ,667 Technical specialists 1, , ,022 Manual laborers(1) 24,259 24,259 Joint operations employees(2) 5,641 1,021 6,662 Subtotal 35, , ,762 Subcontracted employees 4, ,257 Total 40, , ,019 (1) The number of manual laborers, who form part of our network of approximately 24,000 manual laborers, varies in relation to the number and size of projects we have in process at any particular time. (2) Includes engineers, professionals, technical specialists and manual laborers employed by our joint operations. The following chart sets forth the growth of our total employees from December 31, 2011 to December 31, Our talent development system has allowed us to develop a team of professionals who are able to design and implement sophisticated projects. Our talent development system is based on three main pillars: (i) specialized training for all levels, including senior management; (ii) mentoring; and (iii) feedback from managers to employees. 153
GRAÑA Y MONTERO S.A.A. (Exact name of Registrant as specified in its charter)
") U.S. SECURITIES AND EXCHANGE COMMISSION Washington, D.C. 20549 FORM 20-F REGISTRATION STATEMENT PURSUANT TO SECTION 12(b) OR (g) OF THE SECURITIES EXCHANGE ACT OF 1934 OR ANNUAL REPORT PURSUANT TO SECTION
U.S. SECURITIES AND EXCHANGE COMMISSION Washington, D.C. 20549 FORM 20-F REGISTRATION STATEMENT PURSUANT TO SECTION 12(b) OR (g) OF THE SECURITIES EXCHANGE ACT OF 1934 OR ANNUAL REPORT PURSUANT TO SECTION
GRAÑA Y MONTERO. Corporate Presentation
 GRAÑA Y MONTERO Corporate Presentation July 2018 Business highlights Grupo Graña y Montero at a glance Largest Engineering & Construction company in Peru measured by revenues Shareholders June 2018 85
GRAÑA Y MONTERO. Corporate Presentation
 GRAÑA Y MONTERO Corporate Presentation First Quarter 217 Business highlights Grupo Graña y Montero at a glance Largest Engineering & Construction company in Peru measured by revenues 83 years of recognized
GRAÑA Y MONTERO. Corporate Presentation
 GRAÑA Y MONTERO Corporate Presentation Fourth Quarter 2016 Business highlights Grupo Graña y Montero at a glance Largest Engineering & Construction company in Peru measured by revenues 83 years of recognized
GRAÑA Y MONTERO. Conference Call 2Q 2017
 GRAÑA Y MONTERO Conference Call 2Q 2017 Second Quarter 2017 Agenda 1. Introduction 2. Discussion of Financial Results 3. Q&A Presentación Corporativa 2T2016 1. Introduction Presentación Corporativa 2T2016
The Group achieved Revenues of S/. 2,847.3 MM during 2Q2017, a 1.7% increase compared to 2Q2016.
 Consolidated Results Report 2Q2017 July 24, 2017 Executive Summary The Group achieved Revenues of S/. 2,847.3 MM during 2Q2017, a 1.7% increase compared to 2Q2016. Gross Profit amounted to S/. 359.9 MM
GRAÑA Y MONTERO. Corporate Presentation
 GRAÑA Y MONTERO First Quarter 2015 Business highlights Grupo Graña y Montero at a glance Largest Engineering & Construction company in Peru measured by revenues 82 years of recognized operational excellence
The Group achieved Revenues of S/. 2,799.0 MM during 2Q2016, a 25.6% decrease compared to 2Q2015
 Consolidated Results Report Second Quarter 2016 July 25, 2016 Executive Summary The Group achieved Revenues of S/. 2,799.0 MM during 2Q2016, a 25.6% decrease compared to 2Q2015 Gross Profit amounted to
The Group achieved Revenues of S/. 1,433.0 MM during 1Q2016, a 15.9% decrease compared to 1Q2015
 Consolidated Results Report First Quarter 2016 April 28, 2016 Executive Summary The Group achieved Revenues of S/. 1,433.0 MM during 1Q2016, a 15.9% decrease compared to 1Q2015 Gross Profit amounted to
GRAÑA Y MONTERO. Corporate Presentation
 GRAÑA Y MONTERO Corporate Presentation Fourth Quarter 2015 Business highlights GRUPO GRAÑA Y MONTERO AT A GLANCE Largest Engineering & Construction company in Peru measured by revenues 82 years of recognized
GRAÑA Y MONTERO. Corporate Presentation
 GRAÑA Y MONTERO Second Quarter 2015 Business highlights Grupo Graña y Montero at a glance Largest Engineering & Construction company in Peru measured by revenues 82 years of recognized operational excellence
Date: 04/28/ :22 PM Vintage Project: v Form Type: 20-F Client: v464888_buenaventura MINING CO INC_20-F
 Client: v464888_buenaventura MINING CO INC_20-F Submission Data File General Information Form Type* 20-F Contact Name Charlie Fink Contact Phone 866-683-5252 Filer Accelerated Status* Large Accelerated
20-F BUENAVENTURA MINING CO INC (BVN) Filed on 07/15/2008 Period: 12/31/2007 File Number
 Filed on 07/15/2008 Period: 12/31/2007 File Number") BUENAVENTURA MINING CO INC (BVN) 20-F AVE CARLOS VILLARAN 790 LIMA, R5 13 511.419.2536 http://www.buenaventura.com Filed on 07/15/2008 Period: 12/31/2007 File Number 001-14370 LIVEDGAR Information Provided
BUENAVENTURA MINING CO INC (BVN) 20-F AVE CARLOS VILLARAN 790 LIMA, R5 13 511.419.2536 http://www.buenaventura.com Filed on 07/15/2008 Period: 12/31/2007 File Number 001-14370 LIVEDGAR Information Provided
BUENAVENTURA MINING CO INC
 BUENAVENTURA MINING CO INC FORM 20-F (Annual and Transition Report (foreign private issuer)) Filed 04/30/14 for the Period Ending 12/31/13 Telephone 5114192536 CIK 0001013131 Symbol BVN SIC Code 1000 -
Grand Duchy of Luxembourg (Jurisdiction of incorporation or organization) 4 rue Lou Hemmer, L 1748 Luxembourg Findel
 4 rue Lou Hemmer, L 1748 Luxembourg Findel") 20 F 1 attoform20f_2015.htm FORM 20 F UNITED STATES SECURITIES AND EXCHANGE COMMISSION Washington, D.C. 20549 FORM 20 F ANNUAL REPORT PURSUANT TO SECTION 13 OR 15(d) OF THE SECURITIES EXCHANGE ACT OF 1934
20 F 1 attoform20f_2015.htm FORM 20 F UNITED STATES SECURITIES AND EXCHANGE COMMISSION Washington, D.C. 20549 FORM 20 F ANNUAL REPORT PURSUANT TO SECTION 13 OR 15(d) OF THE SECURITIES EXCHANGE ACT OF 1934
Executive Summary. Consolidated Results Report Page 2. Profits & Losses Statement (Thousands S/.) Var %
 Var %") Executive Summary Var % Activity 4,242,801 5,190,801 22.3% GROSS PROFIT 631,749 711,631 12.6% General Expenses (199,582) (255,521) Others 53,537 76,218 OPERATIONAL INCOME 485,704 532,328 9.6% Financial
Executive Summary Var % Activity 4,242,801 5,190,801 22.3% GROSS PROFIT 631,749 711,631 12.6% General Expenses (199,582) (255,521) Others 53,537 76,218 OPERATIONAL INCOME 485,704 532,328 9.6% Financial
UNITED STATES SECURITIES AND EXCHANGE COMMISSION. Sanpaolo IMI S.p.A.
 UNITED STATES SECURITIES AND EXCHANGE COMMISSION WASHINGTON, DC. 20549 FORM 20-F REGISTRATION STATEMENT PURSUANT TO SECTION 12(b) OR (g) OF THE SECURITIES EXCHANGE ACT OF 1934 OR ANNUAL REPORT PURSUANT
Gross Profit reached S/ MM in 2Q2012, increasing 3.9% compared to 2Q2011
 Executive Summary The Group reached an Activity of S/. 2,257.7 MM in the first semester of 212, a 9.6% growth compared the first semester of 211 Gross Profit reached S/.342.3 MM in 2Q212, increasing 3.9%
Grupo Graña y Montero Report at June 30th, 2010
 For additional information please contact: July 20 th, 2010 Symbols: Graña y Montero S.A.A. GRAMON C1 BVL (Peru) Mónica Miloslavich Hart GRYMY OTC (USA) Chief Financial Officer Phone: (511) 213 6571 Fax:
BUENAVENTURA MINING CO INC
 BUENAVENTURA MINING CO INC FORM 20-F (Annual and Transition Report (foreign private issuer)) Filed 04/30/13 for the Period Ending 12/31/12 Telephone 5114192536 CIK 0001013131 Symbol BVN SIC Code 1000 -
UNITED STATES SECURITIES AND EXCHANGE COMMISSION Washington, D.C FORM 20-F
 UNITED STATES SECURITIES AND EXCHANGE COMMISSION Washington, D.C. 20549 (Mark One) FORM 20-F REGISTRATION STATEMENT PURSUANT TO SECTION 12(b) OR (g) OF THE SECURITIES EXCHANGE ACT OF 1934 OR ANNUAL REPORT
CENCOSUD S.A. FORM 20-F. (Annual and Transition Report (foreign private issuer)) Filed 04/15/16 for the Period Ending 12/31/15
) Filed 04/15/16 for the Period Ending 12/31/15") CENCOSUD S.A. FORM 20-F (Annual and Transition Report (foreign private issuer)) Filed 04/15/16 for the Period Ending 12/31/15 Telephone 56 (2) 959-0000 CIK 0001544856 SIC Code 5331 - Retail-Variety Stores
CENCOSUD S.A. FORM 20-F (Annual and Transition Report (foreign private issuer)) Filed 04/15/16 for the Period Ending 12/31/15 Telephone 56 (2) 959-0000 CIK 0001544856 SIC Code 5331 - Retail-Variety Stores
UNITED STATES SECURITIES AND EXCHANGE COMMISSION Washington, D.C FORM 20-F
 UNITED STATES SECURITIES AND EXCHANGE COMMISSION Washington, D.C. 20549 FORM 20-F ANNUAL REPORT PURSUANT TO SECTION 13 OR 15(d) OF THE SECURITIES EXCHANGE ACT OF 1934 for the fiscal year ended: December
Cencosud S.A. (Translation of registrant s name into English)
") UNITED STATES SECURITIES AND EXCHANGE COMMISSION Washington, D.C. 20549 FORM 6 - K Report of Foreign Private Issuer Pursuant to Rule 13a - 16 or 15d - 16 under the Securities Exchange Act of 1934 For the
UNITED STATES SECURITIES AND EXCHANGE COMMISSION Washington, D.C. 20549 FORM 6 - K Report of Foreign Private Issuer Pursuant to Rule 13a - 16 or 15d - 16 under the Securities Exchange Act of 1934 For the
BANCO BILBAO VIZCAYA ARGENTARIA, S.A. BANK BILBAO VIZCAYA ARGENTARIA, S.A.
 UNITED STATES SECURITIES AND EXCHANGE COMMISSION WASHINGTON, D.C. 20549 FORM 6-K REPORT OF FOREIGN ISSUER PURSUANT TO RULE 13a-16 OR 15d-16 UNDER THE SECURITIES EXCHANGE ACT OF 1934 For the six months
FORM 20 F/A MASISA S.A. MYS. Filed: July 17, 2007 (period: December 31, 2006) Amendment to a previously filed 20 F
 Amendment to a previously filed 20 F") FORM 20 F/A MASISA S.A. MYS Filed: July 17, 2007 (period: December 31, 2006) Amendment to a previously filed 20 F Table of Contents PART I Item 1. Identity of Directors, Senior Management and Advisers
FORM 20 F/A MASISA S.A. MYS Filed: July 17, 2007 (period: December 31, 2006) Amendment to a previously filed 20 F Table of Contents PART I Item 1. Identity of Directors, Senior Management and Advisers
GRAÑA Y MONTERO S.A.A. AND SUBSIDIARIES. Consolidated Financial Statements. As of December 31, 2009 and 2008
 Consolidated Financial Statements As of December 31, 2009 and 2008 (With the Independent Auditor s Report Thereon) (TRANSLATION OF FINANCIAL STATEMENTS ORIGINALLY ISSUED IN SPANISH) Contents Page Independent
CEMENTOS PACASMAYO S.A.A.
 ˆ200Fuk00$aL7YotgSŠ 200Fuk00$aL7YotgS MWRPRFRS02 11.2.17 MWRpf_rend 27-Apr-2013 08:15 EST 527611 FS 1 2* Page 1 of 2 UNITED STATES SECURITIES AND EXCHANGE COMMISSION Washington, D.C. 20549 REGISTRATION
MACQUARIE INFRASTRUCTURE CO LLC
 MACQUARIE INFRASTRUCTURE CO LLC FORM 10-Q (Quarterly Report) Filed 04/29/13 for the Period Ending 03/31/13 Address 125 WEST 55TH STREET, 22ND FLOOR NEW YORK, NY 10019 Telephone 212 231 1000 CIK 0001289790
AVIANCA HOLDINGS S.A.
 As filed with the Securities and Exchange Commission on May 1, 2017 UNITED STATES SECURITIES AND EXCHANGE COMMISSION Washington, D.C. 20549 FORM 20-F REGISTRATION STATEMENT PURSUANT TO SECTION 12(b) OR
UNITED STATES SECURITIES AND EXCHANGE COMMISSION Washington, D.C
 UNITED STATES SECURITIES AND EXCHANGE COMMISSION Washington, D.C. 20549 FORM 6-K Report of Foreign Private Issuer Pursuant to Rule 13a-16 or 15d-16 of the Securities Exchange Act of 1934 For the year ended
GRAN TIERRA ENERGY INC.
 UNITED STATES SECURITIES AND EXCHANGE COMMISSION Washington, D.C. 20549 FORM 10-Q (Mark One) QUARTERLY REPORT PURSUANT TO SECTION 13 OR 15(d) OF THE SECURITIES EXCHANGE ACT OF 1934 For the quarterly period
CEMENTOS PACASMAYO S.A.A.
 UNITED STATES SECURITIES AND EXCHANGE COMMISSION Washington, D.C. 20549 FORM 20-F REGISTRATION STATEMENT PURSUANT TO SECTION 12(b) OR (g) OF THE SECURITIES EXCHANGE ACT OF 1934 OR ANNUAL REPORT PURSUANT
Repsol YPF, S.A. (Exact name of registrant as specified in its charter)
") Página 1 de 402 Title of each class UNITED STATES SECURITIES AND EXCHANGE COMMISSION Washington, D.C. 20549 Form 20-F ANNUAL REPORT PURSUANT TO SECTION 13 OR 15(d) OF THE SECURITIES EXCHANGE ACT OF 1934
Página 1 de 402 Title of each class UNITED STATES SECURITIES AND EXCHANGE COMMISSION Washington, D.C. 20549 Form 20-F ANNUAL REPORT PURSUANT TO SECTION 13 OR 15(d) OF THE SECURITIES EXCHANGE ACT OF 1934
EMPRESA NACIONAL DE ELECTRICIDAD S.A. (Exact name of Registrant as specified in its charter)
") SECURITIES AND EXCHANGE COMMISSION Washington, D.C. 20549 FORM 20-F [ ] REGISTRATION STATEMENT PURSUANT TO SECTION 12(b) OR 12(g) OF THE THE SECURITIES EXCHANGE ACT OF 1934 OR [X] ANNUAL REPORT PURSUANT
SECURITIES AND EXCHANGE COMMISSION Washington, D.C. 20549 FORM 20-F [ ] REGISTRATION STATEMENT PURSUANT TO SECTION 12(b) OR 12(g) OF THE THE SECURITIES EXCHANGE ACT OF 1934 OR [X] ANNUAL REPORT PURSUANT
Construction Partners, Inc. (Exact Name of Registrant as Specified in its Charter)
") UNITED STATES SECURITIES AND EXCHANGE COMMISSION WASHINGTON, DC 20549 FORM 10-Q (Mark One) QUARTERLY REPORT PURSUANT TO SECTION 13 OR 15(d) OF THE SECURITIES EXCHANGE ACT OF 1934 For the quarterly period
UNITED STATES SECURITIES AND EXCHANGE COMMISSION WASHINGTON, DC 20549 FORM 10-Q (Mark One) QUARTERLY REPORT PURSUANT TO SECTION 13 OR 15(d) OF THE SECURITIES EXCHANGE ACT OF 1934 For the quarterly period
Ordinary Shares, no par value New York Stock Exchange SecuritiesregisteredortoberegisteredpursuanttoSection12(g)oftheAct: None (Title of Class)
oftheAct: None (Title of Class)") UNITED STATES SECURITIES AND EXCHANGE COMMISSION Washington, D.C. 20549 FORM 20-F ANNUAL REPORT PURSUANT TO SECTION 13 OR 15(d) OF THE SECURITIES EXCHANGE ACT OF 1934 for the fiscal year ended: December
UNITED STATES SECURITIES AND EXCHANGE COMMISSION Washington, D.C. 20549 FORM 20-F ANNUAL REPORT PURSUANT TO SECTION 13 OR 15(d) OF THE SECURITIES EXCHANGE ACT OF 1934 for the fiscal year ended: December
CEMENTOS PACASMAYO S.A.A. (Exact name of Registrant as specified in its charter)
") UNITED STATES SECURITIES AND EXCHANGE COMMISSION Washington, D.C. 20549 FORM 20-F REGISTRATION STATEMENT PURSUANT TO SECTION 12(b) OR (g) OF THE SECURITIES EXCHANGE ACT OF 1934 OR ANNUAL REPORT PURSUANT
UNITED STATES SECURITIES AND EXCHANGE COMMISSION Washington, D.C. 20549 FORM 20-F REGISTRATION STATEMENT PURSUANT TO SECTION 12(b) OR (g) OF THE SECURITIES EXCHANGE ACT OF 1934 OR ANNUAL REPORT PURSUANT
UNITED STATES SECURITIES AND EXCHANGE COMMISSION Washington, D.C FORM 20-F
 UNITED STATES SECURITIES AND EXCHANGE COMMISSION Washington, D.C. 20549 FORM 20-F ANNUAL REPORT PURSUANT TO SECTION 13 OR 15(d) OF THE SECURITIES EXCHANGE ACT OF 1934 For the fiscal year ended December
YPF Sociedad Anónima (Exact name of registrant as specified in its charter)
") UNITED STATES SECURITIES AND EXCHANGE COMMISSION Washington, D.C. 20549 FORM 20-F ANNUAL REPORT PURSUANT TO SECTION 13 OR 15(d) OF THE SECURITIES EXCHANGE ACT OF 1934 For the fiscal year ended December
UNITED STATES SECURITIES AND EXCHANGE COMMISSION Washington, D.C. 20549 FORM 20-F ANNUAL REPORT PURSUANT TO SECTION 13 OR 15(d) OF THE SECURITIES EXCHANGE ACT OF 1934 For the fiscal year ended December
YPF Sociedad Anónima (Exact name of registrant as specified in its charter)
") 20-F 1 d526156d20f.htm FORM 20-F Table of Contents UNITED STATES SECURITIES AND EXCHANGE COMMISSION Washington, D.C. 20549 FORM 20-F ANNUAL REPORT PURSUANT TO SECTION 13 OR 15(d) OF THE SECURITIES EXCHANGE
20-F 1 d526156d20f.htm FORM 20-F Table of Contents UNITED STATES SECURITIES AND EXCHANGE COMMISSION Washington, D.C. 20549 FORM 20-F ANNUAL REPORT PURSUANT TO SECTION 13 OR 15(d) OF THE SECURITIES EXCHANGE
UNITED STATES SECURITIES AND EXCHANGE COMMISSION Washington D.C
 As filed with the Securities and Exchange Commission on March 17, 2015 UNITED STATES SECURITIES AND EXCHANGE COMMISSION Washington D.C. 20549 FORM 20-F REGISTRATION STATEMENT PURSUANT TO SECTION 12(b)
2016 ANNUAL REPORT. Brookfield Infrastructure Partners L.P.
 2016 ANNUAL REPORT Brookfield Infrastructure Partners L.P. UNITED STATES SECURITIES AND EXCHANGE COMMISSION Washington D.C. 20549 FORM 20-F REGISTRATION STATEMENT PURSUANT TO SECTION 12(b) OR 12(g) OF
As filed with the Securities and Exchange Commission on June 29, UNITED STATES SECURITIES AND EXCHANGE COMMISSION Washington, D.C.
 ˆ1G4ZTFDPWZ1RY3G6Š 1G4ZTFDPWZ1RY3G.18 kales0in 28-Jun-2007 03:00 EST 52223 FS 1 2* HTM ESS 0C Page 1 of 2 As filed with the Securities and Exchange Commission on June 29, 2007 UNITED STATES SECURITIES
UNITED STATES SECURITIES AND EXCHANGE COMMISSION WASHINGTON, D.C Amendment No. 1 to FORM 20-F
 UNITED STATES SECURITIES AND EXCHANGE COMMISSION WASHINGTON, D.C. 20549 Amendment No. 1 to FORM 20-F REGISTRATION STATEMENT PURSUANT TO SECTION 12(b) OR 12(g) OF THE SECURITIES EXCHANGE ACT OF 1934 OR
BANCO DE CHILE BANK OF CHILE
 Page 1 of 2 As filed with the Securities and Exchange Commission on June 25, 2003 SECURITIES AND EXCHANGE COMMISSION Washington, D.C. 20549 FORM 20-F Annual Report Pursuant to Section 13 or 15(d) of the
UNITED STATES SECURITIES AND EXCHANGE COMMISSION WASHINGTON, D.C FORM 10-Q. For the quarterly period ended November 3, OR -
 UNITED STATES SECURITIES AND EXCHANGE COMMISSION WASHINGTON, D.C. 20549 FORM 10-Q (Mark One) x QUARTERLY REPORT PURSUANT TO SECTION 13 OR 15(d) OF THE SECURITIES EXCHANGE ACT OF 1934 For the quarterly
YPF SOCIEDAD ANONIMA
 YPF SOCIEDAD ANONIMA FORM 20-F (Annual and Transition Report (foreign private issuer)) Filed 04/26/13 for the Period Ending 12/31/12 Telephone 5413267265 CIK 0000904851 Symbol YPF SIC Code 2911 - Petroleum
United States Securities and Exchange Commission Washington, D.C FORM 10 Q
 United States Securities and Exchange Commission Washington, D.C. 20549 FORM 10 Q [X] QUARTERLY REPORT PURSUANT TO SECTION 13 OR 15(d) OF THE SECURITIES EXCHANGE ACT OF 1934 For the quarterly period ended
AROTECH CORPORATION (Exact name of registrant as specified in its charter)
") UNITED STATES SECURITIES AND EXCHANGE COMMISSION Washington, D.C. 20549 OMB APPROVAL OMB Number: 3235-0070 Expires: September 30, 2018 Estimated average burden hours per response 187.43 FORM 10-Q QUARTERLY
UNITED STATES SECURITIES AND EXCHANGE COMMISSION Washington, D.C. 20549 OMB APPROVAL OMB Number: 3235-0070 Expires: September 30, 2018 Estimated average burden hours per response 187.43 FORM 10-Q QUARTERLY
Brookfield Infrastructure Partners L.P ANNUAL REPORT
 Brookfield Infrastructure Partners L.P. 2017 ANNUAL REPORT x UNITED STATES SECURITIES AND EXCHANGE COMMISSION Washington D.C. 20549 FORM 20-F REGISTRATION STATEMENT PURSUANT TO SECTION 12(b) OR 12(g) OF
PETROBRAS ARGENTINA S.A. (Exact name of Registrant as specified in its charter)
") i UNITED STATES SECURITIES AND EXCHANGE COMMISSION Washington, DC 20549 FORM 20-F ANNUAL REPORT PURSUANT TO SECTION 13 OR 15(D) OF THE SECURITIES EXCHANGE ACT OF 1934 For the fiscal year ended December
i UNITED STATES SECURITIES AND EXCHANGE COMMISSION Washington, DC 20549 FORM 20-F ANNUAL REPORT PURSUANT TO SECTION 13 OR 15(D) OF THE SECURITIES EXCHANGE ACT OF 1934 For the fiscal year ended December
ELBIT SYSTEMS LTD (ESLT) 20-F/A
 20-F/A") ELBIT SYSTEMS LTD (ESLT) 20-F/A Annual and transition report of foreign private issuers pursuant to sections 13 or 15(d) Filed on 04/04/2012 Filed Period 12/31/2011 UNITED STATES SECURITIES AND EXCHANGE
ELBIT SYSTEMS LTD (ESLT) 20-F/A Annual and transition report of foreign private issuers pursuant to sections 13 or 15(d) Filed on 04/04/2012 Filed Period 12/31/2011 UNITED STATES SECURITIES AND EXCHANGE
LI3 ENERGY, INC. FORM 10-Q. (Quarterly Report) Filed 05/15/15 for the Period Ending 03/31/15
 Filed 05/15/15 for the Period Ending 03/31/15") LI3 ENERGY, INC. FORM 10-Q (Quarterly Report) Filed 05/15/15 for the Period Ending 03/31/15 Telephone 56 2 2206 5252 CIK 0001334699 SIC Code 1400 - Mining and Quarrying Of Nonmetallic Minerals (No Fuels)
LI3 ENERGY, INC. FORM 10-Q (Quarterly Report) Filed 05/15/15 for the Period Ending 03/31/15 Telephone 56 2 2206 5252 CIK 0001334699 SIC Code 1400 - Mining and Quarrying Of Nonmetallic Minerals (No Fuels)
YPF Sociedad Anónima
 UNITED STATES SECURITIES AND EXCHANGE COMMISSION Washington, D.C. 20549 FORM 20-F ANNUAL REPORT PURSUANT TO SECTION 13 OR 15(d) OF THE SECURITIES EXCHANGE ACT OF 1934 For the fiscal year ended December
SECURITIES AND EXCHANGE COMMISSION Washington, D.C Form 20-F
 SECURITIES AND EXCHANGE COMMISSION Washington, D.C. 20549 Form 20-F [ ] REGISTRATION STATEMENT PURSUANT TO SECTION 12(b) OR (g) OF THE SECURITIES EXCHANGE ACT OF 1934 OR [ X ] ANNUAL REPORT PURSUANT TO
Lan Airlines S.A. (Exact name of registrant as specified in its charter)
") UNITED STATES SECURITIES AND EXCHANGE COMMISSION Washington, D.C. 20549 FORM 20-F REGISTRATION STATEMENT PURSUANT TO SECTION 12(b) OR (g) OF THE SECURITIES EXCHANGE ACT OF 1934 OR ANNUAL REPORT PURSUANT
UNITED STATES SECURITIES AND EXCHANGE COMMISSION Washington, D.C. 20549 FORM 20-F REGISTRATION STATEMENT PURSUANT TO SECTION 12(b) OR (g) OF THE SECURITIES EXCHANGE ACT OF 1934 OR ANNUAL REPORT PURSUANT
UNITED STATES SECURITIES AND EXCHANGE COMMISSION Washington, D.C FORM 10-Q
 UNITED STATES SECURITIES AND EXCHANGE COMMISSION Washington, D.C. 20549 FORM 10-Q (Mark One) QUARTERLY REPORT PURSUANT TO SECTION 13 OR 15(d) OF THE SECURITIES EXCHANGE ACT OF 1934 For the quarterly period
YPF Sociedad Anónima
 UNITED STATES SECURITIES AND EXCHANGE COMMISSION Washington, D.C. 20549 FORM 20-F ANNUAL REPORT PURSUANT TO SECTION 13 OR 15(d) OF THE SECURITIES EXCHANGE ACT OF 1934 For the fiscal year ended December
Deutsche Bank Aktiengesellschaft
 As filed with the Securities and Exchange Commission on March 23, 2006 UNITED STATES SECURITIES AND EXCHANGE COMMISSION WASHINGTON, D.C. 20549 Form 20-F REGISTRATION STATEMENT PURSUANT TO SECTION 12(b)
China Mobile Limited
 UNITED STATES SECURITIES AND EXCHANGE COMMISSION Washington, DC 20549 FORM 20-F REGISTRATION STATEMENT PURSUANT TO SECTION 12(b) OR 12(g) OF THE SECURITIES EXCHANGE ACT OF 1934 ANNUAL REPORT PURSUANT TO
SECURITIES AND EXCHANGE COMMISSION WASHINGTON, D.C FORM 20-F
 As filed with the Securities and Exchange Commission on June 30, 2005 SECURITIES AND EXCHANGE COMMISSION WASHINGTON, D.C. 20549 FORM 20-F REGISTRATION STATEMENT PURSUANT TO SECTION 12(b) OR (g) OF THE
BANCO BILBAO VIZCAYA ARGENTARIA, S.A. BANK BILBAO VIZCAYA ARGENTARIA, S.A.
 UNITED STATES SECURITIES AND EXCHANGE COMMISSION WASHINGTON, D.C. 20549 FORM 6-K REPORT OF FOREIGN ISSUER PURSUANT TO RULE 13a-16 OR 15d-16 UNDER THE SECURITIES EXCHANGE ACT OF 1934 For the six months
As filed with the Securities and Exchange Commission on April 27, UNITED STATES SECURITIES AND EXCHANGE COMMISSION Washington, D.C.
 As filed with the Securities and Exchange Commission on April 27, 2017 UNITED STATES SECURITIES AND EXCHANGE COMMISSION Washington, D.C. 20549 FORM 20-F ANNUAL REPORT PURSUANT TO SECTION 13 OR 15(d) OF
ORANGE FORM 20-F. (Annual and Transition Report (foreign private issuer)) Filed 04/12/13 for the Period Ending 12/31/12
) Filed 04/12/13 for the Period Ending 12/31/12") ORANGE FORM 20-F (Annual and Transition Report (foreign private issuer)) Filed 04/12/13 for the Period Ending 12/31/12 Telephone 33144442222 CIK 0001038143 Symbol ORAN SIC Code 4813 - Telephone Communications
ORANGE FORM 20-F (Annual and Transition Report (foreign private issuer)) Filed 04/12/13 for the Period Ending 12/31/12 Telephone 33144442222 CIK 0001038143 Symbol ORAN SIC Code 4813 - Telephone Communications
UNITED STATES SECURITIES AND EXCHANGE COMMISSION Washington, D.C FORM 20-F
 UNITED STATES SECURITIES AND EXCHANGE COMMISSION Washington, D.C. 20549 FORM 20-F ANNUAL REPORT PURSUANT TO SECTION 13 OR 15(d) OF THE SECURITIES EXCHANGE ACT OF 1934 For the fiscal year ended December
United States Securities and Exchange Commission Washington, D.C FORM 10 Q
 United States Securities and Exchange Commission Washington, D.C. 20549 FORM 10 Q [X] QUARTERLY REPORT PURSUANT TO SECTION 13 OR 15(d) OF THE SECURITIES EXCHANGE ACT OF 1934 For the quarterly period ended
MANAGEMENT S DISCUSSION AND ANALYSIS FOR THE THIRD QUARTER ENDED SEPTEMBER 30, 2015
 MANAGEMENT S DISCUSSION AND ANALYSIS FOR THE THIRD QUARTER ENDED SEPTEMBER 30, 2015 As of November 9, 2015 Management s discussion and analysis ( MD&A ) is intended to help the reader understand the significant
PLAINS ALL AMERICAN PIPELINE LP
 PLAINS ALL AMERICAN PIPELINE LP FORM 10-K (Annual Report) Filed 02/27/18 for the Period Ending 12/31/17 Address 333 CLAY STREET SUITE 1600 HOUSTON, TX, 77002 Telephone 7136544100 CIK 0000423 Symbol PAA
UNITED STATES SECURITIES AND EXCHANGE COMMISSION Washington, D.C FORM 20-F CHINA PETROLEUM & CHEMICAL CORPORATION
 UNITED STATES SECURITIES AND EXCHANGE COMMISSION Washington, D.C. 20549 FORM 20-F (Mark One) REGISTRATION STATEMENT PURSUANT TO SECTION 12(b) OR (g) OF THE SECURITIES EXCHANGE ACT OF 1934 OR x ANNUAL REPORT
ENEL CHILE S.A. Santa Rosa 76 Santiago, Chile. EXTRAORDINARY SHAREHOLDERS MEETING To be held on December 20, 2017
 ENEL CHILE S.A. Santa Rosa 76 Santiago, Chile EXTRAORDINARY SHAREHOLDERS MEETING To be held on December 20, 2017 To the Holders of American Depositary Shares of Enel Chile S.A. ( ADS Holders ): An Extraordinary
Enel Chile S.A. Shares of Common Stock Rights to Subscribe for Shares of Common Stock
 PROSPECTUS SUPPLEMENT To Prospectus dated February 15, 2018 Enel Chile S.A. Shares of Common Stock Rights to Subscribe for Shares of Common Stock We are offering to our common stockholders transferable
UNITED STATES SECURITIES AND EXCHANGE COMMISSION WASHINGTON, D.C FORM 20-F
 (Mark One) UNITED STATES SECURITIES AND EXCHANGE COMMISSION WASHINGTON, D.C. 20549 FORM 20-F o REGISTRATION STATEMENT PURSUANT TO SECTION 12(b) OR (g) OF THE SECURITIES EXCHANGE ACT OF 1934 OR x ANNUAL
PetroChina Company Limited
 UNITED STATES SECURITIES AND EXCHANGE COMMISSION Washington, D.C. 20549 FORM 20-F ANNUAL REPORT PURSUANT TO SECTION 13 OR 15(d) OF THE SECURITIES EXCHANGE ACT OF 1934 For the fiscal year ended December
Anheuser-Busch InBev SA/NV
 (Mark One) UNITED STATES SECURITIES AND EXCHANGE COMMISSION WASHINGTON, D.C. 20549 FORM 20-F/A (Amendment No. 1) REGISTRATION STATEMENT PURSUANT TO SECTION 12(b) OR (g) OF THE SECURITIES EXCHANGE ACT OF
UNITED STATES SECURITIES AND EXCHANGE COMMISSION Washington, D.C FORM 10-Q
 (Mark One) UNITED STATES SECURITIES AND EXCHANGE COMMISSION Washington, D.C. 20549 FORM 10-Q QUARTERLY REPORT PURSUANT TO SECTION 13 OR 15(d) OF THE SECURITIES EXCHANGE ACT OF 1934 For the quarterly period
[X] ANNUAL REPORT PURSUANT TO SECTION 13 OR 15(d) OF THE SECURITIES EXCHANGE ACT OF 1934 For the fiscal year ended: December 31, 2012
![[X] ANNUAL REPORT PURSUANT TO SECTION 13 OR 15(d) OF THE SECURITIES EXCHANGE ACT OF 1934 For the fiscal year ended: December 31, 2012](/thumbs/72/67270235.jpg "[X] ANNUAL REPORT PURSUANT TO SECTION 13 OR 15(d) OF THE SECURITIES EXCHANGE ACT OF 1934 For the fiscal year ended: December 31, 2012") SECURITIES AND EXCHANGE COMMISSION Washington, D.C. 20549 FORM 20-F (Mark One) [ ] REGISTRATION STATEMENT PURSUANT TO SECTION 12(B) OR (G) OF THE SECURITIES EXCHANGE ACT OF 1934 [X] ANNUAL REPORT PURSUANT
SECURITIES AND EXCHANGE COMMISSION Washington, D.C. 20549 FORM 20-F (Mark One) [ ] REGISTRATION STATEMENT PURSUANT TO SECTION 12(B) OR (G) OF THE SECURITIES EXCHANGE ACT OF 1934 [X] ANNUAL REPORT PURSUANT
UNITED STATES SECURITIES AND EXCHANGE COMMISSION INFOSYS LIMITED
 UNITED STATES SECURITIES AND EXCHANGE COMMISSION Washington, D.C. 20549 FORM 20-F (Mark One) Registration statement pursuant to Section 12(b) or (g) of the Securities Exchange Act of 1934 OR Annual Report
UNITED STATES SECURITIES AND EXCHANGE COMMISSION. Washington, D.C FORM 10-Q. QUARTERLY REPORT PURSUANT TO SECTION 13 OR 15(d) OF THE SECURITIES
 OF THE SECURITIES") (Mark One) þ UNITED STATES SECURITIES AND EXCHANGE COMMISSION Washington, D.C. 20549 FORM 10-Q QUARTERLY REPORT PURSUANT TO SECTION 13 OR 15(d) OF THE SECURITIES EXCHANGE ACT OF 1934 FOR THE QUARTERLY
(Mark One) þ UNITED STATES SECURITIES AND EXCHANGE COMMISSION Washington, D.C. 20549 FORM 10-Q QUARTERLY REPORT PURSUANT TO SECTION 13 OR 15(d) OF THE SECURITIES EXCHANGE ACT OF 1934 FOR THE QUARTERLY
OLD DOMINION FREIGHT LINE, INC. (Exact name of registrant as specified in its charter)
") UNITED STATES SECURITIES AND EXCHANGE COMMISSION Washington, D.C. 20549 FORM 10-Q ý QUARTERLY REPORT PURSUANT TO SECTION 13 OR 15(d) OF THE SECURITIES EXCHANGE ACT OF 1934 For the quarterly period ended
UNITED STATES SECURITIES AND EXCHANGE COMMISSION Washington, D.C. 20549 FORM 10-Q ý QUARTERLY REPORT PURSUANT TO SECTION 13 OR 15(d) OF THE SECURITIES EXCHANGE ACT OF 1934 For the quarterly period ended
COMSTOCK RESOURCES, INC. (Exact name of registrant as specified in its charter)
") UNITED STATES SECURITIES AND EXCHANGE COMMISSION Washington, D.C. 20549 FORM 10-Q (Mark One) QUARTERLY REPORT PURSUANT TO SECTION 13 OR 15(d) OF / THE SECURITIES EXCHANGE ACT OF 1934 For The Quarter Ended
UNITED STATES SECURITIES AND EXCHANGE COMMISSION Washington, D.C. 20549 FORM 10-Q (Mark One) QUARTERLY REPORT PURSUANT TO SECTION 13 OR 15(d) OF / THE SECURITIES EXCHANGE ACT OF 1934 For The Quarter Ended
METROGAS INC FORM 20-F. (Annual and Transition Report (foreign private issuer)) Filed 04/26/13 for the Period Ending 12/31/12
) Filed 04/26/13 for the Period Ending 12/31/12") METROGAS INC FORM 20-F (Annual and Transition Report (foreign private issuer)) Filed 04/26/13 for the Period Ending 12/31/12 Telephone 541143091362 CIK 0000931069 Symbol MGSBF SIC Code 4924 - Natural Gas
METROGAS INC FORM 20-F (Annual and Transition Report (foreign private issuer)) Filed 04/26/13 for the Period Ending 12/31/12 Telephone 541143091362 CIK 0000931069 Symbol MGSBF SIC Code 4924 - Natural Gas
Ternium Announces Third Quarter and First Nine Months of 2018 Results
 Sebastián Martí Ternium - Investor Relations +1 (866) 890 0443 +54 (11) 4018 8389 www.ternium.com Ternium Announces Third Quarter and First Nine Months of 2018 Results Luxembourg, October 30, 2018 Ternium
FRONTERA ENERGY CORPORATION
 NEWS RELEASE FRONTERA ENERGY CORPORATION FRONTERA ANNOUNCES SHAREHOLDER VALUE ENHANCEMENT INITIATIVES AND 2019 PLAN AND GUIDANCE INFORMATION Stable Production and Operating EBITDA Expected to Deliver Strong
PetroChina Company Limited
 UNITED STATES SECURITIES AND EXCHANGE COMMISSION Washington, D.C. 20549 FORM 20-F (Mark One) n REGISTRATION STATEMENT PURSUANT TO SECTION 12(b) OR 12(g) OF THE SECURITIES EXCHANGE ACT OF 1934 or ANNUAL
CAMAC ENERGY INC. FORM 10-Q/A. (Amended Quarterly Report) Filed 07/18/14 for the Period Ending 03/31/14
 Filed 07/18/14 for the Period Ending 03/31/14") CAMAC ENERGY INC. FORM 10-Q/A (Amended Quarterly Report) Filed 07/18/14 for the Period Ending 03/31/14 Address 1330 POST OAK BLVD SUITE 2250 HOUSTON, TX 77056 Telephone 713-797-2940 CIK 0001402281 Symbol
CAMAC ENERGY INC. FORM 10-Q/A (Amended Quarterly Report) Filed 07/18/14 for the Period Ending 03/31/14 Address 1330 POST OAK BLVD SUITE 2250 HOUSTON, TX 77056 Telephone 713-797-2940 CIK 0001402281 Symbol
China Ming Yang Wind Power Group Limited (Exact name of Registrant as specified in its charter)
") UNITED STATES SECURITIES AND EXCHANGE COMMISSION WASHINGTON, D.C. 20549 FORM 20-F (Mark One) REGISTRATION STATEMENT PURSUANT TO SECTION 12(b) OR (g) OF THE SECURITIES EXCHANGE ACT OF 1934 x ANNUAL REPORT
UNITED STATES SECURITIES AND EXCHANGE COMMISSION WASHINGTON, D.C. 20549 FORM 20-F (Mark One) REGISTRATION STATEMENT PURSUANT TO SECTION 12(b) OR (g) OF THE SECURITIES EXCHANGE ACT OF 1934 x ANNUAL REPORT
Lamar Advertising Company Commission File Number
 UNITED STATES SECURITIES AND EXCHANGE COMMISSION Washington, D.C. 20549 FORM 10-Q Quarterly Report Pursuant to Section 13 or 15(d) of the Securities Exchange Act of 1934 For the quarterly period ended
MILLER INDUSTRIES, INC. (Exact name of registrant as specified in its charter)
") UNITED STATES SECURITIES AND EXCHANGE COMMISSION Washington, D.C. 20549 FORM 10-Q QUARTERLY REPORT PURSUANT TO SECTION 13 OR 15(d) OF THE SECURITIES EXCHANGE ACT OF 1934 For the quarterly period ended
UNITED STATES SECURITIES AND EXCHANGE COMMISSION Washington, D.C. 20549 FORM 10-Q QUARTERLY REPORT PURSUANT TO SECTION 13 OR 15(d) OF THE SECURITIES EXCHANGE ACT OF 1934 For the quarterly period ended
BANK BILBAO VIZCAYA ARGENTARIA, S.A. (Translation of Registrant s name into English)
") SECURITIES AND EXCHANGE COMMISSION Washington, D.C. 20549 FORM 20-F REGISTRATION STATEMENT PURSUANT TO SECTION 12(b) OR (g) OF THE SECURITIES EXCHANGE ACT OF 1934 OR ANNUAL REPORT PURSUANT TO SECTION 13
SECURITIES AND EXCHANGE COMMISSION Washington, D.C. 20549 FORM 20-F REGISTRATION STATEMENT PURSUANT TO SECTION 12(b) OR (g) OF THE SECURITIES EXCHANGE ACT OF 1934 OR ANNUAL REPORT PURSUANT TO SECTION 13
Industrial Income Trust Inc.
 UNITED STATES SECURITIES AND EXCHANGE COMMISSION Washington, D.C. 20549 Form 10-Q (Mark One) QUARTERLY REPORT PURSUANT TO SECTION 13 OR 15(d) OF THE SECURITIES EXCHANGE ACT OF 1934 For the quarterly period
UNITED STATES SECURITIES AND EXCHANGE COMMISSION Washington, D.C
 UNITED STATES SECURITIES AND EXCHANGE COMMISSION Washington, D.C. 20549 FORM 20-F (Mark One) REGISTRATION STATEMENT PURSUANT TO SECTION 12(b) OR (g) OF THE SECURITIES EXCHANGE ACT OF 1934 OR ANNUAL REPORT
FORM 20-F ENERSIS S.A.
 SECURITIES AND EXCHANGE COMMISSION Washington, D.C. 20549 FORM 20-F REGISTRATION STATEMENT PURSUANT TO SECTION 12(b) OR 12(g) OF THE SECURITIES EXCHANGE ACT OF 1934 OR ANNUAL REPORT PURSUANT TO SECTION
FORM 10-Q TAYLOR DEVICES, INC.
 (Mark One) UNITED STATES SECURITIES AND EXCHANGE COMMISSION Washington, D.C. 20549 FORM 10-Q QUARTERLY REPORT PURSUANT TO SECTION 13 OR 15(d) OF THE SECURITIES EXCHANGE ACT OF 1934 For the quarterly period
TIFFANY & CO. (Exact name of registrant as specified in its charter)
") UNITED STATES SECURITIES AND EXCHANGE COMMISSION Washington, D.C. 20549 FORM 10-Q (Mark One) x QUARTERLY REPORT PURSUANT TO SECTION 13 OR 15(d) OF THE SECURITIES EXCHANGE ACT OF 1934 For the quarterly
UNITED STATES SECURITIES AND EXCHANGE COMMISSION Washington, D.C. 20549 FORM 10-Q (Mark One) x QUARTERLY REPORT PURSUANT TO SECTION 13 OR 15(d) OF THE SECURITIES EXCHANGE ACT OF 1934 For the quarterly
UNITED STATES SECURITIES AND EXCHANGE COMMISSION Washington, D.C FORM 10-Q
 (Mark One) UNITED STATES SECURITIES AND EXCHANGE COMMISSION Washington, D.C. 20549 FORM 10-Q QUARTERLY REPORT PURSUANT TO SECTION 13 OR 15(d) OF THE SECURITIES EXCHANGE ACT OF 1934 For the quarterly period
Q Earnings Release Published October 29, 2018 (Earnings Conference Call October 30, 2018)
") Q3 2018 Earnings Release Published October 29, 2018 (Earnings Conference Call October 30, 2018) David Graziosi, President & Chief Executive Officer Fred Bohley, Vice President & Chief Financial Officer
Q3 2018 Earnings Release Published October 29, 2018 (Earnings Conference Call October 30, 2018) David Graziosi, President & Chief Executive Officer Fred Bohley, Vice President & Chief Financial Officer
Lamar Advertising Company
 UNITED STATES SECURITIES AND EXCHANGE COMMISSION Washington, D.C. 20549 FORM 10-Q Quarterly Report Pursuant to Section 13 or 15 (d) of the Securities Exchange Act of 1934 For the quarterly period ended
BROOKFIELD INFRASTRUCTURE PARTNERS L.P. Q Supplemental Information
 BROOKFIELD INFRASTRUCTURE PARTNERS L.P. Q3 2018 Supplemental Information Third Quarter,, 2018 Cautionary Statement Regarding Forward-Looking Statements This Supplemental Information contains forward-looking
BROOKFIELD INFRASTRUCTURE PARTNERS L.P. Q Supplemental Information
 BROOKFIELD INFRASTRUCTURE PARTNERS L.P. Q2 2018 Supplemental Information Second Quarter,, 2018 Cautionary Statement Regarding Forward-Looking Statements This Supplemental Information contains forward-looking