UNITED STATES SECURITIES AND EXCHANGE COMMISSION Washington, D.C
|
|
|
- Osborn Goodman
- 5 years ago
- Views:
Transcription
1 UNITED STATES SECURITIES AND EXCHANGE COMMISSION Washington, D.C FORM 6-K Report of Foreign Private Issuer Pursuant to Rule 13a-16 or 15d-16 of the Securities Exchange Act of 1934 For the year ended December, 2015 Commission File Number Atento S.A. (Translation of Registrant's name into English) 4 rue Lou Hemmer, L-1748 Luxembourg Findel Grand Duchy of Luxembourg (Address of principal executive office) Indicate by check mark whether the registrant files or will file annual reports under cover of Form 20-F or Form 40-F. Form 20-F: xform 40-F: o Indicate by check mark if the registrant is submitting the Form 6-K in paper as permitted by Regulation S-T Rule 101(b)(1): Yes: ono: x Note: Regulation S-T Rule 101(b)(1) only permits the submission in paper of a Form 6-K if submitted solely to provide an attached annual report to security holders. Indicate by check mark if the registrant is submitting the Form 6-K in paper as permitted by Regulation S-T Rule 101(b)(7): Yes: ono: x Note : Regulation S-T Rule 101(b)(7) only permits the submission in paper of a Form 6-K if submitted to furnish a report or other document that the registrant foreign private issuer must furnish and make public under the laws of the jurisdiction in which the registrant is incorporated, domiciled or legally organized (the registrant s home country ), or under the rules of the home country exchange on which the registrant s securities are traded, as long as the report or other document is not a press release, is not required to be and has not been distributed to the registrant s security holders, and, if discussing a material event, has already been the subject of a Form 6-K submission or other Commission filing on EDGAR.
2 ATENTO S.A. INDEX Financial Information For the Three Months and Year Ended December 31, 2015 PART I PRESENTATION OF FINANCIAL AND OTHER INFORMATION 3 SELECTED HISTORICAL FINANCIAL INFORMATION 5 SUMMARY CONSOLIDATED HISTORICAL FINANCIAL INFORMATION 6 Consolidated Statements of Financial Position as of December 31, 2014 and Consolidated Income Statements for the Year Ended December 31, 2013, 2014 and Consolidated Income Statements for the Three Months Ended December 31, 2014 and Consolidated Statements of Cash Flow for the Years Ended December 31, 2013, 2014 and 2015, and for the Three Months Ended December 31, 2014 and Management s Discussion and Analysis of Financial Condition and Results of Operations 23 QUANTITATIVE AND QUALITATIVE DISCLOSURES ABOUT MARKET RISK 5 2
3 Table of Contents PART I - PRESENTATION OF FINANCIAL AND OTHER INFORMATION Atento S.A. ( Atento, the Company, we or the Organization ) was formed as a direct subsidiary of Atalaya Luxco Topco S.C.A. ( Topco ). In April 2014, Topco also incorporated Atalaya Luxco PIKCo S.C.A. ( PikCo ) and on May 15, 2014 Topco contributed to PikCo: (i) all of its equity interests in its then direct subsidiary, Atalaya Luxco Midco S.à.r.l. ( Midco ), the consideration for which was an allocation to PikCo s account capital contributions not remunerated by shares (the Reserve Account ) equal to 2 million, resulting in Midco becoming a direct subsidiary of PikCo; and (ii) all of its debt interests in Midco (comprising three series of preferred equity certificates (the Original Luxco PECs )), the consideration for which was the issuance by PikCo to Topco of preferred equity certificates having an equivalent value. On May 30, 2014, Midco authorized the issuance of, and PikCo subscribed for, a fourth series of preferred equity certificates (together with the Original Luxco PECs, the Luxco PECs ). In connection with the completion of Atento s initial public offering (the IPO ) in October 2014, Topco transferred its entire interest in Midco ( 31,000 of share capital) to PikCo, the consideration for which was an allocation of 31,000 to PikCo s Reserve Account. PikCo then contributed all of the Luxco PECs to Midco (the Contribution ), the consideration for which was an allocation to Midco s Reserve Account equal to the value of the Luxco PECs immediately prior to the Contribution. Upon completion of the Contribution, the Luxco PECs were capitalized by Midco. PikCo then transferred the remainder of its interest in Midco ( 12,500 of share capital) to the Company, in consideration for which the Company issued two new shares of its capital stock to PikCo. The difference between the nominal value of these shares and the value of Midco s net equity will be allocated to the Company s share premium account. As a result of this transfer, Midco became a direct subsidiary of the Company. The Company completed a share split (the Share Split ) whereby it issued approximately 2, ordinary shares for each ordinary share outstanding as of September 3, The foregoing is collectively referred as the Reorganization Transaction. On October 7, 2014, we closed our IPO and issued 4,819,511 ordinary shares at a price of $15.00 per share. As a result of the IPO, the Share Split and the Reorganization Transaction, we have 73,619,511 ordinary shares outstanding and own 100% of the issued and outstanding share capital of Midco, as of November 9, On August 4, 2015, the Board approved a share capital increase through the issuance of 131,620 shares. Therefore, the total shares increased from 73,619,511 to 73,751,131. In this Report, all references to U.S. dollar and $ are to the lawful currency of the United States and all references to euro or are to the single currency of the participating member states of the European and Monetary Union of the Treaty Establishing the European Community, as amended from time to time. In addition, all references to Brazilian Reais (BRL), Mexican Peso (MXN), Chilean Peso (CLP), Argentinean Peso (ARS), Colombian Peso (COP) and Peruvian Nuevos Soles (PEN) are to the lawful currencies of Brazil, Mexico, Chile, Argentina, Colombia and Peru, respectively. The following table shows the exchange rates of the U.S. dollar to these currencies for the years and dates indicated as reported by the relevant central banks of the European Union and each country, as applicable Average December 31 Average December 31 Average December 31 Euro (EUR) Brazil (BRL) Mexico (MXN) Colombia (COP) 1, , , , , , Chile (CLP) Peru (PEN) Argentina (ARS) Divestment transaction On December 9, 2014, Atento S.A. through its indirect subsidiary, Atento Spain Holdco, S.L.U., a sole-shareholder subsidiary of Atento Luxco 1, S.A. entered into an agreement for the sale of the 100% of the share capital of ATENTO CESKÁ REPUBLIKA A.S., which owns its operations in the Czech Republic, with the Italian company COMDATA S.P.A., the transaction was not subject to regulatory approval. 3
4 Table of Contents Acquisition transaction As of December 30, 2014, the Company, through its wholly owned subsidiary Atento Brasil S.A. acquired 100% of the share capital of Casa Bahia Contact Center Ltda. ( CBCC ), a call center services provider located in Brazil, for a total acquisition price of 20,343 thousand of reais (equivalent to $7,659 thousand). As a result of the acquisition, the Atento group is expected to strengthen its presence in the Brazilian market. At December 30, 2014, this company has been renamed as Atento Brasil 1, Ltda. The goodwill of $4,061 thousand arose from the acquisition, which is attributable to the synergies derived from combining the operations of the Atento and CBCC. The goodwill recognized is expected to be deductible for income tax purposes. In compliance with Instrução Normativa nº 358 of January 03, 2002 and amendments of the Comissão de Valores Mobiliários (CVM), in July 1, 2015 the General Shareholder Meetings of ATENTO BRASIL S.A. approved the incorporation of your wholly owned subsidiary, ATENTO BRASIL 1 LTDA. 4
5 Table of Contents SELECTED HISTORICAL FINANCIAL INFORMATION We present our historical financial information under International Financial Reporting Standards ( IFRS ) as issued by the International Accounting Standards Board (the IASB ). None of the financial statements or financial information included in Form 6-K has been prepared in accordance with generally accepted accounting principles in the United States of America. Atento Financial Information The consolidated financial information of Atento are the consolidated results of operations of Atento, which includes the year ended December 31, 2013, 2014 and Interim Financial Information The unaudited consolidated financial information for the quarter ended December 31, 2014 and 2015 are derived from Atento s financial information, which are prepared in accordance with IFRS. Rounding Certain numerical figures set out in this Report, including financial data presented in millions or thousands and percentages, have been subject to rounding adjustments, and, as a result, the totals of the data in this Report may vary slightly from the actual arithmetic totals of such data. Percentages and amounts reflecting changes over time periods relating to financial and other data set forth in Selected Historical Financial Information and Management s Discussion and Analysis of Financial Condition and Results of Operations are calculated using the numerical data in the financial statements or the tabular presentation of other data (subject to rounding) contained in this Report, as applicable, and not using the numerical data in the narrative description thereof. 5
6 Table of Contents SUMMARY CONSOLIDATED HISTORICAL FINANCIAL INFORMATION The following tables present a summary of the consolidated historical financial information for the periods and as of the dates indicated and should be read in conjunction with the section of this document entitled Management s Discussion and Analysis of Financial Condition and Results of Operations and Selected Historical Financial Information included elsewhere in this document. For the year For the year ended Change ended December 31, Change excluding FX December 31, ($ millions) (%) (%) 2015 (audited) (unaudited) Change (%) Change excluding FX (%) Revenue 2, ,298.3 (1.8) 7.7 1,965.6 (14.5) 9.2 EBITDA (1) (11.5) (0.8) Adjusted EBITDA (1) (18.3) 6.7 Adjusted Earnings (2) (14.3) 15.7 Adjusted Earnings per share (in U.S. dollars) (3) (14.3) 15.7 Capital Expenditure (4) (103.0) (120.1) (121.2) Payments for acquisition of property, plant, equipment and intangible assets (5) (128.8) (117.9) (8.5) (4.2) (96.4) (18.2) 39.1 Total Debt excluding PECs (23.2) (12.8) (11.9) 6.2 Cash and cash equivalents and short-term financial investments (22.8) (5.4) Net debt with third parties (6) (34.9) (26.2) (5.6) 12.8 For the three months ended December 31, Change ($ millions) (%) (unaudited) Change excluding FX (%) Revenue (17.5) 8.1 EBITDA (1) Adjusted EBITDA (1) (26.0) (1.6) Adjusted Earnings (2) (12.5) 15.2 Adjusted Earnings per share (in U.S. dollars) (3) (12.5) 15.2 Capital Expenditure (4) (54.7) (38.1) (30.3) (4.4) Payments for acquisition of property, plant, equipment and intangible assets (5) (36.7) (35.8) (2.5) Total Debt excluding PECs (11.9) 6.2 Cash and cash equivalents and short-term financial investments (22.8) (5.4) Net debt with third parties (6) (5.6) 12.8 (1) In considering the financial performance of the business, our management analyzes the financial performance measures of EBITDA and Adjusted EBITDA at a company and operating segment level, to facilitate decision-making. EBITDA is defined as profit/(loss) for the period from continuing operations before net finance costs, income taxes and depreciation and amortization. Adjusted EBITDA is defined as EBITDA adjusted to exclude acquisition and integration related costs, restructuring costs, sponsor management fees, asset impairments, site-relocation costs, financing and IPO fees, and other items which are not related to our core results of operations. EBITDA and Adjusted EBITDA are not measures defined by IFRS. The most directly comparable IFRS measure to EBITDA and Adjusted EBITDA is profit/(loss) for the period from continuing operations. We believe EBITDA and Adjusted EBITDA are useful metrics for investors to understand our results of continuing operations and profitability because they permit investors to evaluate our recurring profitability from underlying operating activities. We also use these measures internally to establish forecasts, budgets and operational goals to manage and monitor our business, as well as to evaluate our underlying historical performance. We believe EBITDA facilitates comparisons of operating performance between periods and among other companies in industries similar to ours because it removes the effect of variances in capital structures, taxation, and non-cash depreciation and amortization charges, which may differ between companies for reasons unrelated to operating performance. We believe Adjusted EBITDA better reflects our underlying operating performance because it excludes the impact of items which are not related to our core results of continuing operations. 6
7 Table of Contents EBITDA and Adjusted EBITDA measures are frequently used by securities analysts, investors and other interested parties in their evaluation of companies comparable to us, many of which present EBITDA-related performance measures when reporting their results. EBITDA and Adjusted EBITDA have limitations as analytical tools. These measures are not presentations made in accordance with IFRS, are not measures of financial condition or liquidity and should not be considered in isolation or as alternatives to profit or loss for the period from continuing operations or other measures determined in accordance with IFRS. EBITDA and Adjusted EBITDA are not necessary comparable to similarly titled measures used by other companies. See below under the heading Reconciliation of EBITDA and Adjusted EBITDA to profit/(loss) for a reconciliation of profit/(loss) for the period from continuing operations to EBITDA and Adjusted EBITDA. (2) In considering the Company s financial performance, our management analyzes the performance measure of Adjusted Earnings. Adjusted Earnings is defined as profit/(loss) for the period from continuing operations adjusted for acquisition and integration related costs, amortization of acquisition related intangible assets, restructuring costs, sponsor management fees, assets impairments, site relocation costs, financing and IPO fees, PECs interest expense, other non-ordinary expenses, net foreign exchange impacts and their tax effects. Adjusted Earnings is not a measure defined by IFRS. The most directly comparable IFRS measure to Adjusted Earnings is our profit/(loss) for the period from continuing operations. We believe Adjusted Earnings, is an useful metric to investors and is used by our management for measuring profitability because it represents a group measure of performance which excludes the impact of certain non-cash charges and other charges not associated with the underlying operating performance of the business, while including the effect of items that we believe affect shareholder value and in-year return, such as income-tax expense and net finance costs. Our management uses Adjusted Earnings to (i) provide senior management with monthly reports of our operating results; (ii) prepare strategic plans and annual budgets; and (iii) review senior management s annual compensation, in part, using adjusted performance measures. Adjusted Earnings is defined to exclude items that are not related to our core results of operations. Adjusted Earnings measures are frequently used by securities analysts, investors and other interested parties in their evaluation of companies comparable to us, many of which present an Adjusted Earnings related performance measure when reporting their results. Adjusted Earnings has limitations as an analytical tool. Adjusted Earnings is neither a presentation made in accordance with IFRS nor a measure of financial condition or liquidity, and should not be considered in isolation or as an alternative to profit or loss for the period from continuing operations or other measures determined in accordance with IFRS. Adjusted Earnings is not necessarily comparable to similarly titled measures used by other companies. See below under the heading Reconciliation of Adjusted Earnings to profit/(loss) for a reconciliation of our Adjusted Earnings to our profit/(loss) for the period from continuing operations. (3) Excluding the impact of a previously disclosed one-time tax benefit related to the amortization of goodwill related to a contract with Telefónica in the year ended 2014, Adjusted Earnings per share grew 104.1%. Adjusted Earnings per share is calculated based on 73,648,760 ordinary shares outstanding as of December 31, The weighted average number of ordinary shares for the period ended December 31, 2014 was not considered in this calculation. (4) We define capital expenditure as the sum of the additions to property, plant and equipment and the additions to intangible assets during the period. Capital expenditures for year ended December 31, 2015 reflect the acquisition by Atento of the rights to use certain software for $39.6 million. This intangible asset has a useful life of five years. (5) Payments for acquisition of property, plant, equipment and intangible assets represent the cash disbursement for the period. (6) In considering our financial condition, our management analyzes Net debt with third parties, which is defined as Total Debt less cash, cash equivalents (net of any outstanding bank overdrafts) and short-term financial investments. 7
8 Table of Contents Net debt with third parties has limitations as an analytical tool. Net debt with third parties is neither a measure defined by or presented in accordance with IFRS nor a measure of financial performance, and should not be considered in isolation or as an alternative financial measure determined in accordance with IFRS. Net debt with third parties is not necessarily comparable to similarly titled measures used by other companies. See Selected Historical Financial Information for a reconciliation of Total Debt to Net debt with third parties utilizing IFRS reported balances obtained from the financial information included elsewhere in this Report. The most directly comparable IFRS measure to Net debt with third parties is Total Debt. 8
9 Table of Contents Consolidated Statements of Financial Position as of December 31, 2014 and 2015 (THOUSANDS OF U.S. DOLLARS, UNLESS OTHERWISE INDICATED) December 31, 2014 December 31, 2015 (audited) (unaudited) ASSETS NON-CURRENT ASSETS 942, ,704 Intangible assets 293, ,260 Goodwill 169, ,007 Property, plant and equipment 237, ,678 Non-current financial assets 92, ,923 Deferred tax assets 150, ,836 CURRENT ASSETS 715, ,712 Trade and other receivables 475, ,923 Other current financial assets 28, Cash and cash equivalents 211, ,020 TOTAL ASSETS 1,657,901 1,378,416 EQUITY AND LIABILITIES EQUITY ATTRIBUTABLE TO EQUITY HOLDERS OF THE PARENT 464, ,791 NON-CURRENT LIABILITIES 818, ,046 Deferred tax liabilities 83,132 56,062 Debt with third parties 636, ,277 Derivative financial instruments 1, Non-current provisions 94,774 55,020 Non-current non trade payables ,002 Other non-current payables to public administrations 1,596 1,001 CURRENT LIABILITIES 374, ,579 Debt with third parties 16,761 40,289 Trade and other payables 339, ,848 Current provisions 18,509 11,442 TOTAL EQUITY AND LIABILITIES 1,657,901 1,378,416 9
10 Table of Contents Consolidated Income Statements for the Year Ended December 31, 2013, 2014 and 2015 (THOUSANDS OF U.S. DOLLARS, UNLESS OTHERWISE INDICATED) For the year For the year ended December 31, Change ended Change excluding December 31, excluding 2013 (**) 2014 (**) FX (%) 2015 FX (%) (audited) (unaudited) Revenue 2,341,115 2,298, ,965, Other operating income 4,367 4, , Own work capitalized (32.5) 6 N.M. Other gains - 35,092 N.M. - N.M. Operating expenses: Supplies (115,340) (104,808) 0.2 (78,447) (2.9) Employee benefit expense (1,643,497) (1,636,373) 9.3 (1,422,700) 10.2 Depreciation (58,295) (59,001) 9.1 (51,085) 11.7 Amortization (70,680) (60,819) (8.1) (51,773) 10.0 Changes in trade provisions 2,026 1,665 (10.1) (1,230) N.M. Other operating expenses (355,670) (360,192) 9.2 (245,093) (12.2) Impairment charges - (31,792) N.M. - N.M. Total operating expenses (2,241,456) (2,251,320) 9.7 (1,850,328) 4.7 Operating profit 104,974 87,150 (1.3) 119, Finance income 10,832 17, , Finance costs (117,688) (122,064) 9.8 (75,682) (19.8) Change in fair value of financial instruments (**) (11,579) 27,272 N.M. 17,535 N.M. Net foreign exchange gain/(loss) 17,768 (33,303) N.M. (3,979) N.M. Net finance expense (100,667) (110,769) 17.4 (46,667) (43.0) Profit/(loss) before tax 4,307 (23,619) N.M. 72,933 N.M. Income tax expense (8,346) (18,533) N.M. (23,785) 64.3 Profit/(loss) for the period (4,039) (42,152) N.M. 49,148 N.M. Basic result per share (in U.S. dollars) (*) (0.05) (0.57) N.M N.M. (*) The basic result per share, for the period presented in the table above, was calculated based on the number of ordinary shares of 73,648,760 as of December 31, For the period ended December 31, 2014 the number of ordinary shares was 73,619,511. (**) The gain or loss of the fair value of derivatives was recorded in the Income Statements within Finance income ($6.9 million for the year ended December 31, 2013 and $40.9 million for the year ended December 31, 2014) and Finance costs ($18.5 million for the year ended December 31, 2013 and $13.6 million for the year ended December 31, 2014), instead of Changes in fair value of financial instruments. 10
11 Table of Contents Consolidated Income Statements for the Three Months Ended December 31, 2014 and 2015 (THOUSANDS OF U.S. DOLLARS, UNLESS OTHERWISE INDICATED) For the three months ended December 31, Change excluding 2014 (**) 2015 FX (%) (unaudited) Revenue 555, , Other operating income 2,819 2,307 (3.6) Own work capitalized N.M. Other gains N.M. Operating expenses: Supplies (25,568) (18,628) (2.0) Employee benefit expense (390,020) (329,307) 9.8 Depreciation (14,581) (12,646) 16.4 Amortization (13,599) (11,374) 11.8 Changes in trade provisions 1,864 (305) (121.1) Other operating expenses (109,965) (62,379) (24.5) Impairment charges N.M. Total operating expenses (551,182) (434,639) 3.2 Operating profit 7,373 25,445 N.M. Finance income 3,980 2, Finance costs (21,627) (17,663) 9.2 Change in fair value of financial instruments (**) 20,006 3,492 N.M. Net foreign exchange gain/(loss) (14,930) (4,553) (57.7) Net finance expense (12,571) (15,941) 78.6 Profit/(loss) before tax (5,198) 9,504 N.M. Income tax expense (20,653) (4,100) (74.9) Profit/(loss) for the period (25,851) 5,404 N.M. Basic result per share (in U.S. dollars) (*) (0.35) 0.07 N.M. (*) The basic result per share, for the period presented in the table above, was calculated based on the number of ordinary shares of 73,648,760 as of December 31, For the period ended December 31, 2014 the number of ordinary shares was 73,619,511. (**) The gain or loss of the fair value of derivatives was recorded in the Income Statements within Finance income ($25.9 million for the three months ended December 31, 2014) and Finance costs ($5.9 million for the three months ended December 31, 2014), instead of Changes in fair value of financial instruments. 11
12 Table of Contents Consolidated Statements of Cash Flow for the Year Ended December 31, 2013, 2014 and 2015 and for the Three Months Ended December 31, 2014 and 2015 (THOUSANDS OF U.S. DOLLARS, UNLESS OTHERWISE INDICATED) Operating activities For the three months ended For the year ended December 31, December 31, (audited) (unaudited) (unaudited) Profit/(loss) before tax 4,307 (23,619) 72,933 (5,198) 9,504 Adjustments to profit/(loss): Amortization and depreciation 128, , ,858 28,180 24,020 Impairment allowances (2,026) 30,127 1,230 (2,551) 305 Change in provisions 23,638 30, (3,241) (1,119) Grants released to income (1,702) - (626) - (261) (Gains)/losses on disposal of fixed assets 1, Finance income (10,832) (17,326) (15,459) (3,980) (2,783) Finance costs 117, ,064 75,682 21,627 17,663 Net exchange differences (17,768) 33,303 3,979 14,930 4,553 Change in fair value of financial instruments 11,579 (27,272) (17,535) (20,006) (3,492) Own work capitalized - (475) (6) (62) (21) Other (gains)/losses - (36,380) 1,086 (1,902) 53 Changes in working capital: 250, , ,256 33,684 39,115 Changes in trade and other receivables 41,628 82,576 (74,366) 47,744 23,823 Changes in trade and other payables (67,909) (15,661) (14,321) (2,075) (14,256) Other assets/(payables) (20,802) (43,838) (19,614) (32,587) 3,914 Other cash flow from operating activities (47,083) 23,077 (108,301) 13,082 13,481 Interest paid (63,269) (96,497) (66,178) (28,101) (18,146) Interest received 5,476 23,991 17,760 10,645 2,518 Income tax paid (30,750) (18,986) (16,212) (2,988) (3,240) Other payments (19,795) (28,088) (15,280) 4,771 (2,980) (108,338) (119,580) (79,910) (15,673) (21,848) Net cash flow from/(used in) operating activities 99, ,295 36,978 25,895 40,252 Investment activities Payments for acquisition of intangible assets (13,551) (21,835) (15,137) (8,423) - Payments for acquisition of property, plant and equipment (115,223) (96,017) (81,310) (28,252) (35,754) Acquisition of subsidiaries (13,284) (7,460) - (7,460) - Payments for financial instruments (14,829) (93,192) - (26,630) - Disposals of intangible assets (6) 131 Disposals of property, plant and equipment ,523 (112) (108) Disposals of financial instruments 32,731 66,562 26,866 52,563 - Disposals of subsidiaries - 1,237-1,237 - Net cash flow from/(used in) investment activities (123,401) (149,838) (67,195) (17,083) (35,731) Financing activities Proceeds from common stock - 72,293-72,293 - Proceeds from borrowings from third parties 280,709 68,630 38,739 (2,282) 9,499 Proceeds from borrowings from group companies - 85,080 - (3,239) - Repayment of borrowings from third parties (200,723) (187,167) (2,101) (28,175) (377) Repayment of borrowings from group companies (48,765) Net cash flow from/(used in) financing activities 31,221 38,836 36,638 38,597 9,122 Exchange differences 5,761 (26,344) (33,841) (26,665) (4,279) Net increase/(decrease) in cash and cash equivalents 13,180 (2,051) (27,420) 20,744 9,364 Cash and cash equivalents at beginning of period 200, , , , ,656 Cash and cash equivalents at end of period 213, , , , ,020 Cash and cash equivalents and short-term financial investments at end of the period 213, , , , ,020
13 12
14 Table of Contents Reconciliation of EBITDA and Adjusted EBITDA to profit/(loss): For the year ended December 31, For the three months ended December 31, ($ in millions) (audited) (unaudited) (unaudited) Profit/(loss) for the period (4.0) (42.1) 49.1 (25.9) 5.4 Net finance expense Income tax expense Depreciation and amortization EBITDA (non-gaap) (unaudited) Acquisition and integration related costs (a) Restructuring costs (b) Sponsor management fees (c) Site relocation costs (d) Financing and IPO fees (e) Asset impairments and Other (f) Total non-recurring items Adjusted EBITDA (non-gaap) (unaudited) (a) Acquisition and integration related costs incurred in 2013 and 2014, are costs associated with the post-acquisition process in connection with the full strategy review. These projects were substantially completed by the end of For the year ended December 31, 2013, of the $29.3 million in acquisition and integration related costs, $27.9 million relate to professional fees incurred to establish Atento as a standalone company not affiliated to Telefónica. These projects are mainly related to full strategy review including growth plans and operational set-up with a leading consulting firm ($14.7 million), improvement of financial and cash flow reporting ($5.9 million), improving procurement efficiency ($4.8 million) and executive recruiting fees related primarily to strengthening the senior management team post-acquisition ($1.4 million). For the year ended December 31, 2014 acquisition and integration related costs primarily resulted from consulting fees incurred in connection with the full strategy review including our growth plan and operational set-up with a leading consulting firm ($4.0 million), improving procurement efficiency ($2.3 million), and IT transformation projects ($2.5 million). Acquisition and integration related costs incurred for the year ended December 31, 2015 primarily related to the finalization the SAP IT transformation project during the three months ended March 31, Acquisition and integration related costs incurred during the three months ended December 31, 2014 primarily related to consulting fees incurred in connection with IT transformation projects. During the three months ended December 31, 2015, we have no costs related to our acquisition and integration process. These projects were substantially completed by the end of (b) Restructuring costs incurred in 2013, 2014 and 2015 primarily included a number of restructuring activities and other personnel costs that were not related to our core result of operations. For the year ended December 31, 2013, $8.6 million of our restructuring costs were related to the relocation of our corporate headquarters and severance payments directly related to the acquisition. In addition, in 2013 we incurred $1.5 million in restructuring costs in Spain (relating to restructuring expenses incurred as a consequence of significant reduction in activity levels as a result of adverse market conditions in Spain), and $1.4 million in Chile (related to restructuring expenses incurred in connection with the implementation of a new service delivery model with Telefónica). Restructuring costs incurred for the year ended December 31, 2014, are primarily related to headcount restructuring activities in Spain. In addition, we incurred restructuring costs not related to our core results of operations in Argentina and Peru of $4.8 million, $2.5 million in Chile of restructuring expenses incurred in connection with the implementation of a new service delivery model with Telefónica, and certain changes to the executive team, and an additional $0.7 million related to the relocation of corporate headquarters. Restructuring costs incurred in the year ended December 31, 2015, primarily relates to optimization of labor force to current or expected adjustments in activity levels, mainly in EMEA and Brazil. 13
15 Table of Contents Restructuring costs incurred for the three months ended December 31, 2014, primarily include $2.7 million related to restructuring in Chile ($1.1 million) in connection with certain changes to the executive team, and the restructuring of specific operations in Peru and Argentina ($1.6 million). For the three months ended December 31, 2015 restructuring costs primarily relates to labor force optimization to current activity level declines mainly in Telefónica business, both in Brazil and EMEA. (c) (d) (e) (f) Sponsor management fees represent the annual advisory fee paid to Bain Capital Partners, LLC that were expensed during the period presented. The advisory agreement was terminated in connection with the initial public offering. Site relocation costs incurred for the three months and year ended December 31, 2013 and 2014 include costs associated with our current strategic initiative of relocating call centers from tier 1 cities to tier 2 cities in Brazil to achieve efficiencies through lower rental costs, attrition and absenteeism. Site relocation costs incurred for the three months ended December 31, 2015 related to the anticipation for site closures in Brazil in connection of the site relocation program to tier 2 and tier 3 cities. Financing and IPO fees for the three months and year ended December 31, 2014 primarily relate to non-core professional fees incurred during the IPO process, including advisory, auditing and legal expenses. Financing and IPO fees for the three months and year ended December 31, 2015 relate to remaining costs incurred during the three months ended March 31, 2015 in connection with the IPO process. Asset impairments and other costs incurred for the year ended December 31, 2013 relate to projects for inventory control in Brazil which are not related to our core results of operations. Asset impairments and other costs incurred for the year ended December 31, 2014, mainly relate to the goodwill and other intangible asset impairment relating to our operation in Czech Republic (divested in December 2014) of $3.7 million and Spain of $28.8 million, offset by the amendment of the MSA with Telefónica, by which the minimum revenue commitment for Spain was reduced against a $34.5 million penalty fee paid by Telefónica. Asset impairment and other costs for the year ended December 31, 2015 mainly refer to consulting and other costs in connection with efficiencies and costs reduction projects implemented in Brazil and EMEA. Asset impairments and other costs incurred for the three months ended December 31, 2014 primarily related to a revenue adjustment in Spain ($2.4 million) for prior fiscal years and a one off tax penalty in Colombia ($1.3 million). Asset impairments and other costs for the three months ended December 31, 2015 mainly refer to consulting and other costs in connection with efficiencies and costs reduction projects in implementation in Brazil and EMEA. 14
16 Table of Contents Reconciliation of Adjusted Earnings to profit/(loss): For the three months ended For the year ended December 31, December 31, ($ in millions, except for percentage changes) (audited) (unaudited) (unaudited) Profit/(loss) attributable to equity holders of the parent (4.0) (42.1) 49.1 (25.9) 5.4 Acquisition and integration related costs (a) Amortization of acquisition related intangible assets (b) Restructuring costs (c) Sponsor management fees (d) Site relocation costs (e) Financing and IPO fees (f) PECs interest expense (g) (0.4) - Asset impairments and Other (h) DTA adjustment in Spain (i) Net foreign exchange gain on financial instruments (j) 11.6 (27.3) (17.5) (20.0) (3.5) Net foreign exchange impacts (k) (17.8) Tax effect (l) (38.3) (46.4) (17.1) (11.0) (6.4) Total of add-backs Adjusted Earnings (non-gaap) (unaudited) Adjusted basic Earnings per share (in U.S. dollars) (*) (unaudited) (a) Acquisition and integration related costs incurred in 2013, 2014, are costs associated with the post-acquisition process in connection with the full strategy review. These projects were substantially completed by the end of For the year ended December 31, 2013, of the $29.3 million in acquisition and integration related costs, $27.9 million relate to professional fees incurred to establish Atento as a standalone company not affiliated to Telefónica. These projects are mainly related to full strategy review including growth plans and operational set-up with a leading consulting firm ($14.7 million), improvement of financial and cash flow reporting ($5.9 million), improving procurement efficiency ($4.8 million) and executive recruiting fees related primarily to strengthening the senior management team post-acquisition ($1.4 million). For the year ended December 31, 2014 acquisition and integration related costs primarily resulted from consulting fees incurred in connection with the full strategy review including our growth plan and operational set-up with a leading consulting firm ($4.0 million), improving procurement efficiency ($2.3 million), and IT transformation projects ($2.5 million). Acquisition and integration related costs incurred for the year ended December 31, 2015 primarily relate to the finalization the SAP IT transformation project during the three months ended March 31, Acquisition and integration related costs incurred during the three months ended December 31, 2014 primarily related to consulting fees incurred in connection with IT transformation projects. During the three months ended December 31, 2015, we have no costs related to our acquisition and integration process. These projects were substantially completed by the end of (b) (c) Amortization of acquisition related intangible assets represents the amortization expense of intangible assets resulting from the acquisition and has been adjusted to eliminate the impact of the amortization arising from the acquisition which is not in the ordinary course of our daily operations, and also distorts comparisons with peers and our results for prior periods. Such intangible assets primarily include contractual relationships with customers, for which the useful life has been estimated at primarily nine years. Restructuring costs incurred in 2013, 2014 and 2015 primarily included a number of restructuring activities and other personnel costs that were not related to our core result of operations. For the year ended December 31, 2013, $8.6 million of our restructuring costs were related to the relocation of our corporate headquarters and severance payments directly related to the acquisition. In addition, in 2013 we incurred $1.5 million in restructuring costs in Spain (relating to restructuring expenses incurred as a consequence of significant reduction in activity levels as a result of adverse market conditions in Spain), and $1.4 million in Chile (related to restructuring expenses incurred in connection with the implementation of a new service delivery model with Telefónica). Restructuring costs incurred for the year ended December 31, 2014, are primarily related to headcount restructuring activities in Spain. In addition, we incurred restructuring costs not related to our core results of operations in Argentina and Peru of $4.8 million, $2.5 million in Chile of restructuring expenses incurred in connection with the implementation of a new service delivery model with Telefónica, and certain changes to the executive team, and an additional $0.7 million related to the relocation of corporate headquarters. Restructuring costs incurred in the year ended December 31, 2015, primarily relates to optimization of labor force to current or expected adjustments in activity levels, mainly in EMEA and Brazil. 15
17 Table of Contents Restructuring costs incurred for the three months ended December 31, 2014, primarily include $2.7 million related to restructuring in Chile ($1.1 million) in connection with certain changes to the executive team, and the restructuring of specific operations in Peru and Argentina ($1.6 million). For the three months ended December 31, 2015 restructuring costs primarily relates to labor force optimization to current activity level declines mainly in TEF business, both in Brazil and EMEA. (d) (e) (f) (g) Sponsor management fees represent the annual advisory fee paid to Bain Capital Partners, LLC that are expensed during the period presented. The advisory agreement was terminated in connection with the initial public offering. Site relocation costs incurred for the three months and year ended December 31, 2013 and 2014 include costs associated with our current strategic initiative of relocating call centers from tier 1 cities to tier 2 cities in Brazil to achieve efficiencies through lower rental costs, attrition and absenteeism. Site relocation costs incurred for the three months ended December 31, 2015 related to the anticipation for site closures in Brazil in connection of the site relocation program to tier 2 and tier 3 cities. Financing and IPO fees for the three months and year ended December 31, 2014 primarily relate to non-core professional fees incurred during the IPO process, including advisory, auditing and legal expenses. Financing and IPO fees for the three months and year ended December 31, 2015 relate to remaining costs incurred during the three months ended March 31, 2015 in connection with the IPO process. PECs Interest expense represents accrued interest on the preferred equity certificates that were capitalized in connection with the IPO. (h) Asset impairments and other costs incurred for the year ended December 31, 2013 relate to projects for inventory control in Brazil which are not related to our core results of operations. Asset impairment and other costs incurred for the year ended December 31, 2014, mainly relate to the goodwill and other intangible asset impairment relating to our operation in Czech Republic (divested in December 2014) of $3.7 million and Spain of $28.8 million, offset by the amendment of the MSA with Telefónica, by which the minimum revenue commitment for Spain was reduced against a $34.5 million penalty fee paid by Telefónica. Asset impairments and other costs for the year ended December 31, 2015 mainly refer to consulting and other costs in connection with efficiencies and costs reduction projects implemented in Brazil and EMEA. Asset impairments and other costs incurred for the three months ended December 31, 2014 primarily related to a revenue adjustment in Spain ($2.4 million) for prior fiscal years and a one off tax penalty in Colombia ($1.3 million). Asset impairments and other costs for the three months ended December 31, 2015 mainly refer to consulting and other costs in connection with efficiencies and costs reduction projects in implementation in Brazil and EMEA. (i) Deferred tax asset adjustment as a consequence of the tax rate reduction in Spain from 30% to 28% in 2015 and to 25% in (j) (k) (l) As of April 1, 2015, the Company designated the foreign currency risk on certain of its subsidiaries as net investment hedges using financial instruments as the hedging items. As a consequence, any gain or loss on the hedging instrument, related to the effective portion of the hedge will be recognized in other comprehensive income (equity) as from that date. The gain or loss related to the ineffective portion will be recognized in the income statements. Cumulative net foreign exchange gain of such instruments was reversed from equity to profit/(loss) in the three months ended March 31, 2015 in the amount of $13.0 million and in the three months ended September 30, 2015 an amount of $1.0 million. For comparability, this one time adjustment was added back to calculate adjusted earnings. As of 2015, management analyzes the Company financial condition performance excluding net foreign exchange impacts, which eliminates the volatility to foreign exchange variances from our operational results. For comparability purposes, 2013 and 2014 adjusted earnings was restated by the net foreign exchange non-cash results from currency fluctuations impacting loans between group companies and other minor effects. The tax effect represents the tax impact of the total adjustments based on a tax rate of 30.1% for 2013, 28.7% for 2014 and 30.5% for the year ended December 31, For the three months ended December 31, 2014 and % and 29.6% respectively. The adjustments for the three months ended December 31, 2015 include $1.5 million of DTA adjustments that are both excluded from the adjustments base for tax effect calculation. 16
18 Table of Contents (*) The Adjusted E arnings per share, for the period presented in the table above, was calculated considering the number of ordinary shares of 73,648,760 (w eighted average number of ordinary shares) as of December 31, For the period ended December 31, 2014 the number of ordinary shares was 73,619,
19 Table of Contents Adjusted Earnings in Consolidated Income Statements For the purpose of best presentation of Adjusted Earnings, the adjustments disclosed at "Reconciliation of Adjusted Earnings to profit/(loss)" disclosed in page 15 of this report were allocated to the correspondent Income Statement line of Consolidated Income Statements for the year ended December 31, 2013, 2014 and 2015 and for the three months ended December 31, 2014 and 2015: For the year ended December 31, ($ in millions, except percentage changes) 2013 (**) Allocation 2013 (a) Adjusted 2014 (**) Allocation 2014 (a) Adjusted (audited) (unaudited) (audited) (unaudited) Change (%) Change excluding FX (%) Revenue 2, , , ,298.3 (1.8) 7.7 Other operating income Own work capitalized (44.4) (32.5) Other gains N.M. N.M. Operating expenses: Supplies (115.3) (115.3) (104.8) (104.8) (9.1) 0.2 Employee benefit expense (b) (1,643.5) 12.8 (1,630.7) (1,636.4) 26.7 (1,609.7) (1.3) 8.3 Depreciation (58.3) (58.3) (59.0) (59.0) Amortization (c) (70.7) 40.7 (30.0) (60.8) 36.6 (24.2) (19.3) (14.0) Changes in trade provisions (15.0) (10.1) Other operating expenses (d) (355.6) 42.2 (313.4) (360.2) 72.3 (287.9) (8.1) 0.6 Impairment charges - - (31.8) (31.8) N.M. N.M. Total operating expenses (2,241.4) 95.7 (2,145.7) (2,251.3) (2,115.7) (1.4) 8.0 Operating profit Finance income Finance costs (e) (117.7) 31.8 (85.9) (122.1) 25.8 (96.3) Change in fair value of financial instruments (f) (**) (11.6) (27.3) - N.M. N.M. Net foreign exchange gain/(loss) (g) 17.8 (17.8) - (33.3) N.M. N.M. Net finance expense (100.7) 25.6 (75.1) (110.8) 31.8 (79.0) Profit/(loss) before tax (23.6) Income tax expense (h) (8.3) (38.3) (46.6) (18.5) (36.6) (55.1) Profit/(loss) for the period (4.0) (42.1) Adjusted basic result per share (0.05) 1.07 (0.57) N.M. means not meaningful (**) The gain or loss of the fair value of derivatives was recorded in the Income Statements within Finance income ($6.9 million for the year ended December 31, 2013 and $40.9 million for the year ended December 31, 2014) and Finance costs ($18.5 million for the year ended December 31, 2013 and $13.6 million for the year ended December 31, 2014), instead of Changes in fair value of financial instruments. 18
20 Table of Contents For the year ended December 31, ($ in millions, except percentage changes) 2014 (**) Allocation 2014 Allocation (a) Adjusted 2015 (a) (audited) (unaudited) (unaudited) 2015 Adjusted Change (%) Change excluding FX (%) Revenue 2, , , ,965.6 (14.5) 9.2 Other operating income (6.5) 10.9 Own work capitalized N.M. N.M. Other gains N.M. N.M. Operating expenses: Supplies (104.8) (104.8) (78.4) (78.4) (25.2) (2.9) Employee benefit expense (b) (1,636.4) 26.7 (1,609.7) (1,422.7) 16.4 (1,406.3) (12.6) 10.7 Depreciation (59.0) (59.0) (51.1) (51.1) (13.4) 11.7 Amortization (c) (60.8) 36.6 (24.2) (51.8) 27.5 (24.3) Changes in trade provisions (1.2) (1.2) N.M. N.M. Other operating expenses (d) (360.2) 72.3 (287.9) (245.1) 11.8 (233.3) (19.0) 4.6 Impairment charges (31.8) (31.8) - - N.M. N.M. Total operating expenses (2,251.3) (2,115.7) (1,850.3) 55.7 (1,794.6) (15.2) 8.0 Operating profit (21.3) 3.0 Finance income (10.4) 24.3 Finance costs (e) (122.1) 25.8 (96.3) (75.7) 0.3 (75.4) (21.7) 0.9 Change in fair value of financial instruments (f) 27.3 (27.3) (17.5) - N.M. N.M. (**) Net foreign exchange gain/(loss) (g) (33.3) (4.0) N.M. N.M. Net finance expense (110.8) 31.8 (79.0) (46.7) (13.2) (59.9) (24.2) (4.2) Profit/(loss) before tax (23.6) (19.8) 6.9 Income tax expense (h) (18.5) (36.6) (55.1) (23.8) (15.6) (39.4) (28.5) (7.3) Profit/(loss) for the period (42.1) (14.3) 15.7 Adjusted basic result per share (0.57) (14.3) 15.7 N.M. means not meaningful (**) The gain or loss of the fair value of derivatives was recorded in the Income Statements within Finance income ($40.9 million for the year ended December 31, 2014) and Finance costs ($13.6 million for the year ended December 31, 2014), instead of Changes in fair value of financial instruments. 19
21 Table of Contents ($ in millions, except percentage changes) 2014 (**) Allocation (a) For the three months ended December 31, 2014 Adjusted 2015 Allocation (a) (unaudited) (unaudited) 2015 Adjusted Change (%) Change excluding FX (%) Revenue (17.5) 8.1 Other operating income (17.9) (3.6) Own work capitalized N.M. N.M. Other gains N.M. N.M. Operating expenses: Supplies (25.6) (25.6) (18.6) (18.6) (27.3) (2.0) Employee benefit expense (b) (390.0) 3.0 (387.0) (329.3) 8.6 (320.7) (17.1) 7.9 Depreciation (14.6) (14.6) (12.6) (12.6) (13.7) 16.4 Amortization (c) (13.6) 8.1 (5.5) (11.4) 6.3 (5.1) (7.3) 27.3 Changes in trade provisions (0.3) (0.3) (115.8) (121.1) Other operating expenses (d) (110.0) 47.9 (62.1) (62.5) 6.7 (55.8) (10.1) 19.2 Impairment charges N.M. N.M. Total operating expenses (551.2) 59.0 (492.2) (434.7) 21.6 (413.1) (16.1) 9.9 Operating profit (29.2) (6.8) Finance income (30.0) 2.5 Finance costs (e) (21.7) (0.4) (22.1) (17.7) (17.7) (19.9) 7.2 Change in fair value of financial instruments (f) (**) 20.0 (20.0) (3.5) - N.M. N.M. Net foreign exchange gain/(loss) (g) (14.9) (4.5) N.M. N.M. Net finance expense (12.6) (5.5) (18.1) (15.9) 1.0 (14.9) (17.7) 8.3 Profit/(loss) before tax (5.2) (33.5) (12.4) Income tax expense (h) (20.7) (1.2) (21.9) (4.1) (4.9) (9.0) (58.9) (45.7) Profit/(loss) for the period (25.9) Adjusted basic result per share (0.35) N.M. means not meaningful (**) The gain or loss of the fair value of derivatives was recorded in the Income Statements within Finance income ($25.9 million for the three months ended December 31, 2014) and Finance costs ($5.9 million for the three months ended December 31, 2014), instead of Changes in fair value of financial instruments. Adjusted Earnings footnotes reference: (a) (b) (c) Allocation of adjustments from the Reconciliation of Adjusted Earnings to profit/(loss) disclosed in page 15 of this report. Employee benefit expense adjustment is disclosed on footnote (c) Restructuring costs. Amortization adjustment is related to footnote (b) Amortization of acquisition related intangible assets. (d) Other operating expenses adjustment includes adjustments detailed in footnotes (a) Acquisition and integration relates costs, (d) Sponsor management fees, (e) Site relocation costs, (f) IPO fees and (h) Asset impairments and Other. (e) (f) (g) (h) Finance costs adjustment is related to footnote (f) Financing fees and (g) PECs interest expense. Change in fair value of financial instruments adjustment refer to footnote (j) Net foreign exchange gain on financial instruments. Net foreign exchange gain/(loss) adjustment refer to footnote (k) Net foreign exchange impacts. Income tax expense adjustment is related to footnote (i) DTA adjustment in Spain and (l) Tax effect. 20
22 Table of Contents Financing Arrangements Certain debt agreements contain financial ratios as an instrument to monitor the Company s financial condition and as preconditions to some transactions (e.g. new debts, permitted payments). The following is a brief description of the financial ratios. 1. Gross Leverage Ratio (applies to Atento S.A.) measure the level of gross debt to EBITDA, as defined in the debt agreements. The contractual ratio indicates that the gross debt should not surpass 2.75 times the EBITDA for the last twelve months. As of December 31, 2015, the current ratio was Fixed Charge Coverage Ratio (applies to Restricted Group) measure the Company s ability to pay interest expenses and dividends (fixed charge) in relation to EBITDA, as described in the debt agreements. The contractual ratio indicates that the EBITDA for the last twelve months should represent at least 2 times the fixed charge of the same period. As of December 31, 2015, the current ratio was Net Debt Brazilian Leverage Ratio (applies only to Brazil) measures the level of net debt (gross debt, less cash, cash equivalents and short-term investments) to EBITDA all of the financial terms as defined in the Debenture indenture. The contractual ratio indicates that Brazil net debt should not surpass 2.5 times the Brazilian EBITDA. As of December 31, 2015, the current ratio was 1.7. This is the only ratio considered as a financial covenant. The Company monitors regularly all financial ratios under the debt agreements. As of December 31, 2015, we were in compliance with the terms of our covenants. As of December 31, ($ in million, except Net Debt/Adj. EBITDA LTM) Cash and cash equivalents Short term financial investments Debt: 7.375% Senior Secured Notes due Brazilian Debentures Vendor Loan Note (1) Contingent Value Instrument Preferred Equity Certificates Finance Lease Payables Other Borrowings Total Debt 1, Preferred Equity Certificates (519.6) - - Total Debt excluding PECs Net Debt with third parties (2) (unaudited) Adjusted EBITDA LTM (3) (non-gaap) (unaudited) Net Debt/Adjusted EBITDA LTM (non-gaap) (unaudited) 2.2x 1.4x 1.6x (1) Reflects the prepayment to Telefónica of the entire indebtedness under the Vendor Loan Note. The loan was liquidated in connection with the IPO. (2) In considering our financial condition, our management analyzes net debt with third parties, which is defined as total debt less cash, cash equivalents, and short-term financial investments. Net debt with third parties is not a measure defined by IFRS and it has limitations as an analytical tool. Net debt is neither a measure defined by or presented in accordance with IFRS nor a measure of financial performance, and should not be considered in isolation or as an alternative financial measure determined in accordance with IFRS. Net debt is not necessarily comparable to similarly titled measures used by other companies. 21
23 Table of Contents (3) Adjusted EBITDA LTM (Last Twelve Months) is defined as EBITDA adjusted to exclude acquisition and integration related costs, restructuring costs, sponsor management fees, asset impairments, site-relocation costs, financing fees, IPO costs and other items, which are not related to our core results of operations for the last twelve months. 22
24 Table of Contents CAUTIONARY NOTE REGARDING FORWARD LOOKING STATEMENTS This Form 6-K providing quarterly and annual information contains forward-looking statements within the meaning of Section 27A of the Securities Act of 1933, Section 21E of the Securities Exchange Act of 1934, and the Private Securities Litigation Reform Act of 1995, relating to our operations, expected financial position, results of operation, and other business matters that are based on our current expectations, assumptions, and projections with respect to the future, and are not a guarantee of performance. In this report, when we use words such as may, believe, plan, will, anticipate, estimate, expect, intend, project, would, could, target, or similar expressions, or when we discuss our strategy, plans, goals, initiatives, or objectives, we are making forward-looking statements. We caution you not to rely unduly on any forward-looking statements. Actual results may differ materially from what is expressed in the forward-looking statements, and you should review and consider carefully the risks, uncertainties and other factors that affect our business and may cause such differences. The forward-looking statements are based on information available as of the date that this Form 6-K furnished with the United States Securities and Exchange Commission ( SEC ) and we undertake no obligation to update them. They are based on numerous assumptions and developments that are not within our control. Although we believe these forward-looking statements are reasonable, we cannot assure you they will turn out to be correct. For additional detail see the sections entitled Risk Factors and Cautionary Statements with respect to Forward-looking Statements in our Annual Form 20-F (the 20-F ). MANAGEMENT S DISCUSSION AND ANALYSIS OF FINANCIAL CONDITION AND RESULTS OF OPERATIONS The following discussion and analysis of our financial condition and the results of operations is based upon and should be read in conjunction with the consolidated financial information of Atento. The consolidated financial information of Atento are the consolidated results of operations of Atento, which includes the years ended December 31, 2013, 2014 and The interim financial information has been prepared to demonstrate to the stakeholders of Atento the results for the three months ended December 31, 2015 compared to the same period of The following discussion includes forward-looking statements. Our actual results could differ materially from those that are discussed in these forwardlooking statements. Factors which could cause or contribute to such difference, include, but are not limited to, those discussed elsewhere in this report, particularly under Cautionary Note Regarding Forward Looking Statements and the section entitled Risk Factors in the Form 20-F. Overview Atento is the largest provider of customer-relationship management and business-process outsourcing ( CRM BPO ) services and solutions in Latin America ( LatAm ) and Spain, and among the third largest provider by revenue globally. Atento s tailored CRM BPO solutions are designed to enable our client s ability to deliver a high-quality product by creating a best-in-class experience for their costumers, enabling our clients to focus on operating their core businesses. Atento utilizes its industry expertise commitment to customer care, and consultative approach, to offer superior and scalable solutions across the entire value chain for customer care, each solution customized for the individual client s needs. We offer a comprehensive portfolio of customizable, and scalable, solutions including front and back-end services ranging from sales, applicationsprocessing, customer care and credit-management. We leverage our deep industry knowledge and capabilities to provide industry-leading solutions to our clients. We provide our solutions to over 400 clients via over 163,000 highly engaged customer care specialists facilitated by our best-in-class technology infrastructure and multi-channel delivery platform. We believe we bring a differentiated combination of scale, capacity for processing client s transactions, and industry expertise to our client s customer care operations, which allow us to provide higher-quality and lower cost customer care services than our clients could deliver on their own. 23
25 Table of Contents Our number of workstations increased from 86,071 as of December 31, 2014 to 91,567 workstations as of December 31, Since we lease all of our call center facilities (it means, buildings and related equipment), which increases our operating expenses and does not result in a depreciation expense (exception IT infra that is supported by Atento and depreciated), our EBITDA performance has historically differed from competitors who own their buildings and equipment, as related financings have generally resulted in higher depreciation expenses for those competitors and have increased such competitors EBITDA. As a part of our strategy to improve cost and efficiencies we continued to migrate a portion of our call centers from Tier 1 to Tier 2 cities. These cities, which tend to be smaller lower cost locations, allow us to optimize our lease expenses and reduce labor costs. By being a preferred employer we are able to then draw from new and larger pools of talent and reduce turnover and absenteeism. We have completed many successful site transfers in Brazil, Colombia and Argentina. In Brazil, for example, the percentage of total workstations located in tier 2 cities increased 5 percentage point, from 53% for the year ended December 31, 2014 to 58% for the year ended December 31, 2015, due to the new sites opened outside Sao Paulo and Rio de Janeiro. As demand for our services and solutions grows, and their complexity continues to increase, we have opportunities to evaluate and adjust our site footprint even further to create the most competitive combination of quality and cost effectiveness for our costumers. The following table shows the number of delivery centers and workstations in each of the jurisdictions in which we operated as of December 31, 2013, 2014 and 2015: Number of Workstations Number of Service Delivery Centers (1) Brazil 39,744 44,061 47, Americas 31,534 34,498 36, Argentina (2) 3,959 3,820 3, Central America (3) 1,666 2,983 2, Chile 3,467 2,398 2, Colombia 4,791 5,827 7, Mexico 9,143 9,812 9, Peru 7,387 8,493 8, United States (4) 1,121 1,165 1, EMEA 7,919 7,512 7, Czech Republic (5) Morocco 1,941 2,046 2, Spain 5,386 5,466 5, Total 79,197 86,071 91, (1) Includes service delivery centers at facilities operated by us and those owned by our clients where we provide operations personnel and workstations. (2) Includes Uruguay. (3) Includes Guatemala and El Salvador. (4) Includes Puerto Rico. (5) Operations in Czech Republic were divested in 2014 see detailed figures of Czech Republic below in Divestment transaction. During 2015, revenue generated from our fifteen largest client groups represented 83.3% of our revenue as compared to 82.1% of revenue in the same period in prior year. Excluding revenue generated from the Telefónica Group, our next 15 largest client groups represented in aggregate 38.8% of our revenue for the year ended December 31, 2015 as compared to 36.0% of our revenue in the same period in prior year. For the three months ended December 31, 2015, revenue generated from our fifteen largest client groups represented 81.5% of our revenue as compared to 83.3% of revenue in the same period in prior year. Excluding revenue generated from the Telefónica Group, our next 15 largest client groups represented, in aggregate, 37.5% of our revenue for the three months ended December 31, 2015 compared to 37.3% of our revenue in the same period in prior year. Our vertical industry expertise in telecommunications, financial services and multi-sector companies allows us to adapt our services and solutions for our clients, further embedding us into their value chain while delivering effective business results and increasing the portion of our client s services related to CRM BPO. For the year ended December 31, 2015 and 2014, CRM BPO solutions comprised approximately 23.9% and 23.2% and individual services 76.1% and 76.8% of our revenue, respectively. For the same period in 2013, CRM BPO solutions and individual services comprised approximately 21.8% and 78.2% of our revenue, respectively. For the three months ended December 31, 2015, CRM BPO solutions and individual services comprised approximately 24.0% and 76.0% of our revenue, respectively. For the same period in 2014, CRM BPO solutions and individual services comprised approximately 23.4% and 76.6% of our revenue, respectively. 24
26 Table of Contents The percentage of solutions and individual services for the year ended December 31, 2013, represented approximately 23% and 77% of group revenues, respectively, were misreported and should have amounted to 21.8% and 78.2% as disclosed in the paragraph above. During the year ended December 31, 2015, telecommunications represented 49.2% of our revenue and financial services represented 35.6% of our revenue, compared to 49.1% and 35.2%, respectively, for the same period in 2014 and 52% and 35% for the same period in During the year ended December 31, 2013, 2014 and 2015 the sales by service were: For the year ended December 31, Customer Service 50.1% 49.8% 47.9% Sales 18.7% 18.2% 18.0% Collection 10.3% 10.8% 10.6% Back Office 8.6% 8.8% 9.7% Technical Support 9.8% 9.6% 10.5% Others 2.5% 2.8% 3.3% Total 100.0% 100.0% 100.0% During the three months ended December 31, 2015, telecommunications represented 48.0% of our revenue and financial services represented 36.7% of our revenue, compared to 51.4% and 32.4%, respectively, for the same period in Additionally, during the three months ended December 31, 2014 and 2015 sales by service were: For the three months ended December 31, Customer Service 50.8% 47.9% Sales 19.3% 17.4% Collection 10.8% 11.2% Back Office 9.1% 10.2% Technical Support 6.5% 9.9% Others 3.5% 3.4% Total 100.0% 100.0% We operate in 14 countries worldwide and organize our business into the following three geographic markets: (i) Brazil, (ii) Americas, excluding Brazil ( Americas ) and (iii) EMEA. For the year ended December 31, 2015, Brazil accounted for 47.3% of our revenue, Americas accounted for 40.2% of our revenue and EMEA accounted for 12.6% of our revenue (in each case, before holding company level revenue and consolidation adjustments). For the three months ended December 31, 2015, Brazil accounted for 42.1% of our revenue, Americas accounted for 44.5% of our revenue and EMEA accounted for 13.5% of our revenue (in each case, before holding company level revenue and consolidation adjustments). 25
27 Table of Contents Average headcount The average headcount in the Atento Group in 2013, 2014 and 2015 and the breakdown by country is presented as follow: Average headcount Brazil 86,413 82,702 90,418 Central America 4,051 4,161 4,687 Chile 3,883 4,703 4,615 Colombia 5,400 6,274 7,770 Spain 13,830 12,121 10,497 Morocco 1,544 1,367 1,348 Mexico 18,823 20,033 19,934 Peru 10,561 12,874 15,279 Puerto Rico United States Czech Republic (*) Argentina and Uruguay 9,151 8,062 7,829 Corporate Total 155, , ,974 (*) Operations in Czech Republic were divested in the last quarter of Revenue by country For the year ended December 31, ($ in millions) (audited) (unaudited) Country Spain Morocco Czech Republic Other and eliminations (*) EMEA Argentina Chile Colombia El Salvador United States Guatemala Mexico Peru Puerto Rico Uruguay Panama Other and eliminations (*) Americas Brazil 1, , Other and eliminations (*) (0.8) (0.7) (1.8) Total revenue 2, , ,965.6 (*) Includes revenue holding-company level as well as consolidation adjustments. 26
28 Table of Contents Divestment transaction On December 9, 2014, Atento S.A. through its indirect subsidiary, Atento Spain Holdco, S.L.U., a sole-shareholder subsidiary of Atento Luxco 1, S.A. entered into an agreement for the sale of the 100% of the share capital of ATENTO CESKÁ REPUBLIKA A.S., which owns its operations in the Czech Republic, with the Italian company COMDATA S.P.A.. This transaction allows Atento to continue strengthening the focus on its core markets encompassing the Pan LatAm region as well as Spain and Morocco in the EMEA region. The following table shows the Income Statements related to the divestment operation for the year ended December 31, 2013 and for the eleven months period ended November 30, 2014: (a) Income Statements ($ in thousands) Year ended December 31, Period from Jan 1 Nov 30, Revenue 14,565 9,517 Other operating income 11 4 Supplies (1,138) (775) Employee benefit expense (11,046) (7,729) Depreciation and amortization (207) (246) Other operating expenses (1,293) (1,059) Impairment charges - (3,696) OPERATING PROFIT/(LOSS) 892 (3,984) Net foreign exchange loss (21) (10) NET FINANCE INCOME/ (EXPENSE) (21) (10) PROFIT/(LOSS) BEFORE TAX 871 (3,994) Income tax benefit/(expense) (117) 57 PROFIT/(LOSS) AFTER TAX 754 (3,937) 27
29 Table of Contents Consolidated Income Statements for the Year Ended December 31, 2013, 2014 and 2015 For the year ended December 31, For the year Change ended December 31, Change excluding Change ($ in millions, except percentage changes) 2013 (**) 2014 (**) (%) FX (%) 2015 (%) (audited) (unaudited) Change excluding FX (%) Revenue 2, ,298.3 (1.8) 7.7 1,965.6 (14.5) 9.2 Other operating income (6.5) 10.9 Own work capitalized (44.4) (32.5) - N.M. N.M. Other gains N.M. N.M. - N.M. N.M. Operating expenses: Supplies (115.3) (104.8) (9.1) 0.2 (78.4) (25.2) (2.9) Employee benefit expense (1,643.5) (1,636.4) (0.4) 9.3 (1,422.7) (13.1) 10.2 Depreciation (58.3) (59.0) (51.1) (13.4) 11.7 Amortization (70.7) (60.8) (14.0) (8.1) (51.8) (14.8) 10.0 Changes in trade provisions (15.0) (10.1) (1.2) N.M. N.M. Other operating expenses (355.6) (360.2) (245.1) (32.0) (12.2) Impairment charges - (31.8) N.M. N.M. - N.M. N.M. Total operating expenses (2,241.4) (2,251.3) (1,850.3) (17.8) 4.7 Operating profit (17.0) (1.3) Finance income (10.4) 24.3 Finance costs (117.7) (122.1) (75.7) (38.0) (19.8) Change in fair value of financial instruments (**) (11.6) 27.3 N.M. N.M (35.9) N.M. Net foreign exchange gain/(loss) 17.8 (33.3) N.M. N.M. (4.0) N.M. N.M. Net finance expense (100.7) (110.8) (46.7) (57.9) (43.0) Profit/(loss) before tax 4.3 (23.6) N.M. N.M N.M. N.M. Income tax expense (8.3) (18.5) N.M. (23.8) Profit/(loss) for the period (4.0) (42.1) N.M. N.M N.M. N.M. Other financial data: EBITDA (1) (unaudited) (11.5) (0.8) Adjusted EBITDA (1) (unaudited) (18.3) 6.7 (1) For reconciliation with IFRS as issued by IASB, see section "Reconciliation of EBITDA and Adjusted EBITDA to profit/(loss)" as above. N.M. means not meaningful (**) The gain or loss of the fair value of derivatives was recorded in the Income Statements within Finance income ($6.9 million for the year ended December 31, 2013 and $40.9 million for the year ended December 31, 2014) and Finance costs ($18.5 million for the year ended December 31, 2013 and $13.6 million for the year ended December 31, 2014), instead of Changes in fair value of financial instruments. 28
30 Table of Contents Consolidated Income Statements for the Three Months Ended December 31, 2014 and 2015 For the three months ended December 31, ($ in millions, except percentage changes) 2014 (**) 2015 (unaudited) Change (%) Change excluding FX (%) Revenue (17.5) 8.1 Other operating income (17.9) (3.6) Own work capitalized N.M. N.M. Other gains N.M. N.M. Operating expenses: Supplies (25.6) (18.6) (27.3) (2.0) Employee benefit expense (390.0) (329.3) (15.6) 9.8 Depreciation (14.6) (12.6) (13.7) 16.4 Amortization (13.6) (11.4) (16.2) 11.8 Changes in trade provisions 1.9 (0.3) (115.8) (121.1) Other operating expenses (110.0) (62.5) (43.2) (24.5) Impairment charges N.M. N.M. Total operating expenses (551.2) (434.7) (21.1) 3.2 Operating profit N.M. N.M. Finance income (30.0) 2.5 Finance costs (21.7) (17.7) (18.4) 9.2 Change in fair value of financial instruments (**) (82.5) N.M. Net foreign exchange gain/(loss) (14.9) (4.5) (69.8) (57.7) Net finance expense (12.6) (15.9) Profit/(loss) before tax (5.2) 9.5 N.M. N.M. Income tax expense (20.7) (4.1) (80.2) (74.9) Profit/(loss) for the period (25.9) 5.4 N.M. N.M. Other financial data: EBITDA (1) (unaudited) Adjusted EBITDA (1) (unaudited) (26.0) (1.6) (1) For reconciliation with IFRS as issued by the IASB, see section "Reconciliation of EBITDA and Adjusted EBITDA to profit/(loss)" as above. N.M. means not meaningful (**) The gain or loss of the fair value of derivatives was recorded in the Income Statements within Finance income ($25.9 million for the three months ended December 31, 2014) and Finance costs ($5.9 million for the three months ended December 31, 2014), instead of Changes in fair value of financial instruments. 29
31 Table of Contents Consolidated Income Statements by Segment for the Year Ended December 31, 2013, 2014 and 2015 For the year ended Change For the year ended December 31, December 31, Change excluding FX Change ($ in millions, except percentage changes) (%) (%) 2015 (%) (audited) (unaudited) Revenue: Change excluding FX (%) Brazil 1, ,184.8 (1.8) (21.5) 10.0 Americas EMEA (7.8) (7.7) (26.1) (11.6) Other and eliminations (1) (0.8) (0.7) (12.5) (50.0) (1.8) N.M. N.M. Total revenue 2, ,298.3 (1.8) 7.7 1,965.6 (14.5) 9.2 Operating expenses: Brazil (1,113.6) (1,081.6) (2.9) 6.3 (863.9) (20.1) 11.8 Americas (705.9) (718.9) (726.0) EMEA (365.2) (381.8) (250.9) (34.3) (21.4) Other and eliminations (1) (56.7) (69.0) (9.5) (86.2) (84.6) Total operating expenses (2,241.4) (2,251.3) (1,850.3) (17.8) 4.7 Operating profit/(loss) : Brazil (35.7) (8.6) Americas (4.9) EMEA (0.1) (45.6) N.M. N.M. (2.5) (94.5) (93.0) Other and eliminations (1) (57.3) (35.0) (38.9) (38.6) (10.2) (70.9) (66.3) Total operating profit (17.0) (1.3) Net finance expense : Brazil (43.9) (42.9) (2.3) 7.1 (25.3) (41.0) (18.2) Americas (3.9) (14.7) N.M. N.M. (8.7) (40.8) (19.0) EMEA (18.4) (13.6) (26.1) (26.1) (12.6) (7.4) 11.0 Other and eliminations (1) (34.5) (39.6) (0.1) (99.7) (97.2) Total net finance expense (100.7) (110.8) (46.7) (57.9) (43.0) Income tax benefit/(expense): Brazil (17.7) (22.3) (14.0) (37.2) (9.9) Americas (19.3) (19.7) (20.2) EMEA (83.1) (78.6) Other and eliminations (1) (61.2) (61.2) 7.8 (3.7) 16.0 Total income tax expense (8.3) (18.5) N.M. (23.8) Profit/(loss) for the period: Brazil (29.0) 2.9 Americas (32.7) (28.8) EMEA (10.7) (43.8) N.M. N.M. (12.6) (71.2) (65.8) Other and eliminations (1) (70.9) (66.5) (6.2) (6.1) (2.5) (96.2) (94.6) Profit/(loss) for the period (4.0) (42.1) N.M. N.M N.M. N.M. Other financial data: EBITDA (2) : Brazil (26.6) 3.8 Americas (7.0) (2.8) 14.6 EMEA 24.3 (25.1) N.M. N.M N.M. N.M. Other and eliminations (1) (56.3) (33.9) (39.8) (39.5) (9.4) (72.3) (68.1) Total EBITDA (unaudited) (11.5) (0.8) Adjusted EBITDA (2) : Brazil (24.8) 7.2 Americas (0.6) (7.3) 9.1 EMEA (1.1) (1.2) 19.1 (27.7) (14.8) Other and eliminations (1) (11.1) (9.8) (11.7) (9.9) (7.3) (25.5) (13.3) Total Adjusted EBITDA (unaudited) (18.3) 6.7 (1) Included revenue and expenses at the holding-company level (such as corporate expenses and acquisition related expenses), as applicable, as well as consolidation adjustments. (2) For reconciliation with IFRS as issued by the IASB, see section "Reconciliation of EBITDA and Adjusted EBITDA to profit/(loss)" as above. N.M. means not meaningful. 30
32 Table of Contents Consolidated Income Statements by Segment for the Three Months Ended December 31, 2014 and 2015 For the three months ended December 31, ($ in millions, except percentage changes) Revenue: (unaudited) Change (%) Change excluding FX (%) Brazil (30.9) 4.5 Americas EMEA (16.6) (5.0) Other and eliminations (1) (0.2) (0.4) N.M. Total revenue (17.5) 8.1 Operating expenses: Brazil (248.0) (181.8) (26.7) 10.8 Americas (188.8) (187.4) (0.7) 16.4 EMEA (70.6) (61.8) (12.5) (0.4) Other and eliminations (1) (43.8) (3.7) (91.6) (90.6) Total operating expenses (551.2) (434.7) (21.1) 3.2 Operating profit/(loss) : Brazil (64.4) (46.7) Americas EMEA (89.2) (86.5) Other and eliminations (1) (43.4) (3.2) (92.6) (91.9) Total operating profit N.M. N.M. Net finance expense : Brazil (6.5) (7.6) Americas (5.3) 1.6 (130.2) (103.8) EMEA (3.3) (3.7) Other and eliminations (1) 2.5 (6.2) N.M. N.M. Total net finance expense (12.6) (15.9) Income tax benefit/(expense): Brazil (9.8) (1.9) (80.6) (70.4) Americas (5.3) (3.1) (41.5) (37.7) EMEA (2.2) (0.7) (68.2) (63.6) Other and eliminations (1) (3.4) 1.6 (147.1) N.M. Total income tax expense (20.7) (4.1) (80.2) (74.9) Profit/(loss) for the period: Brazil (90.2) (86.0) Americas N.M. N.M. EMEA (1.8) (4.1) N.M. Other and eliminations (1) (44.3) (7.8) (82.4) (80.4) Profit/(loss) for the period from continuing operations (25.9) 5.4 N.M. N.M. Other financial data: EBITDA (2) : Brazil (48.9) (23.1) Americas (3.0) 16.3 EMEA (51.9) (44.3) Other and eliminations (1) (43.1) (3.0) (93.0) (92.6) Total EBITDA (unaudited) Adjusted EBITDA (2) : Brazil (39.3) (8.9) Americas (10.5) 6.8 EMEA (18.9) (7.8) Other and eliminations (1) (3.4) (1.8) (47.1) (41.2) Total Adjusted EBITDA (unaudited) (26.0) (1.6) (1) Included revenue and expenses at the holding-company level (such as corporate expenses and acquisition related expenses), as applicable, as well as consolidation adjustments. (2) For reconciliation with IFRS as issued by the IASB, see section "Reconciliation of EBITDA and Adjusted EBITDA to profit/(loss)" as above. N.M. means not meaningful. 31
33 Table of Contents Year Ended December 31, 2015 Compared to the Year Ended December 31, 2014 Revenue Revenue decreased by $332.7 million, or 14.5%, from $2,298.3 million for the year ended December 31, 2014 to $1,965.6 million for the year ended December 31, Excluding the impact of foreign exchange and the sale of the operations in Czech Republic, revenue increased by 9.6% driven primarily by strong performance in Brazil and the Americas, largely offsetting a decline in EMEA. Revenue in LatAm, increased 12.8% excluding the impact of foreign exchange. Revenue from Telefónica, excluding the impact of foreign exchange, increased 2.5%, driven primarily by a strong performance in the Americas, in particular, in Peru as a result of the increase in offshore business from Argentina, in Chile due to the implementation in 2014 of a new business model and new services, as well as price adjustments in Argentina. This positive performance in the Americas largely offset a decline in EMEA driven by adverse conditions in the telecommunication service in Spain. Excluding the impact of foreign exchange and the sale of the operations in Czech Republic, revenue from non-telefónica clients increased 15.9% due to strong double-digit growth in all regions, except EMEA. As of December 31, 2015, revenue from non-telefónica clients totaled 56.3% of total revenue, an increase of 2.8 percentage points over the prior year. We have continued our strategy to increase our revenue diversification from Telefónica with significant clients wins in the telecommunication sector in Brazil and multisector segments, and higher volumes with current clients, primarily in the finance sector. The strong growth in the Americas was driven mainly by Peru, Colombia, Chile, Argentina and nearshore business volume increase in United States and new client wins. This growth partially offset by a decline in EMEA Multisector due to some Public Administration service terminations. The following chart sets forth a breakdown of revenue based on geographical region for the year ended December 31, 2014 and December 31, 2015 and as a percentage of revenue and the percentage change between those periods and net of foreign exchange effects. For the year ended December 31, ($ in millions, except percentage changes) 2014 (%) 2015 (%) Change (%) Change excluding FX (%) (audited) (unaudited) Brazil 1, (21.5) 10.0 Americas EMEA (26.1) (11.6) Other and eliminations (1) (0.7) (0.1) (1.8) (0.1) N.M. N.M. Total 2, , (14.5) 9.2 (1) Includes holding company level revenues and consolidation adjustments Brazil Revenue in Brazil for the year ended December 31, 2014 and December 31, 2015 was $1,184.8 million and $930.2 million, respectively. Revenue decreased in Brazil by $254.6 million, or 21.5%. Excluding the impact of foreign exchange, revenue increased by 10.0% over this period. Excluding the impact of foreign exchange, revenue from Telefónica decreased by 0.2%, principally due to lower volumes. Revenue from non-telefónica clients, excluding the impact of foreign exchange, increased by 17.2%, mainly due to volume growth and the introduction of new services with existing clients, mainly in the financial sector, in addition to significant clients wins in the telecommunication sector where we now provide services to all major operators. Americas Revenue in the Americas for the year ended December 31, 2014 and December 31, 2015 was $779.4 million and $789.8 million, respectively, an increase of $10.4 million, or 1.3%. Excluding the impact of foreign exchange, revenue increased by 17.0%. Excluding the impact of foreign exchange, revenue from Telefónica increased by 13.4% over this period, due to strong performance across the region due to volume and new services introduction across all the geography but led by Argentina, Peru and the implementation of new business model in Chile. Excluding the impact of foreign exchange, revenue from non-telefónica clients increased by 20.2%, due to strong growth in most markets supported by new and existing clients, particularly in Argentina, Peru, Colombia, Central America and nearshore business volume increase in the United States. 32
34 Table of Contents EMEA Revenue in EMEA for the year ended December 31, 2014 and December 31, 2015 was $334.8 million and $247.4 million, respectively, a decrease of $87.4 million, or 26.1%. Excluding the impact foreign exchange and sale of operations in Czech Republic, revenue decreased by 9.0%. Excluding the impact of foreign exchange, revenue from Telefónica decreased by 10.6% mainly in Spain due to volume declines. Excluding the impact of foreign exchange and the sale of operations in Czech Republic, revenue from non-telefónica clients decreased by 6.2%. The growth with private sector new clients is accelerating comparing with last year, still not enough to offset the decline driven by the volume reduction of some contracts with Public Administration and other multisector customer. Other operating income Other operating income decreased by $0.3 million, from $4.6 million for the year ended December 31, 2014 to $4.3 million for the year ended December 31, Excluding the impact of foreign exchange, other operating income increased by 10.9% principally due to service insurance redress in Centro America and subsidies received in Spain for hiring disabled employees. Other gains In May 2014, the Master Service Agreement ( MSA ) with Telefónica, which required the Telefónica Group to meet pre-agreed minimum annual revenue commitments to us through 2021, was amended to adjust minimum revenue commitments in relation to Spain and Morocco, to reflect the expected lower level of activities in these countries. The provisions of the MSA required Telefónica to compensate us in case of shortfalls in these revenue commitments. Based on the above, Telefónica agreed to compensate us with a penalty fee amounting to 25.4 million (equivalent to $34.5 million). Total operating expenses Total operating expenses decreased by $401.0 million, or 17.8%, from $2,251.3 million for the year ended December 31, 2014 to $1,850.3 million for the year ended December 31, This decrease was mainly due to foreign exchange. Excluding the impact of foreign exchange, operating expenses increased by 4.7%. As a percentage of revenue, operating expenses constituted 98.0% and 94.1% for the year ended December 31, 2014 and 2015, respectively. This decrease due to the reduction of exceptional charges related to IPO, restructuring and others, and partially offset by increase in employee benefit expenses. Adjusting exceptional charges booked during the period, operating expenses as a percentage of revenues would have constituted 93.6% and 92.7% of revenue for the year ended December 31, 2014 and 2015, respectively The $401.0 million decreased in operating expenses during the year ended December 31, 2015 resulted from the following components: Supplies : Supplies decreased by $26.4 million, or 25.2%, from $104.8 million for the year ended December 31, 2014 to $78.4 million for the year ended December 31, Excluding the impact of foreign exchange, supplies expense decreased by 2.9%. The decrease was principally caused by the lower activity in the EMEA region and efficiencies generated in Americas. As a percentage of revenue, supplies constituted 4.6% and 4.0% for the year ended December 31, 2014 and 2015, respectively. Employee benefit expenses: Employee benefit expenses decreased by $213.7 million, or 13.1%, from $1,636.4 million for the year ended December 31, 2014 to $1,422.7 million for the year ended December 31, Excluding the impact of foreign exchange, employee benefit expenses increased by 10.2%. This increase was principally due to growth in business activity. As a percentage of our revenue, employee benefits expenses constituted 71.2% and 72.4% for the year ended December 31, 2014 and 2015, respectively. This slight increase in the percentage over revenue is due to ramp up of new client wins, severance and other costs related to the alignment of labor force to current and expected volume declines. Depreciation and amortization: Depreciation and amortization expense decreased by $16.9 million, or 14.1%, from $119.8 million for the year ended December 31, 2014 to $102.9 million for the year ended December 31, Excluding the impact of foreign exchange, depreciation and amortization expense increased by 10.9%, principally due to the growth in capacity mainly in Brazil along 2015 and the previous fiscal years. 33
35 Table of Contents Changes in trade provisions: Changes in trade provisions totaled a positive impact of $1.7 million for the year ended December 31, 2014, to a negative impact of $1.2 for the year ended December 31, This variation was principally due to the collection in 2014 of some receivables that had previously been impaired, and receivables accounted as bad debt in Brazil and EMEA during the year ended December 31, As a percentage of revenue, changes in trade provisions constituted 0.1% for the year ended December 31, 2014 and Other operating expenses: Other operating expenses decreased by $115.1 million, or 32.0%, from $360.2 million for the year ended December 31, 2014 to $245.1 million for the year ended December 31, Excluding the impact of foreign exchange, other operating expenses decreased by 12.2%, mainly with the reduction of exceptional charges like IPO fees and charges, efficiency programs and lower activity in EMEA. As a percentage of revenue, other operating expenses constituted 15.7% and 12.5% for the year ended December 31, 2014 and 2015, respectively. Impairment charges: For the year ended December 31, 2014, mainly relate to the goodwill and other intangible asset impairments relating to our operation in Czech Republic of $3.7 million and Spain of $28.8 million. As of June 30, 2014, we performed an impairment test on the carrying amount of customer-relationship intangible assets, goodwill and property, plant and equipment, as a result of the amendment to the MSA which impacted the amount of expected revenue and also in consideration of the changes in expected revenue in certain countries. The impairment test was performed using assumptions revised in accordance with the amendments to the MSA and with updated management expectations on cash flow generation from the different countries where we operate. The result of the test performed was an impairment charge of $27.7 million of the intangible asset related to the customer relationship with Telefónica in connection with the MSA. Impairment charges of $1.1 million of goodwill in Spain and of $3.7 million of goodwill in the Czech Republic were recognized during the year ended December 31, 2014, as a result of this impairment test. Brazil Total operating expenses in Brazil decreased by $217.7 million, or 20.1%, from $1,081.6 million for the year ended December 31, 2014 to $863.9 million for the year ended December 31, Excluding the impact of foreign exchange, operating expenses in Brazil increased by 11.8%. Excluding the corporate expenses, operating expenses as a percentage of revenue increased from 90.7% to 92.0%. This increase is due to higher than expected inflation impact in the business mainly in energy, leasing and other costs, and the restructuring costs to align labor force and site location to current and expected volume declines which negatively affects 2015 operating expenses. Corporate expenses located in Brazil increased $1.8 million, from $6.7 million for the year ended December 31, 2014 to $8.5 million for the year ended December 31, Americas Total operating expenses in the Americas increased by $7.1 million, or 1.0%, from $718.9 million for the year ended December 31, 2014 to $726.0 million for the year ended December 31, Excluding the impact of foreign exchange, operating expenses in the Americas increased by 16.4% below the increase in revenues. Excluding the corporate expenses, operating expenses as a percentage of revenue decreased from 91.2% to 90.5% for the year ended December 31, 2014 and 2015, mainly explained by efficiency gains in Argentina, Peru and Chile. Corporate expenses located in Americas increase $3.2 million, from $7.8 million for the year ended December 31, 2014 to $11.0 million for the year ended December 31, EMEA Total operating expenses in EMEA decreased by $130.9 million, or 34.3%, from $381.8 million for the year ended December 31, 2014 to $250.9 million for the year ended December 31, Excluding the impact of foreign exchange, operating expenses in EMEA decreased by 21.4%. Excluding the corporate expenses, operating expenses as a percentage of revenue decreased from 114.0% to 101.1%. The decrease in operating expenses in the year ended December 31, 2015 was primarily attributable to impairment charges and restructuring costs booked in Excluding the impact of this effect, operating expenses as a percentage of revenue would have reached 98.7% in the year ended December 31, 2014 compared to 97.9% in the year ended December 31, 2015, this decrease is primarily attributable to the benefits of the restructuring programs implemented in 2014 and 2015, and improvements in operational efficiencies. Corporate expenses located in EMEA increase $0.7 million, due to corporate cost of $0.7 million booked for the year ended December 31, Operating profit Operating profit increased by $32.4 million, or 37.2%, from $87.2 million for the year ended December 31, 2014 to $119.6 million for the year ended December 31, Excluding the impact of foreign exchange, operating profit increased by 80.5%. Operating profit margin increased from 3.8% for the year ended December 31, 2014 to 6.1% for the year ended December 31, This increase was driven by broad based improvement in efficiencies and significant reduction in non-recurring expenses versus 2014, partially offset with the ramp up of new client and higher than expected inflationary costs in some operations. 34
36 Table of Contents Brazil Operating profit in Brazil decreased by $37.0 million, or 35.7%, from $103.5 million for the year ended December 31, 2014 to $66.5 million for the year ended December 31, Excluding the impact of foreign exchange, operating profit decreased by 8.6% in Excluding the corporate expenses, operating profit margin decreased from 9.3% for the year ended December 31, 2014 to 8.2% for the year ended December 31, 2015, excluding the impact of foreign exchange. The decrease in operating profit is due to higher than expected inflation impact in the business mainly in energy, leasing and other costs, and the restructuring costs to align labor force and site location to current and expected volume declines which negatively affects 2015 operating margin. Americas Operating profit in the Americas increased by $1.5 million, or 2.3%, from $64.3 million for the year ended December 31, 2014 to $65.8 million for the year ended December 31, Excluding the impact of foreign exchange, operating profit in Americas increased by 21.0% in Excluding corporate expenses, operating profit margin increased from 9.2% for the year ended December 31, 2014 to 9.7% for the year ended December 31, 2015, excluding the impact of foreign exchange. The increase in operating profit was mainly attributed to the strong performance in Peru, Chile and Argentina. EMEA Operating profit in EMEA increased by $43.1 million, from a loss of $45.6 million for the year ended December 31, 2014 to a loss of $2.5 million for the year ended December 31, Excluding the impact of foreign exchange, operating profit in EMEA increased by 93.0% in Excluding corporate expenses, operating profit margin increase from a loss of 13.6% for the year ended December 31, 2014 to a loss of 0.7% for the year ended December 31, 2015, principally due to the non-recurring expenses booked in the year ended December 31, Excluding non-recurring impacts operating profit margin would have increased from a gain of 1.8% to a gain of 2.5%. This increase is primarily attributable to the benefits of the restructuring programs implemented in 2014 and 2015, and improvements in operational efficiencies. Finance income Finance income decreased by $1.8 million, from $17.3 million for the year ended December 31, 2014 to $15.5 million for the year ended December 31, Excluding the impact of foreign exchange, finance income increased by 24.3% during the year ended December 31, Finance costs Finance costs decreased by $46.4 million, or 38.0%, from $122.1 million for the year ended December 31, 2014 to $75.7 million for the year ended December 31, Excluding the impact of foreign exchange, finance costs decreased by 19.8% during the year ended December 31, This decrease in finance costs is mainly driven by the capitalization of PECs in 2014, in connection with the IPO. Changes in fair value of financial instruments Changes in fair value of financial instruments decreased by $9.8 million, or 35.9%, from $27.3 million for the year ended December 31, 2014 to $17.5 million for the year ended December 31, This decrease is mainly related with the implementation of hedge accounting in April 1, 2015, with the recognition of cumulative fair value gains of financial instruments in first quarter. After first quarter, only the ineffective portion of financial instruments are recognized as fair value. Net foreign exchange gain/(loss) Net foreign exchange gain/(loss) changed by $29.3 million, from a loss of $33.3 million for the year ended December 31, 2014 to a loss of $4.0 million for the year ended December 31, The decrease in net foreign exchange loss is mainly related to the change in functional currency from EUR to USD of Atento Luxco 1 in 2015 that eliminated the foreign exchange exposure of the Senior Secured Notes that are denominated in USD. 35
37 Table of Contents Income tax expense Income tax expense for the year ended December 31, 2014 and December 31, 2015 was of $18.5 million and of $23.8 million, respectively. This variation is due to the higher profit before tax in 2015 and due to the non-deductible costs/expenses recognized mainly in Mexico. The average tax rate for the year ended 2015 is 32.6%. Profit/(loss) for the period Profit/(loss) for the year ended December 31, 2014 and December 31, 2015 was a loss of $42.1 million and a gain of $49.1 million, respectively, as a result of the factors discussed above. EBITDA and Adjusted EBITDA EBITDA increased by $15.5 million, or 7.5%, from $207.0 million for the year ended December 31, 2014 to $222.5 million for the year ended December 31, Adjusted EBITDA decreased by $56.1 million, or 18.3%, from $306.4 million for the year ended December 31, 2014 to $250.3 million for the year ended December 31, The difference between EBITDA and Adjusted EBITDA was due to the exclusion of items that were not related to our core results of operations. Our Adjusted EBITDA is defined as EBITDA adjusted to exclude the acquisition and integration related costs, restructuring costs, sponsor management fees, asset impairments, site relocation costs, financing and IPO fees and other items which are not related to our core results of operations. See Selected Historical Financial Information for a reconciliation of EBITDA and Adjusted EBITDA to profit/(loss). Excluding the impact of foreign exchange, EBITDA increased by 40.2% and Adjusted EBITDA increased by 6.7% mainly due to revenue growth and solid performance in Brazil and Americas, more than offsetting reduced activity in EMEA. Brazil EBITDA in Brazil decreased by $42.3 million, or 26.6%, from $158.8 million for the year ended December 31, 2014 to $116.5 million for the year ended December 31, Adjusted EBITDA in Brazil decreased by $42.7 million, or 24.8%, from $172.1 million for the year ended December 31, 2014 to $129.4 million for the year ended December 31, Excluding the impact of foreign exchange, EBITDA and Adjusted EBITDA increased by 3.8% and 7.2%, respectively. The difference between EBITDA and Adjusted EBITDA relates to the exclusion of non-recurring costs, during the year ended December 31, 2015 non-recurring cost were impacted by labor force optimization to current or expected adjustments in activity levels, and by the anticipation of site closures in connection of the site relocation program to tier 2 and tier 3 cities. Excluding corporate expenses, EBITDA and Adjusted EBITDA increased by 6.8% and 9.8%, respectively. This solid performance at EBITDA and Adjusted EBITDA level during the year ended December 31, 2015, in excluding the impact of foreign exchange, is mainly due to strong growth in revenue with existing clients and new clients, including CBCC acquisition, as well as operating efficiencies achieved from our margin transformational programs. Corporate expenses located in Brazil increase $1.8 million, from $6.7 million for the year ended December 31, 2014 to $8.5 million for the year ended December 31, Americas EBITDA in the Americas decreased by $3.0 million, or 2.8%, from $107.2 million for the year ended December 31, 2014 to $104.2 million for the year ended December 31, Adjusted EBITDA in the Americas decreased by $8.6 million, or 7.3%, from $117.7 million for the year ended December 31, 2014 to $109.1 million for the year ended December 31, Excluding the impact of foreign exchange, EBITDA and Adjusted EBITDA increased during the year ended December 31, 2015 by 14.6% and 9.1%, respectively. Excluding corporate expenses, EBITDA and Adjusted EBITDA increased by 17.5% and 12.1%, respectively, excluding the impact of foreign exchange, due to the strong growth mainly in Chile, Peru and Argentina. Corporate expenses located in Americas increase $3.2 million, from $7.8 million for the year ended December 31, 2014 to $11.0 million for the year ended December 31, EMEA EBITDA in EMEA increased by $36.3 million, from a loss of $25.1 million for year ended December 31, 2014 to a gain of $11.2 million for the year ended December 31, Adjusted EBITDA decreased by $7.3 million, from $26.4 million for the year ended December 31, 2014 to $19.1 million for the year ended December 31, Excluding the impact of foreign exchange, EBITDA increased $38.3 million and Adjusted EBITDA decreased $3.9 million during the year ended December 31, The difference between EBITDA and Adjusted EBITDA relates to the exclusion of non-recurring costs, impacted by a significant reduction due to impairment charges, restructuring and other exceptional costs booked in During the year ended December 31, 2015 non-recurring cost were mainly impacted by labor force optimization to current or expected adjustments in activity levels. Excluding corporate costs the Adjusted EBITDA margin grew 0.1 percentage points. Corporate expenses located in EMEA increase $0.7 million, due to corporate cost of $0.7 million booked for the year ended December 31,
38 Table of Contents Three Months Ended December 31, 2015 Compared to Three Months Ended December 31, 2014 Revenue Revenue decreased by $97.3 million, or 17.5%, from $555.1 million for the three months ended December 31, 2014 to $457.8 million for the three months ended December 31, Excluding the impacts of foreign exchange and the sale of the operations in Czech Republic, revenue increased by 8.4% driven primarily by strong performances in Americas and in Brazil with non-telefónica clients, largely offsetting a decline in EMEA. Revenue in LatAm, increased by 10.2% excluding the impact of foreign exchange. Revenue from Telefónica, excluding the impact of foreign exchange, decreased by 0.6%, principally due to lower volumes in Brazil and EMEA that offset Americas growth of 9.6%. Excluding the impact of foreign exchange and the sale of the operations in Czech Republic, revenue from non-telefónica clients increased by 16.3% due to strong double-digit growth in Americas and Brazil. As of the three months ended December 31, 2015, revenue from non-telefónica clients equaled 57.4% of total revenue, compared to 53.6% for the three months ended December 31, 2014, an increase of 3.8 percentage points. Our diversification strategy continue on track, with significant growth due to new client wins in Telecommunication, Financial and other industries like retail and technology, as well as continue share of wallet increase in current clients with new offerings, including higher added value solutions in all geographies. Brazil, Mexico, Colombia, Peru and off shore business from the United States were the main countries driving this significant revenue increase. The following chart sets forth a breakdown of revenue based on geographical region for the three months ended December 31, 2014 and December 31, 2015 and as a percentage of revenue and the percentage change between those periods with and net of foreign exchange effects. For the three months ended December 31, Change ($ in millions, except percentage changes) excluding 2014 (%) 2015 (%) Change (%) FX (%) (unaudited) (unaudited) Brazil (30.9) 4.5 Americas EMEA (16.6) (5.0) Other and eliminations (1) (0.2) - (0.4) (0.1) N.M. Total (17.5) 8.1 (1) Includes holding company level revenues and consolidation adjustments Brazil Revenue in Brazil for the three months ended December 31, 2014 and December 31, 2015 was $278.6 million and $192.6 million, respectively. Revenue decreased in Brazil by $86.0 million, or 30.9%. Excluding the impact of foreign exchange, revenue increased by 4.5%. Excluding the impact of foreign exchange, revenue from Telefónica decreased by 8.5%, principally due to lower volumes. Revenue from non-telefónica clients, excluding the impact of foreign exchange, increased by 13.4%, mainly due to new clients including the CBCC business acquisition (see Note 1d in the Interim Consolidated Financial Statements ), and the introduction of new services with existing clients in the financial services sector. 37
39 Table of Contents Americas Revenue in Americas for the three months ended December 31, 2014 and December 31, 2015 was $202.7 million and $203.9 million, respectively, increased of $1.2 million, or 0.6%. Excluding the impact of foreign exchange, revenue increased by 18.2%. Excluding the impact of foreign exchange, revenue from Telefónica increased by 9.6%. Excluding the impact of foreign exchange, revenue from non-telefónica clients increased by 26.2% due to strong growth in most markets supported by new and existing clients, particularly in Mexico, Colombia, Peru and nearshore business volume increase in United States and new client wins. EMEA Revenue in EMEA for the three months ended December 31, 2014 and December 31, 2015 was $74.0 million and $61.7 million, respectively, decreased of $12.3 million, or 16.6%. Excluding the foreign exchange impact and sale of operations in Czech Republic, revenue decreased by 2.9%. Excluding the impacts of foreign exchange and the sale of operations in Czech Republic, revenue from Telefónica decreased by 2.8% primarily due volume declines. Excluding the impact of foreign exchange and the sale of operations in Czech Republic, revenue from non-telefónica clients decreased by 3.2%. The growth with private sector new clients is accelerating comparing with last year, still not enough to offset the decline driven by the volume reduction of some contracts with Public Administration and other multisector costumers. Other operating income Other operating income decreased from $2.8 million for the three months ended December 31, 2014 to $2.3 million, for the three months ended December 31, 2015, or by $0.5 million. Other Gains Other gains decreased from $0.6 million for the three months ended December 31, 2014 to zero for the three months ended December 31, Total operating expenses Total operating expenses decreased by $116.5 million, or 21.1%, from $551.2 million for the three months ended December 31, 2014 to $434.7 million for the three months ended December 31, This decrease was mainly due to foreign exchange. Excluding the impact of foreign exchange, operating expenses increased by 3.2%. As a percentage of revenue, operating expenses represented 99.3% and 95.0% for the three months ended December 31, 2014 and 2015, respectively. This decrease was mainly due to the reduction of exceptional charges related to IPO, restructuring and others, and partially offset by increase in employee benefit expenses. The $116.5 million decrease in operating expenses resulted from the following items: Supplies : Supplies decreased by $7.0 million, or 27.3%, from $25.6 million for the three months ended December 31, 2014 to $18.6 million for the three months ended December 31, Excluding the impact of foreign exchange, supplies expense decreased by 2.0%. The decrease was mainly due to lower activity in the EMEA. As a percentage of revenue, supplies represent 4.6% and 4.1% for the three months ended December 31, 2014 and 2015, respectively. Employee benefit expenses : Employee benefit expenses decreased by $60.7 million, or 15.6%, from $390.0 million for the three months ended December 31, 2014 to $329.3 million for the three months ended December 31, Excluding the impact of foreign exchange, employee benefit expenses increased by 9.8%. As a percentage of the revenue, employee benefit expenses represented 70.3% and 71.9% for the three months periods ended December 31, 2014 and 2015, respectively. This increase in the percentage over revenue is due to the volume decrease in Brazil and Spain, generating restructuring costs to adapt the labor force to the new volumes. Depreciation and amortization : Depreciation and amortization expense decreased by $4.2 million, or 14.9%, from $28.2 million for the three months ended December 31, 2014 to $24.0 million for the three months ended December 31, Excluding the impact of foreign exchange, depreciation and amortization expense increased by 14.2%, mainly due to the growth in capacity mainly in Brazil along 2015 and the previous fiscal years. Changes in trade provisions : Changes in trade provisions changed by $2.2 million, from positive figure of $1.9 million for the three months ended December 31, 2014 to negative figure of $0.3 million for the three months ended December 31, This variation was principally due to, the collection during the three month ended December 31, 2014 of some receivables that had previously been impaired, and receivables accounted as bad debt mainly in Brazil during the three months ended December 31, As a percentage of revenue, changes in trade provisions constituted 0.3% for the three months ended December 31, 2014 and 0.1% for the three months ended December 31,
40 Table of Contents Other operating expenses : Other operating expenses decreased by $47.5 million, or 43.2%, from $110.0 million for the three months ended December 31, 2014 to $62.5 million for the three months ended December 31, Excluding the impact of foreign exchange, other operating expenses decreased by 24.5%, principally due to the reduction in non-recurring expenses and lower activity in EMEA. As a percentage of revenue, other operating expenses were 19.8% and 13.7% for the three months ended December 31, 2014 and 2015, respectively. Impairment charges: Impairment charges decreased from a positive impact of $0.7 million for the three months ended December 31, 2014 to zero during the three months ended December 31, Brazil Total operating expenses in Brazil decreased by $66.2 million, or 26.7%, from $248.0 million for the three months ended December 31, 2014 to $181.8 million for the three months ended December 31, Excluding the impact of foreign exchange, operating expenses in Brazil increased by 10.8%. Excluding the corporate expenses, operating expenses as a percentage of revenue increased from 89.1% to 93.2%, for the three months ended December 31, 2014 and 2015, respectively, excluding the impact of foreign exchange. This increase is due to higher than expected inflation impact in the business mainly in energy, leasing and other costs, and the restructuring costs to align labor force and site location to current and expected volume declines which negatively affects 2015 operating expenses. Corporate expenses located in Brazil increase $2.4 million, from a positive impact of $0.1 million for the three months ended December 31, 2014 to $2.3 million for the three months ended December 31, Americas Total operating expenses in the Americas decreased by $1.4 million, or 0.7%, from $188.8 million for the three months ended December 31, 2014 to $187.4 million for the three months ended December 31, Excluding the impact of foreign exchange, operating expenses in the Americas increased by 16.4%. Excluding the corporate expenses, operating expenses as a percentage of revenue decreased from 90.9% to 90.6%, for the three months ended December 31, 2014 and the three months ended December 31, 2015, respectively, excluding the impact of foreign exchange. Corporate expenses located in Americas decrease $1.8 million, from $4.5 million for the three months ended December 31, 2014 to $2.7 million during the three months ended December 31, EMEA Total operating expenses in EMEA decreased by $8.8 million, or 12.5%, from $70.6 million for the three months ended December 31, 2014 to $61.8 million for the three months ended December 31, Excluding the impact of foreign exchange, operating expenses in EMEA decreased by 0.4%. Excluding the corporate expenses, operating expenses as a percentage of revenue increased from 95.4% to 99.7%, mainly driven by restructuring costs booked during this period. Excluding the impact of this effect, operating expenses as a percentage of revenue would have decreased from 97.2% to 95.1%. This decrease is primarily attributable to the benefits of the restructuring programs implemented in 2014 and 2015, and improvements in operational efficiencies. Corporate expenses located in EMEA increase $0.3 million, due to corporate cost of $0.3 million booked during the three months ended December 31, Operating profit Operating profit increased by $18.0 million, from $7.4 million for the three months ended December 31, 2014 to $25.4 million for the three months ended December 31, Excluding the impact of foreign exchange, operating profit increased $26.7 million. Operating profit margin increased from 1.3% for the three months ended December 31, 2014 to 5.5% for the three months ended on December 31, The increase is mainly due to the IPO cost booked during the three months ended December 31, Brazil Operating profit in Brazil decreased by $19.7 million, or 64.4%, from $30.6 million for the three months ended December 31, 2014 to $10.9 million for the three months ended December 31, Excluding the impact of foreign exchange, operating profit decreased by 46.7%. Excluding the corporate expenses, operating profit margin in Brazil decreased from 11.0% for the three months ended on December 31, 2014 to 6.8% for the three months ended December 31, 2015, excluding the impact of foreign exchange. The decrease in operating profit is due to higher than expected inflation impact in the business mainly in energy, leasing and other costs, and the restructuring costs to align labor force and site location to current and expected volume declines which negatively affects 2015 operating margin. 39
41 Table of Contents Americas Operating profit in the Americas increased by $0.8 million, or 4.8%, from $16.5 million for the three months ended December 31, 2014 to $17.3 million for the three months ended December 31, Excluding the impact of foreign exchange, operating profit increased by 26.1%. Excluding corporate expenses and impact of foreign exchange, operating profit increased by 13.2% during the three months ended December 31, EMEA Operating profit in EMEA decreased by $3.3 million, from $3.7 million for the three months ended December 31, 2014 to $0.4 million for the three months ended December 31, Excluding the impact of foreign exchange operating profit margin decreased from a margin of 5.0% to a margin of 0.7%. The decrease in operating profit is mainly driven by restructuring and other non-recurring costs booked during the period, excluding the impact of this effect and the corporate costs, operating profit margin would have increased from 6.5% to 6.8%. This increase is primarily attributable to the benefits of the restructuring programs implemented in 2014 and 2015, and improvements in operational efficiencies. Finance income Finance income decreased by $1.2 million, from $4.0 million for the three months ended December 31, 2014 to $2.8 million for the three months ended December 31, Excluding the impact of foreign exchange, finance income increased by 2.5% during the three months ended December 31, Finance costs Finance costs decreased by $4.0 million, or 18.4%, from $21.7 million for the three months ended December 31, 2014 to $17.7 million for the three months ended December 31, Excluding the impact of foreign exchange, finance costs increased by 9.2% during the three months ended December 31, The decrease in finance costs was mainly related to the increase in BNDES outstanding amount. Changes in fair value of financial instruments Changes in fair value of financial instruments changed by $16.5 million, from a gain of $20.0 million for the three months ended December 31, 2014 to a gain of $3.5 million for the three months ended December 31, This decrease is mainly related with the implementation of hedge accounting in April 1, 2015, as after that, only the ineffective portion of financial instruments are recognized as fair value. Net foreign exchange gain/(loss) Net foreign exchange gain/(loss) changed by $10.4 million, from a loss of $14.9 million for the three months ended December 31, 2014 to a loss of $4.5 million for the three months ended December 31, The decrease in net foreign exchange loss is mainly related to the change in functional currency from EUR to USD of Atento Luxco 1 in 2015, that eliminated the foreign exchange exposure of the Senior Secured Notes, denominated in USD. Income tax expense Income tax expense for the three months ended December 31, 2014 and December 31, 2015 was $20.7 million and $4.1 million, respectively. This decrease is due to lower nondeductible costs for income tax in 2015 as well due to the tax benefit of the goodwill from CBCC that starts on the year of Profit/(loss) for the period Profit/(loss) for the three months ended December 31, 2014 and December 31, 2015 was a loss of $25.9 million and a gain of $5.4 million, respectively, as a result of the items disclosed above. EBITDA and Adjusted EBITDA EBITDA increased by $13.8 million, or 38.8%, from $35.6 million for the three months ended December 31, 2014 to $49.4 million for the three months ended December 31, Adjusted EBITDA decreased by $22.5 million, or 26.0% from $86.5 million for the same period ended on December 31, 2014 to $64.0 million for the three months ended December 31, The difference between EBITDA and Adjusted EBITDA is due to the exclusion of items that were not related to our core results of operations. Our Adjusted EBITDA is defined as EBITDA adjusted to exclude the acquisition and integration related costs, restructuring costs, sponsor management fees, asset impairments, site relocation costs, financing and IPO fees and other items which are not related to our core results of operations. See Selected Historical Financial Information for a reconciliation of EBITDA and Adjusted EBITDA to profit/(loss). 40
42 Table of Contents Excluding the impact of foreign exchange, EBITDA increased by 86.2% and Adjusted EBITDA decreased by 1.6% mainly due to the impact at EBITDA level of IPO cost booked during the three months ended December 31, 2014, and the impact at Adjusted EBITDA of lower Telefónica volumes in EMEA and Brazil, the ramp up of new clients and higher than expected inflationary costs in some operations. Brazil EBITDA in Brazil decreased by $21.4 million, or 48.9%, from $43.8 million for the three months ended December 31, 2014 to $22.4 million for the three months ended December 31, Adjusted EBITDA decreased by $19.0 million, or 39.3%, from $48.4 million for the three months ended December 31, 2014 to $29.4 million for the three months ended December 31, Excluding the impact of foreign exchange, EBITDA and Adjusted EBITDA decreased by 23.1% and 8.9%, respectively. The difference between EBITDA and Adjusted EBITDA relates to the exclusion of non-recurring costs, during the three months ended December 31, 2015 non-recurring cost were impacted by labor force optimization to current or expected adjustments in activity levels, and by the anticipation of site closures in connection of the site relocation program to tier 2 and tier 3 cities. Excluding corporate expenses and the impact of foreign exchange, EBITDA decreased by 15.0% and Adjusted EBITDA decreased by 1.6%, during the three months ended December 31, 2014 and 2015, respectively. Corporate expenses located in Brazil increase $1.9 million, from a positive impact of $0.1 million for the three months ended December 31, 2014 to $1.7 million for the three months ended December 31, Americas EBITDA in the Americas decreased by $0.8 million, or 3.0%, from $27.0 million for the three months ended December 31, 2014 to $26.2 million for the three months ended December 31, Adjusted EBITDA decreased by $3.4 million, or 10.5%, from $32.5 million for the three months ended on December 31, 2014 to $29.1 million for the three months ended December 31, Excluding the impact of foreign exchange, EBITDA and Adjusted EBITDA increased during this period by 16.3% and 6.8%, respectively due to the strong growth mainly in Mexico and Chile. Excluding corporate expenses, EBITDA and Adjusted EBITDA increased by 9.1% and 1.8%, respectively due to strong growth in Mexico and Chile. Adjusted EBITDA margin has decreased 2.5 percentage points due to unfavorable service mix, ramp-up of new clients and inflationary pressures. Corporate expenses located in Americas decrease $1.8 million, from $4.5 million for the three months ended December 31, 2014 to $2.7 million during the three months ended December 31, EMEA EBITDA in EMEA decreased by $4.1 million, from $7.9 million for the three months ended December 31, 2014 to $3.8 million for the three months ended December 31, Adjusted EBITDA in EMEA decreased by 18.9%, from $9.0 million for the three months ended December 31, 2014 to $7.3 million for the three months ended December 31, The difference between EBITDA and Adjusted EBITDA relates to the exclusion of non-recurring costs, during the three months ended December 31, 2015 non-recurring cost were impacted by labor force optimization to current or expected adjustments in activity levels. Excluding corporate costs the Adjusted EBITDA margin grew 0.1 percentage points. Corporate expenses located in EMEA increase $0.3 million, due to corporate costs of $0.3 million booked during the three months ended December 31, Year Ended December 31, 2014 Compared to the Year Ended December 31, 2013 Revenue Revenue decreased by $42.8 million, or 1.8%, from $2,341.1 million for the year ended December 31, 2013 to $2,298.3 million for the year ended December 31, Excluding the impact of foreign exchange, revenue increased by 7.7% driven primarily by a strong performance in Brazil and the Americas, largely offsetting the reduction in EMEA. Revenue in LatAm, which includes Brazil and the Americas, increased 10.5% excluding the impact of foreign exchange. 41
43 Table of Contents Revenue from Telefónica, excluding the impact of foreign exchange, increased by 4.4%, driven primarily by a strong performance in the Americas, in particular, in Chile due to the finalization of the implementation of a new business model, in Peru as a result of the increase in offshore business from Argentina, in addition to price adjustments in Argentina. This positive performance in the Americas largely offset the reduction in EMEA caused by the adverse Telefónica situation in the Spanish telecommunication sector. Excluding the impact of foreign exchange, revenue from non-telefónica clients increased by 10.8% due to the strong double digit growth in all regions. As of the end of the year, non-telefónica revenue represented 53% of total revenue, an increase of 2 percentage points over the prior year. We have continued to increase our revenue diversification from Telefónica with significant customer wins in the telecommunication sector in Brazil and multisector segments, and higher volumes with current clients, primarily in the finance sector. Strong growth in the Americas was driven by Peru, Colombia, Mexico and Argentina. In EMEA lower revenues with Telefónica were partially offset by a healthy performance in the non-telefónica sector driven by higher activity with existing clients, in addition to new clients wins. The following chart sets forth a breakdown of revenue based on geographical region for the year ended December 31, 2013 and December 31, 2014 and as a percentage of revenue and the percentage change between those periods with and net of foreign exchange effects. For the year ended December 31, ($ in millions, except percentage changes) 2013 (%) 2014 (%) Change (%) Change excluding FX (%) (audited) (audited) Brazil 1, , (1.8) 7.5 Americas EMEA (7.8) (7.7) Other and eliminations (1) (0.8) - (0.7) (0.1) (12.5) (50.0) Total 2, , (1.8) 7.7 (1) Includes holding company level revenues and consolidation adjustments. Brazil Revenue in Brazil for the year ended December 31, 2013 and December 31, 2014 was $1,206.1 million and $1,184.8 million, respectively. Revenue decreased in Brazil by $21.3 million, or 1.8%. Excluding the foreign-exchange impact, revenue increased by 7.5% over this period. Excluding the impact of foreign exchange, revenue from Telefónica increased by 2.8%, principally due to the introduction of new services in Brazil. Revenue from non-telefónica clients, excluding the impact of foreign exchange, increased by 11.0% over this period, mainly due to volume growth and the introduction of new services with existing clients, driven by the financial sector, in addition to significant customer wins in the telecommunication sector where we now provide services to all major operators. Americas Revenue in the Americas for the year ended December 31, 2013 and December 31, 2014 was $772.7 million and $779.4 million, respectively. Revenue increased in the Americas by $6.7 million, or 0.9%. Excluding the impact of foreign exchange, revenue increased by 15.3%. Excluding the impact of foreign exchange, revenue from Telefónica increased by 19.2% over this period, with strong performance across the region and in particular in Chile due to the positive impact of the implementation of the new business model with Telefónica and in Peru due to the increase in offshore business from Argentina. Excluding the impact of foreign exchange, revenue from non-telefónica clients increased by 11.7%, with strong growth in most markets supported by new and existing clients, particularly in Peru, Colombia, Mexico and Argentina, driven by increased pricing. EMEA Revenue in EMEA for the year ended December 31, 2013 and December 31, 2014 was $363.1 million and $334.8 million, respectively. Revenue decreased in EMEA by $28.3 million, or 7.8%. Excluding the foreign exchange impact, revenue decreased by 7.7%. Excluding the foreign exchange impact, revenue from Telefónica decreased by 14.8% principally due to a decrease in the volume of customer sales in Spain, driven by the adverse Telefónica situation in the Spanish telecommunications market. Revenue from non-telefónica clients increased by 6.8%, excluding the impact of foreign exchange, principally due to higher activity with existing clients, in addition to new client wins. 42
44 Table of Contents Other operating income Other operating income increased by $0.2 million, from $4.4 million for the year ended December 31, 2013 to $4.6 million for the year ended December 31, Excluding the impact of foreign exchange, other operating income increased by 8.7% principally due to subsidies received in Spain for hiring disabled employees. Other gains In May 2014, the Master Service Agreement ( MSA ) with Telefónica, which required the Telefónica Group to meet pre-agreed minimum annual revenue commitments to us through 2021, was amended to adjust minimum revenue commitments in relation to Spain and Morocco, to reflect the expected lower level of activities in these countries. The provisions of the MSA required Telefónica to compensate us in case of shortfalls in these revenue commitments. Based on the above, Telefónica agreed to compensate us with a penalty fee amounting to 25.4 million (equivalent to $34.5 million). Total operating expenses Total operating expenses increased by $9.9 million, or 0.4%, from $2,241.4 million for the year ended December 31, 2013 to $2,251.3 million for the year ended December 31, Excluding the impact of foreign exchange, operating expenses increased by 9.7%. As a percentage of revenue, operating expenses constituted 95.7% and 98.0% for the year ended December 31, 2013 and 2014, respectively. This increase was principally due to the impairment charges recognized, an increase in employee benefit expenses due to restructuring costs and other operating expenses incurred as a result of the IPO process. Adjusting for these items, operating expenses as a percentage of revenues would have constituted 93.1% of revenue. The $9.9 million increase in operating expenses during the year ended December 31, 2014 resulted from the following components: Supplies : Supplies decreased by $10.5 million, or 9.1%, from $115.3 million for the year ended December 31, 2013 to $104.8 million for the year ended December 31, Excluding the impact of foreign exchange, supplies expense increased by 0.2%. The increase was principally caused by growth in Brazil and Mexico as well as a reclassification of costs previously booked as Other operating expenses and now booked as Supplies; these costs were partially offset by a decrease in the EMEA region as a result of lower activity. As a percentage of revenue, supplies constituted 4.9% and 4.6% for the year ended December 31, 2013 and 2014, respectively. Employee benefits expenses: Employee benefits expenses decreased by $7.1 million, or 0.4%, from $1,643.5 million for the year ended December 31, 2013 to $1,636.4 million for the year ended December 31, Excluding the impact of foreign exchange, employee benefits expenses increased by 9.3%. This increase in employee benefits expenses was principally due to restructuring expenses incurred in Spain, Argentina and Chile. This increase was partially offset by operational efficiencies generated. Adjusting for restructuring expenses of $26.7 million and excluding the impact of foreign exchange, employee benefits expenses would have increased by 7.7%. As a percentage of our revenue, employee benefits expenses constituted 70.2% and 71.2% for the year ended December 31, 2013 and 2014, respectively. Adjusting for restructuring expenses, employee benefits expenses as a percentage of revenue would have constituted 69.7% and 70.0% for the year ended December 31, 2013 and 2014, respectively. Depreciation and amortization: Depreciation and amortization expense decreased by $9.2 million, or 7.1%, from $129.0 million for the year ended December 31, 2013 to $119.8 million for the year ended December 31, Excluding the impact of foreign exchange, depreciation and amortization expense decreased by 0.3%, principally due to the lower carrying amount of customer relationship intangible assets, as a result of the impairment test performed in June 30, Changes in trade provisions: Changes in trade provisions totaled a positive figure of $1.7 million for the year ended December 31, 2014, a decrease of $0.3 million over the year ended December 31, This decrease was principally due to the collection, in 2013, of some receivables that had previously been impaired. As a percentage of revenue, changes in trade provisions constituted 0.1% and 0.1% for the year ended December 31, 2013 and Other operating expenses: Other operating expenses increased by $4.6 million, or 1.3%, from $355.6 million for the year ended December 31, 2013 to $360.2 million for the year ended December 31, Excluding the impact of foreign exchange, other operating expenses increased by 9.2%, principally due to financing and IPO fees incurred during the IPO process and a reclassification from suppliers to other operating expenses. As a percentage of revenue, other operating expenses constituted 15.2% and 15.7% for the year ended December 31, 2013 and 2014, respectively. 43
45 Table of Contents Impairment charges: Asset impairment for the year ended December 31, 2013 relates to charges associated to projects for inventory control in Brazil which are not related to our core results of operations. For the year ended December 31, 2014, mainly relate to the goodwill and other intangible asset impairments relating to our operation in Czech Republic of $3.7 million and Spain of $28.8 million. As of June 30, 2014, we performed an impairment test on the carrying amount of customer-relationship intangible assets, goodwill and property, plant and equipment, as a result of the amendment to the MSA which impacted the amount of expected revenue and also in consideration of the changes in expected revenue in certain countries. The impairment test was performed using assumptions revised in accordance with the amendments to the MSA and with updated management expectations on cash flow generation from the different countries where we operate. The result of the test performed was an impairment charge of $27.7 million of the intangible asset related to the customer relationship with Telefónica in connection with the MSA. Impairment charges of $1.1 million of goodwill in Spain and of $3.7 million of goodwill in the Czech Republic were recognized during the year ended December 31, 2014, as a result of this impairment test. Brazil Total operating expenses in Brazil decreased by $32.0 million, or 2.9%, from $1,113.6 million for the year ended December 31, 2013 to $1,081.6 million for the year ended December 31, Excluding the impact of foreign exchange, operating expenses in Brazil increased by 6.3%, which was slightly below revenue growth. Operating expenses as a percentage of revenue decreased from 92.3% to 91.3%. The decrease in operating expenses in Brazil as a percentage of sales was principally due to cost efficiencies achieved from our margin transformation programs in addition to higher costs incurred in 2013 as a result of the ramp-up of new Telefónica services. Americas Total operating expenses in the Americas increased by $13.0 million, or 1.8%, from $705.9 million for the year ended December 31, 2013 to $718.9 million for the year ended December 31, Excluding the impact of foreign exchange, operating expenses in the Americas increased by 16.7%, in line with the increase in revenues. Operating expenses as a percentage of revenue increased from 91.4% to 92.2% in the year ended December 31, 2014, mainly explained by the restructuring costs incurred in Excluding this impact, operating expenses as a percentage of revenue would have been 91.2%. EMEA Total operating expenses in EMEA increased by $16.6 million, or 4.5%, from $365.2 million for the year ended December 31, 2013 to $381.8 million for the year ended December 31, Operating expenses as a percentage of revenue increased from 100.6% to 114.0%. Excluding the impact of foreign exchange, operating expenses in EMEA increased by 4.7%. The increase in operating expenses in EMEA in the year ended December 31, 2014 was primarily attributable to impairment charges and restructuring costs. Excluding the impact of these two effects amounting to $49.1 million, operating expenses as a percentage of revenue would have reached 99.4%. Operating profit Operating profit decreased by $17.8 million, or 17.0%, from $105.0 million for the year ended December 31, 2013 to $87.2 million for the year ended December 31, Excluding the impact of foreign exchange, operating profit decreased by 1.3%. Operating profit margin decreased from 4.5% for the year ended December 31, 2013 to 3.8% for the year ended December 31, 2014, due to the negative impact of costs incurred in connection with the IPO ($51.9 million), recognized impairments in EMEA ($32.5 million) and restructuring costs ($26.7 million), partially offset by the positive impact of the MSA penalty fee (equivalent to $34.5 million). Excluding these impacts, operating profit margin for the year ended December 31, 2014, would have amounted to 7.1%, driven mainly by the operational improvements in most of the markets as a result of the implementation of our strategic initiatives, growth in Chile after the implementation of the new business model with Telefónica during 2013 and costs related to the introduction of new services with Telefónica in Brazil incurred during the first half of Brazil Operating profit in Brazil increased by $8.7 million, or 9.2%, from $94.8 million for the year ended December 31, 2013 to $103.5 million for the year ended December 31, Excluding the impact of foreign exchange, operating profit increased by 19.3% in Operating profit margin in Brazil increased from 7.9% for the year ended December 31, 2013 to 8.7% for the year ended December 31, The increase in operating profit in Brazil for the period was principally due to cost efficiencies achieved, partially offset by the ramp-up of services with new clients. 44
46 Table of Contents Americas Operating profit in the Americas decreased by $3.3 million, or 4.9%, from $67.6 million for the year ended December 31, 2013 to $64.3 million for the year ended December 31, Excluding the impact of foreign exchange, operating profit in Americas increased by 5.5% in Operating profit margin in the Americas decreased from 8.7% for the year ended December 31, 2013 to 8.2% for the year ended December 31, The decrease in operating profit in the Americas was principally attributed to restructuring costs incurred in Argentina, Chile and Peru. Excluding this impact, operating profit margin would have reached 9.3%. EMEA Operating profit in EMEA decreased by $45.5 million, from a loss of $0.1 million for the year ended December 31, 2013 to a loss of $45.6 million for the year ended December 31, Excluding the impact of foreign exchange, operating profit in EMEA decreased by $45.7 million in The operating profit margin in EMEA decreased from a loss of 0.0% for the year ended December 31, 2013 to a loss of 13.6% for the year ended December 31, 2014, principally as a result of the recognized impairment charge ($32.5 million) discussed above and the restructuring costs incurred ($16.6 million). Excluding these impacts operating profit margin would have increased by 1.0%. Finance income Finance income increased by $40.5 million, from $17.8 million for the year ended December 31, 2013 to $58.3 million for the year ended December 31, Excluding the impact of foreign exchange, finance income increased by $42.9 million during the year ended December 31, This increase was principally due to higher unrealized gains on cross-currency swaps associated with the 7.375% Senior Secured Notes and on interest rate swaps associated with Brazilian Debentures, and higher finance income in Brazil. Finance costs Finance costs increased by $0.6 million, or 0.4%, from $135.1 million for the year ended December 31, 2013 to $135.7 million for the year ended December 31, Excluding the impact of foreign exchange, finance costs increased by 5.8% during the year ended December 31, This increase was principally due to a full period of finance costs incurred on the 7.375% Senior Secured Notes. These impacts were partially offset by lower unrealized losses mainly related to cross-currency swaps associated with the 7.375% Senior Secured Notes. Changes in fair value of financial instruments Changes in fair value of financial instruments increased by $38.9 million, from a loss of $11.6 million for the year ended December 31, 2013 to a gain of $27.3 million for the year ended December 31, This increase was principally due to the gains in fair value of Atento Luxco 1 derivative financial instruments during 2014, as a consequence of the depreciation of foreign currencies against U.S. dollar. Net foreign exchange gain/(loss) Net foreign exchange gain/(loss) changed by $51.1 million, from a gain of $17.8 million for the year ended December 31, 2013 to a loss of $33.3 million for the year ended December 31, This decrease was principally due to net foreign exchange loss resulting from liabilities denominated in foreign currencies which depreciated against the U.S. dollar during the 2014 period. Income tax expense Income tax benefit/(expense) for the year ended December 31, 2013 and December 31, 2014 was an expense of $8.3 million and $18.5 million, respectively, increasing by $10.2 million during the year ended December 31, Excluding the impact of foreign exchange, income tax expense increased by $14.2 million. Higher tax expenses are primarily attributed to non-deductible expenses incurred in connection with the IPO and write-off of existing tax credits mainly as a result of corporate tax rate changes in Spain. The aggregated effective tax rate for the year ended December 31, 2014 is distorted because of the contribution of losses in the holding companies to our profit before tax and the tax effect of the impairment charges. Adjusting for this effect, the average effective tax rate for the year ended December 31, 2014 would have been 39.5%, while the average effective tax rate of the year ended December 31, 2013 would have been 30.0%. Profit/(loss) for the period Profit/(loss) for the year ended December 31, 2013 and December 31, 2014 was a loss of $4.0 million and $42.1 million, respectively, as a result of the factors discussed above. 45
47 Table of Contents EBITDA and Adjusted EBITDA EBITDA decreased by $27.0 million, or 11.5%, from $234.0 million for the year ended December 31, 2013 to $207.0 million for the year ended December 31, Adjusted EBITDA increased by $11.3 million, or 3.8%, from $295.1 million for the year ended December 31, 2013 to $306.4 million for the year ended December 31, The difference between EBITDA and Adjusted EBITDA was due to the exclusion of items that were not related to our core results of operations. Our Adjusted EBITDA is defined as EBITDA adjusted to exclude the acquisition and integration related costs, restructuring costs, sponsor management fees, asset impairments, site relocation costs, financing and IPO fees and other items which are not related to our core results of operations. See Selected Historical Financial Information for a reconciliation of EBITDA and Adjusted EBITDA to profit/(loss). Excluding the impact of foreign exchange, EBITDA decreased by 0.8% and Adjusted EBITDA increased by 13.7% mainly due to revenue growth and solid performance in Brazil and Americas, more than offsetting reduced activity with Telefónica in EMEA. Brazil EBITDA in Brazil increased by $8.1 million, or 5.4%, from $150.7 million for the year ended December 31, 2013 to $158.8 million for the year ended December 31, Adjusted EBITDA in Brazil increased by $11.0 million, or 6.8%, from $161.1 million for the year ended December 31, 2013 to $172.1 million for the year ended December 31, Excluding the impact of foreign exchange, EBITDA and Adjusted EBITDA increased by 15.3% and 16.9%, respectively. The increase in EBITDA and Adjusted EBITDA was principally due to the strong growth in revenue with existing clients and the capture of new clients, as well as operating efficiencies achieved from our margin transformational programs. Americas EBITDA in the Americas decreased by $8.1 million, or 7.0%, from $115.3 million for the year ended December 31, 2013 to $107.2 million for the year ended December 31, Adjusted EBITDA in the Americas decreased by $0.7 million, or 0.6%, from $118.4 million for the year ended December 31, 2013 to $117.7 million for the year ended December 31, Excluding the impact of foreign exchange, EBITDA and Adjusted EBITDA increased during the year ended December 31, 2014 by 2.2% and 10.7%, respectively. The increase in Adjusted EBITDA was primarily attributed to strong growth achieved in the region, mainly in Argentina, Chile and Peru. Adjusted EBITDA margin grew at a slower pace than revenue, as a result of higher recruiting and training costs to ramp-up the offshore business from Telefónica Argentina to Peru, and increased allocation of corporate costs as a result of the corporate headquarter relocation completed in the three months ended December 31, On the other side, Chile was positively impacted by the finalization of the implementation of the new business model with Telefónica. EMEA EBITDA in EMEA decreased by $49.4 million, from a gain of $24.3 million for the year ended December 31, 2013 to a loss of $25.1 million for the year ended December 31, Adjusted EBITDA in EMEA decreased by $0.3 million, from $26.7 million for the year ended December 31, 2013 to $26.4 million for the year ended December 31, The decrease in Adjusted EBITDA, during the year ended December 31, 2014 was principally due to a reduction in Telefónica volumes in Spain which implied an oversized structure before the execution of the restructuring process in the three months ended December 31, Liquidity and Capital Resources As of December 31, 2015, our outstanding debt amounted to $575.6 million, which includes $301.7 million of our 7.375% Senior Secured Notes due 2020, $168.1 million equivalent amount of Brazilian Debentures, $26.3 million of CVIs (Contingent Value Instrument), $4.7 million of finance lease payables, $74.7 million of financing provided by BNDES and $0.1 million of other bank borrowings. During the year ended December 31, 2015 we drew down BRL126.7 million (equivalent to $32.5 million of U.S. dollars) under our credit agreement with BNDES. For the year ended December 31, 2015, our net cash flow from operating activities totaled $37.0 million, which includes interest paid of $66.2 million. As such, our net cash flow from operating activities (before giving effect to the payment of interest) amounted to $ million. 46
48 Table of Contents Cash Flow As of December 31, 2015, we had cash and cash equivalents (net of any outstanding bank overdrafts) of approximately $184.0 million. We believe that our current cash flow used in operating activities and financing arrangements will provide us with sufficient liquidity to meet our working capital needs. For the three months ended For the year ended December 31, December 31, ($ in millions) (audited) (unaudited) (unaudited) Cash from/(used in) operating activities Cash provided by/(used in) investment activities (123.4) (149.8) (67.2) (17.1) (35.7) Cash provided by/(used in) financing activities Effect of changes in exchanges rates 5.8 (26.4) (33.8) (26.7) (4.3) Net increase/(decrease) in cash and cash equivalents 13.2 (2.1) (27.4) Cash From/(used in) Operating Activities Year Ended December 31, 2015 Compared to Year Ended December 31, 2014 Cash from operating activities was $ million for the year ended December 31, 2015 compared to $135.3 million for the year ended December 31, The decrease in cash from operating activities resulted from unfavorable changes in working capital as a result of higher DSO (Day Sales Outstanding). Three Months Ended December 31, 2015 Compared to Three Months Ended December 31, 2014 Cash from operating activities was $ million for the three months ended December 31, 2015 compared to $25.9 million for the three months ended December 31, The increase in cash from operating activities was mainly related to interest payments decrease partially offset by a decrease interest received and unfavorable changes in working capital. Year Ended December 31, 2014 Compared to Year Ended December 31, 2013 Cash from operating activities was $135.3 million for the year ended December 31, 2014 compared to $99.6 million for the year ended December 31, The increase in cash from operating activities resulted from an overall improvement in working capital performance and also due to lower taxes paid. Cash Provided by/(used in) Investment Activities Year Ended December 31, 2015 Compared to Year Ended December 31, 2014 C ash used in investment activities was $67.2 million for the year ended December 31, 2015 compared to $149.8 million for the year ended December 31, Cash used in investment activities for the year ended December 31, 2015 mainly include payments for capital expenditure of $96.4 million, and disposal from sale of financial instruments of $26.9 million. 47
49 Table of Contents Three Months Ended December 31, 2015 Compared to Three Months Ended December 31, 2014 Cash used in investment activities was $35.7 million for the three months ended December 31, 2015 compared to $17.1 million for the three months ended December 31, Cash used in investment activities for the three months ended December 31, 2015 was mainly related to capital expenditure. Year Ended December 31, 2014 Compared to Year Ended December 31, 2013 Cash used in investment activities was $149.8 million for the year ended December 31, 2014 compared to $123.4 million for the year ended December 31, Cash used in investment activities for the year ended December 31, 2014 mainly include payments for capital expenditure of $117.9 million, acquisition of subsidiaries of $7.5 million, net payments for financial instruments of $26.6 million, which include $26.6 million of net short-term financial investments in Brazil. Cash Provided by/(used in) Financing Activities Year Ended December 31, 2015 Compared to Year Ended December 31, 2014 Cash provided by financing activities was $ million for the year ended December 31, 2015 compared to $38.8 million for the year ended December 31, Cash provided by financing activities during 2015 was mainly attributable to the amounts drawdown under the BNDES facility during 2015, whereas during 2014 was principally due to IPO proceeds received by Atento S.A., partially offset by prepayment to Telefónica of the entire amount outstanding under the Vendor Loan Note, and the net Debentures amortization and amounts drawdown under the BNDES facility. Three Months Ended December 31, 2015 Compared to Three Months Ended December 31, 2014 Cash provided by financing activities was $ 9. 1 million for the three months ended December 31, 2015 compared to $38.6 million for the three months ended December 31, Cash provided by financing activities for the three months ended December 31, 2015 includes the amount drawdown under the BNDES facility, whereas for 2014 include the positive impact of IPO proceeds received by Atento S.A., partially offset by the prepayment to Telefónica of the entire amount outstanding under the Vendor Loan Note. Year Ended December 31, 2014 Compared to Year Ended December 31, 2013 Cash provided by financing activities was $38.8 million for the year ended December 31, 2014 compared to $31.2 million for the year ended December 31, The increase in cash provided by financing activities was primarily attributable to the impact of IPO proceeds received by Atento S.A., partially offset by prepayment to Telefónica of the entire amount outstanding under the Vendor Loan Note, and the net amortization of debentures and amounts drawdown under the BNDES facility. Free Cash Flow Our management uses free cash flow to assess our liquidity and the cash flow generation of our operating subsidiaries. We define free cash flow as EBITDA less Working Capital movement, Capital expenditures, Income tax paid and Net interest for the period. We believe that free cash flow is useful to investors because it adjusts our EBITDA by the investments to continue and improve business operations. Until the last quarter, the Company defined this measure as net cash flow from operating activities less cash payments for acquisition of property, plant, equipment and intangible assets for the period. In order to be aligned with financial performance index analyzed by management, the criteria of the calculation was improved this quarter. We present comparative amounts for the year ended December 31, 2013 and 2014 and for the fourth quarter of Free cash flow has limitations as an analytical tool. Free cash flow is not a measure defined by IFRS and should not be considered in isolation from, or as an alternative to, EBITDA or other measures as determined in accordance with IFRS. Additionally, free cash flow does not represent the residual cash flow available for discretionary expenditures as it does not incorporate certain cash payments, including payments made on finance lease obligations or cash payments for business acquisitions. Free cash flow is not necessarily comparable to similarly titled measures used by other companies. 48
50 Table of Contents For the three months ended For the year ended December 31, December 31, ($ in millions) (audited) (unaudited) (unaudited) EBITDA (non-gaap) (unaudited) Changes in working capital (47.1) 23.1 (108.3) Payments for acquisition of property, plant, equipment and intangible assets (128.8) (117.9) (96.4) (36.7) (35.8) Disposals of property plant, equipment, and intangible assets (0.1) - Income tax paid (30.8) (19.0) (16.2) (3.0) (3.2) Free cash flow before interest Net interest (57.8) (72.5) (48.4) (17.5) (15.6) Free cash flow (non-gaap) (unaudited) (29.7) 21.6 (44.4) (8.6) 8.3 Year Ended December 31, 2015 Compared to Year Ended December 31, 2014 Free cash flow decreased by $66.0 million from positive $21.6 million for the year ended December 31, 2014 to negative $44.4 million for the year ended December 31, The decreased in free cash flow for the year ended December 31, 2015 was mainly due to the decrease in net cash flow from operating activities, resulted from unfavorable changes in working capital as a result of higher DSO (Day Sales Outstanding). Free cash flow for the year ended December 31, 2014 was negatively impacted by cash outflows of $39.4 million related to financing fees and IPO costs, $15.7 million related to restructuring costs, which include Spanish headcount reduction plan cash outlay, $7.8 million related to acquisition and integration related costs, $7.0 million related to sponsor management fee, $1.2 million related to site relocation costs, and $1.5 million related to other costs. Three Months Ended December 31, 2015 Compared to Three Months Ended December 31, 2014 Free cash flow improved by $ 16.9 million from negative $8.6 million for the three months ended December 31, 2014 to positive $ 8. 3 million for the three months ended December 31, The increase in free cash flow for the three months ended December 31, 2015 was principally due to the decrease from payments on acquisitions of intangible assets. Free cash flow for the three months ended December 31, 2014 was (i) negatively impacted mainly by cash outflows of $34.6 million related to financing and IPO cost, $7.0 million related sponsor management fees, $1.2 million related to acquisition and integration related costs, $1.4 million related to other costs, $0.2 million related to restructuring costs, $0.1 million related to site relocation costs, and (ii) positively impacted by $1.0 million related primarily to the reinstatement of certain employees in connection with the restructuring process in Spain. Year Ended December 31, 2014 Compared to Year Ended December 31, 2013 Free cash flow improved by $51.3 million from negative $29.7 million for the year ended December 31, 2013 to positive $21.6 million for the year ended December 31, The improvement in free cash flow for the year ended December 31, 2014 was principally due to the increase in net cash flow from operating activities. Free cash flow for the year ended December 31, 2014 was negatively impacted by cash outflows of $39.4 million related to financing fees and IPO costs, $15.7 million related to restructuring costs, which include Spanish headcount reduction plan cash outlay, $7.8 million related to acquisition and integration related costs, $7.0 million related to sponsor management fee, $1.2 million related to site relocation costs, and $1.5 million related to other costs. Free cash flow for the year ended December 31, 2013 was (i) negatively impacted by cash outflows of $28.2 million related to acquisition and integration related costs, $0.7 million related to restructuring costs, $8.9 million related to sponsor management fee, and $3.9 million related to financing fees, and (ii) positively impacted by $1.1 million related to other costs. 49
51 Table of Contents Finance leases The Company holds the following assets under finance leases: As of December 31, ($ in millions) Net carrying Net carrying Net carrying amount of asset amount of asset amount of asset Finance leases (audited) (unaudited) Plant and machinery Furniture, tools and other tangible assets Total The present value of future finance lease payments is as follow: As of December 31, ($ in millions) Net carrying Net carrying Net carrying amount of asset amount of asset amount of asset (audited) (unaudited) Up to 1 year Between 1 and 5 years Total Capital Expenditures Our business has significant capital expenditure requirements, including for the construction and initial fit-out of our service delivery centers; improvements and refurbishment of leased facilities for our service delivery centers; acquisition of various items of property, plant and equipment, mainly comprised of furniture, computer equipment and technology equipment; and acquisition and upgrades of our software or specific customer s software. The funding of the majority of our capital expenditures is covered by existing cash and EBITDA generation. The table below sets forth our historic capital expenditures by segment for the year ended December 31, 2013, 2014 and 2015 and for the three months ended December 31, 2014 and 2015: For the three months ended For the year ended December 31, December 31, ($ in millions) (audited) (unaudited) (unaudited) Brazil Americas EMEA Other and eliminations Total capital expenditures
52 Table of Contents QUANTITATIVE AND QUALITATIVE DISCLOSURES ABOUT MARKET RISK The Brazilian Congress approved the Bill 4330/04 on April 22, 2015 that intends to regulate outsourcing in Brazil and focuses on the technical specialization of hired companies. The bill provides protection to our business sector overall, but there are clauses that are cause for concern and which we will continue to monitor with respect to how we interact with our unions. In particular, if enacted, the bill could require that we be subject to the same rules and regulations as our unions, including salary and other benefits, which could be costly for us to comply with. The bill is currently in the Senate awaits the voting at the Senate with the number 30/15, for analysis by its committees and approval. Due to the controversial nature of the bill, it is unclear how long it will take for the Senate to complete its analysis and schedule the vote. On September 2015 the Law number /2015 was published and came into force on December 01, 2015, raising the social security tax from 2% to 3% on gross revenue for the call center industry. 51
53 Table of Contents SIGNATURES Pursuant to the requirements of the Securities Exchange Act of 1934, the registrant has duly caused this report to be signed on its behalf by the undersigned, thereunto duly authorized. Date: March 8, 2016 ATENTO S.A. By: /s/ Alejandro Reynal Name: Alejandro Reynal Title: Chief Executive Officer By: /s/ Mauricio Montilha Name: Mauricio Montilha Title: Chief Financial Officer 52
54 Exhibit 99.1 PRESS RELEASE Atento Reports Fiscal 2015 Fourth-Quarter and Full-Year Results, Achieves Full-Year Targets for Strong Revenue Growth, Adjusted EBITDA Margin Extended CRM/BPO leadership position in Latin America Consolidated fiscal-2015 revenue grew 9.6%, adjusted EBITDA margin of 13% on constant-currency basis Revenue from Latin America up 10.2% in the quarter, 12.8% for the full-year Adjusted EPS up 15.2% in the quarter, 15.7% for the full-year on constant-currency basis Generated $23.9 million in free cash flow in the quarter, before net interest Outlined key financial targets for Fiscal 2016 NEW YORK, March 8, 2016 Atento S.A. (NYSE: ATTO), the largest provider of customer-relationship management and business-process outsourcing services in Latin America, and among the top three providers globally, today announced its fourth-quarter and full-year 2015 operating results which include solidly higher revenue and adjusted EBITDA (earnings before interest, taxes, depreciation and amortization) for the year. Those and all comparisons in this announcement are year-over-year, on a constant-currency (CCY) basis unless noted otherwise. Summary ($ in millions) Q Q FY 2015 FY 2014 Revenue , ,298.3 CCY growth (1) 8.4% 9.6% Adjusted EBITDA Margin 14.0% 15.6% 12.7% 13.3% CCY growth -1.6% 6.7% Adjusted EPS (2) CCY growth 15.2% 15.7% Leverage (x) (3) (1) Constant currency revenue growth from continuing operations excludes the Czech Republic, which was divested in December (2) Adjusted earnings per share, for the period ended December 31, 2015, were calculated considering the number of ordinary shares of 73,648,760. For the period ended December 31, 2014 the number of ordinary shares was 73,619,511. (3) Considered the pro-forma Net Debt adjusted to give effect to the Reorganization Transaction, regarding Preferred Equity Certificates. I am extremely pleased with our performance in 2015 where we achieved our top-line and profitability targets, in spite of a very challenging macro-economic environment in Brazil, said Alejandro Reynal, Atento s Chief Executive Officer. We increased our share of wallet with existing clients, won new business, and broadened our geographic and industry reach as we increased the mix of higher-value solutions provided to our clients. We also continued to execute on our revenue diversification strategy. For example in the fourth quarter, we drove a 16.3% increase in revenue from non-telefónica clients and for the year these clients represented more than half of Atento s revenue. Our long term strategy, which encompasses growth, operational efficiencies and the optimization of our capital structure remains on track. At the same time, our company is financially strong and flexible, Mr. Reynal continued. Atento ended fiscal 2015 with $238 million in liquidity and net debt to adjusted EBITDA of just 1.6 times. Mr. Reynal said that Atento s healthy balance sheet is continuing to serve it well, as he expects that macro-economic challenges will persist through 2016, particularly in Brazil. While 2016 will be a challenging growth environment, we believe we can once again outperform the market, increase our leadership position in Latin America, and remain the reference partner for the CRM/BPO needs of our clients. Our priorities remain to drive an optimal balance of growth, profitability and liquidity; make targeted investments to deliver even higher value to our clients through the best and most efficient customer-experience solutions; and further strengthen our balance sheet by reducing our level of debt, he said. For fiscal 2016, Atento is targeting year-over-year revenue of up 1% to 5%, and an adjusted EBITDA margin in the 11% to 12% range both on a constantcurrency basis. All growth rates are in constant currency and year-over-year unless noted otherwise 1
55 PRESS RELEASE Fourth Quarter Consolidated Operating Results Revenue for the quarter, excluding the Czech Republic which was divested in December 2014, increased 8.4%. This growth, which was driven by a 4.5% increase in Brazil, and an 18.2% increase in the Americas, was modestly offset by a 2.9% decline in EMEA. Growth in Latin America was up 10.2%. On a reported basis, revenue declined 17.3%. Adjusted EBITDA declined 1.6% while adjusted EBITDA margin declined 160 basis points to 14.0%. This decline was largely driven by a shift in the mix of countries, particularly Brazil, due to material devaluation of currencies as well as the impacts of inflation. On a constant currency basis adjusted EBITDA margin was down 140 basis points to 14.2%. Adjusted EPS increased 15.2% to $0.31, driven by a decline in both tax and net interest expense. Fourth-quarter reported financial results included $14.6 million in non-recurring items mostly related to actions taken to proactively align the Company s cost structure with market condition realities including current and expected macro-driven volume declines in Brazil and Spain. In the quarter, the Company generated $23.9 million in free cash flow before net interest. Excluding the impact of non-recurring items, the Company generated $34.2 million in free cash flow before net interest. Adjusted quarterly earnings and EBITDA are non-gaap financial measures and are reconciled to their most directly comparable GAAP measures in the accompanying financial tables. Segment Reporting Brazil Region Q Q FY 2015 FY 2014 Revenue ,184.8 CCY growth 4.5% 10.0% Adjusted EBITDA Margin 15.3% 17.4% 13.9% 14.5% CCY growth -8.9% 7.2% Americas Region Revenue CCY growth 18.2% 17.0% Adjusted EBITDA Margin 14.3% 16.0% 13.8% 15.1% CCY growth 6.8% 9.1% EMEA Region Revenue CCY growth (1) -2.9% -9.0% Adjusted EBITDA Margin 11.8% 12.2% 7.7% 7.9% CCY growth -7.8% -14.8% (1) Constant currency revenue growth from continuing operations excludes the Czech Republic, which was divested in December
56 PRESS RELEASE Brazil Region Revenue for the Brazil region increased 4.5% driven by a 13.4% increase in revenue from non-telefónica clients. This growth was supported by new clients and the introduction of new services with existing clients, particularly in financial services. Revenue from Telefónica declined 8.5% due to macro-driven declines in volume. On a reported basis, revenue declined 30.9%. Adjusted EBITDA decreased 8.9% while margin declined 210 basis points to 15.3%. This decline in profitability was driven by the ramp of new clients and impacts from protracted adverse macro-economic conditions which were partially offset by cost and efficiency initiatives. Excluding the impact of corporate cost allocations, adjusted EBITDA was $31.7 million and margin decreased 90 basis points to 16.4%. Americas Region Revenue for the Americas region increased 18.2% driven by a 26.2% increase in revenue from non-telefónica clients. Growth from new and existing clients was particularly strong in Mexico, Colombia, Peru and U.S. nearshore. A 9.6% increase in revenue from Telefónica was driven by double-digit gains in Mexico, Peru and Argentina. On a reported basis revenue increased 0.6%. Adjusted EBITDA increased 6.8% due to the strong growth in revenue while margin declined 170 basis points to 14.3%. The decline in margin was mostly driven by a shift in mix of services, ramp-up of new clients, and inflationary pressures. Excluding the impact of corporate cost allocations, adjusted EBITDA was $31.8 million and margin decreased 270 basis points to 15.6%. EMEA Region Revenue for the EMEA region declined 2.9%, driven by a 3.2% decline in revenue from non-telefónica clients. As expected, these declines were driven by lower volumes from Public Administration contracts in Spain and the exiting of lower-value contracts, which more than offset strong growth from private sector clients. Revenue from Telefónica declined 2.8% largely driven by Spain. On a reported basis, revenue declined 14.8%. Adjusted EBITDA declined 7.8%, driven by the decline in revenue, while adjusted EBITDA margin declined 40 basis points to 11.8%. The decline in adjusted EBITDA margin was driven by the ramp of new clients and shifts in revenue mix which were partially offset by cost and efficiency initiatives. Excluding the impact of corporate cost allocations, adjusted EBITDA was $7.6 million and margin increased 10 basis points to 12.3%. Strong Balance Sheet and Ample Liquidity Enhance Financial Flexibility At December 31, 2015, the Company had cash, cash equivalents and short-term financial investments totaling $184 million and undrawn revolving credit facilities of 50 million for total liquidity of $238 million. Total net debt with third parties totaled $391.6 million, a decline of $23.4 million. The Company s last twelve month (LTM) adjusted EBITDA to net debt with third parties was 1.6 times. During the fourth quarter of 2015, the Company invested $38.1 million, or 8.3% of revenue, in capital expenditures related to investments in maintenance and growth. For the full year capital expenditures totaled $121.2 million, or 6.2% of revenue. 3
57 PRESS RELEASE Fiscal 2016 Guidance While 2016 will be a challenging growth environment, the Company believes it can outperform the market, increase its leadership position in Latin America, and remain the reference partner for the CRM/BPO needs of its clients. In addition advancing its long term strategy, the Company will focus on the optimal balance of profitable growth and liquidity, strengthening its balance sheet and maintaining financial flexibility. For the full year Fiscal 2016, the Company is targeting revenue growth in the range of 1% to 5%, and adjusted EBITDA margin in the range of 11% to 12%, both on a constant-currency basis. Non-recurring items, which are included as add-backs in adjusted EBITDA, are expected to be approximately $15 million with roughly two-thirds expected in the first-half of the year as the Company continues to align its cost structure with prevailing market conditions. During the year the Company expects to pay down $27 million in debt and expects net interest expense in the range of $60 to $65 million. The Company expects cash capital expenditures of approximately 5% of revenue reflecting investments in both growth and maintenance, an effective tax rate of approximately 32%, and a fully diluted share count of approximately 73.8 million shares. This guidance assumes no acquisitions or changes in the current operating environment, capital structure or exchange rates movements on the translation of our financial statements in USD. Conference Call Atento will host a conference call and webcast for analysts on Tuesday, March 8, 2016 at 5:00 am ET to discuss the financial results. The conference call can be accessed by dialing: +1 (877) toll free domestic, UK: (+44) toll free, Brazil: (+55) toll free, or Spain: (+34) toll free. All other international callers can access the conference call by dialing: +1 (201) toll free. No passcode is required. Individuals who dial in will be asked to identify themselves and their affiliations. The conference call will also be webcasted through a link on Atento's Investor Relations website at investors.atento.com. A web-based archive of the conference call will also be available at the above website. About Atento Atento is the largest provider of customer relationship management and business process outsourcing (CRM BPO) services in Latin America, and among the top three providers globally, based on revenues. Atento is also a leading provider for U.S.-based companies nearshoring CRM/BPO services to Latin America. Since 1999, the company has developed its business model in 14 countries where it employs more than 160,000 people. Atento has over 400 clients to whom it offers a wide range of CRM BPO services across multiple channels. Atento's clients are mostly leading multinational corporations in sectors such as telecommunications, banking and financial services, media and technology, health, retail and public administrations, among others. Atento s shares trade under the symbol ATTO on the New York Stock Exchange (NYSE). In 2015, Atento was named one of the World s 25 Best Multinational Workplaces by Great Place to Work for third consecutive year. For more information visit Investor Relations Lynn Antipas Tyson lynn.tyson@atento.com Media Relations Maite Cordero media@atento.com 4
58 PRESS RELEASE Forward-Looking Statements This press release contains forward-looking statements. Forward-looking statements can be identified by the use of words such as "may," "should," "expects," "plans," "anticipates," "believes," "estimates," "predicts," "intends," "continue" or similar terminology. These statements reflect only Atento's current expectations and are not guarantees of future performance or results. These statements are subject to risks and uncertainties that could cause actual results to differ materially from those contained in the forward-looking statements. These risks and uncertainties include, but are not limited to, competition in Atento s highly competitive industries; increases in the cost of voice and data services or significant interruptions in these services; Atento s ability to keep pace with its clients needs for rapid technological change and systems availability; the continued deployment and adoption of emerging technologies; the loss, financial difficulties or bankruptcy of any key clients; the effects of global economic trends on the businesses of Atento s clients; the non-exclusive nature of Atento s client contracts and the absence of revenue commitments; security and privacy breaches of the systems Atento uses to protect personal data; the cost of pending and future litigation; the cost of defending Atento against intellectual property infringement claims; extensive regulation affecting many of Atento s businesses; Atento s ability to protect its proprietary information or technology; service interruptions to Atento s data and operation centers; Atento s ability to retain key personnel and attract a sufficient number of qualified employees; increases in labor costs and turnover rates; the political, economic and other conditions in the countries where Atento operates; changes in foreign exchange rates; Atento s ability to complete future acquisitions and integrate or achieve the objectives of its recent and future acquisitions; future impairments of our substantial goodwill, intangible assets, or other long-lived assets; and Atento s ability to recover consumer receivables on behalf of its clients. In addition, Atento is subject to risks related to its level of indebtedness. Such risks include Atento s ability to generate sufficient cash to service its indebtedness and fund its other liquidity needs; Atento s ability to comply with covenants contained in its debt instruments; the ability to obtain additional financing; the incurrence of significant additional indebtedness by Atento and its subsidiaries; and the ability of Atento s lenders to fulfill their lending commitments. Atento is also subject to other risk factors described in documents filed by the company with the United States Securities and Exchange Commission. These forward-looking statements speak only as of the date on which the statements were made. Atento undertakes no obligation to update or revise publicly any forward-looking statements, whether as a result of new information, future events or otherwise. SELECTED FINANCIAL DATA The following selected financial information should be read in conjunction with the interim consolidated financial statements and the section entitled Management s Discussion and Analysis of Financial Condition and Results of Operations presented elsewhere in the Form 6-K. 5
59 PRESS RELEASE Consolidated Income Statements For three months ended December 31, Change excluding For the year ended December 31, Change excluding ($ in millions, except percentage changes) (**) FX (%) (**) FX (%) (unaudited) (unaudited) (audited) Revenue , , Other operating income (3.6) Own work capitalized N.M N.M Other gains N.M N.M Supplies (18.6) (25.6) (2.0) (78.4) (104.8) (2.9) Employee benefit expenses (329.3) (390.0) 9.8 (1,422.7) (1,636.4) 10.2 Depreciation (12.6) (14.6) 16.4 (51.1) (59.0) 11.7 Amortization (11.4) (13.6) 11.8 (51.8) (60.8) 10.0 Changes in trade provisions (0.3) 1.9 (121.1) (1.2) 1.7 N.M Other operating expenses (62.5) (110.0) (24.5) (245.1) (360.2) (12.2) Impairment charges N.M - (31.8) N.M Total Operating Expenses (434.7) (551.2) 3.2 (1,850.3) (2,251.3) 4.7 OPERATING PROFIT/(LOSS) N.M Finance income Finance costs (17.7) (21.7) 9.2 (75.7) (122.1) (19.8) Change in fair value of financial instruments (**) N.M N.M Net foreign exchange gains/(loss) (4.5) (14.9) (57.7) (4.0) (33.3) N.M NET FINANCE EXPENSE (15.9) (12.6) 78.6 (46.7) (110.8) (43.0) PROFIT/(LOSS) BEFORE TAX 9.5 (5.2) N.M 72.9 (23.6) N.M Income tax expenses (4.1) (20.7) (74.9) (23.8) (18.5) (25.9) N.M 49.1 (42.1) N.M PROFIT/(LOSS) FOR THE PERIOD Basic result per share (in U.S. dollars) (*) 0.07 (0.35) N.M 0.67 (0.57) N.M (*) The basic result per share, for the period presented in the table above, was calculated based on the number of ordinary shares of 73,648,760 as of December 31, For the period ended December 31, 2014 the number of ordinary shares was 73,619,511. (**) The gain or loss of the fair value of derivatives was recorded in the Income Statements within Finance income ($25.9 million for the three months ended December 31, 2014 and $40.9 million for the year ended December 31, 2014) and Finance costs ($5.9 million for the three months ended December 31, 2014 and $13.6 million for the year ended December 31, 2014), instead of Changes in fair value of financial instruments. 6
60 PRESS RELEASE Reconciliation of EBITDA and Adjusted EBITDA to Profit/(Loss): For the three months ended December 31, For the year ended December 31, ($ in millions) (unaudited) (unaudited) (audited) Profit/(loss) for the period 5.4 (25.9) 49.1 (42.1) Net finance expense Income tax expense Depreciation and amortization EBITDA (non-gaap) (unaudited) Acquisition and integration related costs (a) Restructuring costs (b) Sponsor management fees (c) Site relocation costs (d) Financing and IPO fees (e) Asset impairments and Others (f) Total non-recurring items Adjusted EBITDA (non-gaap) (unaudited) (a) Acquisition and integration related costs incurred in 2014, are costs associated with the post-acquisition process in connection with the full strategy review. These projects were substantially completed by the end of For the year ended December 31, 2014 acquisition and integration related costs primarily resulted from consulting fees incurred in connection with the full strategy review including our growth plan and operational set-up with a leading consulting firm ($4.0 million), improving procurement efficiency ($2.3 million), and IT transformation projects ($2.5 million). Acquisition and integration related costs incurred for the year ended December 31, 2015 primarily related to the finalization the SAP IT transformation project during the three months ended March 31, Acquisition and integration related costs incurred during the three months ended December 31, 2014 primarily related to consulting fees incurred in connection with IT transformation projects. During the three months ended December 31, 2015, we have no costs related to our acquisition and integration process. These projects were substantially completed by the end of (b) Restructuring costs incurred in 2014 and 2015 primarily included a number of restructuring activities and other personnel costs that were not related to our core result of operations. Restructuring costs incurred for the year ended December 31, 2014, are primarily related to headcount restructuring activities in Spain. In addition, we incurred restructuring costs not related to our core results of operations in Argentina and Peru of $4.8 million, $2.5 million in Chile of restructuring expenses incurred in connection with the implementation of a new service delivery model with Telefónica, and certain changes to the executive team, and an additional $0.7 million related to the relocation of corporate headquarters. Restructuring costs incurred in the year ended December 31, 2015, primarily relates to optimization of labor force to current or expected adjustments in activity levels, mainly in EMEA and Brazil. Restructuring costs incurred for the three months ended December 31, 2014, primarily include $2.7 million related to restructuring in Chile ($1.1 million) in connection with certain changes to the executive team, and the restructuring of specific operations in Peru and Argentina ($1.6 million). For the three months ended December 31, 2015 restructuring costs primarily relates to labor force optimization to current activity level declines mainly in Telefónica business, both in Brazil and EMEA. (c) Sponsor management fees represent the annual advisory fee paid to Bain Capital Partners, LLC that were expensed during the period presented. The advisory agreement was terminated in connection with the initial public offering. (d) Site relocation costs incurred for the three months and year ended December 31, 2014 include costs associated with our current strategic initiative of relocating call centers from tier 1 cities to tier 2 cities in Brazil to achieve efficiencies through lower rental costs, attrition and absenteeism. Site relocation costs incurred for the three months ended December 31, 2015 related to the anticipation for site closures in Brazil in connection of the site relocation program to tier 2 and tier 3 cities. (e) Financing and IPO fees for the three months and year ended December 31, 2014 primarily relate to non-core professional fees incurred during the IPO process, including advisory, auditing and legal expenses. Financing and IPO fees for the three months and year ended December 31, 2015 relate to remaining costs incurred during the three months ended March 31, 2015 in connection with the IPO process. (f) Asset impairments and other costs incurred for the year ended December 31, 2014, mainly relate to the goodwill and other intangible asset impairment relating to our operation in Czech Republic (divested in December 2014) of $3.7 million and Spain of $28.8 million, offset by the amendment of the MSA with Telefónica, by which the minimum revenue commitment for Spain was reduced against a $34.5 million penalty fee paid by Telefónica. Asset impairment and other costs for the year ended December 31, 2015 mainly refer to consulting and other costs in connection with efficiencies and costs reduction projects implemented in Brazil and EMEA. Asset impairments and other costs incurred for the three months ended December 31, 2014 primarily related to a revenue adjustment in Spain ($2.4 million) for prior fiscal years and a one off tax penalty in Colombia ($1.3 million). Asset impairments and other costs for the three months ended December 31, 2015 mainly refer to consulting and other costs in connection with efficiencies and costs reduction projects in implementation in Brazil and EMEA.
61 7
62 PRESS RELEASE Reconciliation of Adjusted Earnings to profit/(loss): For the three months ended December 31, For the year ended December 31, ($ in millions, except percentage changes) (unaudited) (unaudited) (audited) Profit/(Loss) attributable to equity holders of the parent 5.4 (25.9) 49.1 (42.1) Acquisition and integration related Costs (a) Amortization of Acquisition related Intangible assets (b) Restructuring Costs (c) Sponsor management fees (d) Site relocation costs (e) Financing and IPO fees (f) PECs interest expense (g) - (0.4) Asset impairments and Others (h) DTA adjustment in Spain (i) Net foreign exchange gain on financial instruments (j) (3.5) (20.0) (17.5) (27.3) Net foreign exchange impacts (k) Tax effect (l) (6.4) (11.0) (17.1) (46.4) Total of Add backs Adjusted Earnings (non-gaap) (unaudited) Adjusted Basic Earnings per share(in U.S. dollars) (*) (unaudited) (a) Acquisition and integration related costs incurred in 2014, are costs associated with the post-acquisition process in connection with the full strategy review. These projects were substantially completed by the end of For the year ended December 31, 2014 acquisition and integration related costs primarily resulted from consulting fees incurred in connection with the full strategy review including our growth plan and operational set-up with a leading consulting firm ($4.0 million), improving procurement efficiency ($2.3 million), and IT transformation projects ($2.5 million). Acquisition and integration related costs incurred for the year ended December 31, 2015 primarily relate to the finalization the SAP IT transformation project during the three months ended March 31, Acquisition and integration related costs incurred during the three months ended December 31, 2014 primarily related to consulting fees incurred in connection with IT transformation projects. During the three months ended December 31, 2015, we have no costs related to our acquisition and integration process. These projects were substantially completed by the end of (b) Amortization of acquisition related intangible assets represents the amortization expense of intangible assets resulting from the acquisition and has been adjusted to eliminate the impact of the amortization arising from the acquisition which is not in the ordinary course of our daily operations, and also distorts comparisons with peers and our results for prior periods. Such intangible assets primarily include contractual relationships with customers, for which the useful life has been estimated at primarily nine years. (c) Restructuring costs incurred in 2014 and 2015 primarily included a number of restructuring activities and other personnel costs that were not related to our core result of operations. Restructuring costs incurred for the year ended December 31, 2014, are primarily related to headcount restructuring activities in Spain. In addition, we incurred restructuring costs not related to our core results of operations in Argentina and Peru of $4.8 million, $2.5 million in Chile of restructuring expenses incurred in connection with the implementation of a new service delivery model with Telefónica, and certain changes to the executive team, and an additional $0.7 million related to the relocation of corporate headquarters. Restructuring costs incurred in the year ended December 31, 2015, primarily relates to optimization of labor force to current or expected adjustments in activity levels, mainly in EMEA and Brazil. Restructuring costs incurred for the three months ended December 31, 2014, primarily include $2.7 million related to restructuring in Chile ($1.1 million) in connection with certain changes to the executive team, and the restructuring of specific operations in Peru and Argentina ($1.6 million). For the three months ended December 31, 2015 restructuring costs primarily relates to labor force optimization to current activity level declines mainly in TEF business, both in Brazil and EMEA. (d) Sponsor management fees represent the annual advisory fee paid to Bain Capital Partners, LLC that are expensed during the period presented. The advisory agreement was terminated in connection with the initial public offering. (e) Site relocation costs incurred for the three months and year ended December 31, 2014 include costs associated with our current strategic initiative of relocating call centers from tier 1 cities to tier 2 cities in Brazil to achieve efficiencies through lower rental costs, attrition and absenteeism. Site relocation costs incurred for the three months ended December 31, 2015 related to the anticipation for site closures in Brazil in connection of the site relocation program to tier 2 and tier 3 cities. (f) Financing and IPO fees for the three months and year ended December 31, 2014 primarily relate to non-core professional fees incurred during the IPO process, including advisory, auditing and legal expenses. Financing and IPO fees for the three months and year ended December 31, 2015 relate to remaining costs incurred during the three months ended March 31, 2015 in connection with the IPO process. (g) PECs Interest expense represents accrued interest on the preferred equity certificates that were capitalized in connection with the IPO. (h) Asset impairment and other costs incurred for the year ended December 31, 2014, mainly relate to the goodwill and other intangible asset impairment relating to our operation in Czech Republic (divested in December 2014) of $3.7 million and Spain of $28.8 million, offset by the amendment of the MSA with Telefónica, by which the minimum revenue commitment
63 for Spain was reduced against a $34.5 million penalty fee paid by Telefónica. Asset impairments and other costs for the year ended December 31, 2015 mainly refer to consulting and other costs in connection with efficiencies and costs reduction projects implemented in Brazil and EMEA. Asset impairments and other costs incurred for the three months ended December 31, 2014 primarily related to a revenue adjustment in Spain ($2.4 million) for prior fiscal years and a one off tax penalty in Colombia ($1.3 million). Asset impairments and other costs for the three months ended December 31, 2015 mainly refer to consulting and other costs in connection with efficiencies and costs reduction projects in implementation in Brazil and EMEA. (i) Deferred tax asset adjustment as a consequence of the tax rate reduction in Spain from 30% to 28% in 2015 and to 25% in (j) As of April 1, 2015, the Company designated the foreign currency risk on certain of its subsidiaries as net investment hedges using financial instruments as the hedging items. As a consequence, any gain or loss on the hedging instrument, related to the effective portion of the hedge will be recognized in other comprehensive income (equity) as from that date. The gain or loss related to the ineffective portion will be recognized in the income statements. Cumulative net foreign exchange gain of such instruments was reversed from equity to profit/(loss) in the three months ended March 31, 2015 in the amount of $13.0 million and in the three months ended September 30, 2015 an amount of $1.0 million. For comparability, this one time adjustment was added back to calculate adjusted earnings. (k) As of 2015, management analyzes the Company financial condition performance excluding net foreign exchange impacts, which eliminates the volatility to foreign exchange variances from our operational results. For comparability purposes, 2014 adjusted earnings was restated by the net foreign exchange non-cash results from currency fluctuations impacting loans between group companies and other minor effects. (l) The tax effect represents the tax impact of the total adjustments based on a tax rate of 28.7% for 2014 and 30.5% for the year ended December 31, For the three months ended December 31, 2014 and % and 29.6% respectively. The adjustments for the three months ended December 31, 2015 include $1.5 million of DTA adjustments that are both excluded from the adjustments base for tax effect calculation. (*) The Adjusted Earnings per share, for the period presented in the table above, was calculated considering the number of ordinary shares of 73,648,760 (weighted average number of ordinary shares) as of December 31, For the period ended December 31, 2014 the number of ordinary shares was 73,619,511. 8
64 PRESS RELEASE Reconciliation of Total Debt to Net Debt with Third Parties As of December 31, (unaudited) ($ in millions, except Net Debt/Adj. EBITDA LTM) Cash and cash equivalents Short term financial investments Debt: 7.375% Sr. Sec. Notes due Brazilian Debentures Vendor Loan Note (1) - - Contingent Value Instrument Preferred Equity Certificates - - Finance Lease Payables Other Borrowings Total Debt Preferred Equity Certificates - - Total Debt excluding PECs Net Debt with third parties (2) (unaudited) Adjusted EBITDA LTM (3) (non - GAAP) (unaudited) Net Debt/Adjusted EBITDA LTM (non-gaap) (unaudited) 1.6x 1.4x (1) Reflects the prepayment to Telefónica of the entire indebtedness under the Vendor Loan Note. The loan was liquidated in connection with the IPO. (2) In considering our financial condition, our management analyzes net debt with third parties, which is defined as total debt less cash, cash equivalents, and short-term financial investments. Net debt with third parties is not a measure defined by IFRS and it has limitations as an analytical tool. Net debt is neither a measure defined by or presented in accordance with IFRS nor a measure of financial performance, and should not be considered in isolation or as an alternative financial measure determined in accordance with IFRS. Net debt is not necessarily comparable to similarly titled measures used by other companies. (3) Adjusted EBITDA LTM (Last Twelve Months) is defined as EBITDA adjusted to exclude acquisition and integration related costs, restructuring costs, sponsor management fees, asset impairments, site-relocation costs, financing fees, IPO costs and other items, which are not related to our core results of operations for the last twelve months. Free Cash Flow For the year ended December ($ in millions) For the three months ended December 31, 31, (unaudited) (unaudited) (audited) EBITDA (non-gaap) (unaudited) Changes in Working Capital (108.3) 23.1 Payments for acquisition of property, plant, equipment and intangible assets (35.8) (36.7) (96.4) (117.9) Disposals of property plant, equipment, and intangible assets - (0.1) Income tax paid (3.2) (3.0) (16.2) (19.0) Free cash flow before interest Net interest (15.6) (17.5) (48.4) (72.5) Free cash flow (non-gaap) (unaudited) 8.3 (8.6) (44.4)

65
66

67
68
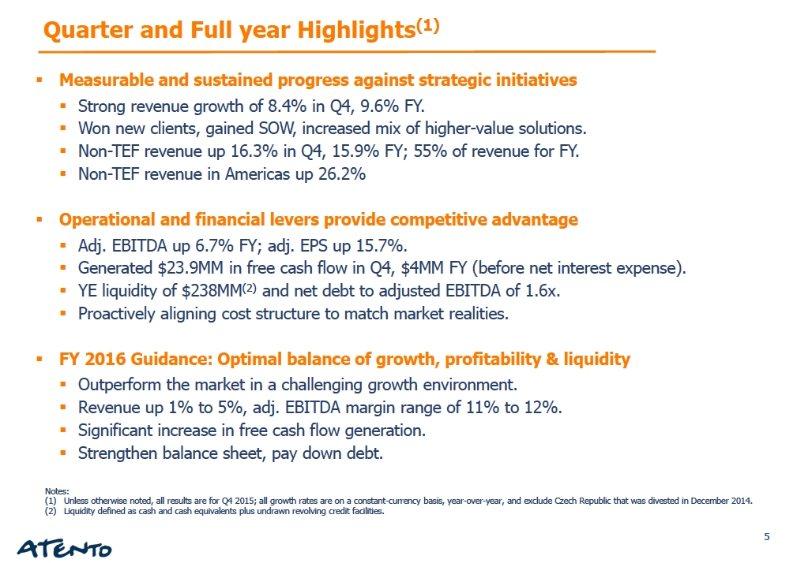
69
70
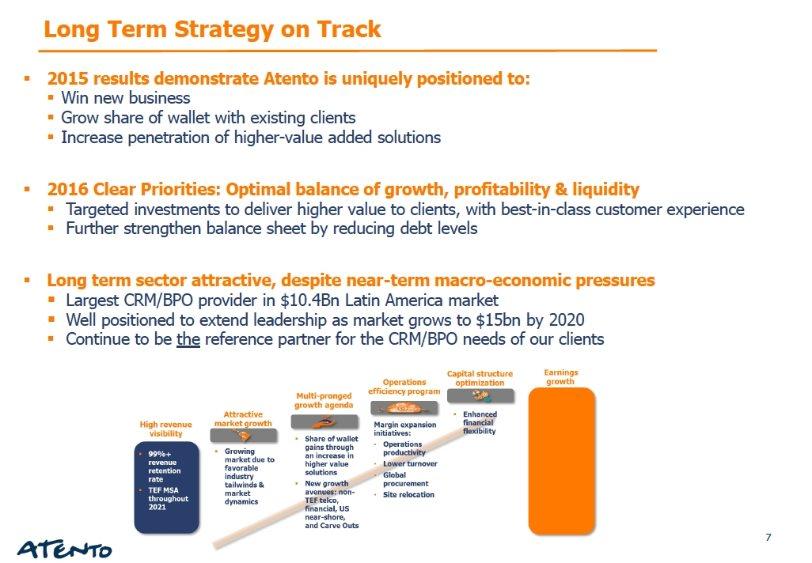
71

72
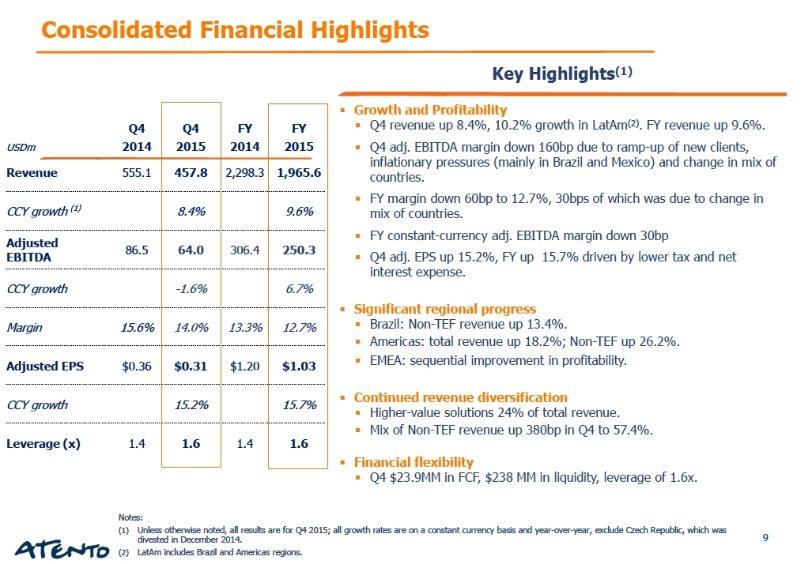
73
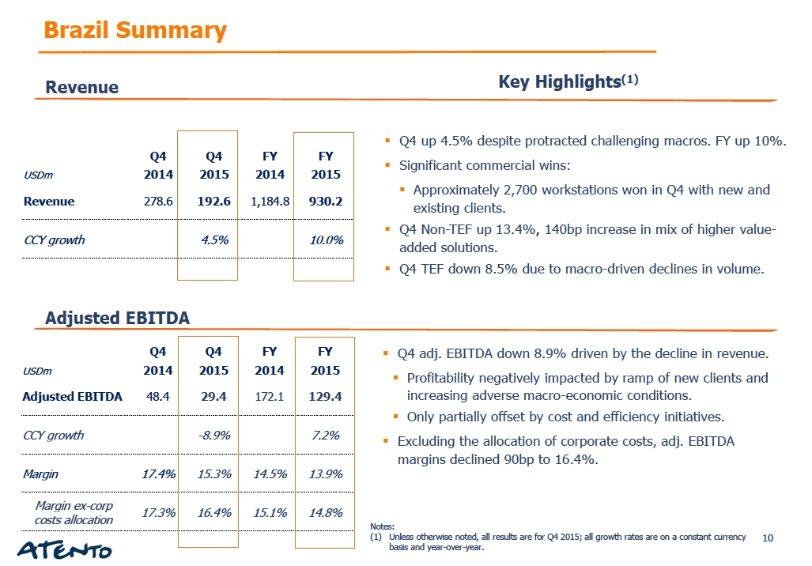
74
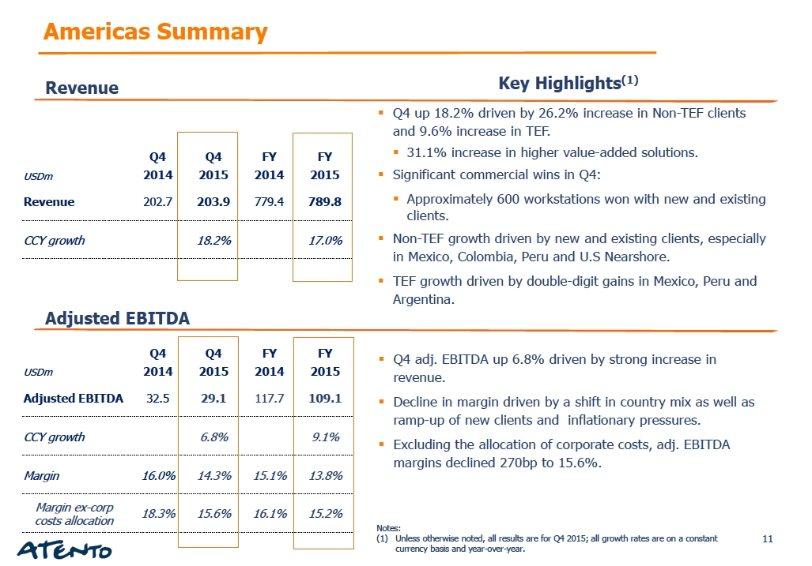
75
76
77
78
79
80
81
82
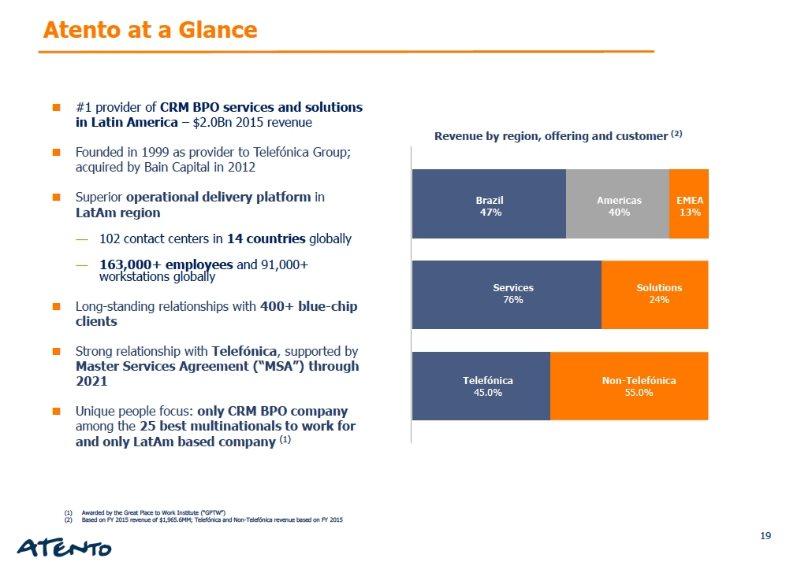
83
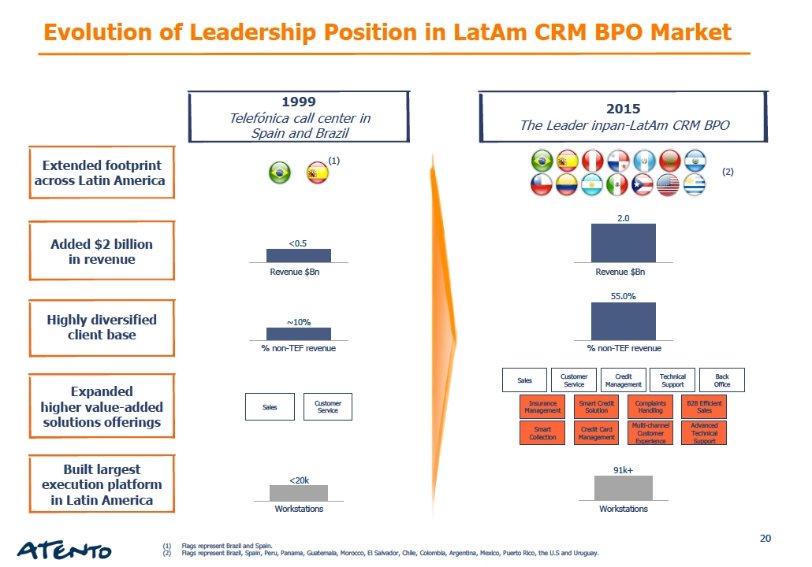
84

85
86
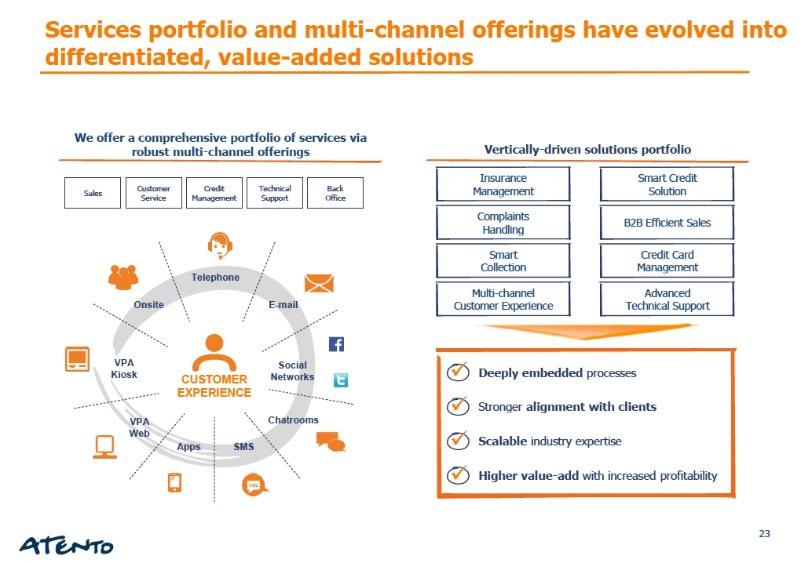
87
88
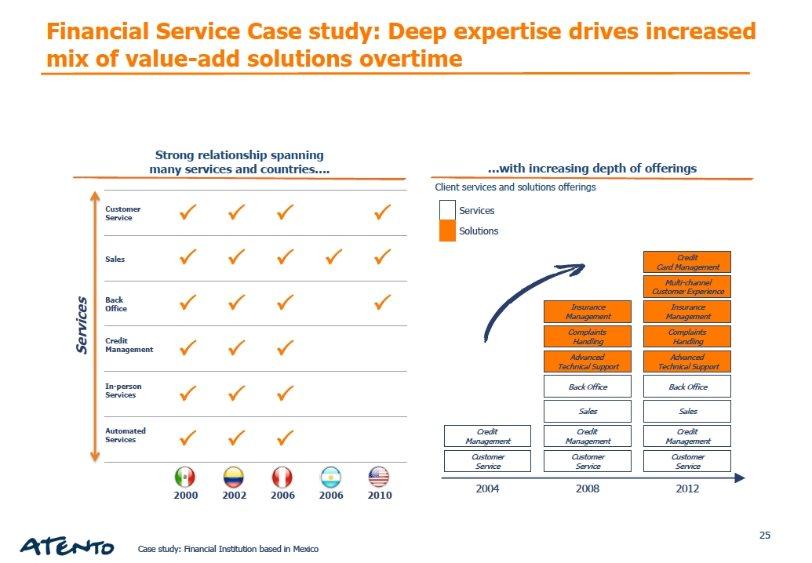
89

90

91
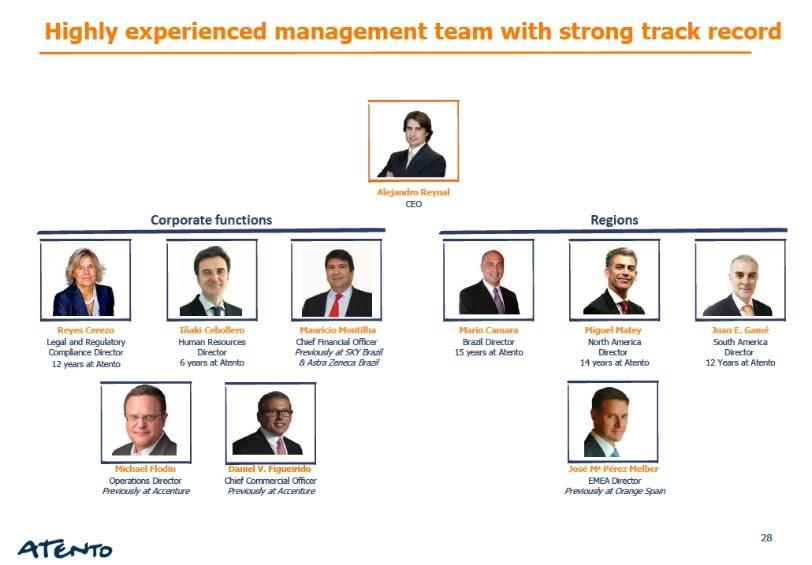
92

93
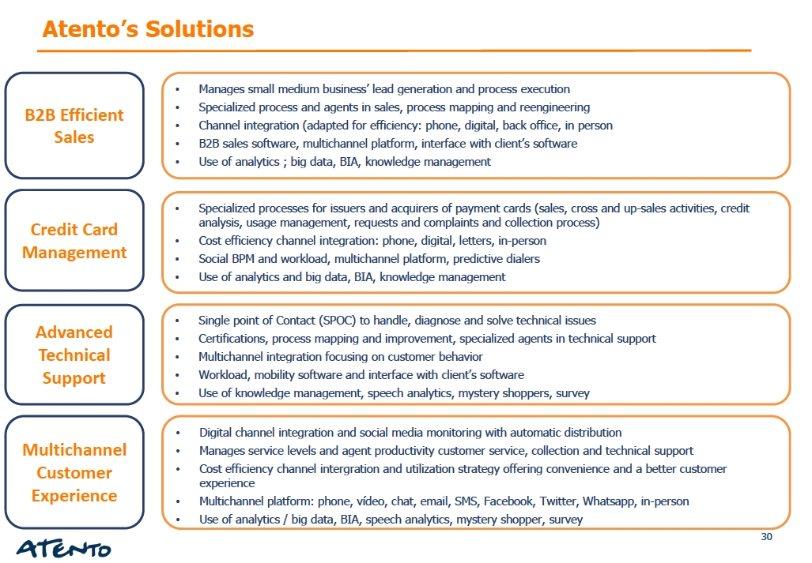
94
95
96
97
98
99
100

101
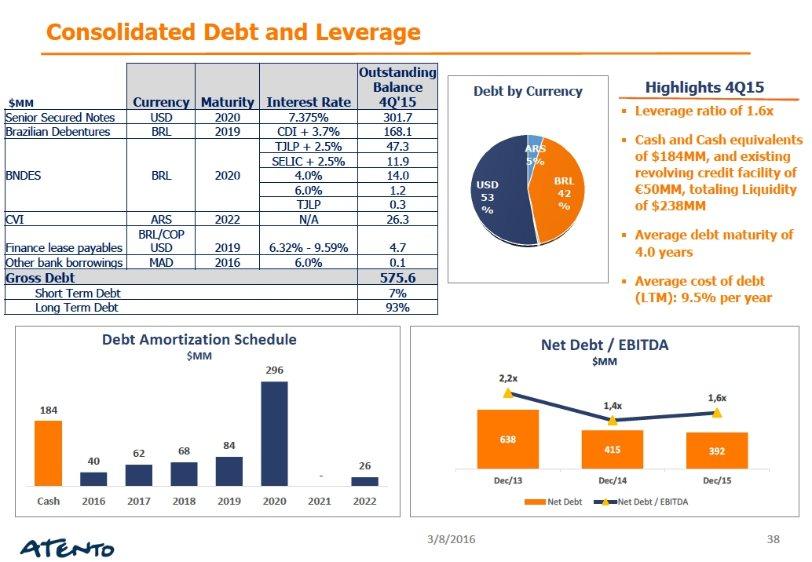
102
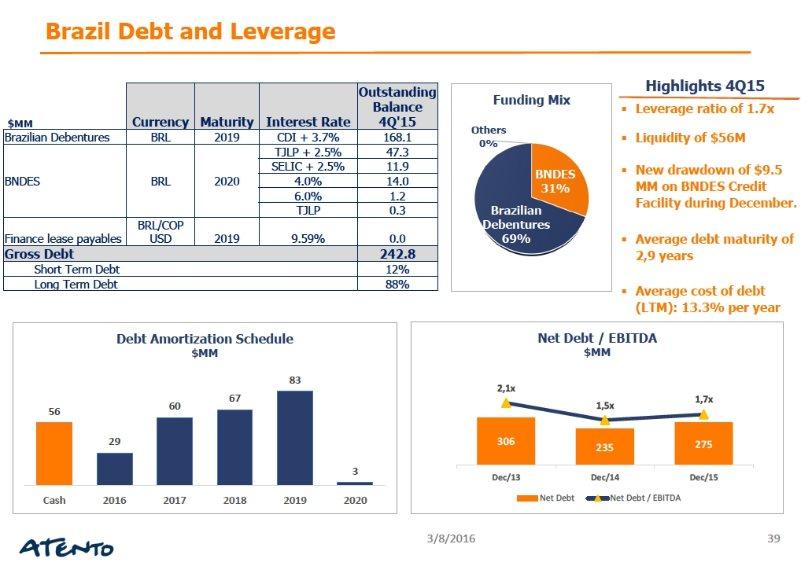
103
Grand Duchy of Luxembourg (Jurisdiction of incorporation or organization) 4 rue Lou Hemmer, L 1748 Luxembourg Findel
 4 rue Lou Hemmer, L 1748 Luxembourg Findel") 20 F 1 attoform20f_2015.htm FORM 20 F UNITED STATES SECURITIES AND EXCHANGE COMMISSION Washington, D.C. 20549 FORM 20 F ANNUAL REPORT PURSUANT TO SECTION 13 OR 15(d) OF THE SECURITIES EXCHANGE ACT OF 1934
20 F 1 attoform20f_2015.htm FORM 20 F UNITED STATES SECURITIES AND EXCHANGE COMMISSION Washington, D.C. 20549 FORM 20 F ANNUAL REPORT PURSUANT TO SECTION 13 OR 15(d) OF THE SECURITIES EXCHANGE ACT OF 1934
UNITED STATES SECURITIES AND EXCHANGE COMMISSION Washington, D.C FORM 20-F
 UNITED STATES SECURITIES AND EXCHANGE COMMISSION Washington, D.C. 20549 FORM 20-F ANNUAL REPORT PURSUANT TO SECTION 13 OR 15(d) OF THE SECURITIES EXCHANGE ACT OF 1934 for the fiscal year ended: December
UNITED STATES SECURITIES AND EXCHANGE COMMISSION Washington, D.C
 UNITED STATES SECURITIES AND EXCHANGE COMMISSION Washington, D.C. 20549 FORM 6-K Report of Foreign Private Issuer Pursuant to Rule 13a-16 or 15d-16 of the Securities Exchange Act of 1934 For the month
Ordinary Shares, no par value New York Stock Exchange SecuritiesregisteredortoberegisteredpursuanttoSection12(g)oftheAct: None (Title of Class)
oftheAct: None (Title of Class)") UNITED STATES SECURITIES AND EXCHANGE COMMISSION Washington, D.C. 20549 FORM 20-F ANNUAL REPORT PURSUANT TO SECTION 13 OR 15(d) OF THE SECURITIES EXCHANGE ACT OF 1934 for the fiscal year ended: December
UNITED STATES SECURITIES AND EXCHANGE COMMISSION Washington, D.C. 20549 FORM 20-F ANNUAL REPORT PURSUANT TO SECTION 13 OR 15(d) OF THE SECURITIES EXCHANGE ACT OF 1934 for the fiscal year ended: December
UNITED STATES SECURITIES AND EXCHANGE COMMISSION Washington, D.C
 UNITED STATES SECURITIES AND EXCHANGE COMMISSION Washington, D.C. 20549 FORM 6-K Report of Foreign Private Issuer Pursuant to Rule 13a-16 or 15d-16 of the Securities Exchange Act of 1934 For the month
UNITED STATES SECURITIES AND EXCHANGE COMMISSION Washington, D.C
 UNITED STATES SECURITIES AND EXCHANGE COMMISSION Washington, D.C. 20549 FORM 6-K Report of Foreign Private Issuer Pursuant to Rule 13a-16 or 15d-16 of the Securities Exchange Act of 1934 For the month
UNITED STATES SECURITIES AND EXCHANGE COMMISSION Washington, D.C
 UNITED STATES SECURITIES AND EXCHANGE COMMISSION Washington, D.C. 20549 FORM 6-K Report of Foreign Private Issuer Pursuant to Rule 13a-16 or 15d-16 of the Securities Exchange Act of 1934 For the month
Atento Reports Third Quarter 2014 Results
 PRESS RELEASE Atento Reports Third Quarter 2014 Results Q3 results demonstrated meaningful progress against the Company s key operating metrics: revenue, adjusted EBITDA and free cash flow Revenues grew
UNITED STATES SECURITIES AND EXCHANGE COMMISSION Washington, D.C
 UNITED STATES SECURITIES AND EXCHANGE COMMISSION Washington, D.C. 20549 FORM 6-K Report of Foreign Private Issuer Pursuant to Rule 13a-16 or 15d-16 of the Securities Exchange Act of 1934 For the month
ATENTO S.A. AND SUBSIDIARIES (FORMERLY ATENTO FLOATCO S.A. AND SUBSIDIARIES)
") ATENTO S.A. AND SUBSIDIARIES (FORMERLY ATENTO FLOATCO S.A. AND SUBSIDIARIES) CONSOLIDATED FINANCIAL STATEMENTS AND CONSOLIDATED MANAGEMENT REPORT FOR THE YEAR ENDED DECEMBER 31, 2014 AND 2015 TABLE OF
ATENTO S.A. AND SUBSIDIARIES (FORMERLY ATENTO FLOATCO S.A. AND SUBSIDIARIES) CONSOLIDATED FINANCIAL STATEMENTS AND CONSOLIDATED MANAGEMENT REPORT FOR THE YEAR ENDED DECEMBER 31, 2014 AND 2015 TABLE OF
Adjusted EBITDA (3) % % Adjusted Margin 13.3% 14.1% 12.6% 12.8%
 % % Adjusted Margin 13.3% 14.1% 12.6% 12.8%") Atento Reports Fiscal 2016 Fourth-Quarter and Full Year Results, Highlighted by Revenue Diversification, Margin Protection and Strong Cash Flow Generation Company Announces Agreement to Acquire Majority
Atento Reports Fiscal 2016 Fourth-Quarter and Full Year Results, Highlighted by Revenue Diversification, Margin Protection and Strong Cash Flow Generation Company Announces Agreement to Acquire Majority
UNITED STATES SECURITIES AND EXCHANGE COMMISSION Washington, D.C FORM 6-K ReportofForeignPrivateIssuer. Atento S.A.
 UNITED STATES SECURITIES AND EXCHANGE COMMISSION Washington, D.C. 20549 FORM 6-K ReportofForeignPrivateIssuer PursuanttoRule13a-16or15d-16ofthe SecuritiesExchangeActof1934 For the year ended December 31,
Atento. Fiscal 2016 Fourth Quarter and Full Year Results. March 21, 2017
 Atento Fiscal 2016 Fourth Quarter and Full Year Results March 21, 2017 Lynn Antipas Tyson Vice President Investor Relations +1-914-485-1150 lynn.tyson@atento.com 1 Disclaimer This presentation has been
Atento. Morgan Stanley 11 th Annual Latin America Executive Conference. January 14-15, Investor Relations Shay Chor
 January 14-15, 2019 Atento Morgan Stanley 11 th Annual Latin America Executive Conference Investor Relations Shay Chor shay.chor@atento.com Fernando Schneider fernando.schneider@atento.com 1 Disclaimer
ATENTO S.A. AND SUBSIDIARIES (FORMERLY ATENTO FLOATCO S.A. AND SUBSIDIARIES)
") ATENTO S.A. AND SUBSIDIARIES (FORMERLY ATENTO FLOATCO S.A. AND SUBSIDIARIES) CONSOLIDATED FINANCIAL STATEMENTS AND CONSOLIDATED MANAGEMENT REPORT FOR THE YEAR ENDED DECEMBER 31, 2015 AND 2016 4, rue Lou
ATENTO S.A. AND SUBSIDIARIES (FORMERLY ATENTO FLOATCO S.A. AND SUBSIDIARIES) CONSOLIDATED FINANCIAL STATEMENTS AND CONSOLIDATED MANAGEMENT REPORT FOR THE YEAR ENDED DECEMBER 31, 2015 AND 2016 4, rue Lou
Atento Reports Fiscal 2018 Second-Quarter Results Highlighted by Top-line Growth and EPS Expansion
 Atento Reports Fiscal 2018 Second-Quarter Results Highlighted by Top-line Growth and EPS Expansion Solid top-line growth across geographies, with revenues up 7.2% Multisector revenues up 9.1% in Q2, representing
Atento Reports Fiscal 2018 First-Quarter Results Highlighted by Solid Topline Growth
 Atento Reports Fiscal 2018 First-Quarter Results Highlighted by Solid Topline Growth Revenues up 4.5% driven by Americas and Brazil Multisector clients revenue growth in all Regions, up 7.9% to 61.4% of
Atento. Fiscal 2017 Fourth Quarter and Full Year Results. March 20, Investor Relations Shay Chor
 March 20, 2018 Atento Fiscal 2017 Fourth Quarter and Full Year Results Investor Relations Shay Chor shay.chor@atento.com Felipe Joaquim Martins de Souza felipe.souza@atento.com 1 Disclaimer This presentation
ATENTO S.A. AND SUBSIDIARIES CONSOLIDATED FINANCIAL STATEMENTS AND CONSOLIDATED MANAGEMENT REPORT FOR THE YEAR ENDED DECEMBER 31, 2016 AND 2017
 4, rue Lou Hemmer L-1748 Luxembourg-Findel RCS Luxembourg: B 185761 ATENTO S.A. AND SUBSIDIARIES CONSOLIDATED FINANCIAL STATEMENTS AND CONSOLIDATED MANAGEMENT REPORT FOR THE YEAR ENDED DECEMBER 31, 2016
LSF9 Balta Issuer S.A.
 LSF9 Balta Issuer S.A. Quarterly Report to Noteholders 290,000,000 7.75% Senior Secured Notes due 2022 Q1 Period ended March 31, LSF9 Balta Issuer S.A. Registered office: 33, rue du Puits Romain, L-8070
FORM 6-K. MFC Bancorp Ltd. (Translation of Registrant's name into English)
") U.S. SECURITIES AND EXCHANGE COMMISSION Washington D.C. 20549 FORM 6-K REPORT OF FOREIGN PRIVATE ISSUER PURSUANT TO RULE 13a-16 OR 15d-16 UNDER THE SECURITIES EXCHANGE ACT OF 1934 For the month of December,
U.S. SECURITIES AND EXCHANGE COMMISSION Washington D.C. 20549 FORM 6-K REPORT OF FOREIGN PRIVATE ISSUER PURSUANT TO RULE 13a-16 OR 15d-16 UNDER THE SECURITIES EXCHANGE ACT OF 1934 For the month of December,
MSA Safety Incorporated Reconciliation of As Reported Financial Measures to Non-GAAP Financial Measures Local Currency Revenue Growth (Unaudited)
") Local Currency Revenue Growth (Unaudited) Three Months Ended 2015 Consolidated North America Europe International Local currency revenue growth, excluding Latchways 4 % 10 % % (4)% Latchways acquisition
Local Currency Revenue Growth (Unaudited) Three Months Ended 2015 Consolidated North America Europe International Local currency revenue growth, excluding Latchways 4 % 10 % % (4)% Latchways acquisition
Hertz Global Holdings, Inc. (1) First Quarter 2007 Performance Results Including Non-GAAP Measures, Definitions and Use/Importance
 First Quarter 2007 Performance Results Including Non-GAAP Measures, Definitions and Use/Importance") Hertz Global Holdings, Inc. (1) First Quarter 2007 Performance Results Including Non-GAAP Measures, Definitions and Use/Importance Table 1: Condensed Consolidated Statements of Operations for the Three
Hertz Global Holdings, Inc. (1) First Quarter 2007 Performance Results Including Non-GAAP Measures, Definitions and Use/Importance Table 1: Condensed Consolidated Statements of Operations for the Three
KEY FIGURES.3 MANAGEMENT DISCUSSION AND ANALYSIS OF THE RESULTS GROUP FINANCIAL HIGHLIGHTS BUSINESS UPDATE H
 1 Table of Contents 1. KEY FIGURES...3 2. MANAGEMENT DISCUSSION AND ANALYSIS OF THE RESULTS...4 2.1. GROUP FINANCIAL HIGHLIGHTS...4 2.2. BUSINESS UPDATE...4 3. OPERATING REVIEW PER SEGMENT...5 3.1. REVENUE
Cencosud S.A. (Translation of registrant s name into English)
") UNITED STATES SECURITIES AND EXCHANGE COMMISSION Washington, D.C. 20549 FORM 6 - K Report of Foreign Private Issuer Pursuant to Rule 13a - 16 or 15d - 16 under the Securities Exchange Act of 1934 For the
UNITED STATES SECURITIES AND EXCHANGE COMMISSION Washington, D.C. 20549 FORM 6 - K Report of Foreign Private Issuer Pursuant to Rule 13a - 16 or 15d - 16 under the Securities Exchange Act of 1934 For the
Atento. Fiscal 2017 First Quarter Results. May 9, Felipe Joaquim Martins de Souza Investor Relations
 Atento Fiscal 2017 First Quarter Results May 9, 2017 Felipe Joaquim Martins de Souza Investor Relations +55 11 3779-8053 Felipe.souza@atento.com 1 Disclaimer This presentation has been prepared by Atento.
UNITED STATES SECURITIES AND EXCHANGE COMMISSION FORM 6-K. LUXOTTICA GROUP S.p.A.
 UNITED STATES SECURITIES AND EXCHANGE COMMISSION WASHINGTON, D.C. 20549 FORM 6-K REPORT OF FOREIGN PRIVATE ISSUER PURSUANT TO RULE 13a-16 OR 15d-16 UNDER THE SECURITIES EXCHANGE ACT OF 1934 For the quarter
Consolidated Statement of Profit or Loss (in million Euro)
") Consolidated Statement of Profit or Loss (in million Euro) Q1 2016 Q1 2017 % change Revenue 603 588-2.5% Cost of sales (408) (396) -2.9% Gross profit 195 192-1.5% Selling expenses (84) (86) 2.4% Research
Consolidated Statement of Profit or Loss (in million Euro) Q1 2016 Q1 2017 % change Revenue 603 588-2.5% Cost of sales (408) (396) -2.9% Gross profit 195 192-1.5% Selling expenses (84) (86) 2.4% Research
Consolidated Statement of Profit or Loss (in million Euro)
") Consolidated Statement of Profit or Loss (in million Euro) Q3 2015 Q3 2016 % change 9m 2015 9m 2016 % change Revenue 661 625-5.4% 1,974 1,873-5.1% Cost of sales (453) (415) -8.4% (1,340) (1,239) -7.5%
Consolidated Statement of Profit or Loss (in million Euro) Q3 2015 Q3 2016 % change 9m 2015 9m 2016 % change Revenue 661 625-5.4% 1,974 1,873-5.1% Cost of sales (453) (415) -8.4% (1,340) (1,239) -7.5%
BANCO BILBAO VIZCAYA ARGENTARIA, S.A. BANK BILBAO VIZCAYA ARGENTARIA, S.A.
 UNITED STATES SECURITIES AND EXCHANGE COMMISSION WASHINGTON, D.C. 20549 FORM 6-K REPORT OF FOREIGN ISSUER PURSUANT TO RULE 13a-16 OR 15d-16 UNDER THE SECURITIES EXCHANGE ACT OF 1934 For the six months
Consolidated Statement of Profit or Loss (in million Euro)
") Consolidated Statement of Profit or Loss (in million Euro) Unaudited, consolidated figures following IFRS accounting policies. Q2 2017 Q2 2018 H1 2017 H1 2018 Revenue 622 559 1,210 1,108 Cost of sales
Consolidated Statement of Profit or Loss (in million Euro) Unaudited, consolidated figures following IFRS accounting policies. Q2 2017 Q2 2018 H1 2017 H1 2018 Revenue 622 559 1,210 1,108 Cost of sales
Pointer Telocation Ltd. (Translation of registrant s name into English)
") UNITED STATES SECURITIES AND EXCHANGE COMMISSION Washington, D.C. 20549 FORM 6-K Report of Foreign Private Issuer Pursuant to Rule 13a-16 or 15d-16 under the Securities Exchange Act of 1934 For the month
UNITED STATES SECURITIES AND EXCHANGE COMMISSION Washington, D.C. 20549 FORM 6-K Report of Foreign Private Issuer Pursuant to Rule 13a-16 or 15d-16 under the Securities Exchange Act of 1934 For the month
UNITED STATES SECURITIES AND EXCHANGE COMMISSION FORM 6-K. LUXOTTICA GROUP S.p.A.
 UNITED STATES SECURITIES AND EXCHANGE COMMISSION WASHINGTON, D.C. 20549 FORM 6-K REPORT OF FOREIGN PRIVATE ISSUER PURSUANT TO RULE 13a-16 OR 15d-16 UNDER THE SECURITIES EXCHANGE ACT OF 1934 For the quarter
LSF9 Balta Issuer S.A.
 LSF9 Balta Issuer S.A. Annual Report to Noteholders 290,000,000 7.75% Senior Secured Notes due 2022 Annual Period ended 31, 2015 LSF9 Balta Issuer S.A. Registered office: 33, rue du Puits Romain, L-8070
FORACO INTERNATIONAL S.A. MANAGEMENT S DISCUSSION & ANALYSIS
 FORACO INTERNATIONAL S.A. MANAGEMENT S DISCUSSION & ANALYSIS Three-month and nine-month periods ended September 30, 2018 FORACO INTERNATIONAL S.A. MANAGEMENT S DISCUSSION AND ANALYSIS The following Management
The Kraft Heinz Company (Exact name of registrant as specified in its charter)
") UNITED STATES SECURITIES AND EXCHANGE COMMISSION WASHINGTON, D.C. 20549 (Mark One) FORM 10-Q x QUARTERLY REPORT PURSUANT TO SECTION 13 OR 15(d) OF THE SECURITIES EXCHANGE ACT OF 1934 For the quarterly
UNITED STATES SECURITIES AND EXCHANGE COMMISSION WASHINGTON, D.C. 20549 (Mark One) FORM 10-Q x QUARTERLY REPORT PURSUANT TO SECTION 13 OR 15(d) OF THE SECURITIES EXCHANGE ACT OF 1934 For the quarterly
Albéa Beauty Holdings S.A.
 Condensed unaudited interim consolidated financial statements for the periods ended September 30, 2015 and September 30, 2014 CONSOLIDATED INCOME STATEMENTS Third quarter Nine Month Period Continuing operations:
ITRON, INC. CONSOLIDATED STATEMENTS OF OPERATIONS
 , INC. CONSOLIDATED STATEMENTS OF OPERATIONS (Unaudited, in thousands, except per share data) Revenues $ 504,063 $ 615,555 $ 1,654,843 $ 1,791,647 Cost of revenues 332,266 438,559 1,103,196 1,237,722 Gross
Atento Reports Fiscal 2018 Third-Quarter Results Highlighted by Delivery of Turnaround in Brazil
 Atento Reports Fiscal 2018 Third-Quarter Results Highlighted by Delivery of Turnaround in Brazil - Adjusted EBITDA margin up 0.5 p.p. sequentially, driven by strong margin expansion in Brazil. - Brazil
CONSOLIDATED FINANCIAL STATEMENTS
 CONSOLIDATED FINANCIAL STATEMENTS FOR THE SIX MONTHS ENDED 30 JUNE 2017 ENDESA, S.A. AND SUBSIDIARIES CONSOLIDATED STATEMENTS OF FINANCIAL POSITION AT 30 JUNE 2017 AND 31 DECEMBER 2016 (*) Unaudited ASSETS
SGD Group S.A.S. Quarterly Report June 30, 2016
 SGD Group S.A.S. Quarterly Report June 30, 2016 Page 0 SGD Group - Consolidated financial statements Confidential Quarter ended June 30, 2016 Contents Page Definitions & structure of the information reported...
NEIMAN MARCUS GROUP LTD LLC REPORTS FOURTH QUARTER AND FISCAL YEAR 2016 RESULTS
 FOR IMMEDIATE RELEASE CONTACT: Mark Anderson Director Finance and Investor Relations (214) 757-2934 REPORTS FOURTH QUARTER AND FISCAL YEAR RESULTS DALLAS, Texas, Neiman Marcus Group LTD LLC today reported
Consolidated condensed interim financial statements. Balta Group NV. Period Ended June 30, Balta Group NV
 Balta Group NV Consolidated condensed interim financial statements Period Ended June 30, 2017 Balta Group NV Registered office: Wakkensteenweg 2, 8710 Sint-Baafs-Vijve, Belgium Registration number: 0671.974.626
ON SEMICONDUCTOR CORPORATION AND SUBSIDIARIES UNAUDITED CONSOLIDATED STATEMENT OF OPERATIONS (in millions, except per share data)
") UNAUDITED CONSOLIDATED STATEMENT OF OPERATIONS (in millions, except per share data) March 28, 2014 Quarter Ended December 31, 2013 March 29, 2013 Revenues $ 706.5 $ 718.0 $ 661.0 Cost of revenues 455.7
UNAUDITED CONSOLIDATED STATEMENT OF OPERATIONS (in millions, except per share data) March 28, 2014 Quarter Ended December 31, 2013 March 29, 2013 Revenues $ 706.5 $ 718.0 $ 661.0 Cost of revenues 455.7
UNITED STATES SECURITIES AND EXCHANGE COMMISSION Washington D.C FORM 6-K. Report of Foreign Private Issuer
 UNITED STATES SECURITIES AND EXCHANGE COMMISSION Washington D.C. 20549 FORM 6-K Report of Foreign Private Issuer Pursuant to Rule 13a-16 or 15d-16 of the Securities Exchange Act of 1934 For the month of
FORM 6-K. Compagnie Générale de Géophysique-Veritas
 SECURITIES AND EXCHANGE COMMISSION Washington, D.C. 20549 FORM 6-K REPORT OF FOREIGN PRIVATE ISSUER PURSUANT TO RULE 13a-16 OR 15d-16 OF THE SECURITIES EXCHANGE ACT OF 1934 For the month of November, 2007
Albéa Beauty Holdings S.A.
 Condensed unaudited interim consolidated financial statements for the periods ended June 30, 2015 and June 30, 2014 CONSOLIDATED INCOME STATEMENTS The notes are an integral part of these condensed interim
Atento. Fiscal 2017 Third Quarter Results. November 1, Investor Relations Shay Chor
 November 1, 2017 Atento Fiscal 2017 Third Quarter Results Investor Relations Shay Chor Shay.chor@atento.com Felipe Joaquim Martins de Souza Felipe.souza@atento.com 1 Disclaimer This presentation has been
Ideal Standard International S.A. Interim Financial Information for the three month period ended 31 March 2017
 Ideal Standard International S.A. Interim Financial Information for the three month period ended 31 March 2017 Ideal Standard International S.A. Financial Information 31 March 2017 Table of Contents Forward-Looking
FORM 10-Q. THE WENDY S COMPANY (Exact name of registrants as specified in its charter)
") UNITED STATES SECURITIES AND EXCHANGE COMMISSION Washington, D.C. 20549 FORM 10-Q (X) QUARTERLY REPORT PURSUANT TO SECTION 13 OR 15(d) OF THE SECURITIES EXCHANGE ACT OF 1934 For the quarterly period ended
UNITED STATES SECURITIES AND EXCHANGE COMMISSION Washington, D.C. 20549 FORM 10-Q (X) QUARTERLY REPORT PURSUANT TO SECTION 13 OR 15(d) OF THE SECURITIES EXCHANGE ACT OF 1934 For the quarterly period ended
Half year financial report
 Half year financial report Six-month period ended June 30, 2016 Condensed Consolidated Financial Statements Management Report CEO Attestation Statutory Auditors Review Report Table of contents Condensed
ITRON, INC. CONSOLIDATED STATEMENTS OF OPERATIONS
 , INC. CONSOLIDATED STATEMENTS OF OPERATIONS (Unaudited, in thousands, except per share data) Revenues $ 489,353 $ 482,175 $ 964,148 $ 929,711 Cost of revenues 326,312 322,587 646,572 630,000 Gross profit
ITRON, INC. CONSOLIDATED STATEMENTS OF OPERATIONS
 , INC. CONSOLIDATED STATEMENTS OF OPERATIONS (Unaudited, in thousands, except per share data) Revenues $ 474,795 $ 447,536 Cost of revenues 320,260 307,413 Gross profit 154,535 140,123 Operating expenses
ITRON, INC. CONSOLIDATED STATEMENTS OF OPERATIONS
 , INC. CONSOLIDATED STATEMENTS OF OPERATIONS (Unaudited, in thousands, except per share data) Revenues $ 571,640 $ 563,691 Cost of revenues 388,535 378,713 Gross profit 183,105 184,978 Operating expenses
ITRON, INC. CONSOLIDATED STATEMENTS OF OPERATIONS
 , INC. CONSOLIDATED STATEMENTS OF OPERATIONS (Unaudited, in thousands, except per share data) Revenues $ 447,536 $ 571,640 Cost of revenues 307,413 388,535 Gross profit 140,123 183,105 Operating expenses
FORACO INTERNATIONAL S.A. MANAGEMENT S DISCUSSION & ANALYSIS
 FORACO INTERNATIONAL S.A. MANAGEMENT S DISCUSSION & ANALYSIS Three-month and nine-month periods ended September 30, 2017 FORACO INTERNATIONAL S.A. MANAGEMENT S DISCUSSION AND ANALYSIS The following Management
February 1, GAAP operating loss was ($16) million and GAAP operating margin was (1.5%).
 million and GAAP operating margin was (1.5%).") Third Quarter 2017 Results CFO Commentary February 1, 2017 A reconciliation for non-gaap financial measures discussed in this commentary to the most directly comparable GAAP financial measures is provided
Third Quarter 2017 Results CFO Commentary February 1, 2017 A reconciliation for non-gaap financial measures discussed in this commentary to the most directly comparable GAAP financial measures is provided
ITRON, INC. CONSOLIDATED STATEMENTS OF OPERATIONS
 , INC. CONSOLIDATED STATEMENTS OF OPERATIONS (Unaudited, in thousands, except per share data) Revenues $ 523,335 $ 642,477 $ 2,178,178 $ 2,434,124 Cost of revenues 359,835 449,944 1,463,031 1,687,666 Gross
European Directories Group, European Directories Midco S.à r.l and European Directories BondCo S.C.A Interim report January-June August 2015
 European Directories Group, European Directories Midco S.à r.l and European Directories BondCo S.C.A Interim report January-June 31 August Interim report January-June (Comparative numbers in brackets)
ITRON, INC. CONSOLIDATED STATEMENTS OF OPERATIONS
 , INC. CONSOLIDATED STATEMENTS OF OPERATIONS (Unaudited, in thousands, except per share data) Revenues $ 470,103 $ 489,353 $ 918,350 $ 964,148 Cost of revenues 351,532 326,312 661,580 646,572 Gross profit
EURAMAX HOLDINGS, INC. FIRST QUARTER 2015 FINANCIAL RESULTS
 EURAMAX HOLDINGS, INC. FIRST QUARTER 2015 FINANCIAL RESULTS Norcross, Georgia, May 14, 2015 Euramax Holdings, Inc. (the "Company"), a leading producer of metal and vinyl products sold to the residential
Leveraging Our Strengths
 Leveraging Our Strengths Second Quarterly Report for the Six Months Ended 2016 Management s Discussion and Analysis of Financial Conditions and Results of Operations For the second quarter and six months
UNITED STATES SECURITIES AND EXCHANGE COMMISSION Washington D.C FORM 6-K. Report of Foreign Private Issuer
 UNITED STATES SECURITIES AND EXCHANGE COMMISSION Washington D.C. 20549 FORM 6-K Report of Foreign Private Issuer Pursuant to Rule 13a-16 or 15d-16 of the Securities Exchange Act of 1934 For the month of
Three Months Ended September 30, 2015 Revenues $ 16,523 $ 18,675 Increase in revenues year over year 20% 13%
 Exhibit 99.1 Alphabet Announces Third Quarter 2015 Results of Google Revenues of $18.7 billion and revenue growth of 13% year over year; constant currency revenue growth of 21% year over year Substantial
CRITEO REPORTS RECORD RESULTS FOR THE FOURTH QUARTER AND FISCAL YEAR 2017
 CRITEO REPORTS RECORD RESULTS FOR THE FOURTH QUARTER AND FISCAL YEAR 2017 NEW YORK - February 14, 2018 - Criteo S.A. (NASDAQ: CRTO), the leading commerce marketing technology company, today announced financial
CONSOLIDATED FINANCIAL STATEMENTS
 CONSOLIDATED FINANCIAL STATEMENTS FOR THE YEAR ENDED 31 DECEMBER ENDESA, S.A. AND SUBSIDIARIES CONSOLIDATED STATEMENTS OF FINANCIAL POSITION AT 31 DECEMBER AND 31 DECEMBER ASSETS 31 December 31 December
GCL Holdings Group. Company presentation 9M 2015 results
 GCL Holdings Group Company presentation 9M results November 27, Forward-looking Statements This presentation may include, and the Company and its representatives may from time to time make, written or
FLEX RECONCILIATION OF GAAP TO NON-GAAP FINANCIAL MEASURES (In thousands, except per share amounts)
") FLEX RECONCILIATION OF GAAP TO NON-GAAP FINANCIAL MEASURES (In thousands, except per share amounts) Q1 FY18 Q2 FY18 Q3 FY18 Q4 FY18 Q1 FY19 Q2 FY19 GAAP gross profit $ 406,932 6.8% $ 393,325 6.3% $ 446,328
FLEX RECONCILIATION OF GAAP TO NON-GAAP FINANCIAL MEASURES (In thousands, except per share amounts) Q1 FY18 Q2 FY18 Q3 FY18 Q4 FY18 Q1 FY19 Q2 FY19 GAAP gross profit $ 406,932 6.8% $ 393,325 6.3% $ 446,328
Albéa Beauty Holdings S.A.
 Condensed unaudited interim consolidated financial statements for the periods ended June 30, 2014 and June 30, 2013 CONSOLIDATED INCOME STATEMENTS The notes are an integral part of these condensed interim
Atento. Fiscal 2017 Second Quarter Results. August 15, 2017
 Atento Fiscal 2017 Second Quarter Results August 15, 2017 Investor Relations Shay Chor Shay.chor@atento.com Felipe Joaquim Martins de Souza Felipe.souza@atento.com 1 Disclaimer This presentation has been
Itron, Inc. Comparison of Key 2015 Financial Metrics to Preliminary Results Announced February 17, Total operating expenses 486, ,839
 Itron, Inc. Comparison of Key 2015 Financial Metrics to Preliminary Results Announced February 17, 2016 (Unaudited, in thousands, except per share data) (announced Feb. 17, 2016) Preliminary FY 2015 Final
FAIR ISAAC CORPORATION CONDENSED CONSOLIDATED BALANCE SHEETS (In thousands) (Unaudited)
 (Unaudited)") CONDENSED CONSOLIDATED BALANCE SHEETS (In thousands) June 30, September 30, 2018 2017 ASSETS: Current assets: Cash and cash equivalents $ 119,929 $ 105,618 Accounts receivable, net 182,419 168,586 Prepaid
CONDENSED CONSOLIDATED BALANCE SHEETS (In thousands) June 30, September 30, 2018 2017 ASSETS: Current assets: Cash and cash equivalents $ 119,929 $ 105,618 Accounts receivable, net 182,419 168,586 Prepaid
FAIR ISAAC CORPORATION CONDENSED CONSOLIDATED BALANCE SHEETS (In thousands) (Unaudited)
 (Unaudited)") CONDENSED CONSOLIDATED BALANCE SHEETS (In thousands) 2018 2017 ASSETS: Current assets: Cash and cash equivalents $ 90,023 $ 105,618 Accounts receivable, net 208,865 168,586 Prepaid expenses and other current
CONDENSED CONSOLIDATED BALANCE SHEETS (In thousands) 2018 2017 ASSETS: Current assets: Cash and cash equivalents $ 90,023 $ 105,618 Accounts receivable, net 208,865 168,586 Prepaid expenses and other current
Interim Report. For the three and nine months ended 30 September Ardagh Packaging Holdings Limited
 Interim Report For the three and nine months ended 30 September TABLE OF CONTENTS Selected financial information... 2 Operating and financial review... 3 Page UNAUDITED CONDENSED CONSOLIDATED INTERIM FINANCIAL
NEIMAN MARCUS GROUP LTD LLC REPORTS FOURTH QUARTER AND FISCAL YEAR 2015 RESULTS
 FOR IMMEDIATE RELEASE CONTACT: Stacie Shirley Senior Vice President Finance and Treasurer (214) 757-2967 Mark Anderson Director Finance (214) 757-2934 NEIMAN MARCUS GROUP LTD LLC REPORTS FOURTH QUARTER
CRITEO REPORTS STRONG RESULTS FOR THE THIRD QUARTER 2016
 CRITEO REPORTS STRONG RESULTS FOR THE THIRD QUARTER 2016 NEW YORK - November 2, 2016 - Criteo S.A. (NASDAQ: CRTO), the performance marketing technology company, today announced financial results for the
Financial Statements. Alpargatas S.A. December 31, 2013 with Independent Auditor s Report
 Financial Statements Alpargatas S.A. with Independent Auditor s Report Financial statements and 2012 Contents Independent auditor s report on financial statements... 1 Audited financial statements Balance
UNITED STATES SECURITIES AND EXCHANGE COMMISSION WASHINGTON, D.C FORM 10-Q. For the quarterly period ended November 3, OR -
 UNITED STATES SECURITIES AND EXCHANGE COMMISSION WASHINGTON, D.C. 20549 FORM 10-Q (Mark One) x QUARTERLY REPORT PURSUANT TO SECTION 13 OR 15(d) OF THE SECURITIES EXCHANGE ACT OF 1934 For the quarterly
HERSHEY CO ( HSY ) 10 Q Quarterly report pursuant to sections 13 or 15(d) Filed on 8/11/2010 Filed Period 7/4/2010
 10 Q Quarterly report pursuant to sections 13 or 15(d) Filed on 8/11/2010 Filed Period 7/4/2010") HERSHEY CO ( HSY ) 100 CRYSTAL A DRIVE HERSHEY, PA, 17033 0810 717 534 4200 www.thehersheycompany.com 10 Q Quarterly report pursuant to sections 13 or 15(d) Filed on 8/11/ Filed Period 7/4/ UNITED STATES
HERSHEY CO ( HSY ) 100 CRYSTAL A DRIVE HERSHEY, PA, 17033 0810 717 534 4200 www.thehersheycompany.com 10 Q Quarterly report pursuant to sections 13 or 15(d) Filed on 8/11/ Filed Period 7/4/ UNITED STATES
MOL GLOBAL, INC. (Exact name of Registrant as specified in its charter)
") UNITED STATES SECURITIES AND EXCHANGE COMMISSION Washington, D.C. 20549 Form 20-F/A Amendment No. 1 REGISTRATION STATEMENT PURSUANT TO SECTION 12(b) OR (g) OF THE SECURITIES EXCHANGE ACT OF 1934 Or x ANNUAL
UNITED STATES SECURITIES AND EXCHANGE COMMISSION Washington, D.C. 20549 Form 20-F/A Amendment No. 1 REGISTRATION STATEMENT PURSUANT TO SECTION 12(b) OR (g) OF THE SECURITIES EXCHANGE ACT OF 1934 Or x ANNUAL
Financial supplement NPM/CNP. Compagnie Nationale à Portefeuille Nationale PortefeuilleMaatschappij
 Financial supplement 2004 NPM/CNP Compagnie Nationale à Portefeuille Nationale PortefeuilleMaatschappij CONSOLIDATED ANNUAL ACCOUNTS Page Statutory auditor's report 2 Consolidated income statement 4 Consolidated
Selling, general and administrative expenses 35,645 33,787. Net other operating income (292) (270) Operating profit 44,202 17,756
 (270) Operating profit 44,202 17,756") Condensed Interim Consolidated Income Statement For the quarter ended September 30 Continuing operations Revenue 328,071 258,941 Cost of sales 248,516 207,668 Gross profit 79,555 51,273 Selling, general
Condensed Interim Consolidated Income Statement For the quarter ended September 30 Continuing operations Revenue 328,071 258,941 Cost of sales 248,516 207,668 Gross profit 79,555 51,273 Selling, general
AMERICAN TOWER CORPORATION REPORTS SECOND QUARTER 2017 FINANCIAL RESULTS
 AMERICAN TOWER CORPORATION REPORTS SECOND QUARTER 2017 FINANCIAL RESULTS CONSOLIDATED HIGHLIGHTS Second Quarter 2017 Total revenue increased 15.3% to $1,662 million Property revenue increased 14.9% to
UNITED STATES SECURITIES AND EXCHANGE COMMISSION FORM 6-K. LUXOTTICA GROUP S.p.A.
 UNITED STATES SECURITIES AND EXCHANGE COMMISSION WASHINGTON, D.C. 20549 FORM 6-K REPORT OF FOREIGN PRIVATE ISSUER PURSUANT TO RULE 13a-16 OR 15d-16 UNDER THE SECURITIES EXCHANGE ACT OF 1934 For the quarter
Lincoln Financing Holdings Pte. Limited
 Lincoln Financing Holdings Pte. Limited Q4 results 23 March 2017 This report provides the unaudited combined accounts for Lincoln Financing Holdings Pte. Limited (the Company ), its finance subsidiary
GCL Holdings Group. Company presentation 1Q 2014 results
 GCL Holdings Group Company presentation 1Q 2014 results Alessandria, May 29, 2014 Forward-looking Statements This presentation may include, and the Company and its representatives may from time to time
VISTEON CORPORATION AND SUBSIDIARIES CONSOLIDATED STATEMENTS OF OPERATIONS (Dollars in Millions, Except Per Share Data) (Unaudited)
 (Unaudited)") CONSOLIDATED STATEMENTS OF OPERATIONS (Dollars in Millions, Except Per Share Data) (Unaudited) Three Months Ended Six Months Ended June 30 June 30 2018 2017 2018 2017 Sales $ 758 $ 774 $ 1,572 $ 1,584
CONSOLIDATED STATEMENTS OF OPERATIONS (Dollars in Millions, Except Per Share Data) (Unaudited) Three Months Ended Six Months Ended June 30 June 30 2018 2017 2018 2017 Sales $ 758 $ 774 $ 1,572 $ 1,584
CHICAGO BRIDGE & IRON COMPANY N.V.
 UNITED STATES SECURITIES AND EXCHANGE COMMISSION WASHINGTON, D.C. 20549 FORM 10-Q x QUARTERLY REPORT PURSUANT TO SECTION 13 OR 15(d) OF THE SECURITIES EXCHANGE ACT OF 1934 For the quarterly period ended
DANA HOLDING CORPORATION Quarterly Financial Information and Reconciliations of Non-GAAP Financial Measures
 Quarterly Financial Information and Reconciliations of Non-GAAP Financial Measures Non-GAAP Financial Measures Adjusted EBITDA is a non-gaap financial measure which we have defined as earnings from continuing
HARLAND CLARKE HOLDINGS CORP. REPORTS FOURTH QUARTER AND FULL YEAR 2007 RESULTS
 HARLAND CLARKE HOLDINGS CORP. REPORTS FOURTH QUARTER AND FULL YEAR 2007 RESULTS Harland Clarke Holdings Corp. to Participate in M & F Worldwide Corp. Conference Call on March 5, 2008 Decatur, GA February
Leveraging Our Strengths
 Leveraging Our Strengths First Quarterly Report for the Three Months Ended March 31, 2016 Management s Discussion and Analysis of Financial Conditions and Results of Operations For the three months ended
Zodiac Pool Solutions S.à r.l.
 The attached unaudited narrative report (the Narrative Report ) for the 12 months ended 2017 has been prepared by Zodiac Pool Solutions S.à r.l. pursuant to the Zodiac group s credit agreements. Zodiac
Atento Fiscal 2016 First Quarter Results
 Atento Fiscal 2016 First Quarter Results May 10, 2016 Lynn Antipas Tyson Vice President Investor Relations +1-914-485-1150 lynn.tyson@atento.com 1 Disclaimer This presentation has been prepared by Atento.
Group Income Statement For the year ended 31 March 2016
 Group Income Statement For the year ended 31 March Note Pre exceptionals Exceptionals (note 2.6) Pre exceptionals Exceptionals (note 2.6) Continuing operations Revenue 2.1 10,601,085 10,601,085 10,606,080
Quarterly Report to Noteholders. LSF9 Balta Issuer S.à r.l. Senior Secured Notes due Q Period Ended September 30, 2017
 LSF9 Balta Issuer S.à r.l. Quarterly Report to Noteholders Senior Secured Notes due 2022 Q3 2017 Period Ended September 30, 2017 LSF9 Balta Issuer S.à r.l. Registered office: 5, rue Guillaume Kroll, L-1882
Second Quarter 2017 Reconciliation of Non-GAAP Financial Measures
 Second Quarter 2017 Reconciliation of Non-GAAP Financial Measures Adjusted Operating Income Reconciliation Adjusted operating income is not a measure of financial performance under generally accepted accounting
 o o o o - - - - - 1. INTERIM CONSOLIDATED INCOME STATEMENTS (in millions of euros) 2017 2016 REVENUE 2,510 2,312 Cost of sales (1,475) (1,337) GROSS PROFIT 1,035 975 Distribution and marketing
LATAM AIRLINES GROUP S.A. AND SUBSIDIARIES CONSOLIDATED FINANCIAL STATEMENTS DECEMBER 31, 2014 (FREE TRANSLATION) CONTENTS
 CONTENTS") LATAM AIRLINES GROUP S.A. AND SUBSIDIARIES CONSOLIDATED FINANCIAL STATEMENTS DECEMBER 31, 2014 (FREE TRANSLATION) CONTENTS Consolidated Statement of Financial Position Consolidated Statement of Income
LATAM AIRLINES GROUP S.A. AND SUBSIDIARIES CONSOLIDATED FINANCIAL STATEMENTS DECEMBER 31, 2014 (FREE TRANSLATION) CONTENTS Consolidated Statement of Financial Position Consolidated Statement of Income
Verint Systems Inc. and Subsidiaries Supplemental Information About Non-GAAP Financial Measures
 Verint Systems Inc. and Subsidiaries Supplemental Information About Non-GAAP Financial Measures The following tables include a reconciliation of certain financial measures consisting of non-gaap revenue,