UNITED STATES SECURITIES AND EXCHANGE COMMISSION Washington, D.C
|
|
|
- Bernice Douglas
- 5 years ago
- Views:
Transcription
1 UNITED STATES SECURITIES AND EXCHANGE COMMISSION Washington, D.C FORM 6-K Report of Foreign Private Issuer Pursuant to Rule 13a-16 or 15d-16 of the Securities Exchange Act of 1934 For the month of June, 2018 Commission File Number Atento S.A. (Translation of Registrant's name into English) 4, rue Lou Hemmer, L-1748 Luxembourg Findel Grand Duchy of Luxembourg (Address of principal executive office) Indicate by check mark whether the registrant files or will file annual reports under cover of Form 20-F or Form 40-F. Form 20-F: xform 40-F: o Indicate by check mark if the registrant is submitting the Form 6-K in paper as permitted by Regulation S-T Rule 101(b)(1): Yes: ono: x Note: Regulation S-T Rule 101(b)(1) only permits the submission in paper of a Form 6-K if submitted solely to provide an attached annual report to security holders. Indicate by check mark if the registrant is submitting the Form 6-K in paper as permitted by Regulation S-T Rule 101(b)(7): Yes: ono: x Note : Regulation S-T Rule 101(b)(7) only permits the submission in paper of a Form 6-K if submitted to furnish a report or other document that the registrant foreign private issuer must furnish and make public under the laws of the jurisdiction in which the registrant is incorporated, domiciled or legally organized (the registrant s home country ), or under the rules of the home country exchange on which the registrant s securities are traded, as long as the report or other document is not a press release, is not required to be and has not been distributed to the registrant s security holders, and, if discussing a material event, has already been the subject of a Form 6-K submission or other Commission filing on EDGAR.
2 ATENTO S.A. INDEX Financial Information For the Three and Six Months Ended June 30, 2018 PART I - PRESENTATION OF FINANCIAL AND OTHER INFORMATION 3 SELECTED HISTORICAL FINANCIAL INFORMATION 6 SUMMARY CONSOLIDATED HISTORICAL FINANCIAL INFORMATION 7 MANAGEMENT S DISCUSSION AND ANALYSIS OF FINANCIAL CONDITION AND RESULTS OF OPERATIONS 12 UNAUDITED INTERIM CONDENSED CONSOLIDATED FINANCIAL INFORMATION FOR THE SIX MONTHS ENDED JUNE 30, PART II - OTHER INFORMATION 59 LEGAL PROCEEDINGS 59 RISK FACTORS 59
3 PART I - PRESENTATION OF FINANCIAL AND OTHER INFORMATION Atento S.A. ( Atento, the Company, we or the Organization ) was formed as a direct subsidiary of Atalaya Luxco Topco S.C.A. ( Topco ). In April 2014, Topco also incorporated Atalaya Luxco PIKCo S.C.A. ( PikCo ) and on May 15, 2014 Topco contributed to PikCo: (i) all of its equity interests in its then direct subsidiary, Atalaya Luxco Midco S.à.r.l. ( Midco ), the consideration for which was an allocation to PikCo s account capital contributions not remunerated by shares (the Reserve Account ) equal to 2 million, resulting in Midco becoming a direct subsidiary of PikCo; and (ii) all of its debt interests in Midco (comprising three series of preferred equity certificates (the Original Luxco PECs )), the consideration for which was the issuance by PikCo to Topco of preferred equity certificates having an equivalent value. On May 30, 2014, Midco authorized the issuance of, and PikCo subscribed for, a fourth series of preferred equity certificates (together with the Original Luxco PECs, the Luxco PECs ). In connection with the completion of Atento s initial public offering (the IPO ) in October 2014, Topco transferred its entire interest in Midco ( 31,000 of share capital) to PikCo, the consideration for which was an allocation of 31,000 to PikCo s Reserve Account. PikCo then contributed all of the Luxco PECs to Midco (the Contribution ), the consideration for which was an allocation to Midco s Reserve Account equal to the value of the Luxco PECs immediately prior to the Contribution. Upon completion of the Contribution, the Luxco PECs were capitalized by Midco. PikCo then transferred the remainder of its interest in Midco ( 12,500 of share capital) to the Company, in consideration for which the Company issued two new shares of its capital stock to PikCo. The difference between the nominal value of these shares and the value of Midco s net equity will be allocated to the Company s share premium account. As a result of this transfer, Midco became a direct subsidiary of the Company. The Company completed a share split (the Share Split ) whereby it issued approximately 2, ordinary shares for each ordinary share outstanding as of September 3, The foregoing is collectively referred as the Reorganization Transaction. On October 7, 2014, we completed our IPO and issued 4,819,511 ordinary shares at a price of $15.00 per share. As a result of the IPO, the Share Split and the Reorganization Transaction, we had 73,619,511 ordinary shares outstanding and owned 100% of the issued and outstanding share capital of Midco, as of November 9, On August 4, 2015, our Board of Directors ( the Board ) approved a share capital increase and issued 131,620 shares, increasing the number of outstanding shares to 73,751,131. On July 28, 2016, the Board approved a share capital increase and issued 157,925 shares, increasing the number of outstanding shares to 73,909,056. AcquisitionandDivestmentTransactions On August 4, 2016, the Company through its direct subsidiary Atento Teleservicios España entered into an agreement (the Share Sale and Purchase Agreement ) with Intelcia Group, S.A. for the sale of 100% of Atento Morocco S.A., encompassing Atento s operations in Morocco providing services to the Moroccan and French markets (the Morocco Transaction ). The Morocco Transaction was consummated on September 30, 2016, upon receipt of regulatory approval. Atento s operations in Morocco, which provide services to the Spanish market, are excluded from the Morocco Transaction and will continue operating as part of Atento Spain. On September 2, 2016, the Company through its direct subsidiary Atento Brasil acquired 81.49%, the controlling interest of RBrasil Soluções S.A. (RBrasil). On May 9, 2017, we announced an extended partnership with Itaú, a leading financial institution in Brazil, through which we will leverage the industry-leading capabilities of RBrasil and Atento Brasil S.A. ( Atento Brasil ) to serve Itaú s increasing demand for end-to-end collections solutions, customer service and back office services. On June 9, 2017, the Company, through its subsidiary, Atento Brasil, acquired 50,00002% of Interfile Serviços de BPO Ltda. and 50,00002% of Interservicer Serviços em Crédito Imobiliário Ltda. (jointly, Interfile ), a leading provider of BPO services and solutions, including credit origination, for the banking and financial services sector in Brazil. Through this acquisition, we expect to be able to expand our capabilities in the financial services segment, especially in credit origination, accelerate our penetration into higher valueadded solutions, strengthen our leadership position in the Brazilian market and facilitate the expansion of our credit origination segment into other Latin American markets. 3
4 On June 30, 2017, we announced the signing of a strategic partnership and the acquisition of a minority stake in Keepcon, a leading provider of semantic technology-based automated customer experience management, through our subsidiary Contact US Teleservices Inc. The acquisition of a minority stake in Keepcon follows our overall strategy to develop and expand our digital capabilities. Our goal is to integrate all of our digital assets to generate additional value for clients and drive growth across verticals and geographies. We aim to turn the business disruption generated by the digital revolution into differentiated customer experience solutions generating competitive advantages for customers. We expect that the investment in Keepcon will expand the artificial intelligence and automatization capabilities of our omnichannel platform. OtherTransactions On August 10, 2017, Atento completed a renegotiation transaction of its financing structure throughout its subsidiary Atento Luxco 1. The new financing structure implied an offering of US$400.0 million aggregate principal amount of 6.125% Senior Secured Notes due 2022 (the Offering ). Atento used the net proceeds from the Offering, together with cash on hand, to redeem all of the Issuer s outstanding 7.375% Senior Secured Notes due 2020 and all of the existing debentures due 2019 of its subsidiary Atento Brasil. The Senior Secured Notes are guaranteed on a senior secured basis by certain of Atento s wholly-owned subsidiaries on a joint and several basis. On August 18, 2017, Atento filed a Form F-3 with the SEC, for up to $200,000,000 Ordinary Shares and 62,660,015 Ordinary Shares Offered by the selling shareholder. In consequence, the selling shareholder may offer and sell from time to time up to 62,660,015 of Ordinary Shares, covered by the Form F-3. These Ordinary Shares will be offered in amounts, at prices and on terms to be determined at the time of their offering, if any. On September 21, 2017, the Board of Directors approved a dividend policy for the Company with a goal of paying annual cash dividends pay-out in line with industry peers and practices. The declaration and payment of any interim dividends will be subject to approval of Atento s corporate bodies and will be determined based upon, amongst other things, Atento s performance, growth opportunities, cash flow, contractual covenants, applicable legal requirements and liquidity factors. The Board of Directors intends to review the dividend policy regularly and so accordingly is subject to change at any time. On October 31, 2017, our Board of Directors declared a cash interim dividend with respect to the ordinary shares of $ per share paid on November 28, 2017 to shareholders of record as of the close on November 10, On November 13, 2017, Atento filed a Supplemental Prospectus with the SEC, for the selling of 12,295,082 ordinary shares within the Offer dated on August 18, 2017, through its selling shareholder PikCo. After the completion of this follow on Offer the selling shareholder owns 50,364,933 ordinary shares in Atento, representing 68.14% of its share stake. Exchange Rate Information In this Interim Report, all references to U.S. dollar and $ (USD) are to the lawful currency of the United States and all references to Euro or are to the single currency of the participating member states of the European and Monetary Union of the Treaty Establishing the European Community, as amended from time to time. In addition, all references to Brazilian Reais or R$ (BRL), Mexican Peso (MXN), Chilean Peso (CLP), Argentinean Peso (ARS), Colombian Peso (COP) and Peruvian Nuevos Soles (PEN) are to the lawful currencies of Brazil, Mexico, Chile, Argentina, Colombia and Peru, respectively. The following table shows the exchange rates of the U.S. dollar to these currencies for the periods and dates indicated as reported by the relevant central banks of the European Union and each country, as applicable. 4
5 Average six Average six Average FY December 31 Average Q2 June 30 Average Q2 months months Euro (EUR) Brazil (BRL) Mexico (MXN) Colombia (COP) 2, , , , , , , , Chile (CLP) Peru (PEN) Argentina (ARS) June 30
6 SELECTED HISTORICAL FINANCIAL INFORMATION The consolidated financial information of Atento are the consolidated results of operations of Atento for the three and six months ended June 30, 2017 and We present our historical financial information under International Financial Reporting Standards ( IFRS ) as issued by the International Accounting Standards Board (the IASB ). The unaudited interim condensed consolidated financial information for the six months ended June 30, 2018 (the interim condensed consolidated financial information ) have been prepared in accordance with International Accounting Standard ( IAS ) 34 - Interim Financial Reporting. As described in Note 4 of the interim condensed consolidated financial information, included elsewhere in this document, the accounting policies adopted in preparation of this interim condensed consolidated financial information are consistent with those followed in the preparation of the consolidated annual financial statements for the year ended December 31, 2017, except for the IFRS 15 and IFRS 9 adopted since January 1, Rounding Certain numerical figures set out in this Interim Report, including financial data presented in millions or thousands and percentages, have been subject to rounding adjustments, and, as a result, the totals of the data in this Interim Report may vary slightly from the actual arithmetic totals of such data. Percentages and amounts reflecting changes over time periods relating to financial and other data set forth in Summary Consolidated Historical Financial Information and Management s Discussion and Analysis of Financial Condition and Results of Operations are calculated using the numerical data in the financial statements or the tabular presentation of other data (subject to rounding) contained in this Interim Report, as applicable, and not using the numerical data in the narrative description thereof. 6
7 SUMMARY CONSOLIDATED HISTORICAL FINANCIAL INFORMATION The following tables present a summary of the consolidated historical financial information for the periods as of the dates indicated and should be read in conjunction with the section of this document entitled Management s Discussion and Analysis of Financial Condition and Results of Operations and Selected Historical Financial Information included elsewhere in this document. As of and for the three months Change As of and for the six months ended June 30, excluding FX ended June 30, ($ in millions) Change (%) (%) (unaudited) (unaudited) Change (%) Change excluding FX (%) Revenue (0.1) (Loss)/profit from continuing operations (3.7) 4.0 N.M. N.M (56.4) (50.3) (Loss)/profit for the period (3.7) 4.0 N.M. N.M (56.4) (50.3) EBITDA (1) Adjusted EBITDA (1) (6.5) (7.0) (2.6) Adjusted Earnings (2) (6.5) Adjusted Earnings per share (in U.S. dollars) (3) (6.5) Adjusted Earnings attributable to Owners of the parent (2) (10.3) Adjusted Earnings per share attributable to Owners of the parent (in U.S. dollars) (3) (10.3) Payments for acquisition of property, plant, equipment and intangible assets (4) (22.8) (12.5) (45.4) (42.6) (36.9) (28.9) (21.7) (16.4) Total Debt (12.3) (6.6) (12.3) (6.6) Cash and cash equivalents (27.2) (22.8) (27.2) (22.8) Net debt with third parties (5) (6.9) (0.7) (6.9) (0.7) Balance sheet data: Total assets 1, , , ,256.8 Equity Capital stock Number of shares 73,909,056 73,909,056 73,909,056 73,909,056 N.M. means not meaningful (1) In considering the financial performance of the business, our management analyzes the financial performance measures of EBITDA and Adjusted EBITDA at a company and operating segment level, to facilitate decision-making. EBITDA is defined as profit/(loss) for the period from continuing operations before net finance expense, income taxes and depreciation and amortization. Adjusted EBITDA is defined as EBITDA adjusted to exclude certain acquisition and integration related costs, restructuring costs, sponsor management fees, asset impairments, site relocation costs, financing fees, and other items not related to our core results of operations. EBITDA and Adjusted EBITDA are not measures defined by IFRS. The most directly comparable IFRS measure to EBITDA and Adjusted EBITDA is profit/(loss) for the year/period from continuing operations. We believe EBITDA and Adjusted EBITDA are useful metrics for investors to understand our results of continuing operations and profitability because they permit investors to evaluate our recurring profitability from underlying operating activities. We also use these measures internally to establish forecasts, budgets and operational goals to manage and monitor our business, as well as to evaluate our underlying historical performance. We believe EBITDA facilitates comparisons of operating performance between periods and among other companies in industries similar to ours because it removes the effect of variances in capital structures, taxation, and non-cash depreciation and amortization charges, which may differ between companies for reasons unrelated to operating performance. We believe Adjusted EBITDA better reflects our underlying operating performance because it excludes the impact of items which are not related to our core results of continuing operations. 7
8 EBITDA and Adjusted EBITDA measures are frequently used by securities analysts, investors and other interested parties in their evaluation of companies comparable to us, many of which present EBITDA-related performance measures when reporting their results. EBITDA and Adjusted EBITDA have limitations as analytical tools. These measures are not presentations made in accordance with IFRS, are not measures of financial condition or liquidity and should not be considered in isolation or as alternatives to profit or loss for the period from continuing operations or other measures determined in accordance with IFRS. EBITDA and Adjusted EBITDA are not necessary comparable to similarly titled measures used by other companies. These non-gaap measures should be considered supplemental in nature and should not be construed as being more important than comparable GAAP measures. See below under the heading Reconciliation of EBITDA and Adjusted EBITDA to profit/(loss) for a reconciliation of profit/(loss) for the periods from continuing operations to EBITDA and Adjusted EBITDA. (2) In considering the Company s financial performance, our management analyzes the performance measure of Adjusted Earnings. Adjusted Earnings is defined as profit/(loss) for the periods from continuing operations adjusted for certain amortization of acquisition related intangible assets, restructuring costs, asset impairments and other nonordinary expenses, site relocation costs, net foreign exchange impacts and their tax effects. Adjusted Earnings is not a measure defined by IFRS. The most directly comparable IFRS measure to Adjusted Earnings is profit/(loss) for the periods from continuing operations. We believe Adjusted Earnings is a useful metric for investors and is used by our management for measuring profitability because it represents a group measure of performance which excludes the impact of certain non-cash charges and other charges not associated with the underlying operating performance of the business, while including the effect of items that we believe affect shareholder value and in-year returns, such as income tax expense and net finance costs. Our management uses Adjusted Earnings to (i) provide senior management with monthly reports of our operating results; (ii) prepare strategic plans and annual budgets; and (iii) review senior management s annual compensation, in part, using adjusted performance measures. Adjusted Earnings is defined to exclude items that are not related to our core results of operations. Adjusted Earnings measures are frequently used by securities analysts, investors and other interested parties in their evaluation of companies comparable to us, many of which present an Adjusted Earnings related performance measure when reporting their results. Adjusted Earnings has limitations as an analytical tool. Adjusted Earnings is neither a presentation made in accordance with IFRS nor a measure of financial condition or liquidity and should not be considered in isolation or as an alternative to profit or loss for the period from continuing operations or other measures determined in accordance with IFRS. Adjusted Earnings is not necessarily comparable to similarly titled measures used by other companies. These non-gaap measures should be considered supplemental in nature and should not be construed as being more important than comparable GAAP measures. See below under the heading Reconciliation of Adjusted Earnings to profit/(loss) for a reconciliation of Adjusted Earnings to our profit/(loss) for the period from continuing operations. (3) Adjusted Earnings per share is calculated based on weighted average number of ordinary shares outstanding of 73,909,056 as of June 30, 2017 and (4) Payments for acquisition of property, plant, equipment and intangible assets represent the cash disbursement for the period. ( 5 ) In considering our financial condition, our management analyzes net debt with third parties, which is defined as total debt less cash, cash equivalents (net of any outstanding bank overdrafts) and short-term financial investments. Net debt with third parties has limitations as an analytical tool. Net debt with third parties is neither a measure defined by or presented in accordance with IFRS nor a measure of financial performance and should not be considered in isolation or as an alternative financial measure determined in accordance with IFRS. Net debt with third parties is not necessarily comparable to similarly titled measures used by other companies. These non-gaap measures should be considered supplemental in nature and should not be construed as being more important than comparable GAAP measures. See below under the heading Financing Arrangements for a reconciliation of total debt to net debt with third parties utilizing IFRS reported balances obtained from the financial information included elsewhere in this Interim Report. The most directly comparable IFRS measure to net debt with third parties is total debt. 8
9 Reconciliation of EBITDA and Adjusted EBITDA to profit/(loss): For the three months ended June 30, For the six months ended June 30, ($ in millions) (unaudited) (Loss)/profit from continuing operations (3.7) Net finance expense Income tax expense 7.3 (0.5) Depreciation and amortization EBITDA (non-gaap) (unaudited) Restructuring costs (a) Other (b) Total non-recurring items (*) Adjusted EBITDA (non-gaap) (unaudited) (*) We define non-recurring items as items that are limited in number, clearly identifiable, unusual, are unlikely to be repeated in the near future in the ordinary course of business and that have a material impact on the consolidated results of operations. Non-recurring items can be summarized as demonstrated below: (a) (b) Restructuring costs primarily included restructuring activities and other personnel costs that were not related to our core results of operations. Restructuring costs for the three and six months ended June 30, 2017, primarily relates to the costs to adapt the organization in Argentina and Brazil to the lower level of activities and the investments made in Brazil, Mexico and Spain to implement a lower-cost operating model. Other non-recurring items for three and six months ended June 30, 2017, mainly refer to consulting and other non-recurring costs. 9
10 Reconciliation of Adjusted Earnings to profit/(loss): For the three months ended June 30, For the six months ended June 30, ($ in millions) (unaudited) (Loss)/profit from continuing operations (3.7) Amortization of acquisition related intangible assets (a) Restructuring costs (b) (*) Other (c) (*) Change in fair value of financial instruments (d) 0.3 (9.0) 0.3 (5.9) Net foreign exchange gain/(loss) Tax effect (e) (2.0) (3.8) (5.4) (6.1) Total of add-backs Adjusted Earnings (non-gaap) (unaudited) Adjusted Earnings per share (in U.S. dollars) (**) (unaudited) Adjusted Earnings attributable to Owners of the parent (non-gaap) (unaudited) Adjusted Earnings per share attributable to Owners of the parent (in U.S. dollars) (**) (unaudited) (*) We define non-recurring items as items that are limited in number, clearly identifiable, unusual, are unlikely to be repeated in the near future in the ordinary course of business and that have a material impact on the consolidated results of operations. Non-recurring items can be summarized as demonstrated below : (a) (b) (c) (d) (e) Amortization of acquisition related intangible assets represents the amortization expense of customer base, recorded as intangible assets. This customer base represents the fair value (within the business combination involving the acquisition of control of Atento Group) of the intangible assets arising from service agreements (tacit or explicitly formulated in contracts) with Telefónica Group and with other customers. Restructuring costs primarily included restructuring activities and other personnel costs that were not related to our core results of operations. Restructuring costs for the three and six months ended June 30, 2017, primarily relates to the costs to adapt the organization in Argentina and Brazil to the lower level of activities and the investments made in Brazil, Mexico and Spain to implement a lower-cost operating model. Other non-recurring items for three and six months ended June 30, 2017, mainly refer to consulting and other non-recurring costs. Since April 1, 2015, the Company designated the foreign currency risk on certain of its subsidiaries as net investment hedges using financial instruments as the hedging items. As a consequence, any gain or loss on the hedging instrument, related to the effective portion of the hedge is recognized in other comprehensive income (equity) as from that date. The gains or losses related to the ineffective portion are recognized in the statements of operations and for comparability, and those adjustments are added back to calculate Adjusted Earnings. The tax effect represents the impact of the taxable adjustments based on tax nominal rate by country. For the three months ended June 30, 2017 and 2018, the effective tax rate after moving non-recurring items was 49.0% and 17.6%, respectively. For the six months ended June 30, 2017 and 2018, the effective tax rate after moving nonrecurring items is 42.7% and 32.9%, respectively. (* * ) Adjusted Earnings per share is calculated based on the weighted average number of ordinary shares outstanding of 73,909,056 as of June 30, 2017 and
11 Financing Arrangements Certain of our debt agreements contain financial ratios as instruments to monitor the Company s financial condition and as preconditions to certain transactions (e.g. the incurrence of new debt, permitted payments). The following is a brief description of the financial ratios. 1. Gross Leverage Ratio (applies to Atento S.A.) measures the level of gross debt to EBITDA, as defined in the debt agreements. The contractual ratio indicates that the gross debt should not surpass 2.8 times the EBITDA for the last twelve months. As of June 30, 2018, the current ratio was 2.2 times. This financial covenant only acts as a restriction for certain actions (e.g. issue a new debt) and, if breached, will not trigger a default or an event of default. 2. Fixed Charge Coverage Ratio (applies to Atento S.A.) measures the Company s ability to pay interest expenses and dividends (fixed charges) in relation to EBITDA, as described in the debt agreements. The contractual ratio indicates that the EBITDA for the last twelve months should represent at least 2 times the fixed charge of the same period. As of June 30, 2018, the current ratio was 5.5 times. This financial covenant only acts as a restriction for certain actions (e.g. issue a new debt) and, if breached, will not trigger a default or an event of default. 3. Net Debt Brazilian Leverage Ratio (applies only to Brazil) measures the level of net debt (gross debt, less cash and cash equivalents) to EBITDA each as defined in debt agreements. The contractual ratio indicates that Brazil net debt should not surpass 2.0 times the Brazilian EBITDA. As of June 30, 2018, the current ratio was 0.6 times. The Company regularly monitors all financial ratios under the debt agreements. As of June 30, 2018, we were in compliance with the terms of our covenants. Net debt with third parties as of June 30, 2017 and 2018 is as follow: As of June 30, ($ in millions, except Net Debt/Adj. EBITDA LTM) (unaudited) Cash and cash equivalents Debt: Senior Secured Notes Brazilian Debentures BNDES Finance Lease Payables Other Borrowings Total Debt Net Debt with third parties (1) (unaudited) Adjusted EBITDA LTM (2) (non-gaap) (unaudited) Net Debt/Adjusted EBITDA LTM (non-gaap) (unaudited) 1.8x 1.7x (1) In considering our financial condition, our management analyzes Net debt with third parties, which is defined as total debt less cash and cash equivalents. Net debt with third parties is not a measure defined by IFRS and it has limitations as an analytical tool. Net debt with third parties is neither a measure defined by or presented in accordance with IFRS nor a measure of financial performance, and should not be considered in isolation or as an alternative financial measure determined in accordance with IFRS. Net debt is not necessarily comparable to similarly titled measures used by other companies. (2) Adjusted EBITDA LTM (Last Twelve Months) is defined as EBITDA adjusted to exclude restructuring costs, site relocation costs and other items not related to our core results of operations. 11
12 CAUTIONARY NOTE REGARDING FORWARD LOOKING STATEMENTS This Form 6-K providing quarterly and annual information contains forward-looking statements within the meaning of Section 27A of the Securities Act of 1933, Section 21E of the Securities Exchange Act of 1934, and the Private Securities Litigation Reform Act of 1995, relating to our operations, expected financial position, results of operation, and other business matters that are based on our current expectations, assumptions, and projections with respect to the future, and are not a guarantee of performance. In this Report, when we use words such as may, believe, plan, will, anticipate, estimate, expect, intend, project, would, could, target, or similar expressions, or when we discuss our strategy, plans, goals, initiatives, or objectives, we are making forward-looking statements. We caution you not to rely unduly on any forward-looking statements. Actual results may differ materially from what is expressed in the forward-looking statements, and you should review and consider carefully the risks, uncertainties and other factors that affect our business and may cause such differences. The forward-looking statements are based on information available as of the date that this Form 6-K furnished with the United States Securities and Exchange Commission ( SEC ) and we undertake no obligation to update them. Such forward looking statements are based on numerous assumptions and developments that are not within our control. Although we believe these forward-looking statements are reasonable, we cannot assure you they will turn out to be correct. MANAGEMENT S DISCUSSION AND ANALYSIS OF FINANCIAL CONDITION AND RESULTS OF OPERATIONS The following discussion and analysis of our financial condition and the results of operations is based upon and should be read in conjunction with the consolidated financial information of Atento. Factors which could cause or contribute to such difference, include, but are not limited to, those discussed elsewhere in this Report, particularly under Cautionary Statement with respect to Forward-Looking Statements and the section entitled Risk Factors in the Form 20-F. Overview Atento is the largest provider of customer-relationship management and business-process outsourcing ( CRM BPO ) services and solutions in Latin America ( LatAm ) and Spain, and the third largest provider by revenue globally. Atento s tailored CRM BPO solutions are designed to enable our client s ability to deliver a high-quality product by creating a best-in-class experience for their customers, enabling our clients to focus on operating their core businesses. Atento utilizes its industry expertise commitment to customer care, and consultative approach, to offer superior and scalable solutions across the entire value chain for customer care, customizing each solution to the individual client s needs. In the third quarter of 2016 we announced a refreshed strategy to drive long-term profitable growth and create shareholder value. Recent market trends, including the macroeconomic pull-back in Brazil (the largest CRM BPO market in Latin America), and the accelerating adoption of omni-channel and digital capabilities, prompted us to reexamine the priorities that support our long-term strategy. The ultimate goal of this exercise, or Strategy Refresh, was to ensure we had the right focus and capabilities to capitalize on industry trends in Latin America and leverage our scale and financial strength to selectively broaden and diversify in key verticals, countries, and solutions. We offer a comprehensive portfolio of customizable, and scalable, solutions including front and back-end services ranging from sales, applications-processing, customer care and credit-management. We leverage our deep industry knowledge and capabilities to provide industry-leading solutions to our clients. We provide our solutions to over 400 clients via over 154,000 highly engaged customer care specialists facilitated by our best-in-class technology infrastructure and multi-channel delivery platform. We believe we bring a differentiated combination of scale, capacity for processing client s transactions, and industry expertise to our client s customer care operations, which allow us to provide higherquality and lower cost customer care services than our clients could deliver on their own. 12
13 We operate in 13 countries worldwide and organize our business into three geographic markets: (i) Brazil, (ii) Americas, excluding Brazil ( Americas ) and (iii) EMEA. For the six months ended June 30, 2018, Brazil accounted for 47.7% of our revenue, Americas accounted for 39.9% of our revenue and EMEA accounted for 13.0% of our revenue (in each case, before holding company level revenue and consolidation adjustments). For the three months ended June 30, 2018, Brazil accounted for 46.7% of our revenue, Americas accounted for 40.9% of our revenue and EMEA accounted for 13.0% of our revenue (in each case, before holding company level revenue and consolidation adjustments). Our number of workstations increased from 89,809 as of June 30, 2017 to 93,403 as of June 30, Generally, our competitors have higher EBITDA and depreciation expense than us because we lease rather than own all of our call center facilities (e.g., buildings and related equipment), except for IT infrastructure that is supported by Atento and depreciated. The following table shows the number of workstations and delivery centers in each of the jurisdictions in which we operated as of June 30, 2017 and 2018: Number of Workstations Number of Service Delivery Centers (1) Brazil 47,650 49, Americas 36,533 38, Argentina (2) 4,151 4, Central America (3) 2,334 2, Chile 2,561 2, Colombia 7,857 8, Mexico 10,011 9, Peru 8,309 9, United States (4) 1,310 1, EMEA 5,626 5, Spain 5,626 5, Total 89,809 93, (1) Includes service delivery centers at facilities operated by us and those owned by our clients where we provide operations personnel and workstations. (2) Includes Uruguay. (3) Includes Guatemala and El Salvador. (4) Includes Puerto Rico. For the three and six months ended June 30, 2018, revenue generated from our 15 largest client groups represented 74.1% and 75.1% of our revenue, respectively, as compared to 77.0% and 77.8%, respectively, in the same period in the prior year. Excluding revenue generated from the Telefónica Group, for the three and six months ended June 30, 2018 our next 15 largest client groups represented 36.3% and 37.4%, respectively, as compared to 38.1% and 38.7%, respectively, in the same period in the prior year. Our vertical industry expertise in telecommunications, financial services and multi-sector companies allows us to adapt our services and solutions for our clients, further embedding us into their value chain while delivering effective business results and increasing the portion of our client s services related to CRM BPO. For the six months ended June 30, 2018, CRM BPO solutions and individual services comprised approximately 25.7% and 74.3% of our revenue, respectively. For the same period in 2017, CRM BPO solutions and individual services comprised approximately 26.1% and 73.9% of our revenue, respectively. For the three months ended June 30, 2018, CRM BPO solutions and individual services comprised approximately 26.4% and 73.6% of our revenue, respectively. For the three months ended June 30, 2017, CRM BPO solutions and individual services comprised approximately 26.3% and 73.7% of our revenue, respectively. 13
14 During the six months ended June 30, 2018, telecommunications represented 46.5% of our revenue and financial services represented 33.4% of our revenue, compared to 47.5% and 33.1%, respectively, for the same period in Additionally, during the six months ended June 30, 2017 and 2018 the sales by service were: For the six months ended June 30, Customer Service 50.9% 50.9% Sales 17.6% 17.0% Collection 9.1% 7.9% Back Office 9.9% 13.0% Technical Support 8.8% 7.5% Others 3.7% 3.7% Total 100.0% 100.0% During the three months ended June 30, 2018, telecommunications represented 46.8% of our revenue and financial services represented 33.3% of our revenue, compared to 47.7% and 32.6%, respectively, for the same period in Additionally, during the three months ended June 30, 2017 and 2018 the sales by service were: For the three months ended June 30, Customer Service 51.7% 51.3% Sales 18.8% 17.8% Collection 8.6% 7.8% Back Office 8.3% 12.6% Technical Support 9.0% 6.8% Others 3.6% 3.7% Total 100.0% 100.0% Averageheadcount The average headcount in the Atento Group in the six months ended June 30, 2017 and 2018, is presented as follows: June 30, (unaudited) Brazil 78,479 81,274 Central America 4,927 5,238 Chile 5,205 5,777 Colombia 9,616 8,990 Spain 10,124 11,081 Mexico 18,200 17,623 Peru 16,144 14,557 Puerto Rico United States Argentina and Uruguay 7,194 8,431 Corporate Total 151, ,003 14
15 Consolidated Statements of Operations for the Three and Six Months Ended June 30, 2017 and 2018 ($ in millions, except percentage changes) For the three months ended Change For the six months ended June June 30, excluding FX 30, Change (%) (%) (unaudited) (unaudited) Change (%) Change excluding FX (%) Revenue (0.1) Other operating income (28.4) (21.5) (13.1) (5.3) Operating expenses: Supplies (17.5) (17.1) (2.4) 5.8 (34.3) (34.7) Employee benefit expenses (355.1) (357.2) (700.8) (724.7) Depreciation (11.1) (8.2) (26.5) (21.1) (22.9) (19.5) (14.9) (12.0) Amortization (12.3) (15.4) (25.9) (30.4) Changes in trade provisions (22.8) (24.4) - (0.1) N.M. N.M. Other operating expenses (63.5) (56.1) (11.6) (4.9) (119.3) (113.3) (5.0) (1.2) Total operating expenses (459.3) (453.9) (1.2) 5.9 (903.2) (922.8) Operating profit Finance income (69.3) (65.9) (62.3) (60.4) Finance costs (16.0) (12.3) (22.8) (19.3) (33.5) (27.0) (19.5) (16.8) Change in fair value of financial instruments (0.3) 9.0 N.M. N.M. (0.3) 5.9 N.M. N.M. Net foreign exchange loss (4.3) (19.0) N.M. N.M. (0.9) (21.8) N.M. N.M. Net finance expense (19.1) (21.9) (31.1) (41.5) Profit before income tax (0.7) (55.1) (52.7) Income tax (expense)/benefit (7.3) 0.5 (106.3) (106.2) (11.1) (5.1) (54.5) (53.8) (Loss)/profit for the period (3.7) 4.0 N.M. N.M (56.4) (50.3) (Loss)/profit attributable to: Owners of the parent (3.9) 3.3 N.M. N.M (74.9) (71.9) Non-controlling interest N.M. N.M N.M. N.M. (Loss)/profit for the period (3.7) 4.0 N.M. N.M (56.4) (50.3) Other financial data: EBITDA (1) (unaudited) Adjusted EBITDA (1) (unaudited) (6.5) (7.0) (2.6) (1) For reconciliation with IFRS as issued by IASB, see section "Summary Consolidated Historical Financial Information - Reconciliation of EBITDA and Adjusted EBITDA to profit/(loss)". N.M. means not meaningful 15
16 ($ in millions, except percentage changes) Revenue: Consolidated Statements of Operations by Segment for the Three and Six Months Ended June 30, 2017 and 2018 For the three months ended June 30, Change Excluding For the six months ended June 30, Change (%) FX (%) (unaudited) Change (%) Change Excluding FX (%) Brazil (5.3) (2.5) 4.8 Americas EMEA Other and eliminations (1) (0.6) (2.7) N.M. N.M. (1.0) (5.8) N.M. N.M. Total revenue (0.1) Operating expenses: Brazil (227.6) (218.3) (4.1) 7.3 (447.6) (449.2) Americas (175.9) (184.3) (342.8) (368.0) EMEA (54.1) (59.9) (109.0) (123.4) Other and eliminations (1) (1.7) 8.5 N.M. N.M. (3.8) 17.8 N.M. N.M. Total operating expenses (459.3) (453.9) (1.2) 5.9 (903.2) (922.8) Operating profit/(loss) : Brazil (76.8) (73.7) (65.3) (62.7) Americas EMEA (25.6) (31.7) Other and eliminations (1) (2.3) 5.9 N.M. N.M. (4.8) 12.1 N.M. N.M. Total operating profit Net finance expense : Brazil (9.2) (9.3) (17.3) (18.2) Americas (1.7) (6.2) N.M. N.M. (3.4) (10.4) N.M. N.M. EMEA (2.5) (0.9) (64.2) (67.2) (5.8) (1.0) (83.0) (84.9) Other and eliminations (1) (5.7) (5.5) (4.0) 7.3 (4.6) (11.9) N.M. N.M. Total net finance expense (19.1) (21.9) (31.1) (41.5) Income tax benefit/(expense): Brazil (1.7) 3.4 N.M. N.M. (3.9) 3.1 N.M. N.M. Americas (4.1) (0.9) (77.6) (78.1) (7.3) (3.6) (51.1) (52.7) EMEA (0.7) (0.6) (20.1) (31.8) (0.6) (0.6) 0.1 (11.7) Other and eliminations (1) (0.8) (1.4) (4.0) N.M. N.M. Total income tax (expense)/benefit (7.3) 0.5 (106.3) (106.2) (11.1) (5.1) (54.5) (53.8) Profit/(loss) from continuing operations: Brazil 2.5 (2.8) N.M. N.M (4.0) (136.8) (139.1) Americas EMEA (2.0) 0.3 (116.2) (114.0) (3.3) 0.7 (121.8) (118.9) Other and eliminations (1) (8.8) (1.0) (88.3) (87.8) (8.7) (3.8) (56.4) (54.2) (Loss)/profit from continuing operations (3.7) 4.0 N.M. N.M (56.4) (50.3) Profit/(loss) for the period: Brazil 2.5 (2.8) N.M. N.M (4.0) (136.8) (139.1) Americas EMEA (2.0) 0.3 (116.2) (114.0) (3.3) 0.7 (121.8) (118.9) Other and eliminations (1) (8.8) (1.0) (88.3) (87.8) (8.7) (3.8) (56.4) (54.2) (Loss)/profit for the period (3.7) 4.0 N.M. N.M (56.4) (50.3) Profit/(loss) attributable to: Owners of the parent (3.9) 3.3 N.M. N.M (74.9) (71.9) Non-controlling interest N.M. N.M N.M. N.M. Other financial data: EBITDA (2) : Brazil (41.0) (33.4) (37.1) (32.4) Americas EMEA (2.8) (12.7) Other and eliminations (1) (2.2) 6.2 N.M. N.M. (4.5) 12.5 N.M. N.M. Total EBITDA (unaudited) Adjusted EBITDA (2) : Brazil (33.4) (24.8) (27.7) (22.2) Americas EMEA Other and eliminations (1) (1.7) (2.1) (4.0) (4.7) Total Adjusted EBITDA (unaudited) (6.5) (7.0) (2.6) (1) Included revenue and expenses at the holding-company level (such as corporate expenses and acquisition related expenses), as applicable, as well as consolidation adjustments. (2) For reconciliation with IFRS as issued by IASB, see section "Summary Consolidated Historical Financial Information - Reconciliation of EBITDA and Adjusted EBITDA to profit/(loss)".
17 N.M. means not meaningful 16
18 Three Months Ended June 30, 2017 Compared to Three Months Ended June 30, 2018 Revenue Revenue decreased by $ 0.3 million, or 0.1%, from $473.7 million for the three months ended June 30, 2017 to $473.4 million for the three months ended June 30, Excluding the impact of foreign exchange, revenue increased 7.2%. Multisector continues to drive growth, with a revenue increase of $1.6 million, or 0.6%, from $286.6 million for the three months ended June 30, 2017 to $288.3 million for the three months ended June 30, Excluding the impact of foreign exchange, revenue from multisector clients increased 9.1%, supported by gains in all regions and across several verticals. Revenue from Telefónica decreased by $1.9 million, or 1.0%, from $187.1 million for the three months ended June 30, 2017 to $185.2 million for the three months ended June 30, Excluding the impact of foreign exchange, revenue from Telefónica clients increased 4.4%, due to higher volumes in Brazil and Americas, partially offset by lower volumes in Spain. For the three months ended June 30, 2018, revenue from multisector clients was 60.9% of total revenue, compared to 60.5% for the three months ended June 30, 2017, an increase of 0.4 percentage point. The following chart sets forth a breakdown of revenue by geographical region for the three months ended June 30, 2017 and 2018 and as a percentage of revenue and the percentage change between those periods with and net of foreign exchange effects. ($ in millions, except percentage changes) For the three months ended June 30, 2017 (%) 2018 (%) Change (%) (unaudited) (unaudited) Change excluding FX (%) Brazil (5.3) 6.3 Americas EMEA Other and eliminations (1) (0.6) (0.1) (2.7) (0.6) N.M. N.M. Total (0.1) 7.2 (1) Includes holding company level revenues and consolidation adjustments. 17
19 Brazil Revenue in Brazil for the three months ended June 30, 2017 and 2018 was $233.5 million and $221.2 million, respectively, a decrease of $12.3 million, or 5.3%. Excluding the impact of foreign exchange, revenue increased by 6.3%, while revenue from multisector clients increased by 6.6%, supported by financial services and telecom clients other than Telefónica. Operational performance was in line with expectations, and reflects Atento's solid conversion of the commercial pipeline in the quarter, with new client wins across several verticals. Excluding the impact of foreign exchange, revenue from Telefónica increased by 5.4%, due to higher volumes. Americas Revenue in Americas for the three months ended June 30, 2017 and 2018 was $185.7 million and $193.5 million, respectively, an increase of $7.8 million, or 4.2%. Excluding the impact of foreign exchange, revenue increased 11.0%. Excluding the impact of foreign exchange, revenue from multisector clients increased by 14.1%, supported by higher volumes in Argentina, Chile and Mexico. Likewise, revenue from Telefónica increased by 6.9%, driven by higher volumes in Argentina, Mexico and Chile. EMEA Revenue in EMEA for the three months ended June 30, 2017 and 2018 was $55.1 million and $61.4 million, respectively, an increase of $6.3 million, or 11.4%. Excluding the impact of foreign exchange, revenue increased 2.9%. Excluding the impact of foreign exchange, revenue from multisector clients increased by 12.3%, supported by higher volumes from telecom clients other than Telefónica, more than offsetting the 2.3% drop in revenue from Telefónica reflecting lower volumes in the region. Other operating income Other operating income totaled $8.3 million for the three months ended June 30, 2017 and $5.9 million for the three months ended June 30, 2018, which includes $5.1 million of partial insurance indemnity from Puerto Rico. Total operating expenses Total operating expenses decreased by $ 5.4 million, or 1.2%, from $459.3 million for the three months ended June 30, 2017 to $453.9 million for the three months ended June 30, Excluding the impact of foreign exchange, operating expenses increased by 5.9%, mainly in Brazil (variable and fixed costs related to new clients/services acquired during 2017) and higher activity in Americas (mainly, Argentina, Chile and Mexico). As a percentage of revenue, operating expenses represented 97.0% and 95.9% for the three months ended June 30, 2017 and 2018, respectively. Excluding the impact of foreign exchange, operating expenses as a percentage of revenue, was maintained at the same level as in the three months ended June 30, Supplies: Supplies expenses decreased by $0.4 million, or 2.4%, from $17.5 million for the three months ended June 30, 2017 to $17.1 million for the three months ended June 30, Excluding the impact of foreign exchange, supplies expenses increased by 5.8% mainly due to higher activity in Americas and EMEA. As a percentage of revenue, supplies represented 3.6% for both the three months ended June 30, 2017 and Employeebenefitexpenses: Employee benefit expenses increased by $2.1 million, or 0.6%, from $355.1 million for the three months ended June 30, 2017 to $357.2 million for the three months ended June 30, Excluding the impact of foreign exchange, employee benefit expenses increased by 7.7%, mainly in Brazil (variable and fixed costs related to new clients acquired along last year and higher labor expenses as per new collective agreement signed on the second half of 2017) and Americas (higher activity mainly in Argentina, Chile and Mexico). As a percentage of revenue, employee benefit expenses represented 75.0% and 75.5% for the three months ended June 30, 2017 and 2018, respectively. Depreciationandamortization: Depreciation and amortization expenses increased by $0.2 million, or 0.8%, from $23.4 million for the three months ended June 30, 2017 to $23.6 million for the three months ended June 30, Excluding the impact of foreign exchange, depreciation and amortization expense increased by 7.1%, mainly related to the new investments to support the Revenue growth. Changesintradeprovisions: Changes in trade provisions remained at $ 0.2 million for the three months ended June 30, 2017 and
20 Otheroperatingexpenses: Other operating expenses decreased by $7.4 million, or 11.6%, from $63.5 million for the three months ended June 30, 2017 to $56.1 million for the three months ended June 30, Excluding the impact of foreign exchange, other operating expenses decreased by 4.9%. As a percentage of revenue, other operating expenses totaled 13.4% and 11.9% for the three months ended June 30, 2017 and 2018, respectively. Brazil Total operating expenses in Brazil decreased by $9.3 million, or 4.1%, from $227.6 million for the three months ended June 30, 2017 to $218.3 million for the three months ended June 30, Excluding the impact of foreign exchange, operating expenses in Brazil increased by 7.3%, mainly due to higher employee benefit expenses from the collective agreement signed on the second half of 2017, that increased by 9.5%. Operating expenses as a percentage of revenue increased percentage points from 97.5% to 98.7%, for the three months ended June 30, 2017 and 2018, respectively. Americas Total operating expenses in Americas increased by $8.4 million, or 4.8%, from $175.9 million for the three months ended June 30, 2017 to $184.3 million for the three months ended June 30, Excluding the impact of foreign exchange, operating expenses increased by 11.8%, reflecting the higher activity and increase in revenues. Operating expenses as a percentage of revenue increased from 94.7% to 95.2%, for the three months ended June 30, 2017 and 2018, respectively. EMEA Total operating expenses in EMEA increased by $5.8 million, or 10.7%, from $54.1 million for the three months ended June 30, 2017 to $59.9 million for the three months ended June 30, Excluding the impact of foreign exchange, operating expenses increased by 2.1%, impacted by an increase of 3.8% in employee benefit expenses. Operating expenses as a percentage of revenue decreased points from 98.2% to 97.5%, for the three months ended June 30, 2017 and 2018, respectively. Operating profit Operating profit increased by $2.8 million, from $22.7 million for the three months ended June 30, 2017 to $25.5 million for the three months ended June 30, Excluding the impact of foreign exchange, operating profit increased 24.9%. Operating profit margin increased or 0.5 percentage points from 4.8% for the three months ended June 30, 2017 to 5.4% for the three months ended June 30, Brazil Operating profit in Brazil decreased by $10.3 million, from $13.4 million for the three months ended June 30, 2017 to $3.1 million for the three months ended June 30, Excluding the impact of foreign exchange, operating profit decreased by 73.7%. Operating profit margin in Brazil decreased from 5.7% for three months ended June 30, 2017 to 1.4% for the three months ended June 30, 2018, reflecting the continued implementation of the operation improvement plan, with profitability expected to improve in the second half of Americas Operating profit in Americas increased by $4.3 million, from $10.4 million for the three months ended June 30, 2017 to $14.7 million for the three months ended June 30, Excluding the impact of foreign exchange, operating profit increased by 49.0%, reflecting higher volumes from multisector clients. Operating profit margin improved from 5.6% for the three months ended June 30, 2017 to 7.6% for the three months ended June 30, EMEA Operating profit in EMEA increased by $0.6 million, from $1.2 million for the three months ended June 30, 2017 to $1.8 million for the three months ended June 30, Excluding the impact of foreign exchange, operating profit increased by 44.3%. Operating profit margin improved from 2.2% to 2.9%, reflecting higher volumes from Multisector clients, especially telecom clients other than Telefónica. 19
21 Finance income Finance income was $0.5 million for the three months ended June 30, 2018, compared to $1.5 million for the three months ended June 30, Excluding the impact of foreign exchange, finance income decreased by 65.9% during the three months ended June 30, 2018 mainly due to lower average cash position. Finance costs Finance costs decreased by $3.7 million, or 22.8%, from $16.0 million for the three months ended June 30, 2017 to $12.3 million for the three months ended June 30, Excluding the impact of foreign exchange, finance costs decreased by 19.3% during the three months ended June 30, The decrease in finance costs was driven by the debt refinancing concluded in August Change in fair value of financial instruments Changes in fair value of financial instruments increased by $9.3 million, from a loss of $0.3 million for the three months ended June 30, 2017 to a gain of $ 9.0 million for the three months ended June 30, This gain is related to positive effect on BRL-USD Cross Currency Swap Mark-to-Market impact due to Brazilian Reais currency devaluation. Net foreign exchange gain/(loss) Net foreign exchange loss changed by $14.7 million, from a loss of $4.3 million for the three months ended June 30, 2017 to a loss of $19.0 million for the three months ended June 30, This loss in the three months ended June 30, 2018 was mainly due to Brazilian Reais and Argentinian Peso depreciations against the U.S. dollar that impacted our intercompany balances and therefore has no significant effect on cash. Income tax expense Income tax expense for the three months ended June 30, 2017 and 2018 was an expense of $7.3 million and a benefit of $0.5 million, respectively. This change is due to nondeductible costs occurred in our holding companies in Profit/(loss) for the period Loss for the three months ended June 30, 2017 was a $3.7 million and, for the three months ended June 30, 2018, we had a profit of $4.0 million, as a result of the factors discussed above. EBITDA and Adjusted EBITDA EBITDA increased by $3.0 million, or 6.4%, from $46.1 million for the three months ended June 30, 2017 to $49.1 million for the three months ended June 30, For the same period, Adjusted EBITDA decreased by $3.4 million, or 6.5%, from $52.5 million for the three months ended June 30, 2017 to $49.1 million for the three months ended June 30, Our Adjusted EBITDA is defined as EBITDA adjusted to exclude the restructuring costs, site relocation costs, asset impairments and other items which are not related to our core results of operations. See Summary Consolidated Historical Financial Information for a reconciliation of EBITDA and Adjusted EBITDA to profit/(loss). Excluding the impact of foreign exchange, EBITDA increased by 15.6% as a result of higher margins in Americas and EMEA, offset by lower margins in Brazil. Excluding the impact of foreign exchange, Adjusted EBITDA increased by 1.5%. Brazil EBITDA in Brazil decreased by $10.7 million, or 41.0%, from $26.2 million for the three months ended June 30, 2017 to $15.5 million for the three months ended June 30, For the same period, Adjusted EBITDA decreased by $9.6 million, or 33.4%, from $28.7 million to $19.1 million. Profitability is on track to expected improvements in second half of 2018, and includes about 0.2 percentage points from costs related to operacional adjustments to specific programs, and volume reduction due to truck drivers strike. Excluding the impact of foreign exchange, EBITDA decreased by 33.4% and Adjusted EBITDA decreased by 24.8%. This drop in Adjusted EBITDA reflects higher employee benefit expenses from the collective agreement signed on the second half of 2017 combined with the continued implementation of the operational improvement plan in the quarter, with profitability expected to improve in the second half of 2018, with the plan to still have some impact in the third quarter of the year. The difference between EBITDA and Adjusted EBITDA for the three months ended June 30, 2018 is due to the exclusion of items that were not related to our core results of operation, most of them related to corporate charges among our subsidiaries, that are eliminated at consolidated level. 20
22 Americas EBITDA in Americas increased by $4.3 million, or 22.7%, from $18.9 million for the three months ended June 30, 2017 to $23.2 million for the three months ended June 30, For the same period, Adjusted EBITDA increased by $4.4 million, or 20.2%, from $21.7 million to $26.1 million. Excluding the impact of foreign exchange, EBITDA increased by $5.0 million, or 27.2%, and Adjusted EBITDA increased by $5.3 million, or 25.6% respectively. The increase in Adjusted EBITDA and EBITDA was mostly driven by the strong revenue growth from multisector clients. Americas benefited from insurance reimbursement of cumulative losses related to Puerto Rico hurricane, offseting lower volumes from domestic operations not totally restated to prior year levels. The difference between EBITDA and Adjusted EBITDA for the three months ended June 30, 2018 is due to the exclusion of items that were not related to our core results of operation, most of them related to corporate charges between the countries, that are eliminated at consolidated level. EMEA EBITDA in EMEA increased by $1.0 million, from $ 3.2 million for the three months ended June 30, 2017 to $4.2 million for the three months ended June 30, For the same period, Adjusted EBITDA increased by 57.0%, from $3.8 million to $6.0 million. Excluding the impact of foreign exchange, EBITDA increased during this period by $ 0.9 million, while Adjusted EBITDA increased by $ 2.0 million, or 49.7%, reflecting higher volumes from Multisector clients, especially telecom clients other than Telefónica. The difference between EBITDA and Adjusted EBITDA for the three months ended June 30, 2018 is due to the exclusion of items that were not related to our core results of operation, most of them related to corporate charges between the countries, that are eliminated at consolidated level. 21
23 Six Months Ended June 30, 2017 Compared to Six Months Ended June 30, 2018 Revenue Revenue increased by $ 22.1 million, or 2.3%, from $941.7 million for the six months ended June 30, 2017 to $963.8 million for the six months ended June 30, Excluding the impact of foreign exchange, revenue increased 5.8%. Multisector continues to deliver a solid growth, with a revenue increase of $22.2 million, or 3.9%, from $567.0 million for the six months ended June 30, 2017 to $589.2 million for the six months ended June 30, Excluding the impact of foreign exchange, revenue from multisector clients increased 8.5%, supported by gains in all regions. Revenue from Telefónica remained almost the same, contributing with $374.6 million in revenue for the six months ended June 30, 2018, against $374.7 million in the six months ended June 30, Excluding the impact of foreign exchange, revenue from Telefónica clients increased by 1.8%, due to higher volumes in Brazil and Americas, partially offset by lower volumes in Spain. For the six months ended June 30, 2018, revenue from multisector clients was 61.1% of total revenue, compared to 60.2% for the six months ended June 30, 2017, an increase of 0.9 percentage point. The following chart sets forth a breakdown of revenue by geographical region for the six months ended June 30, 2017 and 2018 and as a percentage of revenue and the percentage change between those periods with and net of foreign exchange effects. For the six months ended June 30, ($ in millions, except percentage changes) 2017 (%) 2018 (%) Change (%) Change excluding FX (%) (unaudited) (unaudited) Brazil (2.5) 4.8 Americas EMEA Other and eliminations (1) (1.0) (0.1) (5.8) (0.6) N.M. N.M. Total (1) Includes holding company level revenues and consolidation adjustments. 22
24 Brazil Revenue in Brazil for the six months ended June 30, 2017 and 2018 totaled $471.8 million and $460.1 million, respectively, a decrease of $11.7 million, or 2.5%. Excluding the impact of foreign exchange, revenue increased by 4.8%, while revenue from multisector clients increased by 5.5%, supported by higher volumes across several verticals. Operational performance was in line with expectations, and reflects Atento's solid conversion of the commercial pipeline in the second quarter, with new client wins across several verticals. And revenue from Telefónica increased by 3.3% on higher volumes. Americas Revenue in Americas for the six months ended June 30, 2017 and 2018 was $359.1 million and $384.1 million, respectively, an increase of $25.0 million, or 7.0%. Excluding the impact of foreign exchange, revenue increased 10.4%. Excluding it and the impact of foreign exchange, revenue from multisector clients increased by 14.9%, supported by higher volumes in Argentina, Chile and Mexico. On the same way, revenue from Telefónica increased by 4.3%, also driven by higher volumes in Argentina, Mexico and Chile. EMEA Revenue in EMEA for the six months ended June 30, 2017 and 2018 was $111.8 million and $125.3 million, respectively, an increase of $13.5 million, or 12.1%. Excluding the impact of foreign exchange, revenue from multisector clients increased by 10.0%, supported by supported by higher volumes from telecom clients other than Telefónica, offsetting the 5.3% drop in revenue from Telefónica. Other operating income Other operating income totaled $9.1 million and $7.9 million for the six months ended June 30, 2017 and 2018, respectively, which includes $5.1 million of partial insurance indemnity from Puerto Rico. Total operating expenses Total operating expenses increased by $ 19.6 million, or 2.2%, from $903.2 million for the six months ended June 30, 2017 to $922.8 million for the six months ended June 30, Excluding the impact of foreign exchange, operating expenses increased by 5.5%, in line with revenue growth, mainly in Brazil (variable and fixed costs related to new clients/ services acquired during 2017) and higher activity in Americas (mainly, Argentina, Chile and Mexico). As a percentage of revenue, operating expenses represented 95.9% and 95.7% for the six months ended June 30, 2017 and 2018, respectively. Excluding the impact of foreign exchange, operating expenses as a percentage of revenue, was maintained at the same level for the six months ended June 30, Supplies: Supplies expenses increased by $0.4 million, or 1.2%, from $34.3 million for the six months ended June 30, 2017 to $34.7 million for the six months ended June 30, Excluding the impact of foreign exchange, supplies expenses increased by 4.2%, mainly due to higher activity in Americas. As a percentage of revenue, supplies represented 3.6% for the six months ended June 30, 2017 and Employeebenefitexpenses: Employee benefit expenses increased by $23.9 million, or 3.4%, from $700.8 million for the six months ended June 30, 2017 to $724.7 million for the six months ended June 30, Excluding the impact of foreign exchange, employee benefit expenses increased by 6.8%, mainly in Brazil (variable and fixed costs related to new clients acquired along last year and higher labor expenses as per new collective agreement signed on the second half of 2017) and Americas (higher activity mainly in Argentina, Chile and Mexico). As a percentage of revenue, employee benefit expenses represented 74.4% and 75.2% for the six months ended June 30, 2017 and 2018, respectively. Depreciationandamortization: Depreciation and amortization expenses increased by $1.1 million, or 2.3%, from $48.8 million for the six months ended June 30, 2017 to $49.9 million for the six months ended June 30, Excluding the impact of foreign exchange, depreciation and amortization expense increased by 4.4%, mainly related to the new investments to support the revenue growth. Changesintradeprovisions:Changes in trade provisions increased by $0.1 million, from zero to a loss of $0.1 million for the six months ended June 30, 2017 and 2018 respectively. 23
25 Otheroperatingexpenses: Other operating expenses decreased by $6.0 million, or 5.0%, from $119.3 million for the six months ended June 30, 2017 to $113.3 million for the six months ended June 30, Excluding the impact of foreign exchange, other operating expenses decreased by 1.2%, mainly in Brazil. As a percentage of revenue, other operating expenses were 12.7% and 11.8% for the six months ended June 30, 2017 and 2018, respectively. Brazil Total operating expenses in Brazil increased by $1.6 million, or 0.4%, from $447.6 million for the six months ended June 30, 2017 to $449.2 million for the six months ended June 30, Excluding the impact of foreign exchange, operating expenses in Brazil increased by 7.9%, mainly due to higher variable and fixed costs (related to new clients acquired along 2017 and higher labor expenses as per new collective agreement signed on the second half of 2017). Operating expenses as a percentage of revenue increased from 94.9% to 97.6%, for the six months ended June 30, 2017 and 2018, respectively. Americas Total operating expenses in Americas increased by $25.2 million, or 7.4%, from $342.8 million for the six months ended June 30, 2017 to $368.0 million for the six months ended June 30, Excluding the impact of foreign exchange, operating expenses in Americas increased by 11.0%, mainly impacted by increase in supplies and employee benefit expenses that reflects the higher operating activity and increase in revenues. Operating expenses as a percentage of revenue increased from 95.5% to 95.8%, for the six months ended June 30, 2017 and 2018, respectively. EMEA Total operating expenses in EMEA increased by $14.4 million, or 13.2%, from $109.0 million for the six months ended June 30, 2017 to $123.4 million for the six months ended June 30, Excluding the impact of foreign exchange, operating expenses in EMEA increased by 1.1%. Operating expenses as a percentage of revenue increased from 97.5% to 98.5%, for the six months ended June 30, 2017 and 2018, respectively. Operating profit Operating profit increased by $1.3 million, from $47.6 million for the six months ended June 30, 2017 to $48.9 million for the six months ended June 30, 2018, an increase of 1.5%. Excluding the impact of foreign exchange, operating profit increased 8.8%. Operating profit margin was stable at 5.1% for the six months ended June 30, 2017 compared to 5.1% for the six months ended June 30, Brazil Operating profit in Brazil decreased by $21.0 million, from $32.1 million for the six months ended June 30, 2017 to $11.1 million for the six months ended June 30, Excluding the impact of foreign exchange, operating profit decreased by 62.7%, reflecting higher employee benefit expenses from the collective agreement signed on the second half of 2017 combined with the operational plan implemented during the first semester of Operating profit margin in Brazil decreased from 6.8% for six months ended June 30, 2017 to 2.4% for the six months ended June 30, Americas Operating profit in Americas increased by $6.2 million, from $17.2 million for the six months ended June 30, 2017 to $23.4 million for the six months ended June 30, Excluding the impact of foreign exchange, operating profit increased by 36.1%, reflecting higher volumes from multisector clients. Operating profit margin in Americas increased from 4.8% for the six months ended June 30, 2017 to 6.0% for the six months ended June 30, EMEA Operating profit in EMEA increased by $0.8 million, from $3.1 million for the six months ended June 30, 2017 to $2.3 million for the six months ended June 30, Operating profit margin decreased from 2.8% for the six months ended June 30, 2017 to 1.8% for the six months ended June 30,
26 Finance income Finance income was $1.4 million for the six months ended June 30, 2018, compared to $3.6 million for the six months ended June 30, Excluding the impact of foreign exchange, finance income decreased by 60.4% during the six months ended June 30, 2018 mainly due to lower average cash position. Finance costs Finance costs decreased by $6.5 million, or 19.5%, from $33.5 million for the six months ended June 30, 2017 to $27.0 million for the six months ended June 30, Excluding the impact of foreign exchange, finance costs decreased by 16.8% during the six months ended June 30, The decrease in finance costs was driven by the debt refinancing concluded in August Change in fair value of financial instruments Changes in fair value of financial instruments changed by $6.2 million, from a loss of $0.3 million for the six months ended June 30, 2017 to a gain of $5.9 million for the six months ended June 30, This gain is mainly related to positive effect on BRL-USD Cross Currency Swap Mark-to-Market impact due to the Brazilian Reais devaluation. Net foreign exchange gain/(loss) Net foreign exchange loss increased by $20.9 million, from a loss of $0.9 million for the six months ended June 30, 2017 to a loss of $21.8 million for the six months ended June 30, This loss was mainly due to Brazilian Reais and Argentinian Peso depreciations against the U.S. dollar that impacted our intercompany balances and therefore has no significant effect on cash. Income tax expense Income tax expense for the six months ended June 30, 2017 and 2018 totaled $11.1 million and $5.1 million, respectively. This change is due to nondeductible costs occurred in our holding companies in Profit for the period Profit for the six months ended June 30, 2017 and 2018 was $5.4 million and $2.4 million, respectively, as a result of the factors discussed above. EBITDA and Adjusted EBITDA EBITDA increased by $2.4 million, or 2.5%, from $96.4 million for the six months ended June 30, 2017 to $98.8 million for the six months ended June 30, For the same period, Adjusted EBITDA decreased by $7.4 million, or 7.0% from $106.2 million for the six months ended June 30, 2017 to 98.8 million for the six months ended June 30, Our Adjusted EBITDA is defined as EBITDA adjusted to exclude the, restructuring costs, site relocation costs, asset impairments and other items which are not related to our core results of operations. See Summary Consolidated Historical Financial Information for a reconciliation of EBITDA and Adjusted EBITDA to profit/(loss). Excluding the impact of foreign exchange, EBITDA increased by 6.6% and Adjusted EBITDA decreased by 2.6%, mainly driven by lower revenue in Brazil. Brazil EBITDA in Brazil decreased by $22.0 million, or 37.1%, from $59.4 million for the six months ended June 30, 2017 to $37.4 million for the six months ended June 30, For the same period, Adjusted EBITDA decreased by $17.5 million, or 27.7%, from $63.0 million to $45.5 million. Excluding the impact of foreign exchange, EBITDA decreased by 32.4% and Adjusted EBITDA decreased by 22.2%. Profitability is on track to expected improvements in second half of 2018, and includes about 0.2 percentage points from cost related to operational adjustments to specific programs, and volume reduction due to truck drivers strike. This drop in Adjusted EBITDA reflects higher employee benefit expenses from the collective agreement signed on the second half of 2017 combined with the continued implementation of the operational improvement plan in the quarter, with profitability expected to improve in the second half of 2018, with the plan to still have some impact in the third quarter of the year. The difference between EBITDA and Adjusted EBITDA for the three months ended March 31, 2018 is due to the exclusion of items that were not related to our core results of operation, most of them related to corporate charges between the countries, that are eliminated at consolidated level. 25
27 Americas EBITDA in Americas increased by $7.6 million, or 22.5%, from $33.9 million for the six months ended June 30, 2017 to $41.5 million for the six months ended June 30, For the same period, Adjusted EBITDA increased by $8.0 million, or 20.4%, from $39.1 million to $47.1 million. Excluding the impact of foreign exchange, EBITDA increased during this period by $7.5 million, or 22.0%, and Adjusted EBITDA increased $8.6 million, or 22.4%, respectively. The increase in Adjusted EBITDA and EBITDA reflects strong revenue growth from multisector clients. Americas benefited from insurance reimbursement of cumulative losses related to Puerto Rico hurricane, offseting lower volumes from domestic operations not totally restated to prior year levels. The difference between EBITDA and Adjusted EBITDA for the six months ended June 30, 2018 is due to the exclusion of items that were not related to our core results of operation, most of them related to corporate charges between the countries, that are eliminated at consolidated level. EMEA EBITDA in EMEA decreased by $0.2 million, or 2.8% from $7.6 million for the six months ended June 30, 2017 to $7.4 million for the six months ended June 30, For the same period, Adjusted EBITDA increased by 2.9 or 35.5%, from $8.1 million to $11.0 million. Excluding the impact of foreign exchange, EBITDA decreased during this period by $ 1.1 million or 12.7%, while Adjusted EBITDA increased by $ 1.9 million, or 21.5%. The increase in Adjusted EBITDA reflects higher volumes from Multisector clients, especially telecom clients other than Telefónica. The difference between EBITDA and Adjusted EBITDA for the six months ended June 30, 2018 is due to the exclusion of items that were not related to our core results of operation, most of them related to corporate charges between the countries, that are eliminated at consolidated level. Liquidity and Capital Resources As of June 30, 2018, our outstanding debt was $ million, which includes $ million of our 6.125% Senior Secured Notes due 2022, $ 16.4 million of Brazilian Debentures, $ 33.7 million of financing provided by BNDES, $ 7.3 million of finance lease payables and $ 22.9 million of other bank borrowings, especially short-term financing for working capital needs. During the three months ended June 30, 2018, our cash flow provided by operating activities was $49.5 million, which includes interest paid of $9.0 million. Our cash flow from operating activities, before giving effect to the payment of interest, was $58.5 million. During the six months ended June 30, 2018, our cash flow provided by operating activities was $9.5 million, which includes interest paid of $26.5 million. Our cash flow from operating activities, before giving effect to the payment of interest, was $36.0 million. 26
28 Consolidated Statements of Cash Flows for the Three and Six Months Ended June 30, 2017 and 2018 ($ MILLIONS, UNLESS OTHERWISE INDICATED) For the three months ended June 30, For the six months ended June 30, (unaudited) Operating activities Profit before income tax Adjustments to reconcile profit before income tax to net cash flows: Amortization and depreciation Impairment losses (0.2) (0.2) Change in provisions Grants released to income (0.1) (0.3) (0.2) (0.4) Losses on disposal of fixed assets Losses on disposal of financial assets Finance income (1.5) (0.5) (3.6) (1.4) Finance costs Net foreign exchange differences Change in fair value of financial instruments 0.3 (9.0) 0.3 (5.9) Changes in other (gains)/losses and own work capitalized 4.0 (1.6) 5.3 (0.4) Changes in working capital: Changes in trade and other receivables (21.6) 3.9 (56.3) (65.3) Changes in trade and other payables Other assets/(payables) (2.2) 5.8 (17.7) (2.0) (19.3) 16.3 (56.1) (53.9) Interest paid (15.9) (9.0) (31.9) (26.5) Interest received Income tax paid (4.4) (6.0) (10.1) (10.5) Other payments (2.3) (3.7) (10.8) (7.1) (21.5) (15.6) (49.4) (43.8) Net cash flows from operating activities Investing activities Payments for acquisition of intangible assets (16.3) (1.0) (20.1) (11.1) Payments for acquisition of property, plant and equipment (6.5) (11.5) (16.8) (17.8) Acquisition of subsidiaries, net of cash acquired (14.5) - (14.5) - Payments for financial instruments - (0.3) - (0.3) Proceeds from sale of PP&E and intangible assets Net cash flows used in investing activities (37.3) (12.1) (51.3) (28.7) Financing activities Proceeds from borrowing from third parties Repayment of borrowing from third parties (60.9) (22.6) (69.0) (56.4) Dividends paid to company's shareholders - (0.2) - (0.2) Net cash flows provided by/(used in) financing activities 3.1 (18.4) (3.0) (5.5) Net (decrease)/increase in cash and cash equivalents (23.4) 19.0 (52.8) (24.8) Exchange differences (1.3) (12.8) 5.1 (10.6) Cash and cash equivalents at beginning of period Cash and cash equivalents at end of period
29 Cash Flow As of June 30, 2018, we had cash and cash equivalents of $106.4 million. We believe that our current cash flow used in operating activities and financing arrangements will provide us with sufficient liquidity to meet our working capital needs. For the three months ended June 30, For the six months ended June 30, ($ in millions) (unaudited) Cash flows from operating activities Cash flows used in investing activities (37.3) (12.1) (51.3) (28.7) Cash flows provided by/(used in) financing activities 3.1 (18.4) (3.0) (5.5) Net (decrease)/increase in cash and cash equivalents (23.4) 19.0 (52.8) (24.8) Effect of changes in exchanges rates (1.3) (12.8) 5.1 (10.6) Cash Flows from Operating Activities ThreeandSixMonthsEndedJune30,2017ComparedtoThreeandSixMonthsEndedJune30,2018 Cash provided by operating activities was $49.5 million for the three months ended June 30, 2018 compared to $10.8 million for the three months ended June 30, This increase reflects a recovery from higher one-off negative changes in working capital during the three months ended March 31, For the six months ended June 30, 2018 cash provided by operating activities was $9.5 million compared to cash provided by operating activities of $1.5 million for the same period in the prior year. Cash Flows used in Investing Activities ThreeMonthsEndedJune30,2017ComparedtoThreeMonthsEndedJune30,2018 Cash used in investing activities was $ 12.1 million for the three months ended June 30, 2018 compared to cash used in investment activities of $ 37.3 million for the three months ended June 30, The variance is mainly due to the Interfile acquisition in SixMonthsEndedJune30,2017ComparedtoSixMonthsEndedJune30,2018 Cash used in investing activities was $ 28.7 million for the six months ended June 30, 2018 compared to cash used in investment activities of $ 51.3 million for the six months ended June 30, The variance is mainly due to the Interfile acquisition in Cash Flows provided by/(used in) Financing Activities ThreeandSixMonthsEndedJune30,2017ComparedtoThreeandSixMonthsEndedJune30,2018 Cash used in financing activities was $18.4 million for the three months ended June 30, 2018 compared to a cash provided by financing activities of $3.1 million for the three months ended June 30, For the six months ended June 30, 2018 cash used in financing activities was $5.5 million compared to $3.0 million for the same period in the prior year. This variance is mainly due to monthly contractual BNDES amortization, repayment of Santander Revolving Facility disbursements to finance working capital and semi-annual contractual Debentures amortization. 28
30 Finance leases ($ in millions) Finance leases The Company holds the following assets under finance leases: As of June 30, Net carrying amount of asset (unaudited) Net carrying amount of asset Plant and machinery Furniture, tools and other tangible assets Total ($ in millions) The present value of future finance lease payments is as follow: As of June 30, Net carrying amount of asset (unaudited) Net carrying amount of asset Up to 1 year Between 1 and 5 years Total Capital Expenditure Our business has significant capital expenditure requirements, including for the construction and initial fit-out of our service delivery centers; improvements and refurbishment of leased facilities for our service delivery centers; acquisition of various items of property, plant and equipment, mainly comprised of furniture, computer equipment and technology equipment; and acquisition and upgrades of our software or specific customer s software. The funding of the majority of our capital expenditure is covered by existing cash and EBITDA generation. The table below shows our capital expenditure by segment for the three and six months ended June 30, 2017 and For the three months ended June 30, For the six months ended June 30, ($ in millions) (unaudited) Brazil (*) Americas EMEA Total capital expenditure (*) For the three and six months ended June 30, 2017 the amount invested by the Company's principal capital expenditures does not include Interfile acquisition and the amount paid to extend the partnership with Itaú. The capital expenditures for the three and six months ended June 30, 2018 reflect the acquisition by Atento of the rights to use software s for the approximately amount of $38.5 million. Refer to Note 7 of the interim condensed consolidated financial information. 29
31 ATENTO S.A. AND SUBSIDIARIES UNAUDITED INTERIM CONDENSED CONSOLIDATED FINANCIAL INFORMATION FOR THE SIX MONTHS ENDED JUNE 30,
32 ATENTO S.A. AND SUBSIDIARIES INTERIM CONDENSED CONSOLIDATED STATEMENTS OF FINANCIAL POSITION As of December 31, 2017 and June 30, 2018 (In thousands of U.S. dollars, unless otherwise indicated) ASSETS Notes December 31, June 30, (audited) (unaudited) NON-CURRENT ASSETS 764, ,176 Intangible assets 230, ,245 Goodwill 153, ,951 Property, plant and equipment 152, ,321 Non-current financial assets 90,076 90,987 Trade and other receivables 11 21,677 14,035 Other non-current financial assets 11 60,222 63,343 Derivative financial instruments 12 8,177 13,609 Other taxes receivable 7,282 6,050 Deferred tax assets 131, ,622 CURRENT ASSETS 566, ,585 Trade and other receivables 410, ,021 Trade and other receivables , ,031 Current income tax receivable 21,969 24,990 Derivative financial instruments 12-1,115 Other taxes receivable 12,072 11,542 Other current financial assets 11 1,810 1,489 Cash and cash equivalents , ,418 TOTAL ASSETS 1,330,305 1,256,761 The accompanying notes are an integral part of the interim condensed consolidated financial information. 31
33 ATENTO S.A. AND SUBSIDIARIES INTERIM CONDENSED CONSOLIDATED STATEMENTS OF FINANCIAL POSITION As of December 31, 2017 and June 30, 2018 (In thousands of U.S. dollars, unless otherwise indicated) EQUITY AND LIABILITIES Notes December 31, June 30, (audited) (unaudited) TOTAL EQUITY 377, ,086 EQUITY ATTRIBUTABLE TO: NON-CONTROLLING INTEREST 9,476 9,339 OWNERS OF THE PARENT COMPANY 368, ,747 Share capital Reserve for acquisition of non-controlling interest 10 (23,531) (23,531) Share premium 639, ,140 Retained losses (94,535) (93,233) Translation differences (170,063) (184,008) Hedge accounting effects 9,594 7,695 Stock-based compensation 7,415 9,636 NON-CURRENT LIABILITIES 582, ,598 Deferred tax liabilities 43,942 35,868 Debt with third parties , ,245 Derivative financial instruments 12 5,140 3,850 Provisions and contingencies 13 61,186 56,147 Non-trade payables 8,094 17,646 Option for the acquisition of non-controlling interest 23,752 20,377 Other taxes payable 1,025 3,465 CURRENT LIABILITIES 369, ,077 Debt with third parties 12 46,560 59,078 Derivative financial instruments 12 1, Trade and other payables 302, ,731 Trade payables 94,078 86,361 Income tax payables 8,058 7,216 Other taxes payables 86,166 82,255 Other non-trade payables 114, ,899 Provisions and contingencies 13 19,068 15,718 TOTAL EQUITY AND LIABILITIES 1,330,305 1,256,761 The accompanying notes are an integral part of the interim condensed consolidated financial information. 32
34 ATENTO S.A. AND SUBSIDIARIES INTERIM CONDENSED CONSOLIDATED INCOME STATEMENTS For the six months ended June 30, 2017 and 2018 (In thousands of U.S. dollars, unless otherwise indicated) For the three months ended June 30, For the six months ended June 30, Notes (unaudited) (unaudited) Revenue 473, , , ,770 Other operating income 8,315 5,946 9,053 7,911 Other gains and own work capitalized Operating expenses: Supplies (17,501) (17,080) (34,303) (34,700) Employee benefit expenses (355,069) (357,240) (700,843) (724,743) Depreciation (11,077) (8,158) (22,876) (19,489) Amortization (12,301) (15,435) (25,927) (30,417) Changes in trade provisions (26) (140) Other operating expenses (63,524) (56,131) (119,294) (113,283) OPERATING PROFIT 22,756 25,478 47,533 48,931 Finance income 1, ,615 1,357 Finance costs (16,036) (12,349) (33,461) (26,964) Change in fair value of financial instruments (312) 9,034 (268) 5,912 Net foreign exchange loss (4,227) (19,042) (958) (21,803) NET FINANCE EXPENSE (19,075) (21,897) (31,072) (41,498) PROFIT BEFORE TAX 3,681 3,581 16,461 7,433 Income tax expense 14 (7,334) 460 (11,091) (5,056) (LOSS)/PROFIT FOR THE PERIOD (3,653) 4,041 5,370 2,377 (LOSS)/PROFIT ATTRIBUTABLE TO: OWNERS OF THE PARENT (3,868) 3,266 5,106 1,302 NON-CONTROLLING INTEREST ,075 (LOSS)/PROFIT FOR THE PERIOD (3,653) 4,041 5,370 2,377 (LOSS)/PROFIT PER SHARE: Basic (loss)/profit per share from continuing operations (in U.S. dollars) Diluted (loss)/profit per share from continuing operations (in U.S. dollars) 15 (0.05) (0.05) The accompanying notes are an integral part of the interim condensed consolidated financial information. 33
35 ATENTO S.A. AND SUBSIDIARIES INTERIM CONDENSED CONSOLIDATED STATEMENTS OF COMPREHENSIVE INCOME For the six months ended June 30, 2017 and 2018 (In thousands of U.S. dollars, unless otherwise indicated) For the three months ended June 30, For the six months ended June 30, (unaudited) (unaudited) (Loss)/profit from continuing operations (3,653) 4,041 5,370 2,377 (Loss)/profit for the period (3,653) 4,041 5,370 2,377 Other comprehensive income/(loss) Other comprehensive income/(loss) to be reclassified to profit and loss in subsequent periods Cash flow/net investment hedge (10,632) 7,782 (22,810) (1,899) Tax effect on hedge Translation differences (4,120) (58,267) 9,536 (46,452) Other comprehensive income/(loss) (14,615) (50,485) (12,620) (48,351) Total comprehensive income/(loss) (18,268) (46,444) (7,250) (45,974) Total comprehensive income/(loss) attributable to: Owners of the parent (18,491) (45,677) (7,516) (45,837) Non-controlling interest 225 (767) 266 (137) Total comprehensive income/(loss) (18,266) (46,444) (7,250) (45,974) The accompanying notes are an integral part of the interim condensed consolidated financial information. 34
36 ATENTO S.A. AND SUBSIDIARIES INTERIM CONDENSED CONSOLIDATED STATEMENTS OF CHANGES IN EQUITY Share premium Reserve for acquisition of noncontrolling interest For the six months ended June 30, 2017 and 2018 (In thousands of U.S. dollars, unless otherwise indicated) Retained losses Translation differences Hedge accounting effects Stock-based compensation Total owners of the parent company Noncontrolling interest Total equity Share capital Balance at January 1, ,435 (1,057) (53,598) (193,529) 35,521 4, ,921 (718) 430,203 Comprehensive income/(loss) for ,106 9,534 (22,156) - (7,516) 266 (7,250) the period Profit for the period , , ,370 Other comprehensive income/(loss), net ,534 (22,156) - (12,622) 2 (12,620) of taxes Reserve for acquisition of noncontrolling - - (22,474) (22,474) - (22,474) interest Stock-based compensation ,233 1,233-1,233 Non-controlling interest ,022 9,022 Balance at June 30, 2017 (*) ,435 (23,531) (48,492) (183,995) 13,365 5, ,164 8, ,734 Share premium Reserve for acquisition of noncontrolling interest Retained losses Translation differences Hedge accounting effects Stock-based compensation Total owners of the parent company Noncontrolling interest Total equity Share capital Balance at January 1, ,435 (23,531) (94,535) (170,063) 9,594 7, ,363 9, ,839 Comprehensive income/(loss) for the period Profit/(loss) for the period Other comprehensive income/(loss), net of taxes Compensation of retained losses Stock-based compensation Balance at June 30, 2018 (*) ,302 (45,240) (1,899) - (45,837) (137) (45,974) , ,302 1,075 2, (45,240) (1,899) - (47,139) (1,212) (48,351) - (24,147) , ,221 2,221-2, ,288 (23,531) (93,233) (191,156) 7,695 9, ,747 9, ,086 (*) unaudited The accompanying notes are an integral part of the interim condensed consolidated financial information. 35
37 ATENTO S.A. AND SUBSIDIARIES INTERIM CONDENSED CONSOLIDATED STATEMENTS OF CASH FLOWS For the six months ended June 30, 2017 and 2018 (In thousands of U.S. dollars, unless otherwise indicated) Operating activities For the six months ended June 30, (unaudited) Profit before income tax 16,461 7,433 Adjustments to reconcile profit before income tax to net cash flows: Amortization and depreciation 48,803 49,906 Changes in trade provisions Change in provisions 4,406 8,648 Grants released to income (170) (387) Losses on disposal of fixed assets 1, Losses on disposal of financial assets Finance income (3,615) (1,357) Finance costs 33,461 26,964 Net foreign exchange differences ,802 Change in fair value of financial instruments 268 (5,912) Changes in other (gains)/losses and own work capitalized 5,279 (435) 90,522 99,783 Changes in working capital: Changes in trade and other receivables (56,302) (65,252) Changes in trade and other payables 17,935 13,346 Other payables (17,750) (2,043) (56,117) (53,949) Interest paid (31,931) (26,495) Interest received 3, Income tax paid (10,112) (10,540) Other payments (10,774) (7,049) (49,413) (43,783) Net cash flows from operating activities 1,453 9,484 Investing activities Payments for acquisition of intangible assets (20,062) (11,077) Payments for acquisition of property, plant and equipment (16,825) (17,804) Acquisition of subsidiaries, net of cash acquired (14,512) - Payments for financial instruments - (235) Proceeds from sale of PP&E and intangible assets Net cash flows used in investing activities (51,317) (28,746) Financing activities Proceeds from borrowing from third parties 65,990 51,112 Repayment of borrowing from third parties (68,999) (56,410) Dividends paid to company's shareholders - (227) Net cash flows used in financing activities (3,009) (5,525) Net decrease in cash and cash equivalents (52,873) (24,787) Exchange differences 5,115 (10,558) Cash and cash equivalents at beginning of period 194, ,762 Cash and cash equivalents at end of period 146, ,418 The accompanying notes are an integral part of the interim condensed consolidated financial information. 36
38 NOTES TO THE INTERIM CONDENSED CONSOLIDATED FINANCIAL INFORMATION FOR THE SIX MONTHS ENDED JUNE 30, ACTIVITY OF ATENTO S.A. AND CORPORATE INFORMATION (a) Description of business Atento S.A., formerly Atento Floatco S.A. (hereinafter the Company ), and its subsidiaries (hereinafter Atento Group ) is a group of companies that offers customer relationship management services to its clients through contact centers or multichannel platforms. The Company was incorporated on March 5, 2014 under the laws of the GrandDuchy of Luxembourg, with its registered office in Luxembourg at 4, Rue Lou Hemmer. The Atento Group was acquired in 2012 by Bain Capital Partners, LLC (hereinafter Bain Capital ). Bain Capital is a private investment fund that invests in companies with a high growth potential. Notable among its investments in the Customer Relationship Management (hereinafter CRM ) sector is its holding in ellsystem 24, a leader in customer service in Japan, and Genpact, the largest business management services company in the world. In December 2012, Bain Capital entered into a final agreement with Telefónica, S.A. for the transfer of nearly 100% of the CRM business carried out by Atento Group (hereinafter the Acquisition ), the parent company of which was Atento Inversiones y Teleservicios, S.A. (hereinafter AIT ). The Venezuela based subsidiaries of the group headed by AIT, and AIT, except for some specific assets and liabilities, were not included in the Acquisition. Control was transferred for the purposes of creating the consolidated Atento Group on December 1, The majority direct shareholder of the Company, ATALAYA Luxco PIKCo, S.C.A. (Luxembourg), is a holding company incorporated under the laws of the Grand-Duchy of Luxembourg. The Company s corporate purpose is to hold investments in companies in Luxembourg and abroad, purchase and sell, subscribe or any other format, and transfer through sale, swap or otherwise of securities of any kind, and administration, management, control and development of the investment portfolio. The Company may also act as the guarantor of loans and securities, as well as assisting companies in which it holds direct or indirect interests or that form part of its group. The Company may secure funds, with the exception of public offerings, through any kind of lending, or through the issuance of bonds, securities or debt instruments in general. The Company may also carry on any commercial, industrial, financial, real estate business or intellectual property related activity that it deems necessary to meet the aforementioned corporate purposes. The corporate purpose of its subsidiaries, with the exception of the intermediate holding companies, is to establish, manage and operate CRM centers through multichannel platforms; provide telemarketing, marketing and call center services through service agencies or in any other format currently existing or which may be developed in the future by the Atento Group; provide telecommunications, logistics, telecommunications system management, data transmission, processing and internet services and to promote new technologies in these areas; offer consultancy and advisory services to clients in all areas in connection with telecommunications, processing, integration systems and new technologies, and other services related to the above. The Company s ordinary shares trade on NYSE under the symbol ATTO. The interim condensed consolidated financial information were approved by the Board of Directors on July 26, (b) Seasonality Our performance is subject to seasonal fluctuations, which is primarily due to (i) the initial costs to train and hire new employees at new service delivery centers to provide additional services to our clients, and (ii) statutorily mandated minimum wage and salary increases of operators, supervisors and coordinators in many of the countries in which we operate, whereas revenue increases related to inflationary adjustments and contracts negotiations generally take effect after the half year. These seasonal effects also cause differences in revenue and expenses among the various quarters of any financial year, which means that the individual quarters of a year should not be directly compared with each other or used to predict annual financial results. 37
39 2. BASIS OF PRESENTATION OF THE INTERIM CONDENSED CONSOLIDATED FINANCIAL INFORMATION The interim condensed consolidated financial information have been prepared in accordance with IAS 34 - Interim Financial Reporting as issued by the International Accounting Standards Board ( IASB ). The information does not meet all disclosure requirements for the presentation of full annual financial statements and thus should be read in conjunction with the consolidated financial statements prepared in accordance with International Financial Reporting Standards ( IFRS ) for the year ended December 31, The interim condensed consolidated financial information have been prepared on a historical costs basis, with the exception of derivative financial instruments and financial liability related to the option for acquisition of non-controlling interest, which have been measured at fair value. The interim condensed consolidated financial information are for the Atento Group. The figures in these interim condensed consolidated financial information are expressed in thousands of dollars, unless indicated otherwise. U.S. Dollar is the Atento Group s presentation currency. 3. COMPARATIVE INFORMATION On June 9, 2017, the Company, through its subsidiary Atento Brasil, acquired control of Interfile Serviços de BPO Ltda. and of Interservicer Serviços em Crédito Imobiliário Ltda. (jointly, Interfile ), a leading provider of BPO services and solutions, including credit origination, for the banking and financial services sector in Brazil. 4. ACCOUNTING POLICIES There were no significant changes in accounting policies and calculation methods used for the interim condensed consolidated financial information as of June 30, 2018 in relation to those presented in the annual financial statements for the year ended December 31, 2017 except for the IFRS 15 and IFRS 9 adopted since January 1, a) Critical accounting estimates and assumptions The preparation of the interim condensed consolidated financial information under IAS 34 requires the use of certain assumptions and estimates that affect the recognized amount of assets, liabilities, income and expenses, as well as the related disclosures. Some of the accounting policies applied in preparing the accompanying interim condensed consolidated financial information required Management to apply significant judgments in order to select the most appropriate assumptions for determining these estimates. These assumptions and estimates are based on Management experience, the advice of consultants and experts, forecasts and other circumstances and expectations prevailing at year end. Management s evaluation takes into account the global economic situation in the sector in which the Atento Group operates, as well as the future outlook for the business. By virtue of their nature, these judgments are inherently subject to uncertainty. Consequently, actual results could differ substantially from the estimates and assumptions used. Should this occur, the values of the related assets and liabilities would be adjusted accordingly. Although these estimates were made on the basis of the best information available at each reporting date on the events analyzed, events that take place in the future might make it necessary to change these estimates in coming years. Changes in accounting estimates would be applied prospectively in accordance with the requirements of IAS 8, Accounting Policies, Changes in Accounting Estimates and Errors, recognizing the effects of the changes in estimates in the related interim condensed consolidated income statements. 38
40 An explanation of the estimates and judgments that entail a significant risk of leading to a material adjustment in the carrying amounts of assets and liabilities in the coming financial period is as follow: Usefullivesofproperty,plantandequipmentandintangibleassets The accounting treatment of items of property, plant and equipment and intangible assets entails the use of estimates to determine their useful lives for depreciation and amortization purposes. In determining the useful life, it is necessary to estimate the level of use of assets as well as forecast technological trends in the assets. Assumptions regarding the level of use, the technological framework and the future development require a significant degree of judgment, bearing in mind that these aspects are rather difficult to foresee. Changes in the level of use of assets or in their technological development could result in a modification of their useful lives and, consequently, in the associated depreciation or amortization. Estimatedimpairmentofgoodwill The Atento Group tests goodwill for impairment annually, in accordance with the accounting principle disclosed in the consolidated annual financial statements for the year ended December 31, Goodwill is subject to impairment testing as part of the cash-generating unit to which it has been allocated. The recoverable amounts of cash-generating units defined in order to identify potential impairment in goodwill are determined on the basis of value in use, applying five-year financial forecasts based on the Atento Group s strategic plans, approved and reviewed by Management. These calculations entail the use of assumptions and estimates and require a significant degree of judgment. The main variables considered in the sensitivity analyses are growth rates, discount rates using the Weighted Average Cost of Capital ( WACC ) and the key business variables. Deferredtaxes The Atento Group assesses the recoverability of deferred tax assets based on estimates of future earnings. The ability to recover these deferred amounts depends ultimately on the Atento Group s ability to generate taxable earnings over the period in which the deferred tax assets remain deductible. This analysis is based on the estimated timing of the reversal of deferred tax liabilities, as well as estimates of taxable earnings, which are sourced from internal projections and are continuously updated to reflect the latest trends. The appropriate classification of tax assets and liabilities depends on a series of factors, including estimates as to the timing and realization of deferred tax assets and the projected tax payment schedule. Actual income tax receipts and payments could differ from the estimates made by the Atento Group as a result of changes in tax legislation or unforeseen transactions that could affect the tax balances. The Atento Group has recognized deferred tax assets corresponding to losses carried forward since, based on internal projections, it is probable that it will generate future taxable profits against which they may be utilized. The carrying amount of deferred income tax assets is reviewed at each reporting date and reduced to the extent that it is no longer probable that sufficient taxable profits will be available to allow all or part of that deferred tax asset to be utilized. Unrecognized deferred income tax assets are reassessed at each reporting date and are recognized to the extent that it has become probable that future taxable profits will allow the deferred tax asset to be recovered. Provisionsandcontingencies Provisions are recognized when the Atento Group has a present obligation as a result of a past event, it is probable that an outflow of resources will be required to settle the obligation and a reliable estimate can be made of the amount of the obligation. This obligation may be legal or constructive, deriving from, inter alia, regulations, contracts, customary practice or public commitments that would lead third parties to reasonably expect that the Atento Group will assume certain responsibilities. The amount of the provision is determined based on the best estimate of the outflow of resources embodying economic benefit that will be required to settle the obligation, taking into account all available information as of the reporting date, including the opinions of independent experts such as legal counsel or consultants. No provision is recognized if the amount of liability cannot be estimated reliably. In such cases, the relevant information is disclosed in the notes to the interim condensed consolidated financial information. 39
41 Given the uncertainties inherent in the estimates used to determine the amount of provisions, actual outflows of resources may differ from the amounts recognized originally on the basis of these estimates. Fairvalueofderivatives The Atento Group uses derivative financial instruments to mitigate risks, primarily derived from possible fluctuations in interest and exchange rates. Derivatives are recognized at the inception of the contract at fair value. The fair values of derivative financial instruments are calculated on the basis of observable market data available, either in terms of market prices or through the application of valuation techniques. The valuation techniques used to calculate the fair value of derivative financial instruments include the discounting of future cash flow associated with the instruments, applying assumptions based on market conditions at the valuation date or using prices established for similar instruments, among others. These estimates are based on available market information and appropriate valuation techniques. The fair values calculated could differ significantly if other market assumptions and/or estimation techniques were applied. a) New standards and interpretations not yet adopted The reporting standards below were published and are mandatory for future annual reporting periods: Title of standard Nature of change Impact Mandatory application date/ Date of adoption by group IFRS 16 Leases IFRS 16 was issued in January It will result in almost all leases being recognised on the balance sheet, as the distinction between operating and finance leases is removed. Under the new standard, an asset (the right to use the leased item) and a financial liability to pay rentals are recognised. The only exceptions are short-term and low-value leases. The accounting for lessors will not significantly change. The standard will affect primarily the accounting for the Group s operating leases. As at the reporting date, the Group has operating lease commitments of 218,897 thousand U.S. dollars. However, the Group has not yet determined to what extent these commitments will result in the recognition of an asset and a liability for future payments and how this will affect the Group s profit and classification of cash flows. Some of the commitments may be covered by the exception for short-term and low-value leases and some commitments may relate to arrangements that will not qualify as leases under IFRS 16. Mandatory for financial years commencing on or after January 1, At this stage, the group does not intend to adopt the standard before its effective date. Title of standard Key requirements IFRIC Interpretation 23 Uncertainty over Income Tax Treatment The Interpretation addresses the accounting for income taxes when tax treatments involve uncertainty that affects the application of IAS 12 and does not apply to taxes or levies outside the scope of IAS 12, nor does it specifically include requirements relating to interest and penalties associated with uncertain tax treatments. The Interpretation specifically addresses the following: Whether an entity considers uncertain tax treatments separately; The assumptions an entity makes about the examination of tax treatments by taxation authorities; How an entity determines taxable profit (tax loss), tax bases, unused tax losses, unused tax credits and tax rates; Mandatory application date/ Date of adoption by group How an entity considers changes in facts and circumstances. An entity must determine whether to consider each uncertain tax treatment separately or together with one or more other uncertain tax treatments. The approach that better predicts the resolution of the uncertainty should be followed. The interpretation is effective for annual reporting periods beginning on or after January 1, 2019, but certain transition reliefs are available. The Group will apply interpretation from its effective date. 40
42 There are no other standards that are not yet effective and that would be expected to have a material impact on the Group in the current or future reporting periods and on foreseeable future transactions. 5. MANAGEMENT OF FINANCIAL RISK 5.1 Financial risk factors The Atento Group's activities are exposed to various types of financial risks: market risk (including currency risk, interest rate risk and country risk), credit risk and liquidity risk. The Atento Group's global risk management policy aims to minimize the potential adverse effects of these risks on the Atento Group's financial returns. The Atento Group also uses derivative financial instruments to hedge certain risk exposures. These unaudited interim condensed consolidated financial information do not include all financial risk management information and disclosures required in the annual financial statements and therefore they should be read in conjunction with the Atento Group s annual financial statements as of and for the year ended December 31, For the six months ended June 30, 2018 there have not been changes in any risk management policies. Country Risk To manage or mitigate country risk, we repatriate the funds generated in the Americas and Brazil that are not required for the pursuit of new profitable business opportunities in the region and subject to the restrictions of our financing agreements. Interest Rate Risk Interest rate risk arises mainly as a result of changes in interest rates which affect: finance costs of debt bearing interest at variable rates (or short-term maturity debt expected to be renewed), as a result of fluctuations in interest rates, and the value of non-current liabilities that bear interest at fixed rates. Atento Group s finance costs are exposed to fluctuation in interest rates. As of June 30, 2018, 11.3% of Atento Group s finance costs are exposed to fluctuations in interest rates (excluding the effect of financial derivative instruments), compared to 12.8% as of December 31, As of June 30, 2018, the estimated fair value of the interest rate hedging instruments related to the Brazilian Debentures totaled 550 thousand U.S. dollars (1,212 thousand U.S. dollars as of December 31, 2017), which was recorded as a financial liability. Based on our total indebtedness of 479,323 thousand U.S. dollars as of June 30, 2018 without taking into account the impact of our interest rate hedging instruments referred to above, a 1% change in interest rates would impact our net interest expense by 250 thousand U.S. dollars. Foreign Currency Risk Our foreign currency risk arises from our local currency revenues, receivables and payables while the U.S. dollar is our reporting currency. We benefit to a certain degree from the fact that the revenue we collect in each country, in which we have operations, is generally denominated in the same currency as the majority of the expenses we incur. In accordance with our risk management policy, whenever we deem it appropriate, we manage foreign currency risk by using derivatives to hedge any exposure incurred in currencies other than those of the functional currency of the countries. As of June 30, 2018, the estimated fair value of the cross-currency swaps designated as hedging instruments totaled an asset of 9,759 thousand U.S. dollars (asset of 3,037 thousand U.S. dollars, as of December 31, 2017). Credit Risk The Atento Group seeks to conduct all of its business with reputable national and international companies and institutions established in their countries of origin, to minimize credit risk. As a result of this policy, the Atento Group has no material adjustments to make to its credit accounts. 41
43 Credit risk arising from cash and cash equivalents is managed by placing cash surpluses in high quality and highly liquid money-market assets. These placements are regulated by a master agreement revised annually on the basis of the conditions prevailing in the markets and the countries where Atento operate. The master agreement establishes: (i) the maximum amounts to be invested per counterparty, based on their ratings (long- and short-term debt rating); (ii) the maximum period of the investment; and (iii) the instruments in which the surpluses may be invested. The Atento Group s maximum exposure to credit risk is primarily limited to the carrying amounts of it financial assets. The Atento Group holds no guarantees as collection insurance. The Atento Group carries out significant transactions with the Telefónica Group, which amounted to 108,793 thousand U.S. dollars as of June 30, 2018 (207,173 thousand U.S. dollars as of December 31, 2017). Liquidity Risk The Atento Group seeks to match its debt maturity schedule to its capacity to generate cash flow to meet the payments falling due, factoring in a degree of cushion. In practice, this has meant that the Atento Group s average debt maturity must be longer than the length of time we required paying its debt (assuming that internal projections are met). Capital Management The Atento Group s Finance Department, which is in charge of the capital management, takes various factors into consideration when determining the Group s capital structure. The Atento Group s capital management goal is to determine the financial resources necessary both to continue its recurring activities and to maintain a capital structure that optimizes own and borrowed funds. The Atento Group sets an optimal debt level in order to maintain a flexible and comfortable medium-term borrowing structure in order to be able to carry out its routine activities under normal conditions and to address new opportunities for growth. Debt levels are kept in line with forecast future cash flows and with quantitative restrictions imposed under financing contracts. In addition to these general guidelines, we take into account other considerations and specifics when determining our financial structure, such as country risk, tax efficiency and volatility in cash flow generation. Among the restrictions imposed under financing arrangements, the debenture contract lays out certain general obligations and disclosures in respect of the lending institutions, specifically, the borrower Atento Brasil S.A. must comply with the quarterly net financial debt/ebitda ratio set out in the contract terms. In addition to these general guidelines, we take into account other considerations and specifics when determining our financial structure, such as country risk, tax efficiency and volatility in cash flow generation. The contract also sets out additional restrictions, including limitations on dividends, payments and distributions to shareholders and capacity to incur additional debt. The Super Senior Revolving Credit Facility carries no financial covenant obligations regarding debt levels. However, the notes do impose limitations on the distributions on dividends, payments or distributions to the shareholders, the incurring of additional debt, and on investments and disposal of assets. As of the date of these interim condensed consolidated financial information, the Atento Group was in compliance with all restrictions established in the aforementioned financing contracts, and does not foresee any future non- compliance. To that end, the Atento Group regularly monitors figures for net financial debt with third parties and EBITDA. 5.2 Fair value estimation a) Level 1: The fair value of financial instruments traded on active markets is based on the quoted market price at the reporting date. 42
44 b) Level 2: The fair value of financial instruments not traded in active market (i.e. over-the-counter derivatives) is determined using valuation techniques. Valuation techniques maximize the use of available observable market data, and place as little reliance as possible on specific company estimates. If all of the significant inputs required to calculate the fair value of financial instrument are observable, the instrument is classified in Level 2. The Atento Group s Level 2 financial instruments comprise interest rate swaps used to hedge floating rate loans and cross currency swaps. c) Level 3: If one or more significant inputs are not based on observable market data, the instrument is classified in Level 3. The Atento Group s assets and liabilities measured at fair value as of December 31, 2017 and June 30, 2018 are classified as Level 2, except for Senior Secured Notes that is classified in Level 1. No transfers were carried out between the different levels during the period. 6. SEGMENT INFORMATION The following tables present financial information for the Atento Group s operating segments for the six months ended June 30, 2017 and 2018 (in thousand U.S. dollars): For the six months ended June 30, 2017 Thousands of U.S. dollars EMEA Americas Brazil (unaudited) Other and eliminations Total Group Sales to other companies 37, , , ,472 Sales to Telefónica Group 74, , ,213 (1) 376,238 Sales to other group companies 1 1,052 - (1,053) - Other operating income and expense (104,229) (325,217) (412,430) (3,498) (845,374) EBITDA 7,591 33,883 59,414 (4,552) 96,336 Depreciation and amortization (4,492) (16,723) (27,333) (255) (48,803) Operating profit/(loss) 3,099 17,160 32,081 (4,807) 47,533 Financial results (5,781) (3,419) (17,298) (4,574) (31,072) Income tax (620) (7,298) (3,911) 738 (11,091) Profit/(loss) from continuing operations (3,302) 6,443 10,872 (8,643) 5,370 Profit/(loss) for the period (3,302) 6,443 10,872 (8,643) 5,370 EBITDA 7,591 33,883 59,414 (4,552) 96,336 Restructuring costs 515 4,362 3, ,894 Other Adjusted EBITDA (unaudited) 8,106 39,081 62,988 (4,088) 106,087 Capital expenditure 665 6,623 11,901-19,189 Intangible, Goodwill and PP&E (as of December 31, 2017) 46, , ,058 1, ,329 Allocated assets (as of December 31, 2017) 404, , ,090 (287,434) 1,408,167 Allocated liabilities (as of December 31, 2017) 283, , ,743 (99,792) 966,373 43
45 For the six months ended June 30, 2018 Thousands of U.S. dollars EMEA Americas Brazil (unaudited) Other and eliminations Total Group Sales to other companies 47, , , ,395 Sales to Telefónica Group 78, , ,503 (478) 376,375 Sales to other group companies - 4, (5,777) - Other operating income and expense (117,920) (342,600) (422,736) 18,323 (864,933) EBITDA 7,386 41,523 37,382 12,068 98,837 Depreciation and amortization (5,080) (18,092) (26,256) (478) (49,906) Operating profit/(loss) 2,306 23,431 11,126 11,590 48,931 Financial results (985) (10,397) (18,245) (11,871) (41,498) Income tax (600) (3,570) 3,104 (3,990) (5,056) Profit/(loss) from continuing operations 721 9,464 (4,015) (4,271) 2,377 Profit/(loss) for the period 721 9,464 (4,015) (4,271) 2,377 EBITDA 7,386 41,523 37,382 12,068 98,837 Shared services expenses 3,589 5,535 8,153 (17,277) - Adjusted EBITDA (unaudited) 10,975 47,058 45,535 (5,209) 98,837 Capital expenditure 3,254 21,315 28,447-53,016 Intangible, Goodwill and PP&E (as of June 30, 2018) 45, , ,030 2, ,517 Allocated assets (as of June 30, 2018) 395, , ,590 (346,908) 1,256,761 Allocated liabilities (as of June 30, 2018) 121, , ,020 65, ,675 "Other and eliminations" includes activities of the intermediate holding in Spain (Atento Spain Holdco, S.L.U.), Luxembourg holdings, as well as inter-group transactions between segments. 7. INTANGIBLE ASSETS Atento Brasil S.A. entered into Master Agreements regarding the acquisition of rights to use software licenses to Atento and its affiliates in Brazil, Chile, Colombia, El Salvador, Spain, Guatemala, Mexico, Peru, Puerto Rico and United States of America ( U.S.A. ) including the Company s corporate structure areas. This agreement amount for approximately 38,526 thousand U.S. dollars. 8. GOODWILL The variations of amounts related to the period ended December 31, 2017 and June 30, 2018 are related to exchange variance, mainly due to Brazilian Reais and Argentinian Pesos against the U.S. dollar. 9. PROPERTY, PLANT AND EQUIPMENT (PP&E) The variations of amounts related to the period ended December 31, 2017 and June 30, 2018 are related to exchange variance, mainly due to Brazilian Reais and Argentinian Pesos against the U.S. dollar. 44
46 10. EQUITY Share capital Share premium As of June 30, 2018, share capital was 48 thousand U.S. dollars ( 33,304), divided into 73,909,056 shares. PikCo owns 68.14% of ordinary shares of Atento S.A. The share premium refers to the difference between the subscription price that the shareholders paid for the shares and their nominal value. Since this is a capital reserve, it can only be used to increase capital, offset losses, redeem, reimburse or repurchase shares. Reserve for acquisition of non-controlling interest Refers to options attributable to the parent company in the acquisition of RBrasil and Interfile in amount of 23,531 thousand U.S. dollars. Dividends On October 31, 2017, our Board of Directors declared a cash interim dividend of 24,147 thousand U.S. dollars with dividends declared per share of $0.33, paid on November 28, Legal reserve According to commercial legislation in Luxembourg, Atento S.A. must transfer 5% of its year profits to legal reserve until the amount reaches 10% of share capital. The legal reserve cannot be distributed. At December 31, 2017 and June 30, 2018, no legal reserve had been established due to the losses incurred by Atento S.A. Translation differences Translation differences reflect the differences arising on account of exchange rate fluctuations when converting the net assets of fully consolidated foreign companies from local currency into Atento Group s presentation currency (U.S. dollars). Stock - based compensation a) Description of share - based payment arrangements In 2014, Atento granted the following two share-based payment arrangements to directors, officers and other employees, for the Company and its subsidiaries. The share-based payments are Time Restricted Stock Units ( TRSUs ) and Performance Restricted Stock Units ( PRSU ). In 2016, Atento granted two news share-based payment arrangements (both of them are Time Restricted Stock Units TRSUs ) to directors, officers and other employees, for the Company and its subsidiaries. The reference for these share-based payment arrangements is made to the annual financial statements for December 31, 2017, for a description of the arrangement and their vesting conditions. On July 1, 2016, Atento granted the following share-based payment arrangement to directors, officers and other employees, for the Company and its subsidiaries: 1. Time Restricted Stock Units ( RSU ) (equity settled) Grant date: July 1, 2016 Amount: 1,384,982 RSUs Vesting period: 100% of the RSUs vest on January 4, 2019 There are no other vesting conditions 45
47 On July 3, 2017, Atento granted a new share-based payment arrangement to directors, officers and other employees, for the Company and its subsidiaries. The share-based payment had the following arrangements: Time Restricted Stock Units ( RSUs ) (equity settled) Grant date: July 3, 2017 Amount: 886,187 RSUs Vesting period: 100% of the RSUs vests on January 2, 2020 There are no other vesting conditions b) Measurement of fair value The fair value of the RSUs, for all arrangements, has been measured using the Black Scholes model. For all arrangements are equity settled and the fair value of RSUs is measured at grant date and not remeasured subsequently. c) Outstanding RSUs As of June 30, 2017, there are 1,129,800 Time RSUs outstanding to the 2016 Grant and 861,863 Time RSUs outstanding to the 2017 Grant. Holders of RSUs will receive the equivalent in shares of Atento S.A. without cash settlement of stock values when the RSUs. The2016Grant Time RSU Outstanding December 31, ,148,625 Forfeited (*) (18,825) Outstanding June 30, ,129,800 (*) RSUs forfeited during the period due to employees failing to satisfy the service conditions. The2017Grant Time RSU Outstanding December 31, ,863 Forfeited (*) - Outstanding June 30, ,863 (*) RSUs forfeited during the period due to employees failing to satisfy the service conditions. d) Impacts in Profit or Loss In the six months ended June 30, 2018, 3,020 thousand U.S. dollars related to stock-based compensation were recorded as Employee benefit expenses. 11. FINANCIAL ASSETS As of December 31, 2017 and June 30, 2018, all the financial assets of the Company are classified as loans and receivables, except for the derivative financial instruments that are categorized as fair value through profit or loss. Credit risk arises from the possibility that the Atento Group might not recover its financial assets at the amounts recognized and in the established terms. Atento Group Management considers that the carrying amount of financial assets is similar to the fair value. 46
48 As of June 30, 2018, Atento Teleservicios España S.A., Atento Chile S.A., Atento Colombia S.A., Teleatento del Perú S.A.C, Atento Brasil S.A. and Atento El Salvador S.A. de C.V. have entered into factoring agreements without recourse, anticipating an amount of 107,280 thousand U.S. dollars, receiving cash net of discount, the related trade receivables were realized and interest expenses was recognized in the statement of operations. Details of other financial assets as of December 31, 2017 and June 30, 2018 are as follow: Thousands of U.S. dollars 12/31/2017 6/30/2018 (audited) (unaudited) Other non-current receivables (*) 11,125 10,265 Non-current guarantees and deposits 49,097 53,078 Total non-current 60,222 63,343 Other current receivables Current guarantees and deposits 1, Total current 1,810 1,489 Total 62,032 64,832 (*) Other non-current receivables as of June 30, 2018 primarily comprise a loan granted by the subsidiary RBrasil to third parties. The effective annual interest rate is CDI % p.a., maturing up to five years beginning in May 4, 2017, when the value of the loan will be amortized in a single installment. The breakdown of Trade and other receivables as of December 31, 2017 and June 30, 2018 is as follow: Thousands of U.S. dollars 12/31/2017 6/30/2018 (audited) (unaudited) Non-current trade receivables 6,923 5,497 Other non-financial assets (*) 14,754 8,538 Total non-current 21,677 14,035 Current trade receivables 358, ,020 Other receivables (**) 13,225 18,639 Prepayments 7,849 13,345 Personnel 9,180 14,027 Total current 388, ,031 Total 410, ,066 (*) Other non-financial assets as of June 30, 2018 primarily comprise the litigation underway with the Brazilian social security authority ( InstitutoNacionaldoSeguroSocial), recorded in Atento Brasil. (**) The variation is mainly due to partial insurance indemnity from Puerto Rico in the amount of 5,144 thousand U.S. dollars. For the purpose of the interim condensed consolidated financial statements of cash flows, cash and cash equivalents are comprised of the following: 47
49 Thousands of U.S. dollars 12/31/2017 6/30/2018 (audited) (unaudited) Deposits held at call 111,495 77,472 Short-term financial investments 30,267 28,947 Total 141, ,418 Short-term financial investments comprises short-term fixed-income securities in Brazil, which mature in less than 90 days and accrue interest pegged to the CDI. 12. FINANCIAL LIABILITIES The breakdown of the Company s financial liabilities by category as of December 31, 2017 and June 30, 2018 is as follows: Debt with third parties as of December 31, 2017 and June 30, 2018 is as follow: Thousands of U.S. dollars 12/31/2017 6/30/2018 (audited) (unaudited) Senior Secured Notes 388, ,366 Brazilian bonds Debentures 16,797 12,810 Bank borrowing 27,878 14,193 Finance lease payables 6,238 3,856 Total non-current 439, ,225 Senior Secured Notes 9,528 9,528 Brazilian bonds Debentures 4,258 3,604 Bank borrowing 28,514 42,480 Finance lease payables 4,260 3,486 Total current 46,560 59,098 TOTAL DEBT WITH THIRD PARTIES 486, ,323 Senior Secured Notes On January 29, 2013, Atento Luxco 1 S.A. issued 300,000 thousand U.S. dollars aggregate principal amount of Senior Secured Notes that would mature on January 29, The 2020 Senior Secured Notes were senior secured obligations of Atento Luxco 1 and were guaranteed on a senior secured first-priority basis by Atento Luxco 1 and certain of its subsidiaries excluding Argentina and Brazil subsidiaries. The Senior Secured Notes were also guaranteed on an unsecured basis by Atento S.A. and Midco. The indenture governing the 2020 Senior Secured Notes contained covenants that, among other things, restricted the ability of Atento Luxco 1 and certain of its subsidiaries to: incur or guarantee additional indebtedness; pay dividends or make distributions or redeem or repurchase capital stock; issue, redeem or repurchase certain debt; issue certain preferred stock or similar equity securities; make loans and investments; sell assets; incur liens; enter into transaction with affiliates; enter into agreements restricting certain subsidiaries ability to pay dividends; and consolidate, merge or sell all or substantially all of our assets. These covenants were subject to a number of important exceptions and qualifications. In addition, in certain circumstances, if Atento Luxco 1 sell assets or experiences certain changes of control, it must offer to purchase the 2020 Senior Secured Notes. On August 19, 2017, in connection with the offering described below, Atento Luxco 1 redeemed all of the outstanding amount of the 2020 Senior Secured Notes. The notes were called at a premium over face value of % per note, resulting in a total call cost of 11,064 thousand U.S. dollars recorded in finance costs during August 2017, along with the remaining balance of the 2020 Senior Secured Notes issuance amortized cost of 4,920 thousand U.S. dollars. 48
50 On August 10, 2017, Atento Luxco 1 S.A., closed an offering of 400,000 thousand U.S. dollars aggregate principal amount of 6.125% Senior Secured Notes due 2022 in a private placement transaction. The notes are due on August The 2022 Senior Secured Notes are guaranteed on a senior secured basis by certain of Atento s wholly-owned subsidiaries. The issuance costs of 12,574 thousand U.S. dollars related to this new issuance are recorded at amortized cost using the effective interest method. The terms of the Indenture, among other things, limit, in certain circumstances, the ability of Atento Luxco 1 and its restricted subsidiaries to: incur certain additional indebtedness; make certain dividends, distributions, investments and other restricted payments; sell the property or assets to another person; incur additional liens; guarantee additional debt; and enter into transaction with affiliates. As of June 30, 2018, we were in compliance with these covenants. The outstanding amount on June 30, 2018 is 398,894 thousand U.S. dollars. Debentures All interest payments are made on a half yearly basis. The fair value of the Senior Secured Notes, calculated on the basis of their quoted price at June 30, 2018, is 385,624 thousand U.S. dollars. The fair value hierarchy of the Senior Secured Notes is Level 1 as the fair value is based on the quoted market price at the reporting date. There were no changes in the context of the note, and Company s Management considers the variations of amounts related to the period ended December 31, 2017 in relation to the period ended June 30, 2018, not relevant, except for the interest accrued and the contractual amortization (principal and interest) in the period and the exchange rate impact. The outstanding amount on June 30, 2018 is 16,415 thousand U.S. dollars. Bank borrowings On February 3, 2014, Atento Brasil S.A. entered into a credit agreement with Banco Nacional de Desenvolvimento Econômico e Social BNDES ( BNDES ) in an aggregate principal amount of 300,000 thousand Brazilian reais (the BNDES Credit Facility ), equivalent to 77,804 thousand U.S. dollars as of June 30, The total amount of the BNDES Credit Facility is divided into five tranches subject to the following interest rates: Tranche Interest Rate Tranche A Long-Term Interest Rate ( TaxadeJurosdeLongoPrazo-TJLP) plus 2.5% per annum Tranche B SELIC Rate plus 2.5% per annum Tranche C 4.0% per year Tranche D 6.0% per year Tranche E Long-Term Interest Rate ( TaxadeJurosdeLongoPrazo-TJLP) Each tranche intends to finance different purposes, as described below: Tranche A and B: investments in workstations, infrastructure, technology, services and software development, marketing and commercialization, within the scope of BNDES program BNDES Prosoft. Tranche C: IT equipment acquisition, covered by law 8.248/91, with national technology, necessary to execute the project described on tranches A and B Tranche D: acquisitions of domestic machinery and equipment, within the criteria of FINAME, necessary to execute the project described on tranches A and B Tranche E: investments in social projects to be executed by Atento Brasil S.A. 49
51 BNDES releases amounts under the credit facility once the debtor met certain requirements in the contract including delivering the guarantee (stand-by letter) and demonstrating the expenditure related to the project. Since the beginning of the credit facility, the following amounts were released: (Thousands of U.S. dollars) Date Tranche A Tranche B Tranche C Tranche D Tranche E Total March 27, ,572 3,245 4, ,684 April 16, ,732 1,366 1, ,147 July 16, August 13, ,233 1,773 2, ,894 Subtotal ,538 6,384 9, ,881 March 26, ,762 1,190 1, ,780 April 17, ,524 2,381 3, ,562 December 21, ,489 1, ,538 Subtotal ,774 5,438 5, ,879 October 27, Subtotal Total 47,312 11,822 14,131 1, ,958 This facility should be repaid in 48 monthly installments. The first payment was made on March 15, 2016 and the last payment will be due on February 15, The BNDES Credit Facility contains covenants that restrict Atento Brasil S.A. s ability to transfer, assign, change or sell the intellectual property rights related to technology and products developed by Atento Brasil S.A. with the proceeds from the BNDES Credit Facility. As of June 30, 2018, Atento Brasil S.A. was in compliance with these covenants. The BNDES Credit Facility does not contain any other financial maintenance covenant. The BNDES Credit Facility contains customary events of default including the following: (i) reduction of the number of employees without providing program support for outplacement, as training, job seeking assistance and obtaining pre-approval of BNDES; (ii) existence of unfavorable court decision against the Company for the use of children as workforce, slavery or any environmental crimes and (iii) inclusion in the by-laws of Atento Brasil S.A. of any provision that restricts Atento Brasil S.A s ability to comply with its financial obligations under the BNDES Credit Facility. On September 26, 2016, Atento Brasil S.A. entered into a new credit agreement with BNDES in an aggregate principal amount of 22,000 thousand Brazilian Reais, equivalent to 5,706 thousand U.S. dollars as of June 30, The interest rate of this facility is Long-Term Interest Rate (Taxa de Juros de Longo Prazo - TJLP) plus 2.0% per annum. The facility should be repaid in 48 monthly installments. The first payment will be due on November 15, 2018 and the last payment will be due on October 15, This facility is intended to finance an energy efficiency project to reduce power consumption by implementing new lightening, air conditioning and automation technology. On November 24, 2017, 6,500 thousand Brazilian Reais (equivalent to 1,686 thousand U.S. dollars) were released under this facility. As of June 30, 2018, the outstanding amount under BNDES Credit Facility was 33,748 thousand U.S. dollars. On August 10, 2017, Atento Luxco 1 S.A. entered into a new Super Senior Revolving Credit Facility (the Super Senior Revolving Credit Facility ) which provides borrowings capacity of up to 50,000 thousand U.S. dollars and will mature on February 10, Banco Bilbao Vizcaya Argentaria, S.A., as the agent, the Collateral Agent and BBVA Bancomer, S.A., Institución de Banca Múltiple, Grupo Financiero BBVA Bancomer, Morgan Stanley Bank N.A. and Goldman Sachs Bank USA are acting as arrangers and lenders under the Super Senior Revolving Credit Facility. The Super Senior Revolving Credit Facility may be utilized in the form of multi-currency advances for terms of one, two, three or six months. The Super Senior Revolving Credit Facility bears interest at a rate per annum equal to LIBOR or, for borrowings in euro, EURIBOR or, for borrowings in Mexican Pesos, TIIE plus an opening margin of 4.25% per annum. The margin may be reduced under a margin ratchet to 3.75% per annum by reference to the consolidated senior secured net leverage ratio and the satisfaction of certain other conditions. 50
52 The terms of the Super Senior Revolving Credit Facility Agreement limit, among other things, the ability of the Issuer and its restricted subsidiaries to (i) incur additional indebtedness or guarantee indebtedness; (ii) create liens or use assets as security in other transactions; (iii) declare or pay dividends, redeem stock or make other distributions to stockholders; (iv) make investments; (v) merge, amalgamate or consolidate, or sell, transfer, lease or dispose of substantially all of the assets of the Issuer and its restricted subsidiaries; (vi) enter into transactions with affiliates; (vii) sell or transfer certain assets; and (viii) agree to certain restrictions on the ability of restricted subsidiaries to make payments to the Issuer and its restricted subsidiaries. These covenants are subject to a number of important conditions, qualifications, exceptions and limitations that are described in the Super Senior Revolving Credit Facility Agreement. The Super Senior Revolving Credit Facility Agreement includes a financial covenant requiring the drawn super senior leverage ratio not to exceed 0.35:1.00 (the SSRCF Financial Covenant ). The SSRCF Financial Covenant is calculated as the ratio of consolidated drawn super senior facilities debt to consolidated pro forma EBITDA for the twelvemonth period preceding the relevant quarterly testing date and is tested quarterly on a rolling basis, subject to the Super Senior Revolving Credit Facility being at least 35% drawn (excluding letters of credit (or bank guarantees), ancillary facilities and any related fees or expenses) on the relevant test date. The SSRCF Financial Covenant only acts as a draw stop to new drawings under the Revolving Credit Facility and, if breached, will not trigger a default or an event of default under the Super Senior Revolving Credit Facility Agreement. The Issuer has four equity cure rights in respect of the SSRCF Financial Covenant prior to the termination date of the Super Senior Revolving Credit Facility Agreement, and no more than two cure rights may be exercised in any four consecutive financial quarters. As of June 30, 2018, we were in compliance with this covenant. On September 14, 2017, Atento Luxco 1 S.A. and Atento Brasil S.A. entered into an Agreement for a Common Revolving Credit Facility Line with Santander Brasil, Estabelecimento Financeiro de Crédito S.A. in respect of a bi-lateral, multi-currency revolving credit facilities. Up to $30.0 million of commitments are available for the drawing of cash loans in Euro, Mexican Pesos (MXN) and Colombian Pesos (COP). The original borrowers under this facility are Atento Colombia S.A, Atento Teleservicios España, S.A.U and Atento Servicios, S.A. de C.V. This facility is guaranteed by Atento Luxco 1 S.A. and Atento Brasil S.A. on a joint and several basis. This facility matures one year after the date of the Agreement. As of June 30, 2018, the outstanding amount under this facility is 4,502 thousand U.S. dollars. On March 5, 2018, Atento Brasil S.A. entered into an agreement with Banco ABC Brasil for an amount of 10,092 thousand U.S. dollars maturing on September 3, 2018 with an annual interest rate of 3.40%. In connection with the loan, Atento Brasil S.A. entered into a SWAP agreement through which it receives fixed interest rates in U.S. dollars, in the same amount of the loan agreement, and pays variable interest rate at a rate per annum equal to the average daily rate of the one day over extragroup DI Interfinancial Deposits (as such rate is disclosed by CETIP in the daily release available on its web page), plus a spread of 2.10% over 33,000 thousand Brazilian Reais. As of June 30, 2018, the outstanding balance was 10,229 thousand U.S. dollars. Derivatives Details of derivative financial instruments as of December 31, 2017 and June 30, 2018 are as follows: Thousands of U.S. dollars 12/31/2017 6/30/2018 Assets Liabilities Assets Liabilities Interest rate swaps - cash flow hedges - (1,212) - (550) Cross currency swaps - net investment hedges 7,429 (5,140) 5,967 (3,850) Cross currency swaps - that do not meet the criteria for hedge accounting 748-8,757 - Total 8,177 (6,352) 14,724 (4,400) Non-current portion 8,177 (5,140) 13,609 (3,850) Current portion - (1,212) 1,115 (550) 51
53 Derivatives held for trading are classified as current assets or current liabilities. The fair value of a hedging derivative is classified as a non-current asset or a non-current liability, as applicable, if the remaining maturity of the hedged item exceeds twelve months. Otherwise, it is classified as a current asset or liability. In connection with the Refinancing process and the repayment of the first Brazilian Debentures, the hedge accounting for the interest rate swap was discontinued and the OCI balance was transferred to finance cost. Thereafter, any changes in fair value will be directly recognized in statement of operations. On March 5, 2018, Atento Brasil S.A. entered into a cross-currency swap to hedge a USD loan of 10,092 thousand U.S. dollars at a fixed rate of 3.40% exchanged to a 33,000 thousand Brazilian Reais with interest rate of the average daily rate of the one day over extra-group DI Interfinancial Deposits - plus a spread of 2.10% per annum. On April 1, 2015, the Company started a hedge accounting for net investment hedge related to exchange risk between the U.S. dollar and foreign operations in Euro (EUR), Mexican Peso (MXN), Colombian Peso (COP) and Peruvian Nuevo Sol (PEN). In connection with the Refinancing process, 8 of the 10 derivatives contracts designated as Net Investment Hedges were terminated between August 1, 2017 and August 4, 2017, generating positive cash of 46,080 thousand U.S. dollars, net of charges. During August 2017, Atento Luxco 1 also entered into new Cross-Currency Swaps related to exchange risk between U.S. dollars and Euro (EUR), Mexican Peso (MXN), Brazilian Reais (BRL) and Peruvian Nuevo Sol (PEN). Except for the Cross-Currency Swap between U.S. dollars and Brazilian Reais, all other Cross-Currency Swaps were designated for hedge accounting as net investment hedge. As of June 30, 2018, details of interest rate swap, cross-currency swaps that do not qualify for hedge accounting and net investment hedges were as follows: 52
54 Bank Maturity Notional currency Index Interest Rate Swap Notional in contract currency (thousands) Fair value assets/(liability) Other comprehensive income, net of taxes Change in OCI, net of taxes Statements of operations - Finance cost Statements of operations - Change in fair value (unaudited) D/(C) D/(C) D/(C) D/(C) D/(C) Itau Dec-18 BRL BRL CDI 135,000 (550) (550) Cross Currency Swaps - that do not qualify for hedge accounting Bank Maturity Purchase currency Selling currency Notional (thousands) Fair value assets/(liability) Other comprehensive income Change in OCI, net of taxes Statements of operations - Finance cost Statements of operations - Change in fair value (unaudited) D/(C) D/(C) D/(C) D/(C) D/(C) ABC Brasil S.A. Sep-18 USD BRL 10,092 1, (1,139) - Goldman Sachs Aug-22 BRL USD 754,440 7, (5,912) Bank Maturity Purchase currency Selling currency Net Investment Hedges Notional (thousands) Fair value assets/(liability) 8, (1,139) (5,912) Other comprehensive income Change in OCI, net of taxes Statements of operations - Finance cost Statements of operations - Change in fair value (unaudited) D/(C) D/(C) D/(C) D/(C) D/(C) Nomura International Aug-22 EUR USD 34,109 (102) Goldman Sachs Aug-22 MXN USD 1,065,060 5,967 (4,871) (2,386) - - Goldman Sachs Aug-22 PEN USD 194,460 (3,748) 4, Santander Jan-20 USD EUR 20,000-1, Santander Jan-20 USD MXN 11,111 - (2,113) Goldman Sachs Jan-20 USD EUR 48,000-3, Goldman Sachs Jan-20 USD MXN 40,000 - (7,600) Nomura International Jan-20 USD MXN 23,889 - (4,357) Nomura International Jan-20 USD EUR 22,000-1, Goldman Sachs Jan-18 USD PEN 13, (4) - - Goldman Sachs Jan-18 USD COP 7,200 - (80) (8) - - BBVA Jan-18 USD PEN 55, BBVA Jan-18 USD COP 28,800 - (359) ,117 (7,695) (1,899) - - Total 10,324 (7,695) (1,899) (233) (5,912) Derivative financial instrument - asset 14,724 Derivative financial instrument - liability (4,400) Gains and losses on net investment hedges accumulated in equity will be taken to the income statements when the foreign operation is partially disposed of or sold. 53
55 13. PROVISIONS AND CONTINGENCIES Atento has contingent liabilities arising from lawsuits in the normal course of its business. Contingent liabilities with a probable likelihood of loss are fully recorded as liabilities and the breakdown is as follows: Thousands of U.S. dollars 12/31/2017 6/30/2018 (audited) (unaudited) Non-current Provisions for liabilities 30,810 26,455 Provisions for taxes 19,833 19,040 Provisions for dismantling 9,249 8,318 Other provisions 1,294 2,334 Total non-current 61,186 56,147 Current Provisions for liabilities 10,543 4,205 Provisions for taxes 5,641 5,720 Provisions for dismantling - 14 Other provisions 2,884 5,779 Total current 19,068 15,718 Provisions for liabilities primarily relate to provisions for legal claims underway in Brazil. Atento Brasil S.A. has made payments in escrow related to legal claims from exemployees, amounting to 42,217 thousand U.S. dollars and 46,634 thousand U.S. dollars as of December 31, 2017 and June 30, 2018, respectively. Also, the variation of the period was impacted by the Brazilian Reais and Argentinian Peso depreciations against the U.S. dollar. Provisions for taxes mainly relate to probable contingencies in Brazil with respect to social security payments and other taxes, which are subject to interpretations by tax authorities. Atento Brasil S.A. has made payments in escrow related to taxes claims 4,407 thousand U.S. dollars and 3,717 thousand U.S. dollars as of December 31, 2017 and June 30, 2018, respectively. The amount recognized under Provision for dismantling corresponds to the necessary cost of dismantling of the installations held under operating leases to bring them to its original condition. As of June 30, 2018, lawsuits outstanding in the courts were as follows: Brazil At June 30, 2018, Atento Brasil was involved in approximately 15,897 labor-related disputes (14,750 labor disputes as of December 31, 2017), filed by Atento s employees or ex-employees for various reasons, such as dismissals or claims over employment conditions in general. The total amount of the main claims classified as possible was 129,993 thousand U.S. dollars (162,701 thousand U.S. dollars on December 31, 2017). In addition, at June 30, 2018, there are labor-related disputes belonging to the company Atento Brasil 1 (formerly Casa Bahia Contact Center Ltda CBCC ) totaling 499 thousand U.S. dollars. According to the Company s external attorneys, materialization of the risk event is probable. Furthermore, it is important to highlight out that the Superior Labor Court of Appeals (Tribunal Superior do Trabalho) during the month of August 2015 decided to amend the indexation rate related to labor contingencies. The decision alters the Reference Rate Index (TR) usually used to adjust the amount of the contingencies to the Special Broad Consumer Price Index ( ÍndicedePreçosaoConsumidorAmploEspecial IPCA-E). There are several questions about this matter, especially the period to which change should be applied as well as if the new index is appropriate. In addition, during October 2015, the Supreme Court (STF) issued a writ of Mandamus to the Federation of Brazilian Banks (FEBRABAN) suspending the application of the new index (IPCA-E). On September 30, 2017, a new decision of the Superior Labor Court of Appeals on the application of the index IPCA-E was amended, changing the initial date of the application of the index from June 30, 2009 to March 25, As early as December 2017 came the judgment of the Brazilian Bank Federation (FEBRABAN), declaring unfounded the suit proposed by FEBRABAN. With this unfounded, the effects of the injunction that had been granted by the STF were ceased. However, considering that this recent Supreme Court decision was rendered after the entry into force of Law 13,467 / 17 (Labor Reform), the conclusion that can be sustain it is that its effects would be limited to 25 March 2015 to 10 November 2017 because the new law gave a new text to the Article 879 of the Consolidated Labor Laws (CLT), to expressly determine that it will be apply the TR to upgrading of workers' claims arising from criminal conviction. 54
56 Thus, the Company considered this quarter the new modulation projection of the IPCA-E in labor, and this, the external opinion of our lawyers also considering as possible the probability of loss in an eventual dispute. The amount involved in the period from March 25, 2015 to November 10, 2017 is approximately 752 thousand U.S. dollars. We will monitor this issue during On June 30, 2018, the subsidiary RBrasil Soluções S.A. holds contingent liabilities of labor nature classified as possible in the approximate amount of 314 thousand U.S. dollars. On June 30, 2018, the subsidiary Interfile holds contingent liabilities of labor nature and social charges classified as possible in the approximate amount of 1,830 thousand U.S. dollars. Moreover, as of June 30, 2018, Atento Brasil was party to 14 civil public actions filed by the Labor Prosecutor s Office due to alleged irregularities mainly concerning daily and general working routine, lack of overtime control and improper health and safety conditions in the workplace. The total amount involved in these claims was approximately 89,645 thousand Brazilian Reais (23,249 thousand U.S. dollars), of which 2,912 thousand Brazilian Reais (755 thousand U.S. dollars) relate to claims that have been classified as probable by our internal and external lawyers, for which amount Atento Brasil has recorded a provision, as indicated in the paragraph above. We expect that our ultimate liability for these claims, if any, will be substantially less than the full amount claimed. These claims are generally brought with respect to specific jurisdictions in Brazil, and it is possible that in the future similar claims could be brought against us in additional jurisdictions. We cannot assure that these current claims or future claims brought against us will not result in liability to the Company, and that such liability would not have a material adverse effect on our business, financial condition and results of operations. As of June 30, 2018, Atento Brasil S.A. has 7 civil lawsuits ongoing for various reasons (8 on December 31, 2017) which, according to the Company s external attorneys, materialization of the risk event is possible. The total amount of the claims is approximately 5,322 thousand U.S. dollars (5,953 thousand U.S. dollars on December 31, 2017). In addition, at June 30, 2018, Atento Brasil S.A. has 42 disputes ongoing with the tax authorities and social security authorities, for various reasons relating to infraction proceedings filed (42 on December 31, 2017). The total amount of these claims is approximately 36,016 thousand U.S. dollars (59,445 thousand U.S. dollars on December 31, 2017). According to the Company s external attorneys, risk of material loss is possible. In March 2018, Atento Brasil S.A. received a tax notice from the Brazilian Federal Revenue Service, related to Corporate Income Tax (IRPJ) and Social Contribution on Net Income (CSLL) for the period from 2012 to 2015, due to the disallowance of the expenses on tax amortization of goodwill and deductibility of certain financing costs originated of the acquisition of Atento Brasil S.A. by Bain Capital in 2012, and the withholding taxes on payments made to certain of our former shareholders. The amount of the tax assessment from the Brazilian Federal Revenue Service, not including interest and penalties, was approximately 105,268 thousand U.S. dollars, and was assessed by the Company s outside legal counsel as possible loss. We disagree with the proposed tax assessment and we intend to defend our position, which we believe is meritorious, through applicable administrative and, if necessary, judicial remedies. Based on our interpretation of the relevant law, and based on the advice of our legal and tax advisors, we believe the position we have taken is sustainable. Consequently, no provisions are recognized regarding these proceedings. 55
57 In addition, as of June 30, 2018, there are tax authorities disputes belonging to the company CBCC totaling 1,730 thousand U.S. dollars. According to the Company s external attorneys, materialization of the risk event is probable. Spain At June 30, 2018, Atento Teleservicios España S.A.U. including its branches and our other Spanish companies were party to labor-related disputes filed by Atento employees or former employees for different reasons, such as dismissals and disagreements regarding employment conditions, totaling 715 thousand U.S. dollars. According to the Company s external lawyers, materialization of the risk event is possible. Mexico At June 30, 2018, Atento Mexico through its two entities (Atento Servicios, S.A. de C.V. and Atento Atencion y Servicios, S.A. de C.V.) is a party of labor related disputes filed by Atento employees that abandoned their employment or former employees that base their claim on justified termination reasons, totaling 9,715 thousand U.S. dollars (Atento Servicios, S.A. de C.V. totaling 6,649 thousand U.S. dollars and Atento Atencion y Servicios, S.A. de C.V.totaling 3,066 thousand U.S. dollars), according to the external labor law firm for possible risk labor disputes. Argentina In Argentina, as a consequence of an unfavourable sentence on the case ATUSA S.A. issued by Argentinian Internal Revenue Services ( Administración Federal de Ingresos Públicos ), notified on February 2017, the risk qualified so far as remote becomes now possible being this contingency estimated amount of approximately 1,508 thousand U.S. dollars at June 30, 2018 (2,454 thousand U.S. dollars on December 31, 2017). A formal appeal has been filed at the National Supreme Court of Justice. Given the nature of the risks covered by these provisions, it is not possible to determine a reliable schedule of potential payments, if any. 14. INCOME TAX The breakdown of the Atento Groups s income tax expense is as follow: Thousands of U.S. dollars Thousands of U.S. dollars For the three months ended June 30, For the six months ended June 30, Income taxes (unaudited) (unaudited) Current tax expense (3,703) (2,621) (9,777) (12,440) Deferred tax (3,630) 3,080 (1,314) 7,384 Total income tax expense (7,333) 459 (11,091) (5,056) For the three months ended June 30, 2018, Atento Group s interim condensed consolidated financial information presented a profit before income tax in the amount of profit of 3,581 thousand U.S. dollars and a tax benefit of 459 thousand U.S. dollars compared to a profit before income tax in the amount of 3,681 thousand U.S. dollars and a tax expense of 7,333 thousand U.S. dollars for the three months ended June 30, This movement is due to non-deductible costs occurred in our holding Companies. For the six months ended June 30, 2018, Atento Group s interim condensed consolidated financial information presented profit before income tax in the amount of 7,433 thousand U.S. dollars and a tax expense of 5,056 thousand U.S. dollars compared to a profit before income tax of 16,461 thousand U.S. dollars and a tax expense of 11,091 thousand U.S. dollars for the six months ended June 30, This movement is due to non-deductible costs occurred in our holding Companies. 56
58 15. EARNINGS/(LOSS) PER SHARE Basic earnings per share is calculated by dividing the profits attributable to equity owners of the Company by the weighted average number of ordinary shares outstanding during the periods as demonstrated below: For the three months ended June 30, For the six months ended June 30, (unaudited) (unaudited) Profit/(loss) attributable to equity owners of the Company Atento s Profit/(loss) attributable to equity owners of the parent from continuing operations (in thousands of U.S. dollars) (3,868) 3,266 5,106 1,302 Weigthed average number of ordinary shares 73,909,056 73,909,056 73,909,056 73,909,056 Basic (loss)/earnings per share from continuing operations (in U.S. dollars) (0.05) Diluted results per share are calculated by adjusting the weighted average number of ordinary shares outstanding to reflect the conversion of all dilutive ordinary shares. The weighted average number of ordinary shares outstanding used to calculate both basic and diluted net loss per share attributable to common stockholders is the same. The share-based plan was first granted in October For the three months ended June 30, For the six months ended June 30, (unaudited) (unaudited) Profit/(loss) attributable to equity owners of the Company Atento s Profit/(loss) attributable to equity owners of the parent from continuing operations (in thousands of U.S. dollars) (3,868) 3,266 5,106 1,302 Potential increase in number of ordinary shares outstanding in respect of share-based plan - 637, , ,839 Adjusted weighted average number of ordinary shares 73,909,056 74,546,895 74,713,330 74,546,895 Diluted (loss)/earnings per share from continuing operations (in U.S. dollars) (1) (0.05) (1) For the three months ended June 30, 2017, potential ordinary shares of 683,242, relating to the stock option plan were excluded from the calculation of diluted net loss per share, as their effect would dilute the loss per share. 57
59 16. RELATED PARTIES Directors The directors of the Company as of the date on which the interim condensed consolidated financial information were prepared are Melissa Bethell, Marie-Catherine Brunner, Thomas Iannotti, David Garner, Stuart Gent, Devin O Reilly, Antonio Viana-Baptista and Alejandro Reynal. At June 30, 2018, some members of Board of Directors have the right to the stock-based compensation as described in Note 10. Key management personnel Key management personnel include those persons empowered and responsible for planning, directing and controlling the Atento Group s activities, either directly or indirectly. The following table shows the total remuneration paid to the Atento Group s key management personnel in the six months ended June 30, 2017 and 2018: For the six months ended June 30, (unaudited) Total remuneration paid to key management personnel 3,223 3, OTHER INFORMATION a. Guarantees and commitments At June 30, 2018, the Atento Group has guarantees and commitments to third parties amounting to 336,932 thousand U.S. dollars (322,233 thousand U.S. dollars at December 31, 2017). The total amount of operating lease expenses recognized in the interim condensed consolidated income statements for the six months ended June 30, 2018 was 41,916 thousand U.S. dollars (35,069 thousand U.S. dollars at June 30, 2017). There are no contingent payments on operating leases recognized in the interim condensed consolidated income statements for the six months ended June 30, 2017 and The operating leases where the Company acts as lessee are mainly on premises intended for use as call centers. These leases have various termination dates, with the latest terminating in As of June 30, 2018, the payment commitment for the early cancellation of these leases is 159,798 thousand U.S. dollars (137,519 thousand U.S. dollars at December 31, 2017). 58
60 PART II - OTHER INFORMATION LEGAL PROCEEDINGS See Note 13 to the unaudited interim consolidated financial information. RISK FACTORS There were no material changes to the risk factors described in section Risk Factors in our Annual Form 20-F, for the year ended December 31,
61 SIGNATURES Pursuant to the requirements of the Securities Exchange Act of 1934, the registrant has duly caused this report to be signed on its behalf by the undersigned, thereunto duly authorized. ATENTO S.A. Date: July 30, By: /s/ Alejandro Reynal Name: Alejandro Reynal Title: Chief Executive Officer By: /s/ Mauricio Montilha Name: Mauricio Montilha Title: Chief Financial Officer 60
62 Atento Reports Fiscal 2018 Second-Quarter Results Highlighted by Top-line Growth and EPS Expansion Solid top-line growth across geographies, with revenues up 7.2% Multisector revenues up 9.1% in Q2, representing 60.9% of revenues Revenue mix from higher value-added solutions up 0.7 p.p. to 26.4% EBITDA grew a solid 15.6% in Q2, with margin up 0.7 p.p. to 10.4% Strong recurring EPS expansion of 19.9% to $0.20 Free cash flow before interest and acquisitions of $43.3 million in Q2, with FCF positive at $37.3 million Net debt down 5.4% sequentially to $372.9 million, with net leverage down to 1.7x in Q2 vs 1.8x in Q1 Robust Balance Sheet and Cash Flow generation allow to pursue accretive growth opportunities and to initiate a Share Buyback program NEW YORK, July 30, 2018 Atento S.A. (NYSE: ATTO), the largest provider of customer-relationship management and business-process outsourcing services in Latin America, and among the top five providers globally, today announced its second-quarter 2018 operating and financial results. All comparisons in this announcement are year-over-year and in constant-currency (CCY), unless noted otherwise, and may differ from 6K due to certain intra-group eliminations. Summary ($ in millions except EPS) Q Q CCY Growth YTD 2018 YTD 2017 CCY Growth Income Statement Revenue % % EBITDA (1) % % EBITDA Margin 10.4% 9.7% +0.7 p.p. 10.3% 10.2% +0.1 p.p. Adjusted EBITDA (1) % % Adjusted EBITDA Margin 10.4% 11.1% -0.7 p.p. 10.3% 11.3% -1.0 p.p. Net Income (2) 4.0 (3.7) n.m Recurring Net Income (2) % % Earnings Per Share (2) $0.05 ($0.05) $0.03 $0.07 Recurring Earnings Per Share (2) $0.20 $0.13 $0.30 $0.30 Cashflow, Debt and Leverage Free Cash Flow (3) Net Debt Leverage (x) 1.7x 1.8x (1) EBITDA is defined as profit/(loss) for the period from continuing operations before net finance costs, income taxes and depreciation and amortization. Adjusted EBITDA is defined as EBITDA adjusted to exclude restructuring costs, site relocation costs and other items not related to our core results of operations. EBITDA and Adjusted EBITDA are not measures defined by IFRS. The most directly comparable IFRS measure to EBITDA and Adjusted EBITDA is profit/(loss) for the year/period from continuing operations. (2) Reported Net Income and Earnings Per Share and Adjusted EBITDA, Adjusted EBITDA Margin and Adjusted Earnings Per Share refer only to continuing operations. Reported and Adjusted Earnings Per Share, for the period ended June 30, 2018, were calculated considering the weighted average number of ordinary shares of 73,909,056. For the period ended June 30, 2017, the number of ordinary shares was 73,909,056. Recurring Earnings and EPS attributable to Owners of the parent company (3) We define Free Cash Flow before interest and acquisitions as operating cashflow minus Capex payments and income tax expenses. 1
63 Alejandro Reynal, Atento s Chief Executive Officer, commented, The second quarter reported good top and bottom line performance across Atento s footprint. Multisector clients remain our Company s growth engine across all regions with a 9% revenue increase. We continue to see a positive commercial evolution as we expand and roll out our value offer for digital customer experience and business process outsourcing solutions. Mauricio Montilha, Atento s Chief Financial Officer, said, "Second quarter results were very much aligned with our expectations and guidance. As seen in the last quarter, Americas performance drove consolidated margins to 10.4% in the quarter. In Brazil, we continued implementing the operational improvement plan, as highlighted in the first quarter, with positive impacts on margins expected for the second half of the year. The $37 million free cash flow generated in the quarter will help support our future growth. Mr. Reynal concluded, We are confident with the progress made in the first half of 2018 and the prospects of the business moving forward. Our strong balance sheet and solid cash flow generation allows us to continue executing on our capital allocation strategy that includes driving organic growth, pursuing accretive acquisitions and to initiate a share buyback program. Atento s share buyback program reflects our confidence in our Company s strategy to deliver profitable growth, the future prospects of our business and our ongoing commitment to shareholder value creation. Second Quarter Consolidated Operating Results All comparisons in this announcement, unless otherwise noted, are year-over-year and in constant-currency (CCY). Consolidated revenues grew by 7.2% in the second quarter of 2018, driven by the continued growth from Americas and Brazil, particularly from revenue growth of Multisector clients across all regions. On a reported basis, total revenue was stable in the quarter. Multisector continued to drive growth, with a revenue increase of 9.1% and now represents 60.9% of total revenue (+0.4 p.p. YoY), supported by gains in all regions and across several verticals. Revenues from Telefónica increased 4.4% in Q2, due to higher volumes in Brazil and Americas, partially offset by lower volumes in Spain. Revenues from higher value-added solutions represented 26.4% of total revenues in Q2, up 0.7 p.p. year-over-year. EBITDA increased by 15.6% year-over-year, to $49.1 million. EBITDA margin improved by 70 basis points to 10.4% as a result of higher margins in Americas and EMEA, partially offset by lower margins in Brazil. Recurring net income attributable to owners of the parent company totaled $14.8 million in Q2 2018, implying recurring EPS of $0.20, compared to $0.13 in The strong EPS expansion of 19.9% is a result of lower net interest expenses reflecting the debt refinance concluded in August 2017, as well as a lower effective tax rate in Q2 2018, with year-todate ETR of 33%, in line with guidance. Free cash flow generation was positive $37.3 million in the quarter, with FCF before interest and acquisitions of $43.3 million, driven by positive changes in working capital following the one-off negative impacts in Q Capex payments represented 2.6% of revenues, compared to 2.1% in the previous year. Capex is expected to pick up in the second half of the year, with full-year capex as percentage of revenues expected to be in line with guidance. At the end of June 2018, Atento s gross debt totaled $479.3 million, down 12.3% year-over-year and down 3.1% sequentially. Net debt fell to $372.9 million, 6.9% lower year-overyear and 5.4% lower quarter-over-quarter. Net leverage fell to 1.7x, down from 1.8x in Q1, reflecting higher cash position even after debt amortization. Adjusted earnings, adjusted EBITDA and adjusted earnings per share are non-gaap financial measures and are reconciled to their most directly comparable GAAP measures in the accompanying financial tables. 2
64 Segment Reporting ($ in millions) Q Q CCY growth YTD 2018 YTD 2017 CCY growth Brazil Region Revenue % % Adjusted EBITDA % % Adjusted EBITDA Margin 8.6% 12.3% -3.7 p.p. 9.9% 13.4% -3.5 p.p. Operating Income/(loss) (2.8) 2.5 N.M (4.0) 10.9 N.M Americas Region Revenue % % Adjusted EBITDA % % Adjusted EBITDA Margin 13.5% 11.7% 1.8 p.p. 12.3% 10.9% 1.4 p.p. Operating Income/(loss) % % EMEA Region Revenue % % Adjusted EBITDA % % Adjusted EBITDA Margin 9.7% 6.9% 2.8 p.p. 8.8% 7.2% 1.6 p.p. Operating Income/(loss) 0.3 (2.0) N.M 0.7 (3.3) N.M Brazil Region Revenues in Brazil grew 6.3% in the quarter and 4.8% year-to-date. Multisector clients continue to drive growth, with revenue up 6.6% in Q and 5.5% year-to-date. Operational performance was in line with expectations, and reflects Atento s solid conversion of the commercial pipeline in the quarter, with new client wins across several verticals. Revenues from Telefónica increased 5.4% in Q2 and 3.3% year-to-date. Multisector mix went up 0.2 p.p. to 60.9% of total revenues. In Q2 2018, Adjusted EBITDA decreased to $19.1 million, with margin of 8.6%. Profitability is on track to expected improvements in H2 2018, and includes about 200 bps from costs related to operational adjustments to specific programs, and volume reduction due to truck drivers strike. We expect that most operational plans will be fully completed along Q Americas Region Once again, and similarly to the recent performance, revenue growth was strong in Americas, up 11.0% in Q2 and 10.4% year-to-date. Revenues from Multisector increased by 14.0% in Q2 and 14.9% year-to-date, supported by higher volumes across several verticals in Argentina, Chile and Mexico. Likewise, revenue from Telefónica increased by 6.9% in Q2 and 4.3% year-to-date, driven by higher volumes in Argentina, Mexico and Chile. The strong performance continued to push Multisector up another 1.2 p.p. versus Q to 59.6% of revenues (up 2.1 p.p. to 59.2% year-to-date). In the quarter, Adjusted EBITDA reached $26.1 million, with margins up 1.8 p.p. to 13.5%, driven by higher volumes from Multisector. Year-to-date, Adjusted EBITDA totaled $47.1 million, with margins up 1.4 p.p. to 12.3%. Americas benefited from insurance reimbursement of cumulative losses related to Puerto Rico hurricane, offsetting lower volumes from domestic operations not totally restated to prior year levels. 3
65 EMEA Region Revenue in EMEA increased by 2.9% in Q2, remaining stable year-to-date. This is the first year-over-year revenue growth since Q and the third consecutive sequential quarterover-quarter growth. Revenues from Multisector increased by 12.3% in Q and 10.0% year-to-date, mostly driven by higher volumes from non-tef telco clients, which more than offset the 2.3% drop in revenues from Telefónica on lower volumes. Revenue mix from Multisector was up 3.2 p.p. to 38.9% of total in the quarter and stable sequentially. Adjusted EBITDA in EMEA increased by 49.7% to $ 6.0 million, reflecting improved mix from Multisector clients, with Adjusted EBITDA margin increasing by 2.8 p.p. to 9.7%. Year-todate, Adjusted EBITDA margins were up 1.5 p.p. to 8.8%. Cash Flow and Capital Structure Free cash flow totaled $37.3 million in Q2, while free cash flow before interest and acquisitions was $43.3 million. Year-to-date, free cash flow before interest and acquisitions reached $6.9 million, up from $5.8 million in the same period of This strong result can be traced to positive changes in working capital, reversing the one-off negative impact in Q Capex totaled 2.6% of revenues, versus 2.1% in Q Capex is expected to pick up in the second half of the year, with full-year capex as a percentage of revenue expected to be in line with guidance. At the end of June 2018, Atento held cash and cash equivalents of $106 million and revolving credit facilities of $101 million, of which $96 million were undrawn, implying total liquidity of $202 million. Total gross debt dropped 3.1% sequentially to $479.3 million, while third-party total net debt decreased 5.4% to $372.9 million compared to Q Net leverage, measured by Adjusted LTM EBITDA to net debt ratio, was 1.7x, down from the 1.8x in both Q and Q1 2018, reflecting higher cash position even after debt amortization. Capital Allocation: up to $30 million share buyback program approved We believe that our robust Balance Sheet and Cash Flow generation, combined with expectations for H2 2018, will allow the Company to focus on accretive growth opportunities, by continuing to deploy higher value-added solutions in all regions, and pursuing opportunities for capability building. Additionally, as part of our capital allocation strategy, we believe the share buyback program approved by the Board of Directors demonstrates confidence in our business prospects. We expect the program to be concluded in up to 12 months. Conference Call The Company will host a conference call and webcast on Tuesday, July 31, 2018 at 10:00 am ET to discuss its financial results. The conference call can be accessed by dialing: +1 (877) toll free domestic, UK: (+44) toll free, Brazil: (+55) toll free, or Spain: (+34) toll free. All other international callers can access the conference call by dialing: +1 (201) toll free. No passcode is required. Individuals who dial in will be asked to identify themselves and their affiliations. The live webcast of the conference call will be available on Atento s Investor Relations website at investors.atento.com. A web-based archive of the conference call will also be available at the above website. 4
66 About Atento Atento is the largest provider of customer relationship management and business process outsourcing (CRM BPO) solutions in Latin America, and among the top five providers globally, based on revenues. Atento is also a leading provider of nearshoring CRM/BPO services to companies that carry out their activities in the United States. Since 1999, the company has developed its business model in 13 countries where it employs 150,000 people. Atento has over 400 clients to whom it offers a wide range of CRM/BPO services through multiple channels. Atento's clients are mostly leading multinational corporations in sectors such as telecommunications, banking and financial services, health, retail and public administrations, among others. Atento s shares trade under the symbol ATTO on the New York Stock Exchange (NYSE). In 2016, Atento was named one of the World s 25 Best Multinational Workplaces by Great Place to Work for a fourth consecutive year. For more information visit Investor Relations Shay Chor shay.chor@atento.com Felipe Joaquim Martins de Souza felipe.souza@atento.com Media Relations Maite Cordero atento.media@atento.com 5
67 Forward-Looking Statements This press release contains forward-looking statements. Forward-looking statements can be identified by the use of words such as "may," "should," "expects," "plans," "anticipates," "believes," "estimates," "predicts," "intends," "continue" or similar terminology. These statements reflect only Atento's current expectations and are not guarantees of future performance or results. These statements are subject to risks and uncertainties that could cause actual results to differ materially from those contained in the forward-looking statements. These risks and uncertainties include, but are not limited to, competition in Atento s highly competitive industries; increases in the cost of voice and data services or significant interruptions in these services; Atento s ability to keep pace with its clients needs for rapid technological change and systems availability; the continued deployment and adoption of emerging technologies; the loss, financial difficulties or bankruptcy of any key clients; the effects of global economic trends on the businesses of Atento s clients; the nonexclusive nature of Atento s client contracts and the absence of revenue commitments; security and privacy breaches of the systems Atento uses to protect personal data; the cost of pending and future litigation; the cost of defending Atento against intellectual property infringement claims; extensive regulation affecting many of Atento s businesses; Atento s ability to protect its proprietary information or technology; service interruptions to Atento s data and operation centers; Atento s ability to retain key personnel and attract a sufficient number of qualified employees; increases in labor costs and turnover rates; the political, economic and other conditions in the countries where Atento operates; changes in foreign exchange rates; Atento s ability to complete future acquisitions and integrate or achieve the objectives of its recent and future acquisitions; future impairments of our substantial goodwill, intangible assets, or other long-lived assets; and Atento s ability to recover consumer receivables on behalf of its clients. In addition, Atento is subject to risks related to its level of indebtedness. Such risks include Atento s ability to generate sufficient cash to service its indebtedness and fund its other liquidity needs; Atento s ability to comply with covenants contained in its debt instruments; the ability to obtain additional financing; the incurrence of significant additional indebtedness by Atento and its subsidiaries; and the ability of Atento s lenders to fulfill their lending commitments. Atento is also subject to other risk factors described in documents filed by the company with the United States Securities and Exchange Commission. These forward-looking statements speak only as of the date on which the statements were made. Atento undertakes no obligation to update or revise publicly any forward-looking statements, whether as a result of new information, future events or otherwise. SELECTED FINANCIAL DATA The following selected financial information should be read in conjunction with the interim consolidated financial statements and the section entitled Management s Discussion and Analysis of Financial Condition and Results of Operations presented elsewhere in the Form 6-K. 6
68 Consolidated Statements of Operations for the Three and Six Months Ended June 30, 2017 and 2018 ($ in millions, except percentage changes) For the three months ended Change For the six months ended June 30, excluding FX June 30, Change (%) (%) (unaudited) (unaudited) Change (%) Change excluding FX (%) Revenue (0.1) Other operating income (28.4) (21.5) (13.1) (5.3) Operating expenses: Supplies (17.5) (17.1) (2.4) 5.8 (34.3) (34.7) Employee benefit expenses (355.1) (357.2) (700.8) (724.7) Depreciation (11.1) (8.2) (26.5) (21.1) (22.9) (19.5) (14.9) (12.0) Amortization (12.3) (15.4) (25.9) (30.4) Changes in trade provisions (22.8) (24.4) - (0.1) N.M. N.M. Other operating expenses (63.5) (56.1) (11.6) (4.9) (119.3) (113.3) (5.0) (1.2) Total operating expenses (459.3) (453.9) (1.2) 5.9 (903.2) (922.8) Operating profit Finance income (69.3) (65.9) (62.3) (60.4) Finance costs (16.0) (12.3) (22.8) (19.3) (33.5) (27.0) (19.5) (16.8) Change in fair value of financial instruments (0.3) 9.0 N.M. N.M. (0.3) 5.9 N.M. N.M. Net foreign exchange loss (4.3) (19.0) N.M. N.M. (0.9) (21.8) N.M. N.M. Net finance expense (19.1) (21.9) (31.1) (41.5) Profit before income tax (0.7) (55.1) (52.7) Income tax (expense)/benefit (7.3) 0.5 (106.3) (106.2) (11.1) (5.1) (54.5) (53.8) (Loss)/profit for the period (3.7) 4.0 N.M. N.M (56.4) (50.3) (Loss)/profit attributable to: Owners of the parent (3.9) 3.3 N.M. N.M (74.9) (71.9) Non-controlling interest N.M. N.M N.M. N.M. (Loss)/profit for the period (3.7) 4.0 N.M. N.M (56.4) (50.3) Other financial data: EBITDA (1) (unaudited) Adjusted EBITDA (1) (unaudited) (6.5) (7.0) (2.6) (1) For reconciliation with IFRS as issued by IASB, see section "Summary Consolidated Historical Financial Information - Reconciliation of EBITDA and Adjusted EBITDA to profit/(loss)". N.M. means not meaningful 7
69 Reconciliation of EBITDA and Adjusted EBITDA to profit/(loss): For the three months ended June 30, For the six months ended June 30, ($ in millions) (unaudited) (Loss)/profit from continuing operations (3.7) Net finance expense Income tax expense 7.3 (0.5) Depreciation and amortization EBITDA (non-gaap) (unaudited) Restructuring costs (a) Other (b) Total non-recurring items (*) Adjusted EBITDA (non-gaap) (unaudited) (*) We define non-recurring items as items that are limited in number, clearly identifiable, unusual, are unlikely to be repeated in the near future in the ordinary course of business and that have a material impact on the consolidated results of operations. Non-recurring items can be summarized as demonstrated below: a) Restructuring costs primarily included restructuring activities and other personnel costs that were not related to our core results of operations. Restructuring costs for the three and six months ended June 30, 2017, primarily relates to the costs to adapt the organization in Argentina and Brazil to the lower level of activities and the investments made in Brazil, Mexico and Spain to implement a lowercost operating model. b) Other non-recurring items for three and six months ended June 30, 2017, mainly refer to consulting and other non-recurring costs. 8
70 Reconciliation of Adjusted Earnings to profit/(loss): For the three months ended June 30, For the six months ended June 30, ($ in millions) (unaudited) (Loss)/profit from continuing operations (3.7) Amortization of acquisition related intangible assets (a) Restructuring costs (b) (*) Other (c) (*) Change in fair value of financial instruments (d) 0.3 (9.0) 0.3 (5.9) Net foreign exchange gain/(loss) Tax effect (e) (2.0) (3.8) (5.4) (6.1) Total of add-backs Adjusted Earnings (non-gaap) (unaudited) Adjusted Earnings per share (in U.S. dollars) (**) (unaudited) Adjusted Earnings attributable to Owners of the parent (non-gaap) (unaudited) Adjusted Earnings per share attributable to Owners of the parent (in U.S. dollars) (**) (unaudited) ( *) We define non-recurring items as items that are limited in number, clearly identifiable, unusual, are unlikely to be repeated in the near future in the ordinary course of business and that have a material impact on the consolidated results of operations. Non-recurring items can be summarized as demonstrated below: (a) (b) (c) (d) (e) Amortization of acquisition related intangible assets represents the amortization expense of customer base, recorded as intangible assets. This customer base represents the fair value (within the business combination involving the acquisition of control of Atento Group) of the intangible assets arising from service agreements (tacit or explicitly formulated in contracts) with Telefónica Group and with other customers. Restructuring costs primarily included restructuring activities and other personnel costs that were not related to our core results of operations. Restructuring costs for the three and six months ended June 30, 2017, primarily relates to the costs to adapt the organization in Argentina and Brazil to the lower level of activities and the investments made in Brazil, Mexico and Spain to implement a lower-cost operating model. Other non-recurring items for three and six months ended June 30, 2017, mainly refer to consulting and other non-recurring costs. Since April 1, 2015, the Company designated the foreign currency risk on certain of its subsidiaries as net investment hedges using financial instruments as the hedging items. As a consequence, any gain or loss on the hedging instrument, related to the effective portion of the hedge is recognized in other comprehensive income (equity) as from that date. The gains or losses related to the ineffective portion are recognized in the statements of operations and for comparability, and those adjustments are added back to calculate Adjusted Earnings. The tax effect represents the impact of the taxable adjustments based on tax nominal rate by country. For the three months ended June 30, 2017 and 2018, the effective tax rate after moving nonrecurring items was 49.0% and 17.6%, respectively. For the six months ended June 30, 2017 and 2018, the effective tax rate after moving non-recurring items is 42.7% and 32.9%, respectively. (**) Adjusted Earnings per share is calculated based on the weighted average number of ordinary shares outstanding of 73,909,056 as of June 30, 2017 and
71 Financing Arrangements Net debt with third parties as of June 30, 2017 and 2018 is as follow: As of June 30, ($ in millions, except Net Debt/Adj. EBITDA LTM) (unaudited) Cash and cash equivalents Debt: Senior Secured Notes Brazilian Debentures BNDES Finance Lease Payables Other Borrowings Total Debt Net Debt with third parties (1) (unaudited) Adjusted EBITDA LTM (2) (non-gaap) (unaudited) Net Debt/Adjusted EBITDA LTM (non-gaap) (unaudited) 1.8x 1.7x 1) In considering our financial condition, our management analyzes Net debt with third parties, which is defined as total debt less cash and cash equivalents. Net debt with third parties is not a measure defined by IFRS and it has limitations as an analytical tool. Net debt with third parties is neither a measure defined by or presented in accordance with IFRS nor a measure of financial performance and should not be considered in isolation or as an alternative financial measure determined in accordance with IFRS. Net debt is not necessarily comparable to similarly titled measures used by other companies. 2) Adjusted EBITDA LTM (Last Twelve Months) is defined as EBITDA adjusted to exclude restructuring costs, site relocation costs and other items not related to our core results of operations. 10
72 ATENTO S.A. AND SUBSIDIARIES INTERIM CONSOLIDATED STATEMENTS OF FINANCIAL POSITION As of December 31, 2017 and June 30, 2018 (In thousands of U.S. dollars, unless otherwise indicated) ASSETS December 31, June 30, (audited) (unaudited) NON-CURRENT ASSETS 764, ,176 Intangible assets 230, ,245 Goodwill 153, ,951 Property, plant and equipment 152, ,321 Non-current financial assets 90,076 90,987 Trade and other receivables 21,677 14,035 Other non-current financial assets 60,222 63,343 Derivative financial instruments 8,177 13,609 Other taxes receivable 7,282 6,050 Deferred tax assets 131, ,622 CURRENT ASSETS 566, ,585 Trade and other receivables 410, ,021 Trade and other receivables 388, ,031 Current income tax receivable 21,969 24,990 Derivative financial instruments - 1,115 Other taxes receivable 12,072 11,542 Other current financial assets 1,810 1,489 Cash and cash equivalents 141, ,418 TOTAL ASSETS 1,330,305 1,256,761 The accompanying notes are an integral part of the interim consolidated financial information. 11
73 ATENTO S.A. AND SUBSIDIARIES INTERIM CONSOLIDATED STATEMENTS OF FINANCIAL POSITION As of December 31, 2017 and June 30, 2018 (In thousands of U.S. dollars, unless otherwise indicated) December 31, June 30, EQUITY AND LIABILITIES (audited) (unaudited) TOTAL EQUITY 377, ,086 EQUITY ATTRIBUTABLE TO: NON-CONTROLLING INTEREST 9,476 9,339 OWNERS OF THE PARENT COMPANY 368, ,747 Share capital Reserve for acquisition of non-controlling interest (23,531) (23,531) Share premium 639, ,140 Retained losses (94,535) (93,233) Translation differences (170,063) (184,008) Hedge accounting effects 9,594 7,695 Stock-based compensation 7,415 9,636 NON-CURRENT LIABILITIES 582, ,598 Deferred tax liabilities 43,942 35,868 Debt with third parties 439, ,245 Derivative financial instruments 5,140 3,850 Provisions and contingencies 61,186 56,147 Non-trade payables 8,094 17,646 Option for the acquisition of non-controlling interest 23,752 20,377 Other taxes payable 1,025 3,465 CURRENT LIABILITIES 369, ,077 Debt with third parties 46,560 59,078 Derivative financial instruments 1, Trade and other payables 302, ,731 Trade payables 94,078 86,361 Income tax payables 8,058 7,216 Other taxes payables 86,166 82,255 Other non-trade payables 114, ,899 Provisions and contingencies 19,068 15,718 TOTAL EQUITY AND LIABILITIES 1,330,305 1,256,761 The accompanying notes are an integral part of the interim consolidated financial information. 12
74 Free Cash Flow: For the three months ended June 30, For the six months ended June 30, ($ in millions) (unaudited) (***) (unaudited) (***) Operating Cash Flow (1) Cash Capex (2) Income Tax Paid Free Cash Flow before interest and acquisitions Acquisitions Net Financial Expenses (3) Free Cash Flow (FCF) (1) We define Operating Cash flow as Net Cash flow from/(used in) operating activities (as per 6K) adding back net interest and income tax expenses. (2) Does not consider acquisitions (3) Interest payments related to the 2022 SSN are done every February and August, until Bond maturity in August Q includes hedge adjustments of negative $3.1 million and withholding taxes of negative $1.6 million, versus hedge adjustments of positive $1.5 million and no withholding taxes in Q (***) These preliminary results are unaudited and are based on management's initial review of operations for the first quarter ended March 31, 2018 and remain subject to the completion of the Company's customary annual closing and review procedures. Final adjustments and other material developments may arise between the date hereof and the filing of the Company's Annual Report on Form 20-F. 13

75

76
77
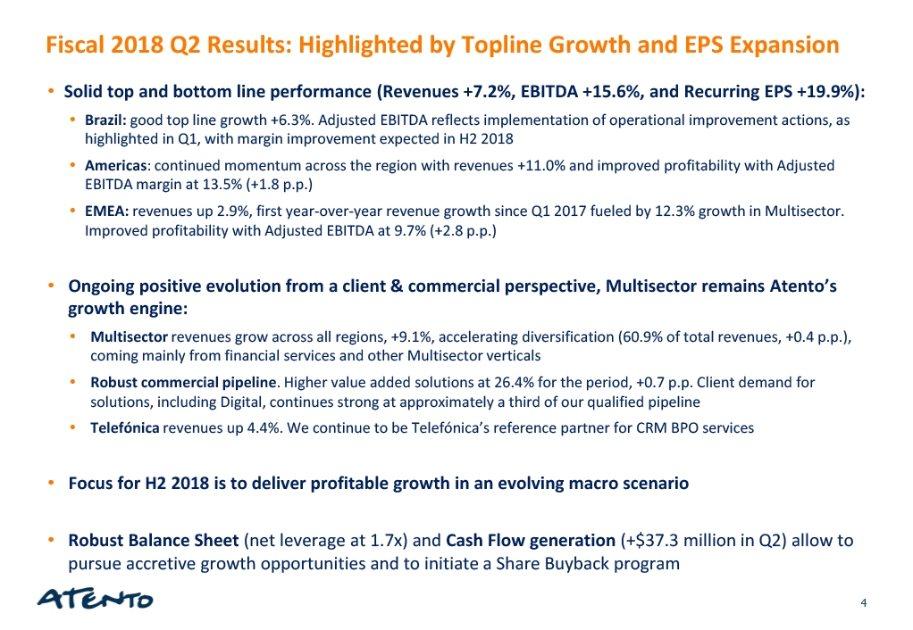
78
79

80
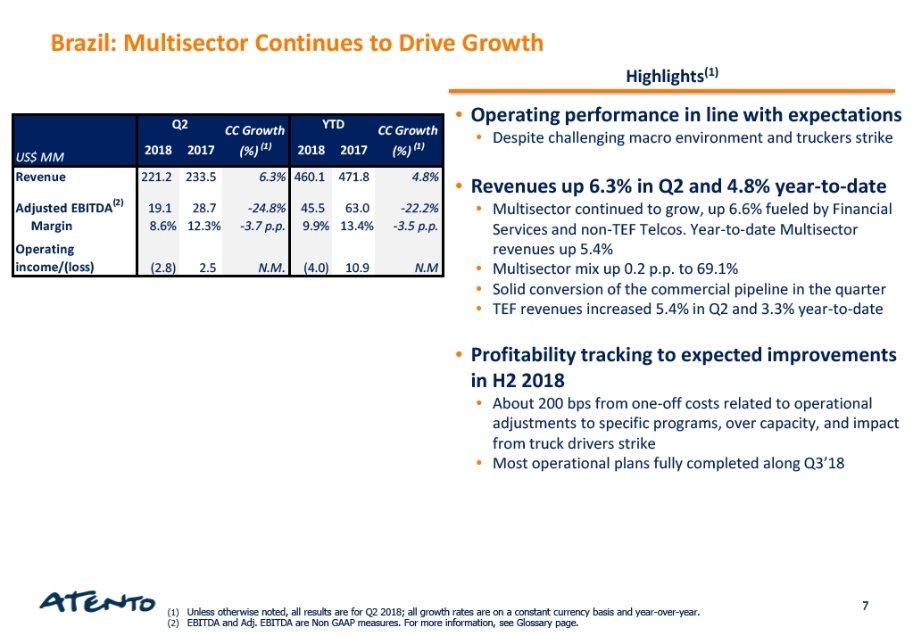
81
82
83

84
85
86
87
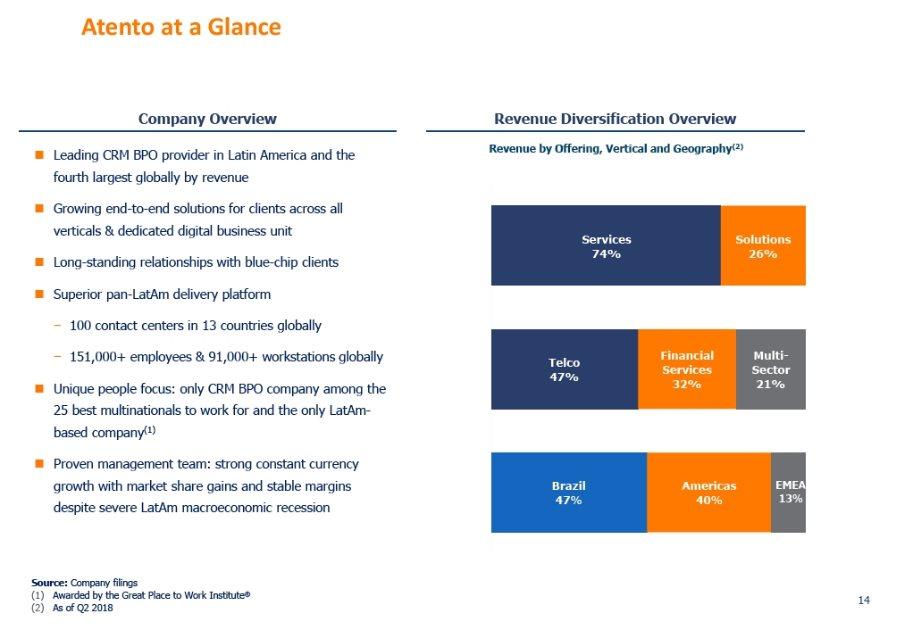
88

89
90

91
92

93
94
95

96

97
98
99
100

101
UNITED STATES SECURITIES AND EXCHANGE COMMISSION Washington, D.C
 UNITED STATES SECURITIES AND EXCHANGE COMMISSION Washington, D.C. 20549 FORM 6-K Report of Foreign Private Issuer Pursuant to Rule 13a-16 or 15d-16 of the Securities Exchange Act of 1934 For the month
UNITED STATES SECURITIES AND EXCHANGE COMMISSION Washington, D.C
 UNITED STATES SECURITIES AND EXCHANGE COMMISSION Washington, D.C. 20549 FORM 6-K Report of Foreign Private Issuer Pursuant to Rule 13a-16 or 15d-16 of the Securities Exchange Act of 1934 For the month
UNITED STATES SECURITIES AND EXCHANGE COMMISSION Washington, D.C
 UNITED STATES SECURITIES AND EXCHANGE COMMISSION Washington, D.C. 20549 FORM 6-K Report of Foreign Private Issuer Pursuant to Rule 13a-16 or 15d-16 of the Securities Exchange Act of 1934 For the month
UNITED STATES SECURITIES AND EXCHANGE COMMISSION Washington, D.C
 UNITED STATES SECURITIES AND EXCHANGE COMMISSION Washington, D.C. 20549 FORM 6-K Report of Foreign Private Issuer Pursuant to Rule 13a-16 or 15d-16 of the Securities Exchange Act of 1934 For the month
UNITED STATES SECURITIES AND EXCHANGE COMMISSION Washington, D.C
 UNITED STATES SECURITIES AND EXCHANGE COMMISSION Washington, D.C. 20549 FORM 6-K Report of Foreign Private Issuer Pursuant to Rule 13a-16 or 15d-16 of the Securities Exchange Act of 1934 For the year ended
Ordinary Shares, no par value New York Stock Exchange SecuritiesregisteredortoberegisteredpursuanttoSection12(g)oftheAct: None (Title of Class)
oftheAct: None (Title of Class)") UNITED STATES SECURITIES AND EXCHANGE COMMISSION Washington, D.C. 20549 FORM 20-F ANNUAL REPORT PURSUANT TO SECTION 13 OR 15(d) OF THE SECURITIES EXCHANGE ACT OF 1934 for the fiscal year ended: December
UNITED STATES SECURITIES AND EXCHANGE COMMISSION Washington, D.C. 20549 FORM 20-F ANNUAL REPORT PURSUANT TO SECTION 13 OR 15(d) OF THE SECURITIES EXCHANGE ACT OF 1934 for the fiscal year ended: December
UNITED STATES SECURITIES AND EXCHANGE COMMISSION Washington, D.C FORM 20-F
 UNITED STATES SECURITIES AND EXCHANGE COMMISSION Washington, D.C. 20549 FORM 20-F ANNUAL REPORT PURSUANT TO SECTION 13 OR 15(d) OF THE SECURITIES EXCHANGE ACT OF 1934 for the fiscal year ended: December
Grand Duchy of Luxembourg (Jurisdiction of incorporation or organization) 4 rue Lou Hemmer, L 1748 Luxembourg Findel
 4 rue Lou Hemmer, L 1748 Luxembourg Findel") 20 F 1 attoform20f_2015.htm FORM 20 F UNITED STATES SECURITIES AND EXCHANGE COMMISSION Washington, D.C. 20549 FORM 20 F ANNUAL REPORT PURSUANT TO SECTION 13 OR 15(d) OF THE SECURITIES EXCHANGE ACT OF 1934
20 F 1 attoform20f_2015.htm FORM 20 F UNITED STATES SECURITIES AND EXCHANGE COMMISSION Washington, D.C. 20549 FORM 20 F ANNUAL REPORT PURSUANT TO SECTION 13 OR 15(d) OF THE SECURITIES EXCHANGE ACT OF 1934
Atento Reports Third Quarter 2014 Results
 PRESS RELEASE Atento Reports Third Quarter 2014 Results Q3 results demonstrated meaningful progress against the Company s key operating metrics: revenue, adjusted EBITDA and free cash flow Revenues grew
Atento. Fiscal 2016 Fourth Quarter and Full Year Results. March 21, 2017
 Atento Fiscal 2016 Fourth Quarter and Full Year Results March 21, 2017 Lynn Antipas Tyson Vice President Investor Relations +1-914-485-1150 lynn.tyson@atento.com 1 Disclaimer This presentation has been
12,295,082 Shares. Ordinary Shares
 Filed Pursuant to Rule 424(b)(4) Registration No. 333-220065 PROSPECTUS SUPPLEMENT (to Prospectus dated August 18, 2017) 12,295,082 Shares Ordinary Shares The selling shareholder named in this prospectus
Atento Reports Fiscal 2018 Second-Quarter Results Highlighted by Top-line Growth and EPS Expansion
 Atento Reports Fiscal 2018 Second-Quarter Results Highlighted by Top-line Growth and EPS Expansion Solid top-line growth across geographies, with revenues up 7.2% Multisector revenues up 9.1% in Q2, representing
Adjusted EBITDA (3) % % Adjusted Margin 13.3% 14.1% 12.6% 12.8%
 % % Adjusted Margin 13.3% 14.1% 12.6% 12.8%") Atento Reports Fiscal 2016 Fourth-Quarter and Full Year Results, Highlighted by Revenue Diversification, Margin Protection and Strong Cash Flow Generation Company Announces Agreement to Acquire Majority
Atento Reports Fiscal 2016 Fourth-Quarter and Full Year Results, Highlighted by Revenue Diversification, Margin Protection and Strong Cash Flow Generation Company Announces Agreement to Acquire Majority
Atento Reports Fiscal 2018 First-Quarter Results Highlighted by Solid Topline Growth
 Atento Reports Fiscal 2018 First-Quarter Results Highlighted by Solid Topline Growth Revenues up 4.5% driven by Americas and Brazil Multisector clients revenue growth in all Regions, up 7.9% to 61.4% of
Atento. Morgan Stanley 11 th Annual Latin America Executive Conference. January 14-15, Investor Relations Shay Chor
 January 14-15, 2019 Atento Morgan Stanley 11 th Annual Latin America Executive Conference Investor Relations Shay Chor shay.chor@atento.com Fernando Schneider fernando.schneider@atento.com 1 Disclaimer
Atento Reports Fiscal 2018 Third-Quarter Results Highlighted by Delivery of Turnaround in Brazil
 Atento Reports Fiscal 2018 Third-Quarter Results Highlighted by Delivery of Turnaround in Brazil - Adjusted EBITDA margin up 0.5 p.p. sequentially, driven by strong margin expansion in Brazil. - Brazil
Atento. Fiscal 2017 Fourth Quarter and Full Year Results. March 20, Investor Relations Shay Chor
 March 20, 2018 Atento Fiscal 2017 Fourth Quarter and Full Year Results Investor Relations Shay Chor shay.chor@atento.com Felipe Joaquim Martins de Souza felipe.souza@atento.com 1 Disclaimer This presentation
Atento. Fiscal 2017 First Quarter Results. May 9, Felipe Joaquim Martins de Souza Investor Relations
 Atento Fiscal 2017 First Quarter Results May 9, 2017 Felipe Joaquim Martins de Souza Investor Relations +55 11 3779-8053 Felipe.souza@atento.com 1 Disclaimer This presentation has been prepared by Atento.
UNITED STATES SECURITIES AND EXCHANGE COMMISSION Washington, D.C FORM 6-K ReportofForeignPrivateIssuer. Atento S.A.
 UNITED STATES SECURITIES AND EXCHANGE COMMISSION Washington, D.C. 20549 FORM 6-K ReportofForeignPrivateIssuer PursuanttoRule13a-16or15d-16ofthe SecuritiesExchangeActof1934 For the year ended December 31,
ATENTO S.A. AND SUBSIDIARIES (FORMERLY ATENTO FLOATCO S.A. AND SUBSIDIARIES)
") ATENTO S.A. AND SUBSIDIARIES (FORMERLY ATENTO FLOATCO S.A. AND SUBSIDIARIES) CONSOLIDATED FINANCIAL STATEMENTS AND CONSOLIDATED MANAGEMENT REPORT FOR THE YEAR ENDED DECEMBER 31, 2014 AND 2015 TABLE OF
ATENTO S.A. AND SUBSIDIARIES (FORMERLY ATENTO FLOATCO S.A. AND SUBSIDIARIES) CONSOLIDATED FINANCIAL STATEMENTS AND CONSOLIDATED MANAGEMENT REPORT FOR THE YEAR ENDED DECEMBER 31, 2014 AND 2015 TABLE OF
Atento. Fiscal 2017 Third Quarter Results. November 1, Investor Relations Shay Chor
 November 1, 2017 Atento Fiscal 2017 Third Quarter Results Investor Relations Shay Chor Shay.chor@atento.com Felipe Joaquim Martins de Souza Felipe.souza@atento.com 1 Disclaimer This presentation has been
Atento. Fiscal 2017 Second Quarter Results. August 15, 2017
 Atento Fiscal 2017 Second Quarter Results August 15, 2017 Investor Relations Shay Chor Shay.chor@atento.com Felipe Joaquim Martins de Souza Felipe.souza@atento.com 1 Disclaimer This presentation has been
ATENTO S.A. AND SUBSIDIARIES CONSOLIDATED FINANCIAL STATEMENTS AND CONSOLIDATED MANAGEMENT REPORT FOR THE YEAR ENDED DECEMBER 31, 2016 AND 2017
 4, rue Lou Hemmer L-1748 Luxembourg-Findel RCS Luxembourg: B 185761 ATENTO S.A. AND SUBSIDIARIES CONSOLIDATED FINANCIAL STATEMENTS AND CONSOLIDATED MANAGEMENT REPORT FOR THE YEAR ENDED DECEMBER 31, 2016
Atento Fiscal 2016 First Quarter Results
 Atento Fiscal 2016 First Quarter Results May 10, 2016 Lynn Antipas Tyson Vice President Investor Relations +1-914-485-1150 lynn.tyson@atento.com 1 Disclaimer This presentation has been prepared by Atento.
ATENTO S.A. AND SUBSIDIARIES (FORMERLY ATENTO FLOATCO S.A. AND SUBSIDIARIES)
") ATENTO S.A. AND SUBSIDIARIES (FORMERLY ATENTO FLOATCO S.A. AND SUBSIDIARIES) CONSOLIDATED FINANCIAL STATEMENTS AND CONSOLIDATED MANAGEMENT REPORT FOR THE YEAR ENDED DECEMBER 31, 2015 AND 2016 4, rue Lou
ATENTO S.A. AND SUBSIDIARIES (FORMERLY ATENTO FLOATCO S.A. AND SUBSIDIARIES) CONSOLIDATED FINANCIAL STATEMENTS AND CONSOLIDATED MANAGEMENT REPORT FOR THE YEAR ENDED DECEMBER 31, 2015 AND 2016 4, rue Lou
FORM 6-K. MFC Bancorp Ltd. (Translation of Registrant's name into English)
") U.S. SECURITIES AND EXCHANGE COMMISSION Washington D.C. 20549 FORM 6-K REPORT OF FOREIGN PRIVATE ISSUER PURSUANT TO RULE 13a-16 OR 15d-16 UNDER THE SECURITIES EXCHANGE ACT OF 1934 For the month of December,
U.S. SECURITIES AND EXCHANGE COMMISSION Washington D.C. 20549 FORM 6-K REPORT OF FOREIGN PRIVATE ISSUER PURSUANT TO RULE 13a-16 OR 15d-16 UNDER THE SECURITIES EXCHANGE ACT OF 1934 For the month of December,
FORACO INTERNATIONAL S.A. MANAGEMENT S DISCUSSION & ANALYSIS
 FORACO INTERNATIONAL S.A. MANAGEMENT S DISCUSSION & ANALYSIS Three-month and nine-month periods ended September 30, 2018 FORACO INTERNATIONAL S.A. MANAGEMENT S DISCUSSION AND ANALYSIS The following Management
BANCO BILBAO VIZCAYA ARGENTARIA, S.A. BANK BILBAO VIZCAYA ARGENTARIA, S.A.
 UNITED STATES SECURITIES AND EXCHANGE COMMISSION WASHINGTON, D.C. 20549 FORM 6-K REPORT OF FOREIGN ISSUER PURSUANT TO RULE 13a-16 OR 15d-16 UNDER THE SECURITIES EXCHANGE ACT OF 1934 For the six months
Atento S.A. (Translation of Registrant s name into English)
") UNITED STATES SECURITIES AND EXCHANGE COMMISSION Washington, D.C. 20549 FORM 6-K Report of Foreign Private Issuer Pursuant to Rule 13a-16 or 15d-16 of the Securities Exchange Act of 1934 For the month
UNITED STATES SECURITIES AND EXCHANGE COMMISSION Washington, D.C. 20549 FORM 6-K Report of Foreign Private Issuer Pursuant to Rule 13a-16 or 15d-16 of the Securities Exchange Act of 1934 For the month
LSF9 Balta Issuer S.A.
 LSF9 Balta Issuer S.A. Quarterly Report to Noteholders 290,000,000 7.75% Senior Secured Notes due 2022 Q1 Period ended March 31, LSF9 Balta Issuer S.A. Registered office: 33, rue du Puits Romain, L-8070
Hertz Global Holdings, Inc. (1) First Quarter 2007 Performance Results Including Non-GAAP Measures, Definitions and Use/Importance
 First Quarter 2007 Performance Results Including Non-GAAP Measures, Definitions and Use/Importance") Hertz Global Holdings, Inc. (1) First Quarter 2007 Performance Results Including Non-GAAP Measures, Definitions and Use/Importance Table 1: Condensed Consolidated Statements of Operations for the Three
Hertz Global Holdings, Inc. (1) First Quarter 2007 Performance Results Including Non-GAAP Measures, Definitions and Use/Importance Table 1: Condensed Consolidated Statements of Operations for the Three
Gardner Denver Holdings, Inc. (Exact name of registrant as specified in its charter)
") UNITED STATES SECURITIES AND EXCHANGE COMMISSION Washington, D.C. 20549 FORM 8-K CURRENT REPORT Pursuant to Section 13 or 15(d) of the Securities Exchange Act of 1934 Date of Report (Date Earliest Event
UNITED STATES SECURITIES AND EXCHANGE COMMISSION Washington, D.C. 20549 FORM 8-K CURRENT REPORT Pursuant to Section 13 or 15(d) of the Securities Exchange Act of 1934 Date of Report (Date Earliest Event
UNITED STATES SECURITIES AND EXCHANGE COMMISSION FORM 6-K. LUXOTTICA GROUP S.p.A.
 UNITED STATES SECURITIES AND EXCHANGE COMMISSION WASHINGTON, D.C. 20549 FORM 6-K REPORT OF FOREIGN PRIVATE ISSUER PURSUANT TO RULE 13a-16 OR 15d-16 UNDER THE SECURITIES EXCHANGE ACT OF 1934 For the quarter
LSF9 Balta Issuer S.A.
 LSF9 Balta Issuer S.A. Annual Report to Noteholders 290,000,000 7.75% Senior Secured Notes due 2022 Annual Period ended 31, 2015 LSF9 Balta Issuer S.A. Registered office: 33, rue du Puits Romain, L-8070
Netshoes Limited Reports First Quarter 2017 Results
 Netshoes Limited Reports First Quarter 2017 Results Gross Merchandise Volume increased 20.6%, or 25.2% on an FX neutral basis, to R$531.2 million, compared to 1Q-2016 Margin improvements reflect operating
4Q 2018 Highlights and Operating Results. Products. Technology. Services. Delivered Globally.
 4Q 2018 Highlights and Operating Results Products. Technology. Services. Delivered Globally. Table of Contents Page 3 Safe Harbor Statement and Non-GAAP Financial Measures 4 Sales Overview 9 Overview of
Gardner Denver Reports Strong Second Quarter 2018 Results and Raises Full Year 2018 Adjusted EBITDA Midpoint Guidance
 August 1, 2018 Gardner Denver Reports Strong Second Quarter 2018 Results and Raises Full Year 2018 Adjusted EBITDA Midpoint Guidance Revenues of $668.2 million increased 15% over the prior year, supported
Cencosud S.A. (Translation of registrant s name into English)
") UNITED STATES SECURITIES AND EXCHANGE COMMISSION Washington, D.C. 20549 FORM 6 - K Report of Foreign Private Issuer Pursuant to Rule 13a - 16 or 15d - 16 under the Securities Exchange Act of 1934 For the
UNITED STATES SECURITIES AND EXCHANGE COMMISSION Washington, D.C. 20549 FORM 6 - K Report of Foreign Private Issuer Pursuant to Rule 13a - 16 or 15d - 16 under the Securities Exchange Act of 1934 For the
Quarterly Report to Shareholders
 Q3 Quarterly Report to Shareholders Scotiabank reports third quarter results TORONTO, August 28, Scotiabank reported third quarter net income of $1,939 million compared to $2,103 million in the same period
UNITED STATES SECURITIES AND EXCHANGE COMMISSION FORM 6-K. LUXOTTICA GROUP S.p.A.
 UNITED STATES SECURITIES AND EXCHANGE COMMISSION WASHINGTON, D.C. 20549 FORM 6-K REPORT OF FOREIGN PRIVATE ISSUER PURSUANT TO RULE 13a-16 OR 15d-16 UNDER THE SECURITIES EXCHANGE ACT OF 1934 For the quarter
FORACO INTERNATIONAL S.A. MANAGEMENT S DISCUSSION & ANALYSIS
 FORACO INTERNATIONAL S.A. MANAGEMENT S DISCUSSION & ANALYSIS Three-month and nine-month periods ended September 30, 2017 FORACO INTERNATIONAL S.A. MANAGEMENT S DISCUSSION AND ANALYSIS The following Management
Fourth Quarter 2015 Earnings Presentation. Interface Security Systems Holdings, Inc. March 24, 2016
 Fourth Quarter 2015 Earnings Presentation Interface Security Systems Holdings, Inc. March 24, 2016 Cautionary Statement Regarding Forward-Looking Statements Cautionary Statement Regarding Forward-Looking
Gardner Denver Reports Record First Quarter 2018 Results and Increases EBITDA Guidance for Full Year
 April 26, 2018 Gardner Denver Reports Record First Quarter 2018 Results and Increases EBITDA Guidance for Full Year Revenues of $619.6 million increased 29% over the prior year, supported by strong and
Pointer Telocation Ltd. (Translation of registrant s name into English)
") UNITED STATES SECURITIES AND EXCHANGE COMMISSION Washington, D.C. 20549 FORM 6-K Report of Foreign Private Issuer Pursuant to Rule 13a-16 or 15d-16 under the Securities Exchange Act of 1934 For the month
UNITED STATES SECURITIES AND EXCHANGE COMMISSION Washington, D.C. 20549 FORM 6-K Report of Foreign Private Issuer Pursuant to Rule 13a-16 or 15d-16 under the Securities Exchange Act of 1934 For the month
Management s Discussion and Analysis
 FIRST QUARTERLY REPORT FOR THE THREE MONTHS ENDED MARCH 31, 2018 Management s Discussion and Analysis of Financial Conditions and Results of Operations For the three months ended March 31, 2018 All figures
A X A L T A C O A T I N G S Y S T E M S. Q FINANCIAL RESULTS July 26, 2016
 A X A L T A C O A T I N G S Y S T E M S Q2 2016 FINANCIAL RESULTS July 26, 2016 Legal Notices Forward-Looking Statements This presentation and the oral remarks made in connection herewith may contain forward-looking
FINANCIAL OVERVIEW Three months ended March 31,
 QUARTERLY REPORT FOR THE THREE MONTHS ENDED MARCH 31, 2018 MANAGEMENT S DISCUSSION AND ANALYSIS May 3, 2018 The Management s Discussion and Analysis ( MD&A ) for Enerflex Ltd. ( Enerflex or the Company
A X A L T A C O A T I N G S Y S T E M S. Q4 & FULL YEAR 2016 FINANCIAL RESULTS February 8 th, 2017
 A X A L T A C O A T I N G S Y S T E M S Q4 & FULL YEAR 2016 FINANCIAL RESULTS February 8 th, 2017 Legal Notices Forward-Looking Statements This presentation and the oral remarks made in connection herewith
UNITED STATES SECURITIES AND EXCHANGE COMMISSION FORM 6-K. LUXOTTICA GROUP S.p.A.
 UNITED STATES SECURITIES AND EXCHANGE COMMISSION WASHINGTON, D.C. 20549 FORM 6-K REPORT OF FOREIGN PRIVATE ISSUER PURSUANT TO RULE 13a-16 OR 15d-16 UNDER THE SECURITIES EXCHANGE ACT OF 1934 For the quarter
4Q 2017 Highlights and Operating Results
 4Q 2017 Highlights and Operating Results January 30, 2018 1 4Q 2017 Highlights and Operating Results Table of Contents Page(s) 1 Sales Overview 4-8 2 Financial Performance Trends 9-16 3 Leverage Metrics
Leveraging Our Strengths
 Leveraging Our Strengths Second Quarterly Report for the Six Months Ended 2016 Management s Discussion and Analysis of Financial Conditions and Results of Operations For the second quarter and six months
KEY FIGURES.3 MANAGEMENT DISCUSSION AND ANALYSIS OF THE RESULTS GROUP FINANCIAL HIGHLIGHTS BUSINESS UPDATE H
 1 Table of Contents 1. KEY FIGURES...3 2. MANAGEMENT DISCUSSION AND ANALYSIS OF THE RESULTS...4 2.1. GROUP FINANCIAL HIGHLIGHTS...4 2.2. BUSINESS UPDATE...4 3. OPERATING REVIEW PER SEGMENT...5 3.1. REVENUE
A X A L T A C O A T I N G S Y S T E M S. Q FINANCIAL RESULTS October 27, 2016
 A X A L T A C O A T I N G S Y S T E M S Q3 2016 FINANCIAL RESULTS October 27, 2016 Legal Notices Forward-Looking Statements This presentation and the oral remarks made in connection herewith may contain
3Q 2018 Highlights and Operating Results. Products. Technology. Services. Delivered Globally.
 3Q 2018 Highlights and Operating Results Products. Technology. Services. Delivered Globally. Table of Contents Page 3 Safe Harbor Statement and Non-GAAP Financial Measures 4 Sales Overview 9 Overview of
BANCO BILBAO VIZCAYA ARGENTARIA, S.A. BANK BILBAO VIZCAYA ARGENTARIA, S.A.
 UNITED STATES SECURITIES AND EXCHANGE COMMISSION WASHINGTON, D.C. 20549 FORM 6-K REPORT OF FOREIGN ISSUER PURSUANT TO RULE 13a-16 OR 15d-16 UNDER THE SECURITIES EXCHANGE ACT OF 1934 For the six months
BANCO BILBAO VIZCAYA ARGENTARIA, S.A. BANK BILBAO VIZCAYA ARGENTARIA, S.A.
 UNITED STATES SECURITIES AND EXCHANGE COMMISSION WASHINGTON, D.C. 20549 FORM 6-K REPORT OF FOREIGN ISSUER PURSUANT TO RULE 13a-16 OR 15d-16 UNDER THE SECURITIES EXCHANGE ACT OF 1934 For the six months
Copyright 2018 CPI Card Group. Fourth Quarter & FY 2017 Earnings Conference Call March 12, 2018
 Fourth Quarter & FY 2017 Earnings Conference Call March 12, 2018 Safe Harbor Forward-Looking Statements Statements in this presentation that are not statements of historical fact are forward-looking statements
QUARTERLY REPORT FOR THE THREE MONTHS AND NINE MONTHS ENDED 30 SEPTEMBER 2014 (unaudited) HYVA GLOBAL B.V. (the Issuer )
 HYVA GLOBAL B.V. (the Issuer )") QUARTERLY REPORT FOR THE THREE MONTHS AND NINE MONTHS ENDED 30 SEPTEMBER 2014 HYVA GLOBAL B.V. (the Issuer ) 28 November 2014 Introduction On 24 March 2011, Hyva Global B.V. (the Issuer or the Company
QUARTERLY REPORT FOR THE THREE MONTHS AND NINE MONTHS ENDED 30 SEPTEMBER 2014 HYVA GLOBAL B.V. (the Issuer ) 28 November 2014 Introduction On 24 March 2011, Hyva Global B.V. (the Issuer or the Company
AMERICAN TOWER CORPORATION REPORTS SECOND QUARTER 2017 FINANCIAL RESULTS
 AMERICAN TOWER CORPORATION REPORTS SECOND QUARTER 2017 FINANCIAL RESULTS CONSOLIDATED HIGHLIGHTS Second Quarter 2017 Total revenue increased 15.3% to $1,662 million Property revenue increased 14.9% to
Investors: Michael D. Neese VP, Investor Relations (804)
") NEWS RELEASE For Immediate Release August 17, 2016 Investors: Michael D. Neese VP, Investor Relations (804) 287-8126 michael.neese@pfgc.com Media: Joe Vagi Manager, Corporate Communications (804) 484-7737
NEWS RELEASE For Immediate Release August 17, 2016 Investors: Michael D. Neese VP, Investor Relations (804) 287-8126 michael.neese@pfgc.com Media: Joe Vagi Manager, Corporate Communications (804) 484-7737
ANSYS, INC. FIRST QUARTER 2011 EARNINGS ANNOUNCEMENT PREPARED REMARKS May 5, 2011
 ANSYS, INC. FIRST QUARTER 2011 EARNINGS ANNOUNCEMENT PREPARED REMARKS May 5, 2011 ANSYS is providing a copy of its prepared remarks in combination with its earnings announcement. This process and these
Second Quarter results REPORT TO SHAREHOLDERS
 Quarterly Report Second Quarter results REPORT TO SHAREHOLDERS Scotiabank reports second quarter results TORONTO, May 30, Scotiabank reported second quarter net income of $2,061 million compared to $1,584
Quarterly Report to Noteholders. LSF9 Balta Issuer S.à r.l. Senior Secured Notes due Q Period Ended September 30, 2017
 LSF9 Balta Issuer S.à r.l. Quarterly Report to Noteholders Senior Secured Notes due 2022 Q3 2017 Period Ended September 30, 2017 LSF9 Balta Issuer S.à r.l. Registered office: 5, rue Guillaume Kroll, L-1882
Leveraging Our Strengths
 Leveraging Our Strengths First Quarterly Report for the Three Months Ended March 31, 2016 Management s Discussion and Analysis of Financial Conditions and Results of Operations For the three months ended
Fourth Quarter 2014 Results. Interface Security Systems Holdings, Inc. March 31, 2015
 Fourth Quarter 2014 Results Interface Security Systems Holdings, Inc. March 31, 2015 Cautionary Statement Regarding Forward-Looking Statements This communication includes forward-looking statements within
Q4 & Full Year 2017 Financial Results
 Exhibit 99.2 Q4 & Full Year 2017 Financial Results February 6, 2018 Legal Notices Forward-Looking Statements This presentation and the oral remarks made in connection herewith may contain forward-looking
2017 Supplemental Earnings Slides. February 15, 2018
 2017 Supplemental Earnings Slides February 15, 2018 1 Cautionary Note on Forward-Looking Statements This presentation contains forward-looking statements, within the meaning of the Private Securities Litigation
ALTERNATIVE PERFORMANCE MEASURES (APMs)
") ALTERNATIVE PERFORMANCE MEASURES (APMs) In compliance with ESMA directives about alternative performance measures ( APM ), we are including this additional information which will enable comparability,
ALTERNATIVE PERFORMANCE MEASURES (APMs) In compliance with ESMA directives about alternative performance measures ( APM ), we are including this additional information which will enable comparability,
CFO Commentary on Fourth Quarter and Fiscal Year 2015 Preliminary Financial Results
 Juniper Networks, Inc. 1133 Innovation Way Sunnyvale, CA 94089 January 27, 2016 CFO Commentary on Fourth Quarter and Fiscal Year 2015 Preliminary Financial Results Related Information The following commentary
BANCO BILBAO VIZCAYA ARGENTARIA, S.A. BANK BILBAO VIZCAYA ARGENTARIA, S.A.
 UNITED STATES SECURITIES AND EXCHANGE COMMISSION WASHINGTON, D.C. 20549 FORM 6-K REPORT OF FOREIGN ISSUER PURSUANT TO RULE 13a-16 OR 15d-16 UNDER THE SECURITIES EXCHANGE ACT OF 1934 For the six months
Actionable Intelligence December 2017
 Actionable Intelligence December 2017 2014 Verint Systems Inc. All Rights Reserved Worldwide. Disclaimers Forward Looking Statements This presentation contains "forward-looking statements," including statements
1Q 2018 Highlights and Operating Results
 1Q 2018 Highlights and Operating Results April 26, 2018 1 Table of Contents Page(s) 4 Announced Agreements to Acquire Australia and New Zealand Security Businesses 5-9 Sales Overview 10-17 Financial Performance
UNITED STATES SECURITIES AND EXCHANGE COMMISSION Washington D.C Form 6-K
 UNITED STATES SECURITIES AND EXCHANGE COMMISSION Washington D.C. 20549 Form 6-K REPORT OF FOREIGN PRIVATE ISSUER PURSUANT TO RULE 13a-16 OR 15d-16 UNDER THE SECURITIES EXCHANGE ACT OF 1934 For the month
Bank of America Merrill Lynch The Future of Financials Conference. November 14, Citi Investor Relations
 Citi Investor Relations Bank of America Merrill Lynch The Future of Financials Conference November 14, 2017 Naveed Sultan Global Head of Treasury & Trade Solutions Agenda Strong Foundation for Growth Technology-Driven
Performance Food Group Company (Exact name of registrant as specified in its charter)
") UNITED STATES SECURITIES AND EXCHANGE COMMISSION WASHINGTON, D.C. 20549 FORM 8-K CURRENT REPORT PURSUANT TO SECTION 13 OR 15(d) OF THE SECURITIES EXCHANGE ACT OF 1934 Date of Report (Date of earliest event
UNITED STATES SECURITIES AND EXCHANGE COMMISSION WASHINGTON, D.C. 20549 FORM 8-K CURRENT REPORT PURSUANT TO SECTION 13 OR 15(d) OF THE SECURITIES EXCHANGE ACT OF 1934 Date of Report (Date of earliest event
ARCOS DORADOS REPORTS THIRD QUARTER 2016 FINANCIAL RESULTS
 FOR IMMEDIATE RELEASE ARCOS DORADOS REPORTS THIRD QUARTER 2016 FINANCIAL RESULTS Achieved as reported revenue and mid-teen comparable sales growth and delivered consolidated Adjusted EBITDA margin expansion
Consolidated condensed interim financial statements. Balta Group NV. Period Ended June 30, Balta Group NV
 Balta Group NV Consolidated condensed interim financial statements Period Ended June 30, 2017 Balta Group NV Registered office: Wakkensteenweg 2, 8710 Sint-Baafs-Vijve, Belgium Registration number: 0671.974.626
Avaya Reports Third Quarter Fiscal 2018 Financial Results
 Media Inquiries: Investor Inquiries: Debbie Lewandowski Peter Schuman 630-245-2720 669-242-8098 deblewan@avaya.com pschuman@avaya.com Avaya Reports Third Quarter Fiscal Financial Results Named to the Gartner's
AFFINION GROUP HOLDINGS, INC. ANNOUNCES RESULTS FOR THE THIRD QUARTER ENDED SEPTEMBER 30, 2017 GLOBAL LOYALTY REVENUE INCREASES 36% YEAR OVER YEAR
 More information: Torrey Martin SVP, Communications and Corporate Development 203.956.8746 tmartin@affiniongroup.com ANNOUNCES RESULTS FOR THE THIRD QUARTER ENDED SEPTEMBER 30, 2017 GLOBAL LOYALTY REVENUE
Delivering Significant Growth. Second Quarter Fiscal 2018 Conference Call May 3, 2018
 Delivering Significant Growth Second Quarter Fiscal 2018 Conference Call May 3, 2018 Preliminary Statements Forward Looking Statements This document contains certain forward-looking statements. These statements
SEPTEMBER 17, 2018 SKY BETTING & GAMING UPDATE
 SEPTEMBER 17, 2018 SKY BETTING & GAMING UPDATE CAUTIONARY NOTE REGARDING FORWARD LOOKING STATEMENTS This presentation contains forward-looking statements and information within the meaning of the Private
AFFINION GROUP HOLDINGS, INC
 More information: Torrey Martin SVP, Communications and Corporate Development 203.956.8746 tmartin@affiniongroup.com AFFINION GROUP HOLDINGS, INC. ANNOUNCES RESULTS FOR THE FOURTH QUARTER AND YEAR ENDED
O&M in the Last Mile Ezentis manages, maintains and deploys infrastructure for telecommunications and utilities companies.
 1 O&M in the Last Mile Ezentis manages, maintains and deploys infrastructure for telecommunications and utilities companies. Focus on Latin America where Ezentis activity represents 91,3% of total Group
ARCOS DORADOS REPORTS FOURTH QUARTER & FULL YEAR 2015 FINANCIAL RESULTS
 FOR IMMEDIATE RELEASE ARCOS DORADOS REPORTS FOURTH QUARTER & FULL YEAR 2015 FINANCIAL RESULTS Achieved double-digit consolidated comparable sales growth, with margin expansion in all divisions in the fourth
UNITED STATES SECURITIES AND EXCHANGE COMMISSION Washington, D.C FORM 8-K CURRENT REPORT
 UNITED STATES SECURITIES AND EXCHANGE COMMISSION Washington, D.C. 20549 FORM 8-K CURRENT REPORT Pursuant to Section 13 OR 15(d) of the Securities Exchange Act of 1934 Date of Report (Date of earliest event
Investment Community Conference Call
 DieboldNixdorf.com Investment Community Conference Call Third Quarter, 2018 Earnings October 31, 2018 Use of non-gaap Financial Information To supplement our condensed consolidated financial statements
QUARTERLY REPORT FOR THE THREE MONTHS AND SIX MONTHS ENDED 30 JUNE 2015 (unaudited) HYVA GLOBAL B.V. (the Issuer )
 HYVA GLOBAL B.V. (the Issuer )") QUARTERLY REPORT FOR THE THREE MONTHS AND SIX MONTHS ENDED 30 JUNE 2015 HYVA GLOBAL B.V. (the Issuer ) 28 August 2015 Introduction On 24 March 2011, Hyva Global B.V. (the Issuer or the Company ) issued
QUARTERLY REPORT FOR THE THREE MONTHS AND SIX MONTHS ENDED 30 JUNE 2015 HYVA GLOBAL B.V. (the Issuer ) 28 August 2015 Introduction On 24 March 2011, Hyva Global B.V. (the Issuer or the Company ) issued
In the third quarter, total revenue of $5.3 billion was flat from the prior year or down 1 percent in constant currency.
 News from Xerox For Immediate Release Xerox Corporation 45 Glover Avenue P.O. Box 4505 Norwalk, CT 06856-4505 tel +1-203-968-3000 Xerox Reports Third-Quarter 2013 Earnings GAAP EPS from continuing operations
2015 Business Update. Interface Systems Holdings, Inc. February 18, 2016
 2015 Business Update Interface Systems Holdings, Inc. February 18, 2016 Cautionary Statement Regarding Forward-Looking Statements This communication includes forward-looking statements within the meaning
2015 Fourth Quarter Financial Results
 2015 Fourth Quarter Financial Results FEBRUARY 10, 2016 Safe Harbor Statements in this presentation regarding First Data Corporation s business which are not historical facts are forward-looking statements.
FORM 8-K. NII HOLDINGS, INC. (Exact name of registrant as specified in its charter)
") UNITED STATES SECURITIES AND EXCHANGE COMMISSION Washington, D.C. 20549 FORM 8-K CURRENT REPORT Pursuant to Section 13 or 15(d) of the Securities Exchange Act of 1934 Date of Report (Date of earliest event
UNITED STATES SECURITIES AND EXCHANGE COMMISSION Washington, D.C. 20549 FORM 8-K CURRENT REPORT Pursuant to Section 13 or 15(d) of the Securities Exchange Act of 1934 Date of Report (Date of earliest event
Investors: Michael D. Neese VP, Investor Relations (804)
") NEWS RELEASE For Immediate Release February 7, 2018 Investors: Michael D. Neese VP, Investor Relations (804) 287-8126 michael.neese@pfgc.com Media: Joe Vagi Manager, Corporate Communications (804) 484-7737
NEWS RELEASE For Immediate Release February 7, 2018 Investors: Michael D. Neese VP, Investor Relations (804) 287-8126 michael.neese@pfgc.com Media: Joe Vagi Manager, Corporate Communications (804) 484-7737
News from Xerox. Xerox Reports Fourth-Quarter Earnings
 News from Xerox For Immediate Release Xerox Corporation 45 Glover Avenue P.O. Box 4505 Norwalk, CT 06856-4505 tel +1-203-968-3000 Xerox Reports Fourth-Quarter Earnings GAAP EPS from continuing operations
AFFINION GROUP HOLDINGS, INC. ANNOUNCES RESULTS FOR THE SECOND QUARTER ENDED JUNE 30, 2017 GLOBAL LOYALTY REVENUE INCREASES 39% YEAR OVER YEAR
 More information: Torrey Martin SVP, Communications and Corporate Development 203.956.8746 tmartin@affiniongroup.com AFFINION GROUP HOLDINGS, INC. ANNOUNCES RESULTS FOR THE SECOND QUARTER ENDED JUNE 30,
Reconciliation of Non-GAAP Financial Measures. Adjusted Operating Income Reconciliation
 Reconciliation of Non-GAAP Financial Measures Adjusted Operating Income Reconciliation Adjusted operating income is not a measure of financial performance under generally accepted accounting principles
ITRON, INC. CONSOLIDATED STATEMENTS OF OPERATIONS
 , INC. CONSOLIDATED STATEMENTS OF OPERATIONS (Unaudited, in thousands, except per share data) Revenues $ 523,335 $ 642,477 $ 2,178,178 $ 2,434,124 Cost of revenues 359,835 449,944 1,463,031 1,687,666 Gross
Samsonite International S.A Avenue de la Liberte, L-1931, Luxembourg RCS Luxembourg: B (Incorporated under the laws of Luxembourg with
 Samsonite International S.A. 13 15 Avenue de la Liberte, L-1931, Luxembourg RCS Luxembourg: B159469 (Incorporated under the laws of Luxembourg with limited liability) Consolidated financial statements
UNITED STATES SECURITIES AND EXCHANGE COMMISSION WASHINGTON, D.C FORM 10-Q. For the quarterly period ended November 3, OR -
 UNITED STATES SECURITIES AND EXCHANGE COMMISSION WASHINGTON, D.C. 20549 FORM 10-Q (Mark One) x QUARTERLY REPORT PURSUANT TO SECTION 13 OR 15(d) OF THE SECURITIES EXCHANGE ACT OF 1934 For the quarterly
2Q 2017 Highlights and Operating Results
 2Q 2017 Highlights and Operating Results July 25, 2017 1 2Q 2017 Highlights and Operating Results Table of Contents Page(s) 1 Sales Overview and Highlights 4-5 2 NSS Overview 6-7 3 EES Overview 8-9 4 UPS
MANAGEMENT S DISCUSSION AND ANALYSIS
 MANAGEMENT S DISCUSSION AND ANALYSIS Q1 2017 February 1, 2017 Basis of Presentation This Management s Discussion and Analysis of the Financial Position and Results of Operations ( MD&A ) is the responsibility