SEPTEMBER 17, 2018 SKY BETTING & GAMING UPDATE
|
|
|
- Annice McDowell
- 5 years ago
- Views:
Transcription


1 SEPTEMBER 17, 2018 SKY BETTING & GAMING UPDATE
2 CAUTIONARY NOTE REGARDING FORWARD LOOKING STATEMENTS This presentation contains forward-looking statements and information within the meaning of the Private Securities Litigation Reform Act of 1995 and applicable securities laws, including, without limitation, certain financial and operational expectations and projections, such as certain future operational and growth plans and strategies, including as it relates to Sky Betting & Gaming ( SBG ) and full year 2018 financial guidance. Forward-looking statements and information can, but may not always, be identified by the use of words such as seek, anticipate, plan, continue, estimate, expect, may, will, project, predict, potential, targeting, intend, could, might, would, should, believe, objective, ongoing, imply, assumes, goal, likely and similar references to future periods or the negatives of these words or variations or synonyms of these words or comparable terminology and similar expressions. These statements and information, other than statements of historical fact, are based on management s current expectations and are subject to a number of risks, uncertainties, and assumptions, including market and economic conditions, business prospects or opportunities, future plans and strategies, projections, technological developments, anticipated events and trends and regulatory changes that affect The Stars Group Inc. ( TSG or The Stars Group ), its subsidiaries, including SBG, and its and their respective customers and industries. Although The Stars Group and management believe the expectations reflected in such forward-looking statements and information are reasonable and are based on reasonable assumptions and estimates as of the date hereof, there can be no assurance that these assumptions or estimates are accurate or that any of these expectations will prove accurate. Forward-looking statements are inherently subject to significant business, regulatory, economic and competitive risks, uncertainties and contingencies that could cause actual events to differ materially from those expressed or implied in such statements. Specific risks and uncertainties include, but are not limited to: the heavily regulated industry in which The Stars Group carries on its business; risks associated with interactive entertainment and online and mobile gaming generally; current and future laws or regulations and new interpretations of existing laws or regulations, or potential prohibitions, with respect to interactive entertainment or online gaming or activities related to or necessary for the operation and offering of online gaming; potential changes to the gaming regulatory framework; legal and regulatory requirements; ability to obtain, maintain and comply with all applicable and required licenses, permits and certifications to offer, operate and market its product offerings, including difficulties or delays in the same; significant barriers to entry; competition and the competitive environment within addressable markets and industries; impact of inability to complete future or announced acquisitions or to integrate businesses successfully; The Stars Group s substantial indebtedness requires that it use a significant portion of its cash flow to make debt service payments; The Stars Group s secured credit facilities contain covenants and other restrictions that may limit its flexibility in operating its business; risks associated with advancements in technology, including artificial intelligence; ability to develop and enhance existing product offerings and new commercially viable product offerings; ability to mitigate foreign exchange and currency risks; ability to mitigate tax risks and adverse tax consequences, including, without limitation, the imposition of new or additional taxes, such as value-added and point of consumption taxes, and gaming duties; The Stars Group s exposure to greater than anticipated tax liability; risks of foreign operations generally; protection of proprietary technology and intellectual property rights; ability to recruit and retain management and other qualified personnel, including key technical, sales and marketing personnel; defects in product offerings; losses due to fraudulent activities; management of growth; contract awards; potential financial opportunities in addressable markets and with respect to individual contracts; ability of technology infrastructure to meet applicable demand and reliance on online and mobile telecommunications operators; systems, networks, telecommunications or service disruptions or failures or cyber-attacks and failure to protect customer data, including personal and financial information; regulations and laws that may be adopted with respect to the Internet and electronic commerce or that may otherwise impact The Stars Group in the jurisdictions where it is currently doing business or intends to do business, particularly those related to online gaming or that could impact the ability to provide online product offerings, including, without limitation, as it relates to payment processing; ability to obtain additional financing or to complete any refinancing on reasonable terms or at all; customer and operator preferences and changes in the economy; dependency on customers acceptance of its product offerings; consolidation within the gaming industry; litigation costs and outcomes; expansion within existing and into new markets; relationships with vendors and distributors; and natural events; contractual relationships of SBG or The Stars Group with Sky plc and/or its subsidiaries; counterparty risks; failure of systems and controls of The Stars Group to restrict access to its products; reliance on scheduling and live broadcasting of major sporting events; macroeconomic conditions and trends in the gaming and betting industry; bookmaking risks; an ability to realize projected financial increases attributable to acquisitions and The Stars Group s business strategies; and an ability to realize all or any of The Stars Group s estimated synergies and cost savings in connection with acquisitions. Other applicable risks and uncertainties include, but are not limited to, those identified in The Stars Group s annual information form for the year ended December 31, 2017, including under the heading Risk Factors and Uncertainties, in the June 21, 2018 prospectus supplement to the short form base shelf prospectus dated January 16, 2018 (the Prospectus Supplement ) under the heading Risk Factors, and in The Stars Group s management s discussion and analysis for the three and six months ended June 30, 2018 (the Q MD&A ), including under the headings Risk Factors and Uncertainties, Limitations of Key Metrics, Other Data and Non-IFRS Measures and Key Metrics and Non-IFRS Measures, each available on SEDAR at EDGAR at and The Stars Group s website at and in other filings that The Stars Group has made and may make with applicable securities authorities in the future. Investors are cautioned not to put undue reliance on forwardlooking statements or information. Any forward-looking statement or information speaks only as of the date hereof, and The Stars Group undertakes no obligation to correct or update any forward-looking statement, whether as a result of new information, future events or otherwise, except as required by applicable law. 2

 or SBG 2. Combined TSG, SBG and BetEasy figures for calendar Q2 2018 3.")
3 TRANSFORMATIVE YEAR DIVERSIFIED GLOBAL LEADER Acquisitions greatly enhance TSG s business profile bringing diversification across verticals Licensed or approved in 19 jurisdictions Enhances proportion of revenues from regulated/locally taxed markets Combination creates a diverse, mobile-led online gaming leader with a strong growth trajectory 1. TSG revenue by product (based on calendar year 2017), revenue by regulation/local taxation (based on calendar Q4 2017), and revenue by geography (based on calendar Q4 2017) are not pro forma for the acquisitions of BetEasy (CrownBet and William Hill Australia) or SBG 2. Combined TSG, SBG and BetEasy figures for calendar Q Includes Other revenues from TSG's International segment and Other revenue for SBG 4. Based on real-money online betting and gaming revenues; excludes Other revenues from TSG's International segment and Other revenues from SBG 3

4 INTEGRATION UPDATE Brian Kyle Chief Financial Officer 4
5 INTEGRATION UPDATE Consolidated financials from July 10, 2018 U.K. Competition and Markets Authority process formally commenced August 23, 2018 with the filing of a merger notice Expected cost synergies of at least USD $70 million 5
 2 Proforma 2018 guidance assumes that SBG and the Australian acquisitions were consolidated from")
6 TSG OUTLOOK for Proforma acquired businesses reflects the expected full year 2018 results of SBG and BetEasy. Complete supporting assumptions are detailed within the Appendix of this presentation (slide 24) 2 Proforma 2018 guidance assumes that SBG and the Australian acquisitions were consolidated from January 1, Complete supporting assumptions are detailed within the Appendix of this presentation (slide 24) 3 Includes H results for SBG and BetEasy 4 NMF means not a meaningful figure 6
7 SBG FINANCIAL UPDATE FINANCIAL YEAR ENDED JUNE 2018 Richard Flint SBG Chief Executive Officer Ian Proctor SBG Chief Financial Officer 7


8 FINANCIAL YEAR SUMMARY Record results in all segments, with 30% revenue growth to 670 million and 43% Adjusted EBITDA growth to 209 million Strong underlying key metrics, with a further boost to reported results due to unusually operator favorable sporting results Consolidated position as the #1 UK online betting and gaming brand based on number of customers, and the market leader in mobile betting and gaming based on revenue Leading the industry with safer gambling initiatives Encouraging start to the new European football season (post year-end) from an operational perspective, with double digit growth in active uniques, stakes and gaming revenue 8

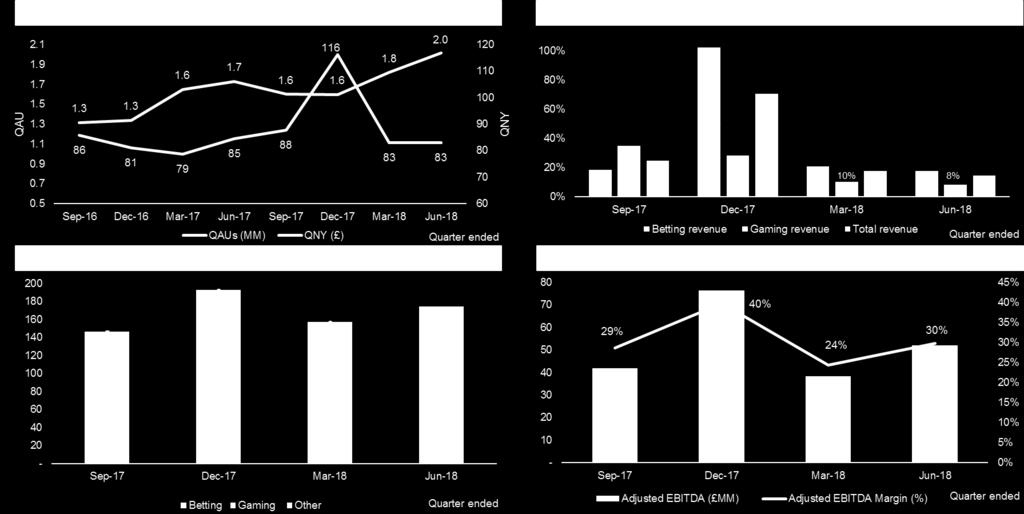
9 SUMMARY FINANCIALS FINANCIAL YEAR Betting revenue growth boosted by sporting results in the quarter ended December 2017 Growth in QAUs across betting and gaming Adjusted EBITDA Margin increased primarily due to the impact of sporting results in betting and due to some operating leverage Continued investment across the business Strong cash generation 1 Non-IFRS financial measure, please refer to the Appendix of this presentation 2 Other revenue includes International and Oddschecker 9


10 SUMMARY FINANCIALS QUARTER ENDED JUNE 2018 Stakes dropped due to a lower average bet size following sustained run of operator-favorable sports results Gaming revenue grew by 8% yearover-year with strong underlying performance impacted by lower cross-sell from betting Growth in QAUs across betting and gaming Adjusted EBITDA was relatively flat, with a lower Adjusted EBITDA Margin, primarily due to marketing investments for the World Cup 1 Non-IFRS financial measure, please refer to the Appendix of this presentation 2 Other revenue includes International and Oddschecker 10

11 SUSTAINABILITY OF GROWTH UNDERPINNED BY RECURRING REVENUE Revenue* by Year of Customer Registration ( millions) Revenue from every cohort of customer registrations has grown Strong, sustainable growth driven by: Efficient customer acquisition engine: high returns with targeted marketing spend High customer retention and loyalty Growing yield through data and personalization *Revenues before the exclusion of certain offsets, incentives and promotions. 11

12 QUARTERLY PERFORMANCE - BETTING Betting Stakes Betting Net Win Margin (%) The quarter ended December 2017 saw a Betting Net Win Margin of 14%, almost 5ppts higher than the long term average achieved due to the sustained run of operator-favorable sports results. *Average for FY16, FY17 and FY18 12

13 SPORTSBOOK MARGINS Monthly Betting Net Win Margin (%) FY 2017 FY 2018 The monthly Betting Net Win Margin is mainly impacted by the outcome of major sporting events, particularly the top European football matches Historically SBG has not seen much variance in the Betting Net Win Margin over the course of a rolling 12-month period 13

14 QUARTERLY PERFORMANCE 14
15 OPERATIONAL HIGHLIGHTS 15

")
16 TRACK RECORD FROM START-UP TO SECTOR LEADER 1 Since FY Financial year (FY) ending June 16


17 OPERATIONAL HIGHLIGHTS Increased focus on consumer data Continued investment in innovative products to enhance user experience Underpinned by stable technology platform and agile approach to development Continued investment in people and the regional economy Launched fully integrated safer gambling campaign 17
 players. Source: Kantar Betscope (Q2 2018).")
18 MARKET TRENDS #1 UK Mobile Market Share 1 #1 Brand Penetration 2 #1 UK online brand by customer numbers in calendar year Kantar Betscope (CY 2017) 2 Regulus Partners (Q1 2018), based on calendar year 2017 revenue. 3 Brand penetration in monthly (or more often) players. Source: Kantar Betscope (Q2 2018). #1 UK mobile market share in calendar year #1 brand penetration in the UK through the quarter ended June
19 SUMMARY AND OUTLOOK FOR SBG Continued strong organic growth in FY18 driven by market growth and market share Sustained run of operator-favorable sporting results in the quarter ended December 2017 increased betting revenues and Adjusted EBITDA, but dampened Stakes in the subsequent periods Consolidated position as the #1 UK online betting and gaming brand 1 Successfully delivered innovative products and user experience enhancements with a strong FY19 pipeline Led the industry with safer gambling initiatives Outlook We are pleased with the start of the European football season, with double digit growth in active users. Revenue growth has been held back by lower Betting Net Win Margins, but overall trading is currently in line with our expectations Tough year-over-year comparatives for the remainder of 2018, due to a high Betting Net Win Margin in the prior year, so we currently expect Adjusted EBITDA to be lower year-over-year for this period We believe that SBG is well positioned to continue growing in the UK online betting and gaming market 1 By active customers (Kantar Research, calendar year 2017) 19
20 TSG CLOSING REMARKS Rafi Ashkenazi Chief Executive Officer 20
21 REALIZING OUR VISION Significant progress has been made this year against our vision: Completed the transformative acquisitions of SBG and BetEasy Refinanced our debt at attractive rates Raised equity to help fund the acquisitions and de-risk the balance sheet Converted the outstanding convertible preferred shares Launched our first US sports betting business Continued to expand our poker offering Becoming the world s favorite igaming destination 21

22 APPENDIX

23 NON-IFRS RECONCILIATIONS FOR SBG FY2018 RESULTS 1 Fiscal Year 2018 includes disposals of
24 GUIDANCE ASSUMPTIONS These unaudited expected results reflect management s view of current and future market and business conditions, including assumptions of (i) expected Betting Net Win Margin of between 8.0% and 10.5%, (ii) continued negative operating conditions in Poland and potential negative operating conditions in Russia resulting from prior regulatory changes, including constraints on payment processing, (iii) no other material regulatory events or investments associated with the entry into new markets, (iv) no impact from the gaming advertising ban in Italy, and (v) no material foreign currency exchange rate fluctuations, particularly against the Euro, Great Britain pound sterling and Australian dollar. Such guidance is also based on a Euro to U.S. dollar exchange rate of 1.17 to 1.00, a Great Britain pound sterling to U.S. dollar exchange rate of 1.32 to 1.00 and an Australian dollar to U.S. dollar exchange rate of 0.74 to 1.00, and the Proforma 2018 Guidance includes pre-acquisition actual results using historical foreign exchange rates and forward guidance postacquisition for each of the three acquisitions using the foreign exchange rates in the assumptions above. Such guidance is also based on Diluted Shares of between 241,000,000 and 243,000,000 for the high and low ends of the Adjusted Diluted Net Earnings per Share range, respectively, and certain accounting assumptions. Capital Expenditures include estimated spend on intangible assets, property, plant and equipment and certain development costs. 24
25 NON-IFRS MEASURES This presentation references non-ifrs financial measures with respect to SBG, including QNY, Adjusted EBITDA and Adjusted EBITDA Margin, and with respect to The Stars Group, including Adjusted EBITDA, Adjusted Net Earnings and Adjusted Diluted Net Earnings Per Share. The Stars Group believes these non-ifrs financial measures will provide investors with useful supplemental information about the financial performance of its and SBG s business, enable comparison of financial results between periods where certain items may vary independent of business performance, and allow for greater transparency with respect to key metrics used by management in operating its business. Although management believes these financial measures are important in evaluating The Stars Group and SBG, they are not intended to be considered in isolation or as a substitute for, or superior to, financial information prepared and presented in accordance with IFRS. They are not recognized measures under IFRS and do not have standardized meanings prescribed by IFRS. These measures may be different from non-ifrs financial measures used by other companies, including between SBG and The Stars Group, limiting its usefulness for comparison purposes. Moreover, presentation of certain of these measures is provided for year-over-year comparison purposes, and investors should be cautioned that the effect of the adjustments thereto provided herein have an actual effect on The Stars Group s and/or SBG s operating results. In addition to QNY, which is defined below under Key Metrics and Other Data, The Stars Group provides the following non-ifrs measures in this presentation, in each case as they relate solely to SBG: Adjusted EBITDA means profit/(loss) for the period attributable to equity shareholders before tax expense/(credit), finance costs, investment income, revaluation of financial instruments measured at fair value, depreciation, amortization, impairment and exceptional items (being transaction-related costs which are adjusted for in this presentation but are not adjusted for in SBG s audited financial statements for its fiscal year ended June 30, 2018). See the reconciliation table presented in the Appendix within this presentation for additional information. Adjusted EBITDA Margin means Adjusted EBITDA as a proportion of total revenue. For additional information on SBG s non-ifrs measures, see elsewhere in this presentation and the Prospectus Supplement, including under the headings Cautionary Note Regarding Use of Non-GAAP Measures and Management s Discussion and Analysis of Sky Betting & Gaming. The Stars Group provides the following non-ifrs measures in this presentation, in each case as they relate solely to The Stars Group on a consolidated basis and as it relates to full year 2018 financial guidance provided in this presentation: Adjusted EBITDA means net earnings before financial expenses, income taxes expense (recovery), depreciation and amortization, stock-based compensation, restructuring, net earnings (loss) on associate and certain other items. Adjusted Net Earnings means net earnings before interest accretion, amortization of intangible assets resulting from purchase price allocations following acquisitions, deferred income taxes, stock-based compensation, restructuring and certain other items. 25
26 NON-IFRS MEASURES (CONT.) Adjusted Diluted Net Earnings per Share means Adjusted Net Earnings attributable to the shareholders of The Stars Group divided by Diluted Shares. Diluted Shares means the weighted average number of common shares of The Stars Group ( Common Shares ) on a fully diluted basis, including options, other equity-based awards, warrants and preferred shares. The effects of anti-dilutive potential Common Shares are ignored in calculating Diluted Shares. For the purposes of the full year 2018 financial guidance provided in this presentation, Diluted Shares equals between 241,000,000 and 243,000,000 for the high and low ends of the Adjusted Net Earnings per Diluted Share range, respectively. For additional information on The Stars Group s non-ifrs measures, see elsewhere in this presentation and the Q MD&A, including under the headings Management s Discussion and Analysis, Limitations of Key Metrics, Other Data and Non-IFRS Measures and Key Metrics and Non-IFRS Measures. With respect to SBG, reconciliations of Adjusted EBITDA, and Adjusted EBITDA Margin, to the nearest IFRS measures are provided in this Appendix. The Stars Group does not provide a reconciliation for the numerator of QNY as the revenue components thereof (i.e., Betting and Gaming) are set forth in this presentation. With respect to The Stars Group, it has not provided a reconciliation of the non-ifrs measures to the nearest IFRS measures included in its full year 2018 financial guidance provided in this presentation, including Adjusted EBITDA, Adjusted Net Earnings and Adjusted Diluted Net Earnings Per Share, because certain reconciling items necessary to accurately project such IFRS measures, particularly net earnings (loss), cannot be reasonably projected due to a number of factors, including variability from potential foreign exchange fluctuations impacting financial expenses, and the nature of other non-recurring or one-time costs (which are excluded from non-ifrs measures but included in net earnings (loss)), as well as the typical variability arising from the audit of annual financial statements, including, without limitation, certain income tax provision accounting, and related accounting matters. For additional information on The Stars Group s non-ifrs measures, see the Q MD&A, including under the headings the Corporation s non-ifrs measures and limitations related to the use of such non-ifrs measures, see the information presented under the heading Management s Discussion and Analysis, Limitations of Key Metrics, Other Data and Non-IFRS Measures and Key Metrics and Non-IFRS Measures. 26
27 OTHER Key Metrics and Other Data The Stars Group provides the following key metrics in this presentation, in each case as they relate solely to SBG: QAUs means active unique customers (online, mobile and desktop client) who have settled a stake on any betting or gaming product within the relevant period. SBG defines unique as a customer who played at least once on one of its real-money offerings during the period, and excludes duplicate counting, even if that customer is active across more than one vertical (betting and gaming). QAUs are disclosed in this presentation on a combined basis for SBG s real-money online gaming and betting brands. The average QAU numbers provided in this presentation reflect a simple average for the respective periods presented. QNY is calculated by dividing quarterly betting and gaming revenue (total revenue less other revenue generated by SBG s Oddschecker and international divisions) generated by SBG by the number of active customers in the period indicated. QNY is a non-ifrs measure. Stakes means betting amounts wagered on SBG s online betting product offerings, and is also an industry term that represents the aggregate amount of funds wagered by customers within the Betting line of operation for the period specified. Betting Net Win Margin is calculated as Betting revenue as a proportion of Stakes. Capital Expenditure for SBG specifically means the purchase of property, plant and equipment and the purchase of intangible assets. For additional information on SBG s key metrics and other data, see the Prospectus Supplement, including under the heading Management s Discussion and Analysis of Sky Betting & Gaming. Currency Unless otherwise noted, all references to $, US$ and USD are to the U.S. dollar and and Pound Sterling are to Great Britain pound sterling. Industry and Market Data Unless otherwise indicated, information contained in this presentation concerning The Stars Group s industry and the markets in which it and SBG operate, including its general expectations and market position, market opportunity and market size, is based on information from various sources, on assumptions that it has made that are based on such data and other similar sources and on its knowledge of the markets for its and SBG's respective products and services. This data involves a number of assumptions and limitations, and you are cautioned not to give undue weight to such estimates. The Stars Group has not independently verified any third-party information and cannot assure you of its accuracy or completeness. While The Stars Group believes the market position, market opportunity and market size information included in this presentation is generally reliable, such information is inherently imprecise. In addition, projections, assumptions and estimates of The Stars Group s and SBG's future performance and the future performance of the industry in which The Stars Group and SBG operate are necessarily subject to a high degree of uncertainty and risk due to a variety of factors, including those described under the heading "Cautionary Note Regarding Forward Looking Statements" in this presentation. These and other factors could cause results to differ materially from those expressed in the estimates made by the independent parties and by The Stars Group or SBG. 27
28 SEPTEMBER 17, 2018 SKY BETTING & GAMING UPDATE
The Stars Group Reports Second Quarter 2018 Results
 The Stars Group Reports Second Quarter 2018 Results The Stars Group Inc. (NASDAQ: TSG)(TSX: TSGI) today reported its financial results for the second quarter ended June 30, 2018, updated its full year
The Stars Group Reports Third Quarter 2018 Results
 The Stars Group Reports Third Quarter 2018 Results TORONTO, November 7, 2018 The Stars Group Inc. (NASDAQ: TSG)(TSX: TSGI) today reported its financial results for the third quarter ended September 30,
The Stars Group Reports First Quarter 2018 Results
 The Stars Group Reports First Quarter 2018 Results The Stars Group Inc. (NASDAQ: TSG; TSX: TSGI) today reported its financial results for the first quarter ended March 31, 2018 and provided certain additional
Q Earnings Presentation. August 12, 2016
 Q2 2016 Earnings Presentation August 12, 2016 Cautionary Note Regarding Forward Looking Statements This presentation contains forward-looking statements within the meaning of the Private Securities Litigation
Acquisition of Sky Betting & Gaming by The Stars Group. April 23, 2018 (Revised May 3, 2018)
") Acquisition of Sky Betting & Gaming by The Stars Group April 23, 2018 (Revised May 3, 2018) Transaction Overview Transaction Terms The Stars Group ( TSG ) to acquire Sky Betting & Gaming ( SBG ) for 2.6bn
Acquisition of Sky Betting & Gaming by The Stars Group April 23, 2018 (Revised May 3, 2018) Transaction Overview Transaction Terms The Stars Group ( TSG ) to acquire Sky Betting & Gaming ( SBG ) for 2.6bn
MANAGEMENT S DISCUSSION AND ANALYSIS FOR THE YEAR ENDED DECEMBER 31, 2018
 MANAGEMENT S DISCUSSION AND ANALYSIS FOR THE YEAR ENDED DECEMBER 31, 2018 March 6, 2019 TABLE OF CONTENTS Management's Discussion and Analysis... 1 Caution Regarding Forward-Looking Statements... 2 Risk
August 8, Conduent Q Earnings Results
 August 8, 2018 Conduent Q2 2018 Earnings Results Cautionary Statements Forward-Looking Statements This report contains forward-looking statements, as defined in the Private Securities Litigation Reform
Q Earnings. GAAP to Non-GAAP Reconciliation
 Q1 2012 Earnings GAAP to Non-GAAP Reconciliation This presentation contains forward-looking statements relating to, among other things, our outlook for full year 2012 bookings, adjusted EBITDA, stock-based
Inspired Entertainment, Inc. Reports Strong Third Quarter FY2018 Results and Completion of its Debt Refinancing
 Inspired Entertainment, Inc. Reports Strong Third Quarter FY2018 Results and Completion of its Debt Refinancing August 13, 2018 - Revenue in the third quarter increased 14.3% as compared to the same quarter
Aramark Fourth Quarter & Full Year 2018 Results November 13, 2018
 Aramark Fourth Quarter & Full Year 2018 Results November 13, 2018 Forward-Looking Statements This presentation includes "forward-looking statements" within the meaning of the Private Securities Litigation
Second Quarter 2018 Financial Results. July 31, 2018
 Second Quarter 2018 Financial Results July 31, 2018 1 Cautionary Note Regarding Forward- Looking Statements This presentation contains forward-looking statements, including, without limitation, those related
UNAUDITED INTERIM CONDENSED CONSOLIDATED FINANCIAL STATEMENTS FOR THE THREE AND NINE MONTHS ENDED SEPTEMBER 30, 2018
 UNAUDITED INTERIM CONDENSED CONSOLIDATED FINANCIAL STATEMENTS FOR THE THREE AND NINE MONTHS ENDED SEPTEMBER 30, 2018 November 7, 2018 TABLE OF CONTENTS UNAUDITED INTERIM CONDENSED CONSOLIDATED FINANCIAL
Helping Clients Win with Digital
 First Quarter 2018 Earnings Supplement Helping Clients Win with Digital May 7, 2018 2017 Cognizant Forward Looking Statements and Non-GAAP Financial Measures This earnings supplement includes statements
5 Q & A. Agenda. Introduction Ben Robinson Strategy Director. Strategy and Business update Guy Dubois CEO. Financial update David Arnott CFO
 Financial Results & Business Update Quarter and year ended 1 December 2011 Disclaimer NOT FOR RELEASE, PUBLICATION OR DISTRIBUTION IN WHOLE OR IN PART IN OR INTO OR FROM THE UNITED STATES OR ANY OTHER
First Quarter Fiscal 2017 Financial Report
 First Quarter Fiscal 2017 Financial Report For the three months ended March 31, 2017 and 2016 TSX: AVO AVIGILON CORPORATION MANAGEMENT S DISCUSSION AND ANALYSIS INTRODUCTION The following Management s
Q Earnings. GAAP to Non-GAAP
 Q4 2011 Earnings GAAP to Non-GAAP Reconciliation This presentation contains forward-looking statements relating to, among other things, our outlook for full year 2012 bookings, adjusted EBITDA, stock-based
Zynga Announces Third Quarter 2014 Financial Results
 November 6, 2014 Zynga Announces Third Quarter 2014 Financial Results DELIVERS $175M IN BOOKINGS AND $2M IN ADJUSTED EBITDA ZYNGA REAFFIRMS FULL YEAR 2014 OUTLOOK FOR BOOKINGS AND ADJUSTED EBITDA SAN FRANCISCO,
February 21, Conduent Q4 & FY 2017 Earnings Results
 February 21, 2018 Conduent Q4 & FY 2017 Earnings Results Cautionary Statements Forward-Looking Statements This report contains forward-looking statements that involve risks and uncertainties. These statements
THE HOME OF BETTING William Hill corporate presentation September 2014
 THE HOME OF BETTING William Hill corporate presentation September 2014 1 Disclaimer This presentation has been prepared by William Hill PLC ( William Hill ). This presentation includes statements that
Investors: Michael D. Neese VP, Investor Relations (804)
") NEWS RELEASE For Immediate Release August 17, 2016 Investors: Michael D. Neese VP, Investor Relations (804) 287-8126 michael.neese@pfgc.com Media: Joe Vagi Manager, Corporate Communications (804) 484-7737
NEWS RELEASE For Immediate Release August 17, 2016 Investors: Michael D. Neese VP, Investor Relations (804) 287-8126 michael.neese@pfgc.com Media: Joe Vagi Manager, Corporate Communications (804) 484-7737
(Unaudited) Reconciliation GAAP to Non-GAAP (In thousands) Pro Forma As Adjusted. Pro Forma Adjustments. Pro Forma As Adjusted. Pro Forma Adjustments
 Reconciliation GAAP to Non-GAAP (In thousands) Pro Forma As Adjusted. Pro Forma Adjustments. Pro Forma As Adjusted. Pro Forma Adjustments") Supplemental Presentation of Selected Quarterly Non-GAAP Financial Information for Fiscal Years 2014-2015, Including Proforma Related to Automotive Business Divesture and Reconciliation to GAAP As announced
Supplemental Presentation of Selected Quarterly Non-GAAP Financial Information for Fiscal Years 2014-2015, Including Proforma Related to Automotive Business Divesture and Reconciliation to GAAP As announced
ZYNGA Q FINANCIAL RESULTS. May 2, 2018
 ZYNGA Q1 2018 FINANCIAL RESULTS May 2, 2018 TABLE OF CONTENTS Overview of Q1 2018 Performance Q2 2018 Financial Guidance GAAP to Non-GAAP Reconciliations 2 MANAGEMENT TEAM CHIEF EXECUTIVE OFFICER Frank
ZYNGA Q FINANCIAL RESULTS. February 7, 2018
 ZYNGA Q4 2017 FINANCIAL RESULTS February 7, 2018 TABLE OF CONTENTS Overview of Q4 2017 Performance Q1 2018 Financial Guidance GAAP to Non-GAAP Reconciliations 2 MANAGEMENT TEAM CHIEF EXECUTIVE OFFICER
ZYNGA Q FINANCIAL RESULTS. October 31, 2018
 ZYNGA Q3 2018 FINANCIAL RESULTS October 31, 2018 TABLE OF CONTENTS Overview of Q3 2018 Performance Q4 2018 Financial Guidance GAAP to Non-GAAP Reconciliations 2 MANAGEMENT TEAM CHIEF EXECUTIVE OFFICER
ACI Worldwide (ACIW) Investor Conferences
 Investor Conferences") ACI Worldwide (ACIW) Investor Conferences Spring/Summer 2014 Private Securities Litigation Reform Act of 1995 Safe Harbor For Forward-Looking Statements This presentation contains forward-looking statements
ACI Worldwide (ACIW) Investor Conferences Spring/Summer 2014 Private Securities Litigation Reform Act of 1995 Safe Harbor For Forward-Looking Statements This presentation contains forward-looking statements
CFO Commentary on Second Quarter 2017 Preliminary Financial Results
 Juniper Networks, Inc. 1133 Innovation Way Sunnyvale, CA 94089 July 25, 2017 CFO Commentary on Second Quarter 2017 Preliminary Financial Results Related Information The following commentary is provided
Horizon Global Third Quarter 2017 Earnings Presentation
 Horizon Global Third Quarter 2017 Earnings Presentation October 31, 2017 Q1 2016 Earnings 1 Safe Harbor Statement Forward-Looking Statements This presentation may contain "forward-looking statements" as
Second Quarter 2018 Earnings Call. July 31, 2018
 Second Quarter 2018 Earnings Call July 31, 2018 Key elements of our strategy Continued growth in Imagery and Services New products for International government and Commercial customers Leverage GBDX cloud-based
thescore, Inc. MANAGEMENT S DISCUSSION AND ANALYSIS OF FINANCIAL CONDITION AND RESULTS OF OPERATIONS For the Three and Nine Months Ended May 31, 2015
 thescore, Inc. MANAGEMENT S DISCUSSION AND ANALYSIS OF FINANCIAL CONDITION AND RESULTS OF OPERATIONS For the Three and Nine Months Ended May 31, 2015 The following is Management's Discussion and Analysis
POSITIVE START TO THE YEAR AND STRONG BEYOND AIR REVENUE GROWTH
 Travelport Worldwide Limited Reports First Quarter 2016 Results POSITIVE START TO THE YEAR AND STRONG BEYOND AIR REVENUE GROWTH LANGLEY, U.K., May 5, 2016 Travelport Worldwide Limited (NYSE: TVPT) announces
Paddy Power Betfair plc Prelim Results
 Paddy Power Betfair plc 2016 Prelim Results Financial & Operating Review [find new imagery for cover] Financial highlights 3 m, Proforma 1 2016 2015 YOY % YOY % CC 2 Revenue 1,551 1,318 +18% +11% Cost
Travelport Worldwide Limited Reports Second Quarter and Half Year 2018 Results
 Travelport Worldwide Limited Reports Second Quarter and Half Year 2018 Results LANGLEY, U.K., August 2, 2018 Travelport Worldwide Limited (NYSE: TVPT) today announced its financial results for the second
First Quarter 2018 Earnings Thursday, May 3, 2018
 First Quarter 2018 Earnings Thursday, May 3, 2018 1 Forward-Looking Statements This presentation may contain "forward-looking statements" as defined in the Private Securities Litigation Reform Act of 1995.
THE HOME OF BETTING William Hill PLC corporate presentation December 2015
 THE HOME OF BETTING William Hill PLC corporate presentation December 2015 1 Disclaimer This presentation has been prepared by William Hill PLC ( William Hill ). This presentation includes statements that
Third Quarter 2018 Financial Results. October 24, 2018
 Third Quarter 2018 Financial Results October 24, 2018 1 Cautionary Note Regarding Forward- Looking Statements This presentation contains forward-looking statements, including, without limitation, those
ELECTRONIC ARTS REPORTS Q3 FY15 FINANCIAL RESULTS
 ELECTRONIC ARTS REPORTS Q3 FY15 FINANCIAL RESULTS Q3 Net Revenue and EPS Results Exceed Guidance Fiscal Year 2015 Net Revenue and EPS Guidance Raised Achieved Record Cash Flow for a Calendar Year Period
ELECTRONIC ARTS REPORTS Q4 FY16 AND FULL YEAR FY16 FINANCIAL RESULTS
 ELECTRONIC ARTS REPORTS Q4 FY16 AND FULL YEAR FY16 FINANCIAL RESULTS Record Fiscal Year Non-GAAP Net Revenue, Digital Net Revenue, Gross Margin, Operating Margin, EPS and Operating Cash Flow Completed
thescore, Inc. MANAGEMENT S DISCUSSION AND ANALYSIS OF FINANCIAL CONDITION AND RESULTS OF OPERATIONS For the Three Months Ended November 30, 2014
 thescore, Inc. MANAGEMENT S DISCUSSION AND ANALYSIS OF FINANCIAL CONDITION AND RESULTS OF OPERATIONS For the Three Months Ended November 30, 2014 The following is Management's Discussion and Analysis ("MD&A")
july 2012 CEB to Acquire SHL Compelling Value Creation, Growth, and Scale Opportunity
 july 2012 CEB to Acquire SHL Compelling Value Creation, Growth, and Scale Opportunity Safe Harbor Disclaimer This presentation contains forward-looking statements within the meaning of the Private Securities
Q Preliminary Earnings Results Summary. February 1, 2018
 Q4 2017 Preliminary Earnings Results Summary February 1, 2018 SAFE HARBOR STATEMENT This presentation may contain projections or other forward-looking statements within the meaning Section 27A of the Private
Mood Media Reports Fourth Quarter and Full Year 2014 Financial and Operating Results, Achieving 2014 EBITDA of $102.6 Million
 Mood Media Reports Fourth Quarter and Full Year 2014 Financial and Operating Results, Achieving 2014 EBITDA of $102.6 Million Successfully Implemented Wave 2 and 3 of Efficiency Gains of More Than $8M
Walgreens Boots Alliance Fiscal year end 2015 and 4Q earnings conference call. 28 October 2015
 Walgreens Boots Alliance Fiscal year end 2015 and 4Q earnings conference call 28 October 2015 Fiscal year end 2015 and 4Q earnings call agenda Topic Introduction & Safe Harbor Business Overview Financial
TransUnion Announces Strong First Quarter 2018 Results and Agreement to Acquire Callcredit
 News Release TransUnion Announces Strong First Quarter 2018 Results and Agreement to Acquire Callcredit CHICAGO, April 20, 2018 - TransUnion (NYSE: TRU) (the Company ) today announced financial results
NEWS RELEASE INTERNATIONAL GAME TECHNOLOGY PLC REPORTS SECOND QUARTER 2016 RESULTS
 NEWS RELEASE INTERNATIONAL GAME TECHNOLOGY PLC REPORTS SECOND QUARTER 2016 RESULTS Net income of $73 million; adjusted Net income of $87 million Adjusted EBITDA rose 4% to $443 million on strong service
FIRSTSERVICE CORPORATION Management s discussion and analysis for the year ended December 31, 2017 (in US dollars) February 22, 2018
 February 22, 2018") FIRSTSERVICE CORPORATION Management s discussion and analysis for the year ended December 31, 2017 (in US dollars) February 22, 2018 The following management s discussion and analysis ( MD&A ) should be
FIRSTSERVICE CORPORATION Management s discussion and analysis for the year ended December 31, 2017 (in US dollars) February 22, 2018 The following management s discussion and analysis ( MD&A ) should be
MANAGEMENT S DISCUSSION AND ANALYSIS OF FINANCIAL CONDITION AND RESULTS OF OPERATIONS
 thescore, Inc. MANAGEMENT S DISCUSSION AND ANALYSIS OF FINANCIAL CONDITION AND RESULTS OF OPERATIONS For the Three and Nine Months Ended May 31, 2018 and 2017 The following is Management's Discussion and
NEWS RELEASE INTERNATIONAL GAME TECHNOLOGY PLC REPORTS SECOND QUARTER 2015 RESULTS
 NEWS RELEASE INTERNATIONAL GAME TECHNOLOGY PLC REPORTS SECOND QUARTER 2015 RESULTS Adjusted EBITDA of $427 million and adjusted earnings per share of $0.35; GAAP earnings per share of ($0.59) Pro forma
Scientific Games Third Quarter 2012 Earnings Presentation
 Scientific Games Third Quarter 2012 Earnings Presentation Safe Harbor Statement Throughout this presentation we make "forward-looking statements" within the meaning of the U.S. Private Securities Litigation
Intertape Polymer Group Reports 2018 Second Quarter Results
 NEWS RELEASE FOR IMMEDIATE DISTRIBUTION Intertape Polymer Group Reports 2018 Second Quarter Results Quarterly revenue increased 18.5% to $249.1 million Quarterly IPG Net Earnings increased $4.9 million
CPI Card Group Inc. Reports Fourth Quarter and Full Year 2015 Results
 CPI Card Group Inc. Reports Fourth Quarter and Full Year 2015 Results Fourth Quarter Net Sales of $93.6 million and Pro Forma Adjusted Diluted EPS of $0.16 Initiates Quarterly Dividend Announces 2016 Financial
Inspired Reports Results For The Three-Month Period Ended December 31, 2018
 Inspired Reports Results For The Three-Month Period Ended December 31, 2018 February 11, 2019 NEW YORK, Feb. 11, 2019 /PRNewswire/ -- Total Revenue for the Transitional Period Ended December 31, 2018 of
Q Preliminary Earnings Results Summary May 3, 2018
 Q1 2018 Preliminary Earnings Results Summary May 3, 2018 SAFE HARBOR STATEMENT This presentation may contain projections or other forward-looking statements within the meaning Section 27A of the Private
Q Earnings Results
 2015 Earnings Results 1 Safe Harbor Forward-Looking Statements This presentation contains forward-looking statements, within the meaning of the safe harbor provisions of the Private Securities Litigation
TORSTAR CORPORATION REPORTS SECOND QUARTER RESULTS
 PRESS RELEASE TORSTAR CORPORATION REPORTS SECOND QUARTER RESULTS TORONTO, ONTARIO (Marketwired August 1, 2018) Torstar Corporation (TSX:TS.B) today reported financial results for the second quarter ended
Horizon Global Reports Financial Results for the First Quarter 2017; Raises Full-Year 2017 Earnings Per Share Guidance and Announces Share Repurchase
 Published on Horizon Global Investor Center (http://investors.horizonglobal.com) on 5/3/17 5:00 pm EDT Horizon Global Reports Financial Results for the First Quarter 2017; Raises Full-Year 2017 Earnings
- Consolidated adjusted EBITDA, excluding NCS, was $5.9 million, an increase of $3.7 million over the prior period ($2.2 million).
.") NEWS RELEASE FOUNDERS ADVANTAGE RELEASES Q2 RESULTS; REVENUES AND INCOME INCREASE AS ALL THREE INVESTEES CONTRIBUTING Calgary, Alberta August 28, Founders Advantage Capital Corp. (TSXV: FCF) (the "Corporation")
NEWS RELEASE FOUNDERS ADVANTAGE RELEASES Q2 RESULTS; REVENUES AND INCOME INCREASE AS ALL THREE INVESTEES CONTRIBUTING Calgary, Alberta August 28, Founders Advantage Capital Corp. (TSXV: FCF) (the "Corporation")
Revenue Increased 17% Excluding the Racing Business Performance Driven by Growth Across Core Lottery and Gaming Businesses
 Scientific Games Announces Third Quarter 2011 Results November 2, 2011 4:04 PM ET Revenue Increased 17% Excluding the Racing Business Performance Driven by Growth Across Core Lottery and Gaming Businesses
Mood Media Reports Third Quarter 2016 Adjusted EBITDA of $22.3 Million
 Mood Media Reports Third Quarter Adjusted EBITDA of $22.3 Million $9.8 Million in Free Cash Flow Generated in Third Quarter, a $16.1 Million Improvement Relative to Prior Year Reaffirms Guidance for Positive
Third Quarter 2018 Earnings Thursday, November 8, 2018
 Third Quarter 2018 Earnings Thursday, November 8, 2018 1 Forward-Looking Statements This presentation may contain "forward-looking statements" as defined in the Private Securities Litigation Reform Act
Safe Harbor. Non-GAAP Financial Information
 1 Safe Harbor This document contains forward-looking statements within the meaning of the Private Securities Litigation Reform Act of 1995, including financial projections subject to risks, uncertainties
Q2 Fiscal 2016 Earnings Presentation August 2, endurance.com /
 Q2 Fiscal 2016 Earnings Presentation August 2, 2016 FORWARD LOOKING STATEMENTS AND OTHER IMPORTANT CAUTIONS This presentation contains certain forward-looking statements within the meaning of the Private
INTERCONTINENTAL EXCHANGE. Earnings Supplement May 3, 2017
 INTERCONTINENTAL EXCHANGE 1Q17 Earnings Supplement INTERCONTINENTAL EXCHANGE 1Q17 Earnings May 3, 217 Supplement May 3, 217 Forward-Looking Statement and Legends CAUTIONARY STATEMENT REGARDING FORWARD
We create communities. We are Stantec.
 Acquisition of MWH Global March 29, 2016 We create communities. We are Stantec. PROSPECTUS INFORMATION An amended and restated preliminary short form prospectus containing important information relating
2018 FOURTH QUARTER EARNINGS CALL
 NORTH AMERICA S LEADING BUILDING MATERIALS DISTRIBUTOR RESIDENTIAL COMMERCIAL INTERIOR SOLAR 2018 FOURTH QUARTER EARNINGS CALL Forward Looking Statements / Non-GAAP Measures This presentation contains
2Q17 EARNINGS AUGUST 2017
 2Q17 EARNINGS AUGUST 2017 FORWARD-LOOKING STATEMENTS The statements contained in this release that refer to plans and expectations for the next quarter, the full year or the future are forward-looking
LHC GROUP AND ALMOST FAMILY ANNOUNCE MERGER OF EQUALS TO CREATE LEADING NATIONAL PROVIDER OF IN-HOME HEALTHCARE SERVICES
 LHC GROUP AND ALMOST FAMILY ANNOUNCE MERGER OF EQUALS TO CREATE LEADING NATIONAL PROVIDER OF IN-HOME HEALTHCARE SERVICES National platform enables greater service and continuity across continuum of care
Q2'17 Actuals. Variance $ (Y/Y)
") 1 ZYNGA Q2 QUARTERLY EARNINGS LETTER August 1, Dear Shareholders, We look forward to discussing our Q2 results during today s earnings call at 2:00 p.m. PT. Below, you ll find our quarterly earnings letter
1 ZYNGA Q2 QUARTERLY EARNINGS LETTER August 1, Dear Shareholders, We look forward to discussing our Q2 results during today s earnings call at 2:00 p.m. PT. Below, you ll find our quarterly earnings letter
Walgreens-Alliance Boots Investor Call
 Walgreens-Alliance Boots Investor Call August 6, 2014 Investor Call Agenda Introduction & Safe Harbor Alliance Boots Step 2 Update Global Management Structure Corporate Structure Rick Hans, CFA Divisional
News Release FOR IMMEDIATE RELEASE ACCO BRANDS CORPORATION REPORTS FOURTH QUARTER AND FULL YEAR 2018 RESULTS
 News Release FOR IMMEDIATE RELEASE ACCO BRANDS CORPORATION REPORTS FOURTH QUARTER AND FULL YEAR 2018 RESULTS LAKE ZURICH, ILLINOIS, February 13, 2019 - ACCO Brands Corporation (NYSE: ACCO), one of the
Safe Harbor Statement
 June 27, 2018 Safe Harbor Statement Cautionary Statement Regarding Forward Looking Statements Statements in this presentation that are not historical, are forward-looking statements made pursuant to the
AIMIA REPORTS FOURTH QUARTER 2017 RESULTS
 AIMIA REPORTS FOURTH QUARTER 2017 RESULTS Montreal, February 14, 2018 Data-driven marketing and loyalty analytics company Aimia Inc. (TSX: AIM) today reported its financial results for the quarter ended
DH CORPORATION Management s Discussion and Analysis For the quarter ended March 31, 2016
 DH CORPORATION Management s Discussion and Analysis For the quarter ended March 31, 2016 D+H Q1 2016 1 Management s Discussion and Analysis For the quarter ended March 31, 2016 Page 1 Introduction 3 2
Mood Media Reports First Quarter 2016 EBITDA of $21.8 Million & Free Cash Flow of $5.7 Million
 Mood Media Reports First Quarter 2016 EBITDA of $21.8 Million & Free Cash Flow of $5.7 Million Affirms 2016 Guidance for Positive Free Cash Flow & Stable EBITDA Incremental Transformation Gains Targeted
Fourth Quarter 2017 Earnings Presentation
 Fourth Quarter 2017 Earnings Presentation Safe Harbor Statement This document may contain certain forward-looking statements within the meaning of the Private Securities Litigation Reform Act of 1995.
Momentive Performance Materials Inc. 22 Corporate Woods Blvd. Albany, NY 12211
 Momentive Performance Materials Inc. 22 Corporate Woods Blvd. Albany, NY 12211 NEWS RELEASE FOR IMMEDIATE RELEASE Momentive Performance Materials Inc. Reports Fourth Quarter and Fiscal Year 2010 Results
Investor Presentation
 Investor Presentation J.P. Morgan 36 th Annual Healthcare Conference San Francisco, CA January 2018 Forward-Looking Statements This presentation contains forward-looking statements (as defined in the Securities
2015 Business Update. Interface Systems Holdings, Inc. February 18, 2016
 2015 Business Update Interface Systems Holdings, Inc. February 18, 2016 Cautionary Statement Regarding Forward-Looking Statements This communication includes forward-looking statements within the meaning
News from Conduent EXHIBIT Conduent Incorporated 100 Campus Drive, Suite 200 Florham Park, NJ
 News from Conduent Conduent Incorporated 100 Campus Drive, Suite 200 Florham Park, NJ 07932 www.conduent.com Conduent Reports First Quarter 2018 Results; Strong Operational and Financial Performance Led
Veritiv Corporation Fourth Quarter and Fiscal Year 2017 Financial Results March 1, 2018
 Veritiv Corporation Fourth Quarter and Fiscal Year 2017 Financial Results March 1, 2018 Tom Morabito Director of Investor Relations 2 Safe Harbor Provision Certain statements contained in this presentation
Forward-Looking Statements
 May 25, 206 Forward-Looking Statements This communication may contain statements, estimates or projections that constitute forward-looking statements as defined under U.S. federal securities laws. Generally,
Sierra Wireless Reports First Quarter 2017 Results
 Sierra Wireless Reports First Quarter 2017 Results Revenue increases 13.3% year-over-year to $161.8 million in the first quarter of 2017 VANCOUVER, BRITISH COLUMBIA - May 4, 2017 - Sierra Wireless, Inc.
FOR IMMEDIATE RELEASE
 FOR IMMEDIATE RELEASE For media inquiries, contact: Eric Armstrong, Citrix Systems, Inc. (954) 267-2977 or eric.armstrong@citrix.com For investor inquiries, contact: Eduardo Fleites, Citrix Systems, Inc.
DISCOVERY, INC. REPORTS FIRST QUARTER 2018 RESULTS
 THIS EARNINGS RELEASE IS UPDATED AS OF 5/9/2018 FOR MINOR TYPOGRAPHICAL ERRORS IN THE SUPPLEMENTAL FINANCIAL TABLES STARTING ON PAGE 10 OF THE RELEASE. DISCOVERY, INC. REPORTS FIRST QUARTER 2018 RESULTS
AUTODESK, INC. (ADSK) THIRD QUARTER FISCAL 2019 EARNINGS ANNOUNCEMENT NOVEMBER 20, 2018 PREPARED REMARKS
 THIRD QUARTER FISCAL 2019 EARNINGS ANNOUNCEMENT NOVEMBER 20, 2018 PREPARED REMARKS") AUTODESK, INC. (ADSK) THIRD QUARTER FISCAL 2019 EARNINGS ANNOUNCEMENT NOVEMBER 20, 2018 PREPARED REMARKS Autodesk posts its prepared remarks and press release to its investor relations website to provide
AUTODESK, INC. (ADSK) THIRD QUARTER FISCAL 2019 EARNINGS ANNOUNCEMENT NOVEMBER 20, 2018 PREPARED REMARKS Autodesk posts its prepared remarks and press release to its investor relations website to provide
EXAMPLE EARNINGS SLIDES UPDATE ON EXTERNAL PRESENTATION OF NON-GAAP RESULTS
 EXAMPLE EARNINGS SLIDES UPDATE ON EXTERNAL PRESENTATION OF NON-GAAP RESULTS October 27, 2016 Note: The Q2 2016 earnings slides have been revised to reflect the changes in how Zynga will externally report
UNITED STATES SECURITIES AND EXCHANGE COMMISSION WASHINGTON, DC FORM 10-Q. For the quarterly period ended June 30, 2018
 UNITED STATES SECURITIES AND EXCHANGE COMMISSION WASHINGTON, DC 20549 FORM 10-Q (Mark One) x QUARTERLY REPORT PURSUANT TO SECTION 13 OR 15(d) OF THE SECURITIES EXCHANGE ACT OF 1934 For the quarterly period
News Release FOR IMMEDIATE RELEASE ACCO BRANDS CORPORATION REPORTS THIRD QUARTER 2018 RESULTS
 News Release FOR IMMEDIATE RELEASE ACCO BRANDS CORPORATION REPORTS THIRD QUARTER 2018 RESULTS LAKE ZURICH, ILLINOIS, October 30, 2018 - ACCO Brands Corporation (NYSE: ACCO), one of the world's largest
American Express Company
 American Express Company Goldman Sachs U.S. Financial Services Conference December 5, 2017 Assumptions that Materialized Migration to plastic Information & technology Consolidation of U.S. issuance Payments
SNAP INTERACTIVE, INC. Third Quarter 2017 Earnings Call November 7, 2017
 SNAP INTERACTIVE, INC. Third Quarter 2017 Earnings Call November 7, 2017 SAFE HARBOR This presentation is for discussion purposes only. The material is based upon information that we consider reliable,
Zynga Announces Second Quarter 2014 Financial Results
 August 7, 2014 Zynga Announces Second Quarter 2014 Financial Results DELIVERS $175M IN BOOKINGS AND $14M IN ADJUSTED EBITDA Company Lowers Outlook for Full Year 2014; Continues Significant Investment in
Scientific Games Fourth Quarter 2012 Earnings Presentation
 Scientific Games Fourth Quarter 2012 Earnings Presentation Safe Harbor Statement Throughout this presentation we make forward-looking statements within the meaning of the U.S. Private Securities Litigation
CPI Card Group Inc. Reports Fourth Quarter and Full Year 2016 Results
 NEWS RELEASE CPI Card Group Inc. Reports Fourth Quarter and Full Year 2016 Results 3/1/2017 Q4 Net Sales of $67.4 million, Full Year 2016 Net Sales of $308.7 million Full Year Net Income from Continuing
THIRD QUARTER 2018 FINANCIAL RESULTS OCTOBER 24, AMD Q FINANCIAL RESULTS OCTOBER 24, 2018
 THIRD QUARTER 2018 FINANCIAL RESULTS OCTOBER 24, 2018 1 AMD Q3 2018 FINANCIAL RESULTS OCTOBER 24, 2018 This presentation contains forward-looking statements concerning Advanced Micro Devices, Inc. (AMD)
Veritiv Corporation Fourth Quarter and Full Year 2018 Financial Results February 28, 2019
 Veritiv Corporation Fourth Quarter and Full Year 2018 Financial Results February 28, 2019 Tom Morabito Director of Investor Relations 2 Safe Harbor Provision Certain statements contained in this presentation
SOLIUM CAPITAL INC. MANAGEMENT S DISCUSSION AND ANALYSIS FOR THE QUARTER ENDED JUNE 30, 2015
 SOLIUM CAPITAL INC. MANAGEMENT S DISCUSSION AND ANALYSIS FOR THE QUARTER ENDED JUNE 30, 2015 This Management s Discussion and Analysis ( MD&A ) of Solium Capital Inc. ( Solium or the Company ) for the
Second Quarter 2018 Earnings Presentation May 8, 2018
 Second Quarter 2018 Earnings Presentation May 8, 2018 Cautionary statements This presentation contains forward-looking statements that are subject to known and unknown risks and uncertainties, many of
Conduent Reports Third Quarter 2017 Results; Operating Income and Adjusted EBITDA Rise; Strong Cash Flow and Adjusted EPS; Healthy Renewal Rate
 News from Conduent Conduent Incorporated 100 Campus Drive, Suite 200 Florham Park, NJ 07932 www.conduent.com Conduent Reports Third Quarter 2017 Results; Operating Income and Adjusted EBITDA Rise; Strong
Veritiv Corporation First Quarter 2018 Financial Results May 8, 2018
 Veritiv Corporation First Quarter 2018 Financial Results May 8, 2018 Tom Morabito Director of Investor Relations 2 Safe Harbor Provision Certain statements contained in this presentation regarding Veritiv
Includes results of KEW MEDIA Distribution, formerly Content Media Corporation, for the 12 months ended March 31,
 KEW MEDIA GROUP Reports Financial Results for Fourth Quarter of 2017 Company Exceeds 2017 Pro Forma Adjusted EBITDA 1 2 Forecast; Expects Further Growth Attributable to Acquisitions in 2018 Toronto, ON,
4Q17 EARNINGS FEBRUARY 2018
 4Q17 EARNINGS FEBRUARY 218 2 FORWARD-LOOKING STATEMENTS The statements contained in this release that refer to plans and expectations for the next quarter, the full year or the future are forward-looking