Q2'17 Actuals. Variance $ (Y/Y)
|
|
|
- Adela Dennis
- 5 years ago
- Views:
Transcription
1 1

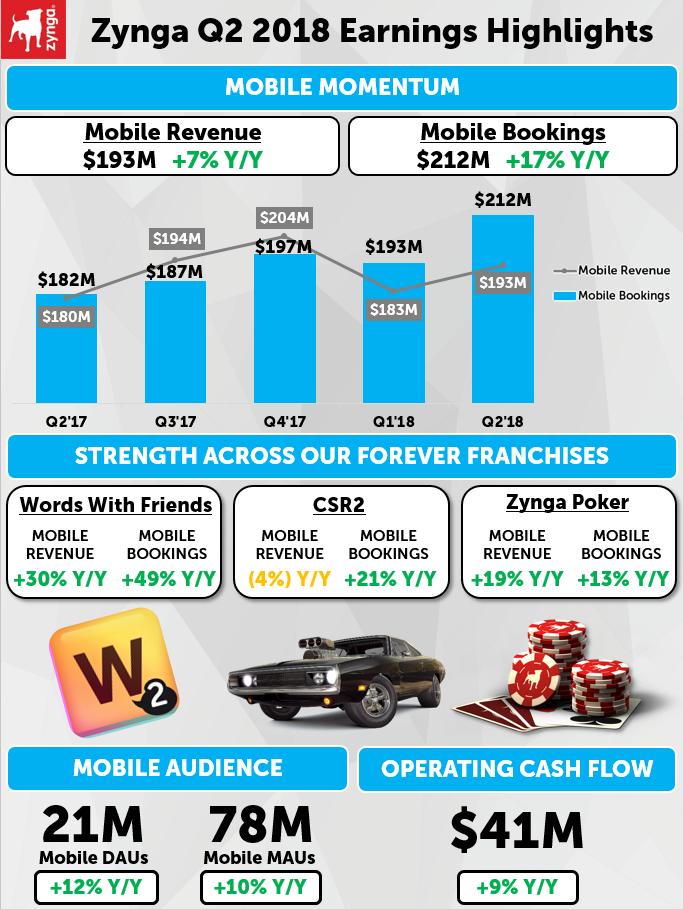
2 ZYNGA Q2 QUARTERLY EARNINGS LETTER August 1, Dear Shareholders, We look forward to discussing our Q2 results during today s earnings call at 2:00 p.m. PT. Below, you ll find our quarterly earnings letter detailing our Q2 performance, as well as our outlook for Q3 and growth opportunities for and beyond. Please note that we manage our business based on topline measures including revenue, which is comprised of the change in deferred revenue and bookings. Revenue and the change in deferred revenue are both directly affected by bookings results, and management utilizes bookings as a primary topline measure to help inform their decisions. HIGHLIGHTS We had a strong first half of the year, delivering Q2 results ahead of our guidance, driven by strength in our mobile live services and continued improvement in our operating leverage. Our live services strategy of creating innovative bold beats and feature enhancements that increase player engagement is paying off, as our forever franchises Words With Friends, CSR2 and Zynga Poker collectively delivered double-digit year-over-year mobile revenue and bookings growth. Q2 Highlights: Mobile revenue was up 7% year-over-year and mobile bookings were up 17% year-over-year, driven primarily by strength in our live services and a partial quarter of bookings contribution from our acquisition of Gram Games. Words With Friends Mobile revenue was up 30% year-over-year and mobile bookings were up 49% year-over-year driven by a stronger advertising performance and the recent introduction of user pay monetization. CSR2 Delivered another great quarter driven by our best performing Fast & Furious event to date. While mobile revenue was down 4% year-over-year due to the timing of when we recognize bookings into revenue, CSR2 delivered its best quarterly bookings performance in franchise history, up 21% year-over-year. Zynga Poker Mobile revenue was up 19% year-over-year and mobile bookings were up 13% year-over-year, supported by continued enhancements to in-game features such as Challenges and Jackpots. Completed our acquisition of Gram Games in May, bringing to Zynga a talented team with a proven track record, expanding our portfolio of live franchises and adding to our pipeline of new games. Continued operating efficiency with GAAP operating expenses at 67% of revenue, in-line with that in Q2 2017, and Non-GAAP operating expenses at 54% of bookings, down from 58% of bookings in Q Generated operating cash flow of $41.1 million, up 9% year-over-year. EXECUTIVE SUMMARY Q2'18 Actuals Q2'17 Actuals Variance $ (Y/Y) Variance % (Y/Y) Q2'18 Guidance Variance $ (Guidance) Variance % (Guidance) (in millions) Revenue $ $ $ % $ $ % Net income (loss) $ (0.9) $ 5.1 $ (6.0) NM $ (15.0) $ 14.1 (94)% Bookings $ $ $ % $ $ % Adjusted EBITDA (1) $ 26.7 $ 29.9 $ (3.2) (11)% $ 19.0 $ % Net release of (increase in) deferred revenue (2) $ (16.9) $ 0.1 $ (17.0) NM $ (20.0) $ 3.1 (16)% (1) Adjusted EBITDA includes the net release of (increase in) deferred revenue. (2) For clarity, a net release of deferred revenue results in revenue being higher than bookings and is a positive impact to Adjusted EBITDA as reported; a net increase in deferred revenue results in revenue being lower than bookings and is a negative impact to Adjusted EBITDA as reported. In Q2, revenue was $217.0 million, above our guidance by $9.0 million and up $7.8 million or 4% year-over-year. Bookings were $233.9 million, beating our guidance by $5.9 million and up $24.7 million or 12% year-over-year. We had a net loss of $0.9 million, $14.1 million better than our guidance and a decline of $6.0 million in net income year-over-year. 2
3 We had a net increase in deferred revenue of $16.9 million versus our guidance of a net increase of $20.0 million and a net release of $0.1 million in the prior year quarter. The acquisition of a new portfolio of games and strength in our live service bookings were the primary drivers of the net increase in deferred revenue in the quarter. The main contributors to the build in deferred revenue were bookings from our recently acquired portfolio of titles from Gram Games, initial user pay bookings from Words With Friends and strength in CSR2 s bookings. The year-over-year difference in change in deferred revenue accounted for $17.0 million of the year-over-year decrease in revenue, net income and Adjusted EBITDA. Our Adjusted EBITDA was $26.7 million, above our guidance by $7.7 million, and a decrease of $3.2 million year-over-year. We generated operating cash flow of $41.1 million in the quarter, up 9% year-over-year. In Q2, mobile revenue was up 7% year-over-year and mobile bookings were up 17% year-over-year. Mobile now represents 89% of total revenue versus 86% a year ago and 90% of total bookings versus 87% in Q Mobile online game or mobile user pay revenue was up 3% year-over-year, and mobile user pay bookings were up 14% year-over-year. Mobile advertising revenue was also up 22% year-over-year, and mobile advertising bookings were up 26% year-over-year. Our strength in advertising in the quarter was primarily driven by increased player engagement in Words With Friends as well as network optimizations across our advertising portfolio. Our strong performance in Q2 was driven by our mobile live services, in particular our forever franchises Words With Friends, CSR2 and Zynga Poker. Our focus on creating innovative bold beats and feature enhancements continues to drive deeper engagement with our players and contributed to double-digit year-over-year mobile revenue and bookings growth collectively across our forever franchises. Words With Friends delivered impressive growth in Q2 with mobile revenue up 30% year-over-year and mobile bookings up 49% year-over-year, driven by a stronger advertising performance and the recent introduction of user pay monetization. In Q2 we introduced Daily Goals, a new bold beat designed to reward players for completing fun daily achievements, and also improved our Solo Challenge feature by giving players more ways to extend their single-player experience. We were also pleased to see players continue to enhance their gameplay by leveraging our popular new Boosts which include Word Radar, Hindsight and Tile Swap. All of these features are driving higher levels of player engagement while also improving the monetization potential of the game. Looking forward, we are excited to build upon this momentum and create more value for players by further enhancing these features in the coming quarters. CSR2 had another great quarter driven by our Fast & Furious finale event, which represented the game s strongest performing event to date from our licensing partnership with Universal Brand Development. While mobile revenue was down 4% year-over-year due to the timing of when we recognize bookings into revenue, CSR2 delivered its best quarterly bookings performance in franchise history, up 21% year-over-year. A key component to the success of CSR2 is our ability to develop strong partnerships with leading auto manufacturers. In Q2, we released a new in-game BMW M2 Competition that gave CSR2 players the opportunity to virtually race this high-performance car ahead of its real-world debut. For the remainder of the year, CSR2 has more bold beats planned, including a series of events featuring some of Porsche s most iconic cars, collectors and drivers in commemoration of Porsche s 70 th anniversary. In Q2, Zynga Poker s mobile revenue grew 19% year-over-year and mobile bookings were up 13% year-over-year. The game s performance was supported by additional updates to game features such as Challenges and Jackpots. Looking ahead, we are excited to bring players a brand new competitive poker experience through our partnership with the World Poker Tour (WPT). Our WPT-themed in-game experience will include a variety of pro-style tournaments with a wide range of stakes and higher in-game payouts. We will begin introducing WPT to Zynga Poker players towards the end of Q3 and expect the feature to steadily ramp with new competitive modes in future quarters. In our Social Slots portfolio, mobile revenue was down 5% year-over-year and mobile bookings were down 3% year-overyear. Our Hit It Rich! Slots and Wizard of Oz Slots games continued to deliver year-over-year mobile revenue and bookings growth; however, this performance was more than offset by declines from other titles in the portfolio. Our strategy in Social Slots has been to increase player engagement and monetization by focusing on fewer slots games to create deeper player experiences. Looking forward, we remain focused on improving player engagement in Hit It Rich! Slots and Wizard of Oz Slots by introducing new experiences that give players more ways to play their favorite social casino games. Another highlight in the quarter was our acquisition of Gram Games, which brings to Zynga a talented team with a proven track record, expands our portfolio of live services and adds to our pipeline of new games. We are pleased with the initial integration of Gram Games into Zynga and look forward to their contributions in the future. In particular, Merge Dragons! engaged players in Q2 with new content that included baby dragons and a summer-themed moon dragon event. We believe that Merge Dragons! has the potential to become a new forever franchise for Zynga, and we are actively working on new updates to the game, including the introduction of social features over the long term. 3

4 In terms of new game development, in Q2 we entered into soft launch with our new Casual mobile game, Willy Wonka s Sweet Adventure, which combines Match-3 and Builder mechanics to innovate within the popular Match-3 genre. While it is early in the soft launch process, we are pleased with how the game is progressing and will continue to collect player feedback while rigorously testing the game for long-term engagement and retention. Across our broader portfolio, we are actively developing new titles across the Action Strategy, Casual, Invest Express and Social Casino categories. Our approach to new game development is to combine strong game teams with high potential sequels, reinvigorated Zynga brands, new intellectual properties and strategic licenses with global appeal. While we don t expect new games to have a material revenue or bookings impact in, we are encouraged by the potential contribution from new games in 2019 and beyond. Turning to audience, Q2 was a dynamic quarter as mobile average daily active users (DAUs) increased by 12% year-overyear and mobile average monthly active users (MAUs) increased by 10%. Sequentially, mobile average DAUs decreased by 8% and mobile average MAUs decreased by 4%. In Q2, our audience was affected by unique events in the quarter including platform changes made by Facebook and our recent sunsets of several older mobile games. Despite these events, we are pleased with the player engagement and monetization we are seeing across our forever franchises and have confidence in our ability to continue this trend in the coming quarters. Overall, we are pleased with the progress we ve made in growing our mobile live services, while also delivering continued improvement in operating leverage. In Q2, we delivered GAAP operating expenses at 67% of revenue in-line with 67% of revenue in Q and non-gaap operating expenses at 54% of bookings down from 58% of bookings a year ago. This contributed to generating operating cash flow of $41.1 million, up 9% year-over-year. Looking forward, we remain focused on executing against our growth strategy and achieving our near-term margin goal later this year. Q2 PERFORMANCE OVERVIEW Q2 Financial Highlights Revenue of $217.0 million; above our guidance and up 4% year-over-year. GAAP operating expenses of $145.8 million; up 5% year-over-year. Net loss of $0.9 million; $14.1 million above our guidance and down $6.0 million year-over-year. Net increase in deferred revenue of $16.9 million; versus our guidance of a net increase of $20.0 million. Bookings of $233.9 million; above our guidance and up 12% year-over-year. Non-GAAP operating expenses of $125.4 million; up 3% year-over-year. Adjusted EBITDA of $26.7 million; above our guidance and a decrease of $3.2 million year-over-year. Generated operating cash flow of $41.1 million; up 9% year-over-year. Q2 Mobile Highlights Mobile revenue of $192.7 million; up 7% year-over-year. Mobile bookings of $211.6 million; up 17% year-over-year. Mobile user pay revenue and bookings were up 3% and 14%, respectively, year-over-year. Mobile advertising revenue and bookings were up 22% and 26%, respectively, year-over year. Mobile average DAUs of 21 million; up 12% year-over-year. 4

5 Q2 Advertising Highlights Advertising revenue of $52.2 million was up 18% year-over-year. Advertising bookings of $53.0 million were up 22% year-over-year. Advertising represented 24% of total revenue and 23% of total bookings as compared to 21% of total revenue and 21% of total bookings in Q Our strength in advertising was primarily driven by increased player engagement in Words With Friends as well as network optimizations across our advertising portfolio. Q2 Player Metrics (users and payers in millions) Three Months Ended March 31, Q2'18 Q2' Q/Q Y/Y Average daily active users (DAUs) (1) (8)% 11 % Average mobile DAUs (1) (8)% 12 % Average web DAUs (1) (14)% 1 % Average monthly active user (MAUs) (1) (7)% 10 % Average mobile MAUs (1) (4)% 10 % Average web MAUs (1) (21)% 12 % Average daily bookings per average DAU (ABPU) $ $ $ % 1 % Average monthly unique users (MUUs) (2) % 1 % Average monthly unique payers (MUPs) (2) (8)% (11)% Payer conversion (2) 2.0 % 2.3 % 2.3 % (10)% (12)% (1) We do not have the third party network login data to link an individual who has played under multiple user accounts and accordingly, actual DAU and MAU may be lower than reported due to the potential duplication of these individuals. Specifically, for the second quarter of, DAUs and MAUs incrementally include Daily Celebrity Crossword, Solitaire, our Facebook Instant Games, the casual card games acquired in December 2017 and games acquired from Gram Games in May ; for the first quarter of, DAUs and MAUs incrementally include Daily Celebrity Crossword, Solitaire, our Facebook Instant Games and casual card games acquired in December 2017; for the second quarter of 2017, DAUs and MAUs incrementally include Daily Celebrity Crossword, Solitaire and our Facebook Instant Games. (2) For the second quarter of, MUUs and MUPs exclude Daily Celebrity Crossword, Solitaire, our Facebook Instant Games, casual card games acquired in December 2017 and games acquired from Gram Games in May ; for the first quarter of, MUUs and MUPs exclude Daily Celebrity Crossword, Solitaire, our Facebook Instant Games and casual card games acquired in December 2017; for the second quarter of 2017, MUUs and MUPs exclude Daily Celebrity Crossword, Solitaire and our Facebook Instant Games. These games are excluded to avoid potential double counting of MUUs and MUPs as our systems are unable to distinguish whether a player of these games is also a player of the Company s other games during the applicable time periods. 5


6 FINANCIAL GUIDANCE Q3 Guidance Revenue of $218 million Net increase in deferred revenue of $30 million Bookings of $248 million Net loss of $21 million Adjusted EBITDA of $16 million Our Q3 performance will be driven primarily by bold beat execution across our live services and a full quarter contribution from our acquisition of Gram Games. We anticipate that our year-over-year growth will benefit from full quarter contributions from our Casual Cards and Gram Games acquisitions as well as strength across our forever franchises. We continue to expect our sequential and year-over-year progression to be affected by declines in web and older mobile games. Similar to Q2, we expect a significant net increase in deferred revenue as we continue to defer the majority of user pay bookings from our recently acquired portfolio of titles from Gram Games in addition to a net increase in deferred revenue from our live service user pay bookings, in particular from Words With Friends and CSR2. We expect our gross margins to be comparable with Q2 and our operating expenses to increase sequentially, primarily due to a full quarter of contribution from Gram Games. We continue to believe will be a live services year and remain focused on achieving our near-term margin goal later this year. While we don t expect new games to have a material revenue or bookings impact in, we are encouraged by the potential contribution from new games in 2019 and beyond. Looking forward, we remain committed to growing Zynga in four ways: (1) Delivering growth in our live services, (2) Building new games with the goal of creating forever franchises, (3) Investing in emerging mobile technologies and (4) Exploring M&A opportunities that will enhance our growth potential. We re excited about how we re executing against our growth strategy as we prioritize delivering value to our players, employees and investors. Sincerely, Frank Gibeau Chief Executive Officer Ger Griffin Chief Financial Officer 6
7 CONTACTS Rebecca Lau Director, Investor Relations & Corporate Finance Kelly Pakula Senior Director, Corporate Communications FORWARD-LOOKING STATEMENTS This letter contains forward-looking statements, including those statements relating to our outlook for the third quarter under the headings "FINANCIAL GUIDANCE" and RECONCILIATION OF GAAP TO NON-GAAP THIRD QUARTER GUIDANCE and statements relating to, among other things: our operational performance and strategy, including our focus on live services, and growth projections relating to our mobile forever franchises, including our ability to enhance the monetization potential of our games; our continued investment in game innovations; our plans to acquire and integrate additional games and IP assets, such as our continued license of the Fast & Furious brand and various vehicle manufacturers; our belief that Merge Dragons! has the potential to become a forever franchise; our partnership with the World Poker Tour (WPT), including the development, launch and success of future game features; our ability to successfully launch new games and enhance existing games; the success of new product and feature launches and other special events; the prospect of emerging game platforms and features, such as chat, augmented reality and next generation wireless networks; our expectations regarding the advertising market, including anticipated trends in that market; our expectations in the mobile game industry, including anticipated trends in that market; our performance expectations regarding our legacy portfolio of web and older mobile games; our share repurchase program and capital allocation strategy; and our ability to achieve financial projections, including revenue, bookings, income and margin goals. Forward-looking statements often include words such as "outlook," "projected," "intends," "will," "anticipate," "believe," "target," "expect," and statements in the future tense are generally forward-looking. The achievement or success of the matters covered by such forward-looking statements involves significant risks, uncertainties, and assumptions. Our actual results could differ materially from those predicted or implied and reported results should not be considered as an indication of our future performance. Undue reliance should not be placed on such forward-looking statements, which are based on information available to us on the date hereof. We assume no obligation to update such statements. More information about factors that could affect our operating results are described in greater detail in our public filings with the Securities and Exchange Commission (the SEC ), copies of which may be obtained by visiting our Investor Relations web site at or the SEC's web site at In addition, the preliminary financial results set forth in this letter are estimates based on information currently available to us. While we believe these estimates are meaningful, they could differ from the actual amounts that we ultimately report in our Quarterly Report on Form 10-Q for the quarter ended. We assume no obligation and do not intend to update these estimates prior to filing our Quarterly Report on Form 10-Q. NON-GAAP FINANCIAL MEASURES We have provided in this letter certain non-gaap financial measures to supplement our consolidated financial statements prepared in accordance with U.S. GAAP (our GAAP financial statements ). Management uses non-gaap financial measures internally in analyzing our financial results to assess operational performance and liquidity. Our non-gaap financial measures may be different from non-gaap financial measures used by other companies. The presentation of our non-gaap financial measures is not intended to be considered in isolation or as a substitute for, or superior to, our GAAP financial statements. We believe that both management and investors benefit from referring to our non-gaap financial measures in assessing our performance and when planning, forecasting and analyzing future periods. We believe our non-gaap financial measures are useful to investors because they allow for greater transparency with respect to key financial measures we use in making operating decisions and because our investors and analysts use them to help assess the health of our business. We have provided reconciliations of our non-gaap financial measures used in this letter to the most directly comparable GAAP financial measures in the following tables. Because of the following limitations of our non-gaap financial measures, you should consider the non-gaap financial measures presented in this letter with our GAAP financial statements. 7
8 Key limitations of our non-gaap financial measures include: Bookings does not reflect that we defer and recognize online game revenue and revenue from certain advertising transactions over the estimated average playing period of payers for durable virtual items or as consumed for consumable virtual items; Adjusted EBITDA does not include the impact of stock-based expense, acquisition-related transaction expenses, contingent consideration fair value adjustments, impairment of intangible assets, legal settlements and restructuring expense; Adjusted EBITDA does not reflect provisions for or benefits from income taxes and does not include other income (expense) net, which includes foreign exchange gains and losses, and interest income; Adjusted EBITDA excludes depreciation and amortization of tangible and intangible assets. Although depreciation and amortization are non-cash charges, the assets being depreciated and amortized may have to be replaced in the future; and Free cash flow is derived from net cash provided by operating activities less cash spent on capital expenditures. 8
9 ZYNGA INC. CONSOLIDATED BALANCE SHEETS (In thousands, unaudited) December 31, 2017 Assets Current assets: Cash and cash equivalents $ 210,177 $ 372,870 Short-term investments 182, ,506 Accounts receivable, net of allowance of $0 at and December 31, , ,677 Restricted cash 10,006 12,807 Prepaid expenses 27,239 24,253 Other current assets 11,736 8,837 Total current assets 541, ,950 Goodwill 949, ,464 Intangible assets, net 137,172 64,258 Property and equipment, net 264, ,589 Restricted cash 25,000 20,000 Prepaid expenses 21,794 23,821 Other non-current assets 47,274 43,251 Total assets $ 1,985,873 $ 1,979,333 Liabilities and stockholders equity Current liabilities: Accounts payable $ 11,628 $ 18,938 Income tax payable 1,914 6,677 Deferred revenue 156, ,007 Other current liabilities 99, ,089 Total current liabilities 269, ,711 Deferred revenue 2, Deferred tax liabilities, net 20,998 5,902 Other non-current liabilities 93,239 48,912 Total liabilities 386, ,093 Stockholders equity: Common stock and additional paid-in capital 3,462,142 3,426,505 Accumulated other comprehensive income (loss) (100,111) (93,497) Accumulated deficit (1,762,437) (1,691,768) Total stockholders equity 1,599,594 1,641,240 Total liabilities and stockholders equity $ 1,985,873 $ 1,979,333 9
10 ZYNGA INC. CONSOLIDATED STATEMENTS OF OPERATIONS (In thousands, except per share data, unaudited) Three Months Ended Six Months Ended March 31, Revenue: Online game $ 164,680 $ 161,553 $ 163,745 $ 326,233 $ 317,226 Advertising and other 52,365 46,679 45,486 99,044 86,289 Total revenue 217, , , , ,515 Costs and expenses: Cost of revenue 74,182 69,042 64, , ,049 Research and development 67,391 60,825 64, , ,817 Sales and marketing 52,878 50,855 51, ,733 97,821 General and administrative 25,580 23,253 23,551 48,833 46,116 Total costs and expenses 220, , , , ,803 Income (loss) from operations (2,986) 4,257 5,692 1,271 (3,288) Interest income 1,800 1,810 1,109 3,610 2,046 Other income (expense), net 2,605 3,401 1,614 6,006 3,050 Income (loss) before income taxes 1,419 9,468 8,415 10,887 1,808 Provision for (benefit from) income taxes 2,330 3,859 3,322 6,189 6,189 Net income (loss) $ (911) $ 5,609 $ 5,093 $ 4,698 $ (4,381) Net income (loss) per share attributable to common stockholders: Basic $ (0.00) $ 0.01 $ 0.01 $ 0.01 $ (0.01) Diluted $ (0.00 ) $ 0.01 $ 0.01 $ 0.01 $ (0.01 ) Weighted average common shares used to compute net income (loss) per share attributable to common stockholders: Basic 858, , , , ,025 Diluted 858, , , , ,025 Stock-based compensation expense included in the above line items: Cost of revenue $ 564 $ 431 $ 371 $ 995 $ 990 Research and development 10,363 8,625 10,483 18,988 22,196 Sales and marketing 2,214 1,836 1,751 4,050 3,538 General and administrative 4,228 3,221 3,627 7,449 7,034 Total stock-based compensation expense $ 17,369 $ 14,113 $ 16,232 $ 31,482 $ 33,758 10
11 ZYNGA INC. CONSOLIDATED STATEMENTS OF CASH FLOWS (In thousands, unaudited) Three Months Ended March 31, 2017 (As Adjusted) (1) Six Months Ended 2017 (As Adjusted) (1) Cash flows from operating activities: Net income (loss) $ (911) $ 5,609 $ 5,093 $ 4,698 $ (4,381) Adjustments to reconcile net income (loss) to net cash provided by (used in) operating activities: Depreciation and amortization 9,178 7,731 7,398 16,909 16,279 Stock-based compensation expense 17,369 14,113 16,232 31,482 33,758 (Gain) loss from foreign currency, sales of investments, assets and other, net (460) 1,951 (222) 1,491 (184) (Accretion) and amortization on marketable debt securities, net (751) (549) (1,300) Change in deferred income taxes and other (49) 1,322 1,193 1,273 2,268 Changes in operating assets and liabilities: Accounts receivable, net 3,327 10, ,009 (7,968) Other assets (2,437) (4,786) 3,309 (7,223) (2,594) Accounts payable (6,687) (9,574) 461 (16,261) (8,341) Deferred revenue 16,893 11,234 (53) 28,126 13,021 Income tax payable (32) (5,004) 1,497 (5,042) 2,749 Other liabilities 5,699 (36,676) 1,726 (30,974) (11,698) Net cash provided by (used in) operating activities 41,139 (3,947) 37,630 37,188 32,909 Cash flows from investing activities: Purchases of short-term investments (59,267) (124,822) (184,089) Maturities of short-term investments 142, , ,000 Sales of short-term investments 9,999 9,999 Acquisition of property and equipment (2,255) (1,424) (1,856) (3,679) (4,141) Business acquisitions, net of cash acquired and restricted cash held in escrow (222,075) (222,075) (27,581) Proceeds from sale of property and equipment Release of restricted cash escrow from business combinations (22,800) (22,800) Other investing activities, net (7,225) Net cash provided by (used in) investing activities (131,498) 10,979 (1,558) (120,519) (38,799) Cash flows from financing activities: Taxes paid related to net share settlement of stockholders' equity awards (7,609) (6,364) (9,008) (13,972) (9,423) Repurchases of common stock (25,874) (39,544) (10,760) (65,418) (96,924) Proceeds from issuance of common stock 844 3, ,158 4,017 Acquisition-related contingent consideration payment (5,115) Net cash provided by (used in) financing activities (32,639) (42,597) (18,903) (75,232) (107,445) Effect of exchange rate changes on cash, cash equivalents and restricted cash (3,407) 1,476 1,169 (1,931) 2,026 Net change in cash, cash equivalents and restricted cash (126,405) (34,089) 18,338 (160,494) (111,309) Cash, cash equivalents and restricted cash, beginning of period 371, , , , ,716 Cash, cash equivalents and restricted cash, end of period $ 245,183 $ 371,588 $ 750,407 $ 245,183 $ 750,407 (1) Prior period 2017 cash flow amounts retrospectively adjusted to reflect the adoption of ASU , Statement of Cash Flows (Topic 230): Restricted Cash. 11
12 ZYNGA INC. RECONCILIATION OF GAAP TO NON-GAAP RESULTS (In thousands, except per share data, unaudited) Three Months Ended Six Months Ended March 31, Reconciliation of Revenue to Bookings: Total Revenue $ 217,045 $ 208,232 $ 209,231 $ 425,277 $ 403,515 Change in deferred revenue 16,884 11,240 (53) 28,124 13,021 Bookings: Total $ 233,929 $ 219,472 $ 209,178 $ 453,401 $ 416,536 Reconciliation of Revenue to Bookings: Mobile Revenue $ 192,744 $ 182,601 $ 179,868 $ 375,345 $ 341,481 Change in deferred revenue 18,858 10,822 1,755 29,680 16,263 Bookings: Mobile $ 211,602 $ 193,423 $ 181,623 $ 405,025 $ 357,744 Reconciliation of Revenue to Bookings: Advertising Revenue $ 52,246 $ 44,826 $ 44,443 $ 97,071 $ 84,497 Change in deferred revenue (1,019) 1, Bookings: Advertising $ 53,038 $ 45,122 $ 43,424 $ 98,159 $ 84,531 Reconciliation of Net Income (Loss) to Adjusted EBITDA Net income (loss) $ (911) $ 5,609 $ 5,093 $ 4,698 $ (4,381) Provision for income taxes 2,330 3,859 3,322 6,189 6,189 Other income, net (2,605) (3,401) (1,614) (6,006) (3,050) Interest income (1,800) (1,810) (1,109) (3,610) (2,046) Restructuring expense (benefit), net , Depreciation and amortization 9,178 7,731 7,398 16,909 16,279 Acquisition-related transaction expenses 1,283 1, Contingent consideration fair value adjustment 1,500 (807) 1,500 (901) Stock-based compensation expense 17,369 14,113 16,232 31,482 33,758 Adjusted EBITDA $ 26,744 $ 26,572 $ 29,937 $ 53,316 $ 46,612 Reconciliation of GAAP Operating Expense to Non-GAAP Operating Expense GAAP operating expense $ 145,849 $ 134,933 $ 139,367 $ 280,782 $ 277,754 Restructuring (expense) benefit, net (400) (444) (1,422) (844) (577) Amortization of intangible assets from acquisition (467) (534) (1,397) (1,001) (2,450) Acquisition-related transaction expenses (1,283) (1,283) (187) Contingent consideration fair value adjustment (1,500) 807 (1,500) 901 Stock-based compensation expense (16,805) (13,682) (15,861) (30,487) (32,768) Non-GAAP operating expense $ 125,394 $ 120,273 $ 121,494 $ 245,667 $ 242,673 Reconciliation of Cash Provided by Operating Activities to Free Cash Flow (2) Net cash provided by (used in) operating activities $ 41,139 $ (3,947) $ 37,630 $ 37,188 $ 32,909 Acquisition of property and equipment (2,255) (1,424) (1,856) (3,679) (4,141) Free cash flow $ 38,884 $ (5,371) $ 35,774 $ 33,509 $ 28,768 (2) Prior period 2017 cash flow amounts retrospectively adjusted to reflect the adoption of ASU , Statement of Cash Flows (Topic 230): Restricted Cash. 12
13 ZYNGA INC. RECONCILIATION OF GAAP TO NON-GAAP THIRD QUARTER GUIDANCE (In thousands, except per share data, unaudited) Third Quarter Reconciliation of Revenue to Bookings Revenue $ 218,000 Change in deferred revenue 30,000 Bookings $ 248,000 Reconciliation of Net Loss to Adjusted EBITDA Net loss $ (21,000) Provision for income taxes 2,000 Other income, net (3,000) Interest income (1,000) Depreciation and amortization 13,000 Contingent consideration fair value adjustment 5,000 Stock-based compensation expense 21,000 Adjusted EBITDA $ 16,000 GAAP basic shares 870,000 Basic net loss per share $ (0.02) 13
ZYNGA Q FINANCIAL RESULTS. October 31, 2018
 ZYNGA Q3 2018 FINANCIAL RESULTS October 31, 2018 TABLE OF CONTENTS Overview of Q3 2018 Performance Q4 2018 Financial Guidance GAAP to Non-GAAP Reconciliations 2 MANAGEMENT TEAM CHIEF EXECUTIVE OFFICER
ZYNGA Q FINANCIAL RESULTS. May 2, 2018
 ZYNGA Q1 2018 FINANCIAL RESULTS May 2, 2018 TABLE OF CONTENTS Overview of Q1 2018 Performance Q2 2018 Financial Guidance GAAP to Non-GAAP Reconciliations 2 MANAGEMENT TEAM CHIEF EXECUTIVE OFFICER Frank
ZYNGA Q FINANCIAL RESULTS. February 7, 2018
 ZYNGA Q4 2017 FINANCIAL RESULTS February 7, 2018 TABLE OF CONTENTS Overview of Q4 2017 Performance Q1 2018 Financial Guidance GAAP to Non-GAAP Reconciliations 2 MANAGEMENT TEAM CHIEF EXECUTIVE OFFICER
ZYNGA Q FINANCIAL RESULTS. May 4, 2017
 ZYNGA Q1 2017 FINANCIAL RESULTS May 4, 2017 TABLE OF CONTENTS Overview of Q1 2017 Performance Q2 2017 Financial Guidance GAAP to Non-GAAP Reconciliations 2 MANAGEMENT TEAM CHIEF EXECUTIVE OFFICER Frank
ZYNGA Q FINANCIAL RESULTS. November 7, 2017
 ZYNGA Q3 2017 FINANCIAL RESULTS November 7, 2017 TABLE OF CONTENTS Overview of Q3 2017 Performance Q4 2017 Financial Guidance GAAP to Non-GAAP Reconciliations 2 MANAGEMENT TEAM CHIEF EXECUTIVE OFFICER
Q Zynga Quarterly Earnings Letter. February 6, 2019
 Q4 2018 Zynga Quarterly Earnings Letter February 6, 2019 Dear Shareholders, We look forward to discussing our Q4 and 2018 full year results during today s earnings call at 2:00 p.m. PT. Our quarterly earnings
ZYNGA Q FINANCIAL RESULTS. November 2, 2016
 ZYNGA Q3 2016 FINANCIAL RESULTS November 2, 2016 TABLE OF CONTENTS Discussion of Q3 2016 Performance Q4 2016 Financial Outlook GAAP to Non-GAAP Reconciliations 2 MANAGEMENT TEAM CHIEF EXECUTIVE OFFICER
ZYNGA Q FINANCIAL RESULTS. May 4, 2016
 ZYNGA Q1 2016 FINANCIAL RESULTS May 4, 2016 TABLE OF CONTENTS Discussion of Q1 2016 Performance Q2 2016 Financial Outlook GAAP to Non-GAAP Reconciliations 2 MANAGEMENT TEAM CHIEF EXECUTIVE OFFICER Frank
EXAMPLE EARNINGS SLIDES UPDATE ON EXTERNAL PRESENTATION OF NON-GAAP RESULTS
 EXAMPLE EARNINGS SLIDES UPDATE ON EXTERNAL PRESENTATION OF NON-GAAP RESULTS October 27, 2016 Note: The Q2 2016 earnings slides have been revised to reflect the changes in how Zynga will externally report
ZYNGA Q FINANCIAL RESULTS. February 10, 2016
 ZYNGA Q4 2015 FINANCIAL RESULTS February 10, 2016 TABLE OF CONTENTS Discussion of 2015 and Q4 2015 Performance Q1 2016 Financial Outlook GAAP to Non-GAAP Reconciliations 2 MANAGEMENT TEAM FOUNDER, CHIEF
Zynga Announces Third Quarter 2014 Financial Results
 November 6, 2014 Zynga Announces Third Quarter 2014 Financial Results DELIVERS $175M IN BOOKINGS AND $2M IN ADJUSTED EBITDA ZYNGA REAFFIRMS FULL YEAR 2014 OUTLOOK FOR BOOKINGS AND ADJUSTED EBITDA SAN FRANCISCO,
ZYNGA Q FINANCIAL RESULTS. November 3, 2015
 ZYNGA Q3 2015 FINANCIAL RESULTS November 3, 2015 TABLE OF CONTENTS Discussion of Q3 2015 Performance Q4 2015 Financial Outlook GAAP to Non-GAAP Reconciliations 2 MANAGEMENT TEAM FOUNDER, CHIEF EXECUTIVE
Zynga Announces Fourth Quarter and 2014 Financial Results
 February 12, 2015 Zynga Announces Fourth Quarter and 2014 Financial Results Delivers $182.4M in Bookings and $9.4M in Adjusted EBITDA Announces Entrance into Mobile Action Strategy Category with Upcoming
Zynga Announces Second Quarter 2014 Financial Results
 August 7, 2014 Zynga Announces Second Quarter 2014 Financial Results DELIVERS $175M IN BOOKINGS AND $14M IN ADJUSTED EBITDA Company Lowers Outlook for Full Year 2014; Continues Significant Investment in
Q Earnings. February 5, 2013
 Q4 2012 Earnings February 5, 2013 2/5/2013 Q4 2012 Earnings 1 Forward-Looking Statements This presentation contains, and our call will contain, forward looking statements relating to, among other things,
Q Earnings. GAAP to Non-GAAP Reconciliation
 Q1 2012 Earnings GAAP to Non-GAAP Reconciliation This presentation contains forward-looking statements relating to, among other things, our outlook for full year 2012 bookings, adjusted EBITDA, stock-based
Q Earnings. GAAP to Non-GAAP
 Q4 2011 Earnings GAAP to Non-GAAP Reconciliation This presentation contains forward-looking statements relating to, among other things, our outlook for full year 2012 bookings, adjusted EBITDA, stock-based
ZYNGA Q4 14 FINANCIAL RESULTS FEBRUARY 12, 2015
 ZYNGA Q4 14 FINANCIAL RESULTS FEBRUARY 12, 2015 TABLE OF CONTENTS DISCUSSION OF 2014 & Q4 14 PERFORMANCE Q1 15 FINANCIAL OUTLOOK GAAP TO NON-GAAP RECONCILIATION 2 MANAGEMENT TEAM CHIEF EXECUTIVE OFFICER
Zynga Announces First Quarter 2014 Financial Results
 April 23, 2014 Zynga Announces First Quarter 2014 Financial Results EXCEEDS HIGH END OF Q1 2014 OUTLOOK FOR BOOKINGS AND ADJUSTED EBITDA ACHIEVES SEQUENTIAL GROWTH IN BOOKINGS, ADJUSTED EBITDA, MOBILE
Second Quarter 2017 Financial Highlights:
 Snap Inc. Reports Second Quarter 2017 Results VENICE, Calif. August 10, 2017 Snap Inc. (NYSE: SNAP) today announced financial results for the quarter ended 2017. Second Quarter 2017 Financial Highlights:
Web.com Reports Fourth Quarter and Full Year 2017 Financial Results
 Web.com Reports Fourth Quarter and Full Year 2017 Financial Results Strong financial and operating performance in the fourth quarter Significant progress on strategic priorities for the year Generated
Glu Mobile Inc. Q118 Earnings Call. May 1, 2018
 Glu Mobile Inc. Q118 Earnings Call May 1, 2018 Safe Harbor Statement This presentation contains "forward-looking" statements including those regarding our Q2 2018 and FY 2018 non-gaap guidance and statements
Alphabet Announces Third Quarter 2018 Results
 Alphabet Announces Third Quarter 2018 Results MOUNTAIN VIEW, Calif. October 25, 2018 Alphabet Inc. (NASDAQ: GOOG, GOOGL) today announced financial results for the quarter ended. "Our business continues
Facebook Reports Second Quarter 2018 Results
 Facebook Reports Second Quarter 2018 Results MENLO PARK, Calif. July 25, 2018 Facebook, Inc. (Nasdaq: FB) today reported financial results for the quarter ended 2018. "Our community and business continue
Alphabet Announces First Quarter 2018 Results
 Alphabet Announces First Quarter 2018 Results MOUNTAIN VIEW, Calif. April 23, 2018 Alphabet Inc. (NASDAQ: GOOG, GOOGL) today announced financial results for the quarter ended. "Our ongoing strong revenue
Internap Reports Third Quarter 2016 Financial Results
 Internap Reports Third Quarter 2016 Financial Results Revenue of $74 million, churn down year-over-year and sequentially Including a $78.2 goodwill impairment, GAAP net loss was $(91.3) million, or $(1.75)
Web.com Reports Fourth Quarter and Full Year 2016 Financial Results
 Web.com Group, Inc. 12808 Gran Bay Parkway West Jacksonville, FL 32258 T: (904) 680-6600 F: (904) 880-0350 NASDAQ: WEB Web.com Reports Fourth Quarter and Full Year 2016 Financial Results Solid progress
ITRON, INC. CONSOLIDATED STATEMENTS OF OPERATIONS
 , INC. CONSOLIDATED STATEMENTS OF OPERATIONS (Unaudited, in thousands, except per share data) Revenues $ 489,353 $ 482,175 $ 964,148 $ 929,711 Cost of revenues 326,312 322,587 646,572 630,000 Gross profit
ITRON, INC. CONSOLIDATED STATEMENTS OF OPERATIONS
 , INC. CONSOLIDATED STATEMENTS OF OPERATIONS (Unaudited, in thousands, except per share data) Revenues $ 474,795 $ 447,536 Cost of revenues 320,260 307,413 Gross profit 154,535 140,123 Operating expenses
ITRON, INC. CONSOLIDATED STATEMENTS OF OPERATIONS
 , INC. CONSOLIDATED STATEMENTS OF OPERATIONS (Unaudited, in thousands, except per share data) Revenues $ 571,640 $ 563,691 Cost of revenues 388,535 378,713 Gross profit 183,105 184,978 Operating expenses
ITRON, INC. CONSOLIDATED STATEMENTS OF OPERATIONS
 , INC. CONSOLIDATED STATEMENTS OF OPERATIONS (Unaudited, in thousands, except per share data) Revenues $ 447,536 $ 571,640 Cost of revenues 307,413 388,535 Gross profit 140,123 183,105 Operating expenses
Alphabet Announces Fourth Quarter and Fiscal Year 2018 Results
 Alphabet Announces Fourth Quarter and Fiscal Year 2018 Results MOUNTAIN VIEW, Calif. February 4, 2019 Alphabet Inc. (NASDAQ: GOOG, GOOGL) today announced financial results for the quarter and fiscal year
Change (Unaudited)
") Snap Inc. Reports First Quarter 2018 Results VENICE, Calif. May 1, 2018 Snap Inc. (NYSE: SNAP) today announced financial results for the quarter ended 2018. First Quarter 2018 Financial Highlights: Percent
Snap Inc. Reports First Quarter 2018 Results VENICE, Calif. May 1, 2018 Snap Inc. (NYSE: SNAP) today announced financial results for the quarter ended 2018. First Quarter 2018 Financial Highlights: Percent
ITRON, INC. CONSOLIDATED STATEMENTS OF OPERATIONS
 , INC. CONSOLIDATED STATEMENTS OF OPERATIONS (Unaudited, in thousands, except per share data) Revenues $ 504,063 $ 615,555 $ 1,654,843 $ 1,791,647 Cost of revenues 332,266 438,559 1,103,196 1,237,722 Gross
ELECTRONIC ARTS REPORTS Q4 FY12 AND FY12 FINANCIAL RESULTS
 ELECTRONIC ARTS REPORTS Q4 FY12 AND FY12 FINANCIAL RESULTS All-Time High Non-GAAP Net Revenue of $4.2 Billion in Fiscal 12 Annual Digital Non-GAAP Revenue Up 47% to $1.2 Billion Digital Revenue Driving
ITRON, INC. CONSOLIDATED STATEMENTS OF OPERATIONS
 , INC. CONSOLIDATED STATEMENTS OF OPERATIONS (Unaudited, in thousands, except per share data) Revenues $ 523,335 $ 642,477 $ 2,178,178 $ 2,434,124 Cost of revenues 359,835 449,944 1,463,031 1,687,666 Gross
FAIR ISAAC CORPORATION CONDENSED CONSOLIDATED BALANCE SHEETS (In thousands) (Unaudited)
 (Unaudited)") CONDENSED CONSOLIDATED BALANCE SHEETS (In thousands) June 30, September 30, 2016 2015 ASSETS: Current assets: Cash and cash equivalents $ 118,155 $ 86,120 Accounts receivable, net 155,196 158,773 Prepaid
CONDENSED CONSOLIDATED BALANCE SHEETS (In thousands) June 30, September 30, 2016 2015 ASSETS: Current assets: Cash and cash equivalents $ 118,155 $ 86,120 Accounts receivable, net 155,196 158,773 Prepaid
ITRON, INC. CONSOLIDATED STATEMENTS OF OPERATIONS
 , INC. CONSOLIDATED STATEMENTS OF OPERATIONS (Unaudited, in thousands, except per share data) Revenues $ 470,103 $ 489,353 $ 918,350 $ 964,148 Cost of revenues 351,532 326,312 661,580 646,572 Gross profit
FAIR ISAAC CORPORATION CONDENSED CONSOLIDATED BALANCE SHEETS (In thousands) (Unaudited)
 (Unaudited)") CONDENSED CONSOLIDATED BALANCE SHEETS (In thousands) March 31, September 30, 2016 2015 ASSETS: Current assets: Cash and cash equivalents $ 85,374 $ 86,120 Accounts receivable, net 155,207 158,773 Prepaid
CONDENSED CONSOLIDATED BALANCE SHEETS (In thousands) March 31, September 30, 2016 2015 ASSETS: Current assets: Cash and cash equivalents $ 85,374 $ 86,120 Accounts receivable, net 155,207 158,773 Prepaid
Facebook Reports Fourth Quarter and Full Year 2018 Results. Fourth Quarter and Full Year 2018 Operational and Other Financial Highlights
 Facebook Reports Fourth Quarter and Full Year 2018 Results MENLO PARK, Calif. January 30, 2019 Facebook, Inc. (Nasdaq: FB) today reported financial results for the quarter and full year ended 2018. "Our
FAIR ISAAC CORPORATION CONDENSED CONSOLIDATED BALANCE SHEETS (In thousands) (Unaudited)
 (Unaudited)") CONDENSED CONSOLIDATED BALANCE SHEETS (In thousands) June 30, September 30, 2018 2017 ASSETS: Current assets: Cash and cash equivalents $ 119,929 $ 105,618 Accounts receivable, net 182,419 168,586 Prepaid
CONDENSED CONSOLIDATED BALANCE SHEETS (In thousands) June 30, September 30, 2018 2017 ASSETS: Current assets: Cash and cash equivalents $ 119,929 $ 105,618 Accounts receivable, net 182,419 168,586 Prepaid
FAIR ISAAC CORPORATION CONDENSED CONSOLIDATED BALANCE SHEETS (In thousands) (Unaudited)
 (Unaudited)") CONDENSED CONSOLIDATED BALANCE SHEETS (In thousands) 2018 2017 ASSETS: Current assets: Cash and cash equivalents $ 90,023 $ 105,618 Accounts receivable, net 208,865 168,586 Prepaid expenses and other current
CONDENSED CONSOLIDATED BALANCE SHEETS (In thousands) 2018 2017 ASSETS: Current assets: Cash and cash equivalents $ 90,023 $ 105,618 Accounts receivable, net 208,865 168,586 Prepaid expenses and other current
Itron, Inc. Comparison of Key 2015 Financial Metrics to Preliminary Results Announced February 17, Total operating expenses 486, ,839
 Itron, Inc. Comparison of Key 2015 Financial Metrics to Preliminary Results Announced February 17, 2016 (Unaudited, in thousands, except per share data) (announced Feb. 17, 2016) Preliminary FY 2015 Final
ELECTRONIC ARTS REPORTS Q4 FY16 AND FULL YEAR FY16 FINANCIAL RESULTS
 ELECTRONIC ARTS REPORTS Q4 FY16 AND FULL YEAR FY16 FINANCIAL RESULTS Record Fiscal Year Non-GAAP Net Revenue, Digital Net Revenue, Gross Margin, Operating Margin, EPS and Operating Cash Flow Completed
Snap Inc. Announces Third Quarter 2018 Financial Results
 Snap Inc. Announces Third Quarter 2018 Financial Results Revenue increased 43% to a record $298 million Trailing twelve months revenue increased 53% to $1.1 billion SANTA MONICA, Calif. October 25, 2018
KING DIGITAL ENTERTAINMENT PLC (Exact Name of Registrant as Specified in Its Charter)
") op UNITED STATES SECURITIES AND EXCHANGE COMMISSION Washington, D.C. 20549 Form 6-K REPORT OF FOREIGN PRIVATE ISSUER PURSUANT TO RULE 13a-16 OR 15d-16 UNDER THE SECURITIES EXCHANGE ACT OF 1934 For the
op UNITED STATES SECURITIES AND EXCHANGE COMMISSION Washington, D.C. 20549 Form 6-K REPORT OF FOREIGN PRIVATE ISSUER PURSUANT TO RULE 13a-16 OR 15d-16 UNDER THE SECURITIES EXCHANGE ACT OF 1934 For the
Glu Mobile Inc. Q Earnings Call August 1, 2017
 Glu Mobile Inc. Q2 2017 Earnings Call August 1, 2017 Safe Harbor Statement 2 This presentation contains "forward-looking" statements including: that Glu s strong Q2-2017 demonstrates continued progress
Glu Mobile Inc. Q417 Earnings Call. February 8, 2018
 Glu Mobile Inc. Q417 Earnings Call February 8, 2018 Safe Harbor Statement This presentation contains "forward-looking" statements including those regarding our Q1 2018 and FY 2018 non-gaap guidance and
Facebook Reports Fourth Quarter and Full Year 2017 Results
 NEWS RELEASE Facebook Reports Fourth Quarter and Full Year 2017 Results MENLO PARK, Calif., Jan. 31, 2018 /PRNewswire/ -- Facebook, Inc. (NASDAQ: FB) today reported financial results for the quarter and
Facebook Reports Third Quarter 2018 Results
 Facebook Reports Third Quarter 2018 Results MENLO PARK, Calif. October 30, 2018 Facebook, Inc. (Nasdaq: FB) today reported financial results for the quarter ended 2018. "Our community and business continue
NEWS RELEASE INTERNATIONAL GAME TECHNOLOGY PLC REPORTS FIRST QUARTER 2018 RESULTS
 NEWS RELEASE INTERNATIONAL GAME TECHNOLOGY PLC REPORTS FIRST QUARTER 2018 RESULTS Net loss of $103 million includes $97 million of net foreign exchange loss; Adjusted net income was $31 million Adjusted
One Fix at a Time, One Client at a Time
 One Fix at a Time, One Client at a Time To illustrate the client and stylist interactions during a Fix order, we ve included an example below. 1. Rebecca ordered Fixes on-demand before becoming a Style
j2 Global Reports Fourth Quarter and Year End 2016 Results and Provides 2017 Outlook
 February 9, 2017 j2 Global Reports Fourth Quarter and Year End 2016 Results and Provides 2017 Outlook Achieves Record Annual Revenues GAAP Diluted EPS Provides Fiscal 2017 Financial Estimates Announces
Facebook Reports Fourth Quarter and Full Year 2015 Results
 Facebook Reports Fourth Quarter and Full Year 2015 Results MENLO PARK, Calif. January 27, 2016 Facebook, Inc. (NASDAQ: FB) today reported financial results for the fourth quarter and full year ended 2015.
SNAP INC. (Exact name of Registrant as Specified in Its Charter)
") UNITED STATES SECURITIES AND EXCHANGE COMMISSION WASHINGTON, D.C. 20549 FORM 8-K CURRENT REPORT Pursuant to Section 13 or 15(d) of the Securities Exchange Act of 1934 Date of Report (Date of earliest event
UNITED STATES SECURITIES AND EXCHANGE COMMISSION WASHINGTON, D.C. 20549 FORM 8-K CURRENT REPORT Pursuant to Section 13 or 15(d) of the Securities Exchange Act of 1934 Date of Report (Date of earliest event
ServiceNow, Inc. Condensed Consolidated Statements of Operations (in thousands, except share and per share data) (Unaudited)
 (Unaudited)") Condensed Consolidated Statements of Operations (in thousands, except share and per share data) September 30, 2016 September 30, 2015 September 30, 2016 September 30, 2015 Revenues: Subscription $ 318,934
Condensed Consolidated Statements of Operations (in thousands, except share and per share data) September 30, 2016 September 30, 2015 September 30, 2016 September 30, 2015 Revenues: Subscription $ 318,934
Facebook Reports Third Quarter 2017 Results
 Facebook Reports Third Quarter 2017 Results MENLO PARK, Calif. November 1, 2017 Facebook, Inc. (NASDAQ: FB) today reported financial results for the quarter ended 2017. "Our community continues to grow
Piper Jaffray Companies Reports Third Quarter 2018 Results
 Piper Jaffray Companies Reports Third Quarter 2018 Results MINNEAPOLIS October 26, 2018 Piper Jaffray Companies (NYSE: PJC) today announced its results for the third quarter ended September 30, 2018. "We
Q2 Fiscal 2019 Letter to Shareholders
 Q2 Fiscal 2019 Letter to Shareholders How Data Science is Woven into the Fabric of Stitch Fix To illustrate the pervasiveness of data science and algorithms across our business, here s an example that
Fourth Quarter and Full Year 2017 Operational and Other Financial Highlights
 Facebook Reports Fourth Quarter and Full Year 2017 Results MENLO PARK, Calif. January 2018 Facebook, Inc. (NASDAQ: FB) today reported financial results for the quarter and full year ended 2017. "2017 was
DISCOVERY COMMUNICATIONS REPORTS FULL YEAR AND FOURTH QUARTER 2011 RESULTS
 DISCOVERY COMMUNICATIONS REPORTS FULL YEAR AND FOURTH QUARTER 2011 RESULTS Full Year 2011 Financial Highlights: Revenues increased 12% to $4.235 billion Adjusted OIBDA increased 13% to $1.914 billion Net
Alphabet Announces Fourth Quarter and Fiscal Year 2017 Results
 Alphabet Announces Fourth Quarter and Fiscal Year 2017 Results MOUNTAIN VIEW, Calif. February 1, 2018 Alphabet Inc. (NASDAQ: GOOG, GOOGL) today announced financial results for the quarter and fiscal year
Facebook Reports First Quarter 2013 Results
 Facebook Reports First Quarter 2013 Results MENLO PARK, Calif. May 1, 2013 Facebook, Inc. (NASDAQ: FB) today reported financial results for the first quarter, which ended March 31, 2013. We ve made a lot
Helping Clients Win with Digital
 First Quarter 2018 Earnings Supplement Helping Clients Win with Digital May 7, 2018 2017 Cognizant Forward Looking Statements and Non-GAAP Financial Measures This earnings supplement includes statements
Alphabet Announces First Quarter 2016 Results
 Exhibit 99.1 Alphabet Announces First Quarter 2016 Results MOUNTAIN VIEW, Calif. April 21, 2016 Alphabet Inc. (NASDAQ: GOOG, GOOGL) today announced financial results for the quarter ended. "Our Q1 results
Glu Mobile Inc. Q Earnings Call
 Glu Mobile Inc. Q2 2016 Earnings Call August 2, 2016 Glu Mobile Q2 2016 Earnings Glu Mobile Inc. Proprietary Page 1 Safe Harbor Statement This presentation contains "forward-looking" statements including:
Adjusted EBITDA $ 19,752 $ 19,714 $ 19,109 0% 3% Adjusted EBITDA Margin 25.2% 23.3% 23.8% 190 BPS 140 BPS
 Internap Reports Continued Adjusted EBITDA Margin Expansion and Positive Levered Free Cash Flow Revenue of $78.3 million, down 7% versus the third quarter of 2014 Data center services revenue of $58.6
Three Months Ended September 30, 2015 Revenues $ 16,523 $ 18,675 Increase in revenues year over year 20% 13%
 Exhibit 99.1 Alphabet Announces Third Quarter 2015 Results of Google Revenues of $18.7 billion and revenue growth of 13% year over year; constant currency revenue growth of 21% year over year Substantial
ServiceNow, Inc. Condensed Consolidated Statements of Operations (in thousands, except share and per share data)
") Condensed Consolidated Statements of Operations (in thousands, except share and per share data) December 31, 2015 December 31, 2014 December 31, 2015 December 31, 2014 Revenues: Subscription $ 244,702
Condensed Consolidated Statements of Operations (in thousands, except share and per share data) December 31, 2015 December 31, 2014 December 31, 2015 December 31, 2014 Revenues: Subscription $ 244,702
Reconciliation of Non-GAAP Financial Measures. Adjusted Operating Income Reconciliation
 Reconciliation of Non-GAAP Financial Measures Adjusted Operating Income Reconciliation Adjusted operating income is not a measure of financial performance under generally accepted accounting principles
Identiv Reports Third Quarter 2017 Financial Results
 Identiv Reports Third Quarter 2017 Financial Results FREMONT, Calif., November 9, 2017 Identiv, Inc. (NASDAQ: INVE), a global provider of physical security and secure identification, reported results for
TELENAV, INC. FORM 8-K. (Current report filing) Filed 10/30/14 for the Period Ending 10/30/14
 Filed 10/30/14 for the Period Ending 10/30/14") TELENAV, INC. FORM 8-K (Current report filing) Filed 10/30/14 for the Period Ending 10/30/14 Address 4655 GREAT AMERICA PARKWAY SUITE 300 SANTA CLARA, CA, 95054 Telephone (408) 245-3800 CIK 0001474439
TELENAV, INC. FORM 8-K (Current report filing) Filed 10/30/14 for the Period Ending 10/30/14 Address 4655 GREAT AMERICA PARKWAY SUITE 300 SANTA CLARA, CA, 95054 Telephone (408) 245-3800 CIK 0001474439
Groupon Announces First Quarter 2015 Results
 May 5, 2015 Groupon Announces First Quarter 2015 Results Gross billings of $1.6 billion Revenue of $750.4 million Adjusted EBITDA of $72.4 million GAAP loss per share of $0.02; non-gaap earnings per share
Facebook Reports First Quarter 2014 Results
 April 23, 2014 Facebook Reports First Quarter 2014 Results - Revenue was $2.50 billion, up 72% vs Q1 2013 - Revenue from advertising was $2.27 billion, up 82% vs Q1 2013 - CFO David Ebersman stepping down
The Stars Group Reports Second Quarter 2018 Results
 The Stars Group Reports Second Quarter 2018 Results The Stars Group Inc. (NASDAQ: TSG)(TSX: TSGI) today reported its financial results for the second quarter ended June 30, 2018, updated its full year
Facebook, Inc. (Exact Name of Registrant as Specified in Charter)
") UNITED STATES SECURITIES AND EXCHANGE COMMISSION Washington, D.C. 20549 FORM 8-K CURRENT REPORT PURSUANT TO SECTION 13 or 15(d) OF THE SECURITIES EXCHANGE ACT OF 1934 Date of report (Date of earliest event
UNITED STATES SECURITIES AND EXCHANGE COMMISSION Washington, D.C. 20549 FORM 8-K CURRENT REPORT PURSUANT TO SECTION 13 or 15(d) OF THE SECURITIES EXCHANGE ACT OF 1934 Date of report (Date of earliest event
Inspired Reports Results For The Three-Month Period Ended December 31, 2018
 Inspired Reports Results For The Three-Month Period Ended December 31, 2018 February 11, 2019 NEW YORK, Feb. 11, 2019 /PRNewswire/ -- Total Revenue for the Transitional Period Ended December 31, 2018 of
Q Earnings Slides. August 7, 2018
 Q2 2018 Earnings Slides August 7, 2018 Forward-Looking Statements & Non-GAAP Financial Measures This presentation contains forward-looking statements about us and our industry that involve substantial
Electronic Arts Reports Q2 FY19 Financial Results
 Electronic Arts Reports Q2 FY19 Financial Results REDWOOD CITY, CA October 30, 2018 Electronic Arts Inc. (NASDAQ: EA) today announced preliminary financial results for its second fiscal quarter ended September
SNAP INC. (Exact name of Registrant as Specified in Its Charter)
") UNITED STATES SECURITIES AND EXCHANGE COMMISSION WASHINGTON, D.C. 20549 FORM 8-K CURRENT REPORT Pursuant to Section 13 or 15(d) of the Securities Exchange Act of 1934 Date of Report (Date of earliest event
UNITED STATES SECURITIES AND EXCHANGE COMMISSION WASHINGTON, D.C. 20549 FORM 8-K CURRENT REPORT Pursuant to Section 13 or 15(d) of the Securities Exchange Act of 1934 Date of Report (Date of earliest event
Wix Reports Strong Third Quarter 2016 Results, Exceeding Expectations Leading to Significant Increase in Full Year Outlook
 Wix Reports Strong Third Quarter 2016 Results, Exceeding Expectations Leading to Significant Increase in Full Year Outlook Exceeded High End of Guidance Range with Strong Top-Line Growth and Record Adjusted
Q Earnings Presentation. August 12, 2016
 Q2 2016 Earnings Presentation August 12, 2016 Cautionary Note Regarding Forward Looking Statements This presentation contains forward-looking statements within the meaning of the Private Securities Litigation
Q4 and Full Year 2018 Earnings Slides. February 5, 2019
 Q4 and Full Year 208 Earnings Slides February 5, 209 FORWARD-LOOKING STATEMENTS & NON-GAAP FINANCIAL MEASURES Forward-Looking Statements & Non-GAAP Financial Measures This presentation contains forward-looking
Roku Q Shareholder Letter
 February 21, 2019 Fellow Shareholders, was an excellent year for Roku, with record results and solid progress towards our long-term vision of powering every TV in the world. As more than 3 million U.S.
DISCOVERY COMMUNICATIONS REPORTS SECOND QUARTER 2011 RESULTS AND ANNOUNCES $1 BILLION INCREASE TO SHARE REPURCHASE PROGRAM
 DISCOVERY COMMUNICATIONS REPORTS SECOND QUARTER 2011 RESULTS AND ANNOUNCES $1 BILLION INCREASE TO SHARE REPURCHASE PROGRAM Second Quarter 2011 Financial Highlights: Revenues increased 11% to $1,067 million
Live Nation Entertainment Reports Second Quarter 2017 Financial Results
 August 9, 2017 Live Nation Entertainment Reports Second Quarter 2017 Financial Results LOS ANGELES, Aug. 9, 2017 /PRNewswire/ -- Highlights (year-over-year): Revenue Up 29% for the Quarter to $2.8 Billion
Fourth Quarter 2017 Results. February 8, 2018
 Fourth Quarter 207 Results February 8, 208 Safe Harbor Disclosure Please review our SEC filings on Form 0-K and Form 0-Q The statements contained herein that are not historical facts are forward-looking
The Stars Group Reports First Quarter 2018 Results
 The Stars Group Reports First Quarter 2018 Results The Stars Group Inc. (NASDAQ: TSG; TSX: TSGI) today reported its financial results for the first quarter ended March 31, 2018 and provided certain additional
QuinStreet Reports Q1 Financial Results and Corporate Restructuring
 November 9, 2016 QuinStreet Reports Q1 Financial Results and Corporate Restructuring Company Announces Stock Repurchase Program FOSTER CITY, Calif., Nov. 09, 2016 (GLOBE NEWSWIRE) -- QuinStreet, Inc. (Nasdaq:QNST),
Piper Jaffray Companies Reports Fourth Quarter and Full Year 2018 Results
 Piper Jaffray Companies Reports Fourth Quarter and Full Year Results MINNEAPOLIS February 1, 2019 Piper Jaffray Companies (NYSE: PJC) today announced its results for the fourth quarter ended December 31,.
NEWS RELEASE INTERNATIONAL GAME TECHNOLOGY PLC REPORTS SECOND QUARTER 2015 RESULTS
 NEWS RELEASE INTERNATIONAL GAME TECHNOLOGY PLC REPORTS SECOND QUARTER 2015 RESULTS Adjusted EBITDA of $427 million and adjusted earnings per share of $0.35; GAAP earnings per share of ($0.59) Pro forma
SEPTEMBER 17, 2018 SKY BETTING & GAMING UPDATE
 SEPTEMBER 17, 2018 SKY BETTING & GAMING UPDATE CAUTIONARY NOTE REGARDING FORWARD LOOKING STATEMENTS This presentation contains forward-looking statements and information within the meaning of the Private
NEWS RELEASE INTERNATIONAL GAME TECHNOLOGY PLC REPORTS THIRD QUARTER 2016 RESULTS
 NEWS RELEASE INTERNATIONAL GAME TECHNOLOGY PLC REPORTS THIRD QUARTER 2016 RESULTS Revenues up 5% to $1,266 million on strong lottery growth and higher gaming product sales U.S. GAAP Net loss was $2 million;
Adobe Reports Record Quarterly and Annual Revenue
 Investor Relations Contact Mike Saviage Adobe 408-536-4416 ir@adobe.com Public Relations Contact Dan Berthiaume Adobe 408-536-2584 dberthia@adobe.com FOR IMMEDIATE RELEASE Adobe Reports Record Quarterly
ServiceNow, Inc. Condensed Consolidated Statements of Operations (in thousands, except share and per share data) (unaudited)
 (unaudited)") Condensed Consolidated Statements of Operations (in thousands, except share and per share data) Revenues: Subscription $ 166,751 $ 104,878 $ 567,217 $ 349,804 Professional services and other 31,253 20,352
Condensed Consolidated Statements of Operations (in thousands, except share and per share data) Revenues: Subscription $ 166,751 $ 104,878 $ 567,217 $ 349,804 Professional services and other 31,253 20,352
ELECTRONIC ARTS REPORTS Q1 FY14 FINANCIAL RESULTS
 ELECTRONIC ARTS REPORTS Q1 FY14 FINANCIAL RESULTS Q1 Non-GAAP Net Revenue and EPS Results Exceed Guidance Q1 Non-GAAP Digital Net Revenue Up 17% Versus Prior Year EA Signs Publishing Agreement with TenCent
NEWS RELEASE INTERNATIONAL GAME TECHNOLOGY PLC REPORTS SECOND QUARTER 2016 RESULTS
 NEWS RELEASE INTERNATIONAL GAME TECHNOLOGY PLC REPORTS SECOND QUARTER 2016 RESULTS Net income of $73 million; adjusted Net income of $87 million Adjusted EBITDA rose 4% to $443 million on strong service
DISCOVERY COMMUNICATIONS REPORTS FIRST QUARTER 2015 RESULTS
 DISCOVERY COMMUNICATIONS REPORTS FIRST QUARTER 2015 RESULTS First Quarter 2015 Financial Highlights: Revenues increased 9% to $1,537 million Adjusted OIBDA increased 8% to $568 million Adjusted Earnings
February 1, Fellow Stockholders,
 February 1, 2018 Fellow Stockholders, Our second quarter demonstrated once again solid execution and momentum as we delivered strong billings growth while continuing to expand our partnerships with key
Electronic Arts Reports Q3 FY18 Financial Results
 January 30, 2018 Electronic Arts Reports Financial Results REDWOOD CITY, Calif.--(BUSINESS WIRE)-- Electronic Arts Inc. (NASDAQ: EA) today announced preliminary financial results for its third fiscal quarter