Claymore Presentation. Som Seif President & CEO Claymore Investments, Inc.
|
|
|
- Marjorie Kelley
- 5 years ago
- Views:
Transcription

1 Claymore Presentation Som Seif President & CEO Claymore Investments, Inc.
2 Claymore ETFs: Intelligent ETFs for Canada Claymore Investments (Canada) is a subsidiary of Claymore Group (US) Designed for Canadian investors 25 ETFs on the TSX, and 33 ETFs in US Total Firm - $15.5 Billion in total assets $4.5 billion in Canada (4 yrs in business) Why we are different Family of intelligent Exchange Traded Funds ( ETFs ) Institutional managers & research firms Research & intelligence behind every product Low Cost Focus on Performance and Risk Management 2
3 33
4 Canada ETF AUM Growth Claymore ETFs AUM by Month (Since Inception) $4,000,000,000 Total Canadian ETFs $3,500,000,000 $3,000,000,000 $2,500,000,000 $2,000,000,000 $1,500,000,000 $1,000,000,000 $500,000,000 $ 4 Sep 06 Oct 06 Nov 06 Dec 06 Jan 07 Feb 07 Mar 07 Apr 07 May 07 Jun 07 Jul 07 Aug 07 Sep 07 Oct 07 Nov 07 Dec 07 Jan 08 Feb 08 Mar 08 Apr 08 May 08 Jun 08 Jul 08 Aug 08 Sep 08 Oct 08 Nov 08 Dec 08 Jan 09 Feb 09 Mar 09 Apr 09 May 09 Jun 09 Jul 09 Aug 09 Sep 09 Oct 09 Nov 09 Dec 09 Current
5 Claymore Investments AUM Growth $5,000,000 $4,500,000 Claymore Investments AUM $4,400,000 $4,500,000 $4,000,000 $3,500,000 $3,000,000 $2,500,000 $2,000,000 $1,500,000 $1,100,000 $1,000,000 $800,000 $500,000 $400,000 $500,000 $ Dec 05 Dec 06 Dec 07 Dec 08 Dec 09 Current 5
6 Canada ETFs AUM Growth $4,000 AUM & Shares O/S Nov 09 $3,500 $3,000 $2,500 $2,000 $1,500 $1,000 $500 $0 6 Dec 09 Oct 09 Nov 09 AUM (milions) # of shares o/s (millions) Dec 09 Oct 09 Nov 09 AUM Shares Dec 07 Jan 08 Feb 08 Mar 08 Apr 08 May 08 Jun 08 Jul 08 Aug 08 Sep 08 Oct 08 Nov 08 Dec 08 Jan 09 Feb 09 Mar 09 Apr 09 May 09 Jun 09 Jul 09 Aug 09 Sep 09 AUM vs AUM/share vs S&P/TSX Composite vs S&P 500 $3,600 $3,400 $3,200 $3,000 $2,800 $2,600 $2,400 $2,200 $2,000 $1,800 $1,600 $1,400 $1,200 $1,000 $800 $600 $400 $200 $0 AUM (milions) Markets AUM S&P/TSX Composite S&P500 USD AUM/share Dec 07 Jan 08 Feb 08 Mar 08 Apr 08 May 08 Jun 08 Jul 08 Aug 08 Sep 08 Oct 08 Nov 08 Dec 08 Jan 09 Feb 09 Mar 09 Apr 09 May 09 Jun 09 Jul 09 Aug 09 Sep 09
7 11/30/2009 Canada ETFs Weekly Trading Volumes Claymore ETFs Trading Volume $250,000,000 $225,000,000 $200,000,000 $175,000,000 $150,000,000 $125,000,000 $100,000,000 $75,000,000 $50,000,000 $25,000,000 $0 7 9/30/2009 7/30/2009 Total Weekly Volume 3 Month Average Volume 3/30/2007 5/30/2007 7/30/2007 9/30/ /30/2007 1/30/2008 3/30/2008 5/30/2008 7/30/2008 9/30/ /30/2008 1/30/2009 3/30/2009 5/30/2009
8 Canada ETF Net Sales Claymore ETF Net Sales by Month $300,000,000 Total Institutional Class Total ETFs $250,000,000 $200,000,000 $150,000,000 $100,000,000 $50,000,000 $ 8 Sep 06 Oct 06 Nov 06 Dec 06 Jan 07 Feb 07 Mar 07 Apr 07 May 07 Jun 07 Jul 07 Aug 07 Sep 07 Oct 07 Nov 07 Dec 07 Jan 08 Feb 08 Mar 08 Apr 08 May 08 Jun 08 Jul 08 Aug 08 Sep 08 Oct 08 Nov 08 Dec 08 Jan 09 Feb 09 Mar 09 Apr 09 May 09 Jun 09 Jul 09 Aug 09 Sep 09 Oct 09 Nov 09 Dec 09
9 Canada ETF breakdown Asset class breakdown Geographical breakdown Commodity 27.3% Large Cap Canadian Equity 15.2% Corporate Bonds 12.2% Emerging Markets Equity 11.3% Government Bonds 9.2% CDN Preferred Shares 8.5% US Equity 8.1% International Equity 5.5% Money Market 1.6% Real Estate 0.7% High Yield Bonds 0.3% Canada Emerging Markets US Asia Developed Europe UK 38.10% 27.78% 17.49% 7.15% 7.12% 2.37% 0% 40% 60% 80% 100% 9
10 Canada ETF Assets by Fund (as of Jan 15/10) ETF Name Ticker AUM % RAFI Claymore Canadian Fundamental Index ETF CRQ $150,358, % Claymore International Fundamental ETF CIE $112,569, % Claymore US Fundamental Index ETF CLU $108,791, % Claymore Japan Fundamental Index ETF C$ Hedged CJP $25,441, % Claymore Emerging Markets Fundamental Index Fund $28,566, % Emerging Markets Equity Claymore BRIC ETF CBQ $346,950, % Claymore Broad Emerging Markets ETF CWO $52,633, % Income Claymore Canadian Financial Monthly Income ETF FIE.A $142,458, % Claymore S&P/TSX Canadian Dividend ETF CDZ $179,580, % Claymore Global Monthly Advantaged Dividend ETF CYH $67,517, % Sector Equity Claymore Global Agriculture ETF COW $275,062, % Claymore S&P Global Water ETF CWW $39,683, % Claymore Equal Weight Banc & Lifeco ETF CEW $94,449, % Claymore S&P/TSX Global Mining ETF CMW $64,682, % Claymore Oil Sands Sector ETF CLO $40,597, % Claymore Global Real Estate ETF CGR $31,131, % Claymore Global Infrastructure ETF CIF $29,364, % Commodity Claymore Natural Gas Commodity ETF GAS $293,003, % Wrap Portfolios Claymore Balanced Income CorePortfolio TM ETF CBD $22,765, % Claymore Balanced Growth CorePortfolio TM ETF CBN $15,553, % Fixed Income Claymore S&P/TSX CDN Preferred Share ET CPD $379,853, % Claymore 1-5 Yr Laddered Government Bond ETF CLF $395,282, % Claymore 1-5 Yr Laddered Corporate Bond ETF CBO $534,532, % Claymore Advantaged Canadian Bond ETF CAB $32,218, % Claymore Advantaged High Yield Bond ETF CHB $14,841, % Money Market Claymore Premium Money Market ETF CMR $72,503, % $3,550,392,252 10
11 YTD Net Creations $2,500 $2,000 Claymore ishares Claymore vs ishares $2,028 $1,856 $1,500 $1,366 $1,000 $500 $0 $770 $717 $1,014 $325 $243 $129 $135 $175 $209 $241 $205 $241 $223 $225 $144 $77 $94 $124 $199 $74 $64 $43 $116 $31 $36 $43 $57 $54 $77 $93 $121 $876 $629 $595 $751 $500 $349 $214 $146 $401 $253 $1,000 $738 Q1 Apr 08 May 08 Jun 08 Jul 08 Aug 08 Sep 08 Oct 08 Nov 08 Dec 08 Jan 09 Feb 09 Mar 09 Apr 09 May 09 Jun 09 Jul 09 Aug 09 Sep 09 Oct 09 Sales $ millions Nov 09 Dec 09 $5,500 $5,000 $5, Creations ($ millions) $4,500 $4,000 $3,500 $3,000 $2,500 $2,000 $2,039 $1,500 $1,000 $921 $500 $ $164 ishares Claymore HBP BMO 11
12 Claymore vs. Mutual Funds $600 Claymore Top Mutual Fund Companies Average Claymore vs Top Mutual Fund Companies* Sales $ millions $400 $200 $0 $200 $321 $145 $134 $99 $116 $108 $83 $86 $66 $80 $82 $82 $49 $48 $34 $22 $14 $82 $244 $244 $193 $206 $176 $185 $196 $181 $184 $107 $122 $151 $151 $148 $148 $159 $136 $139 $55 $66 $65 $91 $38 $35 $12 $28 $52 $120 $146 $400 $397 $600 Jan 08 Feb 08 Mar 08 Apr 08 May 08 Jun 08 Jul 08 Aug 08 Sep 08 Oct 08 Nov 08 Dec 08 Jan 09 Feb 09 Mar 09 Apr 09 May 09 Jun 09 Jul 09 Aug 09 Sep 09 Oct 09 Nov 09 Dec 09 *Top mutual fund companies include: RBC, BMO, TD, CI Financial, AGF, Fidelity and Dynamic Funds; 12
13 Overview of ETFs and Recent Trends 13
14 ETFs are a Global Phenomenon Market has grown to over US $800B. in assets (over 1600 ETFs) Forecast to hit $2 trillion by 2011 (Morgan Stanley) Products listed in US, Europe, Japan, Canada, Hong Kong, Mexico, Australia, Middle East, India 100+ ETFs now listed on TSX (more to come) ~$35 Billion in AUM Cover full market (equity, fixed income, commodity) 4 providers (ishares, Claymore, HBP, BMO) 14
15 Worldwide ETF Growth Assets USD Billions $2,500 Worldwide ETF Growth # ETFs 2,000 1,800 $2,000 1,600 1,400 $1,500 1,200 1,000 $1, $ $ Q F 2011-F Assets USD Billions $0.8 $1.1 $2.3 $5.3 $8.2 $17.6 $39.6 $74.3 $104.8 $141.6 $212.0 $309.8 $412.1 $565.6 $796.7 $711.0 $933.5 $1,000 $2,000 # ETFs ,171 1,592 1,819 0 Source: Barclays Global Investors, Bloomberg 15
16 Mutual Fund Monthly Net Sales Canadian Mutual Fund Monthly Net Sales ($ billions) Jan Feb Mar Apr May Jun Jul Aug Sep Oct Nov Dec Jan Feb Mar Apr May Jun Jul Aug Sep Oct Nov Dec Jan Feb Mar Apr May Jun Jul Aug Sep Oct Nov Dec Jan Feb Mar Apr May Jun Jul Aug Sep Oct Nov Dec 16
17 Mutual Fund vs ETF Sales Canadian ETF vs Mutual Fund Net Sales for 2008/9 ($ billions) ETFs Mutual Funds Jan Feb Mar Apr May Jun Jul Aug Sep Oct Nov Dec Jan Feb Mar Apr May Jun Jul Aug Sep Oct Nov Dec 17
18 Who s Using ETFs? Originally Institutional product, but retail is where major growth coming ~80% of trading is institutional ~60% of inflows are retail Three main institutional users of ETFs: Pension Funds asset allocation tool, overlay ETF on top of their underlying equity portfolios., replacement/compliment to managers Money Managers use ETFs to equitize cash flows from inflows and redemptions, leveraged/short ETFs. Hedge Funds/Prop Traders - use ETFs to immunize the single security and sector risks embedded in their bets, leveraged/inverse ETFs. 18
19 ETFs Represent a Significant Portion of all Equity Trading: U.S. Percent of ETF Trading of Total Equity Trading 50% 45% 40% 35% 38% 45% 30% 25% 25% 15% 10% 5% 14% 17% 0% YTD US Listed Equities Symbol Average Daily Volume USD$ SPDR S&P 500 ETF SPY $ 24,638,912,000 Powershares QQQ Trust QQQQ $ 4,542,191,000 ishares Russell 2000 Index Fund IWM $ 2,815,981,000 Apple Inc. AAPL $ 2,523,536,000 Financial Select Sector SPDR XLF $ 1,922,946,000 19
20 ETFs Represent a Growing Portion of all Equity Trading: Canada Percent of ETF Trading of Total Equity Trading 15% 15% 10% 8% 5% 2% 3% 5% 0% YTD Canadian Listed Equities Symbol Average Daily Volume CAD$ (2009YTD) ishares CDN S&P/TSX 60 Index Fund XIU $ 279,382,894 Royal Bank of Canada RY $ 235,032,665 Barrick Gold ABX $ 182,754,633 Toronto Dominion Bank TD $ 181,475,396 Potash Corp of Saskatchewan POT $ 175,656,752 20
21 Why Is This Happening? Overall flexibility of ETFs as a Multi-Tool Mutual Funds failed to deliver results Avoidance of single stock risk Tax loss selling Focus on transparency 21
22 Benefits of ETFs Low Cost Tax Efficiency low turnover, in-kind creations Transparency daily holdings Diversification portfolio holdings Flexibility trade intraday, long/short/stop loss/margin/bulk Liquidity unlimited liquidity of portfolio Simple to Use 22
23 Product Cost Matters Asset Class Active Mutual Fund (F-Class) ETF Annual MER Savings Canadian Bonds 0.80% 0.15% % 50-80% Canadian Equity 1.30% % 50-85% U.S. Equity 1.30% 0.30% % 50-75% International Equity 1.50%+ 0.50% % 55-65% Wrap Funds 1.50% % 45-55% 23
24 It s Hard to Consistently Beat the Markets 5 years ending Q Fund Category # of Managers Underperforming Benchmarks over past 5 years # of Managers Outperforming Benchmarks over past 5 years Claymore ETF Canadian Equity 92% 7.6% CRQ Canadian Dividend & Income Equity 100% 0% CDZ U.S. Equity 89% 10.6% CLU (C$ hedged) CLU.C (un-hedged) International Equity 93% 8.1% CIE Source: Standard & Poor s SPIVA Canada Scorecard Mid Year - June 30,
25 Popular Investment Strategies Using ETFs 25
26 Portfolio Strategies using ETFs Core/Satellite Fund or Stock Complement or Replacement Hedging/Listed Options Tax Loss Harvesting Cash Equitization Portfolio Transition Foreign Diversification Strategic and Tactical Asset Allocation 26
27 Asset Allocation as a Portfolio Driver Numerous studies done to determine how much of a multiple asset class portfolio s return due to asset allocation vs. other factors Results show that asset allocation decision is single most important factor in multiple asset portfolio Percentage of Return Explained by Asset Allocation Brinson (1986) Brinson (1991) Ibbotson Mutual Ibbotson Pension Asset Allocation 93.6% 91.5% 81.4% 88.0% Active Return 1.1% 0.08% 0.27% 0.44% 27
28 Efficient Portfolio Development 7 Asset Class Portfolio Construction (Jan 1990 December 2009) PORTFOLIO 1 Canadian Equity Canadian Bonds Global Equity Global Bonds Emerging Equity Real Estate Commodities 50% 50% ASSET CLASS PORTFOLIO 1 Canadian Equity 50% Canadian Bonds Global Equity 50% Global Bonds Emerging Equity Real Estate Commodities TOTAL 100% PERFORMANCE Returns (annualized) 7.27% RISK Standard deviation (annualized) 13.39% RISK ADJUSTED PERFORMANCE Return/Risk ratio 0.54 Maximum Monthly Drawdown % 28
29 Efficient Portfolio Development 7 Asset Class Portfolio Construction (Jan 1990 December 2009) PORTFOLIO 1 PORTFOLIO 2 Canadian Equity Canadian Bonds Global Equity Global Bonds Emerging Equity Real Estate Commodities 50% 50% 30% 30% ASSET CLASS PORTFOLIO 1 PORTFOLIO 2 Canadian Equity 50% 30% Canadian Bonds Global Equity 50% 30% Global Bonds Emerging Equity Real Estate Commodities TOTAL 100% 100% PERFORMANCE Returns (annualized) 7.27% 7.96% RISK Standard deviation (annualized) 13.39% 8.26% RISK ADJUSTED PERFORMANCE Return/Risk ratio Maximum Monthly Drawdown % -8.59% 29
30 Efficient Portfolio Development 7 Asset Class Portfolio Construction (Jan 1990 December 2009) PORTFOLIO 1 PORTFOLIO 2 PORTFOLIO 3 Canadian Equity Canadian Bonds Global Equity Global Bonds Emerging Equity Real Estate Commodities 50% 50% 30% 30% 30% 10% ASSET CLASS PORTFOLIO 1 PORTFOLIO 2 PORTFOLIO 3 Canadian Equity 50% 30% 30% Canadian Bonds Global Equity 50% 30% Global Bonds Emerging Equity 10% Real Estate Commodities TOTAL 100% 100% 100% PERFORMANCE Returns (annualized) 7.27% 7.96% 8.60% RISK Standard deviation (annualized) 13.39% 8.26% 8.65% RISK ADJUSTED PERFORMANCE Return/Risk ratio Maximum Monthly Drawdown % -8.59% -9.37% 30
31 Efficient Portfolio Development 7 Asset Class Portfolio Construction (Jan 1990 December 2009) PORTFOLIO 1 PORTFOLIO 2 PORTFOLIO 3 PORTFOLIO 4 Canadian Equity Canadian Bonds Global Equity Global Bonds Emerging Equity Real Estate Commodities 50% 50% 30% 30% 30% 10% 15% 25% 10% 10% ASSET CLASS PORTFOLIO 1 PORTFOLIO 2 PORTFOLIO 3 PORTFOLIO 4 Canadian Equity 50% 30% 30% 25% Canadian Bonds Global Equity 50% 30% 15% Global Bonds Emerging Equity 10% 10% Real Estate 10% Commodities TOTAL 100% 100% 100% 100% PERFORMANCE Returns (annualized) 7.27% 7.96% 8.60% 8.73% RISK Standard deviation (annualized) 13.39% 8.26% 8.65% 8.14% RISK ADJUSTED PERFORMANCE Return/Risk ratio Maximum Monthly Drawdown % -8.59% -9.37% -8.45% 31
32 Efficient Portfolio Development 7 Asset Class Portfolio Construction (Jan 1990 December 2009) PORTFOLIO 1 PORTFOLIO 2 PORTFOLIO 3 PORTFOLIO 4 PORTFOLIO 5 Canadian Equity Canadian Bonds Global Equity Global Bonds Emerging Equity Real Estate Commodities 50% 50% 30% 30% 30% 10% 15% 25% 10% 10% 15% 10% 7.5% 7.5% ASSET CLASS PORTFOLIO 1 PORTFOLIO 2 PORTFOLIO 3 PORTFOLIO 4 PORTFOLIO 5 Canadian Equity 50% 30% 30% 25% Canadian Bonds Global Equity 50% 30% 15% 15% Global Bonds Emerging Equity 10% 10% 7.5% Real Estate 10% 7.5% Commodities 10% TOTAL 100% 100% 100% 100% 100% PERFORMANCE Returns (annualized) 7.27% 7.96% 8.60% 8.73% 8.40% RISK Standard deviation (annualized) 13.39% 8.26% 8.65% 8.14% 7.36% RISK ADJUSTED PERFORMANCE Return/Risk ratio Maximum Monthly Drawdown % -8.59% -9.37% -8.45% -8.27% 32
33 What if We Used RAFI Instead of Market Cap? RAFI adds significant value by improving return, but more importantly reducing risk Using Market Cap Using RAFI RAFI Benefit Return 8.40% 10.55% 2.15% Standard Deviation 7.37% 6.97% 0.40% Risk Adjusted Return Max Drawdown (Mos) 8.27% 7.00% 1.27% 33
34 Correlations ( ) Canadian Equity Canadian Bonds Global Equity Global Bonds Emerging Markets Global Real Estate Commodities Canadian Equity 1 Canadian Bonds Global Equity Global Bonds Emerging Equity Global Real Estate Commodities
35 But Broadly, Correlations are Still Low Correlations across multiple asset classes remain low Average Correlation Across Asset Classes as of December 31, Month 24 Month 12 Month Dec 92 Dec 93 Dec 94 Dec 95 Dec 96 Dec 97 Dec 98 Dec 99 Dec 00 Dec 01 Dec 02 Dec 03 Dec 04 Dec 05 Dec 06 Dec 07 Dec 08 Dec 09 35
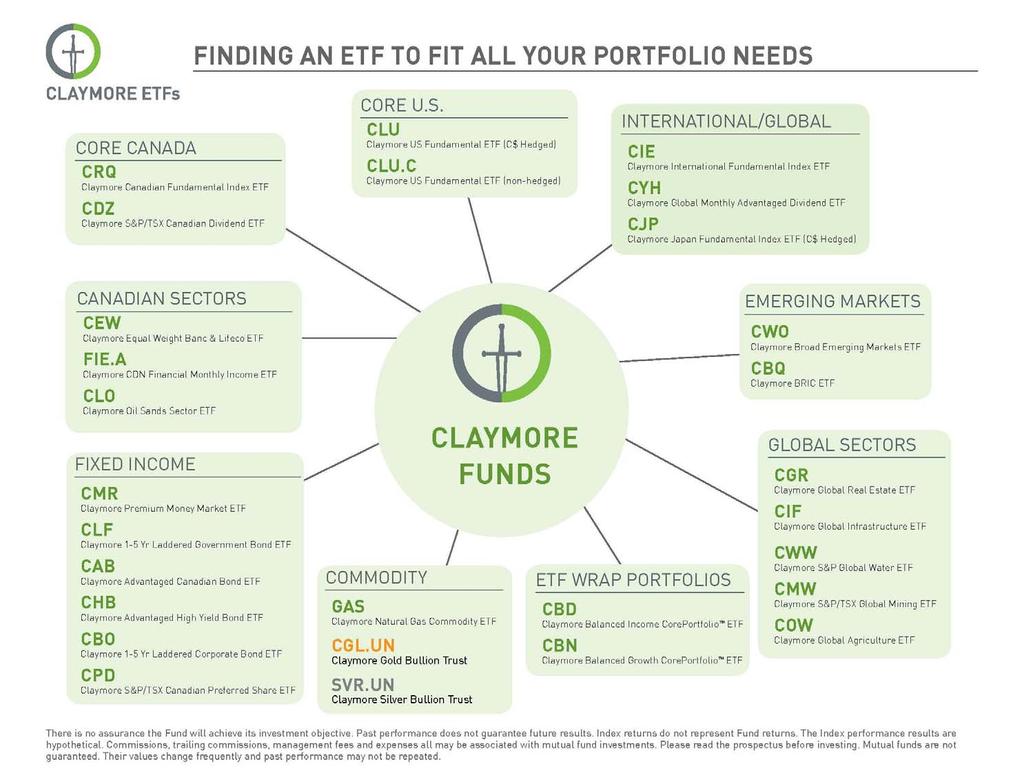
36 Exciting Lineup of Claymore ETFs RAFI FUNDAMENTAL INDEXES Core Canada CRQ Claymore Canadian Fundamental Index ETF Core US CLU Claymore US Fundamental Index ETF - C$ Hedged Core US CLU.C Claymore US Fundamental Index ETF Non-hedged Core International CIE Claymore International Fundamental Index ETF Core Japan CJP Claymore Japan Fundamental Index ETF - C$ Hedged SECTOR / STRATEGY Energy CLO Claymore Oil Sands Sector ETF Global Equity CWW Claymore S&P Global Water ETF Global Equity CMW Claymore S&P/TSX Global Mining ETF Global Equity COW Claymore Global Agriculture ETF Canadian Equity CEW Claymore Equal Weight Banc & Lifeco ETF Global Equity CGR Claymore Global Real Estate ETF Global Equity CIF Claymore Global Infrastructure ETF INTERNATIONAL GROWTH Emerging Markets CBQ Claymore BRIC ETF Emerging Markets CWO Claymore Broad Emerging Markets ETF C$ Hedged 36
37 Exciting Lineup of Claymore ETFs GROWTH & MONTHLY INCOME Large Value CDZ Claymore S&P/TSX Canadian Dividend ETF Global Equity CYH Claymore Global Monthly Advantaged Dividend ETF Canadian Balanced FIE.A Claymore Canadian Financial Monthly Income ETF INCOME / FIXED INCOME Preferred Income CPD Claymore S&P/TSX CDN Preferred Share ETF Fixed Income CLF Claymore 1-5 Yr Laddered Government Bond ETF Fixed Income CBO Claymore 1-5 Yr Laddered Corporate Bond ETF Fixed Income CAB Claymore Advantaged Canadian Bond ETF Fixed Income CHB Claymore Advantaged High Yield Bond ETF Income CMR Claymore Premium Money Market ETF ETF WRAP PROGRAM - CLAYMORE COREPORTFOLIOS SERIES Income CBD Claymore Balanced Income CorePortfolio TM ETF Growth CBN Claymore Balanced Growth CorePortfolio TM ETF COMMODITY Energy GAS Claymore Natural Gas Commodity ETF 37
38 Fundamental versus Market Cap Performance Ticker YTD 3 Month 6 Month 1 Year 3 Year Claymore Canadian Fundamental Index ETF ishares Canadian S&P/TSX 60 Index CRQ 44.28% 2.85% 15.95% 44.28% 1.98% XIU 31.50% 2.52% 11.42% 31.50% 0.18% Difference 12.78% 0.33% 4.53% 12.78% 1.79% Claymore US Fundamental Index ETF ishares Canadian S&P 500 Hedged to CAD Index CLU XSP 28.52% 0.13% 24.55% 28.52% % 22.95% 5.69% 21.27% 22.95% -8.85% Difference 5.57% -5.56% 3.28% 5.57% -1.63% Claymore International Fundamental Index ETF ishares 100% Hedged to CAD Dollars Index Fund CIE XIN 15.59% -4.24% 12.13% 15.59% n/a 18.11% 2.68% 17.42% 18.11% % Difference -2.52% -6.92% -5.29% -2.52% n/a Total Returns, As of 12/31/
39 Fundamental versus Market Cap Performance Claymore Canadian Fundamental Index ETF Ticker YTD 3 Month 6 Month 1 Year 3 Year CRQ 44.28% 2.85% 15.95% 44.28% 1.98% ishares Canadian S&P/TSX 60 Index XIU 31.50% 2.52% 11.42% 31.50% 0.18% Difference 12.78% 0.33% 4.53% 12.78% 1.79% Claymore US Fundamental Index ETF ishares Canadian S&P 500 Hedged to CAD Index CLU XSP 28.52% 0.13% 24.55% 28.52% % 22.95% 5.69% 21.27% 22.95% -8.85% Difference 5.57% -5.56% 3.28% 5.57% -1.63% Claymore International Fundamental Index ETF ishares 100% Hedged to CAD Dollars Index Fund CIE XIN 15.59% -4.24% 12.13% 15.59% n/a 18.11% 2.68% 17.42% 18.11% % Difference -2.52% -6.92% -5.29% -2.52% n/a ishares MSCI EAFE Index Fund ($ CAD) EFA US 9.01% -0.18% 9.67% 9.01% n/a Difference 6.58% -4.06% 2.46% 6.58% n/a Total Returns in $CAD; as of 12/31/
40 Questions? Claymore Investments Inc., Web: Tel: or
The Evolution of Index and ETF Strategies: Going beyond Passive vs. Active
 0.75 CE Credits The Evolution of Index and ETF Strategies: Going beyond Passive vs. Active FOR ADVISOR USE ONLY Agenda Evolution of indexing Market Capitalization Indexing Equal Weighted Indexing Fundamental
No securities regulatory authority has expressed an opinion about these securities and it is an offence to claim otherwise.
 No securities regulatory authority has expressed an opinion about these securities and it is an offence to claim otherwise. PROSPECTUS Continuous Offering June 3, 2016 This prospectus qualifies the distribution
BlackRock Canada Announces Estimated December Cash Distributions for the ishares ETFs
 Contact for Media: Peter McKillop T 212-810-3737 Email: Peter.McKillop@blackrock.com Listing: Symbol: Listing: Symbol: TSX (Toronto Stock Exchange) CBD/XBAL 1, CBH, CBN/XGRO 2, CBO, CDZ, CEW, CGL, CGL.C,
Cash Distribution Per Unit ($) ishares Balanced Income CorePortfolio TM Index ETF CBD 0.059
 ishares Balanced Income CorePortfolio TM Index ETF CBD 0.059") Contact for Media: Julia Koene T 416-643-4010 Email: Julia.Koene@blackrock.com Listing: Symbol: Listing: Symbol: TSX (Toronto Stock Exchange) CBD, CBH, CBN, CBO, CDZ, CEW, CGR, CHB, CIF, CLF, CLG, CMR,
Contact for Media: Julia Koene T 416-643-4010 Email: Julia.Koene@blackrock.com Listing: Symbol: Listing: Symbol: TSX (Toronto Stock Exchange) CBD, CBH, CBN, CBO, CDZ, CEW, CGR, CHB, CIF, CLF, CLG, CMR,
Market Update: Broad Market Returns and Indicators
 Market Update Eckler Ltd. collects information directly from sources believed to be reliable. Eckler Ltd. does not guarantee or warrant the accuracy, timeliness, or completeness of the information either
CIE, CIE.A, CJP, CJP.A, CLU, CLU.A, CLU.B, CLU.C, CRQ, CRQ.A, CWO, CWO.A
 Contact for Media: Julia Koene T 416-643-4010 Email: Julia.Koene@blackrock.com Listing: Symbol: Listing: Symbol: TSX (Toronto Stock Exchange) CBD, CBD.A, CBH, CBH.A, CBN, CBN.A, CBO, CBO.A, CDZ, CDZ.A,
CIE, CIE.A, CJP, CJP.A, CLU, CLU.A, CLU.B, CLU.C, CRQ, CRQ.A, CWO, CWO.A
 Contact for Media: Julia Koene T 416-643-4010 Email: Julia.Koene@blackrock.com Listing: Symbol: Listing: Symbol: TSX (Toronto Stock Exchange) CBD, CBD.A, CBH, CBH.A, CBN, CBN.A, CBO, CBO.A, CDZ, CDZ.A,
CBD, CBD.A, CBH, CBH.A, CBN, CBN.A, CBO, CBO.A, CDZ, CDZ.A, CEW, CEW.A, CHB, CHB.A, CLF, CLF.A, CLG, CLG.A, CMR, CMR.A, CPD, CPD.
 Contact for Media: Maeve Hannigan T 416-643-4058 Email: Maeve.Hannigan@blackrock.com Listing: Symbol: TSX (Toronto Stock Exchange) CBD, CBD.A, CBH, CBH.A, CBN, CBN.A, CBO, CBO.A, CDZ, CDZ.A, CEW, CEW.A,
Endowment Funds Performance (Year ending March 31 st, 2013)
") Endowment Funds Performance (Year ending March 31 st, 2013) Investment Management Committee Meeting May 16 th, 2013 (Note: all returns and values are expressed in Canadian Dollars- CAD s) 1 Total Endowment
Endowment Funds Performance (Year ending March 31 st, 2013) Investment Management Committee Meeting May 16 th, 2013 (Note: all returns and values are expressed in Canadian Dollars- CAD s) 1 Total Endowment
Market Update: Broad Market Returns and Indicators
 Market Update Eckler Ltd. collects information directly from sources believed to be reliable. Eckler Ltd. does not guarantee or warrant the accuracy, timeliness, or completeness of the information either
BMO Exchange Traded Funds
 BMO Exchange Traded Funds June 2012 Alfred Lee, CFA, CMT, DMS Vice President & Investment Strategist BMO BMO Global Asset Management Agenda The Growing ETF Landscape Institutional Usage of ETFs Mechanics
ETF portfolio review, 30th September ETF portfolios with ESG overlay. market overview. portfolio performance
 ETF portfolio review, 30th September 2017 market overview All our ETF portfolios performed better than s in September and all portfolios bar fixed-income continued to add to their gains year-to-date. Our
IXG ishares Global Financials ETF
 ishares Global Financials ETF ETF.com segment: Equity: Global Financials Competing ETFs: DFNL Related ETF Channels: Broad-based, Vanilla, Global, Equity, Financials, Sectors Find more ETFs with our ETF
U.S. ETP MONTHLY FLASH
 U.S. ETP MONTHLY FLASH JANUARY 2013 Source: NYSE Arca ETP Database and Arc vision. Statistics include only NYSE Arca listed ETPs which are derivatively priced securities that can trade intraday on a securities
MANAGED FUTURES INDEX
 MANAGED FUTURES INDEX COMMENTARY + STRATEGY FACTS JUNE 2018 CUMULATIVE PERFORMANCE ( SINCE JANUARY 2007* ) 120.00% 100.00% 80.00% 60.00% 40.00% 20.00% 0.00% AMFERI BARCLAY BTOP50 CTA INDEX S&P 500 S&P
- Victor Haghani, Founder Elm. Watch the full talk here
 "After more than 20 years in finance, from the LSE to Salomon Brothers to LTCM, you d have thought that I d have figured out how to invest my family s savings. Well, it was 2002, I just turned 40, and
Endowment Funds Performance (Year ending Sept 30 th, 2014)
") Endowment Funds Performance (Year ending Sept 30 th, 2014) prepared for University Board of Governors (Note: all returns and values are expressed in Canadian Dollars- CAD s) 1 Quarterly Market Overview
Endowment Funds Performance (Year ending Sept 30 th, 2014) prepared for University Board of Governors (Note: all returns and values are expressed in Canadian Dollars- CAD s) 1 Quarterly Market Overview
MANAGED FUTURES INDEX
 MANAGED FUTURES INDEX COMMENTARY + STRATEGY FACTS JULY 2017 CUMULATIVE PERFORMANCE ( SINCE JANUARY 2007* ) 120.00% 100.00% 80.00% 60.00% 40.00% 20.00% 0.00% AMFERI BARCLAY BTOP50 CTA INDEX S&P 500 S&P
BROAD COMMODITY INDEX
 BROAD COMMODITY INDEX COMMENTARY + STRATEGY FACTS APRIL 2017 80.00% CUMULATIVE PERFORMANCE ( SINCE JANUARY 2007* ) 60.00% 40.00% 20.00% 0.00% -20.00% -40.00% -60.00% -80.00% ABCERI S&P GSCI ER BCOMM ER
NASDAQ GLOBAL RISK MANAGED INCOME INDEX
 1 NASDAQ GLOBAL RISK MANAGED INCOME INDEX WHAT IS IT? The NASDAQ Global Risk Managed Income Index is a rules-based, quantitatively enabled index that is designed to provide risk managed, globally diversified
Horizons HAHN Investment Stewards. Exchange Traded Forum 2011
 Horizons HAHN Investment Stewards Exchange Traded Forum 2011 11 Investors and Advisors are Still Troubled by a Decade of Volatility and Poor Returns Source: HAHN Research (Data: Federal Reserve, Standard
BROAD COMMODITY INDEX
 BROAD COMMODITY INDEX COMMENTARY + STRATEGY FACTS JUNE 2017 80.00% CUMULATIVE PERFORMANCE ( SINCE JANUARY 2007* ) 60.00% 40.00% 20.00% 0.00% -20.00% -40.00% -60.00% -80.00% ABCERI S&P GSCI ER BCOMM ER
CANADIAN ETF REPORT. February 2017
 CANADIAN ETF REPORT February 2017 TABLE OF CONTENTS This report covers trends in the Total ETF & Smart Beta ETF markets across asset classes & geographies for: Canadian ETF AUM Canadian ETF Fund Flows
Morgan Stanley ETF-MAP 2 Index Information
 Morgan Stanley ETF-MAP 2 Index Information Investing in instruments linked to the Morgan Stanley ETF-MAP 2 Index involves risks not associated with an investment in other instruments. See Risk Factors
March U.S. ETP Monthly Flash
 March 2016 U.S. ETP Monthly Flash NYSE Arca U.S. Exchange Traded Products (ETP) Highlights from March 2016 In March, 10 new ETPs listed on NYSE Arca At the end of March, 1,558 ETPs were listed on NYSE
U.S. EXCHANGE TRADED FUNDS MONTHLY FLASH APRIL 2017
 U.S. EXCHANGE TRADED FUNDS MONTHLY FLASH APRIL 2017 NYSE ARCA U.S. EXCHANGE TRADED FUNDS (ETFs) HIGHLIGHTS FROM APRIL 2017 In April, 5 new ETFs 1 listed on NYSE Arca At the end of April, 1,514 ETFs were
MANAGED FUTURES INDEX
 MANAGED FUTURES INDEX COMMENTARY + STRATEGY FACTS JANUARY 2019 CUMULATIVE PERFORMANCE ( SINCE JANUARY 2007* ) 140.00% 120.00% 100.00% 80.00% 60.00% 40.00% 20.00% 0.00% AMFERI BARCLAY BTOP50 CTA INDEX S&P
MANAGED FUTURES INDEX
 MANAGED FUTURES INDEX COMMENTARY + STRATEGY FACTS JANUARY 2018 CUMULATIVE PERFORMANCE ( SINCE JANUARY 2007* ) 120.00% 100.00% 80.00% 60.00% 40.00% 20.00% 0.00% AMFERI BARCLAY BTOP50 CTA INDEX S&P 500 S&P
MANAGED FUTURES INDEX
 MANAGED FUTURES INDEX COMMENTARY + STRATEGY FACTS JULY 2018 CUMULATIVE PERFORMANCE ( SINCE JANUARY 2007* ) 120.00% 100.00% 80.00% 60.00% 40.00% 20.00% 0.00% AMFERI BARCLAY BTOP50 CTA INDEX S&P 500 S&P
MANAGED FUTURES INDEX
 MANAGED FUTURES INDEX COMMENTARY + STRATEGY FACTS SEPTEMBER 2018 CUMULATIVE PERFORMANCE ( SINCE JANUARY 2007* ) 140.00% 120.00% 100.00% 80.00% 60.00% 40.00% 20.00% 0.00% AMFERI BARCLAY BTOP50 CTA INDEX
- Victor Haghani, Founder Elm. Watch the full talk here
 "After more than 20 years in finance, from the LSE to Salomon Brothers to LTCM, you d have thought that I d have figured out how to invest my family s savings. Well, it was 2002, I just turned 40, and
August U.S. ETP Monthly Flash
 August 2014 U.S. ETP Monthly Flash NYSE Arca U.S. Exchange Traded Products (ETP) Highlights from August 2014 In August, 13 new ETPs listed on NYSE Arca At the end of August, 1,477 ETPs were listed on NYSE
LongRun Monthly Strategy Summary (6/30/2013) Commentary
 Commentary") Commentary June was a take-no-prisoners month in the markets. All 14 ETFs that we track for our strategies were down, ranging from -0.8% for US Small Cap Equity (IWM) to -11.5% for Metals & Mining (XME).
Commentary June was a take-no-prisoners month in the markets. All 14 ETFs that we track for our strategies were down, ranging from -0.8% for US Small Cap Equity (IWM) to -11.5% for Metals & Mining (XME).
INVESTMENT MARKET UPDATE UBC FACULTY PENSION PLAN
 INVESTMENT MARKET UPDATE UBC FACULTY PENSION PLAN MIKE LESLIE, FACULTY PENSION PLAN NEIL WATSON, LEITH WHEELER FEBRUARY 11, 2015 Presenters Mike Leslie Executive Director, Investments Faculty Pension Plan
Portfolio Construction Including ETFs: Impressive Opportunities and Clear Benefits
 Portfolio Construction Including ETFs: Impressive Opportunities and Clear Benefits Rohit Mehta Executive Vice-President, Distribution & Strategy First Asset Investment Management, Inc. ETF AUM over the
Annual Public Meeting
 Public Meeting Ottawa, November 27, By Cheryl Barker, Interim Chair of the Board Gordon J. Fyfe, President & CEO Cheryl Barker Interim Chair, Board of Directors 2 Gordon J. Fyfe President and CEO 3 Long
Building Efficient Return Seeking Portfolios Reassessing the Equity Allocation
 Building Efficient Return Seeking Portfolios Reassessing the Equity Allocation Paul M. Martin, CFA Vice President & Portfolio Manager Phillips, Hager & North Investment Management Sources of Risk in a
AS AT OCTOBER 31, Making Active Management Count NCM ALTERNATIVE SUMMARIES INVESTMENTS. ncminvestments.com
 AS AT OCTOBER 31, 2018 Making Active Management Count NCM ALTERNATIVE SUMMARIES INVESTMENTS ncminvestments.com Invest in New Ideas By combining cutting-edge techniques to reduce risk, increasing investable
Endowment Funds Performance (Year ending June 30 th, 2013)
") Endowment Funds Performance (Year ending June 30 th, 2013) prepared for Investment Subcommittee (Note: all returns and values are expressed in Canadian Dollars- CAD s) 1 Quarterly Market Overview Canadian
Endowment Funds Performance (Year ending June 30 th, 2013) prepared for Investment Subcommittee (Note: all returns and values are expressed in Canadian Dollars- CAD s) 1 Quarterly Market Overview Canadian
DTH WisdomTree International High Dividend Fund
 WisdomTree International High Dividend Fund ETF.com segment: Equity: Developed Markets Ex-U.S. - High Dividend Competing ETFs: IDV, HDEF, EFAS, FIDI Related ETF Channels: Developed Markets Ex-U.S., Smart-Beta
BMO Laddered Preferred Share Index ETF (ZPR) (the ETF )
 (the ETF )") ANNUAL MANAGEMENT REPORT OF FUND PERFORMANCE BMO Laddered Preferred Share Index ETF (ZPR) (the ETF ) For the 12-month period ended December 31, 2017 (the Period ) Manager: BMO Asset Management Inc. (the
ANNUAL MANAGEMENT REPORT OF FUND PERFORMANCE BMO Laddered Preferred Share Index ETF (ZPR) (the ETF ) For the 12-month period ended December 31, 2017 (the Period ) Manager: BMO Asset Management Inc. (the
- Victor Haghani, Founder Elm. Watch the full talk here
 "After more than 20 years in finance, from the LSE to Salomon Brothers to LTCM, you d have thought that I d have figured out how to invest my family s savings. Well, it was 2002, I just turned 40, and
BROAD COMMODITY INDEX
 BROAD COMMODITY INDEX COMMENTARY + STRATEGY FACTS JULY 2018 100.00% 80.00% 60.00% 40.00% 20.00% 0.00% -20.00% -40.00% -60.00% CUMULATIVE PERFORMANCE ( SINCE JANUARY 2007* ) -80.00% ABCERI S&P GSCI ER BCOMM
U.S. EXCHANGE TRADED FUNDS MONTHLY FLASH AUGUST 2017
 U.S. EXCHANGE TRADED FUNDS MONTHLY FLASH AUGUST 2017 NYSE ARCA U.S. EXCHANGE TRADED FUNDS (ETFs) HIGHLIGHTS FROM AUGUST 2017 In August, 12 new ETFs 1 listed on NYSE Arca At the end of August, 1,459 ETFs
July U.S. ETP Monthly Flash
 July 2015 U.S. ETP Monthly Flash NYSE Arca U.S. Exchange Traded Products (ETP) Highlights from July 2015 In July, 32 new ETPs listed on NYSE Arca At the end of July, 1,527 ETPs were listed on NYSE Arca
Nasdaq Victory International 500 Vol Wt NTR Index
 Nasdaq Victory International 500 Vol Wt NTR Index The Nasdaq Victory International 500 Volatility Weighted Net Total Return Index contains the 500 largest publicly traded stocks within the Nasdaq Global
RBC GLOBAL BALANCED FUND
 BALANCED FUND December 31, 2017 Portfolio Manager RBC Global Asset Management Inc. ( RBC GAM ) Sub-Advisor: RBC Global Asset Management (UK) Limited, London, England (for the European equity portion of
2018 Annual Management Report of Fund Performance
 (the Fund ) For the 12-month period ended September 30, 2018 (the Period ) Manager: BMO Investments Inc. (the Manager or BMOII ) Portfolio manager: BMO Asset Management Inc., Toronto, Ontario (the portfolio
Schindler Capital Management, LLC / Dairy Advantage Program. Year Jan Feb Mar Apr May Jun Jul Aug Sep Oct Nov Dec
 Schindler Capital Management, LLC / Dairy Advantage Program Fundamental / Ag & Livestock Performance Since August 2005 Year Jan Feb Mar Apr May Jun Jul Aug Sep Oct Nov Dec 2005-11.20% 3.20% -6.67% -13.73%
INVESTMENT MARKET UPDATE UBC FACULTY PENSION PLAN
 INVESTMENT MARKET UPDATE UBC FACULTY PENSION PLAN MIKE LESLIE, FACULTY PENSION PLAN NEIL WATSON, LEITH WHEELER FEBRUARY 12, 2014 Presenters Mike Leslie Executive Director, Investments Faculty Pension Plan
MANAGED FUTURES INDEX
 MANAGED FUTURES INDEX COMMENTARY + STRATEGY FACTS NOVEMBER 2018 CUMULATIVE PERFORMANCE ( SINCE JANUARY 2007* ) 140.00% 120.00% 100.00% 80.00% 60.00% 40.00% 20.00% 0.00% AMFERI BARCLAY BTOP50 CTA INDEX
DWX SPDR S&P International Dividend ETF
 SPDR S&P International Dividend ETF ETF.com segment: Equity: Global Ex-U.S. - High Dividend Yield Competing ETFs: HDAW, VYMI Related ETF Channels: Smart-Beta ETFs, Dividend, Broad-based, ESG, Dividends,
Nasdaq Victory International 500 Vol Wt TR
 12/11 3/12 6/12 9/12 3/13 6/13 9/13 12/13 6/14 9/14 12/14 3/15 9/15 12/15 3/16 6/16 12/16 3/17 6/17 9/17 3/18 6/18 9/18 12/18 Nasdaq Victory International 500 Vol Wt TR The Nasdaq Victory International
DIVERSIFIED PROGRAM COMMENTARY + PORTFOLIO FACTS JANUARY 2019 INVEST WITH AUSPICE. AUSPICE Capital Advisors
 DIVERSIFIED PROGRAM COMMENTARY + PORTFOLIO FACTS 100% CUMULATIVE PERFORMANCE ( SINCE JANUARY 2007* ) 80% 60% 40% 20% 0% AUSPICE DIVERSIFIED BARCLAY BTOP50 CTA INDEX S&P 500 S&P / TSX 60 Correlation 0.69-0.18-0.11
GDX VanEck Vectors Gold Miners ETF
 VanEck Vectors Gold Miners ETF ETF.com segment: Equity: Global Gold Miners Competing ETFs: J, RING, GOEX, PSAU, SGDM Related ETF Channels: Vanilla, Gold, NYSE Arca Gold Miners, Global, Equity, Sectors,
BROAD COMMODITY INDEX
 BROAD COMMODITY INDEX COMMENTARY + STRATEGY FACTS JANUARY 2018 100.00% 80.00% 60.00% 40.00% 20.00% 0.00% -20.00% -40.00% -60.00% CUMULATIVE PERFORMANCE ( SINCE JANUARY 2007* ) -80.00% ABCERI S&P GSCI ER
Endowment Funds Performance (Year ending March 31st, 2012)
") Endowment Funds Performance (Year ending March 31st, 2012) Investment Management Committee Meeting June 20 th, 2012 (Note: all returns and values are expressed in Canadian Dollars- CAD s) 1 $ M Endowmwent
Endowment Funds Performance (Year ending March 31st, 2012) Investment Management Committee Meeting June 20 th, 2012 (Note: all returns and values are expressed in Canadian Dollars- CAD s) 1 $ M Endowmwent
ETFs: Regulatory (High) Impact. Commerzbank, leaders in ETF February 2018
 Impact. Commerzbank, leaders in ETF February 2018") ETFs: Regulatory (High) Impact Commerzbank, leaders in ETF February 2018 What are ETFs? Securities that track the value of an index, commodities or a basket of assets and trade like a stock on the exchange
ETFs: Regulatory (High) Impact Commerzbank, leaders in ETF February 2018 What are ETFs? Securities that track the value of an index, commodities or a basket of assets and trade like a stock on the exchange
URTH ishares MSCI World ETF
 ishares MSCI World ETF ETF.com segment: Equity: Developed Markets - Total Market Competing ETFs: BOTZ, SNSR, RFDI, FDRR, JPGE Related ETF Channels: Total Market, Broad-based, Vanilla, Equity, Size and
GWX SPDR S&P International Small Cap ETF
 SPDR S&P International Small Cap ETF ETF.com segment: Equity: Developed Markets Ex-U.S. - Small Cap Competing ETFs: SCZ, SCHC, HSCZ, FNDC, DLS Related ETF Channels: Equity, Vanilla, Size and Style, Broad-based,
Schwab Diversified Growth Allocation Trust Fund (Closed to new investors) Institutional Unit Class As of June 30, 2017
 Institutional Unit Class As of June 30, 2017") Fund Facts Trustee Fund Type Charles Schwab Bank Collective Trust Fund Morningstar Category Allocation - 50-70% Equity Benchmark Global Growth Custom Index 1 Unit Class Inception Date 3/7/2012 Fund Inception
Fund Facts Trustee Fund Type Charles Schwab Bank Collective Trust Fund Morningstar Category Allocation - 50-70% Equity Benchmark Global Growth Custom Index 1 Unit Class Inception Date 3/7/2012 Fund Inception
BROAD COMMODITY INDEX
 BROAD COMMODITY INDEX COMMENTARY + STRATEGY FACTS AUGUST 2018 120.00% 100.00% 80.00% 60.00% 40.00% 20.00% 0.00% -20.00% -40.00% -60.00% CUMULATIVE PERFORMANCE ( SINCE JANUARY 2007* ) -80.00% ABCERI S&P
Global Equity Trading Volumes Surge 36% in 1 st half 2015 driven by Mainland China
 EMBARGO: :1BST/1:1CET/19:1EDT Global Equity Trading Volumes Surge 36% in 1 st half 215 driven by Mainland China Global Equity Trading Volumes Ex Mainland China Up 5% Mainland China Share Trading Vols Rise
Portfolio Management Services
 2017 / Q1 Portfolio Management Services 1 单击此处添加文字内容 ABF Absolute Return Focus Portfolio 2 单击此处添加文字内容 ABF Systematic Trading Portfolio 3 单击此处添加文字内容 ABF Dynamic Portfolio 单击此处添加文字内容 4 Gold Portfolio 5 单击此处添加文字内容
ASET FlexShares Real Assets Allocation Index Fund
 FlexShares Real Assets Allocation Index Fund ETF.com segment: Equity: Global - Total Market Competing ETFs: QXGG, FVC, DWLV, VT, ACWI Related ETF Channels: Trend-Following, Size and Style, Smart-Beta ETFs,
WDIV SPDR S&P Global Dividend ETF
 SPDR S&P Global Dividend ETF ETF.com segment: Equity: Global - High Dividend Yield Competing ETFs: FGD, SDIV, DEW, LVL, FDVV Related ETF Channels: Smart-Beta ETFs, Global, Dividends, Dividend, Equity,
July U.S. ETP Monthly Flash
 July 2016 U.S. ETP Monthly Flash NYSE Arca U.S. Exchange Traded Products (ETP) Highlights from July 2016 In July, 11 new ETPs listed on NYSE Arca At the end of July, 1,572 ETPs were listed on NYSE Arca
EFAX SPDR MSCI EAFE Fossil Fuel Reserves Free ETF
 SPDR MSCI EAFE Fossil Fuel Reserves Free ETF ETF.com segment: Equity: Developed Markets Ex-U.S. - Total Market Competing ETFs: EFA, VEA, IEFA, SCHF, SPDW Related ETF Channels: Equity, Size and Style, Developed
VEA Vanguard FTSE Developed Markets ETF
 Vanguard FTSE Developed Markets ETF ETF.com segment: Equity: Developed Markets Ex-U.S. - Total Market Competing ETFs: EFA, IEFA, SCHF, SPDW, IDEV Related ETF Channels: Developed Markets Ex-U.S., Total
Russell 2000 Index Options
 Interactive Brokers Webcast Russell 2000 Index Options April 20, 2016 Presented by Russell Rhoads, Senior Instructor Disclosure Options involve risks and are not suitable for all investors. Prior to buying
$31,038. $8,500 June 18. June 12
 HISTORIC RETURNS* Growth of $10,000 since July 2003 $35,000 $30,000 $25,000 $31,038 Fund Performance Series C (PERCENT RETURN) SINCE 1YR 3YRS 5YRS 10YRS INCEPTION 6.78% 6.73% 6.77% 8.10% Target Asset Allocation
DIVERSIFIED PROGRAM COMMENTARY + PORTFOLIO FACTS APRIL 2018 INVEST WITH AUSPICE. AUSPICE Capital Advisors
 DIVERSIFIED PROGRAM COMMENTARY + PORTFOLIO FACTS 100% CUMULATIVE PERFORMANCE ( SINCE JANUARY 2007* ) 80% 60% 40% 20% 0% AUSPICE DIVERSIFIED BARCLAY BTOP50 CTA INDEX S&P 500 S&P / TSX 60 Correlation 0.70-0.20-0.12
DECEMBER 2014 NEWSLETTER
 DECEMBER 2014 NEWSLETTER Market Review 2014 was a very divergent year for world markets, with some being extraordinarily positive, and others not performing well at all. The S&P/TSX was up 7.4%, and the
Using ETFs in Private Client Portfolio Management: Why? Why Not? How?
 Using ETFs in Private Client Portfolio Management: Why? Why Not? How? GREG WALKER, CFA VP, BlackRock Asset Management Canada Ltd. DEBORAH FRAME, CFA VP & CCO, Cougar Global Investments LP CHRISTOPHER GUTHRIE,
MONTHLY FUND SUMMARIES
 January 31, 2016 MONTHLY FUND SUMMARIES Alternative Investments 1.877.431.1407 www.norrep.com MAKING ACTIVE MANAGEMENT COUNT CONTENTS MONTHLY FUND SUMMARIES as at January 31, 2016 Fund Performance Summaries
U.S. EXCHANGE TRADED FUNDS MONTHLY FLASH NOVEMBER 2017
 U.S. EXCHANGE TRADED FUNDS MONTHLY FLASH NOVEMBER 20 NYSE ARCA U.S. EXCHANGE TRADED FUNDS (ETFs) HIGHLIGHTS FROM NOVEMBER 20 In November, 29 new ETFs 1 listed on NYSE Arca At the end of November, 1,487
The role of inflation-linked bonds. September 2004
 The role of inflation-linked bonds September 2004 Table of contents Who we are & our experience Inflation linked bonds: characteristics Performance and risks Applications in a portfolio Simulations and
NASDAQ Global Index. More information about the Index can be found at
 NASDAQ Global Index The NASDAQ Global Index is a float adjusted market capitalization-weighted index designed to track the performance of global equities covering over 98% of the entire listed market capitalization
Commentary. Our greatest weakness lies in giving up. The most certain way to succeed is always to try just one more time.
 LongRun Monthly Strategy Review May 2018 AR +0.2% AG +1.0% TMG +3.0% SP500 +2.4% GDP +0.7% Commentary Last month s commentary led off with our Absolute Return strategy moving to 100% cash for the month
SPTM SPDR Portfolio Total Stock Market ETF
 SPDR Portfolio Total Stock Market ETF ETF.com segment: Equity: U.S. - Total Market Competing ETFs: VTI, ITOT, SCHB, IWV, IYY Related ETF Channels: North America, Total Market, U.S., Broad-based, Vanilla,
DIVERSIFIED PROGRAM COMMENTARY + PORTFOLIO FACTS MARCH 2018 INVEST WITH AUSPICE. AUSPICE Capital Advisors
 DIVERSIFIED PROGRAM COMMENTARY + PORTFOLIO FACTS 100% CUMULATIVE PERFORMANCE ( SINCE JANUARY 2007* ) 80% 60% 40% 20% 0% AUSPICE DIVERSIFIED BARCLAY BTOP50 CTA INDEX S&P 500 S&P / TSX 60 Correlation 0.70-0.20-0.12
VEGI ishares MSCI Global Agriculture Producers ETF
 VEGI ishares MSCI Global Agriculture Producers ETF ETF.com segment: Equity: Global Agriculture Competing ETFs: SOIL, PAGG, CROP, MOO, FTAG Related ETF Channels: Global, Vanilla, Theme Investing, Equity,
IGF ishares Global Infrastructure ETF
 IGF ishares Global Infrastructure ETF ETF.com segment: Equity: Global Infrastructure Competing ETFs: GII, INFR, NFRA, TOLZ, OBOR Related ETF Channels: Smart-Beta ETFs, Multi-factor, Theme Investing, Global,
Schwab Diversified Growth Allocation Trust Fund
 Fund Facts Trustee Fund Type Charles Schwab Bank Collective Trust Fund Category Global Asset Allocation Benchmark Global Growth Custom Index 1 Unit Class Inception Date 11/21/2012 Fund Inception Date 3/7/2012
U.S. EXCHANGE TRADED FUNDS MONTHLY FLASH OCTOBER 2017
 U.S. EXCHANGE TRADED FUNDS MONTHLY FLASH OCTOBER 2017 NYSE ARCA U.S. EXCHANGE TRADED FUNDS (ETFs) HIGHLIGHTS FROM OCTOBER 2017 In October, 18 new ETFs 1 listed on NYSE Arca At the end of October, 1,459
Commentary. If you are the smartest person in the room, then you are in the wrong room. Attributed to Confucius
 LongRun Monthly Strategy Review Jun 2018 AR +0.9% AG +1.0% TMG -0.5% SP500 +0.6% GDP -0.8% Commentary June brought mixed messages from the markets. Worries about the Trump/Kim summit and Federal Reserve
The Evolution of Alternative Beta: Using Index-Based Investment Strategies
 Filed pursuant to Rule 433 Registration Statement No. 333-180300-03 Investor Solutions The Evolution of Alternative Beta: Using Index-Based Investment Strategies This presentation may not be altered except
First Trust AlphaDEX TM U.S. Dividend ETF (CAD-Hedged)
") First Trust AlphaDEX TM U.S. Dividend ETF (CAD-Hedged) Annual December 31, 2016 blank (Page intentionally left blank) ANNUAL MANAGEMENT REPORT OF FUND PERFORMANCE December 31, 2016 First Trust AlphaDEX
First Trust AlphaDEX TM U.S. Dividend ETF (CAD-Hedged) Annual December 31, 2016 blank (Page intentionally left blank) ANNUAL MANAGEMENT REPORT OF FUND PERFORMANCE December 31, 2016 First Trust AlphaDEX
Commentary. "How ridiculous and how strange to be surprised at anything which happens in life." -Marcus Aurelius
 LongRun Monthly Strategy Review Aug 2017 AR +0.72% AG +1.64% TMG +0.36% SP500 +0.29% R2000-1.54% GDP +0.67% Commentary After posting new all-time highs the first week of August, US equity markets had a
Our Picks % Toronto (TSX) % Dow Jones (US) %
 % Dow Jones (US) %") Recommended List Performance (Jan. 1 2009 - Dec. 31 2009) Our Picks - +75.85% Toronto (TSX) - +30.6% Dow Jones (US) - +18.8% OUR PICKS vs. THE INDEX Financials 39.4% 28% Oil / Gas 36.3% 26% Base Materials
Recommended List Performance (Jan. 1 2009 - Dec. 31 2009) Our Picks - +75.85% Toronto (TSX) - +30.6% Dow Jones (US) - +18.8% OUR PICKS vs. THE INDEX Financials 39.4% 28% Oil / Gas 36.3% 26% Base Materials
Quarterly Investment Update First Quarter 2017
 Quarterly Investment Update First Quarter 2017 Market Update: A Quarter in Review March 31, 2017 CANADIAN STOCKS INTERNATIONAL STOCKS Large Cap Small Cap Growth Value Large Cap Small Cap Growth Value Emerging
URA Global X Uranium ETF
 Global X Uranium ETF ETF.com segment: Equity: Global Nuclear Energy Competing ETFs: NLR Related ETF Channels: Nuclear Energy, Nuclear, Vanilla, Theme Investing, Global, Equity, Sectors Find more ETFs with
EWC ishares MSCI Canada ETF
 ishares MSCI Canada ETF ETF.com segment: Equity: Canada - Total Market Competing ETFs: QCAN, H, FCAN, FLCA Related ETF Channels: North America, Canada, Single Country, Total Market, Vanilla, Equity, Size
SCZ ishares MSCI EAFE Small-Cap ETF
 ishares MSCI EAFE Small-Cap ETF ETF.com segment: Equity: Developed Markets Ex-U.S. - Small Cap Competing ETFs: SCHC, GWX, H, FNDC, DLS Related ETF Channels: Developed Markets Ex-U.S., Broad-based, Vanilla,
SIL Global X Silver Miners ETF
 Global X Silver Miners ETF ETF.com segment: Equity: Global Silver Miners Competing ETFs: SLVP, J Related ETF Channels: Silver, Vanilla, Global, Equity, Sectors, Silver Miners Find more ETFs with our ETF
FNDC Schwab Fundamental International Small Company Index ETF
 Schwab Fundamental International Small Company Index ETF ETF.com segment: Equity: Developed Markets Ex-U.S. - Small Cap Competing ETFs: DLS, DDLS, SCZ, SCHC, GWX Related ETF Channels: Smart-Beta ETFs,
SMMD ishares Russell 2500 ETF
 ishares Russell 2500 ETF ETF.com segment: Equity: U.S. - Extended Market Competing ETFs: PRFZ, VXF, SPMD, ISMD, SDVY Related ETF Channels: U.S., Equity, Size and Style, North America, Broad-based, Extended
SPMD SPDR Portfolio Mid Cap ETF
 SPDR Portfolio Mid Cap ETF ETF.com segment: Equity: U.S. - Extended Market Competing ETFs: PRFZ, VXF, ISMD, SMMD, SDVY Related ETF Channels: North America, Extended Market, U.S., Broad-based, Vanilla,
BMO Mid Corporate Bond Index ETF (ZCM) (the ETF )
 (the ETF )") ANNUAL MANAGEMENT REPORT OF FUND PERFORMANCE BMO Mid Corporate Bond Index ETF (ZCM) (the ETF ) For the 12-month period ended December 31, 2017 (the Period ) Manager: BMO Asset Management Inc. (the Manager
ANNUAL MANAGEMENT REPORT OF FUND PERFORMANCE BMO Mid Corporate Bond Index ETF (ZCM) (the ETF ) For the 12-month period ended December 31, 2017 (the Period ) Manager: BMO Asset Management Inc. (the Manager
GHII Invesco S&P High Income Infrastructure ETF
 GHII Invesco S&P High Income Infrastructure ETF ETF.com segment: Equity: Global Infrastructure Competing ETFs: PAVE, IFRA, NFRA, TOLZ, OBOR Related ETF Channels: Smart-Beta ETFs, Dividend, Dividends, Theme