BKW Group Financial Report 2012
|
|
|
- Osborn Lester
- 6 years ago
- Views:
Transcription

1 BKW Group Financial Report 2012
2 The BKW Group is one of Switzerland s largest energy companies. It employs more than 3,000 people and covers all stages of energy supply: from production and transmission to trading and distribution. Directly and indirectly via its distri - bution partners, BKW supplies power to more than a million people. The BKW production portfolio incorporates hydroelectric and nuclear power plants, gas-fired combined-cycle power plants and renewable energy facilities in Switzerland and other parts of Europe. Sales activities in Switzerland and Italy Production Trade Sales Networks Customers Own power plants and power plant shareholdings Management and trading in production and network capacities as well as trading in CO 2 certificates Transmission and distribution
3 Facts & Figures 2012 BKW Group Total operating revenue Net profit/loss Number of employees CHF millions CHF millions Full-time equivalents 2008: 3, : 3, : 2, : 2, : 2, : : : : : : 2, : 2, : 2, : 2, : 3,037 Electricity business GWh restated Sales Electricity sales Switzerland 7,465 8,186 8,153 8,075 7,978 Electricity sales International 1,696 1,630 1,838 5,768 5,201 Electricity trading 10,384 10,332 11,838 12,638 11,882 Pump/substitution energy Transmission losses/own consumption Direct sales from financial interests Total 20,040 20,721 22,507 27,310 25,969 Generation and purchases (incl. financial interests) Hydroelectric plants 3,963 3,406 3,743 4,052 4,012 Nuclear power plants incl. purchase contracts 5,769 5,373 5,921 5,784 5,884 Thermal power plants New renewable energy Trade (purchases) and energy buy-backs 9,229 10,856 11,955 16,732 15,670 Total 20,040 20,721 22,507 27,310 25,969 Sales 2012 Generation and purchases 2012 Electricity sales Switzerland 37.2% Electricity sales International 8.5% Electricity trading 51.8% Pump/substitution energy 1.3% Transmission losses/own consumption 1.0% Direct sales from financial interests 0.2% Hydroelectric plants 19.8% Nuclear power plants incl. purchase contracts 28.8% Thermal power plants 2.4% New renewable energy 3.0% Trade (purchases) and energy buy-backs 46.0%
4 Financials CHF millions restated Total operating revenue 2, , , , ,496.2 Operating profit before depreciation, amortisation and impairment Net profit/loss Cash flow from operating activities Purchase of property, plant and equipment Balance sheet total 7, , , , ,989.3 Shareholders equity 2, , , , ,069.8 as % of balance sheet total Key figures per share CHF Par value Share price Year-end price Year high Year low Net profit/loss (BKW shareholders portion) Equity per share (BKW shareholders portion) Market capitalisation in CHF millions 1, , , , ,298.3 Following the disposal of the German sales operations on 1 January 2011, the total revenue, operating result and energy figures for 2010 have been adjusted accordingly. This adjustment has not been carried out for 2008 and 2009, however, leading to limited comparability. Performance of the BKW share Shareholders BKW registered shares Swiss Performance Index (indexed) Canton of Berne 52.54% Groupe E SA 10.00% E.ON Energie AG 7.03% Treasury stock 9.68% Other 20.75%
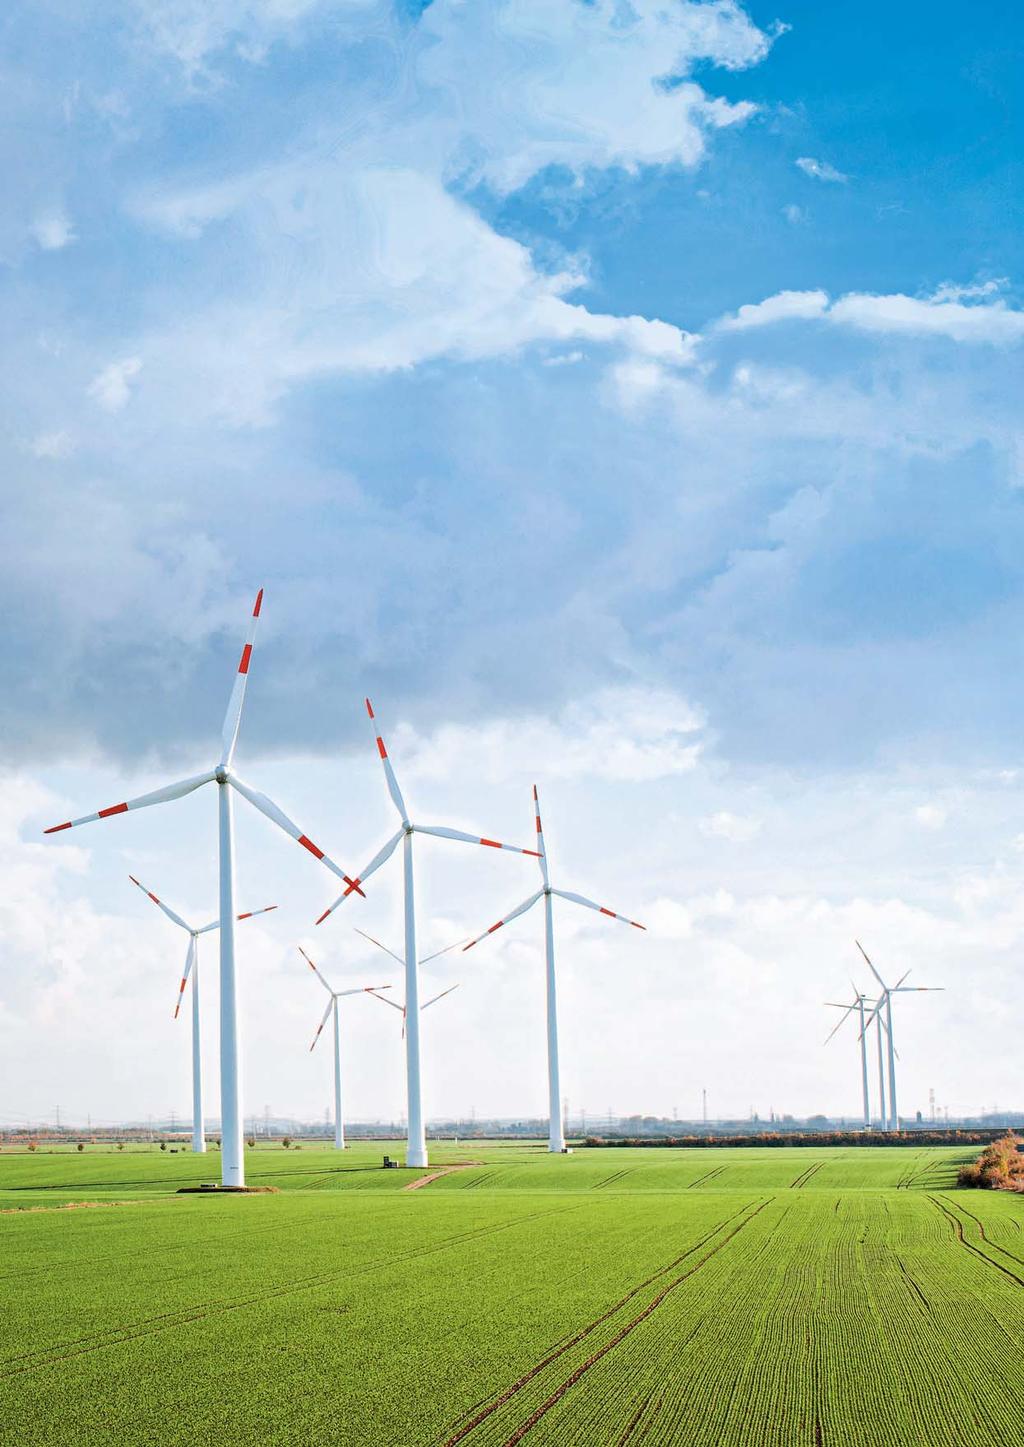
5 Contents Financial Report Financial Result 06 Consolidated Financial Statements of the BKW Group 69 Holdings 72 Report of the Statutory Auditor on the Consolidated Financial Statements 74 Financial Statements of BKW Inc. 81 Appropriation of Retained Earnings 82 Report of the Statutory Auditor on the Financial Statements 84 Investor Information 87 Production Facts & Figures Title image: The Holleben wind farm in Saxony-Anhalt (Germany) has an installed capacity of 25.5 MW. It comprises 17 wind turbines, generating 46.8 GWh of electricity in The facility is located near BKW s Dubener Platte, Lüdersdorf- Parstein and Bockelwitz wind farms. BKW is now Switzerland s largest producer of electricity from the wind. At the end of 2012, it had a total installed capacity of 308 MW in Switzerland, Italy and Germany.
6
7 02 Financial Result Financial Result A solid operating profit in a difficult environment The BKW Group 1 recorded a solid operating profit in 2012, which was significantly higher than the previous year s figure. Key factors included higher production volumes and the impact of cost-cutting measures, but also low energy prices and one-off charges. The performance of the international financial markets had a positive impact on the financial result and thus also on net profit. Rising operating profit and net profit in a demanding environment In the challenging economic and regulatory environment that characterised fiscal 2012, BKW recorded a solid level of operating profit. Both the energy and network business contributed to this positive development, which was supported by higher production volumes from renewable energies and nuclear power plants, coupled with positive effects from the programme of measures introduced to cut costs and improve efficiency. The figure was however also affected by a fall in electricity sales, a continuation of low market prices, and special provisions for energy procurement contracts. Operating profit before depreciation, amortisation and impairment (EBITDA) grew by CHF million to CHF million. Adjusted to take account of one-off charges, EBITDA totalled CHF million, an increase of CHF compared with the adjusted figure for the previous year. Furthermore, the performance of the international financial markets had a positive impact on the financial result and thus also on net profit, which totalled CHF million. Adjusted for special provisions, profit amounted to CHF million. Special provisions The impairment testing of production plants carried out as part of the preparation of the year-end financial statements resulted in the need for a correction totalling CHF million. It is new production plants in particular that are affected by these special charges, namely the Hagneck hydro station and the fossil-fuelled thermal power plants in Wilhelmshaven, Livorno Ferraris and Tamarete. A value adjustment was also needed in the case of the Fessenheim nuclear power plant. BKW purchases the electricity produced at these plants at production cost. Based on the updated assessment of future market developments, BKW expects the production costs of these power plants to be higher than the market prices that can be achieved in future, despite provisions having been made in some cases in Consequently, the impairment has been recorded as a provision for onerous energy procurement contracts and thus as an energy procurement expense. Adjusted for these special charges, EBITDA ended the year 25.1% up on the adjusted figure for the previous year, at CHF million. The net effect of special charges, after taxes, on the annual result is CHF 70.0 million, with an adjusted net profit of CHF million (+ 66.6% compared with the adjusted figure for the previous year). Changes in accounting principles and in the scope of consolidation The consolidated financial statements have been prepared in accordance with International Financial Reporting Standards (IFRS). No IFRS changes with an effect on the financial position, results of operations or cash flows of BKW entered into effect during Similarly, there were only a few changes with regard to the disclosure rules, and BKW was not affected by these. The group of consolidated companies was extended in 2012, particularly as a result of the acquisition of various electrical installation and network construction companies, the switch to the full consolidation of cc energie sa (62% share), and the full takeover of Landkern wind park (previously a 50% share). I 1 The BKW Group comprises BKW Inc. and its consolidated companies. In order to make this report easier to read, the Group will be referred to below simply as BKW. Specific reference to BKW Inc. or BKW FMB Energy Ltd. will be made where appropriate.
8 Financial Result 03 Reconciliation from reported to adjusted result 2012 reported 2012 Adjustments 2012 adjusted 2011 reported 2011 Adjustments 2011 adjusted % change Total operating revenue 2, , , , % Total operating expenses 2, , , , % Operating profit before depreciation, amortisation and impairment % Depreciation, amortisation and impairment % Operating profit/loss % Financial result % Income from equity-valued companies Profit/loss before income taxes % Income taxes % Net profit from discontinued operations Net profit/loss % Slight increase in operating revenue BKW recorded a 8.6% increase in its consolidated operating revenue in 2012, up to CHF 2,860.4 million, despite what remained a difficult economic and regulatory environment. Net sales to external customers increased in the Energy International and Trading business divisions and also in Networks, while there was a slight fall in sales in the case of Energy Switzerland. Energy Switzerland: production volumes up substantially, sales down slightly The operating revenue of Energy Switzerland fell by 4.2% to CHF 2,167.9 million. Net sales to external customers were down as a result of declining volumes, falling by 8.0% to CHF 1,081.9 million. This development can be attributed to a fall in sales to distribution partners, particularly outside the BKW supply region. Despite the higher production volume, net sales to other segments remained almost unchanged compared with the previous year, at CHF million, which can be attributed to the lower internal transfer prices compared with Adjusted operating profit (EBIT) rose strongly, up by 24.1% to CHF million. The main factors responsible for this increase were significant rises in production resulting from exceptionally good outputs from the hydroelectric power plants and the high availability of the Mühleberg nuclear power plant. The same period of 2011 was also negatively affected by a one-off factor, in that the cancellation of the general licence application for replacement nuclear power plants resulted in impairments of CHF 14 million during the first half of 2011, which were charged to the income statement. Energy International and Trading: difficult market environment affects result again The Energy International and Trading business division recorded operating revenue of CHF 2,203.4 million, which represents a year-on-year rise of 6.3%. Net sales to external customers grew by 22.5% to reach CHF 1,402.6 million. Electricity trading was increased by 11.5% to CHF million. Income from proprietary energy trading dipped slightly year on year, down by CHF 4.9 million due to market-related factors, while income from energy hedging, at CHF 6.0 million, was CHF 47.2 million up on the previous year s figure. International sales business was down slightly, due to market-related pricing issues, with sales totalling CHF million (2011: CHF million). Net sales to other segments dropped by 14.4% to CHF million due to price and volume-related factors. Adjusted operating profit (EBIT), at CHF 9.9 million, actually rose by CHF 30.1 million compared with the previous year, but was negative due to low energy prices, the strength of the Swiss franc and the development of the difference between peak and off-peak prices. Higher production volumes from the Group s own wind power plants had a positive impact. Networks: repeated increase in revenue and operating profit The Networks segment grew its total operating revenue by 2.2% to CHF million. Net sales to external customers rose by 26.7% to CHF million, while net sales to other segments were down slightly due to lower grid usage charges
9 04 Financial Result ( 6.4%). Since external revenue for grid usage is largely invoiced by Energy Switzerland and disclosed as internal revenue under Networks, network revenue generated outside the Group is low. The bulk of this revenue is accounted for by engineering services and the electrical installation business, which posted a CHF 25.9 million rise in revenue to a significantly increased level of CHF million (including changes in work in progress). Operating profit (EBIT) grew by 15.1% to CHF million despite EICom cutting the amount of chargeable costs in the distribution grid. A higher throughput and the impact of cost-cutting measures were key factors in this regard. Additionally, coverage differences in 2011 and 2012 on the transmission grid amounting to CHF 17 million were carried in the income statement, with regard to which Swissgrid provided BKW with compensation following the transfer of the transmission grid in Increase in adjusted operating profit and significant easing in the financial result Adjusted energy procurement costs in 2012 totalled CHF 1,541.3 million (CHF 1,424.5 million). This equates to a year-on-year rise of 8.2%. Personnel expenses grew during the reporting year, up by 2.3% to CHF million. The number of employees increased due to the creation of new positions in engineering services and the electrical installation business. Business combinations also resulted in a higher number of staff. In contrast, the measures introduced as part of the cost-cutting programme had a reducing impact. Material and third-party services fell by CHF 10.2 million to CHF million. In 2011 this item included one-off charges in the form of impairments of around CHF 14 million resulting from the cancellation of the general licence application for replacement nuclear power plants. Other operating expenses increased by 3.5% to CHF million, mainly due to higher taxes and charges. EBITDA rose by 25.1% to CHF million. There was only a slight change in the depreciation figures compared with the previous year. Adjusted profit (EBIT), at CHF million, was CHF million higher than the previous year s figure. Buoyed by the positive development on the stock markets, higher financing costs and the strength of the Swiss franc, the financial result climbed by CHF 39.2 million compared with the previous year to reach CHF 49.1 million. The main contributory factor was the return on shares in the decommissioning and disposal funds, which are measured at fair value. In contrast with the slight price losses of the previous year, the state funds recorded a profit of CHF 58.4 million for the reporting year. Expenses relating to the interest on provisions increased by CHF 23.3 million compared with the previous year to CHF 80.9 million. This was due to the formation of provisions for loss-making energy procurement contracts as at 31 December 2011 and the increase in the reserves for nuclear disposal based on the updated 2011 cost estimate. The interest on these provisions was charged to income for the first time in the 2012 financial year. A sound equity and financing situation Total assets in 2012 grew by 5.2% compared with the previous year to CHF 7,453.7 million. On the assets side, non-current assets grew slightly, up by 2.8%, due to the increase in value of state funds for decommissioning and disposal. Current assets increased by 11.8% as a result of a rise in cash and cash equivalents and current financial assets, as well as due to higher replacement values of derivatives. On the liabilities side, non-current liabilities rose primarily due to the formation of special provisions for onerous energy procurement contracts and due to the addition of financial liabilities in conjunction with the issuing of two registered bonds. Equity rose by CHF 68.5 million on a year-on-year basis. The rise in total assets meant, however, that the equity ratio dipped slightly to 36.5% (2011: 37.5%). The BKW Group s equity situation remains stable. Similarly, BKW s financing situation remains solid. The first refinancing of outstanding bonds is not due until The syndicated loan in the amount of CHF 300 million agreed in October 2011 remains unused. Consequently, the financial
10 Financial Result 05 conditions for strengthening the liquidity reserves are unchanged. In November 2012 BKW also successfully placed two registered bonds in the amount of EUR 125 million. By borrowing in euros in this way, BKW is able to obtain partly currency and country-matched financing for its investment projects in Germany from local investors, while also expanding its investor base. The assets and liabilities of BKW Übertragungsnetz AG continue to be disclosed separately in the year-end balance sheet under Assets held for sale and Liabilities held for sale. This is due to the sale of the transmission grid to Swissgrid, which was completed on 3 January Strong cash flow from operating activities, reserved investment activity Cash flow from operating activities totalled CHF million during the year under review. This represents a marked rise of CHF 46.2 million compared with the previous year. a dividend yield of 3.8% (based on the year-end share price). The proposed dividend is based on the net profit for the year of CHF million adjusted for the non-cash special provisions. Taking into account further non-cash effects, and the profit from the shares in the state funds for decommissioning and disposal in particular, this equates to a payout ratio of around 40% and reflects the consistency of BKW s dividend policy. Outlook BKW is not expecting any change in the challenging market environment in the current financial year, with energy prices set to remain low and ongoing margin pressure on the international markets. Coupled with regulatory requirements and a persistently strong Swiss franc, this will also affect the operating result for The full impact of efficiency enhancements resulting from the cost reduction measures is not yet being felt. Based on all of these factors, BKW expects its EBITDA and net profit to be in line with the figures reported for Investments in non-current assets resulted in a cash outflow of CHF million (2011: CHF million). Investment activity tended to be more reserved in light of current market conditions and the prevailing uncertainties. Overall, the cash outflow from investing activity totalled CHF million. During the previous year, investments were primarily financed using longterm time deposits, resulting in a lower cash outflow. The inflow of CHF 37.2 million from financing activities is primarily related to the placement of two registered bonds and to dividend payments. In 2011 the cash outflow of CHF million was largely related to the payment of dividends. Cash and cash equivalents grew by CHF 67.6 million to CHF million. Dividends The Annual General Meeting of 17 May 2013 will be asked to approve a dividend of CHF 1.20 per share, which equates to
11 06 Consolidated Financial Statements of the BKW Group Consolidated Financial Statements of the BKW Group Consolidated Income Statement Note CHF millions Net sales 8 2, ,503.0 Own work capitalised Other operating income Total operating revenue 2, ,632.8 Energy procurement 8 1, ,704.3 Material and third-party services Personnel expenses Other operating expenses Total operating expenses 2, ,494.7 Operating profit before depreciation, amortisation and impairment Depreciation, amortisation and impairment Operating profit/loss Financial income Financial expenses Income from equity-valued companies Profit/loss before income taxes Income taxes Net profit/loss from continuing operations Net profit from discontinued operations Net profit/loss attributable to: BKW shareholders Non-controlling interests Earnings per share in CHF (diluted and undiluted) Earnings per share in CHF from continuing operations (diluted and undiluted)
12 Consolidated Financial Statements of the BKW Group 07 Consolidated Financial Statements of the BKW Group Consolidated Statement of Comprehensive Income CHF millions Net profit/loss Currency translations Currency translations Transfer to the income statement Income taxes Available-for-sale financial assets Value adjustments Income taxes Cash flow hedges Value adjustments Income taxes Total other comprehensive income Comprehensive income attributable to: BKW shareholders Non-controlling interests
13 08 Consolidated Financial Statements of the BKW Group Consolidated Financial Statements of the BKW Group Consolidated Balance Sheet Note CHF millions Assets Property, plant and equipment 16 2, ,833.0 Investments in equity-valued companies 17 1, ,035.4 Derivatives Non-current financial assets 18 1, ,014.7 Intangible assets Deferred tax assets Total non-current assets 5, ,169.7 Inventories Accounts receivable Current tax receivable Derivatives Current financial assets Prepaid expenses and accrued income Cash and cash equivalents Total current assets 1, ,658.4 Assets held for sale Total assets 7, ,082.9 CHF millions Shareholders equity and liabilities Share capital Capital reserves Retained earnings 2, ,808.6 Treasury shares Equity attributable to BKW shareholders 2, ,611.0 Equity attributable to non-controlling interests Total shareholders equity 2, ,654.9 Deferred tax liabilities Derivatives Non-current provisions 24 1, ,692.5 Non-current financial liabilities 25 1, ,213.4 Other non-current liabilities Total non-current liabilities 3, ,626.3 Other current liabilities Derivatives Current provisions Current financial liabilities Current tax liabilities Deferred income and accrued expenses Total current liabilities Liabilities held for sale Total liabilities 4, ,428.0 Total shareholders equity and liabilities 7, ,082.9
14 Consolidated Financial Statements of the BKW Group 09 Consolidated Financial Statements of the BKW Group Changes in Consolidated Equity Share capital Capital reserves Accumulated profit Currency translations Revaluation reserve available-for-sale financial assets Hedging reserves Treasury shares Attributable to BKW shareholders Attributable to non-controlling interests Total CHF millions Equity at , , ,904.7 Net loss Other comprehensive income Comprehensive income Dividend Transactions in treasury shares Share-based payments Reclassification due to new structure (BKW FMB Energy Ltd. shares not exchanged) Acquisition of non-controlling interests Contribution to equity from non-controlling interests Equity at , , ,654.9 Net profit Other comprehensive income Comprehensive income Dividend Share capital increase Transactions in treasury shares Share-based payments Acquisition of non-controlling interests Contribution to equity from non-controlling interests Changes in the scope of consolidation Equity at , , ,723.4 I 1 Due to squeeze-out of BKW FMB Energy Ltd. shares not exchanged for BKW Inc. shares (see Note 23).
15 10 Consolidated Financial Statements of the BKW Group Consolidated Financial Statements of the BKW Group Consolidated Cash Flow Statement Note CHF millions Profit/loss before income taxes (incl. discontinued operations) Adjustment for: Depreciation, amortisation and impairment Income from equity-valued companies Financial result (incl. discontinued operations) 7/ Gains/losses from sale of non-current assets Change in non-current provisions (excl. interest) Change in assigned rights of use Change from the valuation of energy derivatives Other non-cash positions Change in net current assets (excl. financial assets/liabilities and derivatives) Income taxes paid Other financial items paid Cash flow from operating activities Purchase of property, plant and equipment Proceeds from disposal of property, plant and equipment Acquisition of Group companies 6/ Disposal of Group companies Investments in equity-valued companies Disposals of equity-valued companies Investments in current and non-current financial assets Disposals of current and non-current financial assets Purchase of intangible assets Disposals of intangible assets Interest received Dividends received Cash flow from investing activities Sale/purchase of treasury shares Acquisition of non-controlling interests Contribution to capital from non-controlling interests Increase in current and non-current financial liabilities Decrease in current and non-current financial liabilities Increase in other non-current liabilities Decrease in other non-current liabilities Interest paid Dividends paid Cash flow from financing activities Translation adjustments on cash and cash equivalents Net change in cash and cash equivalents Cash and cash equivalents at start of reporting period Cash and cash equivalents at end of reporting period
16 Consolidated Financial Statements of the BKW Group 11 Consolidated Financial Statements of the BKW Group Notes to the Financial Statements 1 Description of business BKW Inc., Berne (CH), together with its Group companies, is a leading energy provider in Switzerland and delivers a comprehensive range of products and services to residential and business customers. Energy is sold in neighbouring countries via the Group s own sales channels. BKW covers the entire value chain, from the production, transmission and distribution to the trading and sale of energy. With a view to introducing a new holding structure, BKW Inc. had issued a public exchange offer for all registered BKW FMB Energy Ltd. shares in free float in October Shareholders in BKW FMB Energy Ltd. were offered a new BKW Inc. share with the same par value for each BKW FMB Energy Ltd. share tendered. The exchange offer was successfully concluded in December 2011, with a 99.31% take-up rate. BKW Inc. was listed on the SIX Swiss Exchange and BX Berne Exchange on 12 December Following the exchange offer, BKW introduced squeeze-out proceedings for the BKW FMB Energy Ltd. shares that had not been tendered for exchange. In its decision of 21 March 2012, the Commercial Court of the Canton of Berne declared the remaining registered BKW FMB Energy Ltd. shares in free float as being invalid. Holders of these BKW FMB Energy Ltd. shares that had been declared invalid therefore received BKW Inc. shares on a 1:1 basis. The additional BKW Inc. shares issued in this way were listed on 11 April BKW Inc. now has a share capital of CHF 132,000,000 and holds 100% of the shares in BKW FMB Energy Ltd. 2 Accounting principles 2.1 General principles The consolidated financial statements have been prepared in accordance with International Financial Reporting Standards (IFRS). They provide a true and fair view of the financial position, the results of operations and the cash flows of BKW. The financial statements also comply with Swiss company law. The closing date for the Group financial statements and those of its fully consolidated companies is 31 December. The statements are presented in Swiss francs (CHF). The consolidated financial statements have been prepared on the basis of historical acquisition costs. Exceptions are described in the Principles of accounting and valuation. 2.2 Adoption of new standards and interpretations in the 2012 financial year All standards and interpretations in force on the balance sheet date were applied in preparing the consolidated financial statements. No new or amended standards or interpretations were applied earlier than required. The following standards and interpretations applied to BKW for the first time in the 2012 financial year: Amendment to IAS 12 Deferred Tax: Recovery of Underlying Assets Amendment to IFRS 7 Disclosures Transfers of Financial Assets These changes had no effect on the presentation of the financial position, results of operations and cash flows of BKW. 2.3 Application of standards and interpretations from the 2013 financial year onwards The following new and amended standards and interpretations had been published by the balance sheet date but will not be applied until subsequent financial years. BKW intends to apply the changes from the date on which they enter into force (entry into force for financial years beginning on or after the dates in brackets): Amendment to IAS 1 Presentation of Financial Statements (1 July 2012) IFRS 10 Consolidated Financial Statements (1 January 2013) IFRS 11 Joint Arrangements (1 January 2013) IFRS 12 Disclosure of Interests in Other Entities (1 January 2013) IFRS 13 Fair Value Measurement (1 January 2013) Amendment to IAS 19 Employee Benefits (1 January 2013) Amendment to IAS 27 Separate Financial Statements (1 January 2013) Amendment to IAS 28 Investments in Associates (1 January 2013)
17 12 Consolidated Financial Statements of the BKW Group Amendments to IFRS 7 Financial Instruments: Disclosures (1 January 2013) IFRIC 20 Stripping Costs in the Production Phase of a Surface Mine (1 January 2013) Annual Improvements to IFRSs Cycle (1 January 2013) Amendments to IFRS 10, IFRS 11 and IFRS 12 Consolidated Financial Statements, Joint Arrangements and Dis closure of Interests in Other Entities: Transition Guidance (1 January 2013) Amendments to IAS 32 Financial Instruments: Presentation (1 January 2014) Amendments to IFRS 10, IFRS 12 and IAS 27 Investment Entities (1 January 2014) IFRS 9 Financial Instruments (1 January 2015) Some of these changes will apply to BKW for the first time during the 2013 financial year. The subsequent changes will have a significant influence on the presentation of BKW s financial position, results of operations and cash flows. Based on current information, BKW does not expect other changes or changes that will only enter into force for financial years from 2014 onwards to have any significant impact on its financial position, results of operation or cash flows Group accounting (IFRS 10/IFRS 11/IFRS 12) As part of the project to reform group accounting, IFRS 10, IFRS 11 and IFRS 12 are being applied for the first time during the 2013 financial year. The new standards replace the previously applicable rules on group accounting (primarily IAS 27 and IAS 31, and the interpretations SIC 12 and SIC 13): In particular, IFRS 10 contains a new definition of the concept of control to be applied when deciding on whether companies should be consolidated or not. IFRS 11 deals with joint arrangements. IFRS 12 deals with disclosures about an entity s interests in subsidiaries, joint arrangements, associates and unconsolidated structured entities. With regard to the investments held as at 31 December 2012, BKW does not expect the application of IFRS 10 to lead to any changes in the assessment of control and thus to any changes in the scope of consolidation. In contrast, the application of IFRS 11 is likely to mean that two investments that were previously accounted for using the equity method will now be disclosed in the consolidated financial statements in proportion to their share of assets and liabilities, and revenues and expenses. As a result of this change, the total assets of the BKW Group as at 1 January 2012 and 31 December 2012 will increase by CHF 40.1 million and CHF 7.4 million respectively, with total operating revenue for 2012 up by CHF 2.8 million. Equity, net profit for the year and earnings per share will remain unchanged. The application of IFRS 12 will create additional disclosure obligations in relation to interests in subsidiaries, joint arrangements and associates IAS 19 Employee Benefits The revised IAS 19 Employee Benefits contains various important changes. BKW currently applies the corridor method and charges to income the actuarial gains and losses from periodic recalculations of the defined benefit obligation provided they exceed the greater of 10% of plan assets and 10% of the defined benefit obligation on a straight-line basis over the average remaining period of service. Due to the elimination of the corridor method, actuarial gains and losses are now recognised in other comprehensive income in the period in which they occur. This is likely to result in greater volatility of the plan assets and obligations and hence also of consolidated equity. Also under the terms of the revised standard, a uniform discount rate must be applied to both the plan assets and the benefit obligation. Previously, the expected return on plan assets was estimated on the basis of the pension fund s investment portfolio and in accordance with the anticipated level of return. Additionally, the expected employee contributions to be made in future are to be included when determining the present value of the benefit obligation. This allocation of risk between employer and employees will alter the benefit obligation and allocation of the current service cost in future.
18 Consolidated Financial Statements of the BKW Group 13 The revised standard will be applied with effect from the 2013 financial year with the previous years figures being adjusted accordingly (restatement). As at 1 January 2012 and 31 December 2012, BKW s reported pension plan assets of CHF million and CHF million respectively will be reported as pension plan liabilities of approximately CHF 216 million and CHF 177 million respectively. Taking deferred income taxes into account, the consolidated equity as at 1 January 2012 or 31 December 2012 will fall by around CHF 249 million or CHF 217 million respectively. Personnel expenses for 2012 will increase by CHF 3.8 million, net profit will fall by CHF 3 million and earnings per share will decrease by CHF A further change expected as a result of the revision of IAS 19 relates to investments measured using the equity method. It is not yet possible to quantify this effect however. The application of the new IAS 19 rules is expected to result in net plan expenses increasing by some CHF 8 million in the 2013 financial year. 3 Consolidation principles 3.1 Consolidation method The financial statements are based on the closing statements of the individual Group companies drawn up according to Group-wide principles of valuation and presentation. Group companies are included in the consolidated financial statements in their entirety. Assets and liabilities as well as expenses and income are included in their entirety. Non-controlling interests in shareholders equity and in net income of the relevant Group companies are disclosed separately in consolidated equity and in the consolidated income statement. Intercompany income and expenditure as well as inter-company assets and liabilities are eliminated on consolidation. Interim profits on inter-company goods and services that have not yet been realised from sales to third parties are eliminated. 3.2 Investments in associates and joint ventures Investments in companies in which BKW is able to exercise significant influence but not overall control (generally share of voting rights of between 20% und 50%), are classified as associates and accounted for using the equity method. Companies which are jointly managed on the basis of contractual agreements between the shareholders (usually partner plants) are treated as joint ventures. Joint ventures are consolidated using the equity method, irrespective of the size of the holding. The closing date for some partner plants differs from that of BKW since these companies close their accounts on 30 September in line with the hydrological year. 3.3 Acquisition and sale of Group companies Companies acquired by BKW during the year are consolidated as from the effective date of acquisition. Net assets acquired are measured at fair value and integrated using the acquisition method. Differences between the higher purchase price and the fair value of net assets acquired are classified as goodwill from acquisitions. Any negative difference is immediately recognised in income. Group companies with regard to which BKW ceases to have control are excluded from consolidation as of the date on which control ceases to exist. The difference between the proceeds from the sale and the net assets disposed of is recognised in the income statement on the effective date. Goodwill still recorded in the balance sheet and accumulated foreign currency translation differences and value fluctuations for financial instruments charged to the statement of other comprehensive income are derecognised in income as a component or the gain or loss on sale.
19 14 Consolidated Financial Statements of the BKW Group 3.4 Foreign currency translations The reporting currency is Swiss francs (CHF). BKW records transactions in foreign currencies at the prevailing exchange rates on the transaction date. Exchange rate gains and losses arising from such transactions as well as the translation of foreign currency balances on the balance sheet date are charged to the financial result. Foreign-currency financial statements of Group companies outside Switzerland are converted to Swiss francs according to the following principles: balance sheet, at the prevailing exchange rate on 31 December; income statement, at average exchange rates for the reporting year; cash flow, at average exchange rates for the reporting year. Goodwill and adjustments made in the course of the purchase price apportionment to the carrying amounts of identified net assets of companies in foreign currency are carried in the foreign currency. Differences arising from the translation of the financial statements of Group companies, associates and joint ventures in foreign currencies are accounted for in other comprehensive income. 4 Principles of accounting and valuation 4.1 Presentation of sales Sales of energy to end customers and sales partners are considered as having been realised and are recorded as sales when delivery is complete. Energy-trading revenue is presented according to the underlying transaction motive. Energy transactions are conducted either for the purpose of actively managing the power plant base or for physical coverage of energy supply or purchase contracts. Such management transactions can be broken down into own-use and hedging transactions. The gross revenue from own-use transactions is recorded as sales ( Electricity Trading or Gas Business ) at the time of delivery. Hedging transactions result from extended production portfolio management for the purpose of engaging in additional transactions to hedge BKW s own production. These additional hedging transactions also fall under the definition of financial instruments. Other energy transactions are conducted with the sole intention of achieving a trading margin. These transactions also come under the definition of financial instruments. Energy transactions defined as financial instruments are measured at the fair value on the closing date, with realised as well as unrealised gains and losses from these transactions recorded net under Income from Energy Hedging and Income from Proprietary Energy Trading. The income from such transactions consists of two components: effective realised gains or losses from transactions in progress, and unrealised measurement gains and losses from measurement at fair value of the open contracts.
20 Consolidated Financial Statements of the BKW Group Financial instruments Financial instruments constitute all contractual agreements that give rise to financial assets for BKW and financial liabilities for a counterparty, and vice versa. Financial assets and liabilities are categorised as follows: financial assets or financial liabilities at fair value through profit or loss (financial instruments held for trading and derivatives); held-to-maturity investments (non-derivative financial assets with fixed or determinable payments and fixed maturity that the company intends and is able to hold to maturity); loans and receivables; available-for-sale financial assets (non-derivative financial assets that cannot be classified under any other category); financial liabilities at amortised cost. Financial assets are recorded and derecognised on the trade date. A standard valuation procedure is followed for each category of financial assets and liabilities. They are initially recognised at fair value. Transaction costs for financial instruments not categorised as at fair value through profit or loss are assigned to the acquisition or issuance of the financial instrument. For subsequent valuation, financial instruments categorised as at fair value through profit or loss are recorded in the balance sheet at fair value, and the related gains or losses are recorded in the income statement. Financial assets available for sale are also recorded at fair value in the balance sheet. While available-for-sale financial assets are measured at fair value, the gains or losses are recorded in other comprehensive income, unless they qualify as an impairment or the financial instrument is sold. In the event of impairment, disposal or other derecognition, the amount recorded in other comprehensive income is transferred to the income statement. Held-to-maturity investments, loans granted by and receivables due to BKW as well as liabilities incurred are carried at amortised cost using the effective interest method less impairments. Impairment is recognised if there are objective indications that the value of an asset is at risk. Assets carried at amortised costs are considered to be impaired if the carrying amount is higher than the present value of estimated future cash flows. Available-for-sale assets are considered to be impaired if the fair value is lower than the acquisition value. Equity instruments are considered to be impaired only if the decline in value is significant or prolonged. The fair value for a stock-exchange quoted share for which the market is assumed to be active is determined based on the published market price. The fair value of other financial instruments is determined using the discounted cash flow method or other recognised measurement methods. Financial assets are derecognised when the rights are realised or have expired, or when BKW hands over control. Financial liabilities are derecognised only when they are discharged. 4.3 Derivatives Energy derivatives BKW trades in contracts in the form of forwards with fixed and flexible profiles, and futures with electricity, gas, oil, coal and certificates as the underlying. Contracts concluded with the sole intention of achieving a trading margin, as well as hedging transactions resulting from extended production portfolio management, are treated as financial instruments and designated as energy derivatives. Transactions open on the balance sheet date are measured at fair value. BKW receivables in respect of counterparties are recorded under assets as positive replacement values (under Derivatives), while payables are recorded under liabilities as negative replacement values (under Derivatives). Ongoing transactions with positive or negative replacement values are netted if the respective contract terms provide for this, and settlement is legally enforceable and intended. Realised and unrealised gains and losses from energy derivatives are recorded as income from proprietary energy trading or as income from energy hedges as applicable within net revenue Hedge accounting Derivative financial instruments can be used to hedge fluctuations in the fair value of an asset or liability (fair value hedge) and to hedge exposure to variability in cash flows (cash flow hedge). This is done in accordance with the existing guidelines governing BKW s hedging and credit risk policy. They are measured at fair value.
21 16 Consolidated Financial Statements of the BKW Group To qualify as a hedging transaction, strict criteria must be met in terms of documentation, the effectiveness of a hedging instrument and the probability of occurrence. On conclusion of a hedging transaction, the relationship between the hedging instrument and the hedged position as well as the purpose and strategy of risk hedging must be documented. The effectiveness of the hedging relationship is assessed and documented at the inception of the hedge and throughout its duration. Changes in the value of financial instruments which are used to hedge the fair value of a balance sheet item and are highly effective (qualification as a fair value hedge) are recognised in profit or loss together with the respective change in fair value of the underlying asset or liability. The effective portion of the gain or loss on financial instruments that qualify as cash flow hedges is recognised in other comprehensive income. The ineffective portion of the gain or loss is recognised in profit or loss. Realised and unrealised changes in the value of financial instruments that serve economically and according to Group guidelines to hedge against exchange rate and interest rate risks related to ongoing business activities, but which do not qualify as hedging transactions, are charged to income as financial income/expenses. 4.4 Property, plant and equipment Property, plant and equipment are recorded at acquisition or manufacturing cost less accumulated depreciation and impairment losses recognised. Depreciation is calculated systematically using the straight-line method and based on the useful lives of the assets. The useful lives and indications of impairment are annually reviewed. Impairments in respect of property, plant and equipment are determined according to the principles set forth in Note Property, plant and equipment dependent on concessions that are revertible without compensation are written down at most over the expected term of the concession. Present values of estimated decommissioning and disposal costs are charged to the balance sheet together with acquisition or manufacturing costs (see also Note 4.15). Fuel elements produced specifically for the nuclear power plant are disclosed in the balance sheet under property, plant and equipment. They are written down on the basis of wear and tear (burn-up). For long-term investment projects the borrowing interest is charged to the balance sheet during the set-up phase. Land is valued at acquisition cost. Depreciation is recorded only in the event of impairment. The costs of repairs and maintenance with no added value are charged to the income statement as incurred. They are carried as assets only if the costs extend the original useful life or give rise to other significant economic benefits (cost reduction, increase in earnings). Costs incurred due to legal requirements that generate no direct future benefit are capitalised only if and when this enables other assets to generate benefits. The estimated useful lives of property, plant and equipment lie within the ranges listed below and are unchanged compared with the previous year: Buildings Power plants Transmission and distribution eqpt. IT systems Operating equipment and vehicles Fuel elements 50 years 20 to 80 years 20 to 50 years 10 to 30 years 3 to 20 years after burn-up 4.5 Intangible assets Intangible assets cover rights of use and contractual or legal rights acquired as a result of acquisitions, as well as software, goodwill and certificates. Rights of use are contractually agreed one-off amounts to compensate a contractual partner for the use of its operating installations as well as licences for the construction and operation of BKW s own installations. Rights of use and intangible assets obtained as a result of an acquisition are written down over the period of use, or at most the contract period, using the straight-line method.
BKW Group Financial Report 2013
 BKW Group Financial Report 2013 The BKW Group is one of Switzerland s largest energy companies. It employs more than 3,000 people, with its partners supplies around one million people with electricity,
BKW Group Financial Report 2011
 BKW Group Financial Report 2011 The BKW Group is one of Switzerland s largest energy companies. It employs more than 2,800 people and covers all stages of energy supply: from production and transmission
BKW Group Half-Year Report 2014
 BKW Group Half-Year Report 2014 Facts & Figures BKW Group Electricity business GWh 2014 2013 2013 Sales Electricity sales Switzerland 3,456 3,903 7,536 Electricity sales International 832 874 1,762 Electricity
59 Consolidated Financial Statements of the BKW Group
 Financial Review 56 Financial Result 59 Consolidated Financial Statements of the BKW Group 108 Holdings 111 Report of the Group Auditors 112 Financial Statements of BKW 120 Appropriation of Retained Earnings
BKW GROUP. Annual Report Income Expenses. = efficient financial year
 BKW GROUP Annual Report 2016 20 16 Income Expenses = efficient financial year For three years now, we have consistently pursued our three-pillar strategy of strengthening energy, de veloping networks and
BKW GROUP. Annual Report 2017
 BKW GROUP Annual Report 2017 20 17 = successful result 2 ANNUAL REPORT 2017 Facts & Figures Facts & Figures Financials CHF millions 2013 2014 2015 2016 2017 Total operating revenue 1 2,733.7 2,844.9 2,645.0
Leading provider of comprehensive energy services
 Leading provider of comprehensive energy services Suzanne Thoma, CEO Beat Grossenbacher, CFO Overview Financials FY 2013 and Outlook Strategy Summary page 2 Continued challenging business environment Neighbouring
BKW GROUP. Half-Year Report 2017
 BKW GROUP Half-Year Report 2017 FACTS & FIGURES BKW Group Financials (restated) (restated) 2017 Total operating revenue 2,490.0 1,190.0 1,297.7 Operating profit 383.6 171.0 181.9 Net profit 322.1 124.0
Financial Report Axpo Holding AG
 Financial Report 2015 16 Axpo Holding AG Table of Contents Financial Report Section A: Financial summary Financial review 4 Section B: Consolidated financial statements of the Axpo Group Consolidated
Half-Year Report 2015
 BKW GROUP Half-Year Report 2015 20 15 First half-year FACTS & FIGURES BKW Group Electricity business GWh 2014 2015 2014 Sales Sales Switzerland 3,456 3,421 6,784 Sales International 832 1,031 1,687 Market
BKW Group Half-Year Report 2009
 BKW Group Half-Year Report 2009 Facts & Figures BKW Group Electricity business GWh 1 st half-year 2009 1 st half-year 2008 2008 Sales Electricity sales Switzerland 4,095 4,133 7,978 Electricity sales International
CONSOLIDATED FINANCIAL STATEMENTS
 CONSOLIDATED FINANCIAL STATEMENTS FOR THE YEAR ENDED 31 DECEMBER ENDESA, S.A. AND SUBSIDIARIES CONSOLIDATED STATEMENTS OF FINANCIAL POSITION AT 31 DECEMBER AND 31 DECEMBER ASSETS 31 December 31 December
CONSOLIDATED FINANCIAL STATEMENTS
 CONSOLIDATED FINANCIAL STATEMENTS FOR THE SIX MONTHS ENDED 30 JUNE 2017 ENDESA, S.A. AND SUBSIDIARIES CONSOLIDATED STATEMENTS OF FINANCIAL POSITION AT 30 JUNE 2017 AND 31 DECEMBER 2016 (*) Unaudited ASSETS
EDP Renováveis, S.A. Condensed Consolidated Financial Statements 30 June 2012
 EDP Renováveis, S.A. Condensed Consolidated Financial Statements 30 June 2012 EDP Renováveis, S.A. and subsidiaries Condensed Consolidated Income Statement for the six months period ended 30 June 2012
Leading provider of comprehensive energy and infrastructure services
 BKW COMPANY PRESENTATION, 19 MARCH 2015 Leading provider of comprehensive energy and infrastructure services Suzanne Thoma, CEO / Ronald Trächsel, CFO Overview Financials FY 2014 Outlook and Strategy Summary
Abertis Telecom Terrestre, S.A.U. and Subsidiaries
 Abertis Telecom Terrestre, S.A.U. and Subsidiaries Unaudited special purpose segmented financial statements for the terrestrial telecommunications business of ABERTIS TELECOM TERRESTRE, S.A.U. and subsidiaries
Annual Report Axpo Trading AG
 Annual Report 2016 17 2 Key figures 2016/17 2015/16 2014/15 restated 2013/14 restated 2012/13 Axpo Trading Group Total income CHF million 3 949.5 3 989.8 4 621.5 5 001.5 4 752.6 Gross margin 1 CHF million
The BKW Group «We are shaping the future of energy straightforward, reliable and integrated»
 The BKW Group «We are shaping the future of energy straightforward, reliable and integrated» COMPANY PRESENTATION, LONDON 28.04.2016 ROADSHOW LONDON BKW 28.04.2016 Contents Overview Financial results 2015
Consolidated Financial Statements
 Gedeon Richter Consolidated Financial Statements 2013 Consolidated Financial Statements Table of Contents Consolidated Income Statement 6 Consolidated Statement of Comprehensive Income 6 Consolidated Balance
TABLE OF CONTENTS. Financial Review 71
 TABLE OF CONTENTS Financial Review 71 Consolidated Financial Statements 74 Consolidated Income Statement for the Year Ended 31 December 74 Consolidated Statement of Comprehensive Income for the Year Ended
Financial section. rec tic el // a n n u a l r e po rt
 04 // Financial section 79 04 rec tic el // a n n u a l r e po rt 2 0 0 8 // Table of contents I. // DEFINITIons 81 II. // FINANCIAL STATEMENTS 82 II.1. Consolidated income statement 82 II.2. Consolidated
9. Share-Based Payments Jointly Controlled Entities Other Operating Income Other Operating Expense 130
 92 Financial Report Detailed contents: Consolidated financial statements Consolidated Income Statement for the year ended 31 December Consolidated Statement of Comprehensive Income for the year ended 31
ABERTIS INFRAESTRUCTURAS, S.A. Financial Statements and Directors' Report for the year ended 31 December 2016
 ABERTIS INFRAESTRUCTURAS, S.A. Financial Statements and Directors' Report for the year ended 31 December 2016 CONTENTS Balance sheets as at 31 December... 2 Statements of profit or loss... 4 Statements
- JCDECAUX SA - COMMENTS ON THE TRANSITION TO IFRS AND FIGURES
 - JCDECAUX SA - COMMENTS ON THE TRANSITION TO IFRS AND FIGURES Pursuant to EC Regulation No. 1606/2002 and in accordance with IFRS 1 First-time Adoption of IFRS, the JCDecaux Group consolidated financial
CONSOLIDATED INCOME STATEMENT
 CONSOLIDATED FINANCIAL STATEMENTS 94 CONSOLIDATED INCOME STATEMENT Note 2015 % 2014 % January 1 to December 31, (except per-share amounts) Net revenues 8 2 077 425 100.0 1 932 571 100.0 Cost of goods and
2007 Financial Statements. Consolidated Financial Statements of the Nestlé Group Financial Statements of Nestlé S.A.
 2007 Financial Statements Consolidated Financial Statements of the Nestlé Group Financial Statements of Nestlé S.A. Consolidated Financial Statements of the Nestlé Group Principal exchange rates...2 Consolidated
Bank Muscat (SAOG) NOTES TO THE CONSOLIDATED FINANCIAL STATEMENTS YEAR ENDED 31 DECEMBER 2012
 NOTES TO THE CONSOLIDATED FINANCIAL STATEMENTS YEAR ENDED 31 DECEMBER 2012") YEAR ENDED 1 LEGAL STATUS AND PRINCIPAL ACTIVITIES Bank Muscat (SAOG) (the Bank or the Parent Company) is a joint stock company incorporated in the Sultanate of Oman and is engaged in commercial and investment
YEAR ENDED 1 LEGAL STATUS AND PRINCIPAL ACTIVITIES Bank Muscat (SAOG) (the Bank or the Parent Company) is a joint stock company incorporated in the Sultanate of Oman and is engaged in commercial and investment
Consolidated. Separate Financial Statements. thereto at 31 December of Astaldi S.p.A Shareholders Call 28. Corporate Bodies 30
 annual report Separate Consolidated Financial annual Statements and report Notes thereto at 31 December 2013 Shareholders Call 28 Corporate Bodies 30 Management Report 32 Statement pursuant to Article
Individual Annual Accounts and Management Report Junta General de Accionistas. Annual Shareholders Meeting
 Individual Annual Accounts and Management Report 2018 Junta General de Accionistas Annual Shareholders Meeting Cellnex Telecom, S.A. Financial Statements for the year ended 31 December 2017 and
Interim Report January March
 2018 Interim Report January March KPIs In CHF million, except where indicated 31.3.2018 31.3.2017 Change Revenue and results Net revenue 1 2,885 2,831 1.9% Operating income before depreciation and amortisation
BE VANDEMOORTELE NV 3 KEY FINANCIAL FIGURES
 BE 0429 977 343 VANDEMOORTELE NV 3 KEY FINANCIAL FIGURES BE 0429 977 343 VANDEMOORTELE NV 4 BE 0429 977 343 VANDEMOORTELE NV 5 CONSOLIDATED INCOME STATEMENT As the shares are not traded in a public market,
Group annual financial statements
 61 Group annual financial statements The consolidated annual financial statements include all of s subsidiaries. They have been produced in accordance with International Financial Reporting Standards (IFRS)
Schindler in brief To the shareholders Elevators & Escalators. Corporate Citizenship Overview of financial results Financial calendar
 Global challenges. First-class solutions. Financial Statements and Corporate Governance 2 Schindler in brief To the shareholders Elevators & Escalators Corporate Citizenship Overview of financial results
Finance Report Excerpt from the 46 th Annual Report 2008/2009. EMS-CHEMIE HOLDING AG Domat/Ems Switzerland
 Finance Report 2008 Excerpt from the 46 th Annual Report 2008/2009 EMS-CHEMIE HOLDING AG Domat/Ems Switzerland Contents EMS Group Spotlight on Share Performance 2 Key Figures 2004-2008 3 Consolidated Income
 ABERTIS INFRAESTRUCTURAS, S.A. Financial Statements and Directors' Report for the year ended 31 December 2017 CONTENTS Balance sheets as at 31 December... 2 Statements of profit or loss... 4 Statements
Annual Report Financial Statements Corporate Governance. Schindler
 Annual Report 2004 Financial Statements Corporate Governance Schindler Contents 4 6 7 8 9 10 49 Financial Statements Consolidated balance sheet Consolidated profit and loss statement Conclusion of the
Notes Statkraft AS Group
 STATKRAFT AS GROUP FINANCIAL STATEMENTS Notes Statkraft AS Group Index of notes to the consolidated financial statements General Note 1 Note 2 Note 3 Note 4 Note 5 General information and summary of significant
Schaffner Group. Half-Year Report 2013/14
 Schaffner Group Half-Year Report 2013/14 To our shareholders 1 Considerable improvement of net sales and profits The Schaffner Group made significant progress in implementing its strategy in the first
International Petroleum Investment Company PJSC and its subsidiaries CHAIRMAN S REPORT AND CONSOLIDATED FINANCIAL STATEMENTS
 International Petroleum Investment Company PJSC and its subsidiaries CHAIRMAN S REPORT AND CONSOLIDATED FINANCIAL STATEMENTS 31 DECEMBER 2011 International Petroleum Investment Company PJSC and its subsidiaries
CONSOLIDATED FINANCIAL STATEMENTS
 12.31. CONSOLIDATED FINANCIAL STATEMENTS (Unaudited figures) CONSOLIDATED FINANCIAL STATEMENTS... 1 CONSOLIDATED BALANCE SHEET - ASSETS... 1 CONSOLIDATED BALANCE SHEET - LIABILITIES... 2 CONSOLIDATED
2 To the shareholders. 15 Statement of the Board of Directors. 5 Overview of financial results
 High-quality solutions for rising demands. Financial Statements and Corporate Governance 212 Content Group Review 212 1 Schindler in brief 2 Schindler in brief 2 To the shareholders 15 Statement of the
Accounting policies Year ended 31 March The numbers
 Accounting policies Year ended 31 March 2014 Basis of preparation The consolidated and Company financial statements have been prepared on a historical cost basis. They are presented in sterling and all
Financial Report 2011
 Financial Report 2011 8 orell füssli 1 financial statements of the orell füssli group 10 1.1 consolidated income statement 1.2 consolidated balance sheet at 31 december 1.3 consolidated cash flow statement
IFRS INDIVIDUAL FINANCIAL STATEMENTS
 IFRS INDIVIDUAL FINANCIAL STATEMENTS 2017 IFRS individual financial statements at 31 December 2017 IFRS INDIVIDUAL FINANCIAL STATEMENTS AT 31 DECEMBER 2017 2 Income statement 2 Statement of comprehensive
GRUPA LOTOS S.A. FINANCIAL HIGHLIGHTS
 FINANCIAL HIGHLIGHTS PLN 000 EUR 000 Dec 31 2015 Dec 31 2014 Dec 31 2015 Dec 31 2014 Revenue 20,482,298 26,243,106 4,894,451 6,264,318 Operating profit/(loss) 183,757 (1,294,183) 43,911 (308,926) Pre-tax
Chapter 6 Financial statements
 Chapter 6 Financial statements Consolidated statement of financial position 51 Consolidated income statement 52 Consolidated statement of comprehensive income 52 Consolidated statement of cash flows 53
BLUESCOPE STEEL LIMITED FINANCIAL REPORT 2011/2012
 BLUESCOPE STEEL LIMITED FINANCIAL REPORT / ABN 16 000 011 058 Annual Financial Report - Page Financial statements Statement of comprehensive income 2 Statement of financial position 3 Statement of changes
PHOENIX Pharmahandel GmbH & Co KG Pfingstweidstraße Mannheim Germany PHOENIX group
 PHOENIX Pharmahandel GmbH & Co KG Pfingstweidstraße 10-12 68199 Mannheim Germany www.phoenixgroup.eu PHOENIX group WE GO FORWARD Half-year report February to July 2014 PHOENIX group We deliver health.
A n n u a l f i n a n c i a l r e s u l t s
 A n n u a l f i n a n c i a l r e s u l t s DIRECTORS STATEMENT The directors of Air New Zealand Limited are pleased to present to shareholders the Annual Report* and financial statements for Air New
DECLARATION BY RESPONSIBLE PERSONS
 DECLARATION BY RESPONSIBLE PERSONS The undersigned Chairman of the Management Committee and Chief Executive Officer Chris Peeters and Chief Financial Officer Catherine Vandenborre declare that to the best
Financial Statements
 Elenia Finance Oyj Financial Statements 1 January 2015-31 December 2015 Business ID 2584057-5 Unofficial translation from Finnish to English 1 Table of Content pages Elenia Finance Group, Report of the
Profit/(Loss) before income tax 112, ,323. Income tax benefit/(expense) 11 (31,173) (37,501)
 before income tax 112, ,323. Income tax benefit/(expense) 11 (31,173) (37,501)") Income statement For the year ended 31 July Note 2013 2012 Continuing operations Revenue 2,277,292 2,181,551 Cost of sales (1,653,991) (1,570,657) Gross profit 623,301 610,894 Other income 7 20,677 10,124
Income statement For the year ended 31 July Note 2013 2012 Continuing operations Revenue 2,277,292 2,181,551 Cost of sales (1,653,991) (1,570,657) Gross profit 623,301 610,894 Other income 7 20,677 10,124
Notes to the Accounts
 Notes to the Accounts 1. Accounting Policies Statement of compliance The Group financial statements consolidate those of the Company and its subsidiaries (together referred to as the Group ), equity account
Statements Chapter 5 CHAPTER 5 STATEMENTS I. FINANCIAL STATEMENTS 71 II. CORPORATE RESPONSIBILTY STATEMENTS 141
 CHAPTER 5 STATEMENTS I. FINANCIAL STATEMENTS 71 II. CORPORATE RESPONSIBILTY STATEMENTS 141 70 I. FINANCIAL STATEMENTS Consolidated statement of financial position 72 Consolidated income statement 73 Consolidated
IFRS-compliant accounting principles
 IFRS-compliant accounting principles Since 1 January 2005, Uponor Corporation has prepared its consolidated financial statements in compliance with the following accounting principles: Main functions Uponor
Preprint. Financial report. Consolidated financial statements of Helvetia Group. Consolidated income statement
 Consolidated financial statements of Helvetia Group 70 71 Consolidated income statement Consolidated statement of comprehensive income 72 Consolidated balance sheet 74 76 Consolidated statement of equity
Atel Group. Financial Report 2007
 Atel Group Financial Report 2007 Key figures 2007 Atel Group +/ variance 2006 2007 in % (based on CHF) 2006 CHF million 2007 CHF million 2006 EUR million 2007 EUR million Energy sales (TWh) 11.4 115.642
Coca-Cola Hellenic Bottling Company S.A Annual Report
 Annual Report Independent auditor s report To the Shareholders of the We have audited the accompanying consolidated financial statements of and its subsidiaries (the Group ) which comprise the consolidated
Annual Report for publication purposes
 Annual Report 2013 for publication purposes 2 Table of contents 1. Report from the Supervisory Board 4 2. Report from the Management Board 6 3. 2013 Financial Statements 11 4. Other information 74 3 1
idated Ffinancial statements Notes to the consolidated financial statements Financial statements of Swisscom Ltd
 idated Ffinancial statements Consolidated financial statements Notes to the consolidated financial statements Consolidated statement of comprehensive income 94 Consolidated balance sheet 95 Consolidated
ACERINOX, S.A. AND SUBSIDIARIES. 31 December 2015
 ACERINOX, S.A. AND SUBSIDIARIES Annual Accounts of the Consolidated Group 31 December 2015 (Free translation from the original in Spanish. In the event of discrepancy, the Spanishlanguage version prevails.)
ACCOUNTING POLICIES. for the year ended 30 June MURRAY & ROBERTS ANNUAL FINANCIAL STATEMENTS 13
 12 MURRAY & ROBERTS ANNUAL FINANCIAL STATEMENTS 13 ACCOUNTING POLICIES for the year ended 30 June 2013 1 PRESENTATION OF FINANCIAL STATEMENTS These accounting policies are consistent with the previous
Gedeon Richter Consolidated Financial Statements 2014
 Gedeon Richter Consolidated Financial Statements Consolidated Financial Statements Table of contents Consolidated Income Statement 6 Consolidated Statement of Comprehensive Income 6 Consolidated Balance
Notes to the consolidated financial statements
 Notes to the consolidated financial statements Basic information on the company Elisa Corporation ( Elisa or the Group ) engages in telecommunications activities, providing data communications services
Notes to the consolidated financial statements A. General basis of presentation
 86 Notes to the consolidated financial statements A. General basis of presentation Accounting principles The consolidated financial statements of Franz Haniel & Cie. GmbH, Duisburg, for the year ended
2012 Year ended 31 December 2012 Alpiq Ltd. Group (Part of the Alpiq Group)
") 2012 Year ended 31 December 2012 Alpiq Ltd. Group (Part of the Alpiq Group) 2 / 2012 Financial Highlights Alpiq Ltd. Group Results of operations before exceptional items Results under IFRS after exceptional
2012 Year ended 31 December 2012 Alpiq Ltd. Group (Part of the Alpiq Group) 2 / 2012 Financial Highlights Alpiq Ltd. Group Results of operations before exceptional items Results under IFRS after exceptional
CONSOLIDATED FINANCIAL STATEMENTS 31 DECEMBER 2013
 134 Aramex PJSC and its subsidiaries CONSOLIDATED FINANCIAL STATEMENTS 31 DECEMBER 135 136 137 Aramex PJSC and its subsidiaries CONSOLIDATED FINANCIAL STATEMENTS 31 DECEMBER Consolidated Statement of Financial
ACCOUNTING POLICIES Year ended 31 March The numbers
 ACCOUNTING POLICIES Year ended 31 March 2015 Basis of preparation The consolidated and Company financial statements have been prepared on a historical cost basis. They are presented in sterling and all
LUBELSKI WĘGIEL BOGDANKA SPÓŁKA AKCYJNA
 LUBELSKI WĘGIEL BOGDANKA SPÓŁKA AKCYJNA FINANCIAL STATEMENTS for the financial year from 1 January 2016 to 31 December 2016 BOGDANKA, MARCH 2017 CONTENTS OF THE FINANCIAL STATEMENTS STATEMENT OF FINANCIAL
OAO SIBUR Holding. International Financial Reporting Standards Consolidated Financial Statements and Independent Auditor s Report.
 OAO SIBUR Holding International Financial Reporting Standards Consolidated Financial Statements and Independent Auditor s Report 31 December 2013 IFRS CONSOLIDATED STATEMENT OF PROFIT OR LOSS (In millions
THE GALA CORAL GROUP PRELIMINARY INTERNATIONAL FINANCIAL REPORTING STANDARDS (IFRS) TRANSITION STATEMENTS
 TRANSITION STATEMENTS") THE GALA CORAL GROUP PRELIMINARY INTERNATIONAL FINANCIAL REPORTING STANDARDS (IFRS) TRANSITION STATEMENTS INTRODUCTION Implementation of International Financial Reporting Standards ( IFRS ) For the year
THE GALA CORAL GROUP PRELIMINARY INTERNATIONAL FINANCIAL REPORTING STANDARDS (IFRS) TRANSITION STATEMENTS INTRODUCTION Implementation of International Financial Reporting Standards ( IFRS ) For the year
Acerinox, S.A. and Subsidiaries
 Acerinox, S.A. and Subsidiaries Consolidated Annual Accounts 31 December 2016 Consolidated Directors' Report 2016 (With Auditors Report Thereon) (Free translation from the original in Spanish. In the event
Notes to the Consolidated Accounts For the year ended 31 December 2017
 National Express Group PLC Annual Report Financial Statements 119 Notes to the Consolidated Accounts 1 Corporate information The Consolidated Financial Statements of National Express Group PLC and its
ENDESA, S.A. and Subsidiaries
 ENDESA, S.A. and Subsidiaries Quarterly Report for the period January-September (Translation from the original issued in Spanish. In the event of discrepancy, the Spanish-language version prevails) Madrid,
financial statements 2017
 financial statements 2017 1. Consolidated balance sheet 60 18. Provisions 84 2. Consolidated income statement 61 19. Trade and other payables 87 3. Consolidated statement of comprehensive income 62 20.
F Notes to the Consolidated Financial Statements.
 F Notes to the Consolidated Financial Statements. 192 1. Significant accounting policies 203 2. Accounting estimates and assessments 205 3. Significant acquisitions and dispositions of interests in companies
J&T FINANCE GROUP, a.s. and Subsidiary Companies
 J&T FINANCE GROUP, a.s. and Subsidiary Companies Consolidated Financial Statements Year ended 31 December 2013 CONSOLIDATED INCOME STATEMENT For the year ended 31 December 2013 In thousands of EUR Note
FINANCIAL STATEMENTS 2011
 FINANCIAL STATEMENTS 2011 Financial Statements 4 Group s IFRS Financial Statements 4 Consolidated Comprehensive Income Statement, IFRS 5 Consolidated Balance Sheet, IFRS 6 Statement of Changes in Equity,
BURGAN BANK GROUP CONSOLIDATED FINANCIAL STATEMENTS 31 DECEMBER 2009
 CONSOLIDATED FINANCIAL STATEMENTS 31 DECEMBER 2009 Consolidated Statement of Financial Position 2009 2008 Notes (Restated) ASSETS Cash and cash equivalents 3 602,088 550,955 Treasury bills and bonds with
PAO SIBUR Holding. International Financial Reporting Standards Consolidated Financial Statements and Independent Auditor s Report.
 PAO SIBUR Holding International Financial Reporting Standards Consolidated Financial Statements and Independent Auditor s Report 31 December 2017 Table of Contents Independent Auditor s Report IFRS Consolidated
DIAMOND BANK PLC CONSOLIDATED FINANCIAL STATEMENT FOR THE QUARTER ENDED 31 MARCH 2013
 DIAMOND BANK PLC CONSOLIDATED FINANCIAL STATEMENT FOR THE QUARTER ENDED 31 MARCH 2013 1. General information Diamond Bank Plc (the "Bank") was incorporated in Nigeria as a private limited liability company
YIOULA GLASSWORKS S.A. AND SUBSIDIARIES NOTES TO THE CONSOLIDATED FINANCIAL STATEMENTS JUNE 30, 2011
 1. CORPORATE INFORMATION: Yioula Glassworks S.A., a corporation formed under the laws of the Hellenic Republic (also known as Greece), οn August 5, 1959, by Messrs Kyriacos and Ioannis Voulgarakis is the
Consolidated Financial Statements of the Nestlé Group 2013
 Consolidated Financial Statements of the Nestlé Group 2013 71 73 74 75 76 78 79 80 80 91 94 99 100 102 103 107 108 116 117 119 128 130 131 132 134 137 138 140 147 148 150 152 154 Principal exchange rates
Annual Report Financial Statements. Schindler
 Annual Report 2001 Financial Statements Schindler Contents 2 3 4 5 6 7 37 39 Consolidated balance sheet Consolidated profit and loss statement Consolidated cash flow statement Statement of shareholders
Amadeus IT Group, S.A. Auditors Report, Annual Accounts and Directors Report for the year ended December 31, 2014
 Amadeus IT Group, S.A. Auditors Report, Annual Accounts and Directors Report for the year ended December 31, 2014 Amadeus IT Group, S.A. Auditors Report for the year ended December 31, 2014 Amadeus IT
Accounting policies Year ended 31 March The numbers
 Accounting policies Year ended 31 March Basis of preparation The consolidated and Company financial statements have been prepared on a historical cost basis. They are presented in sterling and all values
Good First-time Adopter (International) Limited
 Limited") Good First-time Adopter (International) Limited International GAAP Illustrative financial statements of a first-time adopter for the year ended 31 December 2012 Based on International Financial Reporting
Good First-time Adopter (International) Limited International GAAP Illustrative financial statements of a first-time adopter for the year ended 31 December 2012 Based on International Financial Reporting
Net income for the period % %
 QUARTERLY STATEMENT Q3 2018 Key figures KION Group overview in million Q3 2018 Q3 2017 * Change Q1 Q3 2018 Q1 Q3 2017 * Change Order intake 2,060.3 1,847.2 11.5% 6,369.3 5,699.5 11.8% Revenue 1,895.9 1,832.4
International Financial Reporting Standards Consolidated Financial Statements and Auditors Report
 JSC Chelyabinsk Zinc Plant International Financial Reporting Standards Consolidated Financial Statements and Auditors Report For the years ended 31 December 2005, 2004 and 2003 Contents STATEMENT OF MANAGEMENT
Financial Statements for the year ended December 31 st, 2006 in accordance with International Financial Reporting Standards («IFRS»)
") INFO-QUEST S.A. Financial Statements for the year ended December 31 st, 2006 in accordance with International Financial Reporting Standards («IFRS») The attached financial statements have been approved
INFO-QUEST S.A. Financial Statements for the year ended December 31 st, 2006 in accordance with International Financial Reporting Standards («IFRS») The attached financial statements have been approved
Group Income Statement For the year ended 31 March 2015
 Income Statement For the year ended 31 March Note Pre exceptionals Restated Exceptionals (note 11) Pre exceptionals Exceptionals (note 11) Continuing operations Revenue 5 10,606,080 10,606,080 11,044,763
Notes to the Group financial statements
 110 Financial statements Notes to the Group financial statements Notes to the Group financial statements for the year ended 31 March 1. Corporate information Experian plc (the Company ), the ultimate parent
Interim Report. First Quarter of Fiscal siemens.com. Energy efficiency. Intelligent infrastructure solutions. Next-generation healthcare
 Energy efficiency Next-generation healthcare Industrial productivity Intelligent infrastructure solutions Interim Report First Quarter of Fiscal 2014 siemens.com Key to references REFERENCE WITHIN THE
MCI VENTURE PROJECTS LIMITED VI JOINT-STOCK PARTNERSHIP. Financial statements for a period
 0 MCI VENTURE PROJECTS LIMITED VI JOINT-STOCK PARTNERSHIP Financial statements for a period 01.11.2015 31.10.2016 Monitor ERP System Polska Spółka z ograniczoną odpowiedzialnością 1 Financial statements
Directors Report 3. Income Statements 4. Statements of Changes in Equity 5. Balance Sheets 6. Statements of Cash Flows 7-8
 Rakon Limited Annual Report 2009 Table of Contents Directors Report 3 Income Statements 4 Statements of Changes in Equity 5 Balance Sheets 6 Statements of Cash Flows 7-8 Notes to Financial Statements
International Financial Reporting Standard 1 First-time Adoption of International Financial Reporting Standards
 International Financial Reporting Standard 1 First-time Adoption of International Financial Reporting Standards Objective 1 The objective of this IFRS is to ensure that an entity s first IFRS financial
Edisun Power Europe Ltd Universitätstrasse Zurich. Consolidated Interim Financial Statements (unaudited) June 30, 2016
 June 30, 2016") Edisun Power Europe Ltd Universitätstrasse 51 8006 Zurich Consolidated Interim Financial Statements (unaudited) June 30, 2016 Consolidated Interim Balance Sheet (unaudited) Notes 30.06.2016 31.12.2015
Edisun Power Europe Ltd Universitätstrasse 51 8006 Zurich Consolidated Interim Financial Statements (unaudited) June 30, 2016 Consolidated Interim Balance Sheet (unaudited) Notes 30.06.2016 31.12.2015
May & Baker Nig Plc RC. UNAUDITED CONSOLIDATED FINANCIAL STATEMENTS 31 MARCH 2017
 ` May & Baker Nig Plc RC. 558 UNAUDITED CONSOLIDATED FINANCIAL STATEMENTS 31 MARCH 2017 UNAUDITED CONSOLIDATED STATEMENT OF PROFIT OR LOSS AND OTHER COMPREHENSIVE INCOME Note Continuing operations Revenue
ST. KITTS-NEVIS-ANGUILLA NATIONAL BANK LIMITED
 Consolidated balance sheet As of June 30, 2013 ASSETS Notes Cash and balances with Central Bank 6 355,574 254,466 Treasury bills 7 137,962 99,179 Deposits with other financial institutions 8 526,884 418,865
FINANCIAL STATEMENTS CONSOLIDATED BALANCE SHEET PROVISIONS CONSOLIDATED INCOME STATEMENT TRADE AND OTHER PAYABLES 84
 56 AALBERTS INDUSTRIES N.V. ANNUAL REPORT 2015 1. CONSOLIDATED BALANCE SHEET 58 18. PROVISIONS 81 2. CONSOLIDATED INCOME STATEMENT 59 19. TRADE AND OTHER PAYABLES 84 3. CONSOLIDATED STATEMENT OF COMPREHENSIVE