Content. Message from the President. Fund Manager s Report. Independent Auditors Report. Statements of Financial Position
|
|
|
- Nathaniel Grant
- 6 years ago
- Views:
Transcription

1
2 Content Message from the President Fund Manager s Report Independent Auditors Report Statements of Financial Position Statements of Comprehensive Income Statements of Changes in Net Assets Attributable to Unitholders Statements of Cash Flows Notes to Financial Statements


3 Message from the president and Chief Executive Officer Dear Valued Policyholder, I am very happy to report to you that 2017 was a banner year for us, and for the life insurance industry as a whole. Allow me first to thank you all for allowing Insular Life to be a part of your strategy to plan for the future. It is an honor for us to help you gain peace of mind in the present and offer you an assurance of a bright tomorrow. It is for this reason that we work so hard to deliver to you only our very best performance, year after year. Moreover, as you know, our business does not exist in a vacuum, but rather, as an integral part of both the local economy and in part, with the global market. Thus, any movements in these areas where our business is situated, creates a ripple effect to the performance of Insular Life. Nonetheless, we have provided you with great results in both good and difficult years, and 2017 is one of the best years. As I have mentioned earlier, the past year was a great one for life insurance, in general. This is because our economy grew 6.7% Annual for 2017 per PSA as measured by the Gross Domestic Product (GDP). The GDP measures the total value of final goods and services produced in the country. It is the most popular method of measuring an economy s output and is therefore considered a measure of the size of an economy. Growth in the GDP can be explained by the administration s increased spending in infrastructure that focuses on the transportation system nationwide and other mega projects. This so-called Build-Build-Build strategy has seen the construction of such projects as PNR South Railway, South Integrated Transport Service, Quezon Avenue Rapid Bus Transit, PNR North Railway, Mindanao Railway, Cebu PRT, and Bohol Airport. Next year, the Mega Manila Subway is expected to commence construction, with funding from a Japanese loan. While the GDP may be fueled by government spending on borrowed funding, the country s Debt to GDP ratio is low at 42.1% and is projected to go down further in This means that even with our increased spending (reflecting an upward GDP) fueled by increased foreign loans, economists are confident that we can pay back these loans, as reflected by a shrinking Debt-GDP ratio. Things are really looking well in the local economy, and so the next question is, how did our business fare in the face of these positive deployments? 3
4 Message from the president and Chief Executive Officer As your President and Chief Executive Officer, I am happy to report to you that for the first time in our history, we have breached the Php 5.0 billion mark in terms of consolidated net income. We are also heavily capitalized with a net worth of Php billion and assets valued at Php billion. You are probably wondering. What happened to our portfolio of funds? Did it grow as much as the market? Did it grow as much as the industry? Did we make solid financial decisions? The answer to all those questions is Yes. We have posted favorable results and I am happy to report to you the details of our achievements. Among our Wealth Series Funds, the Select Equities Fund posted year-end returns of 23.85%, followed by the Equity Fund at 14.17% then the Growth Fund at 12.98%. Our Balanced Fund, which is a mixed exposure of equity and fixedincome assets, delivered returns of 6.6%. The rest of your fund s performance report is contained in the succeeding sections. What s in store for us this 2018? In the economic side, we will now feel the full effect of the newly-implemented TRAIN Law. We will probably see inflation hover around 4%, and experience a slight increase in interest rates. I assure you that we, your management team, will be ever vigilant and that you can expect nothing but the very best from us. We will continue to be prudent in our investments; we will continue to find the best possible way to grow your funds entrusted to us whatever the market situation may be. On behalf of the management, thank you for your continued trust in Insular Life, indeed, we are INLIFE for GOOD! MONA LISA DE LA CRUZ President and Chief Executive Officer 4
5 Fund Manager s Report PESO FIXED INCOME FUND FUND PERFORMANCE Peso Fixed Income Fund ended 2017 with a NAVPU of Php , 0.47% lower than 2016 NAVPU of Php amid an increasing interest rate environment triggered by Fed rate hikes and increasing inflation. The Fund continues to invest in a mix of government and corporate bonds and short-term securities. MARKET REVIEW Local bond yields mostly tracked movements in US Treasuries at the beginning of the year in the wake of Trump s busy start to the presidency. Concerns over Donald Trump s policies hung over the market coupled with higher probability of a Fed rate hike in March. US CPI which posted the largest YOY increase in nearly 5 years, rising 2.5% since January 2016 may have prompted the Fed to deliver a widely expected quarter point hike and continued to forecast a total of three rate increases in The local bond market moved frantically after the Bureau of the Treasury unexpectedly awarded the new 3-year Retail Treasury Bond (RTB) at the high coupon of 4.25%. The rate was 12 bps higher than the last 5-year FXTN reissuance at 4.13% and 38 bps more than the most recent 3-year FXTN auction at 3.873%. Yields on the most liquid securities adjusted by bps higher across the curve after the Php 181 billion RTB issue. In this backdrop, the BSP sees current monetary policy as appropriate and believes no immediate need to tweak policy rate settings as inflation is expected to stay within the target range of 2%-4%. Indeed, Philippine CPI moderated further to 2.7% YOY in June after it posted 3.4% YOY in March and April. Philippine Q GDP growth came in at 6.5% YOY, slightly ahead of consensus forecast of 6.4%. Domestic consumption remains as the main growth contributor together with government expenditures and investment. Likewise, 10Y US Treasury yield eased to as low as 2.12% even after the second Fed rate hike in June on mixed US economic activity, still below target inflation and heightened geopolitical risk. With steady policy rates, optimistic growth outlook and diminishing Fed rate hike expectations, the local bond market gained support. The last quarter of 2017 once again saw the return of volatility with several factors contributing to the risk-off mode. Headline inflation rose for the fourth straight month and peaked at 3.5% YOY in October bringing full year average inflation rate to 3.2% from 1.8% in The Bureau of the Treasury s (BTR) announcement to increase the GS supply pipeline for November-December 2017 from Php 90 billion to Php 140 billion was viewed negatively by the market and yields consequently adjusted higher by 5-10 basis points. Local bond rates increased further after the government opted to award the new 5Y RTB at the upper end of indications at 4.625% to give retail investors some premium and prefund the government s funding target before the year ends. Final size of the new RTB reached a record Php billion at the end of the offer period following strong demand. Nevertheless, the huge supply resulted in an upward shift in the yield curve as investors adjusted to the 5-year rate of 4.625%. Market sentiment and liquidity in the RPGB market have been poor post-rtb and even worsened in anticipation of another Fed rate hike in December. 5
 Law and accelerating domestic economic activity, the BSP is likewise expected to deliver two rate increases next year.")
6 Fund Manager s Report Towards yearend, demand for government securities was seen mostly on the short-end part of the curve as players foresee more rate tightening from the Fed in With the passage of the Tax Reformation for Acceleration and Inclusion (TRAIN) Law and accelerating domestic economic activity, the BSP is likewise expected to deliver two rate increases next year. OUTLOOK Moving forward, as inflation begins to pick up and global economic recovery gain steam, we would likely see bond yields continue to adjust higher, giving bond portfolios more reason to remain light and short in terms of duration. PESO FIXED INCOME FUND Fund Distribution by Market Value Government Securities 81% TOP HOLDINGS Government Securities: Philippine Government Bond due 2031 Philippine Government Bond due 2025 Philippine Government Bond due 2023 Philippine Government Bond due 2022 Philippine Government Bond due 2020 Short-term Securities 13% Corporate Securities 6% 6
7 Fund Manager s Report EQUITY FUND FUND PERFORMANCE The Equity Fund ended the year with a NAVPU of Php , up 14.17% from the previous year. The Fund underperformed the Philippine Stock Exchange Index (PSEi), which was up by 25.1% for the year. Underperformance was due to the Fund s defensive stance amid the view that the market was relatively expensive already, hence the decision to have an elevated cash position. Moreover, only a few index heavyweight stocks have accounted for bulk of the PSEi s rally, most of which have relatively lower weights in the Equity Fund portfolio. Volatility of the Fund remained lower at 8.4% versus the PSEi s 11.9% (Note: The volatility was based on the annualized standard deviation of daily returns of the portfolio and the PSEi). The Fund maintains its exposure across all sectors of the market, with bias on conglomerates and consumer related stocks. Cash position of the Fund was 11.2% to be defensive against expected volatility in the coming year. For 2018, the Fund is favorably leaning towards a heavier exposure on conglomerates, banks, and consumer stocks as part of its overall broad exposure strategy in the equities market. This will be in-line with its long term outlook with government policies, consumer strength and economic fundamentals. MARKET REVIEW 2017 was a solid year for local equities as we saw the Philippine Stock Exchange Index (PSEi) breaking record highs throughout the period. The market opened the year on a high note in what appeared to be a carry-over of momentum from last year s late rally. We saw the PSEi surging by 7.7% on just the first ten (10) trading days of the year. Market sentiment was positive as the Philippines remains as one of the fastest growing economies in the region with GDP growth of 6.7% for the full year The market briefly consolidated as talks of a series of Fed rate hikes prompted investors to take a cautious stance. The Fed actually raised its policy rates three (3) times in 2017 for a total of 75 basis points. After the consolidation, another rally resumed following widespread optimism on the progress of the comprehensive tax reform package one (TRAIN), which was finally passed into law in December The appointment of Deputy Governor Nestor Espenilla as the successor of outgoing BSP Governor Amando Tetangco was also well received as this implied a continuation of the effective monetary policies that has led the country to its investment grade rating. Foreign funds seemed encouraged as well with the economic growth prospects of the country, registering net foreign buying of Php56.2 billion. The PSEi ended the year at 8, points, translating to a year to date growth of 25.1%. OUTLOOK Volatility may be expected in interim as investors cash-in their profits especially as the market becomes relatively expensive again. Unless earnings growth catches up aggressively, valuations should remain as a key concern that may limit any upside for the market. Foreign flows will be crucial as well, as the rising interest rate environment in the US may put further pressure on the weakening Philippine Peso making it less attractive for foreign funds to enter the local equities market. 7

8 Fund Manager s Report AC AEV AGI ALI AP BDO BPI CNPF DMC DNL EDC EEI EW FDC FGEN FLI FPH GLO GTCAP ICT JFC JGS LPZ MAXS MBT MEG MER MPI MWC MWIDE PBB PCOR PGOLD PHEN RLC RRHI SCC SECB SM SMC SMPH SSI TEL URC VLL EQUITY FUND STOCK LIST As of December 31, 2017 Ayala Corporation Aboitiz Equity Ventures Alliance Global Inc. Ayala Land Inc. Aboitiz Power Corporation Banco De Oro Universal Bank Bank of the Philippine Islands Century Pacific Food, Inc. DMCI Holdings, Inc. D and L Industries, Inc. Energy Development Corporation EEI Corporation East West Banking Corporation Filinvest Development Corporation FirstGen Corporation Filinvest Land Inc. First Philippine Holdings Globe Telecoms GT Capital Holdings, Inc. International Container Terminal Services, Inc. Jollibee Foods Corporation JG Summit Holdings, Inc. Lopez Holdings, Inc. Max s Group, Corp. Metrobank and Trust Co. Megaworld Corporation Manila Electric Co. Metro Pacific Investments, Corp. Manila Water Co. Megawide Construction Corp. Philippine Business Bank Petron Corporation Puregold Price Club, Inc. PHINMA Energy Corp. Robinsons Land Corporation Robinsons Retail Holdings, Inc. Semirara Mining Corporation Security Bank Corporation SM Investments Corp. San Miguel Corporation SM Prime Holdings, Inc. SSI Group, Inc. PLDT, Inc. Universal Robina Corporation Vista Land and Lifescapes, Inc. Cash and Cash Equivalents 11.28% Transport Services 2.81% Utilities 1.49% Infrastructure 5.38% EQUITY FUND Fund Distribution by Market Value Consumer & Consumer Related 20.16% Power & Energy 10.81% Banks/Financial 7.90% Conglomerates/ Holding Firms 25.80% Communications 3.88% Property 10.49% 8
9 Fund Manager s Report GROWTH FUND FUND PERFORMANCE Growth Fund NAVPU closed 2017 with a NAVPU of Php , 12.98% up from the previous year. The Fund lagged the Philippine Stock Exchange Index (PSEi), which was up by 25.1% for the year. Underperformance was due to the Fund s defensive stance amid the view that the market was relatively expensive already, hence the decision to have an elevated cash position. Moreover, only a few index heavyweight stocks have accounted for bulk of the PSEi s rally, most of which have relatively lower weights in the Growth Fund portfolio. Volatility of the Fund was lower at 8.1% versus the PSEi s 11.9% (Note: The volatility was based on the annualized standard deviation of daily returns of the portfolio and the PSEi). The Fund remained overweight on companies exposed in consumer, retail, and property sectors, all of which were believed to outperform the market during the period. Cash position of the Fund was 10.8% to cushion against expected volatility in For 2018, the Fund will be favorably biased on the infrastructure and consumer sectors, on the back of the government s tax reform program and initiative to push spending for infrastructure growth. This is consistent with the Fund s long term strategy to overweight exposure in the growth sectors of the Philippine economy. MARKET REVIEW 2017 was a solid year for local equities as we saw the Philippine Stock Exchange Index (PSEi) breaking record highs throughout the period. The market opened the year on a high note in what appeared to be a carry-over of momentum from last year s late rally. We saw the PSEi surging by 7.7% on just the first ten (10) trading days of the year. Market sentiment was positive as the Philippines remains as one of the fastest growing economies in the region with GDP growth of 6.7% for the full year The market briefly consolidated as talks of a series of Fed rate hikes prompted investors to take a cautious stance. The Fed actually raised its policy rates three (3) times in 2017 for a total of 75 basis points. After the consolidation, another rally resumed following widespread optimism on the progress of the comprehensive tax reform package one (TRAIN), which was finally passed into law in December The appointment of Deputy Governor Nestor Espenilla as the successor of outgoing BSP Governor Amando Tetangco was also well received as this implied a continuation of the effective monetary policies that has led the country to its investment grade rating. Foreign funds seemed encouraged as well with the economic growth prospects of the country, registering net foreign buying of Php 56.2 billion. The PSEi ended the year at 8, points, translating to a year to date growth of 25.1%. OUTLOOK Volatility may be expected in interim as investors cash-in their profits especially as the market becomes relatively expensive again. Unless earnings growth catches up aggressively, valuations should remain as a key concern that may limit any upside for the market. Foreign flows will be crucial as well, as the rising interest rate environment in the US may put further pressure on the weakening Philippine Peso making it less attractive for foreign funds to enter the local equities market. 9
10 Fund Manager s Report AC AEV AGI ALI AP BDO CIC CNPF DMC DMPL DNL EDC EEI EW FGEN FPH GLO GTCAP ICT JGS LPZ MAXS MBT MEG MPI MWIDE NIKL PBB PCOR PGOLD PHEN PX PXP RFM RLC RRHI RWM SCC SECB SM SMC SMPH SSI URC VLL GROWTH FUND STOCK LIST As of December 31, 2017 Ayala Corporation Aboitiz Equity Ventures, Inc. Alliance Global Inc. Ayala Land, Inc. Aboitiz Power Corporation Banco De Oro Universal Bank Concepcion Industrial Corporation Century Pacific Food, Inc. DMCI Holdings, Inc. Del Monte Pacific Ltd. D and L Industries, Inc. Energy Development Corporation EEI Corporation East West Banking Corporation FirstGen Corporation First Philippine Holdings Globe Telecoms GT Capital Holdings, Inc. International Container Terminal Services, Inc. JG Summit Holdings, Inc. Lopez Holdings Max s Group, Inc. Metropolitan Bank and Trust Company Megaworld Corporation Metro Pacific Investments Megawide Construction Corp. Nickel Asia Corp. Philippine Business Bank Petron Corporation Puregold Price Club, Inc. PHINMA Energy Corp Philex Mining Philex Petroleum Corporation RFM Corporation Robinsons Land Corporation Robinsons Retail Holdings, Inc. Travellers International Hotel Group, Inc. Semirara Mining Corporation Security Bank Corporation SM Investments Corp. San Miguel Corporation SM Prime Corporation SSI Group, Inc. Universal Robina Corporation Vista Land and Lifescapes, Inc. Cash and Cash Equivalents 10.76% GROWTH FUND Fund Distribution by Market Value Power & Energy 12.79% Conglomerates/ Holding Firms 23.09% Banks/ Financial 9.26% Mining 0.71% Property 11.21% Consumer- Manufacturing 21.29% Infrastructure/ Telecommunications 6.44% Transport Services 4.11% Tourism 0.34% 10
11 Fund Manager s Report SELECT EQUITIES FUND FUND PERFORMANCE SEF NAVPU closed 2017 at Php , up by 23.85% from the previous year. The Fund tracked the Philippine Stock Exchange Index (PSEi), which was up by 25.1% for the year. SEF volatility mirrored the PSEi s at 11.9% as the index heavyweights that propelled the PSEi to its highs were also part of the SEF portfolio (Note: The volatility was based on the annualized standard deviation of daily returns of the portfolio and the PSEi). MARKET REVIEW 2017 was a solid year for local equities as we saw the Philippine Stock Exchange Index (PSEi) breaking record highs throughout the period. The market opened the year on a high note in what appeared to be a carry-over of momentum from last year s late rally. We saw the PSEi surging by 7.7% on just the first ten (10) trading days of the year. Market sentiment was positive as the Philippines remains as one of the fastest growing economies in the region with GDP growth of 6.7% for the full year appointment of Deputy Governor Nestor Espenilla as the successor of outgoing BSP Governor Amando Tetangco was also well received as this implied a continuation of the effective monetary policies that has led the country to its investment grade rating. Foreign funds seemed encouraged as well with the economic growth prospects of the country, registering net foreign buying of Php 56.2 billion. The PSEi ended the year at 8, points, translating to a year to date growth of 25.1%. OUTLOOK Volatility may be expected in interim as investors cash-in their profits especially as the market becomes relatively expensive again. Unless earnings growth catches up aggressively, valuations should remain as a key concern that may limit any upside for the market. Foreign flows will be crucial as well, as the rising interest rate environment in the US may put further pressure on the weakening Philippine Peso making it less attractive for foreign funds to enter the local equities market. The market briefly consolidated as talks of a series of Fed rate hikes prompted investors to take a cautious stance. The Fed actually raised its policy rates three (3) times in 2017 for a total of 75 basis points. After the consolidation, another rally resumed following widespread optimism on the progress of the comprehensive tax reform package one (TRAIN), which was finally passed into law in December The 11

12 Fund Manager s Report COMPOSITION OF SELECT EQUITIES FUND AS OF 31 DECEMBER 2017 IS AS FOLLOWS: SELECT EQUITIES FUND Fund Distribution by Market Value ALI BDO GLO ICT MBT MEG MPI SECB SM SMPH TEL URC Ayala Land, Inc. BDO Unibank Globe Telecom, Inc. Int l Container Terminal Services, Inc. Metropolitan Bank and Trust Company Megaworld Corporation Metro Pacific Investments Corporation Security Bank Corporation SM Investments Corporation SM Prime Holdings Corporation Pldt, Inc. Universal Robina Corporation Congolomerates/ Holding Firms 16.84% Consumer 7.13% Telecommunications 13.92% Property 24.31% RESERVE LIST AC GLO GTCAP JFC JGS Ayala Corporation Bank of the Philippine Islands GT Capital Holdings, Inc. Jollibee Foods Corporation JG Summit Holdings, Inc. Cash & Cash Equivalents 2.87% Transport review/ Logistics 7.81% Bank/Financial 27.12% 12
13 Fund Manager s Report GUARDIAN FUND FUND PERFORMANCE Guardian Fund NAVPU closed 2017 at Php , up by 6.11% from the previous year. The Fund lagged the Philippine Stock Exchange Index (PSEi), which was up by 25.1% for the year. Note that PSEi s rally last year was mainly driven by only a few index heavyweights. Unfortunately as per design, these index heavyweights are not part of Guardian Fund portfolio, reason why it underperformed significantly. Guardian Fund volatility was lower at 7.5% versus the PSEi s 11.9% (Note: The volatility was based on the annualized standard deviation of daily returns of the portfolio and the PSEi). Cash position remains elevated at 22.5% as the Fund prepares for a market correction ahead. MARKET REVIEW 2017 was a solid year for local equities as we saw the Philippine Stock Exchange Index (PSEi) breaking record highs throughout the period. The market opened the year on a high note in what appeared to be a carry-over of momentum from last year s late rally. We saw the PSEi surging by 7.7% on just the first ten (10) trading days of the year. Market sentiment was positive as the Philippines remains as one of the fastest growing economies in the region with GDP growth of 6.7% for the full year The market briefly consolidated as talks of a series of Fed rate hikes prompted investors to take a cautious stance. The Fed actually raised its policy rates three (3) times in 2017 for a total of 75 basis points. After the consolidation, another rally resumed following widespread optimism on the progress of the comprehensive tax reform package one (TRAIN), which was finally passed into law in December The appointment of Deputy Governor Nestor Espenilla as the successor of outgoing BSP Governor Amando Tetangco was also well received as this implied a continuation of the effective monetary policies that has led the country to its investment grade rating. Foreign funds seemed encouraged as well with the economic growth prospects of the country, registering net foreign buying of Php56.2 billion. The PSEi ended the year at 8, points, translating to a year to date growth of 25.1%. OUTLOOK Volatility may be expected in interim as investors cash-in their profits especially as the market becomes relatively expensive again. Unless earnings growth catches up aggressively, valuations should remain as a key concern that may limit any upside for the market. Foreign flows will be crucial as well, as the rising interest rate environment in the US may put further pressure on the weakening Philippine Peso making it less attractive for foreign funds to enter the local equities market. 13


14 Fund Manager s Report GUARDIAN FUND Fund Distribution by Market Value COMPOSITION OF GUARDIAN FUND AS OF 31 DECEMBER 2017 IS AS FOLLOWS: AC FGEN DNL GTCAP JFC JGS MER PGOLD RLC RRHI SCC Ayala Corporation First Gen Corporation D and L Industries, Inc. GT Capital Holdings, Inc. Jollibee Foods Corporation JG Summit Holdings, Inc. Manila Electric Company Puregold Price Club, Inc. Robinsons Land Corporation Robinsons Retail Holdings, Inc. Semirara Mining and Power Corporation Cash & Cash Equivalents 22.49% Power & Energy 19.92% Congolomerates/ Holding Firms 20.88% Property 6.58% Consumer & Consumer Related 30.13% 14
15 Fund Manager s Report BALANCED FUND FUND PERFORMANCE The Balanced Fund ended the year with a NAVPU of , up 6.6% from the previous year. The Fund is comprised of investments in Equities and in Fixed Income. This allows the fund to maximize upside potential from the stock market, while enjoying the benefits of relatively less volatile fixed income investments. MARKET REVIEW The Philippine Stock Exchange (PSEi) performed solidly as it posted a stellar growth of 25.1% year-on-year in In what appeared to be a continuation of late last year s rally, we saw the PSEi surging by 7.7% on the first ten (10) trading days of the year. The optimism was a result of the confidence in the Philippines economic growth as the country remains to be one of the fastest growing economies in the region with GDP growth of 6.7% for the full year Towards the end of the first quarter, cautious stance among investors emanated as talks of a series of Fed rate hikes surfaced, leading to the brief market consolidation. However, these concerns were overshadowed as widespread optimism over the passage of the comprehensive tax reform package one (TRAIN) and the appointment of Deputy Governor Nestor Espenilla as the new BSP Governor led the resumption of another market rally. At the beginning of the year, local bond yields mostly tracked movements in US Treasuries, which was mainly driven by concerns over US President Donald Trump s policies coupled with higher probability of a Fed rate hike in March. Concerns on the latter were eventually confirmed as the policymakers decided to raise rates in the last month of the first quarter. Meanwhile, the unexpected grant of 3-year Retail Treasury Bond (RTB) at the high coupon of 4.25% pushed yields on the most liquid securities higher by bps across the curve. In this backdrop, the BSP maintained its current stance as it sees inflation staying within the target range of 2%-4%, which indeed stayed at 2.7% year-on-year in June. Philippine Q GDP growth, on the other hand, came in at 6.5% year-on-year, driven by growth in domestic consumption, government expenditures and investment. With steady policy rates, optimistic growth outlook and diminishing Fed rate hike expectations, the local bond market gained support during the period. However, towards the last quarter of 2017, we saw the risk-off mode again. Some of the factors that contributed to this sentiment were higher inflation rate in October, which peaked at 3.5% year-on-year bringing full year average inflation rate to 3.2% from 1.8% in 2016, increase in the GS supply pipeline and the settlement of new 5Y RTB at upper end of indications at 4.625%. As players anticipate more rates tightening from the Fed and expect two rate increases from BSP, demand for government securities was seen mostly on the shortend part of the curve. OUTLOOK Moving forward, volatility is expected to persist as concerns on valuations in equities remain as a key concern. Further pressure on the weakening of the Philippine Peso may also dampen the attractiveness of the country in terms of foreign flows. With the rising interest rate environment amid higher inflation and global economic recovery, bond yields are seen to continue adjusting higher, prompting bond portfolios to remain light and short in terms of duration. 15

16 Fund Manager s Report BALANCED FUND Fund Distribution by Market Value Equities 52% Fixed Income 48% 16
17 Fund Manager s Report DOLLAR FIXED INCOME FUND FUND PERFORMANCE ROPs started the year mainly on a positive note but reversed towards the end of the first quarter and recovered again until September to close the year on a sideways to downward trend. Despite the roller coaster ride, the Dollar Fixed Income Fund, consisting mainly of Philippine sovereign bonds, managed to grow 3.8% YOY with a Net Asset Value per Unit (NAVPU) of USD The country s strong fundamentals remain as it managed to register a GDP growth of 6.7% for full year 2017, placing the country among the fastest-growing economies in Asia. Robust growth in exports and recovery in agriculture spurred the economic activity for the year. Inflation rate, on the other hand, was reined in within BSP s target range of 2%-4% at 3.2% in Despite traversing the year on a backdrop of political noise, armed conflict and crisis with the declaration of Martial Law in Mindanao, the passage of the most awaited tax reform package was still pushed through. This is believed to be one of the catalysts that could drive the country s economic growth moving forward. MARKET REVIEW The year started with optimism as ROPs traded higher on the back of the weak US jobs addition in the last month of the previous year, fueling expectations that the Fed might consider slowing down its plan to raise rates in the coming year. However, the trend immediately reversed after Federal Reserve Chair Janet Yellen stated that the US economy is nearing maximum employment and PCE inflation rate is getting closer to the Fed s 2% target. Total jobs generated for the whole year was at par with projections at 2.1 million, along with the unemployment rate at 4.4%. Meanwhile, US CPI inflation rate reached 2.1% in 2017 versus 1.3% in the previous year. The appointment of new Fed Chair also added to the volatility, but eventually simmered down as the market welcomed Jerome Powell as the person who will continue the former Fed Chair s stance towards policy rates. Although gradual rate hikes were anticipated, prices seesawed as several other factors, particularly geopolitical risks and some political uncertainties, rattled the market. OUTLOOK Markets are expected to closely monitor any significant developments on the Fed s plan to normalize interest rates while on the domestic side, inflation rate and possible changes in the monetary policy are also seen as among the factors the markets will keep an eye on, especially now with the implementation of the Tax Reformation for Acceleration and Inclusion (TRAIN). 17

18 Fund Manager s Report DOLLAR FIXED INCOME FUND Fund Distribution by Market Value TOP HOLDINGS Republic of the Philippines 2034 Republic of the Philippines 2031 Republic of the Philippines 2030 Republic of the Philippines 2025 Republic of the Philippines to 10 years 11.63% 10 to 15 years 28.90% Longer than 15 years 25.18% 5 to 7 years 12.93% 1 to 5 years 11.20% Short-term Investments 10.16% 18
19 INDEPENDENT AUDITORS REPORT THE BOARD OF TRUSTEES AND MEMBERS The Insular Life Assurance Company, Ltd. OPINION We have audited the accompanying financial statements of Insular Life Wealth Series Funds (the Funds ), which comprise the statements of financial position as at December 31, 2017 and 2016, and the statements of comprehensive income, statements of changes in net assets attributable to unitholders, and statements of cash flows for the years then ended, and a summary of significant accounting policies and other explanatory information. In our opinion, the financial statements present fairly, in all material respects, the financial position of the Insular Life Wealth Series Funds as at December 31, 2017 and 2016, and its financial performance and its cash flows for the years then ended in accordance with Philippine Financial Reporting Standards (PFRS). BASIS FOR OPINION We conducted our audits in accordance with Philippine Standards on Auditing (PSA). Our responsibilities under those standards are further described in the Auditor s Responsibilities for the Audit of the Financial Statements section of our report. We are independent of the Funds in accordance with the Code of Ethics for Professional Accountants in the Philippines (Code of Ethics) together with the ethical requirements that are relevant to our audit of the financial statements in the Philippines, and we have fulfilled our other ethical responsibilities in accordance with these requirements and the Code of Ethics. We believe that the audit evidence we have obtained is sufficient and appropriate to provide a basis for our opinion. RESPONSIBILITIES OF MANAGEMENT AND THOSE CHARGED WITH GOVERNANCE FOR THE FINANCIAL STATEMENTS Management is responsible for the preparation and fair presentation of the financial statements in accordance with PFRS, and for such internal control as management determines is necessary to enable the preparation of financial statements that are free from material misstatement, whether due to fraud or error. In preparing the financial statements, management is responsible for assessing the ability to continue as a going concern, disclosing, as applicable, matters related to going concern and using the going concern basis of accounting unless management either intends to liquidate the Funds or to cease operations, or has no realistic alternative but to do so. Those charged with governance are responsible for overseeing the Funds financial reporting process. AUDITOR S RESPONSIBILITIES FOR THE AUDIT OF THE FINANCIAL STATEMENTS Our objectives are to obtain reasonable assurance about whether the financial statements as a whole are free from material misstatement, whether due to fraud or error, and to issue an auditor s report that includes our opinion. Reasonable assurance is a high level of assurance, but is not a guarantee that an audit conducted in accordance with PSA will always detect a material misstatement when it exists. Misstatements can arise from fraud or error and are considered material if, individually or in the aggregate, they could reasonably be expected to influence the economic decisions of users taken on the basis of these financial statements. 19
20 INDEPENDENT AUDITORS REPORT As part of an audit in accordance with PSA, we exercise professional judgment and maintain professional skepticism throughout the audit. We also: Identify and assess the risks of material misstatement of the financial statements, whether due to fraud or error, design and perform audit procedures responsive to those risks, and obtain audit evidence that is sufficient and appropriate to provide a basis for our opinion. The risk of not detecting a material misstatement resulting from fraud is higher than for one resulting from error, as fraud may involve collusion, forgery, intentional omissions, misrepresentations, or the override of internal control. Obtain an understanding of internal control relevant to the audit in order to design audit procedures that are appropriate in the circumstances, but not for the purpose of expressing an opinion on the effectiveness of the internal control. Evaluate the appropriateness of accounting policies used and the reasonableness of accounting estimates and related disclosures made by management. Conclude on the appropriateness of management s use of the going concern basis of accounting and, based on the audit evidence obtained, whether a material uncertainty exists related to events or conditions that may cast significant doubt on the ability to continue as a going concern. If we conclude that a material uncertainty exists, we are required to draw attention in our auditors report to the related disclosures in the financial statements or, if such disclosures are inadequate, to modify our opinion. Our conclusions are based on the audit evidence obtained up to the date of our auditors report. However, future events or conditions may cause the Funds to cease to continue as a going concern. Evaluate the overall presentation, structure, and content of the financial statements, including the disclosures, and whether the financial statements represent the underlying transactions and events in a manner that achieves fair presentation. We communicate with those charged with governance regarding, among other matters, the planned scope and timing of the audit and significant audit findings, including any significant deficiencies in internal control that we identify during our audit. RESTRICTION ON DISTRIBUTION AND USE This report is intended solely for the information and use of the board of trustees and management of The Insular Life Assurance Company, Ltd. and for submission to the Insurance Commission and should not be used for any other purpose. Djole S. Garcia Partner CPA Certificate No SEC Accreditation No AR-1 (Group A) May 12, 2016 valid until May 12, 2019 Tax Identification No BIR Accreditation No , November 25, 2015, valid until November 24, 2018 PTR No , January 9, 2018, Makati City March 22,

21 Statements Of Financial Position 21

22 Statements Of Financial Position 22

23 Statements Of Financial Position 23

24 Statements Of Financial Position 24

25 Statements of Comprehensive Income 25

26 Statements of Comprehensive Income 26

27 Statements of Comprehensive Income 27

28 Statements of Comprehensive Income 28


29 Statements Of Changes In Net Assets Attributable To Unitholders For the Years Ended December 31, 2017 and


30 Statements Of Changes In Net Assets Attributable To Unitholders For the Years Ended December 31, 2017 and

31 STATEMENTS OF CASH FLOWS For the Years Ended December 31, 2017 and

32 STATEMENTS OF CASH FLOWS For the Years Ended December 31, 2017 and

33 STATEMENTS OF CASH FLOWS For the Years Ended December 31, 2017 and

34 STATEMENTS OF CASH FLOWS For the Years Ended December 31, 2017 and
35 NOTES TO FINANCIAL STATEMENTS 1. Investment Fund Information On February 14, 2005, the Insurance Commission ( IC ) approved the license of The Insular Life Assurance Co., Ltd. (the Company ) to sell variable-unit linked ( VUL ) insurance contracts, a life insurance product that is linked to investment in Insular Life Wealth Series Funds (the Separate Funds ). The Separate Funds of the Company consisted of Philippine Peso ( Peso ) Investment Funds which include Balanced Fund, Peso Fixed Income Fund and Equity Fund (established and launched to the public on March 8, 2005), and United States Dollar ( Dollar ) Investment Funds which include Dollar Fixed Income Fund (established and launched to the public on September 24, 2007). The other Peso Investment Funds which include Growth Fund, Asian Emerging Companies Peso Fund, Philippine Equity Advantage Fund Tranche 1, Philippine Equity Advantage Fund Tranche 2, Select Equities Fund, Peso Money Market Fund, Guardian Fund and Peso Global Equity Fund were established and launched to public in February 2011, October 2011, September 2012, February 2014, April 2014, January 2015, January 2016, June 2016 and July 2017, respectively. The other Dollar Investment Funds which include China Prime Fund Tranche 1, China Prime Fund Tranche 2, Asia Dynamic Equity Fund, Asian Emerging Companies Dollar Fund, Euro Blue Chips Dollar Fund, and Dollar Money Market Fund were established and launched to the public in June 2012, July 2012, February 2013, May 2013, July 2014, and January 2016, respectively. The Strategic Resources Fund matured in October Following are the investment objectives of the Separate Funds: Peso Investment Funds Balanced Fund This is a fund that simultaneously provides long-term growth and steady income. It invests in prime- rated stocks that are listed in the Philippine Stock Exchange ( PSE ) and in government securities, bonds issued by, and term loans extended to prime Philippine corporations and short-term money market instruments. Fixed Income Fund This is a fund that invests in debt obligations and debentures issued by corporations, or by the government. These include government securities, fixed income instruments issued by Philippine corporations and short-term money market instruments. Equity Fund This is a fund that provides long-term total return and capital appreciation by investing primarily in dividend-paying shares of local companies with large capitalization and growth potential, and which are listed in the PSE. It also invests in short-term money market instruments. Growth Fund This is a fund that provides long-term growth and capital appreciation by investing largely in medium to largely capitalized listed companies in the PSE leaning towards those with significant growth potential. It also invests in short-term money market instruments. 35
36 NOTES TO FINANCIAL STATEMENTS Strategic Resources Fund This is a fund that was offered for a limited period from August to September The objective of this fund is to deliver competitive returns on peso-denominated variable life insurance by investing in a structured note linked to the global resources of energy and agribusiness. This fund is fully invested in a 5-year, Peso-linked, Dollar-structured note issued by ING Bank N.V. in October The structured note provides principal protection at maturity and an upside potential determined through participation in the performance of ING customized index which is allocated between cash and equities of SPDR S&P Oil & Gas Exploration & Production ETF (XOP US Equity) and Market Vectors Agribusiness ETF (MOO US Equity). This fund, with 325,000 total units, matured on October 6, This fund s net asset value per unit (NAVPU) at maturity amounted to Php 1, Asian Emerging Companies Fund This is a fund that was offered for a limited period in September The objective of this fund is to deliver competitive returns on peso-denominated variable life insurance by investing in a structured note linked to the small-capitalized companies in Asia. This fund is fully invested in a 7-year, Peso-linked, Dollar-structured note issued by ING Bank N.V. in September The structured note provides principal protection at maturity and an upside potential determined through a participation in the performance of ING Asian Emerging Companies Index VT 10% Index. Philippine Equity Advantage Fund - Tranche 1 This is a fund that was offered for a limited period in February The objective of this fund is to deliver competitive returns on pesodenominated variable life insurance by investing in a structured note linked to a custom index exposed to the Philippine Equity market. This fund is fully invested in a 7-year, Peso-Denominated, Dollarsettled structured note issued by BNP Paribas in February The structured note provides principal protection at maturity and an upside potential determined through a participation in the performance of Insular Philippine Equity PHP VT 10% Index. Philippine Equity Advantage Fund - Tranche 2 This is a fund that was offered for a limited period in April The objective of this fund is to deliver competitive returns on pesodenominated variable life insurance by investing in a structured note linked to a custom index exposed to the Philippine Equity market. This fund is fully invested on a 7-year, Peso-Denominated, Dollarsettled structured note issued by BNP Paribas in April The structured note provides principal protection at maturity and an upside potential determined through a participation in the performance of Insular Philippine Equity PHP 2 VT 10% Index. Select Equities Fund This is a fund that provides long-term portfolio growth from capital appreciation by primarily investing in ten (10) of the most liquid and 36
37 NOTES TO FINANCIAL STATEMENTS well-capitalized dividend-paying stocks listed in the PSE. It also invests in short-term money market instruments. Guardian Fund The Fund is an actively managed fund primarily investing in ten (10) of the most liquid and well- capitalized dividend-paying stocks listed in the PSE. It also invests in short-term money market instruments. The set of rules and criteria that cover the stock selection process is a continuation of Select Equities Fund (SEF) wherein dividend payments, free float market capitalization, and average monthly turnover will all be taken into consideration. Peso Money Market Fund This is a fund designed to provide stable returns while maintaining adequate liquidity through investments in peso denominated short-term securities. This is a very conservative fund with low risk classification given that the investments entered into are comprised mainly of cash and near-cash investments. Peso Global Equity Fund This fund aims to achieve long-term growth and capital appreciation by investing majority of its assets in instruments whose principal exposure is in income-producing equity securities in markets throughout the world. The fund is invested in a local domiciled fund whose underlying investment is an offshore fund (Target Fund) composed of income producing company shares globally. Dollar Investment Funds Dollar Fixed Income Fund This is a fund that seeks to achieve capital preservation and provide income growth over a medium to long term period by investing on a diversified portfolio of Dollar-denominated fixed income instruments issued mainly by the Philippine government and prime corporations. China Prime Fund - Tranche 1 This is a fund that was offered for a limited period in June The objective of this fund is to deliver competitive returns on Dollardenominated variable life insurance by investing in a structured note linked to the select stock companies in China. This fund is fully invested in a 7-year, Dollar-structured note issued by Citigroup Funding Inc. in July The structured note, which is guaranteed by Citigroup, Inc., provides principal protection at maturity and an upside potential determined through a participation in the performance of the equity markets in China as represented by the Tracker Fund of Hang Seng Investment Enterprises Index ( HSCEI ). China Prime Fund - Tranche 2 This is a fund that was offered for a limited period in July The objective of this fund is to deliver competitive returns on Dollardenominated variable life insurance by investing in a structured note linked to the select stock companies in China. 37
38 NOTES TO FINANCIAL STATEMENTS This fund is fully invested in a 7-year, Dollar-structured note issued by Citigroup Funding Inc. in July The structured note, which is guaranteed by Citigroup, Inc., provides principal protection at maturity and an upside potential determined through a participation in the performance of the equity markets in China as represented by the Tracker Fund of HSCEI. Asia Dynamic Equity Fund This fund was offered for a limited period in February The objective of this fund is to deliver competitive returns on dollar denominated variable life insurance by investing in a structured note that provides exposure to equities listed in Asia excluding Japan. This fund is fully invested in a 7-year, Dollar-structured note issued by Standard Chartered Bank in March It provides payouts from the 1st to the 6th policy anniversary of 0.5% of the in force single premium and an upside potential at maturity determined through a participation in the performance of the Asia Risk Control Investable Index (ARC-I Index). Asian Emerging Companies Fund This fund was offered for a limited period in May The objective of this fund is to deliver competitive returns on Dollar-denominated variable life insurance by investing in a structured note thatprovides exposure to emerging companies in Asia through a customized risk-control index called ING Asian Emerging Companies VT 10% Index. The fund is fully invested in a 10-year, Dollar-structured note issued by ING Bank N.V. in May Maturity benefit of the note is paid out in four equal payouts on the 7th, 8th, 9th, and 10th anniversary. The payout will include both portion of the principal and the upside potential observed during the first 7 years through a participation in the performance of the ING Asian Emerging Companies VT 10% Index. Euro Blue Chips Dollar Fund This fund was offered for a limited period in July The objective of this fund is to deliver competitive returns on Dollar-denominated variable life insurance by investing in a structured note that provides exposure to European Blue-Chip companies through a customized risk-control index called ING European Blue-Chip Companies VT 10% Index. The fund is fully invested in a 7-year, Dollar-structured note linked to ROP credit issued by ING Bank N.V. in July The structured note provides principal protection at maturity and an upside potential determined through a participation in the performance of ING European Blue-Chip Companies VT 10% Index. Dollar Money Market Fund This is a fund designed to provide stable returns while maintaining adequate liquidity through investments in dollar denominated short-term securities. This is a very conservative fund with low risk classification given that the investments entered into are comprised mainly of cash and near-cash investments. 38
39 NOTES TO FINANCIAL STATEMENTS Balance Fund, Peso Fixed Income Fund, Equity Fund, Growth Fund, Select Equities Fund, Guardian Fund, and Peso Money Market Fund (which are all Peso Investment Funds), and Dollar Fixed Income Fund and Dollar Money Market Fund (which are all Dollar Investment Funds) are classified as Traditional VUL. Strategic Resources Fund, Asian Emerging Companies Fund, Philippine Equity Advantage Fund Tranche 1, and Philippine Equity Advantage Fund Tranche 2 (which are all Peso Investment Funds), and China Prime Fund Tranche 1, China Prime Fund Tranche 2, Asia Dynamic Equity Fund, Asian Emerging Companies Fund, and Euro Blue Chips Dollar Fund (which are all Dollar Investment Funds) are classified as Structured VUL. The Company entered into Service Level Agreement with a thirdparty multinational bank (the Fund Administrator ) accredited by the Bangko Sentral ng Pilipinas ( BSP ). Under this agreement, the Fund Administrator shall perform fund accounting and valuation services of the Separate Funds. Custodianship of Separate Funds assets is also done by the said third-party multinational bank accredited by the BSP. The Company acts as Fund Manager to the Separate Funds. The financial statements of the Separate Funds, which were prepared from the accounts maintained by the Fund Administrator, are provided solely for the Company s use and for submission to the IC. 2. Summary of Significant Accounting and Financial Reporting Policies Statement of Compliance The Separate Funds financial statements have been prepared in accordance with Philippine Financial Reporting Standards ( PFRS ). Basis of Financial Statement Preparation The financial statements have been prepared on a historical cost basis, except for financial assets at fair value through profit or loss ( FVPL ) which are carried at fair value. The financial statements are presented in Philippine Peso, which is the Separate Funds functional currency. The financial statements include the financial statements of the 18 Separate Wealth Series Funds as of and for the years ended December 31, 2017 and 2016, namely: Balanced Fund, Peso Fixed Income Fund, Equity Fund, Growth Fund, Select Equities Fund, Guardian Fund, Peso Money Market Fund, Peso Global Equity Fund, Asian Emerging Companies Fund, Philippine Equity Advantage Fund Tranche 1, and Philippine Equity Advantage Fund Tranche 2, which comprise the Peso Investment Funds, and Dollar Fixed Income Fund, Dollar Money Market Fund, China Prime Fund Tranche 1, China Prime Fund Tranche 2, Asia Dynamic Equity Fund, Asian Emerging Companies Fund, and Euro Blue Chips Dollar Fund, which comprise the Dollar Investment Funds. Inter-fund investments are eliminated in full. The financial statements were authorized for issue by the President of the Company on March 22,
40 NOTES TO FINANCIAL STATEMENTS Changes in Accounting Policies and Disclosures The accounting policies adopted are consistent with those of the previous financial year except the amendments to existing PFRS listed below that became effective beginning January 1, 2017 and which did not have any significant impact on the financial statements. Amendments to PFRS 12, Disclosure of Interests in Other Entities - Clarification of the Scope of the Standard (Part of Annual Improvements to PFRS Cycle) Amendments to PAS 7, Statement of Cash Flows - Disclosure Initiative Amendments to PAS 12, Income Taxes -Recognition of Deferred Tax Assets for Unrealized Losses Standards Issued but Not Yet Effective Pronouncements issued but not yet effective are listed below. The Company does not expect the future adoption of the said pronouncements to have a significant impact on the financial statements of the Separate Funds unless otherwise indicated. The Company intends to adopt the following pronouncements when they become effective. Effective beginning on or after January 1, 2018 Amendments to PFRS 2, Share-based Payment - Classification and Measurement of Share-based Payment Transactions PFRS 15, Revenue from Contracts with Customers Amendments to PAS 28, Investment in Associates and Joint Ventures - Measuring an Associate or Joint Venture at Fair Value (Part of Annual Improvements to PFRS Cycle) Amendments to PAS 40, Investment Property - Transfers of Investment Property Philippine Interpretation IFRIC-22, Foreign Currency Transactions and Advance Consideration PFRS 9, Financial Instruments PFRS 9 reflects all phases of the financial instruments project and replaces PAS 39, Financial Instruments: Recognition and Measurement, and all previous versions of PFRS 9. The standard introduces new requirements for classification and measurement, impairment, and hedge accounting. Retrospective application is required but providing comparative information is not compulsory. For hedge accounting, the requirements are generally applied prospectively, with some limited exceptions. In 2017, the Company performed its initial impact assessment of all three phases of PFRS 9. This assessment is based on currently available information and may be subject to changes arising from further reasonable and supportable information becoming available to the Company when it adopts PFRS 9. 40
41 NOTES TO FINANCIAL STATEMENTS Amendments to PFRS 4, Insurance Contracts - Applying PFRS 9, Financial Instruments, with PFRS 4 The amendments address concerns arising from implementing PFRS 9, the new financial instruments standard before implementing the new insurance contracts standard. The amendments introduce two options for entities issuing insurance contracts: a temporary exemption from applying PFRS 9 and an overlay approach. The temporary exemption is first applied for reporting periods beginning on or after January 1, An entity may elect the overlay approach when it first applies PFRS 9 and apply that approach retrospectively to financial assets designated on transition to PFRS 9. The entity restates comparative information reflecting the overlay approach if, and only if, the entity restates comparative information when applying PFRS 9. Effective beginning on or after January 1, 2019 Amendments to PFRS 9 - Prepayment Features with Negative Compensation PFRS 16, Leases Amendments to PAS 28 - Long-term Interests in Associates and Joint Ventures Philippine Interpretation IFRIC-23, Uncertainty over Income Tax Treatments Deferred effectivity Amendments to PFRS 10 and PAS 28 - Sale or Contribution of Assets between an Investor and Its Associate or Joint Venture The Company continues to assess the impact of the above new and amended accounting standards and interpretations effective subsequent to 2017 on the Separate Funds financial statements in the period of initial application. Additional disclosures required by these amendments will be included in the financial statements when these amendments are adopted. Fair Value Measurement Financial instruments in the Separate Funds are measured at fair value at the end of each reporting date. Fair value is the price that would be received to sell an asset or paid to transfer a liability in an orderly transaction between market participants at the measurement date. The fair value measurement is based on the presumption that the transaction to sell the asset or transfer the liability takes place in either case as follows: In the principal market for the asset or liability; or In the absence of a principal market, in the most advantageous market for the asset or liability. The principal or the most advantageous market must be accessible to the Company. The fair value of an asset or a liability is measured using the assumptions that market participants would use when pricing the asset or liability, assuming that market participants act in their economic best interest. The Company uses valuation techniques that are appropriate in the circumstances and for which sufficient data are available to 41
42 NOTES TO FINANCIAL STATEMENTS measure fair value, maximizing the use of relevant observable inputs and minimizing the use of unobservable inputs. All assets and liabilities for which fair value is measured or disclosed in the financial statements are categorized within the fair value hierarchy, described as follows, based on the lowest level input that is significant to the fair value measurement as a whole: Level 1 - Quoted (unadjusted) market prices in active markets for identical assets or liabilities; Level 2 - Valuation techniques for which the lowest level input that is significant to the fair value measurement is directly or indirectly observable; or Level 3 - Valuation techniques for which the lowest level input that is significant to the fair value measurement is unobservable. For assets and liabilities that are recognized in the Separate Funds financial statements on a recurring basis, the Company determines whether transfers have occurred between levels in the hierarchy by re-assessing categorization (based on the lowest level input that is significant to the fair value measurement as a whole) at the end of each reporting period. The Company s management determines the policies and procedures for both recurring and non-recurring fair value measurement. At each reporting date, the management analyzes the movements in the values of assets and liabilities of the Separate Funds which are required to be re-measured or re-assessed as per the Company s accounting policies. For this analysis, management verifies the major inputs applied in the latest valuation by agreeing the information in the valuation computation to contracts and other relevant documents. For the purpose of fair value disclosures, the Company has determined classes of assets and liabilities on the basis of the nature, characteristics and risks of the asset or liability, and the level of the fair value hierarchy as explained above. Financial Instruments The Company recognizes a financial asset or a financial liability in the statements of financial position when it becomes a party to the contractual provisions of the instrument. All regular way purchases and sales of financial assets are recognized on the trade date, i.e., the date the Company commits to purchase or sell the financial asset. Regular way purchases or sales of financial assets require delivery of financial assets within the time frame generally established by regulation or convention in the market place. Financial assets and financial liabilities are recognized initially at fair value. Transaction costs, if any, are included in the initial measurement of all financial assets and financial liabilities, except for financial instruments measured at FVPL. 42
43 NOTES TO FINANCIAL STATEMENTS Financial liabilities, on the other hand, are classified as either financial liabilities at FVPL or other financial liabilities, as appropriate. The Company determines the classification of its financial instruments at initial recognition and, where allowed and appropriate, re-evaluates this designation at every reporting date. Financial Assets at FVPL Financial assets at FVPL include financial assets held-for-trading purposes or designated by management as financial asset at FVPL at initial recognition. Derivative instruments, except those covered by hedge accounting relationships, are classified under this category. Financial assets are classified as held-for-trading if they are acquired for the purpose of selling in the near term. Financial assets are designated as at FVPL by management on initial recognition when any of the following criteria is met: the designation eliminates or significantly reduces the inconsistent treatment that would otherwise arise from measuring the financial assets or recognizing gains or losses on them on a different basis; or the assets are part of a group of financial assets, which are managed and their performance evaluated on a fair value basis, in accordance with a documented risk management or investment strategy; or the financial instrument contains an embedded derivative, unless the embedded derivative does not significantly modify the cash flows or it is clear, with little or no analysis, that it would not be separately recorded. These financial assets are subsequently measured at fair market value. Realized and unrealized gains and losses arising from changes in fair market value of financial assets at FVPL are recognized in the statements of comprehensive income. Interest earned on debt securities is recognized as the interest accrues taking into account the effective interest rate. Dividend income on equity securities is recognized according to the terms of the contract or when the right to receive payment has been established. As of December 31, 2017 and 2016, the Separate Funds financial assets at FVPL consist of debt securities, equity securities, and inter-fund investments. Inter-fund investments are eliminated in full in the statements of financial position. After initial measurement, financial assets which are classified as financial assets at FVPL are measured at their fair values in the Separate Funds. The fair value of financial asset is based on their quoted market prices on a recognized exchange or sourced from a reputable counterparty, in the case of non-exchange traded instruments, at the reporting date without any deduction for estimated future selling costs. Subsequent changes in the fair value of financial assets at FVPL are recognized in the statements of comprehensive income. Loans and receivables Loans and receivables are non-derivative financial assets with fixed or determinable payments that are not quoted in active markets. These comprise of cash and cash equivalents, subscriptions receivable, investment income receivable, and other receivables. 43
44 NOTES TO FINANCIAL STATEMENTS After initial measurement, such assets are subsequently measured at amortized cost using effective interest rate method less any allowance for impairment. The effective interest rate amortization and loss arising from impairment, if any, are recognized in the statements of comprehensive income. Derecognition of Financial Assets A financial asset (or, where applicable, a part of a financial asset or part of a group of similar financial assets) is derecognized when the criteria listed are met: the rights to receive cash flows from the financial asset have expired; the Separate Funds retain the right to receive cash flows from the financial asset, but has assumed an obligation to pay them in full without material delay to a third party under a passthrough arrangement; or the Separate Funds have transferred its right to receive cash flows from the financial asset and either (a) has transferred substantially all the risks and rewards of the financial asset, or (b) has neither transferred nor retained substantially all the risks and rewards of the financial asset, but have transferred control of the financial asset. Where the Separate Funds have transferred rights to receive cash flows from a financial asset and have neither transferred nor retained substantially all the risks and rewards of the asset nor transferred control of the financial asset, the financial asset is recognized to the extent of the Separate Funds continuing involvement in the asset. Continuing involvement that takes the form of a guarantee over the transferred asset is measured at the lower of the original carrying amount of the asset and the maximum amount of consideration that the Separate Funds could be required to repay. Impairment of Financial Assets The Company assesses at the end of each reporting period whether there is objective evidence that a financial asset or group of financial asset in the Separate Funds is impaired. A financial asset or group of financial assets is deemed to be impaired if, and only if, there is objective evidence of impairment as a result of one or more events that occurred after the initial recognition of the asset (an incurred loss event ) and that loss event has an impact on the estimated future cash flows of the financial asset or group of financial assets that can be reliably estimated. Evidence of impairment may include indications that a debtor or a group of debtors is experiencing significant financial difficulty, default or delinquency in interests or principal repayments, the probability that they will enter bankruptcy or other financial reorganization, and observable data indicating that there is a measurable decrease in the estimated future cash flows, such as changes in arrears or economic conditions that correlate with defaults. Financial assets carried at amortized cost For financial assets carried at amortized cost, the Company first assesses individually whether objective evidence of impairment exists for financial assets in the Separate Funds that are individually significant, or collectively, for financial assets that are not individually significant. If the Company determined that no objective evidence of impairment exists for an individually assessed financial asset, whether significant or not, it include the asset in a group of financial assets with similar credit risk characteristics and collectively 44
45 NOTES TO FINANCIAL STATEMENTS assess them for impairment. Assets that are individually assessed for impairment and for which an impairment loss is, or continues to be recognized are not included in a collective assessment of impairment. If there is objective evidence that an impairment loss has been incurred, the amount of loss is measured as the difference between the assets carrying amount and the present value of estimated future cash flows (excluding future credit losses that have not yet been incurred). The present value of the estimated future cash flows is discounted at the financial asset s original effective interest rate (i.e., the effective interest rate computed at initial recognition). If a loan has variable interest rate, the discount rate for measuring any impairment loss is the current effective interest rate. The carrying amount of the asset is reduced through the use of an allowance account and the loss is recognized in the statements of comprehensive income. Interest income continues to be accrued on the reduced carrying amount and is accrued using the rate of interest used to discount the future cash flows for the purpose of measuring the impairment loss. Loans and receivables together with any associated allowance are written off when there is no realistic prospect of future recovery and all collateral has been realized or has been transferred to the Separate Funds. If, in a subsequent period, the amount of the estimated impairment loss increases or decreases because of an event occurring after the impairment was recognized, the previously recognized impairment loss is increased or reduced by adjusting the allowance account. If a write-off is later recovered, the recovery is credited to the statements of comprehensive income. Cash and Cash Equivalents For the purpose of the statements of cash flows, cash includes cash in banks. Cash equivalents are short-term, highly liquid investments that are readily convertible to known amounts of cash with original maturities of three months or less and that are subject to an insignificant risk of change in value. Revenue Recognition Revenue is recognized when it is probable that the economic benefits will flow to the Separate Funds and when the revenue can be measured reliably, on the following bases: Interest income is recognized on an accrual basis using the effective interest rate method by applying the rate that discounts the estimated future cash receipts over the expected life of the financial instrument to the net carrying amount of the financial asset. Interest income on cash and cash equivalents ( Interest income-deposits in the statements of comprehensive income) is disclosed separately from interest income on debt securities ( Interest income-debt securities in the statements of comprehensive income). Dividend income is recognized when the Separate Funds rights to receive payment has been established. Dividend income relating to exchange-traded equity investments is recognized in the statements of comprehensive income on ex-dividend date. Property dividend is recognized for the amount of cash dividend alternative with the corresponding debit treated as an additional investment. 45
46 NOTES TO FINANCIAL STATEMENTS Realized gains and losses on investment arise from sale of investments while unrealized gains and losses on investments include marked to market valuation of investment held as of reporting date. exchange rate. Foreign exchange gains or losses are taken to the statements of comprehensive income. Expense Recognition All expenses, including administration, custody, and investment management fees, are recognized in the statements of comprehensive income on an accrual basis. Administration, custody, and investment management fees of the Separate Funds are being charged by the Fund Administrators, Fund Custodians, and the Fund Manager, respectively, as a percentage of the Separate Funds net asset value before deduction for such expenses and are recognized in the statements of comprehensive income as they accrue. Transaction costs include charges by brokers for the purchase and sell transactions of equity and debt securities and are recognized in the statements of comprehensive income when incurred. Government taxes and fees related to the investment income of the Separate Funds are charged to the statements of comprehensive income when incurred. Foreign Currency Denominated Transactions Transactions in foreign currencies are recorded using the exchange rate at the date of the transaction. Monetary assets and liabilities denominated in foreign currencies are restated using the IC 46


47 NOTES TO FINANCIAL STATEMENTS 3. Cash and Cash Equivalents Cash in banks earns interest at the prevailing bank deposit rates. Cash equivalents are made for varying periods of between one day and three months and earn interest at the prevailing short-term deposit rates. Interest income on bank deposits totaled Php 39,627,102 and Php 16,998,473 in 2017 and 2016, respectively. 47
48 NOTES TO FINANCIAL STATEMENTS 4. Financial Assets at Fair Value Through Profit or Loss Investments in Debt Securities Investments in debt securities include bonds and structured notes (see Note 8). 48


49 NOTES TO FINANCIAL STATEMENTS The following tables present the breakdown of investments in debt securities by contractual maturity as of December 31: Interest income from investment in debt securities totaled Php 218,309,093 and Php 179,880,766 in 2017 and 2016, respectively. 49


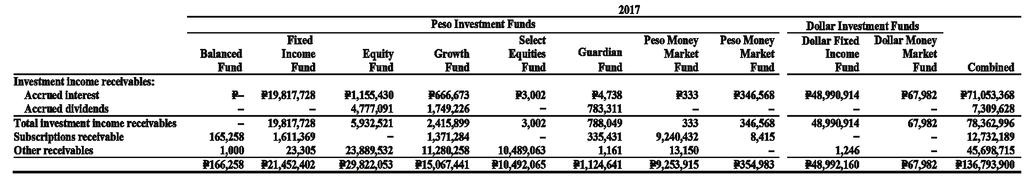

50 NOTES TO FINANCIAL STATEMENTS Investments in Equity Securities 5. Receivables 50


51 NOTES TO FINANCIAL STATEMENTS Accrued interest receivable pertains to interest earned on investments in debt securities and short-term investments but not yet credited to the Separate Funds as of reporting date. Interest rates for such investments range from 0.500% to % for both in 2017 and Accrued dividend receivables are noninterest-bearing and pertain to dividends earned on investment in equity securities but not yet received by the Separate Funds. Dividend income from investment in equity securities totaled Php 271,253,071 and Php 249,182,722 in 2017 and 2016, respectively. Subscription receivable pertains to value of units subscribed but not yet received as at reporting date. Other receivable includes due from Fund Manager and outstanding sales as at reporting period. Inter-fund receivable of Peso Fixed Income Fund amounting Php 1,908,378 and Php 1,466,081 in 2017 and 2016, respectively; and inter-fund receivable of Equity Fund amounting Php 1,908,378 and Php 1,466,081 in 2017 and 2016, respectively, have been eliminated in full (see Note 6). 51


52 NOTES TO FINANCIAL STATEMENTS 6. Accounts Payable and Accrued and Other Liabilities The accounts payable and accrued and other liabilities of Balanced Fund for 2017 and 2016 in the above table are net of inter-fund receivables and payables (see Notes 5 and 7). 52
53 NOTES TO FINANCIAL STATEMENTS 7. Fees a) Management fees Pursuant to the investment management agreement, the Fund Manager is entitled to receive from the Separate Funds an investment management fee equal to 1.5% per annum of the net asset value before deduction of the administration, custody, and investment management fee, of the Peso Fixed Income Fund and Dollar Fixed Income Fund; 1.75% per annum of the net asset value before deduction of the administration, custody, and investment management fee of the Select Equities Fund, 0.445% per annum of the net asset value before deduction of the administration, and investment management fee of the Peso Money Market Fund and Dollar Money Market Fund; and 2.0% per annum of the net asset value before deduction of investment management fee of the Growth Fund, Equity Fund, and Select Equities Fund 2; and 1.1% per annum of the net asset value before deduction of investment management fee of the Peso Global Equity Fund. The other remaining funds are passively managed. Due to this, no investment management fee was incurred in 2017 and 2016 related to these funds. Investment management fees expense amounted to Php 439,959,402 and Php 367,190,730 in 2017 and 2016, respectively. Investment management fees payable outstanding as of December 31, 2017 and 2016 amounted to Php 40,993,808 and Php 33,473,550, respectively (see Note 6). value before deduction of the administration, custody, and investment management fees. Funds without administration fee incurred in 2017 and 2016 are passively administered. Administration fees expense amounted to Php 14,242,585 and Php 12,013,893 in 2017 and 2016, respectively. Administration fees payable outstanding as of December 31, 2017 and 2016 amounted to Php 1,322,552 and Php 1,041,291, respectively (see Note 6). c) Custody fees Pursuant to the Service Level Agreement, the Fund Custodian is entitled to receive between 2.0 to 3.0 basis points per annum based on the total portfolio asset value of the Separate Funds. Structured notes are held at the custody of the Company and as such there was no custody fee expense incurred for all structured notes in 2017 and 2016 (see Note 6). Custody fees expense amounted to Php 4,521,125 and Php 4,340,956 in 2017 and 2016, respectively. Outstanding balances of custody fees payable amounted to Php 471,460 and Php 391,356 as of December 31, 2017 and 2016, respectively (see Note 6). b) Administration fees Pursuant to the Service Level Agreement, the Fund Administrator is entitled to receive administration fee payable monthly in arrears and calculated at 5.5 basis points per annum based on the net asset 53
54 NOTES TO FINANCIAL STATEMENTS 8. Financial Instruments The following tables summarize the financial instruments by category of the Separate Funds as of December 31: 54
55 NOTES TO FINANCIAL STATEMENTS The carrying values of loans and receivables and other financial liabilities approximate their fair values since these are short term in nature. 55
56 NOTES TO FINANCIAL STATEMENTS The following table presents the fair value hierarchy of the financial assets at FVPL as at December 31, 2017 and 2016: The fair values of financial assets at FVPL on Level 1 category are based on the quoted market prices. 56
57 NOTES TO FINANCIAL STATEMENTS The following table shows the reconciliation of the beginning and ending balances of Level 3 financial assets at FVPL as of December 31: There were no transfers within different levels of the fair value hierarchy in 2017 and The structured notes can be decomposed into bond components and option components. Fair value of structured notes has been computed by counterparties using present value calculations and option pricing models as applicable. The valuation requires management to make certain assumptions about the model inputs particularly the credit spread of the issuer. The model also used certain market observable inputs including credit default swap (CDS) of the ROP, USD interest rate swap rates (IRS) (for the USD denominated issuances), and USD/PHP cross currency swap rates (for the PHP-denominated issuances). The probabilities of the various estimates within the range can be reasonably assessed and are used in management s estimate of the fair value of structured notes. 57
58 NOTES TO FINANCIAL STATEMENTS The analysis of the fair market value of the structured notes as of December 31 is performed for the reasonable possible movement in the significant inputs other than quoted prices included within Level 1, with all other variables held constant, showing the impact to profit and loss follows: 58
59 NOTES TO FINANCIAL STATEMENTS The analysis of the fair market value of the structured notes as of December 31 is performed for the reasonably possible movement in the significant unobservable inputs with all other variables held constant, showing the impact to profit and loss follows: 59
60 NOTES TO FINANCIAL STATEMENTS The Bank CDS level is based on the closest available CDS maturity of the counterparty matched to the remaining maturity of the structured notes. Further, the Bank CDS is a proxy for the funding cost of the counterparty which is considered as a significant unobservable input. The estimates are based on assumptions that if altered can change the analysis expressed herein. This shall not constitute a representation or warranty as to future performance of the structured notes. Further, past performance is not indicative of future results. 60
61 NOTES TO FINANCIAL STATEMENTS 9. Financial Risk Management Objectives and Policies The financial instruments of the Separate Funds consist mainly of cash and cash equivalents, financial assets at FVPL, receivables, accounts payable and accrued and other liabilities excluding taxes. The overall risk management program of the Separate Funds focuses on the unpredictability of financial markets and seeks to minimize potential adverse effects on financial performance. The Separate Funds is exposed to credit risk, liquidity risk, equity price risk, fair value interest rate risk, and foreign currency risk. These risks arise from open positions in interest rate, currency, and equity products, all of which are exposed to general and specific market movements. Non-investment grade - rating given to borrowers and counterparties who possess above average capacity to meet their obligations. As of December 31, 2017 and 2016, all of the Separate Funds financial assets fall under investment grade category. Risk concentrations of the maximum exposure to credit risk The Company s market risk policy requires it to manage such risks by setting and monitoring objectives and constraints on investments, diversification plan, and limits on investment in each industry or sector. Credit risk Credit risk is the risk that the Separate Funds will incur a loss because its counterparties failed to discharge their contractual obligations. The Separate Funds exposure to credit risk arises from default of the counterparty, with a maximum credit exposure equal to the carrying amount of the financial assets of the Separate Funds. As of December 31, 2017 and 2016, all of the Separate Funds financial assets are neither past due nor impaired. The Separate Funds use a credit rating concept based on the borrowers and counterparties overall creditworthiness, as follows: Investment grade - rating given to borrowers and counterparties who possess strong to very strong capacity to meet their obligations; 61
62 NOTES TO FINANCIAL STATEMENTS The following table presents the Separate Funds concentration of credit risk in its debt securities portfolio by industrial distribution as percentage of total debt securities as of December 31: Liquidity risk Liquidity or funding risk is the risk that an entity will encounter difficulty in raising funds to meet commitments associated with financial instruments. Liquidity risk may result from either the inability to sell financial assets quickly at their fair values, or counterparty failing on repayment of a contractual obligation or inability to generate cash inflows as anticipated. The Separate Funds manage liquidity through a group liquidity risk policy which determines what constitutes liquidity risk for the Separate Funds, specify minimum proportion of funds to meet emergency calls, set up of contingency funding plans, specify the sources of funding and the events that would trigger the plan, and determine concentration of funding sources, report of liquidity risk exposures, and breaches to the monitoring authority. As of December 31, 2017 and 2016, the Separate Funds other financial liabilities excluding taxes payable amounting to Php 297,141,887 and Php 103,309,971, respectively, have maturities of less than one year. The Separate Funds has cash amounting to Php 2,836,742,161 and Php 2,981,555,219 as of December 31, 2017 and 2016, respectively, which are due on demand that can be used to settle financial liabilities. 62
63 NOTES TO FINANCIAL STATEMENTS Equity price risk The Separate Funds equity price risk exposure at year-end relates to financial assets whose values will fluctuate as a result of changes in market prices. Such investment securities are subject to price risk due to changes in market values of instruments arising either from factors specific to individual instruments or their issuers or factors affecting all instruments traded in the market. The Separate Funds are exposed to equity price risk because of investments held under Equity Fund, Growth Fund, Select Equities Fund, and Select Equities Fund 2 which are classified in the statements of financial position as financial assets at FVPL. The following table demonstrates the sensitivity to a reasonable possible change in the price of equity securities as of December 31: 63
64 NOTES TO FINANCIAL STATEMENTS Risk concentrations of the maximum exposure to equity price risk The Company s market risk policy requires it to manage such risks by setting and monitoring objectives and constraints on investments, diversification plan, and limits on investment in each industry or sector. The following table analyses the Separate Funds concentration of equity price risk in its equity portfolio by industrial distribution as percentage of total equity securities as of December 31: 64
65 NOTES TO FINANCIAL STATEMENTS Fair value interest rate risk Fair value interest rate risk arises from the possibility that changes in interest rates will affect the fair values of investment in debt securities under FVPL. The exposure of the Separate Funds to market risk for changes in interest rates is related primarily to investments under the Peso Fixed Income Fund and Dollar Fixed Income Fund, which are classified in the statements of financial position as financial assets at FVPL. The following table demonstrates the sensitivity to a reasonable possible change in interest rates: 65
66 NOTES TO FINANCIAL STATEMENTS Foreign currency risk Foreign currency risk is the risk that the fair value of future cash flows of a financial instrument will fluctuate because of changes in foreign exchange rates. The Separate Funds foreign currency-denominated assets and liability as of December 31 consist of the following: The foregoing Dollar amounts have been restated to their Peso equivalents using the exchange rate of Php and Php to US$1, prevailing spot rate and as recommended by IC, as of December 31, 2017 and 2016, respectively. 66
67 NOTES TO FINANCIAL STATEMENTS The analysis below is performed for reasonably possible movements in key variables with all other variables held constant, showing the impact on net asset value attributable to unitholders: 67


68 Inlife for good is a mirror of what we stand for and what we do as an organization. As we reflect on our role in the community, these past one hundred years of service have given us the perspective to look through our core and find that our business that of securing lives, providing peace of mind and security to families over generations -- is inherently good for policyholders, the community, and our country. We have always shared the bounty of our blessings, the joys of our success and the prosperity of our business to efforts that uplift the individual, the community and the nation, for the common good, for the higher good. We recognize too, that as a Filipino company, we are here to stay; we are here to journey with our people no matter the circumstances, no matter the challenges, no matter the obstacles. We are here for good. 68
Fund Performance and Composition As of August 31, 2016 PAST 30 DAYS 0.14% 0.07% Year-To-Date 1.04% 0.61% Year-On-Year 1.54% 0.88%
 PNB Prime Peso Money Market Fund MONEY MAET This fund is best suited for conservative investors who are after investment returns better than deposits. The PNB Prime Peso Money Market Fund is invested in
Philippines. Yield Movements
 Philippines 71 Philippines Yield Movements Between 1 June and 15 August, the yields of Philippine local currency (LCY) bonds of all tenors increased except for the 3-month tenor, which decreased 58 basis
Philippines. Yield Movements. 112 Asia Bond Monitor
 112 Asia Bond Monitor Philippines Yield Movements Between 1 September and 31 October, yields movements for Philippine local currency (LCY) government bonds were mixed (Figure 1). Yields at the short-end
Philippines. Yield Movements. 80 Asia Bond Monitor
 80 Asia Bond Monitor Philippines Yield Movements Between 1 March and 15 May, local currency (LCY) government bond yields in the Philippines rose for all tenors except the 3-year, 7-year, and 10-year maturities,
Philippines. Yield Movements. Size and Composition
 Philippines 67 Philippines Yield Movements Between 1 June and 14 August, Philippine local currency (LCY) government bond yields fell for most tenors (Figure 1). Yields for tenors of 2 years and below fell
Philippines. Yield Movements
 Philippines 117 Philippines Yield Movements Between 31 August and 15 October, the yields of Philippine local currency (LCY) bonds of all tenors jumped an average of 189 basis points (bps) (Figure 1). The
AXA UL Funds. Annual Report 2017
 AXA UL Funds Annual Report 2017 Table of Contents Statement of Assets and Liabilities Philippine Economy: 2017 Snapshot Local Equity Market Fixed Income Market Update Wealth Equity Fund Opportunity Fund
Philippines. Yield Movements. Size and Composition
 Philippines 71 Philippines Yield Movements Between end-june and end-december 2013, yields fell for most Philippine local currency (LCY) bonds, particularly for those with tenors of 3 years and less (Figure
EAST WEST BANKING CORPORATION EASTWEST DOLLAR INTERMEDIATE TERM BOND FUND KEY INFORMATION AND INVESTMENT DISCLOSURE STATEMENT
 EAST WEST BANKING CORPORATION > Your dream Our focus < EASTWEST DOLLAR INTERMEDIATE TERM BOND FUND KEY INFORMATION AND INVESTMENT DISCLOSURE STATEMENT For the Month 29 December 2017 FUND FACTS Classification:
EAST WEST BANKING CORPORATION EASTWEST DOLLAR INTERMEDIATE TERM BOND FUND KEY INFORMATION AND INVESTMENT DISCLOSURE STATEMENT
 EAST WEST BANKING CORPORATION > Your dream Our focus < EASTWEST DOLLAR INTERMEDIATE TERM BOND FUND KEY INFORMATION AND INVESTMENT DISCLOSURE STATEMENT For the Month 31 January 2018 FUND FACTS Classification:
Philippines. Yield Movements. Size and Composition
 Philippines 73 Philippines Yield Movements Between 1 September and 15 October, yield movements for Philippine local currency (LCY) government bond yields were mixed (Figure 1). At the short-end of the
Monitoring the Philippine Economy Third Quarter Report for 2016
 Monitoring the Philippine Economy Third Quarter Report for 2016 Project of Angelo King Institute Mitzie Irene P. Conchada 1 Assistant Professor School of Economics Regina S. Villasor BS Applied Economics
GMA Network, Inc: FY12 results disappoint on poor 4Q performance
 TUESDAY, 26 MARCH 2013 Headlines: GMA7: FY12 results disappoint on poor 4Q performance Economy: March inflation is expected to be steady Economy: Budget deficit significantly rises from last year RFM:
Philippines. Yield Movements
 Market Summaries Philippines Yield Movements Between end-september and end-december, Philippine local currency (LCY) government bond yields fell for most tenors with the exception of the 2- and 3-year
EQUITY FUND. May 31, 2013
 EQUITY FUND The PSE index eased 0.69% in May to close at 7,021.95 points. Local stocks succumbed to profit-taking after the index hit an intra-day high of 7,406.65 points mid-month on concerns of steep
EAST WEST BANKING CORPORATION EASTWEST PESO MONEY MARKET FUND KEY INFORMATION AND INVESTMENT DISCLOSURE STATEMENT. For the Month 31 May 2018
 EAST WEST BANKING CORPORATION > Your dream Our focus < EASTWEST PESO MONEY MARKET FUND KEY INFORMATION AND INVESTMENT DISCLOSURE STATEMENT For the Month 31 May 2018 FUND FACTS Classification: Peso Money
EAST WEST BANKING CORPORATION EASTWEST PESO MONEY MARKET FUND KEY INFORMATION AND INVESTMENT DISCLOSURE STATEMENT. For the Month 29 November 2018
 EAST WEST BANKING CORPORATION EASTWEST PESO MONEY MARKET FUND KEY INFORMATION AND INVESTMENT DISCLOSURE STATEMENT > Your dream Our focus < For the Month 29 November 2018 FUND FACTS Classification: Peso
Headlines: Market Summary WEDNESDAY, 10 MAY 2012 INDICES
 WEDNESDAY, 10 MAY 2012 (As of May 18, 2012) Headlines: Alliance Global, Inc. (AGI): 1Q12 core net income Php4.15Bil up 46% y/y Atlas Consolidated Mining (AT): 1Q12 net profits fall sharply on higher operating
EAST WEST BANKING CORPORATION EASTWEST PESO MONEY MARKET FUND KEY INFORMATION AND INVESTMENT DISCLOSURE STATEMENT. For the Month 31 January 2019
 EAST WEST BANKING CORPORATION EASTWEST PESO MONEY MARKET FUND KEY INFORMATION AND INVESTMENT DISCLOSURE STATEMENT > Your dream Our focus < For the Month 31 January 2019 FUND FACTS Classification: Peso
A Product of Wealth Securities, Inc.
 A Product of Wealth Securities, Inc. Index Value Change % Chg PSEi 5,265.94-5.84 0.11 All Shares 3,486.58-6.96 0.20 Financials 1,311.67 1.85 0.14 Industrial 7,888.47-5.79 0.07 Holding Firms 4,426.70 6.43
EAST WEST BANKING CORPORATION EASTWEST DOLLAR INTERMEDIATE TERM BOND FUND KEY INFORMATION AND INVESTMENT DISCLOSURE STATEMENT
 EAST WEST BANKING CORPORATION > Your dream Our focus < EASTWEST DOLLAR INTERMEDIATE TERM BOND FUND KEY INFORMATION AND INVESTMENT DISCLOSURE STATEMENT For the Month 29 September 2017 FUND FACTS Classification:
Yield ( ). Outstanding Amount (billion) Growth Rate (%) Q Q Q Q Q PHP USD PHP USD PHP USD q-o-q y-o-y q-o-q y-o-y
. Outstanding Amount (billion) Growth Rate (%) Q Q Q Q Q PHP USD PHP USD PHP USD q-o-q y-o-y q-o-q y-o-y") 72 Asia Bond Monitor Philippines Yield Movements Between 1 March and 15 May, local currency (LCY) government bond yields in the Philippines rose for the 0.25-, 0.5-, 1-, 2-, 10-, and 25-year tenors; and
72 Asia Bond Monitor Philippines Yield Movements Between 1 March and 15 May, local currency (LCY) government bond yields in the Philippines rose for the 0.25-, 0.5-, 1-, 2-, 10-, and 25-year tenors; and
Bullseye Report Weekly Overview
 Bullseye Report Weekly Overview Issue Prev Wk Last Wk Wk Chg Wk Chg % YTD % Philippines 7,584 7,630 45.89 0.61 11.53 Peso-$ 50.08 49.43 (0.650) (1.30) (0.58) MSCI Phils 35.86 36 0.14 0.39 11.11 PLDT US
EAST WEST BANKING CORPORATION EASTWEST PESO MONEY MARKET FUND KEY INFORMATION AND INVESTMENT DISCLOSURE STATEMENT. For the Quarter 31 December 2015
 EAST WEST BANKING CORPORATION > Your dream Our focus < EASTWEST PESO MONEY MARKET FUND KEY INFORMATION AND INVESTMENT DISCLOSURE STATEMENT For the Quarter 31 December 2015 FUND FACTS Classification: Peso
Market volatility to continue
 How much more? Renewed speculation that financial institutions may report increased US subprime-related losses has sent equity markets tumbling. How much more bad news can investors expect going forward?
EAST WEST BANKING CORPORATION EASTWEST PESO MONEY MARKET FUND KEY INFORMATION AND INVESTMENT DISCLOSURE STATEMENT. For the Month 31 July 2017
 EAST WEST BANKING CORPORATION EASTWEST PESO MONEY MARKET FUND KEY INFORMATION AND INVESTMENT DISCLOSURE STATEMENT For the Month 31 July 2017 FUND FACTS Classification: Peso Money Net Asset Value per Unit
 FIRST METRO SAVE & LEARN BALANCED FUND, INC President s Report 07.13.2013 FINANCIAL HIGHLIGHTS AS OF 12.31.2012 FIRST METRO SAVE AND LEARN BALANCED FUND, INC. (An Open-End Mutual Fund Company) STATEMENTS
Riding the liquidity driven rally
 Riding the liquidity driven rally The PSEi has rallied 4.2% since we last came out with our COLing the Shots repot. The strength of the market s rally surprised us given the absence of positive macro developments.
1ST HALF TECHNICAL OUTLOOK
 1ST HALF TECHNICAL OUTLOOK OUTLOOK OVERVIEW World Markets Dive into medium term Down Trends Some of which threaten to rub in a Bearish-like Phase Such down trends may need a Selling Capitulation or Reversal
Strategy: Adjusting FV estimates to factor in improving outlook
 Stocks in Focus: WED 16 JUNE 2017 Strategy: Adjusting FV estimates to factor in improving outlook Improving outlook justifies lower risk premium. We are cutting our risk premium assumption by 50 basis
EAST WEST BANKING CORPORATION EASTWEST PESO MONEY MARKET FUND KEY INFORMATION AND INVESTMENT DISCLOSURE STATEMENT. For the Quarter 31 March 2017
 EAST WEST BANKING CORPORATION EASTWEST PESO MONEY MARKET FUND KEY INFORMATION AND INVESTMENT DISCLOSURE STATEMENT For the Quarter 31 March 2017 FUND FACTS Classification: Peso Money Market Net Asset Value
A Product of Wealth Securities, Inc.
 A Product of Wealth Securities, Inc. Index Value Change % Chg PSEi 5,219.51-47.15 0.90 All Shares 3,464.57-24.41 0.70 Financials 1,305.05-11.58 0.88 Industrial 7,868.51-53.54 0.68 Holding Firms 4,391.48-35.14
A Product of Wealth Securities, Inc.
 A Product of Wealth Securities, Inc. Index Value Change % Chg PSEi 5,204.84 35.24 0.6817 All Shares 3,472.24 31.49 0.9152 Financials 1,292.15 2.75 0.2133 Industrial 7,851.72 14.73 0.1873 Holding Firms
EAST WEST BANKING CORPORATION EASTWEST PESO MONEY MARKET FUND KEY INFORMATION AND INVESTMENT DISCLOSURE STATEMENT. For the Month 30 April 2018
 EAST WEST BANKING CORPORATION > Your dream Our focus < EASTWEST PESO MONEY MARKET FUND KEY INFORMATION AND INVESTMENT DISCLOSURE STATEMENT For the Month 30 April 2018 FUND FACTS Classification: Peso Money
CTBC BANK (PHILIPPINES) CORPORATION - TRUST AND INVESTMENT SERVICES DEPARTMENT
 CORPORATION - TRUST AND INVESTMENT SERVICES DEPARTMENT") CTBC BANK (PHILIPPINES) CORPORATION - TRUST AND INVESTMENT SERVICES DEPARTMENT CTBC MONEY MARKET FUND KEY INFORMATION AND INVESTMENT DISCLOSURE STATEMENT QUARTER ENDED SEPTEMBER 30, 2018 FUND FACTS Classification
CTBC BANK (PHILIPPINES) CORPORATION - TRUST AND INVESTMENT SERVICES DEPARTMENT CTBC MONEY MARKET FUND KEY INFORMATION AND INVESTMENT DISCLOSURE STATEMENT QUARTER ENDED SEPTEMBER 30, 2018 FUND FACTS Classification
EAST WEST BANKING CORPORATION EASTWEST DOLLAR INTERMEDIATE TERM BOND FUND KEY INFORMATION AND INVESTMENT DISCLOSURE STATEMENT
 EAST WEST BANKING CORPORATION > Your dream Our focus < EASTWEST DOLLAR INTERMEDIATE TERM BOND FUND KEY INFORMATION AND INVESTMENT DISCLOSURE STATEMENT For the Month 31 August 2017 FUND FACTS Classification:
2016 Financial Highlights GROWING THROUGH CHANGE
 2016 Financial Highlights GROWING THROUGH CHANGE VISION MISSION To be the country s premiere financial conglomerate, empowering our individual and business clients to realize their goals and reach their
Fourth Quarter Market Outlook. Kim Huebner, CFA Don Powell, CFA Joseph Styrna, CFA
 Fourth Quarter 2017 Market Outlook Kim Huebner, CFA Don Powell, CFA Joseph Styrna, CFA Economic Outlook Growth Increasing, Spending Modest, Low Unemployment 2017 2016 2015 2014 2013 2012 2011 GDP* Q3:
A PROPOSAL FOR MONTH YEAR (ALL CAPS) CHARTBOOK. Market Indicators
 CHARTBOOK. Market Indicators") A PROPOSAL FOR MONTH YEAR (ALL CAPS) CHARTBOOK Market Indicators November 2015 For more information, contact: Janlo de los Reyes Manager Research and Consultancy janlo.delosreyes@ap.cushwake.com Leo De
A PROPOSAL FOR MONTH YEAR (ALL CAPS) CHARTBOOK Market Indicators November 2015 For more information, contact: Janlo de los Reyes Manager Research and Consultancy janlo.delosreyes@ap.cushwake.com Leo De
Monitoring the Philippine Economy Second Quarter Report for 2016
 Monitoring the Philippine Economy Second Quarter Report for 20 Project of Angelo King Institute Mitzie Irene P. Conchada 1 Assistant Professor School of Economics Regina S. Villasor BS Applied Economics
A Product of Wealth Securities, Inc.
 A Product of Wealth Securities, Inc. Index Value Change % Chg PSEi 5,219.55 66.99 1.30 All Shares 3,463.30 29.08 0.85 Financials 1,285.51 5.8 0.45 Industrial 7,888.54 86.08 1.10 Holding Firms 4,376.71
A Product of Wealth Securities, Inc.
 A Product of Wealth Securities, Inc. Index Value Change % Chg PSEi 5,046.78 29.34 0.5848 All Shares 3,403.86 8.26 0.2433 Financials 1,237.76 6.68 0.5426 Industrial 7,819.58 38.67 0.497 Holding Firms 4,199.08
EASTWEST BANKING CORPORATION EASTWEST PESO MONEY MARKET FUND KEY INFORMATION AND INVESTMENT DISCLOSURE STATEMENT. For the Quarter 30 June 2015
 EASTWEST BANKING CORPORATION > Your dream Our focus < EASTWEST PESO MONEY MARKET FUND KEY INFORMATION AND INVESTMENT DISCLOSURE STATEMENT For the Quarter 30 June 2015 FUND FACTS Classification: Peso Money
Top Story: Other News: Market Summary: THU 20 JULY Gaming sector: Negative impact from AMLA not expected
 Top Story: Gaming sector: Negative impact from AMLA not expected Other News: AC: AC Energy eyes partnerships in Vietnam Economy: Balance of payments deficit widens to US$569Mil in June Market Summary:
COVER SHEET M E T R O P O L I T A N B A N K & T R U S T C O M P A N Y. (Company s Full Name) M e t r o b a n k P l a z a, S e n.
 M e t r o b a n k P l a z a, S e n.") COVER SHEET 2 0 5 7 3 SEC Registration Number M E T R O P O L I T A N B A N K & T R U S T C O M P A N Y (Company s Full Name) M e t r o b a n k P l a z a, S e n. G i l P u y a t A v e n u e, U r d a n
COVER SHEET 2 0 5 7 3 SEC Registration Number M E T R O P O L I T A N B A N K & T R U S T C O M P A N Y (Company s Full Name) M e t r o b a n k P l a z a, S e n. G i l P u y a t A v e n u e, U r d a n
Asia Bond Monitor November 2018
 7 December 8 Key Developments in Asian Local Currency Markets T he monetary board of the Bangko Sentral ng Pilipinas decided to keep its key policy rates steady during its final meeting for the year on
CHP: Play on infrastructure growth
 Stocks in Focus: CHP: Play on infrastructure growth Initiating coverage with a BUY rating with FV estimate of Php9.30/sh. We are initiating coverage on Cemex Holdings Philippines, Inc. (CHP) with a BUY
ASEAN Insights: Regional trends
 ASEAN Insights: Regional trends January 2017 1. Global trends GLOBAL ECONOMY AND EQUITY MARKETS ENTER 2017 ON A STRONG NOTE DESPITE GEOPOLITICAL UNCERTAINTIES The global economy entered 2017 on a strong
A Product of Wealth Securities, Inc.
 A Product of Wealth Securities, Inc. Index Value Change % Chg PSEi 4,645.86 84.78 1.8588 All Shares 3,151.11 44.68 1.4383 Financials 1,036.98 8.11 0.7882 Industrial 7,371.01 7.10 0.0964 Holding Firms 3,656.28
 2012 6 http://www.bochk.com 2 3 4 ECONOMIC REVIEW(A Monthly Issue) June, 2012 Economics & Strategic Planning Department http://www.bochk.com An Analysis on the Plunge in Hong Kong s GDP Growth and Prospects
Financial Market Outlook: Stocks Rebounding from July Correction, Further Gains Likely. Bond Yields Range Bound
 For Market Commentary Interviews Contact: Lisa Villareal, 973-367-2503/lisa.villareal@prudential.com Financial Market Outlook & Strategy: Stocks Rebounding from July Correction, Further Gains Likely. Bond
DMCI Holdings, Inc. Parent Company Financial Statements December 31, 2016 and 2015 and Years Ended December 31, 2016, 2015 and 2014.
 DMCI Holdings, Inc. Parent Company Financial Statements December 31, 2016 and 2015 and Years Ended December 31, 2016, 2015 and 2014 and Independent Auditor s Report SyCip Gorres Velayo & Co. 6760 Ayala
A Product of Wealth Securities, Inc.
 A Product of Wealth Securities, Inc. Index Value Change % Chg PSEi 5,201.32 51.21 0.99 All Shares 3,454.83 25.93 0.76 Financials 1,303.88 12.67 0.98 Industrial 7,916.08 63.88 0.81 Holding Firms 4,366.58
Lock in gains on MER; switch from RRHI to DNL
 Lock in gains on MER; switch from RRHI to DNL Since we last wrote our COLing the Shots report, the market rallied to as high as 8,605.15, but eventually corrected to its current level of 8,343.23. We think
MARKET REVIEW & OUTLOOK February 2018
 MARKET REVIEW & OUTLOOK February 2018 1.0 Fixed Income Economics During the month, Malaysia s 4Q2017 GDP was released. Real Gross Domestic Product ( GDP ) grew 5.9% YoY, slightly slower than the 6.2% recorded
EQUITY FUND. March 27, 2013
 EQUITY FUND Despite trading in negative territory for most part of the month, the PSEi was up 1.87% in March to close at 6,847.4 points, bringing YTD gains to a solid 17.8%. During the last trading day
3.9% Good MornING Asia - 6 April Asia week ahead: Trade war threats weighs on central banks
 Economic and Financial Analysis Bundle Good MornING Asia - Global Economics The fear of a global trade war weighs on Asian central bank policy tightening. We expect Singapore and Korea to keep policies
CAPITAL STRUCTURE AND CAPITAL ADEQUACY
 CAPITAL STRUCTURE AND CAPITAL ADEQUACY The capital-to-risk assets ratios of the Company as reported to the BSP as of 30 September 2017 and 2016 based on Basel III are shown in the table below. In PHP million
ORSO 職業退休計劃. Fidelity Advantage Portfolio Fund
 ORSO 職業退休計劃 Fidelity Advantage Portfolio Fund Semi-Annual Report and Accounts For the period ended 30 June 2018 SEMI-ANNUAL REPORT AND ACCOUNTS - FOR THE PERIOD ENDED 30TH JUNE 2018 Contents Pages Management
EDC: Flat revenues, uptick in opex to result to lower earnings for 2017
 THU 19 JAN 2O17 Stocks in Focus: EDC: Flat revenues, uptick in opex to result to lower earnings for 2017 Operating expense lower in 2016, but will likely pick up this year. EDC s operating expense (including
Eighth UNCTAD Debt Management Conference
 Eighth UNCTAD Debt Management Conference Geneva, 14-16 November 2011 Interactions between Government Domestic Borrowing Needs and the Corporate Sector by Mr. Roberto Juanchito T. Dispo President / Director,
Growth and Inflation Prospects and Monetary Policy
 Growth and Inflation Prospects and Monetary Policy 1. Growth and Inflation Prospects and Monetary Policy The Thai economy expanded by slightly less than the previous projection due to weaker-than-anticipated
Our goal is to provide a clear perspective on the global financial markets, as well as a logical framework to discuss them, thereby enabling
 Our goal is to provide a clear perspective on the global financial markets, as well as a logical framework to discuss them, thereby enabling investors to recognize both the opportunities and risks that
Prudential Guarantee and Assurance Inc.
 Prudential Guarantee and Assurance Inc. Financial Statements December 31, 2016 and 2015 and Independent Auditor s Report SyCip Gorres Velayo & Co. 6760 Ayala Avenue 1226 Makati City Philippines Tel: (632)
Developments in inflation and its determinants
 INFLATION REPORT February 2018 Summary Developments in inflation and its determinants The annual CPI inflation rate strengthened its upward trend in the course of 2017 Q4, standing at 3.32 percent in December,
Ms. Vina Vanessa S. Salonga Head-Issuer Compliance and Disclosure Department
 43 rd FLOOR ROBINSONS EQUITABLE TOWER ADB AVE. COR. POVEDA RD. ORTIGAS CENTER, PASIG CITY TEL. NO.: 633-7631, 637-1670, 240-8801 FAX NO.: 633-9387 OR 633-9207 November 9, 2018 PHILIPPINE DEALING AND EXCHANGE
1. HSBC INVESTMENT FUNDS TRUST 1.1 HSBC ASIAN BOND FUND 1.2 HSBC CHINA MOMENTUM FUND 1.3 HSBC CHINA GROWTH FUND 1.4 HSBC ASIAN HIGH YIELD BOND FUND
 Investment s Trust Annual Report 2017 Contents 1. INVESTMENT FUNDS TRUST 1.1 ASIAN BOND FUND 1.2 CHINA MOMENTUM FUND 1.3 CHINA GROWTH FUND 1.4 ASIAN HIGH YIELD BOND FUND Investment Adviser s Reports 1
COVER SHEET M E T R O P O L I T A N B A N K & T R U S T C O M P A N Y. (Company s Full Name) M e t r o b a n k P l a z a, S e n. G i l J.
 M e t r o b a n k P l a z a, S e n. G i l J.") COVER SHEET 2 0 5 7 3 SEC Registration Number M E T R O P O L I T A N B A N K & T R U S T C O M P A N Y (Company s Full Name) M e t r o b a n k P l a z a, S e n. G i l J. P u y a t A v e n u e, 1 2 0 0
COVER SHEET 2 0 5 7 3 SEC Registration Number M E T R O P O L I T A N B A N K & T R U S T C O M P A N Y (Company s Full Name) M e t r o b a n k P l a z a, S e n. G i l J. P u y a t A v e n u e, 1 2 0 0
EASTWEST BANKING CORPORATION
 EASTWEST BANKING CORPORATION > Your dream Our focus < INFINITY DOLLAR INTERMEDIATE TERM BOND FUND KEY INFORMATION AND INVESTMENT DISCLOSURE STATEMENT For the Quarter 31 March 2015 FUND FACTS Classification:
BDO Life Assurance Company, Inc. (Formerly Generali Pilipinas Life Assurance Company, Inc.)
") BDO Life Assurance Company, Inc. (Formerly Generali Pilipinas Life Assurance Company, Inc.) (A Wholly Owned Subsidiary of BDO Life Assurance Holdings Corp.) Financial Statements December 31, 2016 and 2015
BDO Life Assurance Company, Inc. (Formerly Generali Pilipinas Life Assurance Company, Inc.) (A Wholly Owned Subsidiary of BDO Life Assurance Holdings Corp.) Financial Statements December 31, 2016 and 2015
Financial Market Outlook: Further Stock Gain on Faster GDP Rebound and Earnings Recovery. Year-end Target Raised
 For Market Commentary Interviews Contact: Lisa Villareal, 973-367-2503/lisa.villareal@prudential.com Financial Market Outlook & Strategy: FurtherStock Gains Likely, Year-end Target Raised. Bond Under Pressure
FIDELITY ADVANTAGE PORTFOLIO FUND. Annual Report and Accounts
 FIDELITY ADVANTAGE PORTFOLIO FUND Annual Report and Accounts December 2006 Fidelity Advantage Portfolio Fund Reports and Financial Statements Year ended 31st December 2006 Contents Pages Management and
US Economic Outlook Improving
 Government Bonds Have Never Looked Less Attractive OUTLOOK Executive Summary Kenneth J. Taubes Chief Investment Officer, US Economic Outlook US GDP growth may lead growth among developed nations, at approximately
Recap of 2017 Markets and Economy
 Welcome to 2018! As always, our primary goal this year is to continue our tradition of helping clients achieve their personal financial goals. To make that process more efficient, please review the 2018
Monthly Outlook. June Summary
 Monthly Outlook June 2015 Summary Yields of US Treasuries (USTs) rallied in May, with the 2-year and 10-year yields up 4 and 9 basis points (bps) respectively as compared to end-april levels. During the
Monitoring the Philippine Economy First Quarter Report for 2017
 Monitoring the Philippine Economy First Quarter Report for 2017 Project of Angelo King Institute Dr. Mitzie Irene P. Conchada 1 Associate Professor School of Economics Won Hee Cho BS-MS Economics School
Prudential International Investments Advisers, LLC. Global Investment Strategy October 2009
 Prudential International Investments Advisers, LLC. Global Investment Strategy October 2009 By John Praveen, Chief Investment Strategist For Market Commentary Interviews Contact: Lisa Villareal, 973-367-2503/lisa.villareal@prudential.com
Market Watch. July Review Global economic outlook. Australia
 Market Watch Latest monthly commentary from the Investment Markets Research team at BT. Global economic outlook Australia Available data for the June quarter is consistent with a moderation in GDP growth
Prudential Guarantee and Assurance Inc.
 Prudential Guarantee and Assurance Inc. Financial Statements December 31, 2017 and 2016 and Independent Auditor s Report SyCip Gorres Velayo & Co. 6760 Ayala Avenue 1226 Makati City Philippines Tel: (632)
STANDARD DOCUMENT COVER SHEET FOR SEC FILINGS
 STANDARD DOCUMENT COVER SHEET FOR SEC FILINGS All documents should be submitted under a cover page which clearly identifies the company and the specific document form as follows: SEC Number 121 File Number
Message to Shareholders. ALFM Mutual Funds
 Annual Report CONTENTS 2 Message to Shareholders 4 ALFM Mutual Funds 5 8 11 14 17 20 Fund Performance Review ALFM Peso Bond Fund ALFM Dollar Bond Fund ALFM Euro Bond Fund Philippine Stock Index Fund ALFM
Monitoring the Philippine Economy
 Monitoring the Philippine Economy Second Quarter Report for 2015 Project of Angelo King Institute Mitzie Irene P. Conchada 1 Assistant Professor School of Economics Edgardo Manuel Jopson BS-MS Economics
Erdem Başçi: Recent economic and financial developments in Turkey
 Erdem Başçi: Recent economic and financial developments in Turkey Speech by Mr Erdem Başçi, Governor of the Central Bank of the Republic of Turkey, at the press conference for the presentation of the April
PNB General Insurers Co., Inc. (A Subsidiary of Philippine National Bank)
") PNB General Insurers Co., Inc. (A Subsidiary of Philippine National Bank) Financial Statements December 31, 2016 and 2015 and Independent Auditor s Report SyCip Gorres Velayo & Co. 6760 Ayala Avenue 1226
PNB General Insurers Co., Inc. (A Subsidiary of Philippine National Bank) Financial Statements December 31, 2016 and 2015 and Independent Auditor s Report SyCip Gorres Velayo & Co. 6760 Ayala Avenue 1226
31 July Key Philippine Indices
 31 Key Philippine Indices Close Change % Ch PSEi 6,867.59 +17.12 +0.25 All Shares 4,110.43 +1.55 +0.04 Financials 1,633.98 +5.65 +0.35 Industrial 10,469.66-32.39-0.31 Holding 6,178.24 +12.72 +0.21 Services
Leumi. Global Economics Monthly Review. Arie Tal, Research Economist. July 12, Capital Markets Division, Economics Department. leumiusa.
 Global Economics Monthly Review July 12, 2018 Arie Tal, Research Economist Capital Markets Division, Economics Department Leumi leumiusa.com Please see important disclaimer on the last page of this report
PGA Sompo Insurance Corporation (formerly PGA Sompo Japan Insurance, Inc.)
") PGA Sompo Insurance Corporation (formerly PGA Sompo Japan Insurance, Inc.) Financial Statements December 31, 2016 and 2015 and Independent Auditor s Report SyCip Gorres Velayo & Co. 6760 Ayala Avenue 1226
PGA Sompo Insurance Corporation (formerly PGA Sompo Japan Insurance, Inc.) Financial Statements December 31, 2016 and 2015 and Independent Auditor s Report SyCip Gorres Velayo & Co. 6760 Ayala Avenue 1226
China Bank Savings, Inc. (A Majority Owned Subsidiary of China Banking Corporation)
") China Bank Savings, Inc. (A Majority Owned Subsidiary of China Banking Corporation) Financial Statements December 31, 2017 and 2016 and for the years ended December 31, 2017, 2016 and 2015 and Independent
China Bank Savings, Inc. (A Majority Owned Subsidiary of China Banking Corporation) Financial Statements December 31, 2017 and 2016 and for the years ended December 31, 2017, 2016 and 2015 and Independent
ASEAN Insights: Regional trends
 ASEAN Insights: Regional trends December 2017 1. Global trends CONSUMER AND BUSINESS CONFIDENCE ROBUST; UNEMPLOYMENT RATE FALLS WHILE INFLATION EDGES UP The global economic environment continued on its
International Care Ministries Foundation Inc. (A Nonstock, Nonprofit Corporation)
") International Care Ministries Foundation Inc. (A Nonstock, Nonprofit Corporation) Financial Statements May 31, 2017 and 2016 and Independent Auditor s Report SyCip Gorres Velayo & Co. 6760 Ayala Avenue
International Care Ministries Foundation Inc. (A Nonstock, Nonprofit Corporation) Financial Statements May 31, 2017 and 2016 and Independent Auditor s Report SyCip Gorres Velayo & Co. 6760 Ayala Avenue
Monitoring the Philippine Economy First Quarter Report for 2016
 Monitoring the Philippine Economy First Quarter Report for 2016 Project of Angelo King Institute Mitzie Irene P. Conchada 1 Assistant Professor School of Economics Regina S. Villasor BS Applied Economics
The Moat Report plus more!
 Philippines Market Outlook Alfred Dy (63) 28865687 alfred.dy@clsa.com 01 April 2011 The Moat Report plus more! CLSA recently published The Moat Report. Report highlights 246 companies in Asia that generated
Interest Rate Forecast
 Interest Rate Forecast Economics January Highlights Global growth firms Waiting for Trumponomics Bank of Canada on hold Recent growth momentum in the global economy continued in December and looks to extend
STANDARD DOCUMENT COVER SHEET FOR SEC FILINGS. SEC Identification Number PW-121 File Number
 Page 1 of 31 STANDARD DOCUMENT COVER SHEET FOR SEC FILINGS All documents should be submitted under a cover page which clearly identifies the company and the specific document form as follows: SEC Identification
Q Outlook and Strategy Income Funds
 Q3 Outlook and Strategy Income Funds Industry Recognitions for Asian Fixed Income Capabilities Organiser Award Asia Asset Management Best of the Best Performance Awards 2015: Asian Bonds (3 years) 1 Best
Portfolio Strategist Update from BlackRock Active Opportunity ETF Portfolios
 Portfolio Strategist Update from BlackRock Active Opportunity ETF Portfolios As of Sept. 30, 2017 Ameriprise Financial Services, Inc., ("Ameriprise Financial") is the investment manager for Active Opportunity
Beyond The realm Of possibilities
 Beyond The realm Of possibilities 2013 2nd Quarter Report Table of Contents - Outlook of U.S. Real Estate 3-16 - Products Performance Review 17-20 - Performance: DFSP Series 21-24 - Market Outlook 25-28
South African Reserve Bank STATEMENT OF THE MONETARY POLICY COMMITTEE. Issued by Lesetja Kganyago, Governor of the South African Reserve Bank
 South African Reserve Bank PRESS STATEMENT EMBARGO DELIVERY 18 January 2018 STATEMENT OF THE MONETARY POLICY COMMITTEE Issued by Lesetja Kganyago, Governor of the South African Reserve Bank In recent weeks,
Eurozone. EY Eurozone Forecast September 2014
 Eurozone EY Eurozone Forecast September 2014 Austria Belgium Cyprus Estonia Finland France Germany Greece Ireland Italy Latvia Luxembourg Malta Netherlands Portugal Slovakia Slovenia Spain Outlook for
The Manufacturers Life Insurance Co. (Phils.), Inc. (A Wholly Owned Subsidiary of The Manufacturers Life Insurance Company - Canada)
, Inc. (A Wholly Owned Subsidiary of The Manufacturers Life Insurance Company - Canada)") The Manufacturers Life Insurance Co. (Phils.), Inc. (A Wholly Owned Subsidiary of The Manufacturers Life Insurance Company - Canada) Parent Company Financial Statements December 31, 2016 and 2015 and Independent
The Manufacturers Life Insurance Co. (Phils.), Inc. (A Wholly Owned Subsidiary of The Manufacturers Life Insurance Company - Canada) Parent Company Financial Statements December 31, 2016 and 2015 and Independent