John L. Smallwood, CFP
|
|
|
- Prudence Quinn
- 6 years ago
- Views:
Transcription
1 Portfolio Presentation For YourWealthCurvePodCast Presented by: John L. Smallwood, CFP Symmetry Partners, LLC, is an investment adviser registered with the Securities and Exchange Commission. Please see disclosure page titled "Symmetry and ETF Disclosure" at the end of the presentation for additional information.
2 Table of Contents Introduction Welcome Your Investment Team Our Investment Strategy Disciplined Approach SPIVA Persistency Cost of Volatility Diversification Portfolio Engineering Our Recommendation Your Portfolio and Goals for It Asset Class Breakdown Appendix Portfolio Matrixes Portfolio Returns and Characteristics Portfolio Performance in Good and Bad Markets Ending Thoughts Disclosures
3 Welcome Thank you for your interest in Symmetry Portfolio. The goal of this proposal is to introduce you to our company, our client service process and our unique investment strategy. Review this proposal with your advisor and you will see how we believe Symmetry can improve your portfolio and how you can begin to take steps toward a secure financial future. Symmetry Partners builds portfolios based on more than 60 years of financial science firmly rooted in the belief that markets are largely efficient and that investment returns are determined principally by asset allocation, not market timing or stock selection. We believe that the most trustworthy and objective securities and market research to be found today exists in academia. As your investment manager, Symmetry offers the accountability and continuity that is so important for any long-term relationship. Symmetry takes pride in all client relationships and always puts your best interests first. We thank you for the opportunity to introduce you to our program, and we look forward to helping you enjoy a successful investment experience. Sincerely, Symmetry Partners


4 Your Investment Team DFA ($315.4 Billion)* & Academic Research Symmetry Partners ($7 Billion)** John L. Smallwood, CFP & YourWealthCurvePodCast Goal: Identify what determines stock performance and capture reliable asset class behavior Goal: Asset allocation to optimize risk exposures and return potential Goal: Improve client investment experience Value-Add: 3-Factor Model Cost Control Asset Class Funds Trading Control Value-Add: Institutional Portfolio Management Balanced Stategies Generate Reporting Manage Trading Value-Add: Evaluate Client's Unique Risk Tolerance Keep Client On Track To Achieve Personal Goals Create Custom Financial Plan Client Meetings and Periodic Reviews *As of September 30, 2013 **Symmetry manages more than $7 billion in combined assets under management and sub-advised assets as of 09/30/13. CA 04/30/13 S0011
 Established in 1981 Offices in Austin, Santa Monica, London, Sydney, Vancouver, and Amsterdam Approximately 65 Mutual Funds invested in approximately 50 Countries Funds")
5 Dimensional Fund Advisors Fast Facts $315.4 Billion AUM (as of 09/30/13) Established in 1981 Offices in Austin, Santa Monica, London, Sydney, Vancouver, and Amsterdam Approximately 65 Mutual Funds invested in approximately 50 Countries Funds open to institutional investment only individuals must invest through a select group of advisors Select Board of Directors Eugene Fama - Efficient Markets Hypothesis - Three-Factor Model - University of Chicago Kenneth French - Three-Factor Model - Advisory Editor, Journal of Finance - Dartmouth College Roger G. Ibbotson - Author of Stocks, Bonds, Bills and Inflation - Yale University Myron S. Scholes - Nobel Prize Winner - Stanford University Abbie J. Smith - Co-Editor, Journal of Accounting Research - University of Chicago
6 Symmetry Partners Firm Profile Investment advisory firm registered with the SEC Established in 1994 Home Office: 628 Hebron Ave., Building Two, 5 th Floor, Glastonbury, CT Asset management services available to individuals, institutions and retirement plans More than $7 billion in combined assets under management and sub-advised assets as of 09/30/13. Why Symmetry? We offer: A client-centric process supported by your financial advisor An investment methodology built on more than 60 years of academic research Low cost, tax efficient investment portfolios A variety of technology and support services designed to better the investment experience of our advisors and clients Our Offerings Symmetry s Structured Portfolios: Broadly diversified portfolios constructed from institutional mutual funds from Dimensional Fund Advisors (DFA). Symmetry s Structured Portfolios offer exposure to: 15 different asset classes - Approximately 12,000 securities Approximately 50 countries around the globe The GlobalCore ETF Portfolios: Globally weighted portfolios of exchange traded funds from providers including Vanguard, ishares and State Street Global Advisors. Through the GlobalCore ETF Portfolios, investors gain access to: More than 15 different asset classes Approximately 5,000 securities Approximately 50 countries around the globe Symmetry Bond Portfolios: Symmetry Bond Portfolios offer strategically allocated, broadly diversified fixed income solution that seeks to enhance returns through prudent exposure to maturity and credit risks


7 About Your Advisor John L. Smallwood, CFP John P. Smallwood Edward d E. Bao Smallwood Capital Management Smallwood Capital Management 1161 Broad Street, Suite 312 Shrewsbury, NJ Telephone: Fax: johnl@smallwoodcapital.com johnp@smallwoodcapital.com edwardb@smallwoodcapital.com Smallwood Capital Management is a comprehensive financial services firm that is committed to building clients futures on the foundations of solid financial planning processes. Utilizing an academic approach towards investment planning, paired with a deep knowledge of the unique needs of their clients, enables the advisors of Smallwood Capital Management to fully provide clients with the optimal service that they deserve. Smallwood Capital Management is passionate about continually providing confidence and clarity to clients in this ever changing navigation of wealth management so they may fully enjoy their wealth and pursue their dreams. Wealth management and financial planning Retirement planning Employer-sponsored retirement and benefit plans Business owner protection (e.g. Key Man, Buy-Sell) Securities offered through Securities America, Inc., Member FINRA/SIPC and advisory services offered through Securities America Advisors, Inc. Smallwood Capital Management, Symmetry, and the Securities America companies are separate entities.
8 A Disciplined Approach To Investment Management Rigorous Academic and Nobel Prize-Winning Theory Underpins the Construction of your Symmetry Portfolio Markets are Efficient Markets work and, for investment purposes, are fairly priced - Eugene F. Fama University of Chicago Paul Samuelson MIT, Nobel Prize Economics 1970 Diversification is Key Concentrated investments add risk with no additional expected return - Harry Markowitz Nobel Prize Economics 1990 Risk and Return are Inextricably Related Priced risk factors determine expected return - Robert Merton Nobel Prize Economics Stephen Ross MIT Structure Explains Performance Asset allocation principally determines results in a broadly diversified portfolio - Gary Brinson, Randolph Hood, Gilbert Beebower Roger Ibbotson, Paul Kaplan 2000 Diversification seeks to reduce volatility by spreading your investment dollars into various asset classes to add balance to your portfolio. Using this methodology, however, does not guarantee a profit or protection from loss in a declining market.
 report as of 5-year period ending 12/31/12.")
9 Can Active Managers Outperform Their Relative Benchmarks? Past performance is no guarantee of future results. Data courtesy of Standard & Poor s Index Versus Active (SPIVA) report as of 5-year period ending 12/31/12. Please see the disclosure labeled SPIVA Disclosure to fully understand the implications of the performance information.
10 Do Winners Keep Winning? Past performance vs. subsequent performance equity funds Winners Losers % of the 1,189 winning funds continue to win % of the 918 winning funds continue to win % of the 597 winning funds continue to win. The sample includes funds at the beginning of the three-, five-, and seven-year periods, ending in December The graph shows the proportion of funds that outperform and underperform their respective benchmarks. Winner funds are reevaluated in the subsequent period from 2010 to 2012, with the graph showing the proportion of outperformance and underperformance among past winners. See Data Appendix for more information. Data provided by the CRSP Mutual Fund Database. Source: CRSP data provided by the Center for Research in Security Prices, University of Chicago. Past performance is no guarantee of future results. For Advisor Use Only
11 Do Winners Keep Winning? Past performance vs. subsequent performance fixed income funds Winners Losers % of the 118 winning funds continue to win % of the 105 winning funds continue to win % of the 94 winning funds continue to win The sample includes funds at the beginning of the three-, five-, and seven-year periods, ending in December The graph shows the proportion of funds that outperform and underperform their respective benchmarks. Winner funds are reevaluated in the subsequent period from 2010 to 2012, with the graph showing the proportion of outperformance and underperformance among past winners. See Data Appendix for more information. Data provided by the CRSP Mutual Fund Database. Source: CRSP data provided by the Center for Research in Security Prices, University of Chicago. Past performance is no guarantee of future results. For Advisor Use Only.
12 The Real Cost of Volatility One of our primary goals is to reduce portfolio volatility Declines and Recoveries % Decline % Gain Needed For Recovery 100% 82% % Declines l % Gains -10% 11% -15% 18% -20% 25% -25% 33% -30% 43% -35% 54% -40% 67% -45% -50% This information should be reviewed in conjunction with the disclosure located on the end of the appendix.

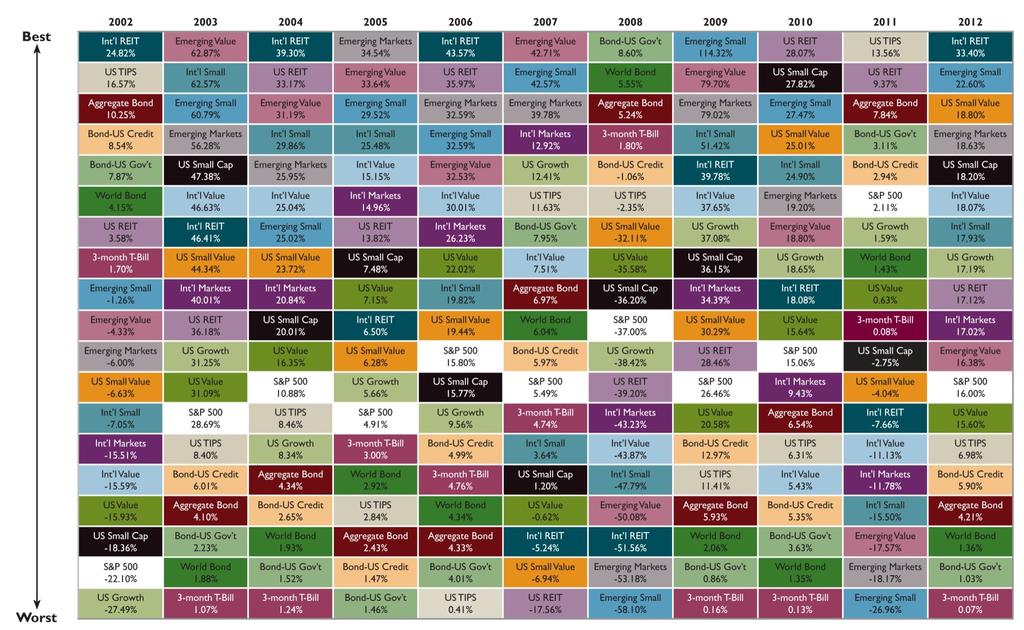
13 Broad Diversification is Essential
14 Portfolio Engineering Symmetry portfolios are engineered using the three-factor model of Eugene Fama (University of Chicago) and Kenneth French (Dartmouth College). The model identifies three independent dimensions of equity returns and allows us to measure their role in returns. Research shows that, over time, investors are rewarded for investing in stocks rather than bonds, small cap rather than large cap, and value, or distressed companies, rather than growth. Result: A portfolio that is more diversified and has improved risk management Step 3: We overweight Value Stocks Domestic and International US Large Cap Value US Small Cap Value Int l Large Cap Value Int l Small Cap Value Emerging Markets Value Step 2: We overweight Small Stocks Domestic and International Microcap Int l Small Cap Market Emerging Markets Emerging Markets Small Cap Step 1: We create your asset allocation with a core Market Portfolio

15 Your Portfolio Symmetry Qualified (Non Tax-Managed) Structured 60/40 The Symmetry 60% Equity Portfolio is fully diversified across global markets. It presently invests in the following DFA mutual funds, which target specific asset classes, and thus aim to capture the risk and reward characteristics of those classes. Your Symmetry Portfolio has been engineered using the three-factor model of Eugene Fama (University of Chicago) and Kenneth French (Dartmouth). The model identifies three independent dimensions of equity returns and allows us to measure their role in returns. US Equity Funds US Core 2 DFQTX 15.60% US Large Value DFLVX 7.80% US Vector DFVEX 11.40% Non- US Equity Funds Intl. Core DFIEX 4.20% Intl. Vector DFVQX 4.20% Intl. Value DFIVX 3.60% Emerging Core DFCEX 5.40% Emerging Value DFEVX 3.00% Global REITs DFGEX 4.80% Fixed Income One- Year Fixed DFIHX 18% Two- Year Global DFGFX 8% Five- Year Global DFGBX 12% Cash 2% 18% 8% 4.80% 12% 3.00% 2% 5.40% 15.60% 3.60% 4.20% 7.80% 4.20% 11.40% US Core 2 US Large Value US Vector Intl. Core Intl. Vector Intl. Value Emerging Core Emerging Value Global REITs One- Year Fixed Two- Year Global Five- Year Global Cash Factor 1: The Market Effect investors are compensated for the extra risk they assume investing in stocks over fixed income. Factor 2: The Size Effect investors are compensated for the extra risk they assume investing in small cap stocks over large cap stocks. Factor 3: The BtM Effect investors are compensated for the extra risk they assume investing in high BtM (or value ) stocks over low BtM (or growth ) stocks. Investors will not receive the exact allocations presented in this material due to a variety of implementation factors, including but not limited to: the custodian or trading platform s own trading algorithm, any changes in price that take place from the time the positions are calculated to the time they are actually traded. In some cases for certain custodians, positions with small allocations may be eliminated altogether. The holdings comprising the strategies and the allocations to those holdings have changed over time and may change in the future. Symmetry tax-managed portfolios are designed with the goal of increasing the portfolio s overall tax efficiency. Changes to portfolio holdings which comprise the portfolio may have tax consequences. If you sell assets in a taxable account, you may have to pay tax on any gain. While Symmetry seeks to mitigate tax exposure when possible, it is likely that investors will incur a taxable event while being invested in the portfolio. Fund allocation for the non-qualified (tax-managed) version of the Symmetry Portfolio is available on page 2. This information should be reviewed in conjunction with the disclosure located at the end of the presentation.

16 Your Portfolio Symmetry Non-Qualified (Tax-Managed) Structured 60/40 The Symmetry 60% Equity Portfolio is fully diversified across global markets. It presently invests in the following DFA mutual funds, which target specific asset classes, and thus aim to capture the risk and reward characteristics of those classes. Your Symmetry Portfolio has been engineered using the three-factor model of Eugene Fama (University of Chicago) and Kenneth French (Dartmouth). The model identifies three independent dimensions of equity returns and allows us to measure their role in returns. US Equity Funds TA US Core 2 DFTCX 15.60% TM Mktwd. Value DTMMX 7.80% US Vector DFVEX 11.40% US REITs DFREX 3.30% Non- US Equity Funds TA World ex US Core DFTWX 6.00% Intl. Vector DFVQX 4.80% TM Intl. Value DTMIX 4.20% Emerging Core DFCEX 3.90% Emerging Value DFEVX 3.00% Fixed Income Short- Term Muni DFSMX 18% Two- Year Global DFGFX 8% Five- Year Global DFGBX 12% Cash 2% Factor 1: The Market Effect investors are compensated for the extra risk they assume investing in stocks over fixed income. Factor 2: The Size Effect investors are compensated for the extra risk they assume investing in small cap stocks over large cap stocks. 18% 8% 3.00% 12% 3.90% 2% 4.20% 4.80% 15.60% 6.00% 7.80% 11.40% 3.30% TA US Core 2 TM Mktwd. Value US Vector US REITs TA World ex US Core Intl. Vector TM Intl. Value Emerging Core Emerging Value Short- Term Muni Two- Year Global Five- Year Global Factor 3: The BtM Effect investors are compensated for the extra risk they assume investing in high BtM (or value ) stocks over low BtM (or growth ) stocks. Cash Investors will not receive the exact allocations presented in this material due to a variety of implementation factors, including but not limited to: the custodian or trading platform s own trading algorithm, any changes in price that take place from the time the positions are calculated to the time they are actually traded. In some cases for certain custodians, positions with small allocations may be eliminated altogether. The holdings comprising the strategies and the allocations to those holdings have changed over time and may change in the future. Symmetry tax-managed portfolios are designed with the goal of increasing the portfolio s overall tax efficiency. Changes to portfolio holdings which comprise the portfolio may have tax consequences. If you sell assets in a taxable account, you may have to pay tax on any gain. While Symmetry seeks to mitigate tax exposure when possible, it is likely that investors will incur a taxable event while being invested in the portfolio. This information should be reviewed in conjunction with the disclosure located at the end of the presentation.
17 Our Goals For Your Portfolio Lower Volatility Global Diversification Lower Tax Exposure No Hidden Surprises
18 Appendix Portfolio Matrices Portfolio Returns and Characteristics Portfolio Performance in Good and Bad Markets Ending Thoughts Disclosures
19 Symmetry Structured 60/40 Model Portfolio Returns Data Matrix 1999 Balanced Strategy % Equity - 40% Fixed Assets in balance How to use this Chart 1) Locate the column for the first year of the interval (2001). Years are labeled at the top and bottom of each column. 2) Locate the row for the last year of the interval (2007). Years are labeled at the beginning of each row. 3) The intersection of the selected column and row displays the annualized return for that time period, i.e. The portfolio has an annualized return of 9.06% from 2001 to Past performance does not guarantee future results. The performance results above include the net effect of 0.50% investment management fee and mutual fund expenses. The performance information presented in this chart from January 1, 1999 to December 31, 2001 represents back tested performance based on live mutual fund data. Actual client performance may be better or worse depending upon when the client invested with Symmetry, rebalancing, cash flows and other factors unique to each client. Please see disclosure labeled Model Portfolio Returns Disclosure for additional limitations to the performance information.
20 Balanced Index Strategy Gross Returns Matrix % Equity - 40 % Fixed This is an index that closely tracks the Symmetry philosophy How to use this Chart 1) Locate the column for the first year of the interval (1986). Years are labeled at the top and bottom of each column. 2) Locate the row for the last year of the interval (2004). Years are labeled at the beginning of each row. 3) The intersection of the selected column and row displays the annualized return for that time period, i.e. The index has an annualized return of 11.5% from 1986 to Past performance does not guarantee future results. The data should be reviewed in conjunction with the disclosure located on the end of the appendix.
21 Structured Model Portfolio Returns Structured Structured Structured Structured Structured Structured Structured Structured Structured Structured Structured S&P 500 0/100 10/90 20/80 30/70 40/60 50/50 60/40 70/30 80/20 90/10 100/0 Index 0% Equities 10% Equities 20% Equities 30% Equities 40% Equities 50% Equities 60% Equities 70% Equities 80% Equities 90% Equities 100% Equities 100% Equities Since Jan Return Jan. 1, Oct. 31, Annual Standard Deviation Year Return Nov. 1, Oct. 31, Annual Standard Deviation Year Return Nov. 1, Oct. 31, Annual Standard Deviation Year Return Nov. 1, Oct. 31, Annual Standard Deviation Year Return Nov. 1, Oct. 31, Year-to-Date 2013 Jan. 1, Oct. 31, Past performance does not guarantee future results. The performance results above include the net effect of 0.50% investment management fee and mutual fund expenses. Please be advised that some of the portfolios may not be available through all broker-dealers. Actual client performance may be better or worse depending upon when the client invested with Symmetry, rebalancing, cash flows and other factors unique to each client. The performance information presented in this chart from January 1, 1999 to December 31, 2001 represents back tested performance based on live mutual fund data. Please see disclosure labeled Model Portfolio Returns Disclosure for additional limitations to the performance information..
22 Symmetry 60/40 Average Annual Returns During Good and Bad Market Periods: % Annual Average of Good Years 0.00% Annual Average of Bad Years 10.00% Annual Average of All Years 15.00% 10.00% 12.87% 10.92% 14.64% -5.00% % % -5.55% -9.43% 5.00% 7.61% 5.10% 4.74% 5.00% 0.00% % % % 0.00% Good Years: 1999, , Bad Years: , 2008 All Years: Portfolio performance data for the years 1999 through 2001 represents hypothetical returns. Classification of Good and Bad Years can also be found in the table below. The comparison above shows the Symmetry Portfolio against a mainstream equity and balanced index during good years, bad Structured 60/40 years, and the overall timeframe using averages of calendar year performance. Symmetry s performance will differ from that of the benchmarks based on the equity to fixed income mix and on differences in portfolio design. Returns depicted here are simple Lipper Balanced averages and do not include the effects of compounding or volatility of the investment, which would be incorporated in the S&P 500 annualized returns. Please see the chart below to view the difference between an annualized return and an average annual return over the available time frame. Choosing a Symmetry Balanced Portfolio takes the emotion out of investing while providing a disciplined, principled and low cost investment solution. Symmetry seeks to leverage the best of academic research by providing passively managed, globally diversified investments with targeted tilts toward small cap and value stocks. Calendar Year Returns for: Classification of Year Good Good Good Good Bad Good Good Good Good Good Bad Bad Bad Good Past performance does not guarantee future results. The above information is supplemented by the DFA Fund Performance and Symmetry During Good and Bad Periods Disclosure. The data should be reviewed in conjunction with the disclosure to understand additional limitations of the performance data. Data is from sources believed to be reliable but cannot be guaranteed or warranted. Created with Zephyr StyleADVISOR Avg. Annual Return Structured 60/40 Portfolio 11.54% -3.72% 13.76% 27.09% % 3.38% 14.78% 7.37% 13.55% 27.56% -3.32% 2.86% 2.08% 13.41% 7.61% 6.80% Lipper Balanced Fd IX 11.94% 0.74% 11.90% 23.35% % 6.53% 11.60% 5.20% 8.99% 19.94% % -3.24% 2.39% 8.98% 5.10% 4.34% Annualized Return S&P 500 Index 16.00% 2.11% 15.06% 26.46% % 5.49% 15.80% 4.91% 10.88% 28.69% % % -9.11% 21.04% 4.74% 2.94%
23 Symmetry Portfolio is a comprehensive investment program offered through select Broker Dealers. We build portfolios based on Nobel Prize-winning research with the belief that markets are efficient and that investment returns are determined principally by asset allocation, not market timing or stock picking. All portfolios employ a strategy designed to capture the return behavior of multiple asset classes. The firm has no economists forecasting business cycles or interest rates, no investment strategists shifting allocations between stocks and bonds, and no analysts searching out undiscovered stocks. Symmetry Structured 60/40 The Symmetry Structured 60/40 Allocation attempts to achieve long-term growth of principal with moderate capital preservation by investing primarily in stocks and short-term bonds. Typical investors in the portfolio are seeking capital growth and modest capital preservation over time, and usually have a minimum investment time horizon of six years. Structured 60/40 Allocation investors are willing to accept greater share price volatility than Moderate Allocation Investors. Portfolio Composition* % Regional Equity Exposure % Sector Equity Exposure % Domestic Equity 37.8 Africa/Middle East 1.15 Basic Materials 6.67 International Equity 22.2 Australasia 2.00 Consumer Cyclical Fixed Income 38.0 Asia Developed 5.48 Financial Services Cash* 2.0 Asia Emerging 4.71 Real Estate 9.06 Source: Morningstar Direct Europe Developed 9.22 Consumer Defensive 6.05 Europe Emerging 1.14 Healthcare 6.38 Japan 4.81 Utilities 1.67 Latin America 2.63 Communication Services 4.33 North America Energy United Kingdom 4.38 Industrials Technology 9.81 Based on latest available Morningstar data as of 09/30/13 Source: Morningstar Direct *Does not include small cash positions held by individual funds Morningstar All rights reserved. Use of this content requires expert knowledge. It is to be used by specialist institutions only. The information contained herein: (1) is proprietary to Morningstar and/or its content providers; (2) may not be copied, adapted or distributed; and (3) is not warranted to be accurate, complete or timely. Neither Morningstar nor its content providers are responsible for damages or losses arising from any use of this information, except where such damages and losses cannot be limited or excluded by law in your jurisdiction. Past financial performance is no guarantee of future results. This information should be reviewed in conjunction with the disclosure located on the end of the appendix.
24 Ending Thoughts We believe markets are quite efficient at pricing securities and all the effort managers expend in trying to beat the market are in most cases, wasted. We believe investors can expect to outperform riskless assets by holding a diversified equity portfolio, since stocks are priced to deliver higher expected returns as compensation for risk. Passive investment vehicles offer a diversified, efficient approach for the long term investor to capture capital market rates of return. Broadly speaking, there are four components Assets to in investing: balance. Cost Risk Taxes Return Investors can control the first three. Unfortunately, they all too often focus on the one component over which, we believe, they have no control: return. The Symmetry strategies provide a framework from which to build a low cost, diversified, tax-efficient portfolio that enables the investor to manage risk effectively. Capitalism will provide the returns. - Patrick A. Sweeny, Principal
25 Symmetry Disclosure With respect to the Symmetry portfolios referenced herein, Symmetry Partners, LLC is an investment advisory firm registered with the Securities and Exchange Commission. Symmetry charges an investment management fee for its services. All Symmetry Partners fees can be found in the ADV Part 2A located on the Symmetry Partners website, As with any investment strategy, there is the possibility of profitability as well as loss. Diversification seeks to reduce volatility by spreading your investment dollars into various asset classes to add balance to your portfolio. Using this methodology, however, does not guarantee a profit or protection from loss in a declining market. Rebalancing assets can have tax consequences. If you sell assets in a taxable account you may have to pay tax on any gain resulting from the sale. Please consult your tax advisor. Symmetry follows a passive investment strategy that involves limited ongoing buying and selling actions. Passive investors will purchase investments with the intention of long-term appreciation and limited maintenance. Passively managed portfolios are designed to closely track their respective benchmark index rather than seek out performance. As a result, the portfolio may hold securities regardless of the current or projected performance of a specific security or a particular industry or market sector. Maintaining investments in securities regardless of market conditions or the performance of individual securities could cause the portfolio to lose value if the market as a whole falls. The credit quality of the investment in the portfolio does not apply to the stability or safety of the fund. In an environment where interest rates may trend upward, rising rates will negatively impact most bond funds, and fixed income securities held by a fund are likely to decrease in value. Bond funds and individual bonds with a longer duration (a measure of the expected life of a security) tend to be more sensitive to changes in interest rates, usually making them more volatile than securities with shorter durations. DIFFERENT TYPES OF INVESTMENTS AND/OR INVESTMENT STRATEGIES INVOLVE VARYING LEVELS OF RISK, AND THERE CAN BE NO ASSURANCE THAT ANY SPECIFIC INVESTMENT OR INVESTMENT STRATEGY WILL BE EITHER SUITABLE OR PROFITABLE FOR YOUR PORTFOLIO. Allocation models are not intended to represent investment advice that is appropriate for all investors. Each investor must take into account his/her financial resources, investment goals, risk tolerance, investing time horizon, tax situation and other relevant factors to determine if such portfolio is suitable. Model composition is subject to change. You and your advisor should carefully consider your suitability depending on your financial situation. Higher potential return generally involves greater risk, short term volatility is not uncommon when investing in various types of funds including but not limited to: sector, emerging markets, small and mid-cap funds. International investing involves special risks such as currency fluctuation, lower liquidity, political and economic uncertainties, and differences in accounting standards. Risks of foreign investing are generally intensified for investments in emerging markets. Risks for emerging markets include risks relating to the relatively smaller size and lesser liquidity of these markets, high inflation rates and adverse political developments. Risks for investing in international Assets equity in include balance. foreign currency risk, as well as, fluctuation due to economic or political actions of foreign governments and/or less regulated or liquid markets. Risks for smaller companies include business risks, significant stock price fluctuation and illiquidity. Investing in real estate entails certain risks, including changes in: the economy, supply and demand, laws, tenant turnover, interest rates (including periods of high interest rates), availability of mortgage funds, operating expenses and cost of insurance. Some real estate investments offer limited liquidity options. An investor should carefully consider investment objectives, risks, charges and expenses before investing. To obtain a prospectus, which contains this and other information, please visit the following websites: Please read the prospectus carefully before investing.
26 DALBAR Disclosure Symmetry Partners, LLC is an investment advisory firm registered with the Securities and Exchange Commission. Symmetry charges an investment management fee for its services. All Symmetry Partners fees can be found in the ADV Part 2A located on the Symmetry Partners website, Diversification seeks to reduce volatility by spreading your investment dollars into various asset classes to add balance to your portfolio. Using this methodology, however, does not guarantee a profit or protection from loss in a declining market. Different types of investments and/or investment strategies involve varying levels of risk, and there can be no assurance that any specific investment or investment strategy will either be suitable or profitable for your portfolio. You and your advisor should carefully consider your suitability depending on your situation. Symmetry follows a passive investment strategy that involves limited ongoing buying and selling actions. Passive investors will purchase investments with the intention of long-term appreciation and limited maintenance. Passively managed portfolios are designed to closely track their respective benchmark index rather than seek outperformance. As a result, the portfolio may hold securities regardless of the current or projected performance of a specific security or a particular industry or sector. Maintaining investments in securities regardless of market conditions or the performance of individual securities could cause the portfolio to lose value if the market as a whole fails. Source: Quantitative Analysis of Investor Behavior, 2013, DALBAR, Inc. Equity benchmark performance and systematic equity investing examples are represented by the Standard & Poor s 500 Composite Index, an unmanaged index of 500 common stocks generally considered representative of the U.S. stock market. Indexes do not take into account the fees and expenses associated with investing, and individuals cannot invest directly in any index. Past performance cannot guarantee of future results. Average stock investor performance results are based on a DALBAR study, Quantitative Analysis of Investor Behavior (QAIB), DALBAR is an independent, Boston-based financial research firm. Using monthly fund data supplied by the Investment Company Institute, QAIB calculates investor returns as the change in total mutual fund assets after excluding sales, redemptions and exchanges. This method of calculation captures realized and unrealized capital gains, dividends, interest, trading costs, sales charges, fees, expenses and any other costs. After calculating investor returns in dollar terms, two percentages are calculated Assets for the period in balance. examined: Total investor return rate and annualized investor return rate. Total return rate is determined by calculating the investor return dollars as a percentage of the net of the sales, redemptions, and exchanges for the period. Standard & Poor s 500 Index represents the 500 leading U.S. companies, approximately 80% of the total U.S. market capitalization. Indices are unmanaged. Investors cannot directly invest in an index. Indexes have no fees. Historical performance results for indexes generally do not reflect the deduction of transaction and/or custodial charges or investment management fees, the incurrence of which have the effect of decreasing historical performance results. Actual performance for client accounts may differ materially from index portfolios.
27 SPIVA Disclosure Symmetry Partners, LLC, is an investment adviser registered with the Securities and Exchange Commission. The firm only transacts business in states where it is properly registered, or excluded or exempted from registration requirements. No current or prospective client should assume that future performance of any specific investment, investment strategy, or product made reference to directly or indirectly in this piece will be profitable. As with any investment strategy, there is a possibility or profitability as well as loss. All data is from sources believed to be reliable but cannot be guaranteed or warranted. Symmetry charges an investment management fee for its services. All Symmetry Partners fees can be found in the ADV Part 2A located on the Symmetry Partners website, As with any investment strategy, there is the possibility of profitability as well as loss. Diversification seeks to reduce volatility by spreading your investment dollars into various asset classes to add balance to your portfolio. Using this methodology, however, does not guarantee a profit or protection from loss in a declining market. Rebalancing assets can have tax consequences. If you sell assets in a taxable account you may have to pay tax on any gain resulting from the sale. Please consult your tax advisor. Different types of investments and/or investment strategies involve varying levels of risk, and there can be no assurance that any specific investment or investment strategy will either be suitable or profitable for your portfolio. You and your advisor should carefully consider your suitability depending on your situation. Symmetry follows a passive investment strategy that involves limited ongoing buying and selling actions. Passive investors will purchase investments with the intentions of long-term appreciation and limited maintenance. Passively managed portfolios are designed to closely track their respective benchmark index rather than seek out performance. As a result, the portfolio may hold securities regardless of the current or projected performance of a specific security or a particular industry or market sector. Maintaining investments in securities regardless of market conditions or the performance of individual securities could cause the portfolio to lose value if the market as a whole falls. Past performance is no guarantee of future results. Data courtesy of Standard & Poor s Index Versus Active (SPIVA) report as of 5-year period ending 12/31/12. The SPIVA Scorecard presents the performances of actively managed mutual funds as compared to benchmark indices. It covers U.S. equity, international equity and fixed income categories. Percentages represent the percent of the equal-weighted asset class that is outperformed by its relative benchmark as defined below. The analysis shows that in most cases the number of active managers in the given asset classes underperforming the benchmark is higher than the number outperforming, though randomly in any one asset class the number of active managers outperforming the relevant benchmark is more than 50%. This same general conclusion holds for each five-year holding period ending December going back to Dec. 2002, as analyzed by SPIVA, except for the period ending Dec. 2007, for which SPIVA did not create a report. Active manager data is obtained from the CRSP Survivorship-Bias-Free US Mutual Fund Database for the 2008 analysis and from the S&P Mutual Fund database, a continuous, Assets consistent, in balance. survivorship-bias free database. Data is from sources believed to be reliable, but cannot be guaranteed or warranted. All indexes have certain limitations. Investors cannot invest directly in an index. Indexes have no fees. Historical performance results for investment indexes generally do not reflect the deduction of transaction and/or custodial charges or the deduction of an investment management fee, the incurrence of which would have the effect of decreasing historical performance results. Actual performance for client accounts may differ materially from the index portfolios. The SPIVA comparison is made against the average active manager performance. Investors cannot invest in the average active manager. S&P 500 Index: Widely regarded as the best single gauge of the U.S. equities market, this market capitalization-weighted index includes a representative sample of 500 leading companies in leading industries of the U.S. economy and provides over 80% coverage of U.S. equities. S&P MidCap 400 Index: This index consists of 400 mid-sized companies and covers approximately 7% of the U.S. equities market. S&P SmallCap 600 Index: This index consists of 600 small-cap stocks and covers approximately 3% of the U.S. equities market. S&P Composite 1500 Index: This is a broad market, capitalization weighted index of 1500 stocks. This index is comprised of three size-based indices: The S&P 500 Index, the S&P MidCap 400 Index, and the S&P SmallCap 600 Index, which measures the performance of large-, mid- and small-cap stocks respectively. This index represents 90% of U.S. equities. S&P United States REIT Index: This index measures the investable universe of publicly traded real estate investment trusts. S&P 700 Index: This index measures the non-united States component of the global equity markets. The index covers all of the regions included in the S&P Global 1200 except for the United States (S&P 500). S&P/IFCI Composite Index: This index is widely recognized as a comprehensive and reliable measure of the world s emerging markets. It measures the returns of stocks that are legally and practically available to foreign investors. Barclays Capital 1-3 Year Government Bond Index: This index consists of U.S. Treasury and U.S. Government agency bonds with maturities from one to three years. Barclays Capital 1-3 Year Government/Credit Bond Index: This index covers corporate and non-corporate fixed-income securities that are rated investment grade and have 1-3 yrs to final maturity. For further information regarding Standard and Poor s Indices Versus Active Funds Scorecard, please go to
.")
28 Disclosures Real Cost of Volatility The data for the chart is calculated by an arithmetic formula and rounding. Please look at the first column on the chart, (-10% decline and 11% increase). If $ invested decreases 10% to $90.00, then an 11% increase would be needed to recover the original investment, ($90.00 x 11% = 9.9 rounded to $ $90.00 = $100.00). The chart does not constitute a complete description of investment services and is for informational purposes only. Other factors such as investment objectives, expenses, etc., should also be considered. The chart does not represent a solicitation of a formula for security selection. Broad Diversification is Essential

29 Disclosures Broad Diversification is Essential Continued
30 Disclosures Symmetry Portfolio Past performance is no guarantee of future results. The data represents Symmetry Portfolio s asset allocation and funds for one portfolio. The portfolio is designed based on historical data achieved through academic research as described in the material. The data is not a complete description of the investment services offered. Different types of investment strategies involve varying degrees of risk, and there can be no assurance that any specific investment strategy will either be suitable or profitable. Other factors such as investment objectives, expenses, etc., should also be considered. The prospectus contains this and other information about the investment company. Prospectus may be obtained from your advisor or from Dimensional Fund Advisors at Please read the prospectus carefully before investing or sending money. Investment return and principal value of an investment in a fund(s) will fluctuate so that an investor s shares when redeemed may be worth more or less than their original cost. Model Portfolio Returns Data Matrix Example of rebalancing: assuming no additional cash flows, a qualified Structured 60/40 Portfolio net the effect of.50% with an annual rebalance in September would have returned 19.54% during the 2009 calendar year. The same portfolio rebalanced in March would have returned 30.27% over the same time frame. The model returns are currently rebalanced in April as that is the date of the last model change, which occurred in Please note that 2009 was marked by unusual volatility that caused a wider dispersion in returns based on time of rebalance, particularly for portfolios with both equity and fixed income. Our experience is that in most periods, the difference in return due to rebalance date is markedly lower. Please note that the performance information presented through the time period May 31, 2006, is the result of the Symmetry Legacy Portfolios. The Legacy Portfolios are comprised of the following Dimensional Fund Advisor funds: DFLCX, DFLVX, DFSCX, DFSVX, DFREX, DFIVX, DFISX, DISVX, DFEMX, DFEVX, DEMSX, DFIHX, DFFGX, DFGFX, DFGBX, and the asset allocation assigned to each fund pursuant to the strategy and structure of the portfolio, (i.e., 100% equity, etc.). As of June 1, 2006, Symmetry made changes to the Portfolios and following funds: DFLCX, DFSCX, DFSVX, DFIVX, DFEMX, DEMSX, and DFFGX were replaced by DFQTX, DFVEX, DFCEX, and DFIEX. As of April 1, 2008, Symmetry has added DFITX (International Real Estate Fund) to the Portfolios. Please be advised that the information presented does not include Symmetry Partners Non-Qualified (tax-managed) Portfolios, which contain funds that are geared toward achieving tax efficiency. Symmetry tax-managed portfolios are designed with the goal of increasing the portfolio s overall tax efficiency. Changes to portfolio holdings which comprise the portfolio may have tax consequences. If you sell assets in a taxable account, you may have to pay tax on any gain. While Symmetry seeks to mitigate tax exposure when possible, it is likely that investors will incur a taxable event while being invested in the portfolio. Past performance is no guarantee of future results. Investment return and principal value of an investment in the fund(s) will fluctuate so that an investor s shares when redeemed may be worth more or less than their original cost. As with any investment strategy, there is a potential for profit as well as the possibility of loss. The Symmetry investment strategy is based on a hybrid of Modern Portfolio Theory and Efficient Market Hypothesis. The strategy employs passive management with emphasis on diversity in order to reduce risk. The portfolios are designed, based on historical performance data, for funds to be invested and allocated in approximately three to fifteen mutual funds as determined by academic research. The data shown represents model portfolios constructed by Symmetry Partners utilizing DFA, (Dimensional Fund Advisors), mutual funds. DFA creates mutual funds that attempt to track proprietary indexes. The performance information presented in this chart from January 1, 1999, to December 31, 2001, represents back tested performance figures based on live mutual fund data. The period of January 1, 2002, to the present represents the time period the portfolios were constructed and are model returns with historical data from live DFA mutual funds. The back tested and model performance figures assume reinvested dividends and capital gains. The performance results include the net effect of.50% investment management and mutual fund expenses. Symmetry s compensation is the investment management fee only and Symmetry is not paid any form of compensation or commission from any mutual fund company or brokerdealer. Back tested and model performances have certain limitations and do not reflect actual client performance. Actual client accounts may vary significantly from the model performances due to factors unique to each client. The performance figures include yearly rebalancing, a 2% cash position, but do not take into consideration actual trading in client accounts, advisor or referral fee, transaction costs such as wire transfer fee, etc., and the custodian fee. All of which, when deducted, would reduce returns. The performance figures also exclude nondiscretionary assets, which are not part of Symmetry s model portfolios. The back tested performance results also differ from actual performance because it is achieved through the retroactive application of Symmetry s model portfolios. For all data periods, the Symmetry Portfolio returns data is provided by Dimensional Fund Advisors and is imported in Zephyr StyleADVISOR from the DFA software program. The performance figures and standard deviations are calculated utilizing Zephyr StyleADVISOR and inputting the appropriate time range and corresponding months. Standard deviation is a measure of the risk of an investment that measures the dispersion of returns around the average return. The higher the standard deviation, the more volatile, or risky the investment has been based on historical returns.
Dimensional Fund Advisors
 Dimensional Fund Advisors Putting Financial Science to Work for You Dimensional Fund Advisors LP is an investment advisor registered with the Securities and Exchange Commission. Consider the investment
A Different Way to Invest
 A Different Way to Invest Dimensional Fund Advisors LP is an investment advisor registered with the Securities and Exchange Commission. Consider the investment objectives, risks, and charges and expenses
Dimensional Fund Advisors
 Dimensional Fund Advisors Putting Financial Science to Work for You Dimensional Fund Advisors LP is an investment advisor registered with the Securities and Exchange Commission. Consider the investment
Symmetry Partners Panoramic Fund Transition Guide
 Partners Fund Transition Guide For Advisor Use Only. Not For Public Distribution. In Q4 2018, Partners will reallocate the Structured mutual fund portfolios to a series of institutional class fund-of-funds/sub-advised
Dimensional Fund Advisors Putting Financial Science to Work for You
 Dimensional Fund Advisors Putting Financial Science to Work for You Dimensional Fund Advisors LP is an investment advisor registered with the Securities and Exchange Commission. Consider the investment
SOLVING THE INVESTMENT PROBLEM
 SOLVING THE INVESTMENT PROBLEM The Fundamentals of Asset Class Investing FOCUS ON INVESTING Investing Is About You We Are Living Longer No matter what your age, you can expect to live much longer than
THE FUNDAMENTALS OF ASSET CLASS
 INVESTING THE FUNDAMENTALS OF ASSET CLASS INVESTING Solving the Investment Problem The first goal of your financial plan should be to avoid outliving your money Investing Is About You We Are Living Longer
Structured Portfolio Enhancements
 Structured Portfolio Enhancements For additional information regarding Symmetry Partners, LLC, Factor Investing, AQR Capital Management, Dimensional Fund Advisors, and the Vanguard Group, please see the
Source: Morningstar, Inc., IFA, ifabt.com IFA Index Portfolios are shown net of 90 bps advisory fees. See the attached disclosures or ifabt.
 Source: Morningstar, Inc., IFA, ifabt.com IFA Index Portfolios are shown net of 90 bps advisory fees. See the attached disclosures or ifabt.com for more details on the construction and historical data
Dimensional Fund Advisors: DC Services
 Fund Advisors: DC Services April 11, 2017 Austin Rosenthal, Regional Director This information is provided for registered investment advisors and institutional investors and is not intended for public
DIMENSIONAL FUND ADVISORS. Putting Financial Science to Work
 DIMENSIONAL FUND ADVISORS Putting Financial Science to Work Dimensional invests differently. We build portfolios based on the science of capital markets. Decades of research guide the way. For more than
New Perspectives on Asset Class Investing
 New Perspectives on Asset Class Investing Steven J. Atkinson, CFS Loring Ward Executive Vice President 2014 LWI Financial Inc. All rights reserved. LWI Financial Inc. ( Loring Ward ) is an investment advisor
Voya Life Companies Asset Allocation Solutions
 Voya Life Companies Asset Allocation Solutions Voya Global Perspectives Portfolio Voya Retirement Portfolios Custom Allocation Models This material must be preceded or accompanied by the variable universal
Pursuing a Better Investment Experience
 Pursuing a Better Investment Experience Last updated: April 2016 1. Embrace Market Pricing World Equity Trading in 2015 Daily Average Number of Trades 98.6 million Dollar Volume $447.3 billion The market
Performance Monitoring Report
 Performance Monitoring Report First Quarter 2014 An Index Fund Advisors, Inc. Quarterly Fiduciary Report on the Performance of Peer Groups and their Comprised Funds. ABC Company 401(k) and Profit Sharing
Aspiriant Risk-Managed Equity Allocation Fund RMEAX Q4 2018
 Aspiriant Risk-Managed Equity Allocation Fund Q4 2018 Investment Objective Description The Aspiriant Risk-Managed Equity Allocation Fund ( or the Fund ) seeks to achieve long-term capital appreciation
Pursuing a Better Investment Experience
 Pursuing a Better Investment Experience Last updated: February 2017 1. Embrace Market Pricing World Equity Trading in 2016 Daily Average Number of Trades 82.7 million Dollar Volume $346.4 billion The market
TIME TARGETED EQUITY PORTFOLIOS
 TIME TARGETED EQUITY PORTFOLIOS 1 3 Year 4 6 Year Equity 7 15 Year 15+ Year Global Diversification Exposure to a large number of securities around the world reduces the risk that any one stock or any one
Performance Monitoring Report
 Performance Monitoring Report Fourth Quarter 2018 Petroleum Equipment Construction 401(k) Plan An Index Fund Advisors, Inc. Quarterly Fiduciary Report on the Performance of Peer Groups and Their Comprised
ELC Advisors, LLC. Efficient Low Cost Wealth Management
 ELC Advisors, LLC Efficient Low Cost Wealth Management ELC Advisors, LLC Our principles Clients come first As an RIA, ELC Advisors adheres to the fiduciary standard No misaligned incentives, as with broker
WORKING TOGETHER Design Build Protect
 WORKING TOGETHER Design Build Protect 2018 LWI Financial Inc. All rights reserved. LWI Financial Inc. ( Loring Ward ) is an investment adviser registered with the Securities and Exchange Commission. Securities
WORKING TOGETHER Design Build Protect
 WORKING TOGETHER Design Build Protect Presenter Presenter Title, Loring Ward 2016 LWI Financial Inc. All rights reserved. LWI Financial Inc. ( Loring Ward ) is an investment adviser registered with the
Active Management Since 2001
 Active Management Since 2001 PRESENTED BY John L. Smallwood, CFP Senior Wealth Advisor Smallwood Capital Management Commonwealth Financial Network Providing Investment Management of: Fee Based Brokerage
Equity Volatility and Covered Call Writing
 December 2017 Equity Volatility and Covered Call Writing Executive Summary Amid uncertainty in the markets and investor desire for lower volatility, investors may want to consider a covered call strategy
Risk-Efficient Investment Portfolios from AlphaSimplex Group. Strategies that put risk management first
 Risk-Efficient Investment Portfolios from AlphaSimplex Group Strategies that put risk management first Agenda About AlphaSimplex Group (ASG) The need for active risk management Introducing the AlphaSimplex
PART TWO: PORTFOLIO MANAGEMENT HOW EXPOSURE TO REAL ESTATE MAY ENHANCE RETURNS.
 PART TWO: PORTFOLIO MANAGEMENT HOW EXPOSURE TO REAL ESTATE MAY ENHANCE RETURNS. MAY 2015 Burland East, CFA CEO American Assets Capital Advisers Creede Murphy Vice President, Investment Analyst American
The benefits of core-satellite investing
 The benefits of core-satellite investing Contents 1 Core-satellite: A powerful investment approach 3 The key benefits of indexing the portfolio s core 6 Core-satellite methodology Core-satellite: A powerful
INVESTING LIKE THE HARVARD AND YALE ENDOWMENT FUNDS JUNE Frontierim.com
 INVESTING LIKE THE HARVARD AND YALE ENDOWMENT FUNDS JUNE 2016 F Frontierim.com Introduction The US University Endowment Funds ( US Endowment Funds ), such as Harvard and Yale, have been leaders in diversified
INVESTING 4 STEPS TO AN EFFECTIVE PORTFOLIO
 INVESTING 4 STEPS TO AN EFFECTIVE PORTFOLIO Invested in Your Goals 4 Steps to an Effective Portfolio Investing makes it possible for many of us to achieve important lifetime goals, such as retirement.
SAMPLE. Portfolio Insights Analysis. May 16, years, 1 month. Improve growth. Minimize impact of market volatility BENCHMARK DATE RANGE GOAL
 May 16, 2018 Portfolio Insights Analysis ILOVEJP Sample Portfolio BENCHMARK JPMorgan 80-20 Benchmark DATE RANGE 10 years, 1 month GOAL Improve growth CONCERN Minimize impact of market volatility As the
Investment Policy Guidelines & Strategies Within the Context of. The American Law Instituteʼs Restatement of the Law Third: Trusts
 Investment Policy Guidelines & Strategies Within the Context of The American Law Instituteʼs Restatement of the Law Third: Trusts Prudent Investor Rule Introduction The purpose of this paper is to summarize
Tactical Core Equity Portfolio Strategy Global core equity portfolio strategy that seeks to outperform equity markets while minimizing volatility
 EquityCompass Tactical Core Equity Portfolio Strategy Global core equity portfolio strategy that seeks to outperform equity markets while minimizing volatility Approved for public distribution Investment
Dimensional Fund Advisors Putting Financial Science to Work for You
 Dimensional Fund Advisors Putting Financial Science to Work for You Data as at 31 March 2016 This information is provided for financial advisers and their clients and wholesale investors. Dimensional Fund
Strength Through Structure Strategies for the Goal-Focused Investor
 Strength Through Structure Strategies for the Goal-Focused Investor Introduction In a world that offers a bewildering array of investment options, there is a need for an approach that delivers clarity
THE PROBLEM WITH BUY & HOLD
 RETIREMENT INCOME THE PROBLEM WITH BUY & HOLD WBI does not stand for We Beat Indexes ; it stands for Wealth Builders, Inc. At WBI, we believe preserving capital to unleash the powerful benefits of compounding
TACTICAL DIVIDEND INCOME
 TACTICAL DIVIDEND INCOME THE PROBLEM WITH BUY & HOLD WBI does not stand for We Beat Indexes ; it stands for Wealth Builders, Inc. At WBI, we believe preserving capital to unleash the powerful benefits
INVEST IN SOMETHING REAL NOT FOR USE IN OHIO.
 TM INVEST IN SOMETHING REAL NOT FOR USE IN OHIO. RISK FACTORS u Past performance is not a guarantee of future results. u Investing in real estate assets entails certain risks, including changes in: the
IMPORTANT DISCLOSURES
 Expand Your Reach. IMPORTANT DISCLOSURES This presentation is for educational purposes only and is not intended to project the performance of any specific investment. May not be suitable for all investors.
Managed Accounts. FTA/Morningstar Multi-Discipline 75/25 Strategy. First Quarter 2018
 Managed Accounts FTA/Morningstar Multi-Discipline 75/25 Strategy First Quarter 2018 Firm Profile First Trust Advisors L.P./First Trust Portfolios L.P. Established in 1991; privately owned Over 700 employees
Value-Added Services
 Value-Added Services Structured Asset Class Investment Strategies Introduction The collapse in growth stock prices following the Technology/Internet bubble of the late 90 s, along with the current financial
Dividend Growth as a Defensive Equity Strategy August 24, 2012
 Dividend Growth as a Defensive Equity Strategy August 24, 2012 Introduction: The Case for Defensive Equity Strategies Most institutional investment committees meet three to four times per year to review
Index and Enhanced Index Funds
 Index and Enhanced Index Funds By David G. Booth Co-Chairman, Chief Executive Officer and Chief Investment Officer Dimensional Fund Advisors Inc. April 2001 Dimensional Fund Advisors' investment strategies
HEARTLAND VALUE FUND
 HEARTLAND VALUE FUND An investor should consider the Fund s investment objectives, risks, and charges and expenses carefully before investing or sending money. This and other important information can
Performance Monitoring Report
 Performance Monitoring Report Third Quarter 2018 ABC Company 401(k) and Profit Sharing Plan (Demo Only) An Index Fund Advisors, Inc. Quarterly Fiduciary Report on the Performance of Peer Groups and Their
q merrill edge guided investing strategy profile CIO Moderately Conservative ETF Core Tax Aware
 Overview This Strategy seeks to provide diversified exposure among three major asset classes for a client's account with a moderately conservative target asset allocation. In normal market conditions,
Sustainable Investment Solutions Personalized Investment Plan
 Sustainable Investment Solutions Personalized Investment Plan Portfolio Recommendation and Investment Policy Statement Prepared for John Q. Sample and Mary R. Sample February 11, 2014 By First Affirmative
GOAL ENGINEER SERIES PORTFOLIO HIGHLIGHTS:
 GOAL ENGINEER SERIES The Goal Engineer Series combines Northern Trust s asset allocation, portfolio construction and risk management expertise with Engineered Equity TM and active fixed income strategies
PROFESSIONALLY MANAGED INVESTMENT SOLUTIONS THROUGH EXCHANGE TRADED FUNDS
 PROFESSIONALLY MANAGED INVESTMENT SOLUTIONS THROUGH EXCHANGE TRADED FUNDS CALING THE HEIGHTS SCALING THE HEIGHTS I WITH EXCHANGE TRADED FUNDS Y THE INVESTMENT CREATED FOR INSTITUTIONS IS NOW AVAILABLE
UMA Model Portfolios Professional Advice for Your Unified Managed Account
 UMA Model Portfolios Professional Advice for Your Unified Managed Account B The introduction of unified managed accounts has helped many investors to consolidate and streamline their investment portfolios.
Managed Accounts. FTA/Morningstar International Core Strategy. First Quarter 2018
 Managed Accounts FTA/Morningstar International Core Strategy First Quarter 2018 Firm Profile First Trust Advisors L.P./First Trust Portfolios L.P. Established in 1991; privately owned Over 700 employees
2 ADAPTING TO 1 A FLEXIBLE 3 SEEKING TAX- 4,000 2,368 TAXABLE INVESTMENT EARNINGS STRATEGIC MUNICIPAL OPPORTUNITIES FUND KEPT $ KEPT $
 www.blackrock.com STRATEGIC MUNICIPAL OPPORTUNITIES FUND Today s income investors are challenged with high taxes, volatile interest rates and greater overall risks. Consider re-evaluating traditional approaches
CALM, COOL AND INVESTED
 CALM, COOL AND INVESTED Staying on track to live the life you want This brochure provides year-end performance. When data for subsequent quarters are available, the brochure must be accompanied by a performance
SEEKING A BALANCE OF SAFETY AND TOTAL RETURN
 SEEKING A BALANCE OF SAFETY AND TOTAL RETURN PRUDENTIAL SHORT-TERM CORPORATE BOND FUND, INC. MORNINGSTAR OVERALL RATING Class R Class A, Q, and Z Positive performance in the past 26 out of 27 years Portfolio
STRATEGY OVERVIEW. Long/Short Equity. Related Funds: 361 Domestic Long/Short Equity Fund (ADMZX) 361 Global Long/Short Equity Fund (AGAZX)
 361 Global Long/Short Equity Fund (AGAZX)") STRATEGY OVERVIEW Long/Short Equity Related Funds: 361 Domestic Long/Short Equity Fund (ADMZX) 361 Global Long/Short Equity Fund (AGAZX) Strategy Thesis The thesis driving 361 s Long/Short Equity strategies
STRATEGY OVERVIEW Long/Short Equity Related Funds: 361 Domestic Long/Short Equity Fund (ADMZX) 361 Global Long/Short Equity Fund (AGAZX) Strategy Thesis The thesis driving 361 s Long/Short Equity strategies
Fortigent Alternative Investment Strategies Model Wealth Portfolios Fortigent, LLC.
 Fortigent Alternative Investment Strategies Model Wealth Portfolios Important Disclaimers The information provided is for educational purposes only and is not intended to be, and should not be construed
Tactical Income ETF. Investor Presentation N ORTHC OAST I NVESTMENT A DVISORY T EAM NORTHCOASTAM. COM
 Tactical Income ETF Investor Presentation N ORTHC OAST I NVESTMENT A DVISORY T EAM 203.532.7000 INFO@ NORTHCOASTAM. COM NORTHCOAST ASSET MANAGEMENT An established leader in the field of tactical investment
Demystifying the Role of Alternative Investments in a Diversified Investment Portfolio
 Demystifying the Role of Alternative Investments in a Diversified Investment Portfolio By Baird s Advisory Services Research Introduction Traditional Investments Domestic Equity International Equity Taxable
1607 GROUP AT MORGAN STANLEY
 W E A L T H M A N A G E M E N T I. Overview TABLE OF CONTENTS: II. 1607 Portfolio III. 1607 Income Growth Portfolio IV. Investment Team WEALTH MANAGEMENT WEALTH MANAGEMENT O V E R V I E W Our Business:
Investment Advisory Whitepaper
 Program Objective: We developed our investment program for our clients serious money. Their serious money will finance their important long-term family and personal goals including retirement, college
TACTICAL DIVIDEND GROWTH
 TACTICAL DIVIDEND GROWTH THE PROBLEM WITH BUY & HOLD WBI does not stand for We Beat Indexes ; it stands for Wealth Builders, Inc. At WBI, we believe preserving capital to unleash the powerful benefits
Principal LifeTime Hybrid 2010 CIT Z as of 03/31/2018
 Principal LifeTime Hybrid 2010 CIT Z as of 03/31/2018 Investment Strategy The investment option seeks a total return consisting of long-term growth of capital and current income. To pursue its goal, this
Personalized Investment Proposal
 Personalized Investment Proposal Client: Mr. Moderate Conservative Prepared on: 11/13/2016 Advisor Name Financial Advisor Advisor Address Advisor City, St zip Advisor Phone Advisor@email.com ATIA Advisor:
Investing Like the Harvard and Yale Endowment Funds
 Investing Like the Harvard and Yale Endowment Funds Michael W. Azlen, CAIA Frontier Investment Management Ilan Zermati Frontier Investment Management Introduction The US University Endowment Funds ( US
Performance Monitoring Report
 Performance Monitoring Report Second Quarter 2018 Sample Client PMR An Index Fund Advisors, Inc. Quarterly Fiduciary Report on the Performance of Peer Groups and Their Comprised Funds. Summary # Fund Name
Principal LifeTime Hybrid 2010 CIT Z15 as of 12/31/2017
 Principal LifeTime Hybrid 2010 CIT Z15 as of 12/31/2017 Investment Strategy The investment option seeks a total return consisting of long-term growth of capital and current income. To pursue its goal,
INVESTMENT PLAN. Sample Client. For. May 04, Prepared by : Sample Advisor Financial Consultant.
 INVESTMENT PLAN For Sample Client May 04, 2012 Prepared by : Sample Advisor Financial Consultant sadvisor@loringward.com Materials provided to approved advisors by LWI Financial Inc., ( Loring Ward ).
Begin Your Journey With Stock Bond Decisions Prepared by Paul Tanner Chartered Financial Analyst
 A Granite Hill Investment Field Guide Begin Your Journey With Stock Bond Decisions Prepared by Paul Tanner Chartered Financial Analyst Flip open a popular financial magazine. Browse its Web presence. Visit
Principal LifeTime Hybrid 2010 CIT I25 as of 03/31/2017
 Principal LifeTime Hybrid 2010 CIT I25 as of 03/31/2017 Investment Strategy The investment option seeks a total return consisting of long-term growth of capital and current income consistent with the investment
Does greater risk equal greater reward?
 Does greater risk equal greater reward? The simple answer is not always, which is why investors may look at lower-volatility fund options like GuideStone s Defensive Market Strategies Fund. The Fund aims
Aspiriant Defensive Allocation Fund RMDFX Q3 2018
 Aspiriant Defensive Allocation Fund RMDFX Q3 2018 Investment Objective Description The Aspiriant Defensive Allocation Fund ( RMDFX or the Fund ) seeks to achieve long-term investment returns with lower
Great-West SecureFoundation(R) Bal Inv
 Bal Inv") The volatility, when shown, Moderate The volatility measure will always be displayed. If the Blend Credit / Interest Rate Moderate Term ium Objective & Strategy The investment seeks long-term capital appreciation
The volatility, when shown, Moderate The volatility measure will always be displayed. If the Blend Credit / Interest Rate Moderate Term ium Objective & Strategy The investment seeks long-term capital appreciation
DESIGNED FOR TODAY S AND TOMORROW S INVESTMENT CHALLENGES
 DESIGNED FOR TODAY S AND TOMORROW S INVESTMENT CHALLENGES PRUDENTIAL REAL ASSETS FUND EFFECTIVE JUNE 11, 2018, THE FUND S NEW NAME WILL BE PGIM REAL ASSETS FUND. FUND SYMBOLS WILL NOT CHANGE. Potential
PMS 2622 PMS % Blk PMS 390
 at a glance THE CAMBRIDGE ASSET ALLOCATION PLATFORM (CAAP) ALLOWS YOU ACCESS TO THE BENEFITS OF ACCOUNTS MANAGED BY SOME OF THE WORLD S LEADING INVESTMENT PROFESSIONALS. USING A TIME-TESTED PROGRAM OF
INVESTMENT POLICY STATEMENT
 2012 INVESTMENT POLICY STATEMENT Prepared for: Sample Client May 04, 2012 Sample Advisor sadvisor@loringward.com Materials provided to approved advisors by LWI Financial Inc., ('Loring Ward'). Securities
A R I S K - B A S E D A S S E T A L L O C A T I O N P R O G R A M TOPS. Pioneers in Strategic ETF Portfolios. 1 of 20
 A R I S K - B A S E D A S S E T A L L O C A T I O N P R O G R A M VALMARK ADVISERS, INC. TOPS Pioneers in Strategic ETF Portfolios 1 of 20 TABLE OF CONTENTS 1 2 3 4 Foundational Investment Management Theory
Great-West SecureFoundation(R) Bal ETF A
 Bal ETF A") The volatility, when shown, Moderate The volatility measure will always be displayed. If the Moderate Quality Objective & Strategy The investment seeks long-term capital appreciation and income. The fund
The volatility, when shown, Moderate The volatility measure will always be displayed. If the Moderate Quality Objective & Strategy The investment seeks long-term capital appreciation and income. The fund
BROCHURE. Published July The first step to increasing your money is keeping it. Tactical Core US
 BROCHURE Published July 2013 The first step to increasing your money is keeping it. Tactical Core US Tactical Core US Brochure 3 The first step to increasing your money is keeping it. Most investors want
Stay on Track with TARGET
 Stay on Track with TARGET Whether you re spending time with your family or focusing on your career, your time is valuable. The time you spend searching for that hot dot or keeping abreast of market events
Factor Investing. Fundamentals for Investors. Not FDIC Insured May Lose Value No Bank Guarantee
 Factor Investing Fundamentals for Investors Not FDIC Insured May Lose Value No Bank Guarantee As an investor, you have likely heard a lot about factors in recent years. But factor investing is not new.
Integrated Wealth Management. Portfolio management i financial planning i tax services
 Integrated Wealth Management Portfolio management i financial planning i tax services CRITICAL FACTORS FOR LONG TERM SUCCESS 1EMBRACE MARKET PRICING The market is an effective, information-processing machine.
THE DURSO WEALTH MANAGEMENT GROUP AT MORGAN STANLEY DISCRETIONARY PORTFOLIO MANAGEMENT INVESTMENT STRATEGIES
 Morgan Stanley 20 Linden Place Red Bank, NJ 07701 (732) 936-3400 THE DURSO WEALTH MANAGEMENT GROUP AT MORGAN STANLEY THE DURSO WEALTH MANAGEMENT GROUP AT MORGAN STANLEY DISCRETIONARY MANAGEMENT INVESTMENT
FundSource. Professionally managed, diversified mutual fund portfolios. A sophisticated approach to mutual fund investing
 FundSource Professionally managed, diversified mutual fund portfolios Is this program right for you? FundSource is designed for investors who: Want a diversified portfolio of mutual funds that fits their
Tower Square Investment Management LLC Strategic Aggressive
 Product Type: Multi-Product Portfolio Headquarters: El Segundo, CA Total Staff: 15 Geography Focus: Global Year Founded: 2012 Investment Professionals: 12 Type of Portfolio: Balanced Total AUM: $1,422
Investment Strategy. Interpreting key concepts and choosing appropriate strategies
 Investment Strategy Interpreting key concepts and choosing appropriate strategies STANDARDS Contents Asset Allocation 2 Strategic asset allocation 6 Tactical allocation 8 Choosing the appropriate mix 9
WEALTH ADVISORY. Investor Guide. For one-on-one presentation only
 WEALTH ADVISORY Investor Guide For one-on-one presentation only experience matters Managing wealth requires discipline commitment, drive, honesty, flexibility and the right resources. At Brinker Capital,
S T H EIG E H H SCALING THE HEIGHTS I WITH EXCHANGE TRADED FUNDS T G LIN A SC
 PROFESSIONALLY MANAGED INVESTMENT SOLUTIONS THROUGH EXCHANGE TRADED FUNDS SCALING THE HEIGHTS SCALING THE HEIGHTS I WITH EXCHANGE TRADED FUNDS AN ETF-BASED DISCIPLINED PROCESS TO HELP YOU ACHIEVE YOUR
PROFESSIONALLY MANAGED INVESTMENT SOLUTIONS THROUGH EXCHANGE TRADED FUNDS
 PROFESSIONALLY MANAGED INVESTMENT SOLUTIONS THROUGH EXCHANGE TRADED FUNDS SCALING THE HEIGHTS SCALING THE HEIGHTS I WITH EXCHANGE TRADED FUNDS AN ETF-BASED DISCIPLINED PROCESS TO HELP YOU ACHIEVE YOUR
This material has been prepared by Principal Trust Company, which is not affiliated with Prudential Retirement. Prudential Retirement serves as
 This material has been prepared by Principal Trust Company, which is not affiliated with Prudential Retirement. Prudential Retirement serves as recordkeeper for your plan, but does not make any representations
Portfolio Gap Analysis
 Portfolio Gap Analysis Prepared For: Joe Client Jane Client May 23, 2014 Prepared By: Alan Advisor aadvisor@loringward.com 2014 LWI Financial Inc. All rights reserved. Unauthorized copying, reproducing,
Investment Terms Glossary
 Investment Terms Glossary 12b-1 Fee: A fee assessed on certain funds and associated share classes permitted under an SEC rule to help cover the cost associated with marketing and selling the fund; 12b-1
The Glenmede Fund, Inc. The Glenmede Portfolios
 The Glenmede Fund, Inc. The Glenmede Portfolios Annual Report The performance for the portfolios shown on pages 2 to 4 and 6 to 24 represents past performance and is not a guarantee of future results.
CMG Tactical Rotation Strategy CMG Capital Management Group, Inc. Financial Professional Use Only
 CMG Tactical Rotation Strategy About CMG CMG is a Registered Investment Advisor located in King of Prussia, Pennsylvania founded in 1992 by Stephen Blumenthal. Since the beginning, CMG has embraced Uncommon
Why and How to Pick Tactical for Your Portfolio
 Why and How to Pick Tactical for Your Portfolio A TACTICAL PRIMER Markets and economies have exhibited characteristics over the past two decades dissimilar to the years which came before. We have experienced
AlphaSolutions Sector Rotation Model
 AlphaSolutions Sector Rotation Model An investment model based on trending and momentum strategies Portfolio Goals Primary: Seeks long term growth of capital by investing in highranked U.S. Equity Sectors
X-Ray View - CORE 75/25
 X-Ray View - CORE 75/25 As of : June 30, 2018 This portfolio reflects your long-term investment goals, financial circumstances, and how much risk you can comfortably take as determined by your financial
Your Asset Allocation: The Sound Stewardship Portfolio Construction Methodology Explained
 Your Asset Allocation: The Sound Stewardship Portfolio Construction Methodology Explained Author: Dan Weeks, CFP At Sound Stewardship, we take a principled approach to investing. That means our investment
Dimensions of Equity Returns in Europe
 RESEARCH Dimensions of Equity Returns in Europe November 2015 Stanley Black, PhD Vice President Research Philipp Meyer-Brauns, PhD Research Size, value, and profitability premiums are well documented in
Risk-efficient investment solutions from AlphaSimplex Group
 Risk-efficient investment solutions from AlphaSimplex Group AlphaSimplex Group and LPL Financial AlphaSimplex Group is working with LPL Financial to offer risk-efficient strategies available in Model Wealth
Investment Management Philosophy
 Investment Management Philosophy Executive Overview The investment marketplace has grown increasingly complex and unpredictable for individual investors. This reality may make it difficult for many people
Pacific Mutual Door Company Partnership 401k Profit Sharing Plan
 Pacific Mutual Door Company Partnership 401k Profit Sharing Plan 1 Plan Highlights 3 Plan Highlights 4 Plan Highlights 5 Plan Highlights 6 Plan Highlights 7 Plan Highlights 8 1.866.909.5148 3400 College