(This page intentionally left blank)
|
|
|
- Harold Holmes
- 6 years ago
- Views:
Transcription
1
2 (This page intentionally left blank)
3 CONTENTS 1. Introduction Consolidated financial highlights (*) Structure of the Autostrade per l Italia Group ( The Group s motorway operators Corporate bodies About the Group Financial profile and credit ratings Report on operations Alternative performance indicators Group financial review Financial review for Autostrade per l Italia SpA Key performance indicators for Group companies Group operating review Innovation, research and development Workforce Corporate governance and ownership structures Sustainability Related party transactions Significant regulatory aspects Other information Events after 31 December Outlook and risks or uncertainties Proposed resolutions for the Annual General Meeting of Autostrade per l Italia SpA s shareholders Consolidated financial statements as at and for the year ended 31 December Consolidated financial statements Notes Annexes to the consolidated financial statements Separate financial statements as at and for the year ended 31 December Financial statements Notes Annexes to the separate financial statements Reports Key indicators extracted from the the financial statements of subsidiaries, associates and joint ventures, as defined by paragraphs 3 and 4 of art of the Italian Civil Code 347 Annual Report

4

5 1. Introdu
6 6 (This page intentionally left blank)
7 1.1 Consolidated financial highlights (*) m 2017 (1) 2016 (1) Total operating revenue Toll revenue Other operating income Gross operating profit (EBITDA) Operating profit (EBIT) Profit/(Loss) before tax from continuing operations Profit for the year Profit attributable to owners of the parent Operating cash flow (2) Capital expenditure (2) 3,945 3,799 3,590 3, ,453 2,384 1,913 1,717 1, , ,715 2, December December 2016 Equity (3) Equity attributable to owners of the parent (3) Net debt (3) 2,738 6,118 2,390 4,369 9,351 8,694 (*) (1) (2) (3) The amounts shown in the above table have been extracted from the reclassified consolidated financial statements included in the "Group financial review ", which also includes the reconciliation of the reclassified and reported amounts published in the "Consolidated financial statements for the year ended 31 December 2017". Some of the amounts shown in the table refer to alternative performance indicators, definitions of which are provided in a specific section of the report on operations. In application of IFRS 5, the contributions of Telepass, Stalexport Autostrady, Autostrade Indian Infrastructure Development Private Ltd. ("AID"), Autostrade dell Atlantico ( ADA ) and the related subsidiaries to the Group s operating results for 2016 have been classified in Profit/Loss) from discontinued operations, following the Group restructuring described in detail in note 6, "Corporate actions", in the consolidated financial statements for the year ended 31 December In addition, the contributions of AID and ADA and the related subsidiaries in 2017 have also been classified in Profit/Loss) from discontinued operations through to the date of their deconsolidation (31 March 2017 and 28 February 2017, respectively). Operating cash flow and capital expenditure include the contributions of Telepass, Stalexport Autostrady, AID, ADA and the related subsidiaries for full year 2016, whilst the corresponding amounts for 2017 include the contributions of AID, ADA and the related subsidiaries through to the date of their deconsolidation (31 March 2017 and 28 February 2017, respectively). Assets and liabilities as at 31 December 2017 also reflect the deconsolidation of AID, ADA and the related subsidiaries in Annual Report
8 1.2 Structure of the Autostrade per l Italia Group (*) Appia Investments (a company owned by Allianz, EDF Invest and DIF) Silk Road Fund 6.94% 88.06% 5.00% 100% Tangenziale di Napoli 100% AD Moving 100% Autostrade Meridionali 58.98% EsseDiEsse 100% Società Italiana per il Traforo del Monte Bianco 51% Autostrade Tech 100% Raccordo Autostradale Valle d Aosta 47.97% (1) Infoblu 75% Autostrada Tirrenica 99.99% (2) Giove Clear 100% Motorway concessions Other services (*) (1) (2) The chart shows interests in the principal Autostrade per l Italia Group companies as at 31 December The Autostrade per l Italia s investments as at 31 December 2017 are described in Annex 1 to the consolidated financial statements. The percentage shown refers to the interest in terms of the total number of shares in issue, whilst the interest in ordinary voting shares is 58.00%. The percentage of interest in share capital refers to the interest in terms of the total number of shares in issue. 8
9 1.3 The Group s motorway operators Network operated by ANAS and others Autostrade per l Italia Km of network: 2,855 Concession expiry: 2038 Società Italiana per il Traforo del Monte Bianco Km of network: 6 Concession expiry: 2050 Raccordo Autostradale Valle d Aosta Km of network: 32 Concession expiry: 2032 Autos trada Tirrenica (1) Km of network: 55 Concession expiry : 2038 Autostrade Meridionali (2) Km of network 52 Concession expiry: 2012 Tangenziale di Napoli Km of network: 20 Concession expiry: 2037 (data as at 31 December 2017) Autostrade per l Italia Subsidiaries Toll stations Service areas Parking areas 95 5 Punto Blu customer service points 57 7 Workforce 5,498 1,851 (3) (1) (2) (3) A draft addendum to the concession arrangement is currently being negotiated with the Grantor. The process of awarding the new concession is underway. The figure refers to operators and other companies operating in Italy and controlled by Autostrade per l Italia. Annual Report
10 1.4 Corporate bodies BOARD OF DIRECTORS IN OFFICE FOR THE FINANCIAL YEARS (1) CHAIRMAN Fabio CERCHIAI CHIEF EXECUTIVE OFFICER Giovanni CASTELLUCCI DIRECTORS Giuseppe ANGIOLINI Massimo BIANCHI Christoph HOLZER Hongcheng LI Roberto PISTORELLI Roberto TOMASI Antonino TURICCHI SECRETARY Amedeo GAGLIARDI (2) BOARD OF STATUTORY AUDITORS FOR THE THREE-YEAR PERIOD (1) CHAIRMAN Antonio MASTRAPASQUA AUDITORS Roberto COLUSSI Alberto DE NIGRO Giandomenico GENTA Antonio PARENTE ALTERNATE AUDITORS Mario VENEZIA Francesco ORIOLI (3) INDEPENDENT AUDITORS FOR THE PERIOD Deloitte & Touche SpA (1) (2) (3) The General Meeting of Autostrade per l Italia s shareholders, held on 26 July 2017, voted to approve an increase in the number of members of the Board of Directors from 7 to 9, electing Christoph Holzer and Hongcheng Li to serve as Directors, and an increase in the number of members of the Board of Statutory Auditors from 3 to 5, electing Roberto Colussi and Alberto De Nigro as Auditors. Amedeo Gagliardi was appointed Secretary to the Board of Directors on 14 December 2017 to replace Antonio Sanna. Francesco Orioli was elected as an Alternate Auditor to replace Francesco Mariano Bonifacio, who resigned on 18 July
11 1.5 About the Group Autostrade-Concessioni e Costruzioni Autostrade SpA was established in 1950 on the initiative of IRI (Istituto per la Ricostruzione Industriale). In 1956 an Agreement was entered into that would see Autostrade co-finance, build and operate the Autostrada del Sole between Milan and Naples. Work began in May of that year and by 1964 the entire length of the motorway was open to traffic. Further agreements followed, granting the Company the concession to build and operate further motorways throughout the country, some of which previously operated by ANAS. Autostrade was privatised in 1999 and IRI, the founding shareholder, was replaced by a stable group of shareholders today led by Edizione Srl (a holding company controlled by the Benetton family). In 2003, the activities carried out under concession were separated from non-motorway operations and Autostrade per l'italia SpA was established. The Company was a wholly owned subsidiary of Atlantia SpA (then Autostrade SpA), a holding company listed on the Milan Stock Exchange. Autostrade per l Italia and the Group s other Italian motorway operators are in the process of implementing a programme designed to upgrade and modernise approximately 1,100 km of the Italian motorway network, entailing total capital expenditure of approximately 25 billion, of which almost 11 billion already carried out. The aim of the programme is to bring motorway capacity into line with growing traffic volumes and changing needs in relation to safety standards and service quality. This makes Autostrade per l Italia the country s biggest private investor. Annual Report
12 1.6 Financial profile and credit ratings Structure of Autostrade per l'italia s debt as at 31 December % 4.8% 71.0% 13.5% 6.9% 8.5% Short-term Debito a debt breve termine Debito Medium/Long-term a medio-lungo debt termine Bond issues Cassa Depositi e Pestiti EIB Intercompany loans Autostrade per l Italia s credit ratings Issuer EMTN Programme ( 7bn) (*) Agency Rating Outlook Rating Outlook Standard & Poor's BBB+ Negative BBB+ - Moody's Baa1 Negative Baa1 Negative Fitch Ratings A- Negative Rating Watch A- Negative Rating Watch (*) Autostrade per l Italia replaced Atlantia as the issuer of bonds originally issued between 2004 and 2014 under Atlantia s previous EMTN Programme. These bonds have the same ratings as Autostrade per l Italia s 7bn EMTN programme. 12
13 (This page intentionally left blank) Annual Report
14
15 2. Re
16 16 (This page intentionally left blank)
17 2.1 Alternative performance indicators In application of the CONSOB Ruling of 3 December 2015, which applies in Italy the guidelines for the alternative performance indicators ( APIs ) issued by the European Securities and Markets Authority (ESMA), the basis used in preparing the APIs published by the Autostrade per l Italia Group is described below. The APIs shown in this release are deemed relevant to an assessment of the operating performance based on the overall results of the Group as a whole and the results of its operating segments and of individual consolidated companies. In addition, the APIs provide an improved basis for comparison of the results over time, even if they are not a replacement for or an alternative to the results published in accordance with international financial reporting standards (IFRS) described in section 3, Consolidated financial statements as at 31 December 2017 (also reported amounts ). With regard to the APIs, Autostrade per l Italia presents reclassified financial statements, for both the Group and the Parent Company, in the Group financial review and the Financial review for Autostrade per l Italia SpA. These statements are different from those required under IFRS, included in the consolidated financial statements and the separate financial statements as at 31 December 2017 (the statutory financial statements). In addition to amounts from the income statement and statement of financial position prepared under IFRS, these reclassified financial statements present a number of indicators and items derived from them, even when they are not required by the above standards and are, therefore, identifiable as APIs. In this regard, the Reconciliation of the reclassified and statutory financial statements, included in the Group financial review and the Financial review for Autostrade per l Italia SpA, presents the reconciliation of the reclassified financial statements with the corresponding statutory financial statements, included in the same section. A list of the APIs used in this Annual Report, together with a brief description and their reconciliation with reported amounts, is provided below: a) Gross operating profit (EBITDA) is the synthetic indicator of earnings from operations, calculated by deducting operating costs, with the exception of amortisation, depreciation, impairment losses and reversals of impairment losses, the operating change in provisions and other adjustments, from operating revenue; b) Operating profit (EBIT) is the indicator that measures the return on invested capital, calculated by deducting amortisation, depreciation, impairment losses and reversals of impairment losses, the operating change in provisions and other adjustments from EBITDA. Like EBITDA, EBIT does not include the capitalised component of financial expenses relating to construction services, which is shown in a specific item under financial income and expenses in the reclassified statement, whilst being included in revenues in the income statement in the consolidated financial statements, on a reported basis; c) Net invested capital, showing the total value of non-financial assets, after deducting nonfinancial liabilities; d) Net debt, indicating the portion of net invested capital funded by net financial liabilities, calculated by deducting Current and non-current financial assets from Current and noncurrent financial liabilities. It is pointed out that the notes to the consolidated financial statements as at and for the year ended 31 December 2017 also include the reconciliation of net debt with net debt calculated in compliance with the ESMA Recommendation of 20 March 2013; e) Capital expenditure, indicating the total amount invested in development of the Group s businesses, calculated as the sum of cash used in investment in property, plant and Annual Report
18 equipment, in assets held under concession and in other intangible assets, excluding investment linked to transactions involving investees; f) Operating cash flow, indicating the cash generated by or used in operating activities. Operating cash flow is calculated as profit for the period + amortisation/depreciation +/- impairments/reversals of impairments of assets +/- provisions/releases of provisions + other adjustments + financial expenses from discounting of provisions +/- share of profit/(loss) of investees accounted for using equity method +/- (losses)/gains on sale of assets +/- other non-cash items +/- portion of net deferred tax assets/liabilities recognised in profit or loss. A number of APIs, calculated as above, are also presented after applying certain adjustments in order to provide a consistent basis for comparison over time. These Like-for-like changes, used in the analysis of changes in gross operating profit (EBITDA), profit for the period, profit for the period attributable to owners of the parent and operating cash flow, have been calculated by excluding, where present, the impact of: (i) changes in the scope of consolidation; (ii) changes in exchange rates on the value of assets and liabilities denominated in functional currencies other than the euro; and (iii) events and/or transactions not strictly connected with operating activities that have an appreciable influence on amounts for at least one of the two comparative periods. The reconciliation of amounts in the reclassified financial statements and the corresponding like-for-like indicators is provided in the section, Like-forlike financial indicators, in the Group financial review, in addition to details of the adjustments made. 18
19 2.2 Group financial review Introduction The financial review contained in this section includes and analyses the reclassified consolidated income statement, the statement of comprehensive income, the statement of changes in equity and the statement of changes in the Autostrade per l Italia Group s net debt for the year ended 31 December 2017, in which amounts are compared with those of the previous year. The review also includes and analyses the reclassified consolidated statement of financial position, compared with the corresponding amounts as at 31 December 2016, and the reconciliation of Autostrade per l Italia s equity and profit for 2017 with the corresponding consolidated amounts for the Autostrade per l Italia Group. The accounting standards applied during preparation of the consolidated accounts for 2017 are consistent with those adopted for the consolidated financial statements for the year ended 31 December 2016, in that the amendments to existing standards that came into effect in 2017 have not had any impact on the accounts. It should also be noted that the Atlantia Group s restructuring was completed in early This involved the transfer of Autostrade per l Italia s investments in Telepass and Stalexport Autostrady to Atlantia, completed at the end of 2016, and, in the first quarter of 2017, the transfer of Autostrade per l Italia s interests in Autostrade dell Atlantico ( ADA, the subholding company that controls the Group s Chilean and Brazilian motorway businesses and holds the controlling interest in Electronic Transaction Consultants) and Autostrade Indian Infrastructure Development ( AID ) in the form of a special dividend in kind payable to the parent. The transfers of these interests involved: a) the deconsolidation, from 28 February 2017, of ADA and its subsidiaries and, from 31 March 2017, of AID; b) classification, in application of IFRS 5, of the contributions of AID, ADA and the related subsidiaries to the Group s operating results for the two comparative periods, and of the contributions of Telepass and Stalexport Autostrady for 2016 alone, in Profit/Loss) from discontinued operations. More details about the restructuring are provided in note 6, Corporate actions, in the section, Consolidated financial statements as at and for the year ended 31 December After excluding the impact of the above restructuring, there have been no further material effects of changes in the scope of consolidation in 2017 compared with With regard to non-recurring transactions, at the end of 2016, a process of issuer substitution was completed. This resulted in Autostrade per l Italia taking Atlantia s place as the issuer of bonds subscribed by institutional investors and in the related hedging derivatives entered into by the latter, with a significant impact on the Autostrade per l Italia Group s operating results and financial position in It should be noted that the Group during 2017 did not enter into non-recurring, atypical or unusual transactions, either with third or related parties, having a material impact on the consolidated accounts. Finally, the reconciliation of the reclassified financial statements included and analysed in this section with the corresponding consolidated financial statements on a reported basis is provided in the section Reconciliation of the reclassified and statutory financial statements. Annual Report
20 Like-for-like financial indicators The following table shows the reconciliation of like-for-like consolidated amounts for gross operating profit (EBITDA), profit for the year, profit for the year attributable to owners of the parent and operating cash flow for the comparative periods and the corresponding amounts presented in the reclassified consolidated income statement. m Note Gross operating Profit for the profit period (EBITDA) Profit attributable to owners of the parent Operating cash flow Gross operating Profit for the profit period (EBITDA) Profit attributable to owners of the parent Reported amounts (A) 2,453 1, ,715 2, ,063 Adjustment for non like-for-like item Amounts for 2017 Amounts for 2016 Operating cash flow Change in scope of consolidation (1) Reversal of impairment losses on intangible assets (2) Change in discount rate applied to provisions (3) Non-recurring financial transactions (4) Impact of financial income and expenses resulting from issuer substitution and issue and accompanying partial repurchase of certain bonds (September 2017) (5) Change in IRES rate (2016 Stability Law) (6) Sub-total (B) Like-for-like amounts (C) = (A)-(B) 2, ,687 2, ,611 Notes: The term like-for-like indicates that certain financial indicators for the two comparative periods have been determined by eliminating: 1) from consolidated amounts for 2017 and 2016, the contributions of AID, ADA and the related subsidiaries through to the date of their deconsolidation and, for 2016 alone, the contributions of Telepass, Stalexport Autostrady and the related subsidiaries; 2) from consolidated amounts for 2017, the partial reversal of impairment losses on intangible assets deriving from concession rights, recognised in the past by Raccordo Autostradale Valle d Aosta (RAV), after the related taxation; 3) from consolidated amounts for 2017 and 2016, the after-tax impact of the difference in the discount rates applied to the provisions accounted for among the Group s liabilities; 4) for 2016 alone, the after-tax impact of the net financial expenses resulting from the issuer substitution involving the transfer of bonds from Atlantia to Autostrade per l Italia, and the partial early repayment of medium/long-term loans granted by the parent, Atlantia; 5) for 2017 alone, the after-tax impact of the financial income and expenses resulting from the issuer substitution carried out in December 2016 and the issue and accompanying partial repurchase of certain bonds by Autostrade per l Italia in September 2017; 6) from consolidated amounts for 2016, the increase in the Italian companies tax expense following the reduction in the IRES tax rate from 27.5% to 24% with effect from 1 January 2017 (the 2016 Stability Law). 20
21 Consolidated results of operations Operating revenue for 2017 amounts to 3,945 million, marking an increase of 146 million (4%) compared with 2016 ( 3,799 million). Toll revenue of 3,590 million is up 107 million (3%) on the figure for 2016 ( 3,483 million), primarily reflecting the following: a) a 2.2% increase in traffic on the Italian network, accounting for an increase in toll revenue of approximately 82 million (including the positive impact of the traffic mix); b) application of annual toll increases (essentially a 0.64% increase applied by Autostrade per l Italia with effect from 1 January 2017), boosting toll revenue by an estimated 19 million. Other operating income of 355 million is up 39 million (12%) compared with 2016 ( 316 million), primarily due to the greater contribution from Autostrade Tech as a result of the services and goods supplied to Telepass (a company deconsolidated at the end of 2016) in Net operating costs of 1,492 million are up 77 million on 2016 ( 1,415 million). The Cost of materials and external services amounts to 527 million, up 66 million on the figure for 2016 ( 461 million). After stripping out the above impact of the deconsolidation of Telepass, the increase in costs is substantially due to maintenance work on the Group s network, primarily by Autostrade per l Italia (an increase in work on the network and the variable costs linked to increased snowfall in 2017). Concession fees of 465 million are up 11 million (2%) on 2016 ( 454 million), substantially due to the component of tolls corresponding with the additional concession fee payable to ANAS, also accounted for in toll revenue. Annual Report
22 RECLASSIFIED CONSOLIDATED INCOME STATEMENT (*) Increase/(Decrease) m Absolute % Toll revenue 3,590 3, Other operating income Total operating revenue 3,945 3, Cost of materials and external services Concession fees Net staff costs Total net operating costs -1,492-1, Gross operating profit (EBITDA) 2,453 2, Amortisation, depreciation, impairment losses and reversals of impairment losses Operating change in provisions and other adjustments Operating profit (EBIT) 1,913 1, Financial expenses from discounting of provisions for construction services required by contract and other provisions Other financial income/(expenses) Capitalised financial expenses on intangible assets deriving from concession rights Share of profit/(loss) of investees accounted for using the equity method n/s Profit/(Loss) before tax from continuing operations 1, Income tax expense Profit/(Loss) from continuing operations 1, Profit/(Loss) from discontinued operations Profit for the year 1, (Profit)/Loss attributable to non-controlling interests (Profit)/Loss attributable to owners of the parent Increase/ (Decrease) Basic earnings per share attributable to the owners of the parent ( ) of which: - from continuing operations from discontinued operations Diluted earnings per share attributable to the owners of the parent ( ) of which: - from continuing operations from discontinued operations (*) The reconciliation with reported amounts in the consolidated income statement is provided in the section, Reconciliation of the reclassified and statutory financial statements. 22
23 Net staff costs of 500 million are in line with the previous year. This broad equivalence essentially reflects a combination of the following: a) a reduction of 162 in the average workforce; b) an increase in the average unit cost, primarily due to the cost of contract renewals. Gross operating profit (EBITDA) for 2017, totalling 2,453 million, is up 69 million (3%) compared with 2016 ( 2,384 million). Amortisation, depreciation, impairment losses and reversals of impairment losses amount to 527 million ( 579 million in 2016). This marks a reduction of 52 million (9%), essentially due to the partial reversal of impairment losses on intangible assets deriving from concession rights recognised in the past ( 79 million by Raccordo Autostradale Valle d Aosta), partially offset by increased amortisation of concession rights at Autostrade per l Italia ( 24 million). The Operating change in provisions and other adjustments shows an expense of 13 million, marking a reduction of 75 million compared with the figure for 2016 ( 88 million). This is primarily attributable to the change in provisions for the repair and replacement of Autostrade per l Italia s motorway infrastructure, which in 2016 reflected charges of 85 million following a significant decline in the related interest rates used to adjust the present value of the provisions. Operating profit (EBIT) of 1,913 million is up 196 million (11%) compared with 2016 ( 1,717 million). Financial expenses from the discounting of provisions for construction services required by contract and other provisions amount to 25 million, down 22 million on This essentially reflects reductions in the discount rates applied in 2017, compared with the comparative period. Net other financial expenses of 456 million are down 365 million on 2016 ( 821 million). This essentially reflects the impact of the issuer substitution implemented by Autostrade per l Italia and Atlantia at the end of 2016, which resulted in the recognition of non-recurring financial expenses in 2016 ( 308 million) and financial income in 2017 ( 41 million). This was essentially due to the recognition and subsequent remeasurement of the fair value of the bonds transferred and of the related derivative financial instruments. After excluding the above effects, net financial expenses are down 16 million, mainly due to the lower cost of debt. Capitalised financial expenses on intangible assets deriving from concession rights, amounting to 3 million, are down 3 million compared with 2016 ( 6 million). The Share of the (profit)/loss of investees accounted for using the equity method amounts to a profit of 3 million, compared with a loss of 8 million in This reflects the Group s share of the profit or loss of its associates and joint ventures and any dividends paid by these companies during the period. Total income tax expense of 420 million is up 101 million on 2016 ( 319 million). This is proportionately less than the increase in profit before tax, having benefitted from the reduction in the IRES rate from 1 January Annual Report
24 Profit from continuing operations amounts to 1,018 million, an increase of 490 million (93%) compared with 2016 ( 528 million), having partly benefitted from the reduction in financial expenses. The Group reports a Profit from discontinued operations of 24 million, down 378 million compared with 2016 ( 402 million). This reflects the different scopes of consolidation in the two comparative periods, following the restructuring of the Atlantia Group described in the introduction. This item includes: a) the contributions of ADA and its subsidiaries and of AID in 2017 through to the date of deconsolidation (February 2017 and March 2017, respectively); b) the contributions of Telepass, Stalexport Autostrady and the related subsidiaries (companies deconsolidated at the end of 2016) in 2016, in addition to those of the companies referred to in point a) above). Profit for the year, amounting to 1,042 million, is up 112 million (12%) compared with 2016 ( 930 million). On a like-for-like basis, profit for the year is up 53 million (6%) on Profit for the year attributable to owners of the parent, amounting to 972 million, is up 155 million (19%) compared with 2016 ( 817 million). On a like-for-like basis, profit for the period attributable to owners of the parent is up 54 million. Profit for the year attributable to non-controlling interests, amounting to 70 million, is down 43 million compared with 2016 ( 113 million), essentially due to the different scope of consolidation in the two comparative periods. 24
25 CONSOLIDATED STATEMENT OF COMPREHENSIVE INCOME CONSOLIDATED STATEMENT OF COMPREHENSIVE INCOME m Profit for the year (A) 1, Fair value gains/(losses) on cash flow hedges Tax effect of fair value gains/(losses) on cash flow hedges Gains/(losses) from translation of assets and liabilities of consolidated companies denominated in functional currencies other than the euro Gains/(losses) from translation of investments accounted for using the equity method denominated in functional currencies other than the euro Other comprehensive income/(loss) reclassifiable to profit or loss for the year (B) Other comprehensive income/(loss) not reclassifiable to profit or loss for the year (C) -1-2 Reclassifications of other components of comprehensive income to profit or loss for the year (D) Tax effect of reclassifications of other components of comprehensive income to profit or loss for the year (E) - - Total other comprehensive income/(loss) for the year (F=B+C+D+E) of which attributable to discontinued operations Comprehensive income for the year (A+F) 1,177 1,373 Of which attributable to owners of the parent 1,062 1,087 Of which attributable to non-controlling interests For 2017, Other comprehensive income for the year, after the related taxation, amounts to 135 million ( 443 million in 2016). This essentially reflects a combination of the following: a) gains on the translation of the assets and liabilities of ADA s overseas subsidiaries, amounting to 90 million, essentially due to increases, at the date of deconsolidation, in the exchange rates used to convert the Brazilian real and the Chilean peso into euros, compared with the rates used at 31 December 2016; b) a reduction of 39 million in fair value losses on cash flow hedges, primarily due to an increase in interest rates in In contrast, there was an increase of 72 million in fair value losses in 2016, reflecting an opposite movement in interest rates; c) reclassifications of other components of comprehensive income to profit or loss for the year, amounting to 20 million, essentially linked to the reclassification to Net other financial expenses of the cash flow hedge reserves linked to the issue and concomitant partial buyback of bonds by Autostrade per l Italia, completed in September Annual Report
26 Consolidated financial position As at 31 December 2017, Non-current non-financial assets of 18,602 million are down 422 million compared with the figure for 31 December 2016 ( 19,024 million). Property, plant and equipment of 81 million is broadly in line with the figure for 31 December 2016 ( 86 million). Intangible assets total 18,356 million ( 18,750 million as at 31 December 2016) and essentially consist of intangible assets deriving from the Group s concession rights, amounting to 12,221 million ( 12,620 million as at 31 December 2016), and goodwill ( 6,111 million) recognised following the contribution of the motorway assets of the former Autostrade Concessioni e Costruzioni Autostrade SpA (now Atlantia) to Autostrade per l Italia as part of a reorganisation of the Group in The reduction of 394 million in intangible assets is primarily due to a combination of the following: a) amortisation for the period ( 583 million); b) investment during the period in construction services for which additional economic benefits are received ( 110 million); c) partial reversal of impairment losses on intangible assets deriving from concession rights previously recognised by RAV ( 79 million). Investments, totalling 64 million, are broadly in line with the figure for 31 December 2016 ( 61 million). 26
27 RECLASSIFIED CONSOLIDATED STATEMENT OF FINANCIAL POSITION (*) m 31 December December 2016 Increase/ (Decrease) Non-current non-financial assets Property, plant and equipment Intangible assets 18,356 18, Investments Deferred tax assets Other non-current assets Total non-current financial assets (A) 18,602 19, Working capital Trading assets Current tax assets Other current assets Non-financial assets held for sale or related to discontinued operations 5 3,576-3,571 Current portion of provisions for construction services required by contract Current provisions Trading liabilities -1,324-1, Current tax liabilities Other current liabilities Non-financial liabilities related to discontinued operations -6-1,234 1,228 Total working capital (B) -1, ,480 Gross invested capital (C=A+B) 16,875 19,777-2,902 Non-current non-financial liabilities Non-current portion of provisions for construction services required by contract -2,840-3, Non-current provisions -1,314-1, Deferred tax liabilities Other non-current liabilities Total non-current non-financial liabilities (D) -4,786-4, NET INVESTED CAPITAL (E=C+D) 12,089 14,812-2,723 Equity Equity attributable to owners of the parent 2,390 4,369-1,979 Equity attributable to non-controlling interests 348 1,749-1,401 Total equity (F) 2,738 6,118-3,380 Net debt Non-current net debt Non-current financial liabilities 10,991 12,022-1,031 Bond issues 8,093 8, Medium/long-term borrowings 2,469 3,537-1,068 Non-current derivative liabilities Non-current financial assets Non-current financial assets deriving from government grants Non-current term deposits Other non-current financial assets Total non-current net debt (G) 10,597 11,626-1,029 Current net debt Current financial liabilities 2,231 3, Short-term borrowings Current derivative liabilities Intercompany current account payables due to related parties Current portion of medium/long-term borrowings 1, Other current financial liabilities Financial liabilities related to discontinued operations - 1,763-1,763 Cash and cash equivalents -2,945-3, Cash -2,076-2, Cash equivalents Intercompany current account receivables due from related parties Cash and cash equivalents related to discontinued operations Current financial assets ,438 1,906 Current financial assets deriving from concession rights Current financial assets deriving from government grants Current term deposits Current portion of medium/long-term financial assets Other current financial assets Financial assets held for sale or related to discontinued operations - -1,930 1,930 Total current net debt (H) -1,246-2,932 1,686 Total net debt (I=G+H) (1) 9,351 8, NET DEBT AND EQUITY (L=F+I) 12,089 14,812-2,723 (*) The reconciliation with the reported amounts in the consolidated financial statements is provided in the section, Reconciliation of the reclassified and statutory financial statements. (1) Net debt includes non-current financial assets, unlike the Group's financial position shown in the notes to the consolidated financial statements and prepared in compliance with the European Securities and Markets Authority (ESMA) Recommendation of 20 March 2013, which does not permit the deduction of non-current financial assets from debt. Annual Report
28 Deferred tax assets of 101 million are down 18 million compared with 31 December 2016 ( 119 million), primarily due to the release of deferred tax assets linked to the above partial reversal of impairment losses on intangible assets deriving from concession rights previously recognised by RAV. Working capital has a negative balance of 1,727 million, marking a reduction of 2,480 million compared with the positive balance of 753 million as at 31 December This essentially reflects a reduction of 2,343 million in net non-financial assets and liabilities related to discontinued operations, following the deconsolidation of AID, ADA and the related subsidiaries, as described above, in addition to an increase of 118 million in net current tax liabilities, primarily linked to provisions for tax expense for the period after deducting payments on account. Non-current non-financial liabilities, totalling 4,786 million, are down 179 million compared with the figure for 31 December 2016 ( 4,965 million). The change primarily reflects a combination of the following: a) a reduction of 325 million in the non-current portion of provisions for construction services required by contract, essentially reflecting an updated estimate of the current portion based on the estimated services to be carried out in 2018; b) an increase in deferred tax liabilities, totalling 127 million, primarily due to deduction, solely for tax purposes, of the amortisation of goodwill recognised by Autostrade per l Italia ( 99 million). As a result, Net invested capital, totalling 12,089 million, is down 2,723 million on the figure for 31 December 2016 ( 14,812 million). Equity amounts to 2,738 million ( 6,118 million as at 31 December 2016). Equity attributable to owners of the parent, totalling 2,390 million, is down 1,979 million on the figure for 31 December 2016 ( 4,369 million). This essentially reflects a combination of the following: a) the transfer of the net assets of AID, ADA and the related subsidiaries to the parent, Atlantia, following distribution of the special dividend in kind approved by the General Meeting of Autostrade per l Italia s shareholders held on 25 January 2017, amounting to 1,155 million (after the related taxation, recognised in equity; b) distribution of a portion of the available reserves ( 1,101 million) in accordance with the resolution approved by the Annual General Meeting of Autostrade per l Italia s shareholders held on 21 April 2017; c) payment of Autostrade per l Italia s final dividend for 2016 ( 314 million) and of the interim dividend for 2017 ( 450 million); d) comprehensive income for the year of 1,062 million. Equity attributable to non-controlling interests of 348 million is down 1,401 million compared with the figure for 31 December 2016 ( 1,749 million). This primarily reflects the deconsolidation of overseas subsidiaries not wholly controlled ( 1,473 million) in early 2017, partially offset by comprehensive income for the year ( 115 million). 28
29 STATEMENT OF CHANGES IN CONSOLIDATED EQUITY m Balance as at 31 December 2015 Issued capital Cash flow hedge reserve Net investment hedge reserve EQUITY ATTRIBUTABLE TO OWNERS OF THE PARENT Reserve for translation differences on translation of assets and liabilities of consolidated companies denominated in functional currencies other than the euro Reserve for translation of investments accounted for using the equity method denominated in functional currencies other than the euro Other reserves and retained earnings Profit/(Loss) for the year after interim dividend , ,000 1,560 4,560 Total EQUITY ATTRIBUTABLE TO NON- CONTROLLING INTERESTS TOTAL EQUITY ATTRIBUTABLE TO OWNERS OF THE PARENT AND NON- CONTROLLING INTERESTS Comprehensive income for the year , ,373 Owner transactions and other changes Autostrade per l'italia SpA's final dividend ( per share) Transfer of profit/(loss) for previous year to retained earnings Autostrade per l'italia SpA's interim dividend ( per share) Dividends paid by other Group companies to non Share-based incentive plans Change in reserves due to transactions under common control ,040-1,054-1,054 Change in scope of consolidation, returns of capital to noncontrolling shareholders and other minor changes Balance as at 31 December , ,369 1,749 6,118 Comprehensive income for the year , ,177 Owner transactions and other changes Autostrade per l'italia SpA's final dividend ( per share) Transfer of profit/(loss) for previous year to retained earnings Autostrade per l'italia SpA's interim dividend ( per share) Dividends paid by other Group companies to non Share-based incentive plans Change in scope of consolidation following distribution of the special dividend in kind, including the effect on current tax income/(expense) , ,155-1,473-2,628 Distribution of available reserves , , ,101 Reclassifications and other minor changes Balance as at 31 December , , ,738 Annual Report
30 RECONCILIATION OF AUTOSTRADE PER L'ITALIA'S EQUITY AND PROFIT FOR THE YEAR WITH THE CORRESPONDING CONSOLIDATED AMOUNTS m Equity as at 31 December 2017 Profit for 2017 Amounts in financial statements of Autostrade per l'italia Recognition in consolidated financial statements of equity and profit/(loss) for the year of investments less non-controlling interests Elimination of carrying amount of consolidated investments Elimination of impairment losses on consolidated investments less reversals Elimination of intercompany dividends Measurement of investments at fair value and using the equity method less dividends received Other consolidation adjustments (1) Consolidated carrying amounts (attributable to owners of the parent) Consolidated carrying amounts (attributable to non-controlling interests) Carrying amounts in consolidated financial statements 1, , ,738 1,042 (1) Other consolidation adjustments essentially include the effects of remeasurement at fair value, solely for the purposes of consolidation, of previously held interests following the acquisition of control of the related companies. The Group s Net debt as at 31 December 2017 amounts to 9,351 million, marking an increase of 657 million compared with 31 December 2016 ( 8,694 million). Non-current net debt, totalling 10,597 million, is down 1,029 million on the figure for 31 December 2016 ( 11,626 million). This essentially reflects a reduction of 1,031 million in noncurrent financial liabilities due to a combination of the following: a) a reduction of 1,068 thousand in medium/long-term borrowings, essentially due to the reclassification of the current portion (totalling 1,120 million) of loans from Atlantia ( 992 million) and banks ( 122 million) maturing in the next 12 months; b) a reduction in fair value losses on derivative financial instruments ( 51 million), essentially due to an increase in interest rates as at 31 December 2017, compared with 31 December 2016; c) a net increase in bond issues of 88 million, reflecting the transaction carried out by Autostrade per l Italia in September 2017, which involved the issue of bonds maturing in 2029 to institutional investors and the concomitant buyback of a portion of the bonds maturing in 2019, 2020 and February and November Current net funds of 1,246 million are down 1,686 million on 31 December 2016 ( 2,932 million) and consist of: a) Cash and cash equivalents of 2,945 million, down 680 million compared with 31 December 2016 ( 3,625 million). The reduction partly reflects the above distribution of a portion of Autostrade per l'italia s available reserves ( 1,101 million); b) Current financial assets of 532 million, down 1,906 million compared with 31 December 2016 ( 2,438 million), essentially due to a reduction in Financial assets held for sale or related to discontinued operations ( 1,930 million), following the deconsolidation of ADA and the related subsidiaries as part of the above restructuring of the Atlantia Group; c) Current financial liabilities of 2,231 million, down 900 million due to a combination of the following: 30
31 1) a reduction in Financial liabilities related to discontinued operations ( 1,763 million), following the above deconsolidation of ADA and the related subsidiaries; 2) an increase in short-term borrowings of 531 million, essentially including the new short-term loan of 500 million obtained from the parent, Atlantia, partly offset by a reduction of 192 million in intercompany current account payables due to Atlantia; 3) an increase in the current portion of medium/long-term financial liabilities ( 470 million), essentially following the above reclassification of medium/long-term borrowings ( 1,120 million), partially offset by repayment, in September 2017, of the current portion of bond issues, totalling 505 million. The residual weighted average term to maturity of the Group s interest bearing debt is six years and five months as at 31 December % of the Group s interest bearing debt is fixed rate. 8% of the Group s debt is denominated in currencies other than the euro (sterling and yen). The average cost of the Group s medium/long-term borrowings in 2017 was 3.6% (4.6% in 2016). As at 31 December 2017, the Group has cash reserves of 4,191 million, consisting of: a) 2,401 million in investments and cash maturing in the short term ( 2,183 million), Autostrade per l'italia s cash and cash equivalents ( 748 million), essentially relating to Autostrade per l Italia s role as a provider of centralised treasury management, partially offset by short-term borrowings ( 530 million), primarily linked to the loan from Atlantia in the form of cash deposits with Autostrade per l'italia; b) 235 million in term deposits allocated primarily to part finance the execution of specific construction services on the motorways operated under concession; c) 1,555 million in undrawn committed lines of credit. As at 31 December 2017, the Group has lines of credit with a weighted average residual term to maturity of approximately eight years and a weighted average residual drawdown period of approximately three years and eight months. The Group s net debt, as defined in the European Securities and Market Authority (ESMA) Recommendation of 20 March 2013 (which does not permit the deduction of non-current financial assets from debt), amounts to 9,744 million as at 31 December 2017, compared with 9,090 million as at 31 December 2016). Consolidated cash flow Net cash from operating activities amounts to 1,913 million in 2017, up 65 million on 2016 ( 1,848 million). This reflects a combination of the following: a) a reduction of 348 million in operating cash flow, mainly due to a decrease in cash from discontinued operations ( 357 million), reflecting changes in the scope of consolidation between the two comparative periods. On a like-for-like basis, operating cash flow for 2017 is up 76 million (5%) compared with 2016, essentially due to the increase in gross operating profit (EBITDA); b) the differing performance of movements in operating capital and non-financial assets and liabilities in the two comparative periods (an inflow of 198 million in 2017 and an outflow of 215 million in 2016). Cash flows in 2017 benefitted from an increase in trading liabilities, reflecting the performance of capital expenditure, and a reduction in trade receivables, primarily due to a decrease in amounts receivable from sub-operators at Annual Report
32 service areas, reflecting collection in February 2017 of receivables recognised as at 31 December 2016 (relating to contracts executed prior to 2014, under which billing takes place annually). Cash used for investment in non-financial assets, totalling 748 million, has changed by 1,430 million compared with the inflow of 357 million in 2016, primarily due to a combination of the following: a) the inflow generated in 2016 as a result of the impact of the transfer of the investments in Telepass and Stalexport, totalling 1,537 million, including proceeds totalling 1,291 million and the deconsolidation of the companies net debt, amounting to 246 million; b) deconsolidation of the net (debt)/funds of the companies transferred to Atlantia in the form of a special dividend in kind as part of the Group restructuring described above, totalling 204 million; c) a reduction of 370 million in cash used for capital expenditure, partly due to the Group s different scopes of consolidation in the two comparative periods. Net equity cash outflows amount to 1,931 million in 2017, marking an increase of 1,132 million compared with the previous year. This primarily reflects distribution of a portion of the available reserves, amounting to 1,101 million, to the parent, Atlantia. In 2017, other changes also resulted in a reduction in net debt of 109 million, essentially due to a reduction in fair value losses on derivative financial instruments ( 39 million) as a result of rising interest rates, the recognition of non-cash financial income (included in other changes) linked to the issuer substitution completed at the end of 2016 ( 41 million) and the unwinding of a number of Forward-Starting Interest Rate Swaps, following the issue and partial buyback of certain bonds described above ( 21 million). In 2016, net debt increased by 83 million, as a result of accounting for foreign currency bonds at fair value ( 107 million), linked to the issuer substitution completed at the end of December The overall impact of the above cash flows has resulted in an overall increase in net debt of 657 million in 2017 (a decrease of 1,648 million in 2016). 32
33 STATEMENT OF CHANGES IN CONSOLIDATED NET DEBT (*) m CASH FLOWS FROM (USED IN) OPERATING ACTIVITIES Profit for the year 1, Adjusted by: Amortisation and depreciation Operating change in provisions Financial expenses from discounting of provisions for construction services required by contract and other provisions Impairment losses/(reversal of impairment losses) on financial assets and investments accounted for at cost or fair value Share of (profit)/loss of investees accounted for using the equity method Impairment losses/(reversal of impairment losses) and adjustments of current and noncurrent assets (Gains)/Losses on sale of non-current assets Net change in deferred tax (assets)/liabilities through profit or loss Other non-cash costs (income) Non-cash inflows from discontinued operations Operating cash flow Change in operating capital Other changes in non-financial assets and liabilities Net cash generated from/(used in) operating activities (A) ,715 2, ,913 1,848 NET CASH FROM/(USED IN) INVESTMENT IN NON-FINANCIAL ASSETS Investment in assets held under concession Purchases of property, plant and equipment Purchases of other intangible assets Capital expenditure Government grants related to assets held under concession Increase in financial assets deriving from concession rights (related to capital expenditure) Proceeds from sales of property, plant and equipment, intangible assets and unconsolidated investments Net debt/(funds) of consolidated companies transferred as a result of distribution of special dividend in kind Proceeds from sale of consolidated companies, including net debt transferred Net change in other non-current assets Net cash from/(used in) investment in non-financial assets (B) , NET EQUITY CASH INFLOWS/(OUTFLOWS) Distribution of reserves to the parent -1,101 - Dividends declared by Autostrade per l'italia and Group companies and payable to noncontrolling shareholders Return of capital to non-controlling shareholders Net equity cash inflows/(outflows) (C) , Increase/(Decrease) in cash and cash equivalents during year (A+B+C) Change in fair value of hedging derivatives Financial income/(expenses) accounted for as an increase in financial assets/(liabilities) Change in financial liabilities arising from issuer substitution Effect of foreign exchange rate movements on net debt and other changes Other changes in net debt (D) , Increase in net debt for year (A+B+C+D) ,648 Net debt at beginning of year Net debt at end of year -8,694-10,342-9,351-8,694 (*) The reconciliation with the reported amounts in the consolidated interim financial statements is provided in the section, Reconciliation of the reclassified and statutory financial statements. Annual Report
34 Reconciliation of the reclassified and statutory financial statements Reconciliations of the reclassified financial statements presented above with the matching income statement, statement of financial position and statement of cash flows, as prepared under international financial reporting standards (IAS/IFRS), are included below. 34
35 RECONCILICATION OF THE CONSOLIDATED INCOME STATEMENT WITH THE RECLASSIFIED INCOME STATEMENT m 2017 Reconciliation of items Ref. Reported basis Sub-items Main entries Ref. Reclassified basis Sub-items Main entries Toll revenue 3,590 3,590 Revenue from construction services 118 Revenue from construction services - government grants and cost of materials and external services (a) 101 Capitalised staff costs - construction services for which additional economic benefits are received (b) 6 Revenue from construction services: capitalised financial expenses (c) 3 Revenue from construction services provided by sub-operators (d) 8 Contract revenue - Other revenue (e) 347 Other operating income (e+d) 355 Revenue from construction services provided by sub-operators (d) 8 Total revenue 4,055 TOTAL OPERATING REVENUE 3,945 Raw and consumable materials Service costs Gain/(Loss) on sale of elements of property, plant and equipment 1 1 Other operating costs -538 Concession fees (f) -465 Lease expense Other Use of provisions for construction services required by contract (h) 388 Revenue from construction services: government grants and capitalised cost of materials and external (a) 101 COST OF MATERIALS AND EXTERNAL SERVICES -527 CONCESSION FEES (f) -465 Staff costs (g) -525 NET STAFF COSTS (g+b+i) -500 TOTAL NET OPERATING COSTS -1,492 GROSS OPERATING PROFIT (EBITDA) 2,453 OPERATING CHANGE IN PROVISIONS AND OTHER ADJUSTMENTS -13 Operating change in provisions -12 (Provisions)/ Uses of provisions for repair and replacement of motorway infrastructure - - Other provisions (Impairment losses)/reversals of impairment losses (l) -1 Use of provisions for construction services required by contract 407 Use of provisions for construction services required by contract (h) 388 Capitalised staff costs - construction services for which no additional economic benefits are received (i) 19 Amortisation and depreciation (j) -605 Depreciation of property, plant and equipment -22 Amortisation of intangible assets deriving from concession rights -566 Amortisation of other intangible assets -17 (Impairment losses)/reversals of impairment losses 77 (Impairment losses)/reversals of impairment losses on property, plant and equipment and intangible (k) 78 (Impairment losses)/reversals of impairment losses (l) -1 AMORTISATION, DEPRECIATION, IMPAIRMENT LOSSES AND REVERSALS OF IMPAIRMENT LOSSES (j+k) -527 TOTAL COSTS -2,139 OPERATING PROFIT/(LOSS) 1,916 OPERATING PROFIT/(LOSS) (EBIT) 1,913 Financial income 101 Dividends received from investees (m) 2 Other financial income (n) 99 Financial expenses -582 Financial expenses from discounting of provisions for construction services required by contract and other provisions Other financial expenses (o) -557 Foreign exchange gains/(losses) (p) - Other financial expenses, after other financial income (m+n+o+p) -456 Capitalised financial expenses on intangible assets deriving from concession rights (c) 3 FINANCIAL INCOME/(EXPENSES) -481 Share of (profit)/loss of investees accounted for using the equity method 3 3 PROFIT/(LOSS) BEFORE TAX FROM CONTINUING OPERATIONS 1,438 1,438 Income tax (expense)/benefit Current tax expense -299 Differences on tax expense for previous years 10 Deferred tax income and expense -131 PROFIT/(LOSS) FROM CONTINUING OPERATIONS 1,018 1,018 Profit/(Loss) from discontinued operations PROFIT FOR THE YEAR 1,042 1,042 of which: Profit attributable to owners of the parent Profit attributable to non-controlling interests Annual Report
36 RECONCILICATION OF THE CONSOLIDATED INCOME STATEMENT WITH THE RECLASSIFIED INCOME STATEMENT m 2016 Reconciliation of items Ref. Reported basis Sub-items Main entries Ref. Reclassified basis Sub-items Main entries Toll revenue 3,483 3,483 Revenue from construction services 245 Revenue from construction services - government grants and cost of materials and external services (a) 221 Capitalised staff costs - construction services for which additional economic benefits are received (b) 7 Revenue from construction services: capitalised financial expenses (c) 6 Revenue from construction services provided by sub-operators (d) 11 Contract revenue - Other revenue (e) 305 Other operating income (e+d) 316 Revenue from construction services provided by sub-operators (d) 11 Total revenue 4,033 TOTAL OPERATING REVENUE 3,799 Raw and consumable materials Service costs Gain/(Loss) on sale of elements of property, plant and equipment - - Other operating costs -509 Concession fees (f) -454 Lease expense -4-4 Other Use of provisions for construction services required by contract (h) 429 Revenue from construction services: government grants and capitalised cost of materials and external (a) 221 COST OF MATERIALS AND EXTERNAL SERVICES -461 CONCESSION FEES (f) -454 Staff costs (g) -522 NET STAFF COSTS (g+b+i) -500 TOTAL NET OPERATING COSTS -1,415 GROSS OPERATING PROFIT (EBITDA) 2,384 OPERATING CHANGE IN PROVISIONS AND OTHER ADJUSTMENTS -88 Operating change in provisions -86 (Provisions)/ Uses of provisions for repair and replacement of motorway infrastructure Other provisions -1-1 (Impairment losses)/reversals of impairment losses (l) -2 Use of provisions for construction services required by contract 444 Use of provisions for construction services required by contract (h) 429 Capitalised staff costs - construction services for which no additional economic benefits are received (i) 15 Amortisation and depreciation (j) -579 Depreciation of property, plant and equipment -22 Amortisation of intangible assets deriving from concession rights -542 Amortisation of other intangible assets -15 (Impairment losses)/reversals of impairment losses -2 (Impairment losses)/reversals of impairment losses on property, plant and equipment and intangible (k) - (Impairment losses)/reversals of impairment losses (l) -2 AMORTISATION, DEPRECIATION, IMPAIRMENT LOSSES AND REVERSALS OF IMPAIRMENT LOSSES (j+k) -579 TOTAL COSTS -2,310 OPERATING PROFIT/(LOSS) 1,723 OPERATING PROFIT/(LOSS) (EBIT) 1,717 Financial income 22 Dividends received from investees (m) 2 Other financial income (n) 20 Financial expenses -890 Financial expenses from discounting of provisions for construction services required by contract and other provisions Other financial expenses (o) -843 Foreign exchange gains/(losses) (p) - Other financial expenses, after other financial income (m+n+o+p) -821 Capitalised financial expenses on intangible assets deriving from concession rights (c) 6 FINANCIAL INCOME/(EXPENSES) -868 Share of (profit)/loss of investees accounted for using the equity method -8-8 PROFIT/(LOSS) BEFORE TAX FROM CONTINUING OPERATIONS Income tax (expense)/benefit Current tax expense -219 Differences on tax expense for previous years 3 Deferred tax income and expense -103 PROFIT/(LOSS) FROM CONTINUING OPERATIONS Profit/(Loss) from discontinued operations PROFIT FOR THE YEAR of which: Profit attributable to owners of the parent Profit attributable to non-controlling interests
37 RECONCILICATION OF THE CONSOLIDATED STATEMENT OF FINANCIAL POSITION WITH THE RECLASSIFIED CONSOLIDATED STATEMENT OF FINANCIAL POSITION m 31 December December 2016 Reconciliation of items Reported basis Reclassified basis Reported basis Reclassified basis Ref. Main entries Ref. Sub-items Main entries Ref. Main entries Ref. Sub-items Main entries Non-current non-financial assets Property, plant and equipment (a) (a) Intangible assets (b) 18,356 18,356 (b) 18,750 18,750 Investments (c) (c) Deferred tax assets (d) (d) Other non-current assets (e) - - (e) 8 8 Total non-current non-financial assets (A) 18,602 19,024 Working capital Trading assets (f) (f) Current tax assets (g) (g) Other current assets (h) (h) Non-financial assets held for sale or related to discontinued operations p p q (w) 5 (w) 3,576 by contract (i) (i) Current provisions (j) (j) Trading liabilities (k) -1,324-1,324 (k) -1,255-1,255 Current tax liabilities (l) (l) -4-4 Other current liabilities (m) (m) Non-financial liabilities related to discontinued operations (x) -6 (x) -1,234 Total working capital (B) -1, Gross invested capital (C=A+B) 16,875 19,777 Non-current non-financial liabilities required by contract (n) -2,840-2,840 (n) -3,165-3,165 Non-current provisions (o) -1,314-1,314 (o) -1,298-1,298 Deferred tax liabilities (p) (p) Other non-current liabilities (q) (q) Total non-current non-financial liabilities (D) -4,786-4,965 NET INVESTED CAPITAL (E=C+D) 12,089 14,812 Total equity (F) 2,738 2,738 6,118 6,118 Net debt Non-current net debt Non-current financial liabilities (r) 10,991 10,991 (r) 12,022 12,022 Non-current financial assets (s) (s) Total non-current net debt (G) 10,597 11,626 Current net debt Current financial liabilities (t) 2,231 2,231 (t) 1,368 3,131 Short-term borrowings Current derivative liabilities Intercompany current account payables due to related parties Current portion of medium/long-term borrowings 1,385 1, Other current financial liabilities Current financial liabilities related to discontinued operations (aa) - (aa) 1,763 Cash and cash equivalents (u) -2,938-2,945 (u) -3,224-3,625 Cash -2,076-2,076-2,541-2,541 Cash equivalents Intercompany current account receivables due from related parties Cash and cash equivalents related to discontinued operations (y) -7 (y) -401 Current financial assets (v) (v) ,438 Current financial assets deriving from concession rights Current financial assets deriving from government grants Current term deposits Current portion of other medium/long-term financial assets Other current financial assets Financial assets held for sale or related to discontinued operations (z) - (z) -1,930 Total current net debt (H) -1,246-2,932 Total net debt (I=G+H) 9,351 8,694 NET DEBT AND EQUITY (L=F+I) 12,089 14,812 Assets held for sale or related to discontinued operations (-y-z+w) 12 (-y-z+w) 5,907 Liabilities related to discontinued operations (-x+aa) 6 (-x+aa) 2,997 TOTAL NON-CURRENT ASSETS TOTAL CURRENT ASSETS TOTAL NON-CURRENT LIABILITIES TOTAL CURRENT LIABILITIES (a+b+c+d+ e-s) 18,996 (f+g+h-u-vy-z+w) 4,106 (-n-o-pq+r) 15,777 (-i-j-k-l-m+tx+aa) 4,587 (a+b+c+d+ e-s) 19,420 (f+g+h-u-vy-z+w) 10,366 (-n-o-pq+r) 16,987 (-i-j-k-l-m+tx+aa) 6,681 Annual Report
38 RECONCILICATION OF THE STATEMENT OF CHANGES IN CONSOLIDATED NET DEBT WITH THE CONSOLIDATED STATEMENT OF CASH FLOWS m Reconciliation of items Note Consolidated statement of cash flows Changes in consolidated net debt Consolidated statement of cash flows Changes in consolidated net debt CASH FLOWS FROM (USED IN) OPERATING ACTIVITIES Profit for the year 1,042 1, Adjusted by: Amortisation and depreciation Operating change in provisions Financial expenses from discounting of provisions for construction services required by contract and other provisions Impairment losses/(reversal of impairment losses) on financial assets and investments accounted for at cost or fair value Share of (profit)/loss of investees accounted for using the equity method Impairment losses/(reversal of impairment losses) and adjustments of current and non-current assets (Gains)/Losses on sale of non-current assets Net change in deferred tax (assets)/liabilities through profit or loss Other non-cash costs (income) Non-cash inflows from discontinued operations (a) 32 - Operating cash flow 1,715 2,063 Change in operating capital (b) Other changes in non-financial assets and liabilities (c) 59 9 Change in working capital and other changes (a+b+c) Net cash generated from/(used in) operating activities (A) 1,913 1,913 1,848 1,848 NET CASH FROM/(USED IN) INVESTMENT IN NON-FINANCIAL ASSETS Investment in assets held under concession Purchases of property, plant and equipment Purchases of other intangible assets Capital expenditure Government grants related to assets held under concession Increase in financial assets deriving from concession rights (related to capital expenditure) Proceeds from sales of property, plant and equipment, intangible assets and unconsolidated investments Price collected from disposal of consolidated companies (d) - - 1,291 1,291 Net debt transferred following disposal of consolidated companies (e) Cash arising from disposal of consolidated companies (f) Cash transferred following disposal of consolidated companies (g) Proceeds from sale of consolidated companies, including net debt transferred (d+e) - 1,537 Proceeds from sale of consolidated companies, after cash and cash equivalents transferred (d+f+g) - 1,555 Cash and cash equivalents of consolidated companies transferred as a result of distribution of special dividend in kind Net debt/(funds) of consolidated companies transferred as a result of distribution of dividend in kind special (h) (i) Net change in other non-current assets Net change in current and non-current financial assets (j) Net cash from/(used in) investment in non-financial assets (B) (k) Net cash generated from/(used in) investing activities (C) (k-e+f+g+h-i+j) NET EQUITY CASH INFLOWS/(OUTFLOWS) Distribution of reserves to the parent -1,101-1, Dividends declared by Group companies (l) Dividends paid (m) Return of capital to non-controlling shareholders Net equity cash inflows/(outflows) (D) -1, Net cash generated during year (A+B+D) ,731 Repayment of loans from parent - -1,101 Issuance of bonds Increase in medium/long term borrowings (excluding finance lease liabilities) - 5 Bond redemptions Repayments of medium/long term borrowings (excluding finance lease liabilities) Net change in other current and non-current financial liabilities Net cash generated from/(used in) financing activities (E) -1,448-1,899 Change in fair value of hedging derivatives (n) Financial income/(expenses) accounted for as an increase in financial assets/(liabilities) (o) Change in financial liabilities arising from issuer substitution (p) Effect of foreign exchange rate movements on net debt and other changes (q) Other changes in net debt (F) Net effect of foreign exchange rate movements on net cash and cash equivalents (G) Decrease in net debt for year (A+B+D+F) ,648 Net debt at beginning of year -8,694-10,342 Net debt at end of year -9,351-8,694 Increase/(Decrease) in cash and cash equivalents during year (A+C+E+G) NET CASH AND CASH EQUIVALENTS AT BEGINNING OF YEAR 3,419 2,812 NET CASH AND CASH EQUIVALENTS AT END OF YEAR 2,931 3,419 38
39 Notes: a) this item shows, for 2017, the balance of cash flows not generated by operating activities with an impact on profit for the year of the companies classified as discontinued operations. In 2016, these cash flows were presented in the specific items adjusting profit for the year as they were classified as discontinued operations at the end of 2016; b) the Change in operating capital shows the change in trade-related items directly linked to the Group s ordinary activities (in particular: inventories, trading assets and trading liabilities); c) the Other changes in non-financial assets and liabilities shows the change in items of a non-trading nature (in particular: current tax assets and liabilities, other current assets and liabilities, current provisions for construction services required by contract and other provisions); d) this item refers to the price collected on the sale, at the end of 2016, of the investments in Telepass and Stalexport Autostrady; e) this item includes the net debt of Telepass, Stalexport Autostrady and the related subsidiaries at the date of transfer of the related investments (the end of 2016); f) this item refers to cash and cash equivalents arising, at the end of 2016, from the deconsolidation of Telepass, Stalexport Autostrady and the related subsidiaries; g) this item includes the cash and cash equivalents held by Telepass, Stalexport Autostrady and the related subsidiaries at the date of transfer of the related investments; h) this item refers to cash and cash equivalents transferred as a result of the deconsolidation of AID, ADA and the related subsidiaries following distribution of the special dividend in kind to the parent, Atlantia; i) this item refers to the net debt/funds of AID, ADA and the related subsidiaries transferred following distribution of the special dividend in kind to the parent, Atlantia; j) the Net change in current and non-current financial assets is not shown in the Statement of changes in consolidated net debt, as it does not have an impact on net debt; k) Net cash from/(used in) investment in non-financial assets excludes changes in the financial assets and liabilities referred to in notes e), g) and j) that do not have an impact on net debt; l) Dividends declared by Group companies regard the portion of dividends declared by the Parent Company and other Group companies attributable to non-controlling interests, regardless of the period of payment; m) Dividends paid refer to amounts effectively paid during the reporting period; n) the amount represents the change in the fair value of cash flow hedges, before the related taxation, as shown in Fair value gains/(losses) on cash flow hedges in the consolidated statement of comprehensive income; o) this item essentially includes financial income and expenses in the form of interest linked to loans requiring the repayment of principal and interest accrued at maturity; the financial assets are described in note 7.4 and the financial liabilities are described in note 7.15 in the consolidated financial statements; p) the Change in financial liabilities due to the issuer substitution" reflects the impact on the change in net debt in 2016 as a result of the issuer substitution, completed at the end of 2016; q) this item includes the impact of exchange rate movements on financial assets (including cash and cash equivalents) and financial liabilities denominated in currencies other than the euro held by Group companies, and the non-cash income/(costs) resulting in changes in net debt. Annual Report
40 2.3 Financial review for Autostrade per l Italia SpA Introduction This financial review includes and analyses the reclassified income statement, statement of comprehensive income, statement of changes in equity and statement of changes in net debt of Autostrade per l Italia SpA (the company ) for the year ended 31 December 2017, in which amounts are compared with those of the previous year. The review also includes and analyses the reclassified statement of financial position as at 31 December 2017, compared with comparative amounts as at 31 December The accounting standards applied during preparation of the accounts for the year ended 31 December 2017 are consistent with those adopted for the financial statements for the year ended 31 December 2016, in that the amendments to existing standards that have come into effect since 1 January 2017 have not had a material impact on the accounts. The planned restructuring of the Group, approved and initiated by Atlantia s Board of Directors in 2016, was completed in March Based on the resolution approved by the Company s shareholders on 25 January 2017, the Company distributed a special dividend in kind (equal to 755 million) to the parent, Atlantia, via the transfer, based on the related carrying amounts, of its entire interests in Autostrade dell Atlantico and Autostrade Indian Infrastructure Development. In addition, on 21 April 2017, the Annual General Meeting of the Company s shareholders approved the distribution of a portion of its available reserves, by transferring the amount of 1,101 million from the Reserve for transactions under common control, present in the financial statements as at and for the year ended 31 December On 27 April 2017, Atlantia s Board of Directors approved the sale of a 5% interest in the Company to Appia Investments (a company owned by Allianz, EDF Invest and DIF) and the sale of a further 5% interest to Silk Road Fund. On completion of the transaction on 26 July 2017, the call option granted to Appia Investments was also exercised, resulting in the sale of a further 1.94% interest in the Company. The Company did not enter into non-recurring, atypical or unusual transactions, either with third or related parties, having a material impact on the Company s accounts in either 2017 or There were no non-recurring events and/or transactions in In 2016, on the other hand, the Company completed an issuer substitution, taking Atlantia s place as the issuer of a number of bonds. This had a significant impact on the Company s operating results and financial position in that year. The reconciliation of the reclassified financial statements included and analysed in this section with the corresponding statutory financial statements is provided in the section Reconciliation of Autostrade per l Italia SpA s reclassified and statutory financial statements. 40
41 Results of operations Operating revenue for 2017 amounts to 3,621 million, marking an increase of 94 million compared with 2016 ( 3,527 million). It should be noted that toll revenue includes, for 359 million( 349 million in 2016) the toll increases matching the addition to the concession fee payable to ANAS and accounted for in operating costs, without having any impact on the Company s results (1). After stripping out the above toll increases, total revenue is up 84 million compared with Toll revenue of 3,321 million is up 99 million compared with 2016 ( 3,222 million). After stripping out the above toll increases, the improvement is 89 million, primarily reflecting: a) a 2.2% increase in traffic. Taking into account the positive impact of the different traffic mix, the increase in toll revenue is estimated to be 73 million; b) application of annual toll increases for 2017 (a rise of 0.64% from 1 January), boosting toll revenue by an estimated 18 million. Other operating income amounts to 300 million, slightly down on 2016 due, among other things, to reduced income recognised in connection with the transfer of buildings at certain service areas free of charge, reflecting the renewal of the related sub-concessions. Net operating costs, amounting to 1,313 million, are up 29 million compared with 2016 ( 1,284 million). After stripping out the above additional concession fees payable, net operating costs are up 19 million on the previous year. The Cost of materials and external services amounts to 483 million, up 20 million compared with 2016 ( 463 million). This reflects an increase in maintenance work on the network and the variable costs linked to increased snowfall in (1) From 1 January 2011 the additional concession fees payable to ANAS, pursuant to laws 102/2009 and 122/2010, calculated on the basis of the number of kilometres travelled, amount to 6 thousandths of a euro per kilometre for toll classes A and B and 18 thousandths of a euro per kilometre for classes 3, 4 and 5. Annual Report
42 Concession fees amount to 442 million ( 431 million in 2016). This item includes the above addition in the concession fees payable and concession fees linked to toll revenue and subconcession arrangements. RECLASSIFIED INCOME STATEMENT (*) INCREASE/(DECREASE) m ABSOLUTE % Toll revenue 3,321 3, Other operating income Total operating revenue 3,621 3, Cost of materials and external services Concession fees Net staff costs Total net operating costs -1,313-1, Gross operating profit (EBITDA) 2,308 2, Amortisation, depreciation, impairment losses and reversal of impairment losses Operating change in provisions and other adjustments n.s. Operating profit (EBIT) 1,749 1, Dividends received from investees Reversals of impairment losses/(impairment losses) on investments Financial expenses from discounting of provisions for construction services required by contract and other provisions n.s Other financial income/(expenses), net Capitalised financial expenses on intangible assets deriving from concession rights Profit/(Loss) before tax from continuing operations , Income tax expense Profit/(Loss) from continuing operations After-tax dividends from discontinued operations n.s. Profit for the year ( ) INCREASE/ (DECREASE) Basic earnings per share of which: - from continuing operations from discontinued operations Diluted earnings per share of which: - from continuing operations from discontinued operations (*) The reconciliation with reported amounts in the income statement is provided in the section, Reconciliation of Autostrade per l'italia's reclassified and statutory financial statements. 42
43 Net staff costs of 388 million are down approximately 2 million compared with This broadly reflects the following: a) a reduction in the average workforce of 162, essentially reflecting the transfer of staff from Autostrade per l Italia s Contact centre to Telepass, of staff from Autostrade per l Italia s Foreign Department to Atlantia, as well as slower turnover among toll collectors, partly offset by the hiring of staff to fill specific roles within certain organisational units; b) an increase in the average unit cost, primarily due to the cost of contract renewals. Gross operating profit (EBITDA) of 2,308 million is up 65 million on 2016 ( 2,243 million). Operating profit (EBIT) of 1,749 million is up 110 million on 2016 ( 1,639 million). In addition to the improvement in EBITDA, the increase in EBIT reflects a combination of: a) the positive impact of the Operating change in provisions and other adjustments, totalling 70 million, essentially due to movements in provisions for the repair and replacement of motorway infrastructure, reflecting: 1) a net use of 17 million in 2017, mainly attributable to a revised forecast of the repair work to the carried out on the motorway network, given the fact that the discount rates used in the two comparative periods are substantially unchanged; 2) a negative impact of 60 million in 2016, essentially to a reduction in the discount rates used as at 31 December 2016, compared with those applied as at 31 December 2015; b) increased depreciation and amortisation ( 25 million), primarily relating to construction services for which no additional economic benefits are received, due to revision of the present value on completion of investment in construction services recognised as at 31 December Dividends received from investees, totalling 50 million, are up 23 million compared with the previous year ( 27 million). This primarily reflects increased dividends declared by Autostrade Tech and Traforo Monte Bianco ( 25 million and 14 million in 2017, compared with 6 million and 5 million in 2016). Reversals of impairment losses/(impairment losses) on investments amount to a positive 4 million in 2017, relating to the adjustment of the carrying amount of the investment in Pavimental, compared with impairment losses recognised in 2016 on the investments in Pavimental ( 7 million), AD Moving ( 3 million) and other minor investees ( 3 million). Financial expenses from the discounting of provisions for construction services required by contract and other provisions amount to 24 million ( 45 million in 2016), down 21 million essentially due to the decline in the discount rates applied with respect to the comparative period. Net other financial expenses of 432 million are down 367 million compared with 2016 ( 799 million). As a result of the issuer substitution completed in December 2016, the following were recognised: a) in 2016, a non-recurring expense of 308 million, reflecting recognition of the fair value of foreign currency bond issues and the related Cross Currency Swaps; Annual Report
44 b) in 2017, income of 41 million essentially due to remeasurement of the fair value of the foreign currency bond issues transferred as part of the issuer substitution and the change in the fair value of the related derivative financial instruments. After stripping out these items, net financial expenses are down 18 million, primarily due to combination of the following: a) the expenses incurred in 2016 in order to repay the loan from Atlantia with a face value of 880 million in May 2016 ( 14 million) and to make partial early repayment of loans from Atlantia, matching bonds issued by the latter and also subject to a partial buyback ( 19 million); b) expenses ( 21 million) linked to the unwinding, in 2017, of a number of Forward-Starting Interest Rate Swaps entered into in June 2015, with the release of a matching amount from the relevant equity reserve, following the partial buyback of certain bonds in issue, accompanied by the issuance of new bonds. Profit before tax from continuing operations amounts to 1,348 million, an increase of 537 million compared with 2016 ( 811 million), primarily as a result of the reduction in financial expenses. Income tax expense of 380 million in 2017 is up 84 million compared with 2016, essentially due to the increase in pre-tax profit, having benefitted from the reduction in the IRES rate from 1 January 2017 (with an estimated impact of 38 million). Dividends, after the related taxation, from discontinued operations, amounting to zero in 2017, in 2016 included net proceeds from the dividends declared by Telepass ( 54 million) and Autostrade per l Atlantico ( 50 million). Control of these companies was transferred to the parent between the end of 2016 and the first quarter of 2017, following the restructuring of the Atlantia Group. Profit for the year thus amounts to 968 million, up 349 million compared with 2016 ( 619 million) which, as previously noted, was primarily impacted by the non-recurring expenses incurred as a result of the issuer substitution. Total other comprehensive income for the year amounts to 44 million in 2017, primarily reflecting: a) a reduction of 25 million in fair value losses, after taxation, on Interest Rate Swaps and Forward-Starting Interest Rate Swaps, due to higher interest rates in 2017; b) the reclassification of 21 million in fair value losses on Forward-Starting Interest Rate Swaps recognised in equity to profit or loss. In 2016, this item amounted to income of 91 million, primarily reflecting a combination of the following: a) the release of the cash flow hedge reserve, following the unwinding of derivatives as a result of the issuer substitution, recognising a loss in profit or loss of 201 million (this loss in profit or loss is fully offset by income of the same amount resulting from extinguishment of the matching derivatives entered into with Atlantia); b) the reversal of deferred tax assets, amounting to 50 million, linked to point a); 44
45 c) the after-tax reduction in the fair value of the Forward-Starting Interest Rate Swaps entered into in June 2015 and February 2016, relating to the reduction in interest rates between 31 December 2016 and 31 December 2015 ( 56 million). STATEMENT OF COMPREHENSIVE INCOME OF AUTOSTRADE L'ITALIA SpA m Profit for the year (A) of which attributable to discontinued operations Fair value gains/(losses) on cash flow hedges Tax effect of fair value gains/(losses) on cash flow hedges Deferred tax effect of issuer substitution on cash flow hedges Other comprehensive income/(loss) reclassifiable to profit or loss for the year (B) Gains/(losses) from actuarial valuations of provisions for employee benefits -1-2 Tax effect of gains/(losses) from actuarial valuations of provisions for employee benefits - 1 Other comprehensive income/(loss) not reclassifiable to profit or loss for the year (C) -1-1 Reclassification of the cash flow hedge reserve arising from issuer substitution Other reclassifications of the cash flow hedge reserve 20-3 Reclassifications of other components of comprehensive income to profit or loss for the year (D) Total other comprehensive income/(loss) for the year (E=B+C+D) Comprehensive income for the year (A+E) 1, Annual Report
46 Financial position As at 31 December 2017, Non-current non-financial assets of 17,702 million are down 459 million on the figure for 31 December 2016 ( 18,161 million). This item primarily refers to Intangible assets of 17,403 million ( 17,862 million as at 31 December 2016), essentially represented by: a) concession rights totalling 11,272 million ( 11,734 million as at 31 December 2016); b) the residual value of goodwill ( 6,111 million) recognised following the contribution of the motorway assets of the former Autostrade Concessioni e Costruzioni Autostrade SpA (now Atlantia SpA) to Autostrade per l Italia as part of a reorganisation of the Group in Goodwill is not amortised on a systematic basis but is subject to impairment tests which, as at 31 December 2017, have confirmed the recoverability of the above carrying amount with respect to the estimated value in use. The decrease in intangible assets compared with 31 December 2016, totalling 459 million, is essentially due to a combination of the following: a) amortisation for the year ( 545 million); b) the portion of investment recognised as an increase in intangible assets, amounting to 114 million, and primarily linked to construction services for which additional economic benefits are received ( 88 million). As at 31 December 2017, Investments amount to 225 million ( 221 million as at 31 December 2016). The increase of 4 million regards the partial reversal of impairment losses on the carrying amount of Pavimental. As at 31 December 2017, Working capital has a negative balance of 1,662 million (compared with a negative balance of 348 million as at 31 December 2016). This broadly reflects the reduction in investments classified as held for distribution to shareholders as at 31 December 2016, following: a) the return of capital reserves by Autostrade per l Atlantico, totalling 398 million; b) distribution of a special dividend in kind via the transfer to Atlantia of the Company s investments in Autostrade dell Atlantico and Autostrade Indian Infrastructure Development, amounting to 754 million and 1 million, respectively, with effect from 1 and 22 March
47 RECLASSIFIED STATEMENT OF FINANCIAL POSITION (*) m 31 December December 2016 INCREASE/ (DECREASE) Non-current non-financial assets Property, plant and equipment Intangible assets 17,403 17, Investments Total non-current non-financial assets (A) 17,702 18, Working capital Trading assets Current tax assets Other current assets Non-financial assets held for sale or for distrubution to shareholders or related to discontinued operations 4 1,158-1,154 Current portion of provisions for construction services required by contract Current provisions Trading liabilities -1,306-1, Current tax liabilities Other current liabilities Total working capital (B) -1, ,314 Gross invested capital (C=A+B) 16,040 17,813-1,773 Non-current non-financial liabilities Non-current portion of provisions for construction services required by contract -2,840-3, Non-current provisions -1,064-1, Deferred tax liabilities Other non-current liabilities Total non-current non-financial liabilities (D) -4,525-4, NET INVESTED CAPITAL (E=C+D) Equity 11,515 13,073-1,558 Issued capital Reserves and retained earnings 847 2,669-1,822 Profit/(Loss) for the year after payment of interim dividend Total equity (F) 1,987 3,605-1,618 Net debt/(net funds) Non-current net debt/(net funds) Non-current financial liabilities 10,964 11,994-1,030 Bond issues 8,093 8, Medium/long-term borrowings 2,442 3,509-1,067 Non-current derivative liabilities Non-current financial assets Non-current financial assets deriving from government grants Non-current term deposits Other non-current financial assets Total non-current net debt/(net funds) (G) 10,326 11,352-1,026 Current net debt/(net funds) Current financial liabilities 1,971 1, Short-term borrowings Current derivative liabilities Intercompany current account payables due to related parties Current portion of medium/long-term borrowings 1, Other current financial liabilities 3-3 Cash and cash equivalents -2,627-2, Cash -1,773-2, Cash equivalents Intercompany current account receivables due from related parties Current financial assets Current financial assets deriving from government grants Current term deposits Current derivative assets Current portion of other medium/long-term financial assets Other current financial assets Total current net debt/(net funds) (H) ,884 1,086 Total net debt/(net funds) (I=G+H) (1) NET DEBT AND EQUITY (L=F+I) 9,528 9, ,515 13,073-1,558 (*) The reconciliation with the reported amounts in the financial statements is provided in the section, Reconciliation of Autostrade per l'italia SpA's reclassified and (1) Net debt includes non-current financial assets, unlike the financial position shown in the notes to the financial statements and prepared in compliance with the European Securities and Markets Authority (ESMA) Recommendation of 20 March 2013, which does not permit the deduction of non-current financial assets from debt. Annual Report
48 After stripping out the above effects, the reduction in working capital of 161 million, compared with the balance as at 31 December 2016, primarily reflects the following changes: a) a decrease of 100 million in the current portion of provisions for construction services required by contract, linked to expected investment in construction services for which no additional benefits are received in 2018 and, of 8 million in other provisions; b) an increase of 116 million in net current tax liabilities, essentially due to provisions for tax expense for the period, after payments on account; c) an increase of 77 million in trade payables, primarily due to the greater volume of capital expenditure carried out in the last quarter of 2017, compared with the same period of 2016, and to an increase in amounts payable to the operators of interconnecting motorways and in tolls in the process of being collected, reflecting normal seasonal traffic trends on the network; d) a reduction of 72 million in trade receivables, primarily due to a decline in tolls to be billed at the end of the year and a decrease in amounts due from sub-operators at service areas (following collection, in February 2017, of receivables recognised as at 31 December 2016 in relation to contracts entered into prior to 2014, under which billing takes place annually, partially offset by an increase in the value of bills issued on a quarterly basis under the new contracts). Non-current non-financial liabilities, totalling 4,525 million, are down 215 million ( 4,740 million as at 31 December 2016) due to: a) a reduction of 325 million in the non-current portion of provisions for construction services required by contract, essentially reflecting an updated estimate of the current portion based on the estimated services to be carried out in 2018; b) a decrease of 20 million in the non-current portion of other provisions, primarily following a revised estimate of provisions for the repair and replacement of motorway infrastructure ( 14 million); c) an increase of 127 million in net deferred tax liabilities, primarily as a result of the recognition of deferred tax liabilities due to the deduction, solely for tax purposes, of the amortisation of goodwill ( 99 million) and the tax effect of fair value gains on cash flow hedges recognised in other comprehensive income ( 14 million). As a result, Net invested capital amounts to 11,515 million ( 13,073 million as at 31 December 2016). Equity of 1,987 million is down 1,618 million compared with 31 December 2016 ( 3,605 million). This essentially reflects a combination of the following: a) the above distribution of the special dividend in kind approved by the General Meeting of Autostrade per l Italia s shareholders held on 25 January 2017, totalling 755 million, as previously mentioned in the comment on working capital, and recognition of the related current tax liabilities of 12 million; b) the above distribution of a portion of the Reserve for transactions under common control, approved by the AGM of the Company s shareholders held on 21 April 2017, totalling 1,101 million; 48
49 c) payment of the final dividend for 2016 ( 314 million) and the interim dividend for 2017 ( 450 million); d) comprehensive income for the year, amounting to 1,012 million. STATEMENT OF CHANGES IN EQUITY Other reserves and retained earnings m Issued capital Share premium reserve Legal reserve Cash flow hedge reserve Other reserves and retained earnings Total other reserves and retained earnings Profit for the year after interim dividend Total equity Balance as at 31 December ,232 1, ,566 Comprehensive income for the year Owner transactions and other changes Final dividend for 2015 ( per share, AGM of 21 April) Transfer of profit/(loss) for previous year to retained earnings (AGM of 21 April) Interim dividend ( per share) Share-based incentive plans Increase in "Reserve for transactions under common control" due to sale of investments ,101 1,101-1,101 Balance as at 31 December ,485 2, ,605 Comprehensive income for the year ,012 Owner transactions and other changes Distribution of special dividend in kind, including effect on current taxation (OGM of 25 January) Final dividend for 2016 ( per share, AGM of 21 April) Distribution of part of "Reserve for transactions under common control" (AGM of 21 April) ,101-1, ,101 Interim dividend ( per share) Share-based incentive plans Balance as at 31 December ,987 Annual Report
50 Net debt as at 31 December 2017 amounts to 9,528 million, up 60 million on the figure for 31 December 2016 ( 9,468 million). Non-current net debt of 10,326 million is down 1,026 million compared with 31 December 2016 ( 11,352 million). The change during the year is due to a combination of the following: a) reclassification of the loan from Atlantia ( 996 million) and portions of bank borrowings ( 122 million) maturing in 2018; b) a reduction in fair value losses on derivative financial instruments ( 51 million), essentially due to an increase in interest rates during 2017, as well as the above-mentioned unwinding; c) an increase in bond issues of 135 million, reflecting the issue of bonds maturing in 2029 to institutional investors and the concomitant buyback of a portion of the bonds maturing in 2019, 2020 and February and November As at 31 December 2017, Current net funds amount to 798 million, down 1,086 million compared with 31 December 2016 ( 1,884 million). This primarily reflects the above reclassification of the loan from Atlantia maturing in 2018, as indicated in the previous point a). 8% of the Company s debt is denominated in currencies other than the euro (sterling and yen) as at 31 December Taking into the account the cross currency swaps linked to the bonds denominated in sterling and yen, the percentage of foreign currency debt exposed to currency risk amounts to zero. The residual weighted average term to maturity of the Company s interest bearing debt is approximately six years and seven months as at 31 December % of interest bearing debt is fixed rate. The remaining 5% of floating rate date regards short-term loans in the form of cash deposits by Atlantia and amounts in intercompany current accounts repayable to related parties. The average cost of the Company s medium/long-term borrowings in 2017 was 3.6%. As at 31 December 2017, the Company has cash reserves (cash, term deposits and undrawn committed lines of credit) of 3,774 million, consisting of: a) 2,040 million in investments and cash maturing in the short term, including net shortterm debt to Atlantia Group companies, essentially relating to Autostrade per l Italia s role as a provider of centralised treasury management; b) 234 million in term deposits allocated primarily to part finance the execution of specific construction services; c) 1,500 million in undrawn committed lines of credit. The Company has lines of credit with a weighted average residual term to maturity of approximately eight years and three months and a weighted average residual drawdown period of approximately four years. 50
51 Cash flow Net cash from operating activities amounts to 1,837 million, marking an increase of 233 million compared with 2016 ( 1,604 million). The change primarily reflects the performance of operating capital in the comparative periods (a difference of 234 million), primarily linked to cash flow generated in 2017 (essentially an increase in trading liabilities and a reduction in trade receivables, as mentioned above), taking into account that fact that, in 2016, there was an outflow of operating capital due to the reduction in trading liabilities essentially as a result of the performance of capital expenditure. There was also an increase in the inflow generated by other non-financial assets and liabilities ( 70 million), primarily due to current taxation. Operating cash flow is instead down 71 million compared with 2016, primarily due to a reduction in dividends received following the above transfer of the Company s investments in Autostrade dell Atlantico and Telepass to Atlantia, and the positive impact on taxation recognised in 2016 as a result of the issuer substitution, partially offset by an improvement in cash from operating activities and a reduction in net realised financial expenses in Cash used for investment in non-financial assets, totalling a negative amount of 130 million, reflects capital expenditure ( 530 million), partially offset by the return of capital reserves by Autostrade dell Atlantico in January 2017 ( 398 million). The inflow of 595 million recorded in 2016 was primarily due to the proceeds from disposal of the investments in Telepass and Stalexport Autostrady to Atlantia In addition to the final dividend for 2016 and the interim dividend for 2017, amounting to 314 million and 450 million, respectively ( 470 million and 305 million in 2016), Net equity cash outflows include the above distribution of a portion of the Reserve for transactions under common control, totalling 1,101 million. Net debt was also influenced by the following in 2017: a) a reduction of 39 million in after-tax fair value losses on cash flow hedges recognised in comprehensive income (an increase in losses of 74 million in 2016), as mentioned above; b) other changes in financial assets and liabilities, totalling 61 million, essentially due to: 1) non-cash financial income recognised in profit or loss ( 41 million) following remeasurement of the fair value of bond issues denominated in foreign currencies and the positive movement in the value of Cross Currency Swaps (included in the issuer substitution completed in December 2016); 2) realised financial expenses ( 21 million) resulting from the reclassification to profit or loss of the equity reserve for losses on Forward-Starting Interest Rate Swaps (reflecting the buyback of a portion of certain bond issues and the concomitant issuance of new bonds). The above cash flows have, therefore, resulted in an overall increase in net debt of 60 million, compared with a decrease of 1,242 million in Annual Report
52 STATEMENT OF CHANGES IN NET DEBT OF AUTOSTRADE PER L'ITALIA SpA (*) m CASH FLOWS FROM (USED IN) OPERATING ACTIVITIES Profit for the year Adjusted by: Amortisation and depreciation Operating change in provisions Financial expenses from discounting of provisions for construction services required by contract and other provisions (Reversals of impairment losses)/impairment losses on investments Impairment losses/(reversals of impairment losses) on current and non-current assets 1 2 (Gains)/Losses on sale of non-current assets -1 - Net change in deferred tax (assets)/liabilities through profit or loss Other non-cash costs (income) Operating cash flow 1,613 1,683 Change in operating capital Other changes in non-financial assets and liabilities Net cash generated from/(used in) operating activities (A) 1,837 1,604 NET CASH FROM/(USED IN) INVESTMENT IN NON-FINANCIAL ASSETS Investment in assets held under concession Purchases of property, plant and equipment Purchases of other intangible assets Capital expenditure Government grants related to assets held under concession 1 1 Proceeds from sale of property, plant and equipment, intangible assets and investments 1 1,266 Repayment of capital reserves by subsidiaries Net cash from/(used in) investment in non-financial assets [b] NET EQUITY CASH INFLOWS/(OUTFLOWS) Distribution of equity reserves -1,101 - Dividends declared Net equity cash inflows/(outflows) [c] -1, Increase/(Decrease) in cash and cash equivalents during year [a+b+c] ,424 OTHER CHANGES IN NET DEBT Change in fair value of hedging derivatives Financial income/(expenses) accounted for as an increase in financial assets/(liabilities) -2-1 Change in financial liabilities arising from issuer substitution Other change in financial assets and liabilities 61 - Other changes in net debt [d] Decrease/(Increase) in net debt for year [a+b+c+d] -60 1,242 Net debt at beginning of year -9,468-10,710 Net debt at end of year -9,528-9,468 (*) The reconciliation with the reported amounts in the statement of cash flows is provided in the section, Reconciliation of Autostrade per l'italia SpA's reclassified and statutory financial statements. 52
53 Reconciliation of Autostrade per l Italia SpA s reclassified and statutory financial statements Reconciliations of the reclassified income statement, the reclassified statement of financial position and the statement of changes in net debt with the matching statutory financial statements are included below. Annual Report
54 RECONCILICATION OF AUTOSTRADE PER L'ITALIA SpA'S INCOME STATEMENT WITH THE RECLASSIFIED INCOME STATEMENT m Reconciliation of items Ref. Reported basis Reclassified basis Reported basis Reclassified basis Main entries Ref. Main entries Ref. Main entries Ref. Subitems Subitems Subitems Subitems Main entries Toll revenue 3,321 3,321 3,222 3,222 Revenue from construction services venue from construction services - government grants and cost of materials and external services (a) 82 (a) 184 Capitalised staff costs - construction services for which additional economic benefits are received (b) 5 (b) 5 Revenue from construction services: capitalised financial expenses (c) 1 (c) 2 Revenue from construction services provided by sub-operators (d) 7 (d) 11 Other revenue (e) 293 (e) 294 Other operating income (e+d) 300 (e+d) 305 Revenue from construction services provided by sub-operators (d) 7 (d) 11 Total revenue 3,709 3,718 TOTAL OPERATING REVENUE 3,621 3,527 Raw and consumable materials Service costs Gain/(Loss) on sale of elements of property, plant and equipment Other operating costs Concession fees (q) -442 (q) -431 Lease expense Other Use of provisions for construction services required by contract (g) 388 (g) 429 Revenue from construction services: government grants and capitalised cost of materials and (a) (a) 82 external services 184 COST OF MATERIALS AND EXTERNAL SERVICES CONCESSION FEES (q) -442 (q) -431 Staff costs (f) -411 (f) -410 NET STAFF COSTS (f+b+h) -388 (f+b+h) -390 TOTAL NET OPERATING COSTS -1,313-1,284 GROSS OPERATING PROFIT (EBITDA) 2,308 2,243 OPERATING CHANGE IN PROVISIONS AND OTHER ADJUSTMENTS 6-64 Operating change in provisions 7-63 (Provisions)/ Uses of provisions for repair and replacement of motorway infrastructure (Provisions)/Uses of other provisions (Impairment losses)/reversals of impairment losses on current assets (k) -1 (k) -1 Use of provisions for construction services required by contract Use of provisions for construction services required by contract (g) 388 (g) 429 pitalised staff costs - construction services for which no additional economic benefits are received (h) 18 (h) 15 Amortisation and depreciation (i) -565 (i) -540 Depreciation of property, plant and equipment Depreciation of investment property - - Amortisation of intangible assets deriving from concession rights Amortisation of other intangible assets (Impairment losses)/reversals of impairment losses on current and non-current assets -1-1 (Impairment losses)/reversals of impairment losses on property, plant and equipment and (j) - (j) - (Impairment losses)/reversals of impairment losses on other assets (k) -1 (k) -1 AMORTISATION, DEPRECIATION, IMPAIRMENT LOSSES AND REVERSALS OF IMPAIRMENT LOSSES TOTAL COSTS -1,959-2,077 OPERATING PROFIT/(LOSS) 1,750 1,641 OPERATING PROFIT/(LOSS) (EBIT) 1,749 1,639 Financial income Reversal of impairment losses on financial assets and investments (l) 4 (l) - Dividends received from investees Other financial income (m) 119 (m) 50 Financial expenses Financial expenses from discounting of provisions for construction services required by contract and other provisions Impairment losses on financial assets and investments (n) - (n) -13 Other financial expenses (o) -551 (o) -849 Foreign exchange gains/(losses) (p) - (p) - Reversals of impairment losses/(impairment losses) on investments (l+n) 4 (l+n) -13 Other financial expenses, after other financial income (m+o+p) -432 (m+o+p) -799 Capitalised financial expenses on intangible assets deriving from concession rights (c) 1 (c) 2 FINANCIAL INCOME/(EXPENSES) PROFIT/(LOSS) BEFORE TAX FROM CONTINUING OPERATIONS 1,348 1, Income tax (expense)/benefit Current tax expense Differences on tax expense for previous years 9 3 Deferred tax income and expense PROFIT/(LOSS) FROM CONTINUING OPERATIONS Dividends, after the related taxation, from discontinued operations PROFIT FOR THE YEAR (i+j) -565 (i+j)
55 RECONCILICATION OF AUTOSTRADE PER L'ITALIA SpA'S STATEMENT OF FINANCIAL POSITION WITH THE RECLASSIFIED STATEMENT OF FINANCIAL POSITION m 31 December December 2016 Reconciliation of items Reported basis Reclassified basis Reported basis Reclassified basis Ref. Main entries Ref. Sub-items Main entries Ref. Main entries Ref. Sub-items Main entries Non-current non-financial assets Property, plant and equipment (a) (a) Intangible assets (b) 17,403 17,403 (b) 17,862 17,862 Investments (c) (c) Other non-current assets (d) - - (d) - - Total non-current non-financial assets (A) 17,702 18,161 Working capital Trading assets (e) (e) Current tax assets (f) (f) Other current assets (g) (g) Investments held for sale or for distribution to shareholders or related to p discontinued p operations q y (v) 4 (v) 1,158 contract (h) (h) Current provisions (i) (i) Trading liabilities (j) -1,306-1,306 (j) -1,229-1,229 Current tax liabilities (k) (k) -3-3 Other current liabilities (l) (l) Non-financial liabilities related to discontinued operations (w) - (w) - Total working capital (B) -1, Gross invested capital (C=A+B) 16,040 17,813 Non-current pnon-financial p liabilities q by contract (m) -2,840-2,840 (m) -3,165-3,165 Non-current provisions (n) -1,064-1,064 (n) -1,084-1,084 Deferred tax liabilities (o) (o) Other non-current liabilities (p) (p) Total non-current non-financial liabilities (D) -4,525-4,740 NET INVESTED CAPITAL (E=C+D) 11,515 13,073 Total equity (F) 1,987 1,987 3,605 3,605 Net debt/(net funds) Non-current net debt/(net funds) Non-current financial liabilities (q) 10,964 10,964 (q) 11,994 11,994 Non-current financial assets (r) (r) Total non-current net debt/(net funds) (G) 10,326 11,352 Current net debt/(net funds) Current financial liabilities (s) 1,971 1,971 (s) 1,156 1,156 Short-term borrowings Current derivative liabilities Intercompany current account payables due to related parties Current portion of medium/long-term borrowings 1,381 1, Other current financial liabilities Cash and cash equivalents (t) -2,627-2,627 (t) -2,924-2,924 Cash -1,773-1,773-2,238-2,238 Cash equivalents Intercompany current account receivables due from related parties Current financial assets (u) (u) Current financial assets deriving from government grants Current term deposits Current derivative assets Current portion of other medium/long-term financial assets Other current financial assets Total current net debt (H) ,884 Total net debt (I=G+H) 9,528 9,468 NET DEBT AND EQUITY (L=F+I) 11,515 13,073 Investments held for sale or for distribution to shareholders or related to discontinued operations (v) 4 (v) 1,158 Liabilities related to discontinued operations (-w) - (-w) - TOTAL NON-CURRENT ASSETS (a+b+c+d-r) 18,340 (a+b+c+d-r) 18,803 TOTAL CURRENT ASSETS (e+f+g-t-u+v) 3,328 (e+f+g-t-u+v) 4,853 TOTAL NON-CURRENT LIABILITIES (-m-n-o-p+q) 15,489 (-m-n-o-p+q) 16,734 TOTAL CURRENT LIABILITIES (-h-i-j-k-l+s-w) 4,192 (-h-i-j-k-l+s-w) 3,317 Annual Report
56 RECONCILICATION OF AUTOSTRADE PER L'ITALIA SpA'S STATEMENT OF CHANGES IN NET DEBT WITH THE STATEMENT OF CASH FLOWS m Reconciliation of items Note Statement of cash flows Changes in net debt Statement of cash flows Changes in net debt CASH FLOWS FROM (USED IN) OPERATING ACTIVITIES Profit for the year Adjusted by: Amortisation and depreciation Operating change in provisions Financial expenses from discounting of provisions for construction services required by contract and other provisions (Reversal of impairment losses)/impairment losses on investments Impairment losses/(reversal of impairment losses) on current and non-current assets (Gains)/Losses on sale of non-current assets Net change in deferred tax (assets)/liabilities through profit or loss Other non-cash costs (income) Operating cash flow 1,613 1,683 Change in operating capital (a) Other changes in non-financial assets and liabilities (b) Change in working capital and other changes (a+b) Net cash generated from/(used in) operating activities (A) 1,837 1,837 1,604 1,604 NET CASH FROM/(USED IN) INVESTMENT IN NON-FINANCIAL ASSETS Investment in assets held under concession Purchases of property, plant and equipment Purchases of other intangible assets Capital expenditure Government grants related to assets held under concession Return of capital reserves by subsidiaries Proceeds from sales of property, plant and equipment, intangible assets and investments 1 1 1,266 1,266 Net change in current and non-current financial assets (c) Net cash from/(used in) investment in non-financial assets (B) (d) Net cash generated from/(used in) investing activities (C) (d-c) NET EQUITY CASH INFLOWS/(OUTFLOWS) Dividends declared (e) Distribution of equity reserves -1,101-1,101 - Dividends paid (f) Net equity cash inflows/(outflows) (D) -1, Net cash (used)/generated during year (A+B+D) ,424 Repayment of loans from parent - -1,100 Issuance of bonds Increase in medium/long term borrowings - - Bond redemptions Repayments of medium/long term borrowings Net change in other current and non-current financial liabilities Net cash generated from/(used in) financing activities (E) -1,798-1,830 OTHER CHANGES IN NET DEBT Change in fair value of hedging derivatives (g) Financial income/(expenses) accounted for as an increase in financial assets/(liabilities) (h) -2-1 Change in financial liabilities arising from issuer substitution (i) Other changes in financial assets and liabilities (j) 61 - Other changes in net debt (F) (Increase)/Decrease in net debt for year (A+B+D+F) -60 1,242 Net debt at beginning of year -9,468-10,710 Net debt at end of year -9,528-9,468 (Decrease)/Increase in cash and cash equivalents during year (A+C+E+G) NET CASH AND CASH EQUIVALENTS AT BEGINNING OF YEAR 2,682 2,348 NET CASH AND CASH EQUIVALENTS AT END OF YEAR 2,570 2,682 56
57 Notes: a) the Change in operating capital shows the change in trade-related items directly linked to the Company s ordinary activities (in particular: inventories, trading assets and trading liabilities); b) the Change in other non-financial assets and liabilities shows the change in items of a non-trading nature (in particular: current tax assets and liabilities, other current assets and liabilities, current provisions for construction services required by contract and other provisions); c) the Net change in current and non-current financial assets is not shown in the Statement of changes in net debt, as it does not have an impact on net debt; d) Net cash (used in)/from investment in non-financial assets excludes changes in the financial assets and liabilities referred to in note c) that do not have an impact on net debt; e) Dividends declared regard the portion of dividends declared by the Company, regardless of the period of payment; f) Dividends paid refer to amounts effectively paid during the reporting period; g) the amount represents the change in the fair value of cash flow hedges, before the related taxation, as shown in Fair value gains/(losses) on cash flow hedges in the statement of comprehensive income; h) this item essentially includes financial income and expenses in the form of interest linked to loans requiring the repayment of principal and interest accrued at maturity; the financial assets are described in note 6.4 and the financial liabilities are described in note 6.14 in the financial statements; i) the Change in financial liabilities due to the issuer substitution" reflects the impact of the issuer substitution completed at the end of 2016 on the change in net debt. j) the item, Other changes in financial assets and liabilities includes non-cash financial income from the change in the fair value of foreign currency bonds and derivatives, and non-cash financial expenses linked to reclassifications to profit or loss of the equity reserve for losses on Forward-Starting Interest Rate Swaps. Annual Report
58 2.4 Key performance indicators for Group companies (*) m OPERATING REVENUE (1) Increase/ (Decrease) Absolute % Autostrade per l'italia 3,621 3, % Autostrade Meridionali % Tangenziale di Napoli % Società Italiana per il Traforo del Monte Bianco % Autostrada Tirrenica % Essediesse Raccordo Autostradale Valle d'aosta % Giove Clear Ad Moving % Autostrade Tech % Infoblu % Consolidation adjustments % TOTAL 3,945 3, % COMPANIES DISPOSED OF Consolidation adjustments TOTAL AUTOSTRADE PER L'ITALIA GROUP 3,945 3, % (*) Key performance indicators for companies disposed of and those held for sale, as part of the Atlantia Group s restructuring, as described in the Group financial review, have been excluded from the above schedule. (1) The alternative performance indicators presented above are defined in the section, "Alternative performance indicators. 58
59 EBITDA (1) CAPITAL EXPENDITURE (1) Increase/ (Decrease) Increase/ (Decrease) Absolute % Absolute % 2,308 2, % % % 2-2 n.s % % % % n.s % n.s % ,453 2, % % n.s ,453 2, % % Annual Report
60 2.5 Group operating review Traffic Traffic on the Group s Italian network in 2017 is up 2.2% compared with the previous year. The number of kilometres travelled by vehicles with 2 axles is up 1.8%, with the figure for those with 3 or more axles up 4.7%. After excluding the leap-year effect, traffic is estimated to have risen by 2.4% in 2017 compared with TRAFFIC ON THE NETWORK OPERATED UNDER CONCESSION IN ITALY IN 2017 Motorway section Vehicles with 2 axles Km travelled (in millions) Vehicles with 3 or more axles Total vehicles % increase/ (decrease) on 2016 ATVD (1) 2017 A1 Milan-Naples 15,425 2,882 18, ,421 A4 Milan-Brescia 3, , ,151 A7 Serravalle-Genoa ,185 A8/A9 Milan-Lakes 2, , ,839 A8/26 spur ,629 A10 Genoa-Savona ,384 A11 Florence-Coast 1, , ,616 A12 Genoa-Sestri ,230 A12 Rome-Civitavecchia ,553 A13 Bologna-Padua 1, , ,937 A14 Bologna-Taranto 8,897 1,507 10, ,477 A16 Naples-Canosa 1, , ,194 A23 Udine-Tarvisio ,278 A26 Genoa Voltri- Gravellona Toce 1, , ,736 A27 Venice-Belluno ,351 A30 Caserta-Salerno ,039 Mestre Interchange TOTAL AUTOSTRADE PER L'ITALIA 41,473 6,442 47, ,987 Autostrade Meridionali 1, , ,364 Tangenziale di Napoli ,842 Autostrada Tirrenica (2) ,596 Raccordo Autostradale Valle d'aosta ,023 Società italiana per il Traforo del Monte Bianco ,562 TOTAL ITALIAN OPERATORS 44,408 6,575 50, ,411 (1) ATVD - Average theoretical vehicles per day, equal to number of kilometres travelled/journey length/number of days. (2) The 15-km Civitavecchia-Tarquinia section was opened to traffic at the end of March
61 MONTHLY TRAFFIC TRENDS ON THE GROUP S NETWORK (millions of km travelled) ,969 2,821 3,338 3,795 3,657 4,052 4,712 4,789 3,952 3,644 3,213 3,463 January February March April May June July August September October November December vehicles with 2 axles vehicles with 3+ axles Toll increases Autostrade per l Italia applied an annual toll increase of 0.64% from 1 January This was determined on the basis of the following components: 0.00% for inflation; 0.62% to provide a return on capital expenditure via the X tariff component; and 0.02% to provide a return on capital expenditure via the K tariff component. Information on the toll increases applied by the Group s other motorway operators is provided in the section, Significant regulatory aspects. INFLATION AND TOLL INCREASES APPLIED BY AUTOSTRADE PER L'ITALIA (base 2000 =100) Inflation Net toll increases Net tolls after capex component Annual Report
62 AVERAGE TOLLS FOR CARS IN EUROPE (*) (VAT included, 2017 in cents per km) Autostrade per l'italia Italy (1) Portugal (APCAP) France (2) Spain (ASETA) UK (M6 Toll) (*) (1) (2) Source: APCAP, ASETA, M6 Toll, ASECAP. Source: AISCAT The toll for 2017 has been estimated on the basis of the average increase of 0.76% applied on the motorway network from 1 February 2017, as reported in the French press. AVERAGE TOLLS FOR HEAVY VEHICLES IN EUROPE (*) (VAT included, 2017 in cents per km) Tariffe medie per mezzi pesanti in Europa (*) IVA inclusa (Anno 2017 cent/km) Autostrade per l'italia Italy (1) Germany (Toll Collect) Spain (ASETA) Portugal (APCAP) France (2) UK (M6 Toll) Austria (Asfinag) (*) (1) (2) Source: APCAP, ASETA, M6 Toll, ASECAP. Source: AISCAT. The toll for 2017 has been estimated on the basis of the average increase of 0.76% applied on the motorway network from 1 February 2017, as reported in the French press. 62
63 Capital expenditure Autostrade per l Italia is in the process of implementing a programme of investment in major infrastructure projects under the original Agreement of 1997 and the IV Addendum of 2002, totalling 15.6 billion. Projects with a value of 9.7 billion have been completed as at 31 December 2017, with the opening to traffic of 432 km of new lanes. The purpose of this investment is to increase the capacity of the existing motorway network on the country s principal arteries, in order to improve traffic flow, road safety and service quality. In addition to the above programme, Autostrade per l Italia s new Single Concession Arrangement of 2007 also envisages further investment totalling 7 billion, via: extensions to projects already included in the Agreement of 1997, involving new specific network upgrades worth approximately 2 billion; a commitment to develop preliminary designs for the upgrade of certain sections of motorway operated under concession, totalling around 325 km, at a cost of approximately 5 billion. AUTOSTRADE PER L'ITALIA Total km Km opened to traffic Value of project (1) ( bn) Stage of completion as at 31 December 2017 (2) ( bn) Agreement of IV Addendum Single Arrangement Other projects Agreement of Total SUBSIDIARIES Total km covered by project Km opened to traffic Value of project (1) ( bn) Stage of completion as at 31 December 2017 (2) ( bn) Raccordo Autostradale Valle d'aosta Autostrade Meridionali Autostrada Tirrenica Total TOTAL GROUP INVESTMENT IN MAJOR WORKS (1) (2) (3) Total cost of carrying out the works, as assessed at 31 December 2017, including the base bid price (net of bid or agreed reductions), available funds, recognised reserves and early completion bonuses. The value of works under the Arrangement of 1997 is net of an amount included in "Other investment". Excludes capitalised costs (financial expenses and staff costs). At the end of 2016, in accordance with the Grantor, following an integrated assessment of transport needs and competitiveness, 8 upgrade projects were identified as being "priority" in nature. The upgrades regard approximately 150 km of Autostrade per l'italia s network and will cost approximately 2.4 billion to carry out. Autostrade Meridionali and Raccordo Autostradale Valle d Aosta have completed their planned investment in major works under their respective concession arrangements. Autostrada Tirrenica opened the new section of motorway between Civitavecchia and Tarquinia to traffic in Completion of the remaining section from Tarquinia to Livorno is still at the planning stage and, at the end of 2017, a related financial plan was sent to the Grantor for initial examination. This only envisages construction of the section from Tarquinia to Ansedonia, plus an extra-urban link road between Ansedonia and Orbetello Scalo (amounting to a total estimated investment of approximately 0.6 billion). This project is Annual Report
64 subject to fulfilment of the related technical and financial conditions and receipt of the necessary consents, to be verified together with execution of a memorandum of understanding and an addendum to the Concession Arrangement, which is to include a viable financial plan. Upgrade and modernisation of the network operating under concession ( m) Autostrade per l'italia -projects in Agreement of Autostrade per l'italia - projects in IV Addendum of Autostrade per l'italia: other capital expenditure (including capitalised costs Other operators (including capitalised costs) Total investment in infrastructure operated under concession Investment in other intangible assets Investment in property, plant and equipment Total capital expenditure Discontinued operations: investment in infrastrcture operated under concession Discontinued operations: investment in property, plant and equipment and intangible assets - 46 Total capital expenditure including discontinued operations Autostrade per l Italia and the Group s other Italian operators invested a total of 556 million in With regard to the works envisaged in the Agreement of 1997, work continued in 2017 on widening the A1 between Barberino and Florence North to three lanes, with mechanical boring of the new Santa Lucia Tunnel currently under way. Work is also continuing on completion of the Variante di Valico (opened to traffic at the end of 2015). The work relates solely to off carriageway works, the Florence North-Florence South section of the A1 and Lot 1 North on the A1 between Florence South and Incisa, which is being widened to three lanes. The Galluzzo bypass was opened to traffic in May. This involved lengthening the Florence-Siena expressway by 4 km in order to bypass the town of Galluzzo and reduce through traffic. The Villa Costanza park-and-ride on the A1 near to Scandicci also opened in June (this is the first car park of its kind in Italy to provide pedestrian access from the ordinary road network). In terms of the works contained in the IV Addendum of 2002, work on construction of link roads serving the A14 motorway and on mitigation works in the Municipality of Fano proceeded in 2017, as did work on completing off carriageway works for the previously opened sections between Cattolica and Fano and between Senigallia and Ancona South. The A4-A13 link road in the vicinity of the Padua Industrial Park toll station was also opened to traffic in September, with the aim of making it easier and faster to transfer from one motorway to another. 64
65 Finally, on 7 September 2017, the Grantor approved the Final Design for the upgrade of the road and motorway system serving Genoa (the so-called "Gronda di Ponente") and work on the executive design for the various lots that make up the project is now in progress. Autostrade per l Italia s other capital expenditure includes approximately 76 million invested in major works, primarily construction of the fourth free-flow lane for the A4 between the Viale Certosa and Sesto San Giovanni interchanges, landscaping work for the Barberino-Florence North section, and design work and surveys carried out in preparation for work on the Bologna Interchange (on carriageway works and work on the surrounding area). In December, the new interchanges serving Foggia Industrial Park (situated close to the city s industrial park) on the A14, and at Sasso Marconi North on the A1 were opened to traffic. The latter is located close to Borgonuovo di Sasso Marconi and will relieve traffic congestion on the main SS64 Porrettana road to the south of Bologna). Stage of completion of works being carried out by Autostrade per l Italia and the Group s other motorway operators The following tables show major works to be carried out as part of the upgrade of the network operated under concession, based on the commitments given in the respective concession arrangements. The estimated value of each project includes the overall cost (before any government grants) of the works, as assessed at the end of December The following remain subject to change based on the effective future progress of the works: the date of completion and entry into service of the various works, due to the impossibility of making reasonable estimates, above all where the related contracts have yet to be awarded; the final cost, primarily due to disputes and eventual changes to designs. In 2009, Autostrade per l Italia s Board of Directors set up a body to oversee the Group s projects. The body was renamed the major Works Committee in 2017 and has the role of monitoring: the performance of infrastructure investment plans in terms of state of progress of the works, the related costs and compliance with the commitments given by the Company and its subsidiaries in the relevant concession arrangements; the process of selecting contractors to carry out the works; the organisational and procedural aspects of carrying out the works; the state of contract reserves; the status of the most important legal disputes. The Committee met on 7 occasions in Annual Report
 A8 Link road for new Milan Exhibition Centre Modena-Bologna (4 th lane) A14 Bologna Ring Road (3 rd free flow lane) Genoa Bypass (3 rd lane) A1 Variante di Valico A1 Barberino-Incisa (3rd")
66 PLANNED INVESTMENT IN THE ITALIAN NETWORK A5 Morgex-Entrèves A8 Milan-Lainate (5 th lane) Milan East-Bergamo (4 th lane) ) A9 lainate-como Grandate (3 rd ) MONT BLANC A8 Milan-Gallarate (3 rd a nd 4 th lanes) A8 Link road for new Milan Exhibition Centre Modena-Bologna (4 th lane) A14 Bologna Ring Road (3 rd free flow lane) Genoa Bypass (3 rd lane) A1 Variante di Valico A1 Barberino-Incisa (3rd lane) A14 Rimini North-Porto S. Elpidio (3 rd lane) A12 Autostrada Tirrenica A1 Orte-Rome North (3 rd lane) A1 Fiano Romano-Settebagni (3 rd lane) and Castelnuovo di Porto junction A3 Naples-Pompei-Salerno (3 rd lane) Autostrade per l Italia s network Works on Autostrade per l Italia s network 1997 Financial Plan IV Addendum 2002 Works on other operators networks: Raccordo Autostradale Valle d Aosta Autostrada Tirrenica project under review Autostrade Meridionali Tangenziale di Napoli ANAS and other operators 66
67 PLANNED UPGRADES AND MODERNISATION OF THE NETWORK OPERATED UNDER CONCESSION Status as at 31 December 2017 km covered by project Value of project (a) Km opened to traffic as at 31 December 2017 Stage of completion as at 31 December 2017 (b) (km) m (km) m Autostrade per l'italia: Arrangement of A8 3rd and 4th lanes Milan-Gallarate Completed A1 4th lane Modena-Bologna Completed (1) A14 3rd lane Bologna Ring Road Completed (2) A1 3rd lane Casalecchio - Sasso Marconi Completed A1 Variante di Valico Completed/in progress (3) , ,154 4 A1 3rd lane Barberino - Incisa Work in progress/completed (4) , ,277 5 A1 3rd lane Orte - Rome North Completed Other projects Work in progress/completed 22 n.a 22 Total projects under Arrangement of 1997 Projects included in IV Addendum of , , # A1 3rd lane Fiano R. - Settebagni and Castelnuovo di Porto junction Completed A4 4th lane Milan East - Bergamo Completed A8 5th lane Milan - Lainate Work in progress (5) A9 3rd lane Lainate - Como Grandate Completed # A14 3rd lane Rimini North - Porto Sant'Elpidio Completed , ,232 9 A7/A10/A12 Genoa Bypass (plus other works) Final design approved (6) , A8 Link road for New Milan Exhibition Centre Completed Other projects Work in progress/completed (7) 356 n.a 246 Total projects under IV Addendum of 2002 Other Group motorway operators , , # A5 RAV new Morgex- Entreves section Completed # A3 Autostrade Meridionali, 3rd lane Naples-Pompei East/Scafati (c) Work in progress/completed # A12 Autostrada Tirrenica Work in progress/completed (8) Total projects of other operators , ,207 Total investment in major works , ,861 (a) Total cost of carrying out the works, as assessed at 31 December 2017, including the base bid price (net of bid or agreed reductions), available funds, recognised reserves and early completion bonuses. The value of works under the Arrangement of 1997 is net of an amount included in "Other investment". (b) Excludes capitalised costs (financial expenses and staff costs). (c) The concession held by Autostrade Meridionali expired on 31 December As requested by the Grantor, from 1 January 2013 the company has continued to be responsible for day-to-day operation of the motorway, including completion of the investment plan, whilst awaiting the transfer of the concession to the new operator subject to inclusion of the related costs in the value of its takeover right. (1) Includes construction of the Modena Ring Road, a work requested by local authorities and awaiting approval from the Services Conference. (2) Total investment of 247 million, of which 59 million in the Major Works Plan of 1997 and 188 million in "Other investment in the Arrangement of (3) Work is in progress on off carriageway works, landscaping and completion of the new Rioveggio junction. (4) Work on the Barberino-Florence North section is in progress; the executive design for lot 2 of the Florence South-Incisa section was approved in March 2017, whilst work on lot 1 is in progress. (5) Work is nearing completion on lot 1 and the tender procedure for lot 2 is in progress. (6) The portion of the works completed relates to design of the Genoa Bypass and construction of the San Benigno Interchange, and includes noise abatement work in the Prà Palmaro area, the design for which is in the progress of being approved. (7) The tender procedure is underway for the Maddaloni junction; work is in progress on the Tunnel Safety Plan; and work on the new A4/A13 interchange at the Padua Industrial Park toll station has been completed. (8) Work is in progress on external roads for lot 6A of the Civitavecchia-Tarquinia. In 2017, the Ministry of Infrastructure and Transport conducted a project review for the road running down the Thyrrenian coast (the Thyrrenian corridor ), which envisages construction of the Tarquinia Ansedonia section of motorway by Autostrada Tirrenica and the widening to four lanes of the existing dual carriageway (the SS 1) from Ansedonia to Orbetello Scalo by the same company. Work on the remaining section, from Orbetello Scalo to San Pietro in Palazzi, would be the sole responsibility of ANAS SpA. The Interministerial Economic Planning Committee, at the session held on 22 December 2017, received the report on the process of modifying the proposed project for completion of Thyrrenian corridor. Discussions are ongoing with the Grantor to assess the administrative and financial feasibility of the new solution. Annual Report
68 Investment in major works by Autostrade per l Italia 1997 Agreement The final cost of the works (based on contracts in progress and final and executive designs awaiting authorisation) today amounts to approximately 7.1 billion. Of this, 85% of the works with a value of approximately 6 billion have been completed as at 31 December Compared with the initial estimate of 3.6 billion in 1997, on the basis of which the Company was privatised, the additional expense to be borne by the operator in order to complete the original programme drawn up in 1997 currently stands at approximately 3.5 billion. Investment in major works by Autostrade per l Italia IV Addendum 2002 (1) As at 31 December 2017, almost all the works have been authorised, with approximately 43% of these works completed. The final design for the most important project included in the IV Addendum, from both a technical and financial viewpoint, the Genoa Interchange, was approved in September The plan for the Genoa Interchange was conceived on the basis of an idea dating back to the 1980s. The motorway network serving the Genoa area (the A10, A7, A12 and A26 motorways) has always been required to not only handle extra-urban and through traffic, but also to act as a ring road for traffic moving within and around the city. The Genoa Interchange Project thus aims to relieve congestion on the section of the A10 close to the city of Genoa, from the Genoa West toll station (from the Port of Genoa to the residential district of Voltri). This will involve transferring through traffic on to a new road running alongside the existing motorway. Due to the geography and topography of the area concerned, it is not possible to widen the existing road. This means that the project can only be carried out by building a new road, the Gronda di Ponente. Together with the new A7 and the upgrade of the Genoa East - A7 link road section, the scheme involves construction of new motorway infrastructure. In terms of the process of obtaining the related consents, the project marks the first time in Italy that a major infrastructure scheme has been subjected (between 2008 and 2009) to the sort of public consultation often used in France. This procedure, which involved discussion of the design with local authorities and the wider public (during public hearings), has made a major contribution to the choice of route and the type of infrastructure. Based on the solution adopted as a result of the public consultation, the Final Design was prepared in May 2009 and, in 2011, work began on the Environmental Impact Assessment, which was completed in 2014 with the issue of the related EIA Decree. The Services Conference, which opened at the end of 2014, came to a positive conclusion in May 2015, with the decree finalising the agreement between central government and the regional authority. The Final Design was then revised to take into account the requirements resulting from the EIA Decree and the Services Conference, before being submitted to the Grantor in April Work is now in progress on the executive design (for the 10 lots that make up the project). The estimated total cost of the scheme is 4.3 billion and work is expected to take approximately 10 years from the start of construction. (1) The authorisation process for works covered by the IV Addendum, signed by Autostrade per l Italia in December 2002, was completed and became effective in June Work on the designs relating to the investment programme envisaged by the IV Addendum could thus only start from this date, after a delay of 21 months with respect to the original programme. 68


69 GENOA INTERCHANGE PROJECT ALESSANDRIA MILAN A26 MASONE A7 BUSALLA GRONDA DI PONENTE GENOA BOLZANETO A12 UPGRADE GENOA EAST VESIMA A10 VENTIMIGLIA GENOA VOLTRI GENOA PEGLI GENOA AIRPORT NEW SAN BENIGNO INTERCHANGE GENOA WEST A7 UPGRADE GENOA A12 GENOA NERVI Investment in major works by Autostrade per l Italia New Single Arrangement of 2007 Under the Single Concession Arrangement signed on 12 October 2007, Autostrade per l Italia is committed to developing the preliminary design for the upgrade of certain sections of motorway operated under concession, totalling around 325 km, at a cost of approximately 5 billion. New traffic analyses and transport studies were conducted in 2016 in order to identify the infrastructure needed to ensure adequate capacity and levels of service on the motorway network. Taking into the related cost-benefit analyses, a number of sections to be widened to three and four lanes, covering approximately 150 km, were identified as priority. These are shown in the following table. In agreement with the Grantor, the approval procedures involving the Environmental Impact Assessment and the Services Conference have begun, with the aim of including the projects in the next five-yearly review of Autostrade per l Italia s investment programme. Project Km covered by project (km) A1 Milan South-Lodi 4th lane 16.5 A1 Incisa - Valdarno 3rd lane 18.4 A11 Florence - Pistoia 3rd lane 26.8 A12 Cerveteri - Torrimpietra 3rd lane (free-flow) 13.0 A13 Ferrara - Bologna 3rd lane 32.5 A13 Padua - Monselice 3rd lane 12.3 A14 Ravenna - Bologna San Lazzaro 4th lane 34.5 Total Annual Report
70 In addition to these projects, Autostrade per l'italia is also required to finance construction by ANAS of the northern section of the Casalecchio Interchange. Investment in major works by Autostrade per l Italia Other motorway upgrades Following the agreement between Autostrade per l'italia, the Ministry of Infrastructure and Transport and local authorities, which was signed on 15 April 2016, Autostrade per l'italia is preparing the design for an upgrade of the motorway system and ring road serving Bologna (the Bologna Interchange ). The project will involve widening around 13.2 km of existing A14-orbital motorway system, including improvements to the layout of slip roads, junctions and intersections, and improvements to 4 of the access roads for the motorway system. Like the Gronda di Genova scheme, the Bologna Interchange was also subject to a public consultation process, which took place between July and November The Environmental Impact Assessment for work on the existing motorway system took place in The process came to a conclusion in November, with a favourable opinion from the Technical Committee. Issue of the EIA Decree is awaited prior to requesting the start of the Services Conference. The cost of the project is currently estimated to be 0.7 billion. Network operations The cost to Autostrade per l Italia and the Group s other Italian motorway operators for maintenance, safety and traffic management on the network in 2017 (excluding work at service areas) was 444 million. 400 million of this was spent by Autostrade per l Italia. Total expenditure in 2017 (not including maintenance staff costs) is made up of the following: maintenance costs of 312 million; 132 million spent on safety and traffic management (including capitalised maintenance costs). Safety and maintenance There were 14,595 accidents on the network managed by Autostrade per l Italia and the other operators in 2017 (down 1.5% compared with 2016). The global accident rate is down to 28.6 from 29.7 in 2016, whilst the death rate is 0.24, compared with 0.22 in ACCIDENT RATES ON THE NETWORK OPERATED BY AUTOSTRADE PER L'ITALIA AND THE GROUP S OTHER MOTORWAY OPERATORS 2000 (*) 2016 (*) 2017 (*) Global accident rate (number of accidents per 100 km travelled) Accident rate on carriageways Casualty rate (number of accidents per 100 km travelled) Fatal accident rate (number of accidents per 100 km travelled) Death rate (number of deaths per 100 km travelled) (*) Provisional data 70
71 DEATH RATES ON THE NETWORK OPERATED BY AUTOSTRADE PER L'ITALIA AND THE GROUP S OTHER MOTORWAY OPERATORS The indicator that measures the number of accidents at so-called blackspots (the Blackspot Accident Index (2) 1 ) stood at (3) 2in 2017 (33.65 in 2016), marking a reduction of over 40% compared with 2013, when the indicator was introduced. 250 specific initiatives were implemented during 2017, to add to the over 2,000 such initiatives carried out since 2002, since when accidents at these points on the network have fallen by approximately 81%. The improvement was also achieved thanks to deployment of the Tutor system for measuring average speeds (as at 31 December 2017, the system was in use on over 2,500 km or approximately 40% of the roads operated by Autostrade per l Italia and the Group s other Italian motorway operators), in addition to the continual improvement of quality standards and specific infrastructure and operational measures. These include the introduction of new Guidelines for the installation, management and removal of roadworks on Autostrade per l Italia s network and information campaigns designed to raise safety awareness among road users. To ensure that the motorway infrastructure, works and equipment is in good working order, and thereby guarantee the best possible standards of safety and service quality, the departments responsible for the various sections of the motorways operated by Autostrade per l Italia and its subsidiaries carry out monitoring and maintenance. In keeping with the standards set in recent years, during 2017 there were over 60 major projects entailing structural maintenance. Work was carried out on repairs to bridges and viaducts on all the motorways in Liguria, on Apennine sections of the A1 and A16 and along the central sections of the motorway that runs down the Adriatic coast. Work was also carried out on a number of tunnels along the motorways in Liguria, on the A1 and the A16. Finally, work was carried out on motorways in Liguria, on the Apennine and Lazio sections of the A1, A16 and A14. (2) The Blackspot Accident Index: the number of accidents at blackspots per billion km travelled. (3) The data for 2017 is provisional whilst awaiting consolidation of the data in March. Annual Report
72 Draining pavement has been laid throughout Autostrade per l Italia s network, with the exception of roads liable to ice over, tunnels and roads where high traction paving has been laid or sections where major works are due to take place or are in progress. RESURFACED PAVEMENT ON AUTOSTRADE PER L ITALIA S NETWORK square metres (x 1,000) 11,256 7,561 7,286 of which square metres with draining pavement (x 1,000) 2,319 4,963 4,686 total cubic metres (x 1,000) Total percentage of Autostrade per l'italia's network surfaced with draining pavement 18.9% 83.6% 83.4% As always, Autostrade per l Italia ran numerous initiatives and campaigns in 2017 to promote safety: the plan for managing peak-time traffic during the summer, via additional road traffic information, the removal of all road works and increasing traffic flow at toll stations; traffic forecasts, made available on a specific section of Autostrade per l Italia s website, at Hi-Point information desks at service areas and on Autostrade per l Italia s My Way app; the Snow Plan, put into practice each year in collaboration with the highway police and aimed at stressing Autostrade per l Italia s commitment in terms of personnel and equipment used to manage emergency situations, in addition to providing a series of useful suggestions for motorists travelling on the motorway in snow. There is a specific section of the website dedicated to winter operations, providing a handbook containing advice on driving during the winter and details of the winter equipment road users are required to carry; the introduction of Guidelines for the installation, management and removal of roadworks on Autostrade per l Italia s network. Traffic management The Total Delay (4) 1 on the network managed by Autostrade per l Italia in 2017 amounted to approximately 5.9 million hours, compared with 5.0 million hours in 2016 (recalculated using the new algorithm). The increase primarily reflects traffic growth with respect to 2016, as well as the greater number of hours when roads were closed due to accidents or when traffic was held up by accidents, despite an improvement in the global accident rate (5). 2 Instead, the Total Delay Work, a sub-index of Total Delay, which measures disruption caused by roadworks on motorways, recorded a figure of approximately 106,000 hours in 2017, 72 (4) (5) Total Delay: the sum of the difference between the average transit time for each section of the entire network in the period under review and the equivalent time at an average speed typical of the section in question, multiplied by the number of journeys. From 1 January 2017, a new algorithm for calculating the Total Delay was introduced. This results in a more accurate estimate of delays on Autostrade per l Italia s network and a more precise breakdown into sub-indicators (Accident, Traffic and Work), above all in the case of concomitant events on the same section of motorway, introducing a basis for temporal as well as spatial comparison. The algorithm has been certified in accordance with the ISO 9001:2015 standard. The main reason for the increases is linked to the greater number of accidents involving heavy vehicles, which have a more significant impact in terms of the complexities involved in clearing the road.
73 calculated using the new algorithm, compared with 85,333 hours in 2016 (also calculated using the new algorithm), when the figure reached an all-time low. The principal steps taken to improve traffic flow in the presence of roadworks were: a prior assessment of the impact on traffic of each roadwork to identify the best period of the year in which to carry out the work and the best layout of the site in order to reduce disruption to a minimum; an increase in the number of road workers and equipment used to reduce the time required; the suspension of work at busy times of day; more information given to road users on the sections affected and the most critical times of day, with suggestions on how to organise journeys and choose alternative routes, including the information available via the My Way app. In terms of information, the following took place in 2017: the agreement with the radio broadcaster, RTL, continued alongside the existing partnership with RAI Isoradio, with the broadcast of 27 live bulletins a day from Autostrade per l Italia s Traffic Operations centre over the radio and in radiovision, and news on serious disruptions still available in FM; the number of Variable Message Panels providing traffic information was further increased (at the end of 2017 there were 1,822 panels on Autostrade per l Italia s network); a total of 304,562 calls were made to the traffic information centre, with a total of 99.8% answered; as at 31 December 2017, live coverage on the MyWay slots on SkyTG24 was provided on 1,050 occasions, with peaks of 12 slots a day during the summer season; there were over 10,000 reports on SkyMeteo24 s 501 channel, where MyWay is on air every day from 7.10 in the morning until 9.40 at night. QUALITY INDICATORS FOR TRAFFIC MANAGEMENT SERVICES ON AUTOSTRADE PER L'ITALIA S NETWORK Number of variable message panels 384 1,798 1,822 % of traffic covered by service on entry n/av % of traffic on motorway covered by service n/av % of network on which ISORADIO and RTL can be received n/av % of calls answered by call centre n/av Annual Report
74 2017 (*) 2016 (*) (%) Toll collection and payment systems In 2017, the number of transactions handled by automated tolling systems on the network operated by Autostrade per l Italia rose 3.5% on the previous year, reaching 85.4% of total transactions (84.0% in 2016). This led to a 6.6% reduction in manual transactions. The number of transactions handled by automated tolling systems on the Italian network operated by Autostrade per l Italia and the Group s other motorway operators is up 3.7%, accounting for 84.2% of total transactions (82.7% in 2016). Free-flow tolling using Telepass accounted for 61.3% of transactions (60.0% including the networks of the Group s other operators), compared with 60.3% in 2016 (59.2% including the networks of the Group s other operators). TRANSACTIONS BY METHOD OF PAYMENT ON AUTOSTRADE PER L'ITALIA S NETWORK Method of payment Number of Number of Increase/ (decrease) transactions % transactions % 2017/2016 MANUAL CASH PAYMENTS 108,161, % 115,789, % -6.6% Automated cash 81,946, % 77,673, % 5.5% VIAcard direct debit 20,789, % 21,416, % -2.9% Telepass 470,549, % 454,793, % 3.5% Prepaid cards 10,837, % 11,497, % -5.7% Credit cards 44,753, % 41,472, % 7.9% FASTpay 26,953, % 26,536, % 1.6% TOTAL AUTOMATED PAYMENTS 655,830, % 633,389, % 3.5% Other (unpaid tolls, strikes, evasion) 4,179, % 4,436, % -5.8% GRAND TOTAL 768,171, % 753,614, % 1.9% (*) Provisional data TRANSACTIONS BY METHOD OF PAYMENT ON THE NETWORKS OPERATED BY AUTOSTRADE PER L'ITALIA AND THE GROUP S OTHER OPERATORS (*) Method of payment Number of Number of Increase/ (decrease) transactions % transactions % 2017/ (**) 2016 (*) (%) MANUAL CASH PAYMENTS 141,744, % 152,198, % -6.9% Automated cash 111,602, % 104,551, % 6.7% VIAcard direct debit 23,337, % 24,048, % -3.0% Telepass 558,243, % 540,420, % 3.3% Prepaid cards 12,377, % 13,163, % -6.0% Credit cards 48,799, % 44,814, % 8.9% FASTpay 28,772, % 28,491, % 1.0% TOTAL AUTOMATED PAYMENTS 783,133, % 755,489, % 3.7% Other (unpaid tolls, strikes, evasion) 5,523, % 5,805, % -4.9% GRAND TOTAL 930,400, % 913,493, % 1.9% (*) It doesn't include Traforo del Monte Bianco. (**) Provisional data 74
75 Service areas and advertising There are currently 217 service areas along the motorway network operated by Autostrada per l Italia and the Group s other motorway operators, 205 of which are on motorways operated by Autostrade per l Italia. In accordance with its Concession Arrangement and as required by the Antitrust Authority, Autostrade per l Italia has awarded sub-concessions to operators specialising in all the various services offered at services areas (oil and food services, etc.). the concessions are awarded on the basis of competitive, transparent and non-discriminatory procedures, run by external advisors. In agreement with the Grantor, a new three-year upgrade programme for Autostrade per l Italia s service areas was launched in Work is currently in progress at the Metauro West service area, whilst work was recently completed at the Cantagallo West and Lucignano West service areas and the tender process for completion of the Arno West and La Pioppa East service areas is in progress. The executive designs for the Sebino North and Sebino South services and for completion of the Teano West services have been submitted to the Grantor. Tenders for the renewal of 4 oil service concessions were run by Autostrade per l Italia in Recurring royalties received from sub-operators on the network managed by Autostrade per l Italia totalled million, down 1.7% on 2016 ( million). This was essentially due to a reduction in the quantity of oil sold (down 4.5% compared with 2016), partially offset by an increase in the volume of non-oil services provided (up 1.5% on 2016). Including subsidiaries, recurring royalties received from sub-operators at service areas in 2017 amount to million, down 3.9 million (2.1%) on the figure for RECURRING ROYALTIES FROM SUB-OPERATORS - AUTOSTRADE PER L ITALIA AND SUBSIDIARIES m 181, Non-oil services Oil services In 2017, the subsidiary, AD Moving SpA, earned revenue of approximately 7.3 million (down 7% on 2016) from the management and marketing of advertising space at service areas and road travel information along the motorways. This reflects the continuing downturn in the advertising market and a reduction in the fees charged to oil service providers, similar to the initiative involving food service providers in 2016, as part of a joint initiative with Autostrade per l Italia. Annual Report
76 Financial review for the principal subsidiaries Autostrade Meridionali In compliance with the concession arrangement, in December 2012 the Grantor asked Autostrade Meridionali to continue operating the motorway, in accordance with the existing terms and conditions, and to implement safety measures on the motorway. Total operating revenue for 2017 amounts to 92 million, up 6 million on the previous year. Revenue reflects the previously mentioned addition to the concession fee to be paid to the Grantor (approximately 11 million in 2017), with a matching amount recognised in operating costs. Net toll revenue of 84 million is up 2 million on 2016, reflecting traffic growth in 2017 (up 2.8%). Other operating income is up 4 million, essentially due to the recognition of extraordinary income linked to the positive outcome to a number of legal disputes involving the company. EBITDA of 36 million is up 4 million compared with 2016, primarily due to the above revenue growth, partially offset by an increase in the cost of maintaining the infrastructure operated under concession. Tangenziale di Napoli Total operating revenue of 70 million for 2017 is down approximately 1 million on Revenue reflects the previously mentioned addition to the concession fee to be paid to the Grantor ( 5 million in 2017), with a matching amount recognised in operating costs. Net toll revenue of 66 million is slightly down on 2016, reflecting a decline in traffic in 2017 (down 0.5%). Other operating income is in line with the previous year. Operating costs, after concession fees, are up 2 million on 2016, essentially due to an increase in maintenance costs as a result of work carried out during the year. EBITDA of 26 million is down 2 million on Modernisation and upgrade of the motorway continued in 2016, with work amounting to 13 million carried out. This regarded the new Ospedaliera toll station and earthquake proofing of the Capodichino and Sant Antonio viaducts. Società Italiana per Azioni per il Traforo del Monte Bianco Total operating revenue amounts to 62 million for 2017, an increase of 4 million compared with Toll revenue of 61 million is up 4 million as a result of traffic growth of 5.1% (light vehicles are up 3.7% and heavy vehicles up 8.2%). This increase mainly reflects a recovery in cross-border traffic and the temporary closure, in the last quarter of 2017, of the Grand Saint Bernard tunnel, which reopened in the closing days of the year. This resulted in a small volume of traffic being diverted to the Mont Blanc tunnel. EBITDA of 40 million is up by approximately 1 million compared with the previous year. Capital expenditure of approximately 3 million in 2017 regarded work on the upgrade of infrastructure and plant. Raccordo Autostradale Valle d Aosta Total operating revenue of 20 million in 2017 is up approximately 1 million compared with 2016 and primarily consists of toll revenue, which benefitted from traffic growth (up 4.6%) and a 0.9% increase in tolls. Operating costs were slightly down. EBITDA of 7 million is broadly in line with the previous year. 76
77 Autostrada Tirrenica Autostrade Tirrenica registered total operating revenue of 40 million in 2017, an increase of 2 million compared with the previous year. Toll revenue of 38 million in 2017 is up 2 million on the figure for 2016, due to traffic growth of 4.5%, which benefitted from the opening of the new Civitavecchia Tarquinia section at the end of March 2016, and a 0.9% increase in tolls in Operating costs rose, partly due to the cost of repairing damage following accidents. EBITDA for 2017 amounts to 22 million, in line with Capital expenditure in 2017 amounted to approximately 3 million, marking a reduction of 21 million compared with 2016, primarily reflecting completion of the Civitavecchia-Tarquinia section and the related access roads. Autostrade Tech Autostrade Tech is a provider of Intelligent Transportation Systems, operating in Italy and overseas. It supplies systems used for tolling, traffic management and information, urban access controls, car parks and speed checks. Operating revenue of 59 million in 2017 is down 1 million compared with The reduction reflects a decline in sales of tolling and Tutor speed check systems. EBITDA of 10 million in 2017 is up 1 million compared with 2016, thanks mainly to the lower amount spent on raw and consumable materials during the year. Annual Report
78 2.6 Innovation, research and development The Group s innovation, research and development activities aim to offer innovative, technologically advanced solutions designed to boost service quality, improve operations and infrastructure efficiency, and minimise the impacts of activities right from the start of the design process. These activities, some of which are long-term in nature, are undertaken by Group companies, and sometimes in collaboration with national and international research centres and universities. Many projects were carried out in 2017, some of which were co-financed at EU and national level. The main activities under way in 2017 include: the development of free-flow tolling systems for traditional motorway tolling systems and for European service providers looking to introduce tolling systems using satellite technology; the development and upgrade of onboard devices for the Italian and European markets, and the design of next generation dual-mode devices; continued development of systems for identifying vehicle classes for tolling purposes and to track and manage vehicles on motorways; the creation of a data lake to gather traffic information from the Myway app so as to provide services for the Group and for external customers; trials of automated systems for the survey and modelling of the structural performance of infrastructure for maintenance and surveillance purposes; new solutions for monitoring traffic and accidents in order to improve traffic management and planning to ensure protection for work sites; the development of next generation safety barriers; EU-funded projects underway include: participation in European programmes for the development and application of ITS-based services (information for road users, traffic management, freight transport and logistics services) needed in order to achieve European objectives relating to the safety and environmental impact of transport and mobility; participation in the REETS project, regarding implementation of a Regional European Electronic Toll Service, set up by Directive 2004/527EC and Decision 2009/750/EC; completion of the MOBINET project, aimed at creating an e-marketplace in the Intelligent Transport Systems sector. Group companies total expenditure on innovation, research and development in 2017 amounts to approximately 10 million. This sum represents the total amount spent by the Group on research and development, including operating costs, staff costs and capital expenditure. 78
79 2.7 Workforce As at 31 December 2017, the Autostrade per l Italia Group employs 6,926 staff on permanent contracts and 423 temporary staff, making a total workforce of 7,349 (down 118 or 1.6% compared with the 7,467 of 31 December 2016). The reduction primarily reflects the previously mentioned restructuring of the Atlantia Group. The change in permanent staff (down 198) is primarily due to: the transfer of Contact Centre personnel from Autostrade per l Italia to Telepass, the transfer of staff from Autostrade per l Italia s Foreign Department to Atlantia and slower turnover among toll collectors (at Autostrade per l Italia, Autostrade Meridionali and Tangenziale di Napoli), partly offset by the hiring of staff to fill specific roles within certain organisational units (down 217); an increase in the average volume of work carried out by Giove Clear (up 22). The change in temporary staff at 31 December 2017 (up 80) is primarily due to: the higher number of seasonal toll collectors required by Autostrade per l Italia (up 53); an increase in the average volume of work carried out by Giove Clear (up 26). The average workforce (including agency staff) is down from 7,068 in 2016 to 6,906 in 2017, marking a reduction of 162 (2.3%). The decrease, linked to the above factors, primarily regards the following companies: motorway operators (down 177 on average); Giove Clear (up 10 on average). Information on the performance of staff costs is provided in the Group financial review. Annual Report
80 PERMANENT STAFF 31 December December 2016 Increase/(Decrease) absolute % Senior managers % Middle managers % Administrative staff 2,686 2, % Manual workers 1,469 1, % Toll collectors 2,298 2, % Total 6,926 7, % TEMPORARY STAFF 31 December December 2016 Increase/(Decrease) absolute % Senior managers % Middle managers n.a. Administrative staff % Manual workers % Toll collectors % Total % AVERAGE WORKFORCE (including agency staff, equal to 1) Increase/(Decrease) absolute % Senior managers % Middle managers % Administrative staff 2,645 2, % Manual workers 1,439 1, % Toll collectors 2,336 2, % Total 6,906 7, % 80
81 Breakdown of the Group s workforce (permanent employees) DISTRIBUTION OF PERMANENT STAFF BY CATEGORY DISTRIBUTION OF PERMANENT STAFF BY AGE RANGE 1.4% 5.5% 2.1% 21.2% Senior managers Middle managers 18.4% 17.5% 30 and under 31 to % 38.8% Admin. staff Toll collectors Manual workers 25.7% 36.4% 46 to to 60 over 60 DISTRIBUTION OF PERMANENT STAFF BY EDUCATIONAL QUALIFICATION 39.2% 14.4% 46.4% University graduates High school graduates DISTRIBUTION OF PERMANENT STAFF BY LENGTH OF SERVICE 30.5% 29.8% 1.9% 5.9% 15.3% 16.7% under 1 year 2 to 5 years 6 to 10 years 11 to 20 years 21 to 30 years over 30 years Other Annual Report
82 Staff management and development The process of identifying and selecting Autostrade per l Italia Group personnel is based on the search for the best talent. The Group aims to identify people capable of offering excellent levels of performance, high potential and cross-departmental experience. The tools and channels used to find candidates differ according to seniority and the technical and specialist expertise required. The channels used to find candidates are the Atlantia per la Conoscenza programme, managed by the parent, Atlantia, the website, the online recruiting database and agreements with schools, universities and masters programmes. Junior staff are selected after an assessment, involving individual and group tests aimed at gauging attitude and ability. Head hunters and social network platforms are used to recruit senior staff. The selection process involves assessment of personal, motivational and technical and professional aspects. The Autostrade per l Italia Group has always been committed to enhancing and developing the know-how available to the Group, through training programmes designed to promote professional development and the achievement of business targets. With the aim of enhancing and disseminating the know-how available with the Company, the important process of creating an internal Academy continued in The idea is to provide strategic support for training and study initiatives for everyone within the Company, to encourage the transfer of technical know-how and distinctive expertise and to provide opportunities for personnel to refresh and develop their skills. Training focused primarily on improving the quality of service provided and leveraging the know-how available within the Company continued in The training programmes run primarily focused on the following areas: improving Operations and Customer Service; support for change management and soft skills training; training in corporate responsibility and on the organisation, management and control model. The Autostrade per l'italia Group invests in its human capital as a means to boosting its competitiveness to achieve success, using assessment tools to orientate management and development initiatives in order to meet the Group s needs. This process involves two integrated assessment tools: Performance Management: a process that aims to develop professional and managerial skills, focusing on the expertise that will enable the Company and the Group to successfully meet the challenges that lie ahead; Development Programmes: with the aim of getting the most out of personnel and ensuring their professional development. In 2017, the Group s commitment to corporate welfare, paying attention to people and their well-being, continued. This includes the provision of a Flexible Benefits plan, with personalisable services offering health care, school fees, social assistance and care, sports, culture and leisure. This initiative added value to existing welfare schemes, focusing on the following areas: Health Care - initiatives designed to promote the health and wellbeing of personnel and corporate wellness programmes aimed at raising awareness and improving lifestyles Family Care - initiatives for the families and children of employees in order to improve work-life balance 82
83 People Care - engagement and time-saving initiatives to foster a sense of belonging to the Group. Details of remuneration policies are provided in Atlantia s Remuneration Report for 2016 (as approved by the Board of Directors on 10 March 2017) and in the information circulars for the various equity plans, prepared pursuant to art. 84-bis, paragraph 1 of the Regulations for Issuers and available for inspection on the parent s website at Workplace health and safety Protecting the health and safety of Autostrade per l Italia s workforce is backed up by a certified Management System that meets international OHSAS standards. The System covers all Autostrade per l Italia s activities and organisational units, ensuring that the Company s operational processes are adequately provided for, in full compliance with the relevant occupational health and safety legislation. Certification also involves suppliers, contractors and all service providers that work on the Company s behalf, who are obligated to not only comply with the related legislation and regulations, but also the rules set out in the procedures and regulations set out in Autostrade per l Italia s Management System. Autostrade per l Italia also conducts periodic audits of workplaces, using its own team of qualified auditors. The onsite checks and improvement initiatives form a key basis for the Health and Safety Management System, ensuring not only compliance with the applicable occupational health and safety legislation, but also its continuous improvement. A system for assessing and reporting on injuries and near misses has been adopted, enabling the Company to produce statistics, trends and historical data for use in conducting controls and devising preventive measures designed to reduce risks. Another key aspect of the Management System is training, which is considered a safety measure on a par with protective devices and plays an essential role in controlling workplace risks. Training and refresher course focusing on workplace health and safety are always organised by Autostrade per l Italia taking into account the requirements of Legislative Decree 81/2008 and the agreement between central government and regional authorities dated 21 December Organisation The following key projects and actions were implemented by the Autostrade per l Italia Group's companies in 2017: the corporate restructuring of the Group, at the end of which the overseas subsidiaries were transferred to Atlantia and the departments within Autostrade per l Italia connected with the overseas business were transferred to Autostrade dell Atlantico, a subsidiary of Atlantia; the fine-tuning of Autostrade per l Italia's business units and corporate departments and improvement to certain core processes; implementation of an IT system for managing service tenders and works contracts; adoption, by Autostrade per l Italia and its subsidiaries, of the anti-corruption policy issued by Atlantia, appointing managers with responsibility for combatting corruption and activating a process designed to result in the certification of Autostrade per l Italia in accordance with the ISO standard for Anti-Bribery Management Systems. Annual Report
84 Industrial relations The Group reached a number of agreements with the labour unions in 2016, some regarding the requirements of the existing national collective labour contract regarding second-level collective bargaining. The most important regard: the productivity bonus; the transfer of a business unit from Telepass to Telepass Pay; simplification and rationalisation of previous contract provisions and their inclusion in a single document. The following activities were also carried out in 2017: the annual meeting of the European Company Committee, set up in 2016, in accordance with EU directives on communication and consultation with workers; the Joint Committee for Funded Training met to, among other things, plan the main training initiatives for 2018; decentralised bargaining for local offices and departments, reaching a range of agreements with union representatives at local level. 84
85 2.8 Corporate governance and ownership structures This section also represents the report on corporate governance and ownership structures provided for by art. 123-bis of Legislative Decree 58 of 24 February 1998 (the Consolidated Finance Act or CFA ), in terms of the disclosures required by paragraph 2, letter b) (1) Autostrade per l Italia SpA s ownership structure Structure of the issued capital Autostrade per l Italia s issued capital consists of registered ordinary shares. The shares are indivisible and each share has one voting right. The holders of Autostrade per l Italia s shares may vote at the Company s ordinary and extraordinary general meetings and, otherwise, exercise the shareholder and patrimonial rights granted to them under existing legislation, within the limits established by the legislation and the Company s Articles of Association. As at 31 December 2017, the Company s issued capital amounts to 622,027,000, represented by 622,027,000 ordinary shares with a par value of 1.00 each. Autostrade per l Italia s shareholder structure at the date of this Annual Report is as follows. Shareholder No. of shares held % of issued capital Atlantia SpA 547,776, % Appia Investments Srl 43,148, % Silk Road Fund Ltd. 31,101,350 5% Autostrade per l Italia is under the legal control of Atlantia SpA, a joint-stock company listed on the screen-based trading system (Mercato Telematico Azionario) operated by Borsa Italiana SpA. The Company is managed and coordinated by Atlantia pursuant to articles 2497 et seq. of the Italian Civil Code Restrictions on the transfer of Autostrade per l Italia s shares The Company s articles of association place certain restrictions on the transfer of Autostrade per l Italia s shares. Specifically, the restrictions establish that: (a) the transfer of shares (or other equity-like financial instruments) held by minority shareholders is subject to prior approval by the Company s Board of Directors. This approval may, however, only be refused when the transfer is to one of the prohibited transferees indicated in the Articles of Association; (b) in the event that a minority shareholder wishes to transfer their shares (or other equitylike financial instruments held), they must give the other shareholders the right of first refusal, meaning that the minority shareholder wishing to sell has an obligation to offer the shares first to Autostrade per l Italia s other shareholders; and (1) Given that the Company has not issued shares admitted to trading on a regulated market or in a multilateral trading system, the Company has chosen to apply the option granted by paragraph 5 of art. 123-bis of the Consolidated Finance Act and to omit publication of the disclosures referred to in paragraphs 1 and 2, with the exception of those required by paragraph 2, letter b) of the same article 123-bis. Annual Report
86 (c) in the event that the majority shareholder wishes to transfer their shares (or other equitylike financial instruments held) and the transfer gives rise to a change of control, as a result of which the transferee becomes the new majority shareholder, the minority shareholders must be given a tag-along right, obliging the majority shareholder to ensure that the purchaser of the shares must also purchase the shares held by the minority shareholders who choose to exercise such right. The above restrictions do not apply to transfers between shareholders and their affiliates, with the exception of transfers to one of the prohibited transferees indicated in the Articles of Association. Restrictions on transfers provided for in the shareholder agreements governing Autostrade per l Italia s shares are described below in section Shareholder agreements governing Autostrade per l Italia s shares Contracts of sale entered into by Atlantia with Appia and Silk Road, respectively On 5 May 2017, Atlantia SpA ( Atlantia ) at that time Autostrade per l Italia s sole shareholder on the one hand, and Allianz Infrastructure Luxembourg I Sàrl, DIF Infrastructure IV Coöperatief UA and Électricité de France SA, on the other, entered into a contract of sale (the First Contract ) for the sale, by Atlantia, and the purchase, by the First Purchaser (as defined hereafter), subject to the fulfilment of certain suspensive conditions, of a 5% stake (plus up to a further 2.5% on the exercise of call options) in Autostrade per l Italia. On 29 May 2017, in accordance with the First Contract and Article 1401 of the Italian Civil Code, the special purpose vehicle, Appia Investments Srl ( Appia or the First Purchaser ) a company controlled by Allianz Infrastructure Luxembourg I Sàrl was designated the purchaser and, as a result, acquired all the rights and assumed all the obligations of the original parties to the First Contract. On 12 July 2017, Appia exercised call options on a further % interest in the Company. In addition, on 12 May 2017, Atlantia and Silk Road Fund Co., Ltd. ( Silk Road ) a medium- to long-term investment fund owned by the State Administration of Foreign Exchange, China Investment Corporation, China Development Bank and Export-Import Bank of China signed a contract of sale for the sale, by Atlantia, and the purchase, by Silk Road, subject to the fulfilment of certain suspensive conditions, of a 5% stake in Autostrade per l Italia (the Second Contract and, together with the First Contract, the Contracts of Sale ), the terms and conditions of which were in line with those in the First Contract. On 26 July 2017 (the Closing Date ), given that all the suspensive conditions provided for in the Contracts of Sale had been fulfilled, Atlantia, Appia and Silk Road executed the Contracts of Sale, completing the transfer of the interests in Autostrade per l Italia (the Closing ). In accordance with the terms of the Contracts of Sale, Atlantia has given a commitment, from the end of the second month following the dates of signature and for the following twelve months, not to sell any of its shareholding in Autostrade per l Italia at a price per share lower (after adjustments for any rights issues, capital reductions, share splits or consolidations, or similar transactions) than the base price per share paid by the purchasers under the Contracts of Sale. Shareholder agreement signed, among others, by Atlantia, Appia and Silk Road At the Closing Date (26 July 2017), Atlantia, Appia and Silk Road, in accordance with the provisions of the Contracts of Sale, entered into a shareholder agreement (the Shareholder Agreement or the Agreement ). In addition to Atlantia, Appia and Silk Road, the Agreement was also signed by Allianz Infrastructure Luxembourg I Sàrl, Allianz Pensionskasse Aktiengesellschaft, Allianz 86
87 Pensionskasse Aktiengesellschaft, DIF Infrastructure IV Coöperatief UA, DIF Infrastructure V Coöperatief UA and Électricité de France SA, solely in respect of specific provisions in the Agreement, in that they are (direct or indirect) shareholders of Appia. On Closing, the signatories to the Agreement agreed to include all the shares they hold in Autostrade per l Italia in the Agreement, as follows: Shareholder No. of shares included in the Agreement % Atlantia 547,776, % Appia 43,148, % Silk Road 31,101,350 5% Total 622,027, % Given that, pursuant to Articles 2359, paragraph 1 of the Italian Civil Code and 93 of the CFA, at the Closing Date, the Company, through its 58.98% interest, exercises legal control over Autostrade Meridionali SpA ( SAM ), whose shares are traded on the screen-based trading system (Mercato Telematico Azionario) operated by Borsa Italiana SpA, the commitments given under the Agreement regard the shares of a company that controls an issuer of listed shares and, as such, are subject to the provisions of Article 122 of the CFA, and specifically Article 122, paragraphs 1 and 5, letters a), b) and d) of the CFA. By executing the Agreement, Atlantia, Appia and Silk Road intended to establish the terms and conditions governing their mutual relations as shareholders of Autostrade per l Italia. For further information on the content of the Agreement, reference should be made to the Essential Information on the Agreement published pursuant to Article 122 of the TUF and Article 130 of CONSOB Regulation of 14 May 1999, and available on Autostrade Meridionali SpA s website ( in the section Governance / Quotazione Titolo / Patti Parasociali and on CONSOB s website Autostrade per l Italia SpA s corporate governance system The Corporate Governance system adopted by Autostrade per l Italia SpA (the Company or Autostrade per l Italia ) is based on a collection of rules that are in line with regulatory guidelines and best market practices, in line with the applicable Statutory and regulatory requirements. The Company s corporate governance structure takes the traditional Italian form which without prejudice to the role of the General Meeting of shareholders assigns executive responsibility to the Board of Directors and responsibility for supervision to the Board of Statutory Auditors. This corporate governance structure, like the Company s overall organisational structure, is in keeping with Autostrade per l Italia s aim of maximising operational efficiency. The Company s corporate bodies are the General Meeting of shareholders, the Board of Directors and the Board of Statutory Auditors. The powers and roles of the various corporate bodies are governed by law, the Articles of Association and the resolutions passed by the competent bodies, as the case may be. Annual Report
88 The General Meeting of shareholders General Meetings enable shareholders to play an active role in the life of the Company, deliberating on matters falling within its purview in accordance with the law and the Articles of Association. General Meetings may be held in ordinary and extraordinary session. The Ordinary General Meeting, in particular, must be called, at least once a year, within onehundred and twenty days after the end of the financial year, or, in certain instances, within one-hundred and eighty days. The resolutions adopted by ordinary and extraordinary general meetings are passed by the majority required by law. As a partial exception to the above rule, applicable on a general basis, the Articles of Association refer to certain matters on which the General Meeting may only validly vote if the above majority also includes the votes of all the minority shareholders who individually, at the date of the relevant General Meeting, hold at least 5% of the Company s issued capital. A list of these matters (and the related exceptions) is contained in the Articles of Association. The procedures for calling and conducting General Meetings and for shareholders to exercise their rights are governed by law and the Articles of Association The Board of Directors Composition and term of office In accordance with the Articles of Association, the Board of Directors has no less than seven and no more than twenty-three members, elected by ordinary General Meeting of shareholders for a period of not more than three years. The same General Meeting determines the number of Directors to be elected based on the number of slates presented (see below). Directors may be re-elected on expiry of their term of office. The Board of Directors in office at the date of this Report, elected by the Annual General Meeting of 21 April 2017 and increased in number by the Ordinary General Meeting of 26 June 2017, has the following nine members: 88 Fabio Cerchiai, Chairman; Giovanni Castellucci, Chief Executive Officer; Roberto Tomasi, Director; Giuseppe Angiolini, Director; Massimo Bianchi, Director; Roberto Pistorelli, Director; Antonino Turicchi, Director; Christoph Holzer, Director; Hongcheng Li, Director. The term of office of the current Board of Directors will expire on approval of the financial statements for the year ended 31 December Election and replacement of members of the Board of Directors The Articles of Association require the entire Board of Directors to be elected by slate vote. The related slates may be submitted by one or more shareholders representing, individually or jointly with other shareholders, at least 5% of the Company s issued capital. Each shareholder may take part in the presentation of a slate. The slates are voted on and each shareholder, regardless of the number of shares held and whether or not they have submitted a slate, may vote on only one slate.
89 Members of the Board of Directors are elected in the following manner: (a) (b) if only one slate has been submitted, all the members of the Board of Directors are elected from that slate; if two or more slates have been submitted; (i) (ii) all the Directors, less the number of Directors that, in accordance with the criteria described in point (ii) below, must be elected from the Minority Slates, are elected from the Majority Slate in sequential order as they appear on the slate. The number of Directors elected from the Majority Slate cannot, in any event, be less than 60% (after rounding up) of the total number of Directors to be elected; the remaining Directors are elected from the Minority Slates as follows: (A) one Director from each Minority Slate A (2)1 and (B) one Director from Minority Slate B (3)2 obtaining the greatest number of votes, in each case, in the same sequential order as the candidates appear on the slates. With regard to the criteria described in point (i), the number of Directors elected from the Minority Slates may not exceed, on an aggregate basis, 40% (after rounding down) of the Directors to be elected; (c) if no slate is submitted, the Directors are elected by majority vote of the General Meeting, as required by law, following the presentation of candidates meeting the relevant requirements. Should two or more Minority Slates B obtain the same number of votes, a further deciding vote is held. In line with the above, if during the financial year one or more Directors leaves their post, the Board of Directors proceeds to replace via co-optation pursuant to Article 2386 of the Italian Civil Code the departing Director with a candidate from the same slate to which the departing Director belonged. The General Meeting, called to confirm the co-opted Director, then approves the replacement, by majority vote, applying the same criterion. If, for whatever reason, it is not possible to replace the departing Director in the above manner (e.g. because there are no further candidates available from the slate to which the departing Director belonged), or because the Director co-opted by the Board of Directors is not confirmed by the General Meeting, or because a majority of the members of the Board of Directors elected by General Meeting leave their posts, the entire Board of Directors is deemed to have been terminated and a new General Meeting must be called to elect a new Board of Directors in accordance with the slate vote mechanism. Role, functions and delegated bodies The Board of Directors has been given the fullest powers for the ordinary and extraordinary management of the Company. It has the authority to take all the initiatives it deems necessary in order to implement and achieve the Company s objects, excluding the powers reserved by law and the Articles of Association for the General Meeting of shareholders. In carrying out its duties, the Board of Directors meets at least ten times a year. (2) (3) A slate presented by a minority shareholder individually holding an interest equal to at least 5% of the Company s issued capital. A slate presented by a group of shareholders holding an aggregate interest equal to at least 5% of the Company s issued capital. Annual Report
90 The Board of Directors also meets once a year to revise and approve, by a majority vote required by law, the Company s budgets, which contain, among other things, information on the outlook. The Board of Directors has the authority to nominate an executive committee, establishing the number of committee members and its terms of reference. The Board, within the limits provided for in Article 2381 of the Italian Civil Code, may delegate some of its powers to the executive committee. The Board may also delegate authority for ordinary and extraordinary management, establishing whatever limits it deems appropriate, to the Chairperson, the Deputy Chairperson and executive Directors. The Board may also appoint one or more general managers, establishing their functions and powers. Without prejudice to the Board of Directors authority to delegate its powers, the law and the Articles of Association provide that certain powers may not be delegated, with the exception of the delegation or sub-delegation of the powers needed to execute, implement and finalise resolutions approved by the Board of Directors. The Board of Directors decisions are taken in the form of resolutions. Resolutions are approved by a majority vote of the Directors in attendance and, in order to be valid, it is necessary that a majority of the Directors in office are present. As a partial exception to the above rule, applicable on a general basis, the Articles of Association refer to certain matters on which the Board of Directors may only validly vote if the majority required by law also includes the votes of all the Directors elected from Minority Slates A. A list of these matters (and the related exceptions) is contained in the Articles of Association. The Chairperson of the Board of Directors and the Chief Executive Officer, acting jointly and severally, have the authority to represent the Company. Major Works Committee In compliance with the Articles of Association, the Board of Directors has established a special committee to monitor, among other things, the performance and completion of construction contracts. The Committee has five members and includes the Chairman of the Board of Directors, the Chief Executive Officer and Director from each Minority Slate A. The members of the Committee in office at the date of this Report, appointed by the Board of Directors on 4 August 2017, are as follows: Antonio Turicchi, Committee Chairman; Giuseppe Angiolini; Christoph Holzer; Hongcheng Li; Roberto Pistorelli; Fabio Cerchiai; Giovanni Castellucci. The Committee meets at least once every twelve months and acts in accordance with the terms of reference approved from time to time by the Board of Directors The Board of Statutory Auditors Composition and term of office 90
91 The Board of Statutory Auditors may have three or five standing members and two alternates, elected by General Meeting, partly in order to comply with the requirements of the Single Concession Arrangement entered into by the Company with ANAS SpA, whose place was taken by the Ministry of Infrastructure and Transport from 1 October The general Meeting of shareholders establishes the number of members of the Board of Statutory Auditors when electing the Board. The Statutory Auditors remain in office for three years and their term expires on the date of the General Meeting called to approve the financial statements for the last financial year of their term of office. The Board of Statutory Auditors in office at the date of this Report, elected by the Annual General Meeting of 24 April 2015 and increased in number by the Ordinary General Meeting of 26 July 2017, has the following five standing members and two alternates: Antonio Mastrapasqua, Chairman of the Board of Statutory Auditors; Giandomenico Genta, standing Auditor; Antonio Parente, standing Auditor; Alberto De Nigro, standing Auditor; Roberto Colussi, standing Auditor; Francesco Orioli, alternate Auditor; Mario Venezia, alternate Auditor. The term of office of the current Board of Statutory Auditors will expire on approval of the financial statements for the year ended 31 December Election of the Board of Statutory Auditors The Board of Statutory Auditors is elected by slate vote. The slates may be submitted (i) individually, by the Majority Shareholder, and (ii) individually or jointly with other shareholders, by each Minority Shareholder holding at least 5% of the Company s issued capital. Each shareholder may take part in the presentation of a slate. The slates are voted on and each shareholder, regardless of the number of shares held and whether or not they have submitted a slate, may vote on only one slate. Members of the Board of Statutory Auditors are elected in the following manner: (a) if only one slate has been submitted, all the standing and alternate members of the Board of Statutory Auditors are elected from that slate, with the exception of the statutory auditors to be elected in accordance with the terms of the Single Concession Arrangement; (b) if two or more slates have been submitted: (i) (ii) all the standing and alternate Auditors, with the exception of (A) the Auditors that must be elected or designated in accordance with the terms of the Single Concession Arrangement and (B) the Auditors that must be elected from the slate obtaining the second highest number of votes, are elected from the slate receiving a majority of the votes in sequential order as they appear on the slate; one standing and one alternate Auditor are elected from the slate obtaining the second highest number of votes in sequential order as they appear on the slate, without prejudice to the fact that, if one or more slates receive the same number of votes, the slate from which the above standing and one alternate Auditor are to be Annual Report
92 taken must be drawn by lot, conducting the draw in accordance with the procedure established by the Chair of the General Meeting, so as to ensure that the draw is conducted in a transparent and non-discriminatory manner. As stated, the above mechanism does not affect the designation and election of a member of the Board of Statutory Auditors in compliance with the terms of the Single Concession Arrangement. The standing Auditor elected from the slate obtaining a majority of the votes at the General Meeting and occupying the lowest sequential position in the slate is automatically appointed Chairperson of the Board of Statutory Auditors. Role and functions The Board of Statutory Auditors oversees compliance with the law and the Articles of Association, compliance with the principles of good governance and, in particular, the adequacy of the organisational, administrative and accounting structure adopted by the Company, and its functionality Independent Auditors Responsibility for the statutory audit of the accounts is assigned to the Independent Auditors elected by General Meeting of shareholders, based on a reasoned opinion from the Board of Statutory Auditors. Throughout their engagement, the Independent Auditors must satisfy all the requirements provided for by law and the regulations from time to time applicable. The Annual General Meeting of shareholders held on 24 April 2012 appointed Deloitte & Touche SpA as the Independent Auditors on the recommendation of the Board of Statutory Auditors. The term of office of the Independent Auditors will expire on approval of the financial statements for the year ended 31 December Further information on the Independent Auditors is provided in section below Internal control and risk management system Introduction The internal control and risk management system consists of all of the instruments, rules, procedures and corporate organisational structures designed to enable - via the adequate identification, measurement, management and monitoring of the main risks - sound and correct management of the Company in a manner consistent with the Company s objectives set out by the Board of Directors. The risk management and internal control system established by the Board of Directors shall be based on the following general principles: a) operational powers: operational powers are assigned taking account of the size and risks associated with the various categories of transaction; b) organisational structures: the organisational structures are arranged in such a way as to avoid functional overlaps and the concentration of responsibility for highly critical or risky activities in one individual; c) regular reports: each process is subject to a set of standards and a related regular report designed to measure its efficiency and effectiveness; d) regular analyses: the professional knowledge and skills available within the organisation are periodically analysed in terms of their match with the objectives assigned; 92
93 reliability e) operating processes: operating processes are defined in such a way as to ensure that there are adequate documentary records enabling their continuous assessment in terms of fairness, consistency and responsibility; f) security systems: security systems guarantee an adequate level of protection for the corporate organisation s assets and data, to allow access to data as required in order to carry out the activities assigned; g) risk monitoring: the risks connected to achievement of objectives are identified and periodically monitored and updated. Negative events that may pose a threat to the organisation s business continuity shall be appropriately assessed and the related protections adapted; h) ongoing supervision: the risk management and internal control system must be subject to continuous supervision to enable periodic assessment and ongoing adaptation. To verify the functionality and appropriateness of the internal control and risk management system, the Company s Board of Directors annually approves the audit plan, prepared by the Head of the Internal Audit department of the parent, Atlantia. The Board approved the audit plan for 2017 on 16 February The Internal Control and Audit Committee, a role carried out by the Company s Board of Statutory Auditors, assesses the findings of the independent auditors as may be contained in a letter of recommendations and the report on material deficiencies detected during the course of the independent audit. In order to monitor and improve the effectiveness and efficiency of its internal control and risk management system, Autostrade per l Italia makes use of the Group Internal Audit department of the parent, Atlantia Main characteristics of existing risk management and internal control systems in respect of the financial reporting process Introduction The risk management system should not be considered separately from the internal control system in relation to financial reporting. In fact, both are part and parcel of the same system. In the context of the internal control system, with reference to the process of financial reporting, the Autostrade per l Italia Group has implemented and continually revises an internal control system for financial reporting, based on a series of administrative and accounting procedures such as to guarantee their truthfulness (4), 1accuracy (5) (6)3,2 and punctuality (7)4 in accordance with the regulations governing their preparation. (4) Truthfulness (of disclosures): disclosures must be correct and comply with generally accepted accounting principles and with their applicable statutory and regulatory requirements. (5) Accuracy (of disclosures): disclosures must be neutral and precise. Disclosures are considered neutral if free from preconceived distortions designed to influence the decision-making process of users for the purposes of achieving a predetermined result. (6) Reliability (of disclosures): disclosures must be clear and complete so as to enable investors to take informed decisions. Disclosures are deemed to be clear if they aid in understanding complex aspects of the business, without going into excessive and superfluous detail. (7) Punctuality (of disclosures): disclosures must comply with the deadlines for publication. Annual Report
94 In particular, Autostrade per l Italia benefits from the activities carried out, at the level of the Atlantia Group, by the parent, Atlantia, within the context of the laws and regulations applicable to it. The planning, implementation and maintenance of this system, and its regular assessment, are informed by international best practices and compliant with the CoSo Report III, which is the internationally recognised framework of reference for the implementation, analysis and assessment of the internal control and risk management system. In particular, the CoSo Report III (published by the Committee of Sponsoring Organizations of the Treadway Commission) provides for five components (control environment, risk assessment, control activities, information and communication, monitoring activities) that operate at the level of organisational entity and/or operating/administrative process, based on their characteristics. In common with the Atlantia Group, the Autostrade per l Italia Group s internal control system for financial reporting provides for regulations, procedures and guidelines by virtue of which Autostrade per l Italia ensures the exchange of data and information with its subsidiaries, thereby ensuring their coordination. In particular, this activity is carried out through the distribution, by the parent, Atlantia, of regulations for the application of the reference accounting standards, such as the Guidelines for preparation of the IFRS reporting package used in drawing up the Group s consolidated financial statements, and procedures regulating the preparation of the separate and consolidated financial statements and of the interim accounts and reports. The operational processes put in place by subsidiaries on the basis of Atlantia s guidelines are applicable to the above. The setting up of audits is performed after a process conducted by the parent, Atlantia, according to a top-down approach, aimed at identifying the organisational entities, processes and specific activities capable of generating the risk of unintentional errors or fraud that could have a material impact on financial reports Description of the main characteristics of existing risk management and internal control systems in respect of the financial reporting process (A) Phases of the existing risk management and internal control systems in respect of financial reporting The process of monitoring the internal control system for financial reporting is reiterated on a six-monthly basis in compliance with the provisions contained in art. 154 bis, paragraph 5 of the CFA. Autostrade per l Italia uses the same process as the parent, Atlantia, which is broken down into the following phases: (i) Identification of financial reporting risks: risk identification activities are performed with reference to Autostrade per l Italia s separate financial statements and the Group s consolidated financial statements, and is based on the assessment of qualitative and quantitative aspects concerning, firstly, the selection of significant companies to be included in the analysis, and then the classes of transaction and significant accounts. This selection activity requires: (a) (b) the definition of quantitative criteria with respect to the contribution in terms of operating performance and financial condition of the individual companies to the latest accounts and the selection rules, including minimum materiality thresholds; the consideration of qualitative elements that might contribute to the inclusion of other entities or classes of transactions on the basis of the specific risks determined by the accounting implications of the transactions carried out by the above entities, or by the presence in the accounts of the latter of substantial amounts in terms of contribution to 94
95 the consolidated financial statements in relation to items not considered in the above criteria. Every material item of data/information is traced back to the accounting and administrative processes that originated them and the typical financial report assertions are identified (existence and occurrence of events, completeness, measurement and recognition, rights and obligations, presentation and reporting) and the risks that one or more financial statement assertions do not provide a true and fair view, with consequent impact on the financial report. (ii) Assessment of financial reporting risks: the risks are assessed in terms of potential impact on the basis of quantitative and qualitative indicators and assuming the absence of controls (at an inherent level). Risks are assessed at entity level and at process level. The former includes risks of fraud, incorrect working of IT systems and other unintentional errors. At process level, financial reporting risks (underestimation, overestimation, inaccuracy etc.) are analysed at the level of the activities that make up the processes. (iii) Identification of controls for the risks detected: the risks detected are addressed through controls capable of mitigating them, both at entity level and at process level. Key controls are determined, according to risk-based and top-down controls; such controls are deemed necessary to ensure with reasonable certainty the prevention and timely identification of material errors in financial reporting. (iv) Assessment of controls for the risks detected: the process of analysing and assessing the internal control system for financial reporting continues with the assessment of the identified controls in terms of adequacy (effectiveness of control design) and in terms of effective application. Effective application is tested through specific activities performed first of all by the management line responsible for implementing such controls and, to ensure the effective assessment and consistent design of the control system, by the Financial and Accounting Compliance unit available to the Manager Responsible for Financial Reporting. The monitoring of the effective application of administrative and accounting procedures is conducted with regard to the effective implementation of key controls. The assessment procedure is chosen on the basis of the underlying risk: this choice takes into account the strengths and weaknesses of the control environment that may condition the outcome of the assessments made, the complexity of the control, the type of control (manual or automatic), the level of judgment required during the process and the dependence of the control on the functionality of other controls. The monitoring activities involve sampling techniques in line with international best practices. With reference to the automatic controls implemented, the assessment of adequacy and effective application is extended to the design and operation of general IT controls supporting the relevant applications. At the end of the monitoring activity, any deficiencies or problems are tested for significance. The Manager Responsible for Financial Reporting will, at least every six months, bring to the attention of the Control, Risk and Corporate Governance Committee the results of the activities performed and the assessment process described above by checking, together with Annual Report
96 it, the adequacy of the administrative and accounting procedures, and their effective application, in view of the issue of the attestations provided for by article 154 bis of the CFA. (B) Roles and Functions involved The internal control and risk management system requires a clear identification of the roles involved in its planning, implementation, monitoring and upgrading over time. The above components of the internal control and risk management system are coordinated and interdependent and the system, as a whole, involves in different roles and on a collaborative and coordinated basis - management bodies, supervisory and oversight bodies, the Company s management and the Atlantia Group The Manager Responsible for Financial Reporting The Manager Responsible for Financial Reporting is responsible for monitoring the internal control system on financial reporting. In particular, this Manager: (i) is responsible for ensuring the preparation of the administrative and accounting procedures necessary to prepare the annual financial statements, the six-monthly condensed financial statements and the consolidated financial statements, as well as any other periodic financial reports; (ii) complies with article 154-bis by issuing the attestations required by the applicable laws and regulations. In performing these duties, the Manager Responsible for Financial Reporting relies on the Financial and Accounting Compliance unit, which performs the following functions: (i) operational management of the System in its planning, implementation, monitoring and revision phases; (ii) review of the design and effectiveness of controls; (iii) fostering of the necessary synergies with Atlantia s Group Internal Audit department and the coordination of primary external experts in relation to their support to the performance of the unit s duties and responsibilities; (iv) ensure at Atlantia Group level, thanks to Atlantia s and its subsidiaries departments, the revision, implementation and monitoring and effective application of the procedures falling within the purview of the Manager Responsible for Financial Reporting. Lastly, the Manager responsible for financial reporting works in cooperation with the company units responsible for auditing the internal control system, to obtain all the information necessary to take effective action and to ensure the effectiveness and efficiency of the attestation process. In accordance with art. 34 of the Articles of Association, in compliance with the provisions of art. 154-bis of the CFA, the Board of Directors, subject to obtaining the required opinion of the Board of Statutory Auditors, appoints and dismisses the Manager Responsible for Financial Reporting. The Manager Responsible for Financial Reporting is selected from candidates with at least three years experience in positions with appropriate responsibility for administration and finance, or administration and control in listed joint-stock companies, and who possess the integrity required by the regulations in force. The Directors fix the related remuneration and the term of office, which is renewable, and grant the manager all the authority and instruments necessary in order to carry out the duties assigned to them by law. At a meeting on 21 April 2017, the Board of Directors confirmed the appointment of Giancarlo Guenzi as Manager Responsible for Financial Reporting. 96
97 In 2017, the internal control and risk management system, previously introduced to meet the statutory requirements to which the parent, Atlantia, is subject, was revised from an administrative and accounting viewpoint, for the purposes of attestations by the Chief Executive Officer and the Manager Responsible for Financial Reporting of the separate and consolidated annual financial reports and the consolidated half-year report, concerning, among other aspects, the adequacy and effective application of the administrative and accounting procedures Director of Internal Audit The Director of Internal Audit of the parent, Atlantia, is responsible for verifying that the risk management and internal control system is properly functioning and is fit for purpose. With particular reference to Autostrade per l Italia, the Group s Director of Internal Audit: a) audits, on an ongoing and ad hoc basis and in compliance with international standards, the good working order and adequacy of the risk management and internal control system through the application of an audit plan, based on a structured analysis and ranking of material risks with an approach risk-based; b) has direct access to all information required for the performance of his duties; c) prepares periodic reports containing an assessment of the internal control and risk management system; d) promptly present reports on events of particular relevance; e) distributes the reports pursuant to c) and d) above to the Chairmen of the Board of Statutory Auditors and the Board of Directors; f) on request, supports the Group s Ethics Officer in handling reports received in anonymous and confidential form; g) ascertains, as part of the audit plan, the reliability of information systems, including accounting systems Independent Auditors Deloitte & Touche SpA are the Independent Auditors engaged to perform the statutory audit of the separate and consolidated financial statements, the periodical assessment of the propriety of bookkeeping and a limited scope audit of the consolidated interim reports of Autostrade per l Italia for the financial years The firm was engaged by the General Meeting of shareholders held on 24 April The Board of Statutory Auditors and the Independent Auditors periodically exchange information and data on their respective audits. The parent Atlantia s Procedure for the engagement of statutory audit firms, which was revised in 2016 to take into account the changes introduced by Regulation (EU) no. 537/2014 of the European Parliament and Council and Legislative Decree 135/2016 (implementation of Directive 2014/56/EU), defines corporate responsibility and internal operating methods for the engagement of statutory external auditors in accordance with law and regulation as in force, as well as criteria for managing relations with the independent auditors and members of the relative network. The procedure applies to all Atlantia Group companies consolidated as per articles 2 and 3 of Legislative Decree 38/2005 in compliance with International Financial Reporting Standard (IFRS), and subject to statutory audit. The procedure thus relates to senior management and the managements of Atlantia Group companies who, in the performance of their duties, have direct or indirect contact with independent auditors during their internal audit procedures. Annual Report
98 Supervisory Board Autostrade per l Italia has set up a Supervisory Board. The Board was appointed by the Board of Directors on 10 July 2015, for the period from 1 July 2015 to 30 June During 2017, the Supervisory Board met on 14 occasions reported regularly to the Company s Board of Directors and Board of Statutory Auditors on the activities carried out, with regard to both revision of the Organisational, Management and Control Model and monitoring. It confirmed that the Organisational, Management and Control Model adopted by the Company meets all the necessary statutory requirements to prevent the commission of the offences referred to in Legislative Decree 231/ Organisational, Management and Control Model (Legislative Decree 231/2001) Autostrade per l Italia has adopted an Organisational, Management and Control Model to prevent commission of the offences referred to in Legislative Decree 231/2001. During 2017, the Supervisory Board completed its assessment of the legislative changes made to legislative Decree 231/01 in the period following approval of the previous revision of the Organisational, Management and Control Model adopted in compliance with Legislative Decree 231/2001 (June 2016) and discussed the proposed changes to the 231 Model drawn up by the Corporate Governance and Compliance department in order to ensure that the Company s Organisational Model is in line with the statutory requirements and the organisational changes that have taken place. In particular, the competent departments (Corporate Governance and Compliance, Legal Affairs and Central Human Resources) revised the map of areas at risk, taking into account the organisational and corporate changes that had taken place since the Model was previously revised, and amendments to the offences already covered by the legislation and new offences introduced. The new offences include private-to-private corruption and inducement to corruption as defined in Legislative Decree 38 of 15 March 2017; Trafficking and exploitation of labour, as defined in Law 199 of 29 October 2016); market abuse, as defined in EU Regulation 596/2014/EU (the Market Abuse Regulation MAR) and Directive 2014/57/EU regarding sanctions for market abuse (the Criminal Sanctions Market Abuse Directive CSMAD). The Board of Directors approved the revised Organisational Model at its meeting of 14 December Other corporate governance procedures A description of the Organisational, Management and Control Model which also includes, among other things, the Group s Code of Ethics is provided in the above section in the part describing the internal control and risk management system Procedure for market announcements At a meeting on 8 July 2016, in order to comply with the provisions of Regulation (EU) no. 596/2014 of the European Parliament and Council (more commonly known as the Market Abuse Regulation or MAR Regulation ), the Company's Board of Directors: (a) revised the Procedure for Market Announcements, which the Company had already adopted when the Retail Loan bonds called "Autostrade TF " were listed on the screen-based bond trading system (MOT) operated by Borsa Italiana SpA, and therefore the applicability of the market announcements regulations to Autostrade per l Italia, as a "listed issuer", which included, among other things, the obligations pursuant 98
99 (b) to articles 114 and 115 of the CFA and the obligation to set up an "insiders register"; and approved adoption of the Internal Dealing Code of Conduct, containing, among other things, a description of the reporting requirements and conduct the reporting and conduct obligations relating to transactions regarding listed bonds issued by Autostrade per l Italia or the financial instruments connected to them, carried out by Relevant Persons (as defined in the Code of Conduct) and/or persons closely associated with them, as well as the related reporting to the Company, CONSOB and the market Anti-corruption policy On 9 November 2017, Autostrade per l Italia adopted the Atlantia Group s Anti-corruption Policy. By adopting this policy, Autostrade per l Italia in common with all the other Atlantia Group companies has reaffirmed its commitment to preventing and combatting illegal conduct. In this regard, the policy brings together and combines into a coherent whole the existing rules designed to prevent and combat such behaviour already applied by the Group. The policy is intended for application alongside the Code of Ethics, the Management and Control Model and the Group s compliance programmes. Annual Report
100 2.9 Sustainability Whilst being a public interest entity falling within the scope of application of Legislative Decree 254/2016 regarding non-financial reporting requirements, Autostrade per l'italia SpA has elected to take advantage of the option, provided for in art. 6, paragraph 2 of the above decree, to not prepare a consolidated non-financial statement, given that it is included in the consolidated non-financial statement published by Atlantia SpA, the Company s parent and subject to the same obligations. The pillars of Autostrade per l Italia's sustainability strategy include the safety of infrastructures, ongoing improvement of customer service quality, operational excellence through the development of innovative technologies, protecting health and safety at work, safeguarding the environment, dialogue with communities and enhancement of the areas the network passes through, as well as enhancement of people, who are at the centre of all Group activities. In pursuing this aim, Autostrade per l'italia and its subsidiaries abide by the principles of transparency, rigour and ethics, respecting people s right to freedom and equality and combating all forms of discrimination and corruption. Service quality In 2017, the network operated by Autostrade per l Italia and its Italian subsidiaries registered a global accident rate of 28.6 (29.7 in 2016), a fatal accident rate of 0.24 (0.22 in 2016) and a Blackspot Accident Index of 33.37, marking a reduction of over 40% since 2013, when the indicator was introduced. These results were achieved thanks to the significant contribution from initiatives undertaken over the years, including deployment of the Tutor system for measuring average speeds, continual improvements in network standards, ongoing structural maintenance work, the rollout of draining pavement throughout the network, the adoption of specific procedures for managing emergencies and the numerous information campaigns designed to raise safety awareness among road users. In terms of traffic flow indicators, the Total Delay, the certified algorithm that measures the difference between the average transit time for each section of the entire network in the period under review and the equivalent time at an average speed typical of the section in question, amounted to 5.9 million hours, compared with 5.0 million in The increase primarily reflects traffic growth and the greater number of hours when roads were closed due to accidents, despite an improvement in the global accident rate. Customer satisfaction with the motorway service is measured through Customer Satisfaction surveys, conducted periodically by specialist firms and/or via telephone interviews. In 2017, Autostrade per l Italia's Customer Satisfaction Index (CSI) was based on interviews conducted twice during the year with a sample of "frequent travellers", namely customers who use motorways at least once a month: commuters, truck drivers and traders. The resulting score of 7.28 is the highest since 2004, the year in which the survey was first conducted. 100
101 Customer satisfaction (Autostrade per l Italia) SAFETY % of satisfied customers (score > or equal to 7-scale 1:10) Overall score (average score on a scale 1:10) TRAFFIC INFORMATION % of satisfied customers (score > or equal to 7-scale 1:10) Overall score (average score on a scale 1:10) TOLLGATES % of satisfied customers (score > or equal to 7-scale 1:10) Overall score (average score on a scale 1:10) PAYMENT SYSTEMS % of satisfied customers (score > or equal to 7-scale 1:10) Overall score (average score on a scale 1:10) ROAD CONDITIONS % of satisfied customers (score > or equal to 7-scale 1:10) Overall score (average score on a scale 1:10) SERVICE AREAS % of satisfied customers (score > or equal to 7-scale 1:10) Overall score (average score on a scale 1:10) Total CSI The environment Environmental sustainability is particularly important in the construction and management of motorway infrastructure especially in the areas the network passes through and is the basis of a long-term strategy to protect and enhance Italy's landscape, architectural and natural heritage. Indeed, the complexity of the motorway network managed by the Group requires adoption of an organic approach to environmental management geared towards prevention and control. Consequently, the Group promotes environmental protection using appropriate procedural, managerial and organisational tools, ranging from training and awareness raising to the study of innovative technological solutions aimed at providing excellent performances. Use of resources In managing its activities especially maintenance and the modernisation of infrastructure Autostrada per l'italia makes necessary use of materials whose impact on the environment has to be constantly monitored and limited. The materials normally used are: quarry materials, bitumen, iron and steel and cement. Optimising use of the materials employed is a constant concern in managing the Group s activities. A total of approximately 960 thousand cubic metres of water was consumed in 2017, broadly in line with the figure for Energy and climate change The efficient use of energy and renewable sources has become a key issue in Autostrade per l Italia's sustainability policy-making. Annual Report
102 Autostrade per l Italia's commitment in this field is expressed via projects aimed at the adoption of renewable energy sources, and the study and implementation of eco-efficient solutions in terms of consumption. This approach is accompanied by monitoring, management and emissions reduction activities, and more generally by a strategy to combat climate change. Energy consumption depends on the organisation s needs and the amount of energy used in providing the motorway service: the lighting of tunnels, toll stations, junctions and service areas, power for plant and equipment, fuel for service vehicles. In 2017, the Group consumed a total of 1,155 TJoules, including electricity, natural gas, LPG, diesel and petrol. The figure is up 6% on the previous year, reflecting increased use of fuel oil/diesel for heating and for vehicles and machinery used in operations, and an increase in electricity consumption, above all for tunnel lighting. The increase in energy consumption is also reflected in the volume of greenhouse gas emissions, which amounted to approximately 95 thousand tonnes of CO2 equivalent emissions (CO 2 eq (1) ) in 2017, up 5% on In terms of renewable energy, by the end of 2017, Autostrade per l Italia s photovoltaic plant installation plan had achieved the following results: 164 plants in operation, providing installed photovoltaic capacity of 10.8 MWatt; estimated energy production of approximately 13 GWh per year, including around 40% consumed on site by the Company; estimated savings of CO 2 : over 4,000 tonnes. Moreover, taking into account the Group subsidiaries' new photovoltaic installations, electricity generated from renewable sources amounted to 13,250 MWh in As part of its energy saving programme, the initiatives carried out by Autostrade per l Italia on electrical equipment and external lighting systems during the period resulted in energy savings of 23,100 MWh a year, due especially to three types of initiative: the replacement of high pressure sodium lamps used in tunnels and at toll stations with LED lamps; the upgrade of lighting at service areas through the replacement of lamps installed on lighting towers; a reduction in the brightness of lighting systems at service areas to bring it into line with current legal requirements, using voltage regulators. The "diesel-free" project, which involves the decommissioning of diesel power at 48 thermal power stations, primarily by using heat pumps and converting from diesel to LPG, continued in Once fully operational, this project will enable annual saving of over 300 thousand litres of diesel. Autostrade per l Italia also operates tri-generation plants, having built three such plants since This enabled the Company to self-produce over 3.2 GWh of electricity in Waste The total amount of waste produced in 2017 amounted to around 33 thousand tonnes, of which around 59% was recovered or recycled. The figure is down 4% compared with 2016, due to a reduction in waste disposal due to maintenance activities. (1) 102 In terms of global warming, the amount of emissions of all greenhouse gases is measured in terms of CO 2 equivalent (CO2 eq ), based on defined conversion tables.
103 Key environmental indicators /2017 (%) Water consumption (m 3 ) 960, ,578 0% Energy consumption by type (MWh eq) 1,155 1,094 6% Diesel % Natural gas % Petrol 2 2 0% Electricity % Other % CO2 emissions (t) 95,108 90,585 5% Direct emissions (*) 28,848 25,712 12% Indirect emissions from electricity consumption 66,260 64,873 2% CO2 emissions due to traffic congestion - Total Delay (t) 23,377 19,481 20% Waste produced (t) 33,727 35,162-4% % of waste recycled /recovered % (*) Emissions deriving from the use of fuels. Government and the community The Autostrade per l Italia Group works closely with communities and maintains constant dialogue with central and local government authorities throughout all stages of its operations. The Group s vital counterparties are the Ministries of Infrastructure, the Environment, Heritage and Culture and Tourism, parliamentary committees during the discussion phase of new regulatory proposals for the sector supervisory and monitoring bodies, and government-level technical organisations. Also vital are relations with local stakeholders, regions and municipalities, as well as with government departments, in order to guarantee a shared approach to local planning for development. In the context of policies focused on local areas, a growing role is played by actions to enhance local excellence, carried out in 2017 via the Sei in un paese meraviglioso (You're in a wonderful country) project 1 1 to the promotion of UNESCO sites. Also noteworthy are the Group s humanitarian, scientific, cultural, sporting and social initiatives, whether implemented independently or in collaboration with national and international entities and bodies. The aim is go beyond the traditional philanthropic approach and contribute towards making investments for the community, with a focus on spreading responsible behaviours and cultural growth. Suppliers Autostrade per l Italia s main suppliers are businesses that provide goods and services and those involved in the construction of new infrastructure and maintenance of the existing network, and companies that supply technology used in developing automated tolling systems and new safety and quality service standards for customers. The process of selecting suppliers starts with a request for assessment of the financial, technical and organisational aspects of each supplier. Specific information on sustainability is (1) For more information on the Sei in un paese meraviglioso project, go to: Annual Report
104 also requested backed up by documentary evidence (e.g. sustainability reports, environmental reports, adoption of sustainability strategies, certification of processes and/or products, implementation of initiatives aimed at developing a socially responsible approach to planning and business management). The awarding of construction, operation and network maintenance contracts to external companies takes place via public tenders, in which all bidders who meet the general and specific requirements provided for in the relative tenders may freely participate. Competitions are held in accordance with the relevant EU regulations in a fair and transparent way. In implementation of the Company s ethical principles, all suppliers must commit to complying with the Group s Code of Ethics and Conduct on their own behalf and on behalf of any authorised sub-contractors, consultants and employees. In addition, suppliers are required to meet a series of social and environmental obligations relating, for example, to occupational health and safety and environmental protection, such as the methods used for disposing of waste and scrap. In order to ensure that suppliers comply with their obligations regarding sustainability, a number of specific audits and training and awareness raising initiatives have been carried out. 104
105 2.10 Related party transactions Information on related party transactions is provided in note 10.5 to the consolidated financial statements and note 9.3 to Autostrade per l'italia s separate financial statements Significant regulatory aspects Toll increases with effect from 1 January 2017 The Minister of Infrastructure and Transport and Minister of the Economy and Finance issued decrees on 30 December 2016, determining the toll increases to come into effect from 1 January Specifically: Autostrade per l Italia was to apply a toll increase of 0.64%, compared with the 0.77% requested. The reason given for the reduction with respect to the requested shortfall (equal to 0.13%) was that additional documentation was required in respect of the X and K tariff components. Once these documents had been submitted Autostrade per l Italia, on 21 September 2017, the Grantor decided to allow almost all the expenditure detailed in the additional documentation, announcing the need to resubmit the same documents when applying for the toll increase for 2018; Raccordo Autostradale Valle d Aosta and Autostrada Tirrenica were to apply an increase based on the target inflation rate (0.90%), whilst determining that any over or under recoveries, including those for previous years, will be assessed following revision of the operators financial plans. The companies thus challenged the related decree before the Regional Administrative Court. On 12 September 2017, the Court partially upheld the challenge brought by Raccordo Autostradale Valle d Aosta, cancelling the above provision; Tangenziale di Napoli was to apply a toll increase of 1.76%, thus lower than the requested increase, and that any over or under recoveries, including those for previous years, will be assessed following revision of the operator s financial plans. The company thus challenged the related decree before the Regional Administrative Court; Autostrade Meridionali, as in previous years, did not have the right to apply any toll increase, in view of the fact that its concession expired on 31 December Autostrade Meridionali has brought a legal challenge contesting the above decision, in line with the approach adopted in previous years, and for 2014, 2015 and 2016, the courts found in the company s favour. Campania Regional Administrative Court also upheld Autostrade Meridionali s challenge with respect to the increase for 2017, declaring the failure to allow the requested toll increase unlawful. In the case of Traforo del Monte Bianco, which operates under a different regulatory regime, on 2 December 2016, the Intergovernmental Committee for the Mont Blanc Tunnel gave the go-ahead for a toll increase of 0.06%, representing the average of the inflation rates registered in Italy (-0.07%) and France (+0.2%). Annual Report
106 Toll increases with effect from 1 January 2018 The Minister of Infrastructure and Transport and Minister of the Economy and Finance issued decrees on 29 December 2017, determining the toll increases to come into effect from 1 January Specifically: Autostrade per l Italia was to apply a toll increase of 1.51%, including 0.49% as the inflationlinked component, 0.64% to provide a return capital expenditure via the X tariff component and -0.04% to provide a return on investment via the K tariff component (the shortfall in the increase awarded for 2017 was recouped for both these components) and 0.43% to recover the reduction in revenue earned in the period from June 2014 to 2017 as a result of the discounted tolls for frequent motorway users, introduced by the Memorandum of Understanding entered into with the Ministry. The shortfall in the increase with respect to the requested amount, equal to 0.01%, regards the X component. In response, as in 2017, the Company has submitted additional documentation to support its request, with the aim of recouping the shortfall as part of the toll increase for 2019; Raccordo Autostradale Valle d Aosta was awarded a toll increase of 52.69%, compared with a request for 81.12%. The company has challenged the decree before the Regional Administrative Court; Autostrade Meridionali was awarded a toll increase of 5.98%, compared with a request for 9.9%; Autostrade Tirrenica was awarded a toll increase of 1.33%, compared with a request for 36.51%. The company has challenged the decree before the Regional Administrative Court; Tangenziale di Napoli was awarded a toll increase of 4.31%, inclusive of the increase designed to make up for the lack of any increases in previous years, compared with a requested increase of 1.93%. The increase was awarded on the basis of the revised financial plan annexed to the Addendum signed on 8 September 2017 and, later, at the Grantor s request, signed digitally on 22 February The Addendum will be effective once it has been formally approved by decree, as required by law, and once the decree has been registered with Italy s Court of Auditors. In the case of Traforo del Monte Bianco which, as noted above, operates under a different regulatory regime, on 24 November 2017, the Intergovernmental Committee for the Mont Blanc Tunnel gave the go-ahead for a toll increase of 1.09%. This is based on the average of the inflation rates registered in Italy and France from 1 September 2016 to 31 August 2017, in addition to an extra 0.95% increase determined by the Committee. From 1 April 2018, tolls for all Euro 3 category heavy vehicles of over 3.5 tons, will be increased by 5%. II Addendum to Autostrade per l'italia s Single Concession Arrangement A II Addendum to Autostrade per l Italia s Single Concession Arrangement was signed on 10 July 2017, replacing the previous addendum signed on 10 December 2015, for which the related approval process had not been completed. The Addendum governs the inclusion of the Casalecchio Interchange Northern section among the operator s investment commitments in the Single Concession Arrangement. The project will involve expenditure of up to approximately 158 million, including around 2 million already incurred for design work, and almost 156 million to be paid to ANAS, which will carry out the work and then operate the infrastructure. This amount will be paid to ANAS on a stage of completion basis and under a specific agreement to be executed. The amount will then be recouped by Autostrade per l'italia through the specific K tariff component. 106
107 During the approval process, the Grantor requested that the document be signed digitally. The Addendum was then signed on 22 February 2018 and will be effective once it has been approved by the Ministry of Infrastructure and Transport and the Ministry of the Economy and Finance, and once the related decree has been registered by Italy s Court of Auditors. Addendum to Tangenziale di Napoli s Single Concession Arrangement On 8 September 2017, the Addendum to Tangenziale di Napoli s Single Concession Arrangement was signed. The Addendum sets out the results of the five-yearly review ( ) of the financial plan annexed to the Arrangement. During the approval process, the Grantor requested that the document be signed digitally. The Addendum was then signed on 22 February 2018 and will be effective once it has been approved by the Ministry of Infrastructure and Transport and the Ministry of the Economy and Finance, and once the related decree has been registered by Italy s Court of Auditors. Agreement on the upgrade of the existing motorway system/ring road interchange serving Bologna On 15 April 2016, Autostrade per l Italia, the Ministry of Infrastructure and Transport, Emilia- Romagna Regional Authority, the Bologna Metropolitan Authority and the Municipality of Bologna signed an agreement for the upgrade of the existing motorway system/ring road interchange serving the city of Bologna. On 16 December 2016, the signatories to the agreement signed a final memorandum following a public meeting. The memorandum confirms that Autostrade per l Italia has modified the design for the project in full compliance with the principles set out in the agreement, and that it will carry out the work needed to complete the road network connecting the urban and metropolitan area to the new motorway infrastructure. The environmental assessment is expected to come to a conclusion in early 2018 and, following receipt of all the necessary consents, the tender process will begin. Addendum to Autostrada Tirrenica s Single Concession Arrangement In response to observations from the European Commission regarding, among other things, extension of the concession to 2046 and following discussions with the Grantor, since 2014 Autostrada Tirrenica has prepared and submitted to the Grantor a number of drafts of a new addendum to its existing Single Concession Arrangement, providing for: a reduction in the concession term (initially to expire in 2043, then in 2040 and, finally, in 2038), the obligation to put all the works out to tender and the conditions for completion of the road. On 17 May 2017, the European Commission announced that the Commission had referred Italy to the European Court of Justice for violation of EU law regarding extension of the concession arrangement without conducting a tender process. On 5 October 2017, the Ministry of Infrastructure and Transport notified the company that it had lodged an appeal. In 2017, the Ministry of Infrastructure and Transport carried out a project review for the road running down the Thyrrenian coast (the Thyrrenian corridor ), which envisages construction of the Tarquinia Ansedonia section of motorway by Autostrada Tirrenica and the widening to four lanes of the existing dual carriageway (the SS 1) from Ansedonia to Orbetello Scalo by the same company. The date for expiry of the concession term was to be 31 December Work on the remaining section, from Orbetello Scalo to San Pietro in Palazzi, would be the sole responsibility of ANAS. Annual Report
108 The Interministerial Economic Planning Committee, at the session held on 22 December 2017, received the report on the process of modifying the proposed project for completion of Thyrrenian corridor. Discussions are ongoing with the Grantor to assess the administrative and financial feasibility of the new solution. Award of the concession for the A3 Naples Pompei Salerno motorway In 2012, the Ministry of Infrastructure and Transport issued a call for tenders for the new concession for the A3 Naples Pompei Salerno motorway. Following the challenges brought by Autostrade Meridionali and Consorzio Stable SIS before Campania Regional Administrative Court, contesting the Ministry s decision, dated 22 March 2016, to disqualify both bidders from the tender process, on 19 December 2016, Campania Regional Administrative Court announced that it did not have jurisdiction for either action, referring the challenges to Lazio Regional Administrative Court. On 29 and 30 December 2016, respectively, Consorzio Stable SIS and Autostrade Meridionali returned to court and, on 31 January 2017, Lazio Regional Administrative Court published its view that the Campania Regional Administrative Court had jurisdiction, referring the matter to the Council of State in order to decide on the question. Following the hearing before the Council of State, held on 27 June 2017, the Council issued an order dated 17 November 2017, finally assigning jurisdiction to Campania Regional Administrative Court. Following the return of the case to Campania Regional Administrative Court, the Court scheduled a hearing on the merits of both challenges brought by Autostrade Meridionali and SIS for 23 May New legislation concerning tenders and concessions The 2018 Budget Law Law 205 of 27 December has amended art. 177 of the Public Contracts Code. The new article requires motorway operators holding a concession not awarded in the form of project financing, or by public tender in accordance with EU law, to award 60% of any contracts for works, services or goods by public tender, instead of the 80% generally applied. ANAC (the Autorità Nazionale Anti Corruzione, Italy s National Anti- Corruption Authority) is in the process of issuing interpretation guidelines for art Charges payable by motorway operators in accordance with Legislative Decree 35 of 2011 The Ministerial Decree of 7 August 2017 was published Official Gazette no. 250 on 26 October This legislation quantifies the charges to be paid by motorway operators for "the activities involved in overseeing projects, classification of the network and the inspection of existing roads" carried out by the Ministry of Infrastructure and Transport as the Competent Body in accordance with Legislative Decree 35/2011 (the infrastructure safety decree). At this time, the provisions of Legislative Decree 35/2011 require the issue of further legislation, given the Ministry s failure to issue implementing decrees. Despite this, the provisions, in event, represent legal standards to be taken duly into account in the day-to-day operations of motorway operators, during both the design of new works and the management of existing infrastructure. Publication of the decree calculating the charges and establishing the method and terms of payment by operators for the Ministry s activities as the Competent Body, such as the 108
109 oversight of projects, classification of the network and inspections, is an issue of some importance given that the activities have yet to take place. For this reason, whilst having proceeded to pay the amounts due for 2017 and 2018 expressly reserving the right to request restitution -, Autostrade per l Italia, in common with almost all other motorway operators, lodged an extraordinary appeal with the Head of State on 22 February 2018, challenging the above legislation. This is to avoid the risk that apparent acquiescence to the decree could lead the Ministry s inspections to be classified as an activity carried out as a Competent Body with responsibility for infrastructure safety. Discussions between the Ministry of Infrastructure and Transport and the European Commission regarding the extension of Autostrade per l Italia s concession In July 2017, the Ministry of Infrastructure and Transport reached an agreement with the European Commission. The agreement sets out the key conditions to be met in order to grant Autostrade per l Italia a 4-year extension to its concession in return for pre-determined toll increases and recognition of a takeover right on expiry. Press reports dated 28 February 2018 indicate that, following positive developments in is talks with the Ministry of Infrastructure and Transport, the European Commission is about to make a decision on the matter. Once the Commission has made its decision, Autostrade per l'italia will assess the details in order to decide on how to respond. Annual Report
110 2.12 Other information Autostrade per l Italia does not own, either directly or indirectly through trust companies or proxies, shares or units issued by parent companies. No transactions were carried out during the year involving treasury shares or shares or units issued by parent companies. Autostrade per l Italia does not operate branch offices. With reference to CONSOB Ruling 2423 of 1993, regarding criminal proceedings or judicial investigations, the Company is not involved in proceedings, other than those described in note 10.7 Significant legal and regulatory aspects, that may result in charges or potential liabilities with an impact on the financial statements. Transactions in the shares of Tangenziali Esterne di Milano SpA On 10 November 2017, Autostrade per l Italia exercised the pre-emption right, granted to it under the terms of the articles of association of Tangenziali Esterne di Milano SpA (TEM), on the interests in TEM held by Intesa San Paolo SpA (ISP) and Autostrade Lombarde SpA (AL), and which the two shareholders had decided to sell to Società Autostrada Torino-Alessandria- Piacenza SpA (SATAP) and SIAS Società Iniziative Autostradali e Servizi SpA (SIAS, and together with SATAP, the Party SIAS). As a result of exercising its pre-emption right and the increase in the original stake due to Autostrade per l Italia following the decision, taken by all the other holders of such rights, not to exercise them, with the exception of the original purchasers, SIAS and SATAP and following completion of the two transactions, Autostrade per l Italia will increase its interest in TEM from the current 13.67% to 19.34%. This will be achieved in return for payment of a total consideration of approximately 12.5 million (of which approximately 9.9 million to acquire the shares held by ISP and approximately 2.6 million to acquire the shares held by AL). Autostrade per l Italia s purchase of the shares will take place - mutatis mutandis at the same terms and conditions as those in the contracts originally entered into by the Party SIAS with ISP and AL. The first of the two transactions was completed on 23 February 2018, involving Intesa San Paolo s sale of 13,122,231 shares in TEM to Autostrade per l Italia. The price of the shares totalling 9,842, will be paid on 22 January Intesa San Paolo will continue to exercise its right of usufruct of the shares until 31 December Events after 31 December 2017 Traffic figures for early 2018 Between the beginning of the year and 18 February (preliminary data), traffic using Autostrade per l Italia s network was up 5.1%, with heavy vehicles (3 or more axles) up 6.1% and light vehicles (2 axles) rising 4.9%. 110
111 2.14 Outlook and risks or uncertainties Traffic using the Group s Italian network is expected to grow, as confirmed from the trends seen in the early part of the year. Work on upgrading the network operated under concession will continue in 2018, whilst preparation of the executive design for the Genoa Bypass is proceeding. Overall, forecasts for 2018 lead us to expect the Group to post earnings growth and improvements in key performance indicators. Annual Report
112 2.15 Proposed resolutions for the Annual General Meeting of Autostrade per l Italia SpA s shareholders Dear Shareholders, In conclusion, we invite you: a) to approve the financial statements as at and for the year ended 31 December 2017, which report profit of 968,016,188.98, having taken note of the accompanying documents; b) to appropriate the 517,668, in profit for the year remaining, after payment of the interim dividend of 450,347, (equal to per share) in 2017, as follows: 1) 517,526, to pay a final dividend of per share, payable to holders of each of the 622,027,000 dividend-bearing shares with a par value of 1.00 in issue; 2) the remaining 142, to retained earnings; c) to establish the dividend payment date as 16 May For the Board of Directors The Chairman 112
113 (This page intentionally left blank) Annual Report

114


115
116 Consolidated financial statements CONSOLIDATED STATEMENT OF FINANCIAL POSITION of which 000 Note 31 December 2017 related party 31 December 2016 transactions of which related party transactions ASSETS Non-current assets Property, plant and equipment ,099 85,878 Property, plant and equipment 79,298 83,862 Investment property 1,801 2,016 Intangible assets ,355,696 18,750,244 Intangible assets deriving from concession rights 12,220,843 12,620,116 Goodwill and other intangible assets with indefinite lives 6,111,237 6,111,237 Other intangible assets 23,616 18,891 Investments ,944 61,044 Investments accounted for at cost or fair value 33,920 33,920 Investments accounted for using the equity method 30,024 27,124 Non-current financial assets , ,767 Non-current financial assets deriving from government grants 188, ,985 Non-current term deposits 184, ,696 Other non-current financial assets 21,059 20,086 Deferred tax assets , ,522 Other non-current assets ,189 Total non-current assets 18,995,957 19,419,644 Current assets Trading assets , ,739 Inventories 52,053 48,561 Contract work in progress 4,204 4,204 Trade receivables 451, , , ,112 Cash and cash equivalents 7.8 2,938,061 3,223,793 Cash 2,076,029 2,540,743 Cash equivalents 100, ,080 Intercompany current account receivables due from related parties 761, , , ,970 Current financial assets , ,333 Current financial assets deriving from concession rights 399, ,270 Current financial assets deriving from government grants 52,265 50,476 Current term deposits 50,599 48,913 Current portion of medium/long-term financial assets 22,147 3,423 Other current financial assets 6,879 7,251 Current tax assets ,800 31,229 69,025 65,174 Other current assets ,862 82,518 Assets held for sale and related to discontinued operations ,061-5,907,657 26,340 Total current assets 4,104,993 10,366,065 TOTAL ASSETS 23,100,950 29,785,
117 CONSOLIDATED STATEMENT OF FINANCIAL POSITION of which 000 Note 31 December 2017 related party 31 December 2016 transactions of which related party transactions EQUITY AND LIABILITIES Equity Equity attributable to owners of the parent 2,390,132 4,368,352 Issued capital 622, ,027 Reserves and retained earnings 1,246,560 3,233,873 Profit/(Loss) for the year net of interim dividends 521, ,452 Equity attributable to non-controlling interests 347,660 1,749,310 Issued capital and reserves 292,779 1,649,674 Profit/(Loss) for the year net of interim dividends 54,881 99,636 Total equity ,737,792 6,117,662 Non-current liabilities Non-current portion of provisions for construction services required by contract ,839,552 3,165,177 Non-current provisions ,314,339 1,298,255 Non-current provisions for employee benefits 100, ,382 Non-current provisions for repair and replacement of motorway infrastructure 1,197,310 1,169,196 Other non-current provisions 16,999 21,677 Non-current financial liabilities ,990,445 12,022,227 Bond issues 8,092,619 8,005,130 Medium/long-term borrowings 2,468,682-3,536, ,320 Non-current derivative liabilities 429, ,447 Deferred tax liabilities , ,947 Other non-current liabilities ,103 30,823 Total non-current liabilities 15,775,803 16,987,429 Current liabilities Trading liabilities ,323,768 1,254,817 Trade payables 1,323, ,370 1,254, ,053 Current portion of provisions for construction services required by contract , ,454 Current provisions , ,790 Current provisions for employee benefits 23,525 24,332 Current provisions for repair and replacement of motorway infrastructure 152, ,779 Other current provisions 38,692 42,679 Current financial liabilities ,230,850 1,368,390 Bank overdrafts repayable on demand 7 - Short-term borrowings 774, , ,480 - Current derivative liabilities 638 2,997 Intercompany current account payables due to related parties 13,954 13, , ,768 Current portion of medium/long-term financial liabilities 1,384,584 1,000, ,001 4,344 Other current financial liabilities 56, Current tax liabilities ,449 87,143 4, Other current liabilities ,730 18, ,074 10,089 Liabilities related to discontinued operations , ,996,823 7,433 Total current liabilities 4,587,355 6,680,618 TOTAL LIABILITIES 20,363,158 23,668,047 TOTAL EQUITY AND LIABILITIES 23,100,950 29,785,709 Annual Report
118 CONSOLIDATED INCOME STATEMENT 000 Note 2017 of which related party transactions 2016 of which related party transactions REVENUE Toll revenue 8.1 3,590,330 3,482,401 Revenue from construction services , ,001 Contract revenue Other operating income , , ,293 73,005 TOTAL REVENUE 4,055,348 4,031,719 COSTS Raw and consumable materials ,455-65,729 Service costs , , , ,187 Gain/(Loss) on sale of elements of property, plant and equipment Staff costs ,032-24, ,502-26,839 Other operating costs , ,242 Concession fees -465, ,424 Lease expense -10,216-4,265 Other -62,999-51,553 Operating change in provisions ,290-85,716 (Provisions)/Uses of provisions for repair and replacement of motorway infrastructure ,585 Provisions -11,551-1,131 Use of provisions for construction services required by contract , ,366 Amortisation and depreciation -605, ,235 Depreciation of property, plant and equipment -22,255-21,996 Amortisation of intangible assets deriving from concession rights -565, ,038 Amortisation of other intangible assets -17,276-15,201 (Impairment losses)/reversals of impairment losses ,948-1,682 TOTAL COSTS -2,139,456-2,309,207 OPERATING PROFIT/(LOSS) 1,915,892 1,722,512 Financial income 101,636 22,448 Dividends received from investees 2,430 2,295 Other financial income 99,206 2,737 20,153 13,486 Financial expenses -582, ,258 Financial expenses from discounting of provisions for construction services required by contract and other provisions -25,113-46,768 Other financial expenses -557,297-59, , ,890 of which non-recurring ,215 Foreign exchange gains/(losses) FINANCIAL INCOME/(EXPENSES) , ,930 Share of (profit)/loss of investees accounted for using the equity method ,743-7,733 PROFIT BEFORE TAX FROM CONTINUING OPERATIONS 1,437, ,849 Income tax (expense)/benefit , ,788 Current tax expense -298, ,097 Differences on current tax expense for previous years 9,512 3,193 Deferred tax income and expense -130, ,884 PROFIT/(LOSS) FROM CONTINUING OPERATIONS 1,017, ,061 Profit/(Loss) from discontinued operations , ,314 PROFIT FOR THE YEAR 1,041, ,375 of which: Profit attributable to owners of the parent 971, ,245 Profit attributable to non-controlling interests 69, , Basic earnings per share attributable to owners of the parent of which: - continuing operations discontinued operations Diluted earnings per share attributable to owners of the parent of which: - continuing operations discontinued operations
119 CONSOLIDATED STATEMENT OF COMPREHENSIVE INCOME Profit for the year (A) 1,041, ,375 Fair value gains/(losses) on cash flow hedges 38,663-72,354 Tax effect of fair value gains/(losses) on cash flow hedges -14,116-32,224 Gains/(losses) from translation of assets and liabilities of consolidated companies denominated in functional currencies other than the euro Gains/(Losses) from translation of investments accounted for using the equity method denominated in functional currencies other than the euro 90, , ,860 Other comprehensive income/(loss) for the year reclassifiable to profit or loss (B) 116, ,797 Gains/(losses) from actuarial valuations of provisions for employee benefits -1,002-2,459 Tax effect of gains/(losses) from actuarial valuations of provisions for employee benefits Other comprehensive income/(loss) for the year not reclassifiable to profit or loss (C) ,872 Reclassification of the cash flow hedge reserve arising from issuer substitution - 200,909 Other reclassifications of the cash flow hedge reserve to profit or loss for the year 20,144-2,865 Reclassifications of other components of comprehensive income to profit or loss for the year (D) 20, ,044 Tax effect of reclassifications of other components of comprehensive income to profit or loss for the year (E) - - Total other comprehensive income/(loss) for the year (F=B+C+D+E) 135, ,969 of which attributable to discontinued operations 91, ,223 Comprehensive income for the year (A+F) 1,177,261 1,373,344 Of which attributable to owners of the parent 1,062,383 1,086,500 Of which attributable to non-controlling interests 114, ,844 Annual Report
120 STATEMENT OF CHANGES IN CONSOLIDATED EQUITY EQUITY ATTRIBUTABLE TO OWNERS OF THE PARENT 000 Issued capital Cash flow hedge reserve Net investment hedge reserve Reserve for translation differences on translation of assets and liabilities of consolidated companies denominated in functional currencies other than the euro Reserve for translation of investments accounted for using the equity method denominated in functional currencies other than the euro Other reserves and retained earnings Profit/(Loss) for the year after interim dividend Total EQUITY ATTRIBUTABLE TO NON-CONTROLLING INTERESTS TOTAL EQUITY ATTRIBUTABLE TO OWNERS OF THE PARENT AND NON- CONTROLLING INTERESTS Balance as at 31 December ,027-93,707-36, ,752-5,557 2,210, ,108 2,999,735 1,559,981 4,559,716 Comprehensive income for the year - -62, ,101 1, , ,245 1,086, ,844 1,373,344 Owner transactions and other changes Autostrade per l'italia SpA's final dividend ( per share) , , ,252 Transfer of profit/(loss) for previous year to retained earnings , , Autostrade per l'italia SpA's interim dividend ( per share) , , ,793 Dividends paid by other Group companies to non-controlling shareholders ,422-18,422 Share-based incentive plans ,942-2, ,979 Change in reserves due to transactions under common control - 1,565-12,513-1,040,099-1,054,177-1,054,177 Change in scope of consolidation, returns of capital to noncontrolling shareholders and other minor changes ,130-79,087 Balance as at 31 December , ,890-36, ,138-3,652 3,613, ,452 4,368,352 1,749,310 6,117,662 Comprehensive income for the year - 44,691-46, ,893 1,062, ,878 1,177,261 Owner transactions and other changes Autostrade per l'italia SpA's final dividend ( per share) , , ,127 Transfer of profit/(loss) for previous year to retained earnings , , Autostrade per l'italia SpA's interim dividend ( per share) , , ,348 Dividends paid by other Group companies to non-controlling shareholders ,734-65,734 Share-based incentive plans ,995-1, ,025 Change in scope of consolidation following distribution of the special dividend in kind, including the effect on current tax income/(expense) , ,205 3,168-1,332, ,153,529-1,474,106-2,627,635 Distribution of available reserves ,101, ,101, ,101,312 Reclassifications and other minor changes , ,282 23,282 - Balance as at 31 December , , ,356, ,545 2,390, ,660 2,737,
121 CONSOLIDATED STATEMENT OF CASH FLOWS 000 Note 2017 of which related party transactions 2016 of which related party transactions CASH FLOWS FROM (USED IN) OPERATING ACTIVITIES Profit for the year 1,041, ,375 Adjusted by: Amortisation and depreciation 605, ,921 Operating change in provisions 12,179 77,862 Financial expenses from discounting of provisions for construction services required by contract and other provisions Impairments/(Reversal of impairment losses) on non-current financial assets and investments accounted for at cost or fair value Share of (profit)/loss of investees accounted for using the equity method ,113 61, , ,743 12,814 Impairment losses/(reversal of impairment losses) and adjustments of current and non-current assets -76,948-26,479 (Gain)/Loss on sale of non-current assets Net change in deferred tax (assets)/liabilities through profit or loss 130,748 55,720 Other non-cash costs (income) -51, ,499 Change in working capital and other changes 230, , , ,101 Net cash generated from/(used in) operating activities [a] 9.1 1,912,812 1,847,529 CASH FLOWS FROM (USED IN) INVESTING ACTIVITIES Investment in assets held under concession , ,111 Purchases of property, plant and equipment ,691-46,945 Purchases of other intangible assets ,150-39,817 Government grants related to assets held under concession 1,497 6,291 Increase in financial assets deriving from concession rights (related to capital expenditure) 1,593 76,079 Proceeds from sales of property, plant and equipment, intangible assets and unconsolidated investments Cash and cash equivalents of consolidated companies transferred as a result of distribution of special dividend in kind 1,105 4, ,046 - Proceeds from sales of consolidated investments, net of cash and cash equivalents transferred - 1,554,717 1,554,717 Net change in other non-current assets 7,904-9,860 Net change in current and non-current financial assets -33,096-75,822 Net cash generated from/(used in) investing activities [b] , ,151 CASH FLOWS FROM (USED IN) FINANCING ACTIVITIES Distribution of reserves to the parent ,101,312 - Dividends paid -777, ,451 Return of capital to non-controlling shareholders - -6,316 Repayment of loans from parent ,100,572-1,100,572 Issuance of bonds 130, ,385 Increase in medium/long term borrowings (excluding finance lease liabilities) - 4,859 Redemption of bonds -505,566-90,730 Repayments of medium/long term borrowings (excluding finance lease liabilities) , ,381 Payment of finance lease liabilities Net change in other current and non-current financial liabilities 969, , , ,206 Net cash generated from/(used in) financing activities [c] 9.1-1,448,343-1,898,573 Net effect of foreign exchange rate movements on net cash and cash equivalents [d] 9,702 33,868 Increase/(Decrease) in cash and cash equivalents [a+b+c+d] NET CASH AND CASH EQUIVALENTS AT BEGINNING OF YEAR , ,975 3,419,541 2,811,566 NET CASH AND CASH EQUIVALENTS AT END OF YEAR 2,930,623 3,419,541 Annual Report
122 ADDITIONAL INFORMATION ON THE STATEMENT OF CASH FLOWS 000 Note Income taxes paid 195, ,573 Interest and other financial income collected 35,785 41,107 Interest expense and other financial expenses paid 533, ,248 Dividends received ,430 2,295 Foreign exchange gains collected Foreign exchange losses incurred RECONCILIATION OF NET CASH AND CASH EQUIVALENTS 000 Note NET CASH AND CASH EQUIVALENTS AT BEGINNING OF YEAR 3,419,541 2,811,566 Cash and cash equivalents 7.8 3,223,793 2,786,098 Bank overdrafts repayable on demand Intercompany current account payables due to related parties ,768-13,522 Cash and cash equivalents related to discontinued operations ,516 39,021 NET CASH AND CASH EQUIVALENTS AT END OF YEAR 2,930,623 3,419,541 Cash and cash equivalents 7.8 2,938,061 3,223,793 Bank overdrafts repayable on demand Intercompany current account payables due to related parties , ,768 Cash and cash equivalents related to discontinued operations , ,
123 Notes 1. Introduction The core business of the Autostrade per l Italia Group ( the Group ) is the operation of motorways under concessions granted by the relevant authorities. Under the related concession arrangements, the Group s operators are responsible for the construction, management, improvement and upkeep of motorway infrastructure. Further information on the Group s concession arrangements is provided in note 4 Concessions. The Parent Company, Autostrade per l Italia SpA ( Autostrade per l Italia, the Company or the Parent Company ) is a public limited company incorporated in The Company s core business is the operation of Italian motorways under a concession granted by the Ministry of Infrastructure and Transport, which assumed the role of Grantor previously fulfilled by ANAS SpA (Italy s Highways Agency) from 1 October The Parent Company s registered office is at Via Bergamini, 50 in Rome and it does not have branch offices. The duration of the Company is until 31 December As at 31 December 2017, 88.06% of the Company s share capital is held by Atlantia SpA (also referred to as "Atlantia"), which is listed on the screen-based trading system (Mercato Telematico Azionario) operated by Borsa Italiana SpA, and is responsible for the management and coordination of the Company. At the date of preparation of these consolidated financial statements, Sintonia SpA is the shareholder that holds a relative majority of the issued capital of Atlantia SpA. Neither Sintonia SpA nor its direct parent company Edizione Srl, exercise management and coordination of Atlantia. In addition, the sale of 11.94% of Autostrade per l'italia to minority shareholders was completed in 2017, as described in section 2.8.1, Autostrade per l'italia SpA s ownership structure, in the Report on Operations accompanying these consolidated financial statements. These consolidated financial statements as at and for the year ended 31 December 2017 were approved by the Company s Board of Directors at its meeting of 1 March Basis of preparation of the consolidated financial statements The consolidated financial statements as at and for the year ended 31 December 2017 are based on the assumption that the Parent Company and consolidated companies are going concerns. They have been prepared in compliance with articles 2 and 3 of Legislative Decree 38/2005 and International Financial Reporting Standards (IFRS) issued by the International Accounting Standards Board and endorsed by the European Commission. These standards reflect the interpretations issued by the International Financial Reporting Interpretations Committee (IFRIC), in addition to previous International Accounting Standards (IAS) and interpretations issued by the Standard Interpretations Committee (SIC) and still in force at the end of the reporting period. For the sake of simplicity, all the above standards and interpretations are hereinafter referred to as IFRS. Moreover, the measures introduced by the CONSOB, in application of paragraph 3 of article 9 of Legislative Decree 38/2005, relating to the preparation of financial statements, have also been taken into account. The consolidated financial statements consist of the statement of financial position, the income statement, the statement of comprehensive income, the statement of changes in equity, the statement of cash flows and these notes, applying the historical cost convention, with the exception of those items that are required by IFRS to be recognised at fair value, as explained in the accounting policies for individual items described in note 3, Accounting standards and policies applied. The statement of financial position is based on the format that separately discloses current and non-current assets and liabilities. The income statement is classified by Annual Report
124 nature of expense, whilst the statement of cash flows has been prepared in application of the indirect method. IFRS have been applied in accordance with the indications provided in the Conceptual Framework for Financial Reporting, and no events have occurred that would require exemptions pursuant to paragraph 19 of IAS 1. CONSOB Resolution of 27 July 2006 requires that, in addition to the specific requirements of IAS 1 and other IFRS, financial statements must, where material, include separate sub-items providing (i) disclosure of amounts deriving from related party transactions; and, with regard to the income statement, (ii) separate disclosure of income and expenses deriving from events and transactions that are non-recurring in nature, or transactions or events that do not occur on a frequent basis in the normal course of business. As in 2016, no non-recurring, atypical or unusual transactions, having a material impact on the Group s income statement and statement of financial position, were entered into in 2017, either with third or related parties. There were no non-recurring events and/or transactions in In 2016, on the other hand, the Autostrade per l Italia completed an issuer substitution, taking Atlantia s place as the issuer of a number of bonds. This had a significant impact on the Group s operating results and financial position in that year. More details are provided in note 8.17, Material non-recurring transactions, in the consolidated financial statements as at and for the year ended 31 December The consolidated financial statements thus show, for 2016 alone, the impact of nonrecurring transactions that took place in that year, and material amounts relating to related party transactions in the two comparative periods. Amounts in the Company s financial statements and in the notes are shown in thousands of euros, unless otherwise stated. The euro is the functional currency of the Parent Company and a number of its subsidiaries and the presentation currency for these consolidated financial statements. Each item in the financial statements is compared with the corresponding amount for the previous year. The comparative amounts have not been restated and/or reclassified with respect to those presented in the consolidated financial statements as at and for the year ended 31 December 2016, given that there have not been any events or material changes to the accounting standards applied that have resulted in the need to adjust or reclassify prior year amounts. 3. Accounting standards and policies applied A description follows of the more important accounting standards and policies employed by the Group for its consolidated financial statements as at and for the year ended 31 December These accounting standards and policies are consistent with those applied in preparation of the consolidated financial statements for the previous year, as no new standards, interpretations, or amendments to existing standards became effective in 2017, having a material effect on the Autostrade per l Italia Group's consolidated financial statements. The following amendments to existing standards and interpretations were applicable from 1 January 2017: a) IAS 7 Statement of Cash Flows. The amendments has introduced a requirement to provide a specific disclosure enabling the users of financial statements to assess changes in liabilities arising from financing activities, with the introduction of a specific reconciliation; b) IAS 12 Income Taxes. The amendments to this standard have clarified how to account for deferred tax assets on debt instruments measured at fair value, and how to estimate future taxable profit. 124
125 Property, plant and equipment Property, plant and equipment is stated at cost. Cost includes expenditure that is directly attributable to the acquisition of the items and financial expenses incurred during construction of the asset. As permitted by IFRS 1, assets acquired through business combinations prior to 1 January 2004 are stated at previous amounts, as determined under Italian GAAP for those business combinations and representing deemed cost. The cost of assets, determined as indicated above, with finite useful lives is systematically depreciated on a straight-line basis applying rates that represent the expected useful life of the asset. Each component of an asset with a cost that is significant in relation to the total cost of the item, and that has a different useful life, is accounted for separately. Land, even if undeveloped or annexed to residential and industrial buildings, is not depreciated as it has an indefinite useful life. Investment property, which is held to earn rentals or for capital appreciation, or both, is recognised at cost measured in the same manner as property, plant and equipment. The relevant fair value of such assets has also been disclosed. The bands of annual rates of depreciation used in 2017 are shown in the table below by asset class. Property. plant and equipment Rate of depreciation Buildings 2.5% % Plant and machinery 10% - 33% Industrial and business equipment 4.5% - 33% Other assets 8.6% % Assets acquired under finance leases are initially accounted for as property, plant and equipment, and the underlying liability recorded in the balance sheet, at an amount equal to the relevant fair value or, if lower, the present value of the minimum payments due under the contract. Lease payments are apportioned between the interest element, which is charged to the income statement as incurred, and the capital element, which is deducted from the financial liability. Property, plant and equipment is tested for impairment, as described below in the relevant note, whenever events or changes in circumstances indicate that the carrying amount may not be recoverable. Property, plant and equipment is derecognised on disposal. Any gains or losses (determined as the difference between disposal proceeds, less costs to sell, and the carrying amount of the asset) are recognised in profit or loss in the period in which the asset is sold. Intangible assets Intangible assets are identifiable assets without physical substance, controlled by the entity and from which future economic benefits are expected to flow, and purchased goodwill. Identifiable intangible assets are those purchased assets that, unlike goodwill, can be separately distinguished. This condition is normally met when the intangible asset: (i) arises from a legal or contractual right, or (ii) is separable, meaning that it may be sold, transferred, licensed or exchanged, either individually or as an integral part of other assets. The asset is controlled by the entity if the entity has the ability to obtain future economic benefits from the asset and can limit access to it by others. Internally developed assets are recognised as assets to the extent that: (i) the cost of the asset can be measured reliably; (ii) the entity has the intention, the available financial resources and the technical expertise to complete the asset and either use or sell it; (iii) the entity is able to demonstrate that the asset is capable of generating future economic benefits. Intangible assets are stated at cost which, apart from concession rights, is determined in the same manner as the cost of property, plant and equipment. The cost of concession rights is recovered in the form of payments received from road users and may include one or more of the following: Annual Report
126 a) the fair value of construction services and/or improvements carried out on behalf of the Grantor (measured as described in the note on "Construction contracts and services in progress") less finance-related amounts, consisting of (i) the amount funded by government grants, (ii) the amount that will be unconditionally paid by replacement operators on termination of the concession (so-called "takeover rights"), and/or (iii) any minimum level of tolls or revenue guaranteed by the Grantor. In particular, the following give rise to intangible assets deriving from concession rights: 1) rights received as consideration for specific obligations to provide construction services for road widening and improvement for which the operator does not receive additional economic benefits. These rights are initially recognised at the fair value of the construction services to be provided in the future (equal to their present value, less the portion covered by grants, and excluding any financial expenses that may be incurred during provision of the services), with a contra entry of an equal amount in Provisions for construction services required by contract, accounted for in liabilities in the statement of financial position. In addition to the impact of amortisation, the initial value of the rights changes over time as a result of periodic reassessment of the fair value of the part of the construction services still to be rendered at the end of the reporting period (equal to their present value, less the portion covered by grants, and excluding any financial expenses that may be incurred during provision of the services); 2) rights received as consideration for construction and/or upgrade services rendered for which the operator receives additional economic benefits in the form of specific toll increases and/or significant increases in the expected number of users as a result of expansion/upgrade of the infrastructure; 3) rights to infrastructure constructed and financed by service area concession holders which have reverted free of charge to Group companies on expiry of the related concessions; b) rights acquired from third parties, to the extent costs were incurred to acquire concessions from the Grantor or from third parties (the latter relating to the acquisition of control of a company that already holds a concession). Concession rights, on the other hand, are amortised over the concession term in a pattern that reflects the estimated manner in which the economic benefits embodied in the right are consumed. Amortisation rates are, consequently, determined taking any significant changes in traffic volumes during the concession term into account. Amortisation is charged from the date on which economic benefits begin to accrue. In contrast, amortisation of other intangible assets with finite useful lives begins when the asset is ready for use, in relation to their residual useful lives. The bands of annual rates of amortisation used in 2017 are shown in the table below by asset class. Intangible assets Rate of amortisation Concession rights On the commencement of generation of economic benefits for the entity, based on the residual term of the concession and, where significant, traffic projections. Development costs 4.8% % Industrial patents and intellectual property rights 6.4% - 55% Licences and similar rights 7.7% % Other assets 3.3% % 126
127 Intangible assets are tested for impairment, as described below in the note on impairments and reversals, whenever events or changes in circumstances indicate that the carrying amount may not be fully recoverable. Gains and losses on the disposal of intangible assets are determined as the difference between the disposal proceeds, less costs to sell, and the carrying amount of the asset and then recognised in profit or loss in the period in which the asset is disposed of. Business combinations and goodwill Acquisitions of companies and business units are accounting for using the acquisition method, as required by IFRS 3. For this purpose, identifiable assets liabilities acquired through business combinations are measured at their fair value at the acquisition date. The cost of an acquisition is measured as the fair value, at the date of exchange, of the assets acquired, liabilities assumed and any equity instruments issued by the Group in exchange for control. Ancillary costs directly attributable to the business combination are recognised as an expense in the income statement when incurred. Goodwill is initially measured as the positive difference between 1) the acquisition cost, plus both the fair value at the acquisition date of any previous non-controlling interests held in the acquiree and non-controlling interests held by third parties in the acquiree (at fair value or prorated to the current net asset value of the acquiree), and 2) the fair value of net assets acquired. The goodwill, as measured on the date of acquisition, is allocated to each of the substantially independent cash generating units or groups of cash generating units which are expected to benefit from the synergies of the business combination. A negative difference between the cost of the acquisition, as increased by the above components, and the fair value of the net assets acquired is recognised as income in profit or loss in the year of acquisition. Goodwill on acquisitions of non-controlling interests is included in the carrying amount of the relevant investments. If the Group is not in possession of all the information necessary to determine the fair value of the assets acquired and the liabilities assumed, these are recognised on a provisional basis in the year in which the business combination is completed and retrospectively adjusted within twelve months of the acquisition date. After initial recognition, goodwill is no longer amortised and is carried at cost less any accumulated impairment losses, determined as described in the note on impairment testing. IFRS 3 was not applied retrospectively to acquisitions prior to 1 January As a result, the carrying amount of goodwill on these acquisitions is that determined under Italian GAAP, which is the net carrying amount at this date, subject to impairment testing and the recognition of any impairment losses. Acquisitions or disposals of companies and/or business units under common control are treated, in accordance with IAS 1 and IAS 8, on the basis of their economic substance, with confirmation of the fact that the purchase consideration is determined on the basis of fair value and that added value is generated for all the parties involved, resulting in significant measurable changes in the cash flows generated by the investments transferred before and after the transaction. In this regard: a) if both requirements to be confirmed are met, such acquisitions of companies and/or business units are accounted for in accordance with IFRS 3, using the same treatment previously described for similar transactions with third parties. In such cases, the seller recognises any difference between the carrying amount of the assets and liabilities transferred and the related purchase consideration in profit or loss; b) in the other cases, the acquirer recognises the assets and liabilities transferred at the same carrying amounts at which they were accounted for in the financial statements of the seller prior to the transaction, recognising any difference with respect to the cost of the acquisition in equity. Accordingly, the seller recognises the difference between the carrying amount of the assets and liabilities transferred and the agreed purchase consideration in equity. In Annual Report
128 128 addition, income and expenses recognised in previous years in "other comprehensive income" in the statement of comprehensive income (relating, for example, to the cash flow hedge reserve or the reserve for translation of assets and liabilities denominated in functional currencies other than the euro) and relating to the assets and liabilities transferred are reclassified directly in the Group s equity. Investments Investments in associates and joint ventures are accounted for using the equity method. The Group s share of post-acquisition profits or losses is recognised in the income statement for the accounting period to which they relate, with the exception of the effects deriving from other changes in the equity of the investee, excluding any owner transactions, when the Group s share is recognised directly in comprehensive income. In addition, when measuring the value of the investment, this method is also used to recognise the fair value of the investee s assets and liabilities and any goodwill, determined with reference to the acquisition date. Such assets and liabilities are subsequently measured in future years on the basis of the standards and accounting policies described in this note. Provisions are made to cover any losses of an associate or joint venture exceeding the carrying amount of the investment, to the extent that the shareholder is required to comply with actual or constructive obligations to cover such losses. Investments in unconsolidated subsidiaries and other companies, which qualify as available-forsale financial instruments as defined by IAS 39, are initially accounted for at cost at the settlement date, in that this represents fair value, plus any directly attributable transaction costs. After initial recognition, these investments are measured at fair value, to the extent reliably determinable, through the statement of comprehensive income and hence in a specific equity reserve. On realisation or recognition of an impairment loss in the income statement, the accumulated gains and losses in that reserve are reclassified to the income statement. Impairment losses, identified as described below in the note on Impairment of assets and reversals (impairment testing), are reversed to other comprehensive income in the event the circumstances giving rise to the impairment cease to exist. When fair value cannot be reliably determined, investments, classified as available-for-sale, are measured at cost less any impairment losses. In this case impairment losses may not be reversed. Construction contracts and services in progress Construction contracts are accounted for on the basis of a contract's revenue and costs that can be reliably estimated with reference to the stage of completion of the contract, in accordance with the percentage of completion method, as determined by a survey of the works carried out or based on the ratio of costs incurred to total estimated costs. Contract revenue is allocated to the individual reporting periods in proportion to the stage of contract completion. Any positive or negative difference between contract revenue and any advance payments received is recognised in assets or liabilities, taking account of any impairments, in order to reflect the risks linked to the inability to recover the value of work performed on behalf of customers. In addition to contract payments, contract revenue includes variations, price reviews and claims to the extent that they can be reliably determined. Expected losses are recognised immediately in profit or loss, regardless of the stage of contract completion. Revenue from construction and/or upgrade services provided to the Grantor and relating to the concessions held by certain Group companies, are recognised on a percentage of completion basis. Construction and/or upgrade service revenues, representing the consideration for services provided, are measured at fair value, calculated on the basis of the total costs incurred (consisting primarily of the cost of materials and external services, relevant employee benefits and financial expenses, the latter only in the case of construction and/or upgrade services for which the operator receives additional economic benefits), plus any arm's length profits realised on construction services provided by Group entities (in that they represent the fair value of the services). The double entry of construction and /or upgrade service revenue is represented by
129 financial assets deriving from concession rights and/or grants, or by intangible assets deriving from concession rights, as explained in the relevant note. Inventories Inventories, primarily consisting of stocks and spare parts used in the maintenance and assembly of plant, are measured at the lower of purchase or conversion costs and net realisable value obtained on their sale in the ordinary course of business. The purchase cost is determined using the weighted average cost method. Receivables and payables Receivables are initially recognised at fair value of the underlying asset, net of any directly attributable transaction proceeds, and subsequently measured at amortised cost, using the effective interest method, less any allowance for bad debts. The amount of the allowance is based on the present value of expected future cash flows. These cash flows take account of expected collection times, estimated realisable value, any guarantees received, and the expected costs of recovering amounts due. Impairment losses are reversed in future periods if the circumstances that resulted in the loss no longer exist. In this case, the reversal is accounted for in the income statement and may not in any event exceed the amortised cost of the receivable had no previous impairment losses been recognised. Payables are initially recognised at cost, which corresponds to the fair value of the liability, after any directly attributable transaction costs. After initial recognition, payables are recognised at amortised cost, using the effective interest method. Trade receivables and payables, which are subject to normal commercial terms and conditions, are not discounted to present value. Cash and cash equivalents Cash and cash equivalents are recognised at face value. They include highly liquid demand deposits or very short-term instruments of excellent quality, which are subject to an insignificant risk of changes in value. Derivative financial instruments All derivative financial instruments are recognised at fair value at the end of the year. As required by IAS 39, derivatives are designated as hedging instruments when the relationship between the derivative and the hedged item is formally documented and the periodically assessed effectiveness of the hedge is high and ranges between 80% and 125%. Changes in the fair value of cash flow hedges hedging assets and liabilities (including those that are pending and highly likely to arise in the future) are recognised in the statement of comprehensive income. The gain or loss relating to the ineffective portion is recognised in profit or loss. Changes in the value of fair value hedged assets or liabilities are recognised in profit or loss for the period. Analogously, the hedged assets and liabilities are restated at fair value through profit or loss. Since derivative contracts deemed net investment hedges in accordance with IAS 39, because they were concluded to hedge the risk of unfavourable movements in the exchange rates used to translate net investments in foreign operations, are treated as cash flow hedges, the effective portion of fair value gains or losses on the derivatives is recognised in other comprehensive income, thus offsetting changes in the foreign currency translation reserve for net investments in foreign operations. Accumulated fair value gains and losses, recognised in the net investment hedge reserve, are reclassified from comprehensive income to profit or loss on the disposal or partial disposal of the foreign operation. Changes in the fair value of derivative instruments that do not qualify for hedge accounting under IAS 39 are recognised in profit or loss. Annual Report
130 Other financial assets and liabilities Other financial assets that Group companies intend and are able to hold to maturity and other financial liabilities are recognised at the fair value of the purchase consideration at the settlement date, with assets being increased and liabilities being reduced by transaction costs directly attributable to the purchase of the assets or issuance of the liabilities. After initial recognition, financial assets are measured at amortised cost using the original effective interest method. Financial assets and liabilities are derecognised when, following their sale or settlement, the Group is no longer involved in their management and has transferred all risks and rewards of ownership. If there is a modification of one or more terms of an existing financial instrument (including as a result of its novation), it is necessary to conduct a qualitative and quantitative analysis in order to assess whether or not the modification is substantial with respect to the existing terms. In the event of non-substantial modifications, the instrument continues to be accounted for at the previously recognised amortised cost, and the instrument s effective interest rate is remeasured on a prospective basis. If the modifications are substantial, the existing instrument is derecognised and the fair value of the new instrument is recognised, with the related difference recognised in profit or loss. Financial assets held for trading are recognised and measured at fair value through profit or loss. Other categories of financial asset classified as available-for-sale financial instruments are recognised and measured at fair value through comprehensive income and, consequently, in a specific equity reserve. The financial instruments in these categories have, to date, never been reclassified. Financial assets also include the following receivables arising from assets held under concession: a) takeover rights, being the amount that will be unconditionally paid by an incoming operator on termination of the concession; b) the present value of minimum toll revenue guaranteed by the Grantor, representing an unconditional right to receive cash payments for construction services performed, regardless of the extent to which the public uses the service; c) amounts due from public entities as grants or similar compensation relating to the construction of infrastructure (construction and/or upgrade services). Fair value measurement and the fair value hierarchy For all transactions or balances (financial or non-financial) for which an accounting standard requires or permits fair value measurement and which fall within the application of IFRS 13, the Group applies the following criteria: a) identification of the unit of account, defined as the level at which an asset or a liability is aggregated or disaggregated in an IFRS for recognition purposes; b) identification of the principal market or, in the absence of such a market, the most advantageous market in which the particular asset or liability to be measured could be traded; unless otherwise indicated, it is assumed that the market currently used coincides with the principal market or, in the absence of such a market, the most advantageous market; c) definition for non-financial assets of the highest and best use of the asset; unless otherwise indicated, highest and best use is the same as the asset's current use; d) definition of valuation techniques that are appropriate for the measurement of fair value, maximising the use of relevant observable inputs that market participants would use when determining the price of an asset or liability; e) determination of the fair value of assets, based on the price that would be received to sell an asset, and of liabilities and equity instruments, based on the price paid to transfer a liability in an orderly transaction between market participants at the measurement date; f) inclusion of non-performance risk in the measurement of assets and liabilities and above all, in the case of financial instruments, determination of a valuation adjustment when measuring fair value to include, in addition to counterparty risk (CVA - credit valuation adjustment), the own credit risk (DVA - debit valuation adjustment). 130
131 Based on the inputs used for fair value measurement, a fair value hierarchy for classifying the assets and liabilities measured at fair value, or the fair value of which is disclosed in the financial statements, has been identified: a) level 1: includes quoted prices in active markets for identical assets or liabilities; b) level 2: includes inputs other than quoted prices included within level 1 that are observable, such as the following: i) quoted prices for similar assets or liabilities in active markets; ii) quoted prices for similar or identical assets or liabilities in markets that are not active; iii) other observable inputs (interest rate and yield curves, implied volatilities and credit spreads); c) level 3: unobservable inputs used to the extent that observable data is not available. The unobservable inputs used for fair value measurement should reflect the assumptions that market participants would use when pricing the asset or liability being measured. Definitions of the fair value hierarchy level in which individual financial instruments measured at fair value have been classified, or for which the fair value is disclosed in the financial statements, are provided in the notes to individual components of the financial statements. There are no assets or liabilities classifiable in level 3 of the fair value hierarchy. No transfers between the various levels of the fair value hierarchy took place during the year. The fair value of derivative financial instruments is based on expected cash flows that are discounted at rates derived from the market yield curve at the measurement date and the curve for listed credit default swaps entered into by the counterparty and Group companies, to include the non-performance risk explicitly provided for by IFRS 13. In the case of medium/long-term financial instruments, other than derivatives, where market prices are not available, the fair value is determined by discounting expected cash flows, using the market yield curve at the measurement date and taking into account counterparty risk in the case of financial assets and the own credit risk in the case of financial liabilities. Provisions for construction services required by contract and other provisions Provisions for construction services required by contract relate to specific contractual obligations having regard to motorway expansion and upgrading for which the operator receives no additional economic benefit. Since the performance of such obligations is treated as part of the consideration for the concession, an amount equal to the fair value of future construction services (equal to the present value of the services, less the portion covered by grants, and excluding any financial expenses that may be incurred during provision of the services) is initially recognised. The double entry is concession rights for works without additional economic benefits. The fair value of the residual liability for future construction services (equal to their present value, less the portion covered by grants, and excluding any financial expenses that may be incurred during provision of the services) is periodically reassessed and changes to the measurement of the liabilities (such as, for example, changes to the estimated cash outflows necessary to discharge the obligation, a change in the discount rate or a change in the construction period) are recognised as a matching increase or reduction in the corresponding intangible asset. Any increase in provisions to reflect the time value of money is recognised as a financial expense. Other provisions are made when: (i) the Group has a present (actual or constructive) obligation as a result of a past event; (ii) it is probable that an outflow of resources will be required to settle the obligation; and (iii) the related amount can be reliably estimated. Provisions are measured on the basis of management s best estimate of the expenditure required to settle the present obligation by the Company, or to transfer it to third parties at the end of the reporting period. If the discount to present value is material, provisions are determined by discounting future expected cash flows to their present value at a rate that reflects the market view of the time value of money. Subsequent to the computation of present value, the increase in provisions over time is recognised as a financial expense. Provisions for the repair and replacement of motorway infrastructure cover the liability represented by the contractual obligation to repair and replace motorway infrastructure, as Annual Report
132 required by the concession arrangements entered into by the Group s motorway operators and the respective grantors. These provisions are calculated on the basis of the usage and the wear and tear of motorways at the end of the reporting period, taking into account, if material, the time value of money. Routine maintenance costs are, in contrast, recognised in the income statement when incurred and are not, therefore, included in the provisions. The provisions for cyclical maintenance include the estimated cost of a single cycle and are determined separately for each category of infrastructure (viaducts, flyovers, tunnels, safety barriers, motorway surfaces). The following process is applied for each category, based on specific technical assessments, the available information, the current state of motorway traffic and existing materials and technologies: a) the duration of the cycle linked to the repair or replacement work is estimated; b) the serviceability of the infrastructure is assessed, classifying the various types of intervention based on the state of repair of the infrastructure and the number of years remaining until the scheduled maintenance work; c) the cost for each category is determined, based on the verifiable and documented evidence available at the time and comparable work; d) the total value of the work included in the relevant cycle is determined; e) the provisions at the reporting date are calculated, allocating the cost to the income statement in relation to the number of years remaining until the date of the scheduled maintenance work, in line with the above classification based on the state of repair of the infrastructure, discounting the resulting amount to present value at the measurement date using an interest rate with a duration in line with that of the expected cash flows. The above effects are recognised in the following income statement items: a) the Operating change in provisions, reflecting the impact of the revision of estimates as a result of technical assessments (the value of the works to be carried out and the expected timing of such works) and the change in the discount rate used compared with the previous year; b) Financial expenses from discounting of provisions, reflecting the time value of money, calculated on the basis of the value of the provisions and the interest rate used to discount the provisions to present value at the prior year reporting date. When the cost of the works is actually incurred, the cost is recognised by nature and the item Operating change in provisions reflects use of the provisions previously made, as described in point e) above. Employee benefits Short-term employee benefits, provided during the period of employment, are recognised on an accruals basis as the accrued liability at the end of the reporting period. Liabilities deriving from other medium/long-term employee benefits are recognised in the vesting period, less any plan assets and advance payments made. They are determined on the basis of actuarial assumptions and, if material, recognised on an accruals basis in line with the period of service necessary to obtain the benefit. Medium/long-term post-employment benefits in the form of defined benefit plans are recognised at the amount accrued at the end of the reporting period. Post-employment benefits delivered at the same time or after the termination of employment in the form of defined benefit plans are recognised in the vesting period, less any plan assets and advance payments made. Such defined benefit plans primarily regard the obligation as determined on the basis of actuarial assumptions and recognised on an accruals basis in line with the period of service necessary to obtain the benefit. The obligation is calculated by independent 132
133 actuaries. Any resulting actuarial gain or loss is recognised in full in other comprehensive income in the period to which it relates. Non-current assets held for sale, assets and liabilities included in disposal groups or held for distribution to shareholders and/or related to discontinued operations Where the carrying amount of non-current assets held for sale, or of assets and liabilities included in disposal groups or held for distribution to shareholders and/or related to discontinued operations is to be recovered primarily through sale rather than through continued use, these items are presented separately in the statement of financial position. Immediately prior to being classified as held for sale or for distribution, each asset and liability is recognised under the specific IFRS applicable and subsequently accounted for at the lower of the carrying amount and fair value. Any impairment losses are recognised immediately in the income statement. Disposal groups or operations held for sale or for distribution are recognised in profit or loss as discontinued operations provided when the following conditions are met: a) they represent a major line of business or geographical area of operation; b) they are part of a single coordinated plan to dispose of a separate major line of business or geographical area of operation; c) they are subsidiaries acquired exclusively with a view to resale. The economic impact after tax gains and losses resulting from the management and sale or distribution of such operations, are recognised as one amount in profit or loss also with reference to the comparative period. Revenue Revenue is recognised when the fair value can be reliably measured and it is probable that the economic benefits associated with the transactions will flow to the Group. Depending on the type of transaction, revenue is recognised on the basis of the following specific criteria: a) toll revenue is accrued with reference to traffic volumes; b) to the extent, for sales of goods, that significant risks and rewards of ownership are transferred to the buyer; c) the provision of services is prorated to percentage of completion of work, based on the previously described criteria used for construction contracts and services in progress, which also include the construction and/or upgrade services provided to grantors, in application of IFRIC 12. When service revenue cannot be reliably determined, it is only recognised to the extent that expenses are considered to be recoverable; d) rental income or royalties, on an accruals basis, based on the agreed terms and conditions of the contract. This revenue includes amounts generated by the sub-concession of retail and office space to third parties within the airports and motorway networks operated by the Group and, as they substantially equate to the lease of portions of infrastructure, are subject to IAS 17. This revenue, under existing contractual agreements, is partly dependent on the revenue earned by the sub-operator and, as a result, the related amount varies over time; e) interest income (so does interest expense) is calculated with reference to the amount of the financial asset or liability, in accordance with the effective interest method; f) dividend income is recognised when the right to receive payment is established. Government grants Government grants are accounted for at fair value when: (i) the related amount can be reliably determined and there is reasonable certainty that (ii) they will be received and that (iii) the conditions attaching to them will be satisfied. Grants related to income are accounted for in the income statement for the accounting period in which they accrue, in line with the corresponding costs. Annual Report
134 Grants received for investment in motorways and airports are accounted for as construction service revenue, as explained in the note on "Construction contracts and services work in progress". Any grants received to fund investment in property, plant and equipment are accounted for as a reduction in the cost of the asset to which they refer and contribute, in reduction to the calculation of the relative depreciation rates. Income taxes Income taxes are recognised on the basis of an estimate of the tax expense to be paid, in compliance with the regulations in force, as applicable to each Group company. Deferred tax assets and liabilities are determined on the basis of temporary differences between the carrying amounts of assets and liabilities as in the Company's books, resulting from application of the accounting policies described in note 3, and the corresponding tax bases, resulting from application of the tax regulations in force in the country relevant to each subsidiary, as follows: a) deferred tax assets are only recognised only when it is probable that future taxable profits will allow the asset to be utilised; b) deferred tax liabilities are always recognised. In 2017, the parent, Atlantia SpA, has again operated a tax consolidation arrangement in which Autostrade per l Italia and certain of its Italian-registered subsidiaries participate. Income tax payables reported under current tax liabilities in the statement of financial position, less any advance payments of taxes, also include the portion relating to IRES included in the Atlantia s tax consolidation arrangement. Any overpayments are recognised as current tax assets. Share-based payments The cost of services provided by Directors and/or employees remunerated through share-based incentive plans, and settled through the award of financial instruments, is based on the fair value of the rights at the grant date. Fair value is computed using actuarial assumptions and with reference to all characteristics, at the grant date (vesting period, any consideration due and conditions of exercise, etc.), of the rights and the plan's underlying securities. The obligation is determined by independent actuaries. The cost of these plans is recognised in profit or loss, with a contra-entry in equity, over the vesting period, based on a best estimate of the number of options that will vest. The cost of any services provided by Directors and/or employees and remunerated through sharebased payments, but settled in cash, is instead measured at the fair value of the liability assumed and recognised in profit or loss, with a contra entry in liabilities, over the vesting period, based on a best estimate of the number of options that will vest. Fair value is remeasured at the end of each reporting period until such time as the liability is settled, with any changes recognised in profit or loss. Impairment of assets and reversals (impairment testing) At the end of the reporting period, the Group tests property, plant and equipment, intangible assets, financial assets and investments for impairment. If there are indications that these assets have been impaired, the value of such assets is estimated in order to verify the recoverability of the carrying amounts and eventually measure the amount of the impairment loss. Irrespective of whether there is an indication of impairment, intangible assets with indefinite lives and those which are not yet available for use are tested for impairment at least annually, or more frequently, if an event has occurred or there has been a change in circumstances that could cause an impairment. If it is not possible to estimate the recoverable amounts of individual assets, the recoverable amount of the cash-generating unit ( CGU ) to which a particular asset belongs is estimated. This entails estimating the recoverable amount of the asset (represented by the higher of the asset's fair value less costs to sell and its value in use) and comparing it with the carrying amount. If the 134
135 recoverable amount of an asset is estimated to be less than its carrying amount, the carrying amount is reduced to its recoverable amount. In calculating value in use, expected future pre-tax cash flow is discounted using a pre-tax rate that reflects current market assessments of the cost of capital which embodies the time value of money and the risks specific to the business. In estimating an operating CGU s future cash flows, after-tax cash flows and discount rates are used because the results are substantially the same as pre-tax computations. Impairments are recognised in profit or loss in a variety of classifications depending on the nature of the impaired asset. If there are indications, at the end of the reporting period, that an impairment loss recognised in previous years has been reduced, in full or in part, the recoverability of the carrying amount is tested and any reversal of the impairment loss determined. The reversal may under no circumstances exceed the amount of the impairment loss previously recognised. Losses are reversed if the circumstances that resulted in the loss no longer exist, provided that the reversal does not exceed the cumulative impairment losses previously recognised, unless the impairment loss relates to goodwill and investments measured at cost, where the related fair value cannot be reliably determined. Estimates and judgements Preparation of financial statements in compliance with IFRS involves the use of estimates and judgements, which are reflected in the measurement of the carrying amounts of assets and liabilities and in the disclosures provided in the notes to the financial statements, including contingent assets and liabilities at the end of the reporting period. These estimates are primarily used in determining amortisation and depreciation, impairment testing of assets (including the measurement of receivables), provisions, employee benefits, the fair value of financial assets and liabilities, and deferred tax assets and liabilities. The amounts subsequently recognised may, therefore, differ from these estimates. Moreover, these estimates and judgements are periodically reviewed and updated, and the resulting effects of each change immediately recognised in the financial statements. Translation of foreign currency items The reporting package of each consolidated enterprise is prepared using the functional currency of the economy in which the enterprise operates. Transactions in currencies other than the functional currency are recognised by application of the exchange rate at the transaction date. Assets and liabilities denominated in currencies other than the functional currency are, subsequently, remeasured by application of the exchange rate at the end of the reporting period. Any exchange differences on remeasurement are recognised in profit or loss. Non-monetary assets and liabilities denominated in foreign currencies and recognised at historical cost are translated using the exchange rate at the date of the initial recognition. Translation of the liabilities, assets, goodwill and consolidation adjustments shown in the reporting packages of consolidated companies with functional currencies other than the euro is made at the closing rate of exchange, whereas the average rate of exchange is used for income statement items to the extent that they approximate the transaction date rate or the rate during the period of consolidation, if lower. All resultant exchange differences are recognised directly in comprehensive income and reclassified to profit or loss upon the loss of control of the investment and the resulting deconsolidation. Earnings per share Basic earnings per share is computed by dividing profit attributable to owners of the parent by the weighted average number of shares outstanding during the accounting period. Diluted earnings per share is computed by dividing profit attributable to owners of the parent by the above weighted average, also taking into account the effects deriving from the subscription, exercise or conversion of all potential shares that may be issued as a result of the exercise of any outstanding rights. Annual Report
136 New accounting standards and interpretations, or revisions and amendments of existing standards, that have either yet to come into effect As required by IAS 8 Accounting Policies, Changes in Accounting Estimates and Errors, this section describes new accounting standards and interpretations, and amendments of existing standards and interpretations that are already applicable, but that have either yet to come into effect at the reporting date, and that may in the future be applied in the Group s consolidated financial statements. Name of document New accounting standards and interpretations Effective date of IASB document Date of EU endorsement IFRS 9 Financial Instruments 1 January 2018 November 2016 IFRS 15 Revenue from Contracts with Customers 1 January 2018 September 2016 IFRS 16 Leases 1 January 2019 October 2017 Amendments to existing standards and interpretations Amendments to IFRS 2 Share-based Payment Annual Improvements to IFRSs: Annual Improvements to IFRSs: January 2018 Not endorsed 1 January February January 2019 Not endorsed IFRS 9 Financial Instruments In July 2014, the IASB published the final version of IFRS 9, the standard created to replace the existing IAS 39 for the classification and measurement of financial instruments. The standard introduces new rules for the classification and measurement of financial instruments, a new impairment model for financial assets and a new hedge accounting model. Classification and measurement IFRS 9 envisages a single approach for the assessment and classification of all financial assets, including those containing embedded derivatives. The classification and related measurement is driven by both the business model in which the financial asset is held and the contractual cash flow characteristics of the asset. The financial asset is measured at amortised cost subject to both of the following conditions: a) the asset is held in conjunction with a business model whose objective is to hold assets in order to collect contractual cash flows; and b) the contractual terms of the financial asset give rise on specified dates to cash flows that are solely payments of principal and interest on the principal amount outstanding. The financial asset is measured at fair value, with any changes recognised in comprehensive income, if the objectives of the business model are to hold the financial asset to collect the contractual cash flows, or to sell it. Finally, the standard envisages a residual category of financial asset measured at fair value through profit or loss, which includes assets held for trading. A financial asset meeting the conditions to be classified and measured at amortised cost may, on initial recognition, be designated as a financial asset at fair value through profit or loss, to the extent that this accounting treatment would eliminate or significantly reduce a measurement or recognition inconsistency (sometimes referred to as an accounting mismatch ) that would 136
137 otherwise arise from measuring assets or liabilities or recognising the gains and losses on them on different bases. In addition, the new standard provides that an entity may, with respect to investments in equity instruments, which consequently may not be carried and measured at amortised cost unless such instruments are shares that are not held for trading but rather for strategic reasons, make an irrevocable election on initial recognition to present changes in the fair value in comprehensive income. The new IFRS 9, on the other hand, has confirmed the provisions of IAS 39 for financial liabilities including the relative measurement at amortised cost or, in specific circumstances, at fair value through profit or loss. Finally, the standard envisages a residual category of financial asset measured at fair value through profit or loss, which includes assets held for trading. A financial asset meeting the conditions to be classified and measured at amortised cost may, on initial recognition, be designated as a financial asset at fair value through profit or loss, to the extent that this accounting treatment would eliminate or significantly reduce a measurement or recognition inconsistency (sometimes referred to as an accounting mismatch ) that would otherwise arise from measuring assets or liabilities or recognising the gains and losses on them on different bases. In addition, the new standard provides that an entity may, with respect to investments in equity instruments, which consequently may not be carried and measured at amortised cost unless such instruments are shares that are not held for trading but rather for strategic reasons, make an irrevocable election on initial recognition to present changes in the fair value in comprehensive income. The new IFRS 9, on the other hand, has confirmed the provisions of IAS 39 for financial liabilities including the relative measurement at amortised cost or, in specific circumstances, at fair value through profit or loss. As a result of the amendment approved on 12 October 2017 (and effective from 1 January 2019), it has been specified that: a) in the event of non-substantial modifications to the terms of a financial instrument, the difference between the present value of the modified cash flows (determined using the instrument s effective interest rate at the date of modification) and the carrying amount of the instruments is accounted for in profit or loss; b) a debt instrument with a prepayment option may comply with the definition of contractual cash flows alone required by IFRS 9 and, as a result, be accounted for at amortised cost or at fair value through other comprehensive income, even when the contract provides for negative compensation for the lender. The requirements of IAS 39 that have been changed are primarily: a) the reporting of changes in fair value in connection with the credit risk of certain liabilities, which IFRS 9 requires to be recognised in comprehensive income rather than in profit or loss as movements in fair value as a result of other risks; b) the elimination of the option to measure, at amortised cost, financial liabilities consisting of derivative financial instruments entailing the delivery of unlisted equity instruments. The consequence of the change is that all derivative financial instruments must now be recognised at fair value. Impairment IFRS 9 has defined a new impairment model for financial assets, with the objective of providing the users of financial statements with more useful information about an entity s expected losses. The model requires an entity to recognise expected credit losses at all times and to update the amount of expected losses recognised at each reporting date to reflect changes in the credit risk of the financial instruments. It is, therefore, no longer necessary to wait for evidence of a trigger event before testing for impairment and recognition of a credit loss. Annual Report
138 All financial instruments must be tested for impairment, with the exception of those measured at fair value through profit or loss. Hedge accounting The most important changes introduced by IFRS 9 regard: (a) the extended scope of the risks eligible for hedge accounting, to include those to which nonfinancial assets and liabilities are exposed, also permitting the designation of groups and net positions as hedged items, also including any derivatives; (b) the option of designating a financial instrument at fair value through profit or loss as a hedging instrument; (c) the alternative method of accounting for forwards and options, when included in a hedge accounting relationship; (d) changes to the method of conducting hedge effectiveness tests, following introduction of the principle of the economic relationship between the hedged item and the hedging instrument; in addition, retrospective hedge effectiveness testing is no longer required; (e) the possibility of rebalancing an existing hedge where the risk management objectives continue to be valid. IFRS 15 Revenue from Contracts with Customers IFRS 15 replaces the previous IAS 18, in addition to IAS 11, regarding contract work, and the related interpretations, IFRIC 13, IFRIC 15, IFRIC 18 and SIC 31. IFRS 15 establishes the standards to follow in recognising revenue from contracts with customers, with the exception of contracts falling within the scope of application of standards governing leases, insurance contracts and financial instruments. The new standard provides an overall framework for identifying the timing and amount of revenue to be recognised in the financial statements. Under the new standard, the entity must analyse the contract and the related accounting effects using the following steps: a) identification of the contract; b) identification of the performance obligations in the contract; c) determination of the transaction price; d) allocation of the transaction price to each identified performance obligation; e) recognition of revenue when the performance obligation is satisfied. The amount recognised as revenue by an entity must, therefore, reflect the consideration to which the entity is entitled in exchange for goods transferred to the customer and/or services rendered. This revenue is to be recognised when the entity has satisfied its performance obligations under the contract. In addition, in recognising revenue, the standard stresses the need to assess the likelihood of obtaining/collecting the economic benefits linked to the proceeds. In the case of contract work in progress, currently governed by IAS 11, the new standard introduces the requirement to recognise revenue taking into account the effect of discounting to present value resulting from the deferral of collections over time. If it is not possible to retrospectively apply the new standard, a modified approach can be used upon first-time adoption. Under this approach, the effects of application of the new standard must be recognised in opening equity at the beginning of the reporting period of first-time adoption. IFRS 16 Leases On 13 January 2016, the IASB published the final version of the new accounting standard regarding the accounting treatment for finance leases. This new standard replaces IAS 17, IFRIC 4, SIC 15 and SIC 27, and its adoption, subject to endorsement by the European Union, is required from 1 January Earlier application is permitted if IFRS 15 Revenue from Contracts with Customers has been applied. 138
139 The new accounting standard provides a single lessee accounting model for both operating and finance leases. IFRS 16 requires the lessee to recognise the leased assets in its statement of financial position, with the assets recognised and classified as a right-of-use asset (thus, in intangible assets), regardless of the nature of the leased asset, to be amortised over the life of the right. On initial recognition, the lessee recognises the right-of-use asset and the related lease liability, based on the present value of the minimum lease payments payable over the lease term. IFRS 16 also clarifies that a lessor, with regard to contracts that contain a lease component, must separate the lease components (to which IFRS 16 applies) from the non-lease components, to which other IFRS are applicable. Application of the new method of presentation is not required, in terms of significance for the lessee, when the lease term is 12 months or less or the underlying asset has a low value. In terms of the lessor, the alternative accounting models for finance or operating leases continue to be substantially applicable, depending on the nature of the contract, as currently governed by IAS 17. As a result, it will be necessary to recognise the receivable (if a finance lease) or the fixed asset (if an operating lease). Amendments to IFRS 2 Share-based Payment On 20 June 2016, the IASB published a number of amendments to IFRS 2 in order to clarify the method of accounting for cash-settled share-based payments linked to performance indicators, the classification of share-based payments settled net of tax withholdings and the method of accounting in the event of modification of share-based payment transactions from cash-settled to equity-settled. Annual Improvements to IFRSs: On 8 December 2016, the IASB published its Annual Improvements to IFRSs: cycle. The principal amendments that could be relevant to the Group regard IFRS 12 Disclosure of Interest in Other Entities. The document clarifies the scope of the standard, specifying that the disclosures required by the standard, with the exception of those in paragraphs B10-B16, also apply to investments in other entities held for sale, held for distribution or as discontinued operations in accordance with IFRS 5. Annual Improvements to IFRSs: On 12 December 2017, the IASB published its Annual Improvements to IFRSs: cycle, introducing amendments to a number of standards as part of its annual improvements process. The principal amendments that could be relevant to the Group regard: a) IFRS 3 Business Combinations, and IFRS 11 Joint Arrangements. The amendment establishes that if an entity acquires control of a business that is a joint operation, it must remeasure any previous interests in the business at fair value. In contrast, this approach does not apply to acquisitions of joint control; b) IAS 12 Income Taxes. The amendment clarifies that an entity must account for all income tax consequences of dividend payments (including payments on financial instruments classified as equity) in the same way as the transaction that generated them. They will, therefore, be recognised in the income statement, in comprehensive income or in equity. The Autostrade per l Italia Group is currently evaluating the effects of the future application of newly issued standards, as well as of revisions and amendments to existing standards. These effects cannot currently be reasonably estimated, with the exception of IFRS 9, IFRS 15 and IFRS 16, to which the following applies. With regard to the new standard, IFRS 9, the Group has proceeded with an assessment of the potential impact of application of the standard. This process has focused on the principal financial statement items that may be affected, consisting of trade receivables, financial assets deriving from concession rights, financial liabilities and derivative financial instruments. The impact of the procedures required by the new standard on the above items has been analysed and, as a result Annual Report
140 of the tests and evaluations conducted, it is not expected to have a material impact on the Autostrade per l Italia Group s consolidated financial statements. The only modification of note regards the non-substantial modifications of financial liabilities carried out by Autostrade per l Italia in 2017 and described in note 7.15, Financial liabilities. Under the new standard, these modifications would have resulted in recognition, in profit or loss, of the difference between the present value of the modified cash flows (determined using the instrument s effective interest rate at the date of the modification) and the carrying amount of the instrument at the date of the modification. This difference, estimated to be approximately 35 million before the related taxation, will be recognised in consolidated equity at 1 January 2018, representing the effect of adoption of IFRS 9. With reference to IFRS 15, the Group has substantially completed its assessment of the applicability of the new standard to the various types of existing contracts, and the potential operational and accounting effects. The assessment examined the applicability of the new standard to the concession arrangements to which Group companies are party, to the subconcessions granted for motorway service areas and retail space on motorways, and to the other important contracts to which Group companies are party. The process has resulted in the view that the concession arrangements to which Group companies are party do not fall within the scope of application of IFRS 15. As a result, the current methods of presentation, described above in these notes, are not expected to change, including the treatment of revenue from construction services and the above sub-concession arrangements, which are excluded from application of the new standard as they are governed by IAS 17 Leases, given that they are leases of specific assets. Adoption of the new standard is also not expected to result in significant changes to the way in which other important contracts are accounted for. Therefore, based on the analyses and evaluations conducted, the adoption of IFRS 15 is not expected to have a material impact on the Group s consolidated financial statements. The Group has also assessed the potential impact of the introduction of IFRS 16. The Group is not a party to significant lease arrangements as a lessee. In addition, with regard to arrangements in which Group companies are the lessor, essentially represented by sub-concession arrangements involving the lease of space used by retailers and food service providers along the motorways operated under concession, IFRS 16 has not introduced changes to the accounting treatment of lease arrangements by lessors, compared with the requirements of IAS 17. As a result, introduction of the new standard is not currently expected to have a material impact. 4. Concessions The Group s core business is the operation of motorways under concessions held by Group companies. The purpose of the concessions is the construction and operation of motorway infrastructure. Essential information regarding the concessions held by the Group companies is set out below. Further details of events of a regulatory nature, linked to the Group s concession arrangements, during the year are provided in note 10.7 Significant legal and regulatory aspects. Existing concessions establish the right for motorway operators to demand tolls from motorway users. Tolls are revised annually through a toll formula contained in the specific individual concession arrangements. On the other hand, operators have an obligation to pay concession fees, to expand and modernise the motorway infrastructure operated under the concessions, and to maintain and operate the motorways. Concessions are not automatically renewed on expiry but are publicly re-tendered in accordance with laws as may be in effect from time to time. This consequently entails the handover free of charge of all assets in a good state of repair by the 140
141 operator to the Grantor, unless the concession provides for a payment by a replacement operator of the residual carrying amount of assets to be handed over. The only changes to the motorway concessions held by the Group s Italian companies in 2017 are as follows: a) A II Addendum to Autostrade per l Italia s Single Concession Arrangement was signed on 10 July 2017, replacing the previous addendum signed on 10 December 2015, for which the related approval process had not been completed. The Addendum governs the inclusion of the Casalecchio Interchange Northern section among the operator s investment commitments in the Single Concession Arrangement. The project will involve expenditure of up to approximately 158 million, including around 2 million already incurred for design work, and almost 156 million to be paid to ANAS, which will carry out the work and then operate the infrastructure. This amount will be paid to ANAS on a stage of completion basis and under a specific agreement to be executed. The amount will then be recouped by Autostrade per l'italia through the specific K tariff component. During the approval process, the Grantor requested that the document be signed digitally. The Addendum was then signed on 22 February 2018 and will be effective once it has been approved by the Ministry of Infrastructure and Transport and the Ministry of the Economy and Finance, and once the related decree has been registered by Italy s Court of Auditors; b) On 8 September 2017, the Addendum to Tangenziale di Napoli s Single Concession Arrangement was signed. The Addendum sets out the results of the five-yearly review ( ) of the financial plan annexed to the Arrangement. During the approval process, the Grantor requested that the document be signed digitally. The Addendum was then signed on 22 February 2018 and will be effective once it has been approved by the Ministry of Infrastructure and Transport and the Ministry of the Economy and Finance, and once the related decree has been registered by Italy s Court of Auditors. There are, in any event, no changes to report regarding the concession arrangements to which the Group s other Italian companies are party, given the fact that the process of revising the financial plans of Raccordo Autostradale Valle d Aosta and Autostrada Tirrenica is still in progress. With regard to Autostrade per l Italia s concession, the Company is engaged in the implementation of a programme of investment in Major Works (including the works envisaged by the 1997 Agreement, the IV Addendum of 2002 and other investment) worth approximately 18 billion, including approximately 10.1 billion already completed as at 31 December 2017 ( 9.8 billion as at 31 December 2016). The investment programme, which forms part of the Company s financial plan, updated to December 2013, essentially regards the upgrade of existing motorways. With regard to the concession held by Autostrade Meridionali, which expired on 31 December 2012, the company is continuing to operate the relevant motorway (the A3 Naples-Salerno) under a contract extension, in accordance with the terms of the previous arrangement. The operator is currently awaiting the outcome of the dispute over the tender process that will select the new operator to take over operation of the motorway. Further information is provided in note 10.7 Significant legal and regulatory aspects. Annual Report
142 Operator Autostrade per l Italia Section of motorway Kilometres in service A1 Milan Naples A4 Milan Brescia 93.5 A7 Genoa Serravalle 50.0 A8/9 Milan lakes 77.7 A8/A26 link road 24.0 A10 Genoa Savona 45.5 A11 Florence Pisa North 81.7 A12 Genoa Sestri Levante 48.7 A12 Rome Civitavecchia 65.4 A13 Bologna Padua A14 Bologna Taranto A16 Naples Canosa A23 Udine Tarvisio A26 Genoa Gravellona Toce A27 Mestre Belluno 82.2 A30 Caserta Salerno 55.3 TOTAL 2, Dec 2038 Raccordo Autostradale Valle d Aosta A5 Aosta Mont Blanc 32.3 Expiry date Autostrade Meridionali (1) A3 Naples Salerno Dec Dec 2032 Tangenziale di Napoli Naples ring road Dec 2037 Autostrada Tirrenica A12 Livorno Civitavecchia Dec 2046 Società Italiana per azioni per il Traforo del Monte Bianco Mont Blanc tunnel Dec 2050 (1) In compliance with the concession arrangement, in December 2012 the Grantor asked Autostrade Meridionali to continue operating the motorway after 1 January 2013, in accordance with the terms and conditions of the existing arrangement, whilst awaiting the conclusion of the tender process that will select the new operator. 5. Scope of consolidation In addition to the Parent Company, Autostrade per l Italia, companies are consolidated when Autostrade per l Italia SpA exercises control as a result of its direct or indirect ownership of a majority of the voting power of the relevant entities (including potential voting rights resulting from currently exercisable options), or because, as a result of other events or circumstances that (regardless of its percentage interest in the entity) mean it has power over the investee, exposure, or rights, to variable returns from its involvement with the investee, and the ability to use its power over the investee to affect the amount of the investor's returns. Subsidiaries are consolidated using the line-by-line method and are listed in Annex 1. All entities over which control is exercised are consolidated from the date on which the Group gains control. Entities are deconsolidated from the date on which the Group ceases to exercise control, as defined above. Companies are, in part, consolidated on the basis of the specific reporting packages prepared by each consolidated company, at the end of the reporting period and in compliance with the IFRS accounting policies adopted by the Group. Companies are consolidated according to the following criteria and procedures: a) use of the line-by-line method, entailing the reporting of non-controlling interests in equity and profit or loss and the recognition of all assets, liabilities, revenues and costs, regardless of percentage ownership; b) elimination of intercompany assets, liabilities, revenues and costs, including the reversal of unrealised profits and losses on transactions between consolidated companies and recognition of the consequent deferred taxation; c) reversal of intercompany dividends and reallocation to the relevant opening equity reserves; d) netting of the carrying amount of investments in consolidated companies against the corresponding amount of equity, with any resultant positive and/or negative differences being debited/credited to the relevant balance sheet accounts (assets, liabilities and equity), as determined on the acquisition date of each investment and adjusted for subsequent variations. Following the acquisition of control, any acquisition of further interests from noncontrolling shareholders, or the sale of interests to such shareholders not resulting in the loss 142
143 of control, are accounted for as owner transactions and the related changes recognsied directly in equity; any resulting difference between the amount of the change in equity attributable to non-controlling interests and cash and cash equivalents exchanged are recognised directly in equity attributable to owners of the Parent; e) translation of the reporting packages of consolidated companies in functional currencies other than the euro applying the method prevsiously described in the policy regarding the Translation of foreign currency items, included in note 3. The exchange rates, shown below, used for the translation of reporting packages denominated in functional currencies other than the euro, were obtained from the Bank of Italy: Valute Cambio puntuale al 31 dicembre Cambio medio 2017 Cambio puntuale al 31 dicembre Cambio medio 2016 Euro/Dollaro USA (*) 1,060 1,063 1,054 1,107 Euro/Zloty polacco 4,177 4,257 4,410 4,363 Euro/Peso cileno (*) 687, , , ,477 Euro/Real brasiliano (*) 3,281 3,350 3,431 3,856 Euro/Rupia indiana (*) 69,397 71,284 71,594 74,372 (*) In relazione all'operazione di riorganizzazione sopra descritta, si precisa che ai fini della conversione dei reporting package con valute funzionali rappresentate da Dollaro USA, Peso cileno e Real brasiliano, il cambio puntuale del 2017 inserito in tabella si riferisce al tasso di cambio al 28 febbraio Inoltre, il cambio medio del 2017 utilizzato per la conversione dei reporting package con le medesime valute si riferisce al tasso di cambio medio dei primi due mesi del (**) In relazione all'operazione di riorganizzazione sopra descritta, si precisa che ai fini della conversione del reporting package con valuta funzionale rappresentata dalla Rupia indiana (AID) il cambio puntuale del 2017 inserito in tabella si riferisce al tasso di cambio al 31 marzo Inoltre, il cambio medio del 2017 utilizzato per la conversione dei reporting package con la medesima valuta si riferisce al tasso di cambio medio del primo trimestre del The scope of consolidation at 31 December 2017 has changed with respect to the scope as at 31 December 2016, following the deconsolidation of Autostrade dell Atlantico (ADA) and the related subsidiaries and of Autostrade Indian Infrastructure Development (AID). This is a result of distribution, to the parent, Atlantia, of a special dividend in kind, following completion of the Atlantia Group s restructuring launched in 2016, as described below in note 6.1, Restructuring of the Atlantia Group. In addition, the subsidiary, Autostrade Tech, completed the acquisition of control of Catterick Investments in March As a result, this company is consolidated on a line-by-line basis. Given the immaterial value of this acquisition ( 2 thousand), the disclosure required by IFRS 3 has not been provided. 6. Corporate actions 6.1 Restructuring of the Atlantia Group As previously indicated in note 6, Corporate actions, in the consolidated financial statements included in the Annual Report for 2016, as part of the restructuring of the Atlantia Group, the General Meeting of Autostrade per l Italia s shareholders held on 25 January 2017 approved the distribution, to the parent, Atlantia, of a special dividend in kind. The distribution, using available equity reserves, took the form of the transfer of the Company s investments in ADA (effective 1 March 2017) and in AID (effective 22 March 2017). These transactions are classifiable as transactions under common control. As a result, in accordance with the accounting standard applied in previous years, taking into account that the transactions merely represent a restructuring of the Group, without generating added value for any of the parties involved, resulting in significant measurable changes in the cash flows Annual Report
144 generated by the assets transferred before and after the transaction, the difference between the carrying amount of the assets and liabilities transferred and the established consideration, amounting to 1,155 million, has been recognised in Autostrade per l Italia s consolidated equity, after taking into account the related taxation. It should be noted that, for the companies involved in the above transfer, changes in the following equity reserves were, in previous years, recognised in comprehensive income (and, therefore, directly in equity): (i) Reserve for translation differences on translation of assets and liabilities of consolidated companies denominated in functional currencies other than the euro, (ii) Net investment hedge reserve and (iii) Reserve for translation of investments accounted for using the equity method denominated in functional currencies other than the euro. Generally, on losing control of a company and the net assets transferred, IFRS 10 requires the parent (in this specific case, Autostrade per l Italia) to reclassify the reserves previously recognised in comprehensive income to profit or loss. Paragraphs and B.98C of IFRS 10, however, grant the option of reclassifying the reserves directly to retained earnings if permitted by other IFRS. Based on the effective substance of the above transactions (representing, as noted above, a mere restructuring of the Group) and the procedure followed, involving direct recognition in equity of the difference between the carrying amount of the assets and liabilities transferred and the related consideration (as a transaction under common control entered into with Atlantia, as a sole shareholder, it is subject to a specific accounting treatment and, therefore, not required to generate an impact on profit or loss for the year), the provisions of above paragraphs and B.98C of IFRS 10 have been applied. As a result, the previously mentioned reserves have been reclassified directly to retained earnings, without recognition through consolidated profit or loss. 144
145 7. Notes to the consolidated statement of financial position The following notes provide information on items in the consolidated statement of financial position as at 31 December Comparative amounts as at 31 December 2016 are shown in brackets. Details of amounts in the consolidated statement of financial position deriving from related party transactions are provided in note 10.5, Related party transactions. 7.1 Property, plant and equipment - 81,099 ( 85,878 thousand) As at 31 December 2017, property, plant and equipment amounts to 81,099 thousand, compared with a carrying amount of 85,878 thousand as at 31 December The following table provides details of property, plant and equipment at the beginning and end of the period, showing the original cost and accumulated depreciation at the end of the period. 000 Cost 31 December 2017 Accumulated depreciation Carrying amount Cost 31 December 2016 Accumulated depreciation Carrying amount Property, plant and equipment 329, ,146 79, , ,059 83,862 Investment property 5,852-4,051 1,801 5,387-3,371 2,016 Total property, plant and equipment 335, ,197 81, , ,430 85,878 The following table shows amounts at the beginning and end of the period for the different categories of asset, and the related changes in CHANGES DURING THE YEAR 000 Carrying amount as at 31 December 2016 Additions Depreciation Disposals Reclassifications and other adjustments Carrying amount as at 31 December 2017 Property, plant and equipment Land Buildings Plant and machinery Industrial and business equipment Other assets Property, plant and equipment under construction and advance payments Total Investment property Land Buildings Total Total property, plant and equipment The reduction in the carrying amount of property, plant and equipment with respect to 31 December 2017, amounting to 4,779 thousand, primarily reflects a combination of depreciation for the year of 22,252 thousand and capital expenditure during the year of 17,691 thousand. Investment property of 1,801 thousand as at 31 December 2017 refers to land and buildings not used in operations and is stated at cost. The total fair value of these assets is estimated to be 14.5 million, based on independent appraisals and information on property markets relevant to these types of investment property. There were no significant changes in the expected useful lives of these assets during Finally, as at 31 December 2017, property, plant and equipment is free of mortgages, liens or other collateral guarantees restricting use. Annual Report
146 7.2 Intangible assets - 18,355,696 thousand ( 18,750,244 thousand) This item consists of: a) assets deriving from concession rights, totalling 12,220,843 thousand ( 12,620,116 thousand as at 31 December 2016), and regarding the following categories: 1) rights deriving from the performance of construction services for which no additional economic benefits are received, totalling 7,976,248 thousand; 2) rights deriving from construction services for which additional economic benefits are received, totalling 4,036,033 thousand; 3) rights deriving from construction services carried out by service area operators, totalling 107,902 thousand, represented by assets that were handed over free of charge to the Group s operators on expiry of the related sub-concessions; 4) rights acquired from third parties ( 100,660 thousand), essentially reflecting the fair value of concession rights recognised following acquisitions of motorway operators in previous years; b) goodwill and other intangible assets with indefinite lives, totalling 6,111,237 thousand and unchanged with respect to the previous year; c) other intangible assets of 23,616 thousand ( 18,891 thousand as at 31 December 2016). 31 December December Cost Accumulated amortisation Accumulated impairments Carrying amount Cost Accumulated amortisation Accumulated impairments Carrying amount Intangible assets deriving from concession rights 18,626,859-6,289, ,048 12,220,843 18,538,958-5,724, ,748 12,620,116 Goodwill and other intangible assets with indefinite lives 6,111, ,111,237 6,111, ,111,237 Other intangible assets 265, ,716-23, , ,327-18,891 Intangible assets 25,003,428-6,531, ,048 18,355,696 24,891,413-5,946, ,748 18,750,244 Intangible assets recorded a net decrease of 394,548 thousand in 2017, primarily due to a combination of the following: a) amortisation for the year, totalling 583,150 thousand; b) investment in construction services for which additional economic benefits are received, totalling 110,237 thousand; c) partial reversal of the impairment loss on the concession rights of Raccordo Autostradale Valle d Aosta, totalling 78,700 thousand, as described below. The following table shows intangible assets at the beginning and end of the period and changes during 2017 in the different categories of intangible assets. 146
147 CHANGES DURING THE YEAR 000 Carrying amount as at 31 December 2016 Additions due to completion of construction services, purchases and capitalisations Amortisation Reversals of impairment losses (Impairment losses) Changes due to revised present value Reclassifications and of contractual other adjustments obligations Carrying amount as at 31 December 2017 Intangible assets deriving from concession rights Acquired concession rights 105, , ,660 Concession rights accruing from construction services for which no additional economic benefits are received Concession rights accruing from construction services for which additional economic benefits are received 8,384, , , ,976,248 4,024, , ,970 78, ,292 4,036,033 Concession rights accruing from construction services provided by sub-operators 105,745 7,292-5, ,902 Total 12,620, , ,874 78,700-26,540-3,088 12,220,843 Goodwill and other intangible assets with indefinite lives Goodwill 6,111, ,111,234 Trademarks Total 6,111, ,111,237 Other intangible assets Development costs 8,973 10,978-9, ,482 Industrial patents and intellectual property rights 6,409 9,024-7, ,296 Concessions and licenses Intangible assets under development and advance payments 3, ,966 Total 18,891 21,151-17, ,616 Intangible assets 18,750, , ,150 78,700-26,540-2,238 18,355,696 There were no significant changes in the expected useful lives of intangible assets during the period. In 2017, the Group invested a total of 517,205 thousand in assets held under concession ( 844,111 thousand in 2016). In accordance with IFRIC 12 and as described in note 3, Accounting standards and policies applied, operating and financial expenses in connection with those assets were recognised in income by nature, as was the fair value of construction and upgrade services rendered (classified in Revenue from construction services and Use of provisions for construction services required by contract ). The following analysis shows the various components of investment in assets held under concession effected through construction services, as also reported in the consolidated statement of cash flows. 000 Note Increase/ (Decrease) Use of provisions for construction services required by contract for which no additional economic benefits 7.13 are received 406, ,735-47,767 Increase in intangible concession rights accruing from completed construction services for which additional economic benefits are received 110, , ,706 Increase in financial assets deriving from motorway construction services - 81,101-81,101 Revenue from government grants for construction services for which no additional economic benefits are received Investment in assets held under concession 517, , ,906 Research and development expenditure of approximately 0.7 million has been recognised in the consolidated income statement for These activities are carried out in order to improve infrastructure, the services offered, safety levels and environmental protection and in relation to the inhouse development of software and IT systems. Annual Report
148 "Goodwill and other intangible assets with indefinite lives" amounts to 6,111,237 thousand. The balance consists of the carrying amount of the goodwill (impairment tested at least once a year rather than amortised) recognised following the transfer of motorway assets from the former Autostrade Concessioni e Costruzioni Autostrade SpA (now Atlantia), as part of the Autostrade Group s reorganisation in This goodwill was determined in accordance with prior accounting standards under the exemption permitted by IFRS 1 and is the carrying amount as at 1 January 2004, the Parent Company s IFRS transition date. With regard to the recoverability of goodwill, allocated entirely to the CGU represented by Autostrade per l Italia, and of the concession rights attributable to this CGU (given the overall significance of these items), these assets have been tested for impairment. There are no other CGUs in the Group companies showing evidence of a potential impairment, with the exception of Autostrade Meridionali, which is dealt with below. In the case of the CGU represented by Raccordo Autostradale Valle d Aosta, this company s intangible assets deriving from concession rights were subject to an impairment loss in previous years (net of subsequent partial reversals). As a result, the residual value of this company s intangible assets deriving from concession rights amounted to 193,843 thousand, before the related deferred taxation, as at 31 December In 2017, there was evidence that the circumstances that had resulted in the earlier impairment loss no longer applied, in view of the decision by the relevant ministries to grant the company toll increases (unlike previous years, when increases were turned down) and the improvement in the company s operating cash flow. As a result, the recoverability of the operator s intangible assets was tested for impairment. In terms of the methodology used in impairment testing, the following should be noted: a) as explained in note 3, Accounting standards and policies applied, in line with the approach adopted in previous years, each operator is a separate CGU since the cash flows generated by the motorways operated under concession arrangements are largely independent of cash flows generated by other assets. Subsidiaries that do not hold concessions are also treated as a separate CGU; b) in the case of the operators, Autostrade per l Italia and Raccordo autostradale Valle d Aosta, value in use was estimated on the basis of the long-term plans drawn up by the respective companies, containing traffic, investment, revenue and cost projections for the full term of the related concessions. The use of long-term plans covering the entirety of the respective concession terms is deemed more appropriate than the approach provisionally suggested by IAS 36 (namely, a limited explicit projection period and the estimated terminal value), given the intrinsic nature of the motorway concession arrangements, above all with regard to the regulations governing the sector and the predetermined duration of the arrangements. The following table shows the key assumptions forming the basis for the long-term plans of the CGUs represented by the Group s motorway operators to be tested for impairment, prepared on the basis of the regulatory mechanisms included in the specific concession arrangements. The recoverable value of the CGUs is estimated on the basis of these assumptions (rate of traffic growth, rate of toll increases and discount rate used, the latter determined on the basis of the requirements of IAS 36). Traffic growth rate (CAGR) Average annual toll increase Discount rate Autostrade per l Italia 1.24% 2.66% (*) 5.68% Raccordo Autostradale Valle d'aosta -1.51% 10.4% (**) 6.39% (*) in Autostrade per l'italia's case, this includes an average annual toll increase of 1.36% based on implementation of the investment programme, in addition to annual toll increases designed to take account of inflation (1.30%). (**) in Raccordo Autostradale Valle d'aostaps case, this includes an average annual toll increase of 1.51% to take account of inflation, in addition to the annual toll increases intended to provide a return on invested capital. 148
149 Quantification of the above assumptions was primarily based on publicly available information from external sources, integrated, where appropriate, by estimates based also on historical data. With regard to the average annual rate of traffic growth at Autostrade per l Italia, an inflationlinked component of 1.30% was taken into account. This is 70% below the annual target inflation rates (2% between 2020 and 2023) forming part of the medium-term scenario indicated in the Italian government s Stability programme included in the Revised Budget for In addition, with regard to the average annual rate of traffic growth to fund future investment, amounting to 1.36%, this component of the toll increase is recognised on a proportionate basis if expected capital expenditure is only partially carried out. In this case, it would also be necessary to take into account the financial impact of the shortfall in investment. The impairment tests confirmed that the assets accounted for in the financial statements and allocated to the above CGUs, which in Autostrade per l Italia s case also includes the value of goodwill, are fully recoverable. In addition to the above impairment tests, sensitivity analyses were conducted on the recoverable values, increasing the indicated discount rates by 1%, and reducing the average annual rate of traffic growth by 1%. The results of these analyses have not, in any event, resulted in any material differences with respect to the outcomes of the above tests. In the case of the CGU represented by Raccordo Autostradale Valle d Aosta, the result of the impairment test indicated the need to proceed with a partial reversal of previous impairment losses recognised on the concession rights allocated to this CGU. The reversal amounts to 78,700 thousand, after the related taxation of 21,957 thousand, recognised in the income statement for In the case of Autostrade Meridionali, the operator s motorway concession expired on 31 December The operator is continuing to operate the relevant motorway, whilst awaiting the conclusion of the tender process that will select the new operator, which will be required (i) to pay the outgoing operator compensation equal to the unamortised carrying amount of the capital expenditure carried out in the final years of the concession arrangement, and (ii) to assume the obligations relating to sale and purchase agreements entered into by the previous operator, excluding those of a financial nature, and to outstanding legal actions and disputes. In this regard, the value of this CGU s net assets is recoverable due to the above obligations to be honoured by the incoming operator. 7.3 Investments - 63,944 thousand ( 61,044 thousand) As at 31 December 2017, this item is up 2,900 thousand, reflecting recognition of the Group s share of the results of its investees, taking into account dividends distributed by these companies during the year. The following table shows carrying amounts at the beginning and end of the period, grouped by category, and changes in investments in Annual Report
150 CHANGES DURING THE YEAR December 2016 Measurement using equity 31 December 2017 Opening method Closing balance Profit or loss Other balance comprehensive income Investments accounted for at cost or fair value Investments accounted for using the equity method: - associates - joint ventures 33, ,920 26,124 2, ,024 1, ,000 Investments 61,044 2, ,944 The equity method is used to measure interests in associates and joint ventures, based on the most recent approved financial statements made available by the companies. In the event that financial statements for the year ended 31 December 2017, the above information was supplemented and, where necessary, restated in accordance with Group accounting policies. The following table shows an analysis of the Group s principal investments as at 31 December 2017, including the Group s percentage interest and the relevant carrying amount, net of unpaid, called-up issued capital, and showing the original cost and any accumulated revaluations and impairments at the end of the period. There are no investments in associates and joint ventures that are individually material with respect to total consolidated assets, operating activities and geographical area and, therefore, the additional disclosures required in such cases by IFRS 12 are not presented December December 2016 % interest Cost Revaluations/ (Impairments) Carrying amount % interest Cost Revaluations/ (Impairments) Carrying amount Investments accounted for at cost or fair value Tangenziali Esterne di Milano 13.67% 36,034-4,012 32, % 36,034-4,012 32,022 Tangenziale Esterna 0.25% 1,162-1, % 1,162-1,162 Uirnet 1.51% % Veneto Strade 5.00% % Other minor investments Total investments accounted for at cost or fair value 33,920 33,920 Investments accounted for using the equity method: - associates Spea Engineering 20.00% 1,576 15,925 17, % 1,576 17,129 18,705 Pavimental 20.00% 9,505-2,783 6, % 9,505-6,944 2,561 Società Infrastrutture Toscane (in liquidation) 46.00% 3, , % 3, ,969 Pedemontana Veneta (in liquidation) 29.77% 1, , % 1, ,826 Bologna & Fiera Parking 36.81% 5,557-5, % 5,557-5,557 - Other minor investments joint ventures Geie del Traforo del Monte Bianco 50.00% 1,000 1, % 1,000-1,000 Total investments accounted for using the equity method 30,024 27,124 Investments 63,944 61,044 Annex 1 provides an analytical list of the Group's investments as at 31 December
151 7.4 Financial assets (non-current) 393,619 thousand ( 395,767 thousand) (current) 531,753 thousand ( 508,333 thousand) The following analysis shows the composition of other financial assets at the beginning and end of the period, together with the current and non-current portions December December 2016 Carrying amount Current portion Non-current portion Carrying amount Current portion Non-current portion Note Takeover rights 399, , , ,270 - Financial assets deriving from concession rights (1) 399, , , ,270 - Financial assets deriving from government grants related to construction services (1) 240,564 52, , ,461 50, ,985 Term deposits (2) 234,860 50, , ,609 48, ,696 Derivative assets (3) 20,007 20,007-1,131 1,131 - Other medium/long-term financial assets (1) 23,199 2,140 21,059 22,378 2,292 20,086 Other medium/long-term financial assets 43,206 22,147 21,059 23,509 3,423 20,086 Other current financial assets (1) 6,879 6,879-7,251 7,251 - Total 925, , , , , ,767 (1) These assets include financial instruments primarily classified as "loans and receivables" under IAS 39. The carrying amount is equal to fair value. (2) These assets have been classified as "available-for-sale" financial instruments and in level 2 of the fair value hierarchy. The carrying amount is equal to fair value. (3) These assets primarily include derivative financial instruments classified as hedges under level 2 of the fair value hierarchy. Financial assets deriving from concession rights include takeover rights attributable to Autostrade Meridionali ( 399,863 thousand as at 31 December 2017), being the amount payable by a replacement operator on termination of the concession for the company's unamortised capital expenditure during the final years of the outgoing operator's concession. Financial assets deriving from government grants to finance infrastructure works, amounting to 240,564 as at 31 December 2017, include amounts receivable from grantors, from third parties or other public entities as grants accruing as a result of construction and maintenance of assets held under concession. Term deposits, totalling 234,860 thousand, essentially relate to loans disbursed by banks as a condition precedent for the grants financing the new construction required by laws 662/1996, 345/1997 and 135/1997, relating to the Variante di Valico and the upgrade of the motorway interchange serving Florence. The balances on the accounts may not be withdrawn until such time as the Grantor specifically approves the effective start-up of work and the stage of completion. It is noted that no evidence of impairment was found in 2017 for any of the financial assets reported in the financial statements. 7.5 Deferred tax assets and deferred tax liabilities Deferred tax assets - 101,314 thousand ( 118,522 thousand) Deferred tax liabilities - 598,364 thousand ( 470,947 thousand) The amount of deferred tax assets and liabilities both eligible and ineligible for offset is shown below, with respect to temporary timing differences between consolidated carrying amounts and the corresponding tax bases at the end of the period. Annual Report
152 December December 2016 Deferred tax assets 953, ,677 Deferred tax liabilities eligible for offset -852, ,155 Deferred tax assets less deferred tax liabilities eligible for offset 101, ,522 Deferred tax liabilities not eligible for offset -598, ,947 Difference between deferred tax assets and liabilities (eligible and ineligible for offset) -497, ,425 Changes in the Group s deferred tax assets and liabilities during the period, based on the nature of the temporary differences giving rise to them, are summarised in the following table December 2016 CHANGES DURING THE YEAR Provisions Releases Provisions (releases) on other components of comprehensive Change in prior year estimates and other changes 31 December 2017 Deferred tax assets on: Restatement of total amount subject to IFRIC 12 by Autostrade per l'italia 423, , ,925 Provisions 432,869 93,275-86, ,517 Impairments and depreciation of non-current assets 39, , ,544 Derivative liabilities 55, ,845-40,750 Impairment of receivables and inventories 5, ,065 4,066 Other temporary differences 44,076 9,645-1, ,757 Total 999, , ,324-14, ,559 Deferred tax liabilities on: Off-balance sheet amortisation of goodwill -1,317,288-98, ,415,925 Other temporary differences -34,814-1,349 1, ,684 Total -1,352,102-99,986 1, ,450,609 Difference between deferred tax assets and liabilities (eligible and ineligible for offset) -352,425 3, ,175-13,875-1, ,050 The balance of net deferred tax liabilities, totalling 497,050 thousand as at 31 December 2017, primarily consists of the following: a) deferred tax liabilities recognised from 2003 as a result of the deduction, solely for tax purposes, of the amortisation of goodwill recognised by Autostrade per l Italia, totalling 1,415,925 thousand; b) the residual balance of Autostrade per l Italia s deferred tax assets accounted for as a result of recognition of the impact on taxation of the carrying amounts accounted for in application of IFRIC 12 amounting to 401,925 thousand; c) deferred tax assets on the portion of provisions, primarily for the repair and replacement of motorway infrastructure, deductible in future years, totalling 439,517 thousand. The reduction of 144,625 thousand in net deferred tax liabilities primarily reflects a combination of the following: a) the provision of deferred taxes on the above deduction, solely for tax purposes, of amortisation of the goodwill formerly recognised by Autostrade per l Italia ( 98,637 thousand); b) the release of deferred tax assets on impairment losses and depreciation and amortisation of non-current assets, totalling 24,141 thousand and essentially relating to the above- 152
153 c) mentioned partial reversal of impairment losses on intangible assets deriving from the concession rights of the subsidiary, Raccordo Autostradale Valle d Aosta; the net release of deferred tax assets of 21,510 thousand, representing the accrued portion of the total amount resulting from Autostrade per l Italia s application of IFRIC Other non-current assets thousand ( 8,189 thousand) The reduction in this item essentially relates to the reclassification to other current assets of refundable VAT due to Autostrade Tirrenica. 7.7 Trading assets 507,456 thousand ( 574,739 thousand) As at 31 December 2017, trading assets include: a) inventories of 52,053 thousand ( 48,561 thousand as at 31 December 2016), primarily relating to stocks and spare parts used in motorway maintenance or the assembly of plant; b) contract work in progress of 4,204 thousand (unchanged with respect to 31 December 2016); c) trade receivables of 451,199 thousand ( 521,974 thousand as at 31 December 2016), consisting of the following items December December 2016 Trade receivables due from: Motorway users 222, ,790 Sub-operators at motorway service areas 84, ,001 Sundry customers 138, ,571 Gross trade receivables 445, ,362 Allowance for bad debts (34,427) (29,151) Other trading assets 39,668 44,763 Net trade receivables 451, ,974 Trade receivables, after the allowance for bad debts, are down 70,775 thousand, essentially due to the following: a) a reduction in amounts due from sub-operators at service areas, totalling 37,018 thousand, essentially reflecting collection in February 2017 of receivables recognised as at 31 December 2016 (relating to contracts executed prior to 2014, under which billing takes place annually), partially offset by an increase in the value of bills issued on a quarterly basis under the new contracts; b) a decrease in receivables due from motorway customers, totalling 31,765 thousand, primarily due to a reduction in tolls to be billed at the end of the year. The following table shows an ageing schedule for amounts due from customers and other trade receivables. 000 Total receivables as at 31 December 2017 Total not yet due More than 90 days overdue Between 90 and 365 days overdue More than one year overdue Trade receivables 445, ,515 14,763 15,997 60,683 Annual Report
154 Overdue receivables regard uncollected and unpaid tolls, in addition to royalties due from service area operators and sales of other goods and services. The following table shows movements in the allowance for bad debts for trade receivables during 2017, determined with reference to the management and measurement of receivables and historical data regarding losses on receivables, also taking into account guarantee deposits and other collateral given by customers December 2016 Additions Uses Reclassifications and other changes 31 December 2017 Allowance for bad debts 29,151 4, ,343 34,427 The carrying amount of trade receivables approximates to fair value. 7.8 Cash and cash equivalents 2,938,061 thousand ( 3,223,793 thousand) This item includes cash in hand and investments maturing within the short term and has decreased 285,732 thousand compared with 31 December The reduction partly reflects the distribution of a portion of available equity reserves ( 1,101,312 thousand) to the parent, Atlantia in accordance with the resolution approved by the Annual General Meeting of Autostrade per l Italia s shareholders held on 21 April Detailed explanations of the cash flows resulting in the reduction in the Group s cash in 2017 are contained in note 9.1, Notes to the consolidated statement of cash flows. 7.9 Current tax assets and liabilities Current tax assets - 34,800 thousand ( 69,025 thousand) Current tax liabilities - 88,449 thousand ( 4,270 thousand) Current tax assets and liabilities at the beginning and end of the period are detailed below. 000 Current tax assets Current tax liabilities 31 December December December December 2016 IRES 33,874 67,779 87, IRAP 753 1,073 1,306 3,523 Taxes attributable to foreign operations ,800 69,025 88,449 4,270 As at 31 December 2017, the Group reports net current tax assets of 53,649 thousand, up 118,404 thousand ( 64,755 thousand as at 31 December 2016). This substantially reflects the fact that payments on account for IRES made during the year are higher than the amount of tax due as at 31 December Other current assets - 81,862 thousand ( 82,518 thousand) This item consists of receivables and other current assets that are not eligible for classification as trading or financial. The composition of this item is shown below. 154
155 December December 2016 Increase/ (Decrease) Receivable from public entities 13,133 9,112 4,021 Tax credits other than for income tax 9,864 16,620-6,756 Receivables due from end users and insurance companies for damages 18,583 19, Accrued income of a non-trading nature Amounts due from staff 1,683 1, Receivables from social security institutions Payments on account to suppliers and other current assets 42,291 39,604 2,687 Gross other current assets 86,643 87, Allowance for bad debts -4,781-5, Other current assets 81,862 82, The balance is broadly in line with the figure for 31 December 2016, having decreased by 656 thousand. The allowance for bad debts, totalling 4,781 thousand as at 31 December 2017 ( 5,063 thousand as at 31 December 2016), essentially refers to estimated losses on amounts due from road users and insurance companies to cover damage to the motorway infrastructure managed by Autostrade per l Italia Assets held for sale or related to discontinued operations - 11,061 thousand ( 5,907,657 thousand) Liabilities related to discontinued operations 6,300 thousand ( 2,996,823 thousand) As described in note 6, Corporate actions, following the restructuring of the Atlantia Group, the assets and liabilities of AID, ADA and the related subsidiaries (as at 31 December 2016 reclassified to net assets held for sale or related to discontinued operations) have been transferred to the parent, Atlantia, in the form of a special dividend in kind approved by the General Meeting of Autostrade per l Italia s shareholders held on 25 January The following table shows the composition of these assets and liabilities held for sale or related to discontinued operations according to their nature (trading, financial or other). Annual Report
156 December December 2016 Increase/ (Decrease) Non-current non-financial assets 4,271 3,277,931-3,273,660 -Property, plant and equipment - 15,173-15,173 -Intangible assets - 3,159,605-3,159,605 -Deferred tax assets - 27,048-27,048 -Investments 4,271 60,613-56,342 -Other non-current assets - 15,492-15,492 Current non-financial assets , ,172 -Trading assets - 238, ,812 -Other current non-financial assets ,619-59,360 Non-current financial assets - 1,646,229-1,646,229 Current financial assets 6, , ,535 - Cash and cash equivalents 6, , ,993 - Other current financial assets 8 283, ,542 Total assets held for sale or related to discontinued operations 11,061 5,907,657-5,896,596 Non-current non-financial liabilities - 1,011,469-1,011,469 -Non-current provisions - 74,130-74,130 -Deferred tax liabilities - 878, ,406 -Other non-current liabilities - 58,933-58,933 Trading liabilities and other current nonfinancial liabilities 5, , ,728 Non-current financial liabilities - 1,344,138-1,344,138 Current financial liabilities , ,188 Total liabilities related to discontinued operations 6,300 2,996,823-2,990,523 Net assets held for sale or related to discontinued operations, amounting to 4,761 thousand as at 31 December 2017, include: a) the remaining 2% interest in Strada dei Parchi, amounting to 4,271 thousand, that is the subject of put and call options agreed with Toto Costruzioni Generali in the contract governing the sale, in 2011, of a controlling interest in the company; b) the remaining net assets of the French companies involved in the EcoTaxe project, totalling 490 thousand. 156
157 7.12 Equity - 2,737,792 thousand ( 6,117,662 thousand) The issued capital of the Parent Company, Autostrade per l Italia SpA, as at 31 December 2017 is fully subscribed and paid and consists of 622,027,000 ordinary shares of a par value of 1 each, amounting to a total of 622,027 thousand. This figure has not undergone any changes compared with 31 December Equity attributable to owners of the parent, totalling 2,390,132 thousand, is down 1,978,220 thousand compared with 31 December The most important changes during the period are shown in detail in the statement of changes in consolidated equity. These regard: a) the transfer of the carrying amount of the net assets of AID, ADA and the related subsidiaries to the parent, Atlantia, following distribution of the special dividend in kind approved by the General Meeting of Autostrade per l Italia s shareholders held on 25 January 2017, amounting to 1,153,529 thousand (after the related taxation, recognised in equity); b) distribution of a portion of the available reserves ( 1,101,312 thousand) in accordance with the resolution approved by the Annual General Meeting of Autostrade per l Italia s shareholders held on 21 April 2017; c) the dividends declared by Autostrade per l Italia, including the final dividend for 2016, amounting to 314,127 thousand, and the interim dividend for 2017, totalling 450,348 thousand; d) comprehensive income for 2017, totalling 1,062,383 thousand, consisting of profit for the year ( 971,893 thousand) and other comprehensive income ( 90,490 thousand), due primarily to the following: 1) gains ( 46,044 thousand) on the translation of the assets and liabilities of ADA s overseas subsidiaries through to the date of their deconsolidation, reflecting the significant increase, as at 28 February 2017, in the value of the Brazilian real and the Chilean peso compared with 31 December 2016; 2) a reduction in fair value losses ( 44,691 thousand) on cash flow hedges due to an increase in interest rates in Equity attributable to non-controlling interests of 347,660 thousand is down 1,401,650 thousand compared with 31 December 2016 ( 1,749,310 thousand ). This essentially reflects deconsolidation of the overseas subsidiaries transferred to the parent, Atlantia ( 1,474,106 thousand) and dividends declared by a number of Group companies that are not wholly owned subsidiaries (totalling 65,734 thousand), partially offset by comprehensive income for the year ( 114,878 thousand). Autostrade per l Italia aims to manage its capital in order to create value for shareholders, ensure the Company remains a going concern, safeguard the interests of stakeholders and guarantee efficient access to external sources of funding to adequately support the growth of the Group s businesses and fulfil the commitments given in concession arrangements Provisions for construction services required by contract (non-current) 2,839,552 thousand ( 3,165,177 thousand) (current) 421,949 thousand ( 521,454 thousand) Provisions for construction services required by contract represent the present value of motorway infrastructure construction and/or upgrade services that Autostrade per l'italia is required to provide and for which no additional economic benefits are received in terms of specific toll increases and/or significant increases in traffic. The following table shows provisions for construction services required by contract and for which no additional economic benefits are received at the beginning and end of the year and changes during 2017, showing the non-current and current portions. Annual Report
158 December 2016 CHANGES DURING THE YEAR 31 December 2017 Carrying amount non-current portion current portion Changes due to revised present Financial provisions value of obligations Uses to finance works Carrying amount non-current portion current portion Provisions for construction services required by contract 3,686,631 3,165, ,454-26,540 8, ,968 3,261,501 2,839, ,949 The reduction in these provisions, including both the current and non-current portions, amounts to 425,130 thousand and primarily reflects the use of provisions for construction services for which no additional economic benefits are received performed during the period ( 406,968 thousand) Provisions (non-current) - 1,314,339 thousand ( 1,298,255 thousand) (current) - 214,309 thousand ( 231,790 thousand) As at 31 December 2017, provisions amount to 1,528,648 thousand ( 1,530,045 thousand as at 31 December 2016). The following table shows details of provisions by type, showing the noncurrent and current portions December December 2016 Carrying amount non-current portion current portion Carrying amount non-current portion current portion Provisions for employee benefits 123, ,030 23, , ,382 24,332 Provisions for repair and replacement of motorway infrastructure 1,349,402 1,197, ,092 1,333,975 1,169, ,779 Other provisions 55,691 16,999 38,692 64,356 21,677 42,679 Total provisions 1,528,648 1,314, ,309 1,530,045 1,298, ,790 The following table shows provisions at the beginning and end of the period and changes in December 2016 CHANGES DURING THE YEAR 31 December Carrying amount Operating provisions Financial provisions Uses Actuarial gains/(losses) recognised in comprehensive income Reclassifications and other changes Carrying amount Provisions for employee benefits Post-employment benefits 131, ,047-9,443 1,002-1, ,555 Total 131, ,047-9,443 1,002-1, ,555 Provisions for repair and replacement of motorway infrastructure 1,333, ,439 15, , ,349,402 Other provisions Provisions for disputes, liabilities and sundry charges 64,356 11, , ,298 55,691 Total 64,356 11, , ,298 55,691 Total provisions 1,530, ,878 16, ,060 1,002-10,952 1,528,648 PROVISIONS FOR EMPLOYEE BENEFITS (non-current) - 100,030 thousand ( 107,382 thousand) (current) - 23,525 thousand ( 24,332 thousand) As at 31 December 2017, this item consists almost entirely of provisions for post-employment benefits to be paid to staff employed under Italian law. The reduction of 8,159 thousand primarily reflects uses of provisions for benefits and advances paid during the year. The actuarial model used to measure provisions for post-employment benefits is based on both demographic and economic assumptions. The most important actuarial assumptions used to measure post-employment benefits at 31 December 2017 are summarised below. 158
159 Financial assumptions Annual discount rate(*) 0.88% Annual inflation rate 1.50% Annual rate of increase in post-employment benefits 2.63% Annual rate of increase in real salaries 0.65% Annual turnover rate from 0.75% to 5% Duration (years) from 6.7 to 16.7 (*) The annual discount rate used to determine the present value of the obligation was determined with reference to the average yield curve based on the Iboxx Corporate AA index on the valuation date for durations of 7-10 years, reflecting the estimated period of service to be provided by plan members. Demographic assumptions Mortality Disability Retirement age Government General Accounting Office projections INPS tables by age and sex Mandatory state pension retirement age The following table shows a sensitivity analysis of provisions for post-employment benefits at the end of the year based on assumed changes in the individual rates used in the actuarial assumptions. Sensitivity analysis as at 31 December 2017 Change in assumption 000 Turnover rate Inflation rate Discount rate + 1 % - 1 % % % % % Autostrade per l'italia Group's provisions for post-employment benefits 118, , , , , ,576 PROVISIONS FOR REPAIR AND REPLACEMENT OF MOTORWAY INFRASTRUCTURE (non-current) - 1,197,310 thousand ( 1,169,196 thousand) (current) - 152,092 thousand ( 164,779 thousand) This item regards the present value of provisions for the repair and replacement of motorway infrastructure operated under concession, in accordance with the contractual commitments of the Group s operators and designed to ensure the serviceability and safety of the assets. The provisions, including the current and non-current portions, are up 15,427 thousand on 31 December 2016, reflecting a combination of the following: a) operating provisions, totalling 359,439 thousand; b) financial provisions for the year of 15,688 thousand; c) uses ( 359,700 thousand) in connection with repairs and replacements carried out during the period. OTHER PROVISIONS (non-current) - 16,999 thousand ( 21,677 thousand) (current) - 38,692 thousand ( 42,679 thousand) These provisions essentially regard estimates of liabilities, at the end of the period, expected to be incurred in connection with pending litigation and disputes, including the estimated expenses provisioned for contract reserves relating to contractors who carry out maintenance work. The overall amount is down 8,665 thousand, reflecting a combination of the following: Annual Report
160 a) b) c) direct uses in relation to outstanding litigation, amounting to 10,917 thousand, following the settlement of contractual disputes; the reduction linked to reclassifications and other changes, amounting to 9,298 thousand and relating primarily to the reversal of surplus provisions to cover the cost of claims for damages, which were ultimately settled for lower amounts; operating provisions of 11,550 thousand, primarily relating to a number of tax demands received by Autostrade per l Italia regarding local taxes. Further information on developments in the principal disputes outstanding as at 31 December 2017 is provided in note 10.7, Significant legal and regulatory aspects Financial liabilities (non-current) 10,990,445 thousand ( 12,022,227 thousand) (current) 2,230,850 thousand ( 1,368,390 thousand) MEDIUM/LONG-TERM FINANCIAL ASSETS (non-current) 10,990,445 thousand ( 12,022,227 thousand) (current) 1,384,584 thousand ( 915,001 thousand) As at 31 December 2017, medium/long-term financial liabilities amount to 12,375,029 thousand. These liabilities essentially consist of bonds issued by Autostrade per l Italia since 2015, the bonds involved in the issuer substitution, completed at the end of 2016, and bank borrowings. The following two tables provide an analysis of medium/long-term financial liabilities, showing the following aspects: ( 000) Note Face value Carrying amount 31 December December 2016 Term Current portion Noncurrent portion between 13 and 60 months after 60 months Face value Carrying amount Current portion Noncurrent portion Bond issues (1) (2) (3) 8,244,396 8,092,619-8,092,619 2,824,924 5,267,695 8,569,297 8,510, ,947 8,005,130 Bank borrowings 2,390,864 2,380, ,061 2,258, ,281 1,730,887 2,552,676 2,541, ,398 2,380,136 Other borrowings 1,277,164 1,260,142 1,049, , ,335 12,179 1,215,747 1,208,067 51,553 1,156,514 of which due to Atlantia 1,000, , , ,000, , ,320 Medium/long-term borrowings (2) (3) 3,668,028 3,640,371 1,171,689 2,468, ,616 1,743,066 3,768,423 3,749, ,951 3,536,650 Derivative liabilities (4) 429, , , , , ,447 Accrued expenses on medium/long-term financial liabilities (2) 212, , , ,103 - Other financial liabilities Other medium/long-term financial liabilities 212, , , ,103 - Total 12,375,029 1,384,584 10,990,445 3,815,934 7,174,511 12,937, ,001 12,022,227 (1) The par value of the bonds denominated in pounds sterling and yen is shown at the exchange rate applicable to the related Cross Currency Swaps. (2) Financial instruments classified as financial liabilities measured at amortised cost in accordance with IAS 39. (3) Further details of hedged financial liabilities are contained in note 9.2, "Financial risk management". (4) Financial instruments classified as hedging derivatives in accordance with IAS 39 and in level 2 of the fair value hierarchy. an analysis of the balance by the corresponding face value and maturity (current and non- current portions); a) 160
161 b) type of interest rate, maturity and fair value; 000 Bond issues Maturity 31 December December 2016 Carrying amount (1) Fair value (2) Carrying amount (1) Fair value (2) - listed fixed rate from 2019 to ,092,619 8,885,248 8,510,077 9,539,112 8,092,619 8,885,248 8,510,077 9,539,112 Bank borrowings - fixed rate from 2018 to ,583,886 1,830,066 1,673,123 1,976,107 - floating rate from 2018 to , , , ,992 - non-interest bearing ,320 49,320 2,380,229 2,655,096 2,541,534 2,891,419 Other borrowings - fixed rate ,256 1,035, ,320 1,071,347 - non-interest bearing (3) from 2019 to , , , ,747 1,260,142 1,299,846 1,208,067 1,287,094 of which due to Atlantia 996,256 1,035, ,320 1,071,347 Medium/long-term borrowings 3,640,371 3,954,942 3,749,601 4,178,513 Derivative liabilities 429, , , ,447 Accrued expenses on medium/long-term financial liabilities 212, , , ,103 Other financial liabilities Other medium/long-term financial liabilities 212, , , ,103 Total 12,375,029 13,482,229 12,937,228 14,395,175 (1) The amounts shown in the table for medium/long-term financial liabilities include both the non-current and current portions. (2) The fair value shown is classified in level 2 of the fair value hierarchy. (3) This item primarily includes the amount repayable by Autostrade per l'italia to the Central Guarantee Fund following SAT's contribution of the payable as a result of the acquisition of control of this company in c) a comparison of the face value of each liability (bond issues and medium/long-term borrowings) and the related carrying amount, by issue currency, showing the corresponding average and effective interest rates; 31 December December Face value Carrying amount Average interest rate applied to 31 December 2017 Effective interest rate as at 31 December 2017 Face value Carrying amount Euro (EUR) 11,013,248 10,873, % 3.63% 11,438,544 11,342,439 Sterling (GBP) 750, , % 2.20% 750, ,194 Yen (JPY) 149, , % 3.39% 149, ,045 Total 11,912,424 11,732, % 12,337,720 12,259,678 d) movements during the period in the carrying amounts of outstanding bond issues and medium/long-term borrowings expressed in the financial statements. 000 Carrying amount as at 31 December 2016 New borrowings Repayments Currency translation differences and other changes Carrying amount as at 31 December 2017 Bond issues 8,510, , ,566-42,526 8,092,619 Bank borrowings 2,541, , ,380,229 Other borrowings 1,208, ,136 55,211 1,260,142 Medium/long-term borrowings 3,749, ,947 55,717 3,640,371 Total 12,259, , ,513 13,191 11,732,990 Annual Report
162 The Group uses derivative financial instruments to hedge certain current and highly likely future financial liabilities, including Interest Rate Swaps (IRSs) which, in accordance with IAS 39, are classifiable as cash flow hedges or fair value hedges. The fair value of the hedging instruments as at 31 December 2017 is recognised in Derivative liabilities. More detailed information on financial risks and the manner in which they are managed, in addition to details of outstanding financial instruments held by the Group, is contained in note 9.2, Financial risk management. BOND ISSUES (non-current) thousand ( 8,005,130 thousand) (current) - thousand ( thousand) This item consists of bonds issued by Autostrade per l Italia, including: a) bonds transferred from Atlantia to Autostrade per l Italia following the issuer substitution carried out in December 2016 (a total of 4,391,610 thousand as at 31 December 2017); b) bonds ( 2,963,736 thousand as at 31 December 2017) issued to institutional investors as part of the Euro Medium Term Note Programme launched in October 2014 (and authorised for an amount of up to 7 billion); c) bonds issued to retail investors (totalling 737,273 thousand as at 31 December 2017). As at 31 December 2017, the balance is down 417,458 thousand compared with 31 December 2016, due to the following changes: a) the repayment of bonds by Autostrade per l Italia in September 2017, totalling 505,566 thousand; b) the reduction in bond issues denominated in currencies other than the euro, transferred as a result of the issuer substitution completed in December 2016, essentially due to the application of amortised cost to these borrowings and a strengthening of the euro against sterling and the Japanese yen as at 31 December 2017, compared with the end of 2016; c) the net effect of a liability management transaction completed by Autostrade per l Italia on 26 September 2017, by which the Company: 1) issued bonds maturing in September 2029 to institutional investors, amounting to a par value of 700,000 thousand (coupon interest of 1.875%); 2) bought back a portion of the bonds maturing in 2019, 2020, February 2021 and November 2021 (all guaranteed by Atlantia, with the exception of the bonds maturing in November 2021), amounting to a total par value of 522,614 thousand. In terms of the notional value of the new bond matching the value of the repurchased bonds, the transaction described in point c) represents, from an accounting point of view, in accordance with IAS 39, a non-substantial modification of existing financial liabilities (and not the extinguishment of existing liabilities or the recognition of new ones). This has resulted in remeasurement of the amortised cost of these financial liabilities on a prospective basis, taking into account the premium paid in order to buy back the bonds (amounting to 40,969 thousand). As part of the same transaction, Autostrade per l Italia unwound a number of Forward-Starting Interest Rate Swaps, recognising fair value losses on the derivatives. Details are provided in note 9.2, Financial risk management. MEDIUM/LONG-TERM BORROWINGS (non-current) 2,468,682 thousand ( 3,536,650 thousand) (current) 1,171,689 thousand ( 212,951 thousand) The balance of this item, including both current and non-current portions, consists of other borrowings (with a carrying amount of 1,260,142 thousand). These essentially include medium/long-term loans to Autostrade per l'italia from Atlantia (with a carrying amount of 996,256 thousand) maturing in November 2018 and the Group s bank borrowings (totalling 2,380,229 thousand). 162
163 The reduction of 109,230 thousand in medium/long-term borrowings compared with 31 December 2016 essentially reflects repayments during the period ( 161,811 thousand). It is stated that the committed lines of credit obtained from Cassa Depositi e Prestiti were renegotiated on 13 December The facilities (maturing in 2021 and 2014 and having a total notional value of 1,700,000 thousand, compared with debt with a face value of 400,000 thousand) consist of a Term Loan and a Revolving Line of Credit (maturing in 2027 and 2022, respectively, and having notional values of 1,100,000 thousand and 600,000 thousand). The transaction, as regards the loans disbursed on the basis of the renegotiated committed lines of credit, represents, from an accounting point of view, in accordance with IAS 39, a non-substantial modification of existing financial liabilities (and not the extinguishment of existing liabilities or the recognition of new ones). This has resulted in remeasurement of the amortised cost of these financial liabilities on a prospective basis, taking into account the charges and fees effectively paid. A number of the medium/long-term loan agreements include negative pledge provisions, in line with international practice. Under these provisions, it is not possible to create or maintain (unless required to do so by law) collateral guarantees on all or a part of any proprietary assets, with the exception of the debt deriving from project finance. The above agreements also require compliance with certain financial covenants. The method of selecting the variables to compute the ratios is specified in detail in the relevant loan agreements. Breach of these covenants, at the relevant measurement dates, could constitute a default event and result in the lenders calling in the loans, requiring the early repayment of principal, interest and of further sums provided for in the agreements. The most important covenants are those relating to the loan agreements with Cassa Depositi e Prestiti (totalling 796,343 thousand as at 31 December 2017) that require compliance with a minimum threshold for Operating cash flow available for Debt Service/Debt Service (DSCR). Autostrade per l'italia is in compliance with these covenants. DERIVATIVE LIABILITIES (non-current) - 429,144 thousand ( 480,477 thousand) (current) - - (-) As at 31 December 2017, this item includes derivative financial instruments entered into with a number of banks to hedge the Group s exposure to interest rate and foreign currency risk on certain medium/long-term financial liabilities, partly with regard to highly likely future financial liabilities to be entered into through to The overall reduction in this item compared with 31 December 2016, amounting to 51,303 thousand, essentially reflects a combination of the following: a) a 17,295 thousand increase in fair value losses, including exchange rate movements, on Cross Currency Swaps linked to foreign currency bonds (pounds sterling and Japanese yen); b) a reduction of 11,556 thousand in fair value losses on Forward-Starting Interest Rate Swaps already present as at 31 December 2016 and entered into to hedge highly likely future financial liabilities to be entered into through to 2019, reflecting an increase in interest rates as at 31 December 2017, compared with 31 December 2016; c) a reduction of 20,984 thousand in fair value losses on outstanding Interest Rate Swaps, essentially reflecting an increase in interest rates as at 31 December 2017, compared with 31 December 2016; d) the reduction due to fair value losses ( 27,461 thousand) recognised on the unwinding of Forward-Starting Interest Rate Swaps linked to the bonds issued by Autostrade per l Italia in 2017 as part of the above settlement of the liability management transaction. The following have been recognised as at 31 December 2017 in relation to the Forward-Starting Interest Rate Swaps: Annual Report
164 a) b) financial instruments entered into to hedge highly likely future financial liabilities to be entered into by the Company through to 2018 in order meet its funding requirements, amounting to 43,999 thousand, and having a notional value of 850 million; financial instruments entered into to hedge highly likely future financial liabilities to be entered into by the Company through to 2019 in order meet its funding requirements, amounting to 3,345 thousand, and having a notional value of 750 million. Further details are contained in note 9.2, Financial risk management. OTHER MEDIUM/LONG-TERM FINANCIAL LIABILITIES (non-current) - (-) (current) 212,895 thousand ( 197,103 thousand) The balance of this item, including the current and non-current portions, is up 15,792 thousand. This is essentially due to a reduction in accrued expenses on bonds ( 15,499 thousand). SHORT-TERM FINANCIAL LIABILITIES - 846,266 thousand ( 453,389 thousand) An analysis of short-term financial liabilities is shown below December December 2016 Short-term borrowings 774, ,480 Current derivative liabilities (1) 638 2,997 Intercompany current account payables due to related parti 13, ,768 Other current financial liabilities 56, Short-term financial liabilities 846, ,389 (1) These liabilities include derivative instruments that classify as non-hedge accounting and in level 2 of the fair value hierarchy. This item amounts to 846,266 thousand and is up 392,877 thousand, essentially due to a combination of the following: a) an increase in short-term borrowings in the form of cash deposits by Atlantia (totalling 500,000 thousand as at 31 December 2017); b) a reduction of 191,807 thousand in amounts in intercompany current accounts repayable to related parties, connected to Autostrade per l Italia s role as a provider of centralised treasury management. The decrease is essentially due to a reduction in the amount payable to Atlantia ( 198,091 thousand). NET DEBT IN COMPLIANCE WITH ESMA RECOMMENDATION OF 20 MARCH 2013 An analysis of the various components of net debt is shown below with amounts payable to and receivable from related parties, as required by CONSOB Ruling DEM/ of 28 July 2006, in accordance with European Securities and Markets Authority ("ESMA") Recommendation of 20 March 2013 (which does not entail the deduction of non-current financial assets from debt). 164
165 m 31 December 2017 of which related party transactions 31 December 2016 of which related party transactions Cash -2,076-2,541 Cash equivalents and intercompany current account receivables due from related parties Cash and cash equivalents related to discontinued operations Cash and cash equivalents (A) -2,945-3,625 Current financial assets (1) (B) ,438 - Bank overdrafts repayable on demand - - Current portion of medium/long-term financial liabilities 1,385 1, Other financial liabilities Financial liabilities related to discontinued operations - 1,763 Current financial assets (C) 2,231 3,131 Current net debt (D=A+B+C) -1,246-2,932 Medium/long-term borrowings 2,469-3, Bond issues 8,093 8,005 Other non-current borrowings Non-current financial liabilities (E) 10,990 12,022 (Net funds) / Net debt as defined by ESMA recommendation (F=D+E) 9,744 9,090 Non-current financial assets (G) Net debt (H=F+G) 9,351 8,694 (1) Includes financial assets held for sale or related to discontinued operations Other non-current liabilities - 33,103 thousand ( 30,823 thousand) The balance as at 31 December 2017 amounts to 33,103 thousand and is substantially in line with the figure for 31 December 2016 ( 30,823 thousand). The following table shows a breakdown of this item December December 2016 Accrued expenses of a non-trading nature 24,608 25,120 Payable to staff 7,497 5,224 Amounts payable for expropriations Social security contributions payable Other payables Other non-current liabilities 33,103 30, Trading liabilities - 1,323,768 thousand ( 1,254,817 thousand) An analysis of trading liabilities is shown below December December 2016 Amounts payable to suppliers 580, ,707 Payable to operators of interconnecting motorways 664, ,180 Tolls in the process of settlement 77,025 90,642 Acrrued expenses, deferred income and other trading liabilities 1,373 Trading liabilities 1,323,768 1,254, Trading liabilities, totalling 1,323,768 thousand, are up 68,951 thousand compared with 31 December 2016 ( 1,254,817 thousand). This primarily reflects a combination of the following: a) an increase in amounts payable to the operators of interconnecting motorways ( 41,781 thousand), essentially linked to the increase in the operators toll revenue and in keeping with contractually agreed collection times; Annual Report
166 b) an increase in amounts payable to suppliers ( 39,702 thousand), primarily reflecting the performance of investment. The carrying amount of trading liabilities approximates to the relative fair value Other current liabilities - 301,730 thousand ( 303,074 thousand) The balance of other current liabilities as at 31 December 2017, amounting to 301,730 thousand, is broadly in line with the figure for 31 December 2016 ( 303,074 thousand). An analysis of other current liabilities is shown below December December 2016 Taxation other than income taxes 26,021 30,083 Payable to staff 35,526 35,886 Concession fees payable 96, ,566 Social security contributions payable 22,888 25,569 Amounts payable for expropriations 9,587 11,747 Amounts payable to public entities Other payables 111,622 99,208 Other current liabilities 301, ,
167 8. Notes to the consolidated income statement This section includes the notes to amounts in the income statement, with negative components of the income statement shown with a sign in the headings and tables of the notes, and amounts for 2016 shown in brackets. The contributions of AID, ADA and the related subsidiaries to the Group s income statements for the two comparative periods have, in application of IFRS 5, been classified in Profit/(Loss) from discontinued operations. This follows the restructuring of the Atlantia Group described in detail in note 6, "Corporate actions". In addition, the contributions of Telepass and Stalexport Autostrady for 2016 alone have, in application of IFRS 5, been classified in Profit/(Loss) from discontinued operations, following the transfer of the investments in these companies to Atlantia at the end of Details of amounts in the consolidated income statement deriving from related party transactions are provided in note 10.5, Related party transactions. 8.1 Toll revenue - 3,590,330 thousand ( 3,482,401 thousand) Toll revenue of 3,590,330 thousand is up 107,929 thousand (3%) on 2015 ( 3,482,401 thousand), primarily due to the following: a) a 2.2% increase in traffic on the Italian network, accounting for an increase in toll revenue of approximately 82 million (including the impact of the different traffic mix); b) application of annual toll increases (essentially a 0.64% increase applied by Autostrade per l Italia with effect from 1 January 2017), boosting toll revenue by an estimated 19 million. 8.2 Revenue from construction services - 117,529 thousand ( 244,001 thousand) An analysis of this revenue is shown below Increase/ (Decrease) Revenue from construction services for which additional economic benefits are received 110, , ,430 Revenue from construction services: government grants for services for which no additional economic benefits are received Revenue from construction services provided by sub-operators 7,292 11,002-3,710 Revenue from construction services 117, , ,472 Revenue from construction services essentially consists of construction services for which additional benefits are received and financial assets deriving from concession rights, represented by the fair value of the consideration due in return for the construction and upgrade services rendered in relation to assets held under concession during the year. Revenue from construction services is down 126,472 thousand compared with This is essentially due to a decrease of 122,430 thousand in construction services for which additional benefits are received, reflecting a reduction in the services performed by Autostrade per l Italia during the period. In 2017, the Company carried out additional construction services for which no additional benefits are received, amounting to 406,968 thousand, net of the related government grants, for which the Company made use of a portion of the specifically allocated Provisions for construction services required by contract. Uses of these provisions are classified as a reduction in operating costs for the period, as explained in note 8.10, Use of provisions for construction services required by contract. Details of total investment in assets held under concession during the year are provided in note 7.2 ( Property, plant and equipment ). Annual Report
168 8.3 Contract revenue - - thousand ( 24 thousand) Contract revenue amounts to 0 thousand in Other operating income - 347,489 thousand ( 305,293 thousand) An analysis of other operating income is provided below Increase/ (Decrease) Revenue from sub-concessions 177, ,478-3,871 Maintenance revenue 16,348 14,711 1,637 Other revenue from motorway operation 24,788 19,220 5,568 Revenue from the sale of technology devices and services 26,030 13,067 12,963 Refunds 21,070 19,466 1,604 Damages and compensation 21,437 16,791 4,646 Advertising revenue 3,298 2, Other income 56,911 37,684 19,227 Other operating income 347, ,293 42,196 Other operating income of 347,489 thousand is up 42,196 thousand compared with This is primarily due to the greater contribution from Autostrade Tech to the consolidated results, reflecting supplies to Telepass (a company deconsolidated at the end of 2016) in Raw and consumable materials ,455 thousand (- 65,729 thousand) This item consists of purchases of materials and the change in inventories of raw and consumable materials Increase/ (Decrease) Construction materials -8,249-8, Electrical and electronic materials -37,344-11,598-25,746 Lubricants and fuel -10,622-9,408-1,214 Other raw and consumable materials -37,223-42,086 4,863 Cost of materials -93,438-71,889-21,549 Change in inventories of raw, ancillary and consumable materials and 3,492 4,966-1,474 goods for resale Capitalised cost of raw materials 1,491 1, Raw and consumable materials -88,455-65,729-22,726 The reduction of 22,726 thousand primarily reflects a decrease in the cost of electrical and electronic materials ( 25,746 thousand), due to the greater contribution from Autostrade Tech s purchases of goods from Telepass (a company deconsolidated at the end of 2016). 8.6 Service costs ,813 thousand (- 989,861 thousand) An analysis of service costs is provided below. 168
169 Increase/ (Decrease) Construction and similar -583, , ,422 Professional services -140, ,008-13,914 Transport and similar -20,905-15,162-5,743 Utilities -34,594-37,645 3,051 Insurance -11,577-9,895-1,682 Statutory Auditors' fees Other services -63,366-63, Service costs -855, , ,048 The decrease in service costs, amounting to 134,048 thousand, essentially reflects a reduction in construction services (totalling 152,422 thousand), linked substantially to the lower volume of investment in assets held under concession. 8.7 Staff costs ,032 thousand (- 521,502 thousand) Staff costs break down as follows: Increase/ (Decrease) Wages and salaries -354, , Social security contributions -105, ,411 1,706 Payments to supplementary pension funds, INPS and for post-employment benefits -22,276-24,280 2,004 Directors' remuneration -3,818-3, Other staff costs -38,874-32,362-6,512 Staff costs -525, ,502-3,530 Staff costs of 525,032 thousand are up 3,530 thousand compared with 2016 ( 521,502 thousand), essentially due to: a) a reduction of 162 in the average workforce; b) an increase in the average unit cost, primarily due to contract renewals. The following table shows the average number of employees (divided by category and including agency staff). Increase/ Average workforce 2017 (*) 2016 (*) (Decrease) Senior managers Middle managers and administrative staff 3,032 3, Toll collectors 2,336 2, Manual workers 1,439 1,430 9 Total 6,906 7, (*) The figures for both comparative periods exclude the staff employed by companies whose income and costs are classified in "Profit/(Loss) from discontinued operations", as described in note Annual Report
170 Information on equity-settled and cash-settled share-based incentive plans for certain Directors and employees of Group companies is provided in note 10.6, Disclosures regarding share-based payments. 8.8 Other operating costs ,273 thousand (- 510,242 thousand) An analysis of other operating costs is shown below Increase/ (Decrease) Concession fees -465, ,424-10,634 Lease expense -10,216-4,265-5,951 Grants and donations -33,029-22,136-10,893 Direct and indirect taxes -10,159-9, Other -19,811-19,816 5 Other costs -62,999-51,553-11,446 Other operating costs -538, ,242-28,031 The increase in other operating costs, amounting to 28,031 thousand, primarily reflects a combination of the following: a) an increase in grants and donations ( 10,893 thousand), reflecting the increased costs incurred in 2017 for work on the upgrade of infrastructure operated by public entities, as part of construction services relating to assets held under concession; b) an increase in concession fees ( 10,634 thousand), linked to the rise in toll revenue in Operating change in provisions ,290 thousand (- 85,716 thousand) This item reflects the impact on profit or loss of operating changes (new provisions and uses) in provisions, excluding those for employee benefits, made by the Company during the period in order to meet the legal and contractual obligations that it is presumed will require the use of financial resources in future years. The negative impact of this item in 2017, totalling 11,290 thousand, essentially consists of: a) the positive operating change in provisions for the repair and replacement of motorway infrastructure ( 261 thousand), given that the discount rates used as at 31 December of both comparative periods are substantially unchanged; b) other provisions of 11,551 thousand made in 2017 ( 1,131 thousand in 2016), as described in note 7.14, Provisions. In contrast, the change in the present value of provisions for the repair and replacement of the Group s motorway infrastructure (a negative balance of 84,585 thousand) was essentially due to an increase in the discount rate applied at 31 December 2016, compared with the rate applied at 31 December Use of provisions for construction services required by contract - 406,968 thousand ( 444,366 thousand) This item regards the use of provisions for construction services required by contract, relating to services for which no additional economic benefits are received rendered during the year, less accrued government grants (recognised in revenue from construction services, as explained in note 8.2, Revenue from construction services ). The item represents the indirect adjustment to construction costs classified by nature and incurred by Autostrade per l Italia, whose concesssion 170
171 arrangement provides for such obligations. The reduction of 37,398 thousand is broadly linked to reduced investment in the upgrade of the A1 Milan-Naples motorway between Bologna and Florence (Impairment losses) and reversals of impairment losses - 76,948 (- 1,682 thousand) The figure for 2017 is essentially due to the partial reversal of impairment losses on intangible assets deriving from concession rights at Raccordo Autostradale Valle d Aosta, amounting to 78,700 thousand. This is described in note 7.2, Intangible assets Financial income/(expenses) ,858 thousand - (- 867,930 thousand) Financial income 101,636 thousand ( 22,448 thousand) Financial expenses - 582,410 thousand (- 890,528 thousand) Foreign exchange gains/(losses) - 84 thousand (- 120 thousand) An analysis of financial income and expenses is shown below Increase/ (Decrease) Dividends received from investees 2,430 2, Financial income accounted for as an increase in financial assets Income from derivative financial instruments 68,028 8,639 59,389 Interest and fees receivable on bank and post office deposits 2,727 4,653-1,926 Other 27,499 5,903 21,596 Other financial income 99,206 20,153 79,053 Financial income (a) 101,636 22,448 79,188 Financial expenses from discounting of provisions for construction services required by contract and other provisions -25,113-46,768 21,655 Interest on medium/long-term borrowings -125, , ,160 Losses on derivative financial instruments -117,882-71,911-45,971 Interest on bonds -290,157-61, ,066 Interest expense accounted for as an increase in financial liabilities -3, ,200 Impairment losses on investments measured at cost or fair value and non-current financial assets - -2,522 2,522 Interest and fees payable on bank and post office deposits -1,794-1,795 1 Other -18, , ,747 of which non-recurring ,215 Other financial expenses -557, , ,193 Total financial expenses (b) -582, , ,848 Foreign exchange gains 34,617 11,070 23,547 Foreign exchange losses -34,701-11,190-23,511 Foreign exchange gains/(losses) (c) Financial income/(expenses) (a+b+c) -480, , ,072 Net of Other financial income, Other financial expenses of 458,091 thousand are down 365,246 thousand compared with 2016 ( 823,337 thousand). This essentially reflects the impact of the issuer substitution implemented by Autostrade per l Italia and Atlantia at the end of 2016, which resulted in the recognition of non-recurring financial expenses in 2016 ( 307,780 thousand) and financial income in 2017 ( 41,466 thousand). This was essentially due to the recognition and subsequent remeasurement of the fair value of the bonds transferred and of the related derivative financial instruments. After excluding the above effects, net financial expenses are down 16,000 thousand, reflecting a combination of the following: Annual Report
172 a) b) c) non-recurring financial expenses linked to partial early repayment of certain loans from Atlantia, completed in 2016 prior to the issuer substitution (amounting to 19,435 thousand); interest and financial expenses paid in 2016, reflecting the loan granted by Atlantia in 2009 and repaid in May 2016 ( 15,764 thousand); the unwinding of a number of Forward-Starting Interest Rate Swaps on which fair value losses of 20,502 thousand, were incurred, following the issue and partial repurchase of certain bonds by Autostrade per l Italia (as part of the liability management transaction), completed in September 2017 and described above in note 7.15, Financial liabilities. Further details are contained in note 9.2, Financial risk management. Financial expenses from discounting of provisions for construction services required by contract and other provisions amount to 25,113 thousand for 2017, down 21,655 thousand compared with 2016 ( 46,768 thousand). This essentially reflects reductions in the discount rates applied in 2017, compared with the comparative period Share of profit/(loss) of investees accounted for using the equity method - 2,743 (- 7,733 thousand) The Share of (profit)/loss of investees accounted for using the equity method amounts to a profit of 2,743 thousand for 2017, essentially relating to the Group s share of the profit or loss of its associates and joint ventures and any dividends paid by these companies during Further details are provided in note 7.3, Investments Income tax expense thousand (- 318,788 thousand) A comparison of the net tax charges for the two comparative periods is shown below Increase/ (Decrease) IRES -241, ,433-79,791 IRAP -62,493-61,411-1,082 Current tax benefit of tax loss carry-forwards 4,813 3,747 1,066 Current tax expense -298, ,097-79,807 Recovery of previous years' income taxes 9,788 3,268 6,520 Previous years' income taxes Differences on current tax expense for previous years 9,512 3,193 6,319 Provisions 103, ,303-14,662 Releases -134, ,811-20,513 Changes in prior year estimates -1,228-9,512 8,284 Deferred tax income -31,911-5,020-26,891 Provisions -99,986-99, Releases 1,149 1, Changes in prior year estimates Deferred tax expense -98,837-97, Deferred tax income/(expense) -130, ,884-27,864 Income tax (expense)/benefit -420, , ,352 Income tax expense for 2017 amounts to 420,140 thousand, marking an increase of 101,352 thousand on 2016 ( 318,788 thousand). This is proportionately lower than the change in profit before tax, essentially having benefitted from the reduction in the IRES rate from 1 January
173 The following table shows the reconciliation of the IRES charge calculated at the statutory tax rate and the effective charge in the comparative periods. 000 Taxable income Taxable income Tax Tax rate Tax Tax rate Profit/(Loss) before tax from continuing operations 1,437, ,849 IRES tax expense computed using statutory rate applied by Parent Company 345, % 232, % Temporary differences deductible in future years 356,241 87, % 411,160 99, % Temporary differences taxable in future years -414,171-85, % -357,658-85, % Reversal of prior year temporary differences -401, , % -339,291-93, % Permanent differences % 15,268 3, % IRAP 62,493 61,411 Total 298, % 219, % 8.15 Profit/(Loss) from discontinued operations - 23,833 thousand ( 402,314 thousand) The composition of this item is shown in the following table Increase/ (Decrease) Operating income 140, , ,542 Operating costs -99, , ,534 Financial income 63, , ,933 Financial expenses -60, , ,700 Tax benefit/(expense) -20,942-52,974 32,032 Contribution to net profit of discontinued operations 23, , ,209 Share of profit/(loss) of investees accounted for using the equity method - -5,081 5,081 Other net profit/(loss) from discontinued operations - 3,353-3,353 Profit/(Loss) from discontinued operations 23, , ,481 The change reflects the different scopes of consolidation in the two comparative periods, following the restructuring of the Atlantia Group described in the introduction. In particular, this item includes: a) the contributions of ADA and its subsidiaries and of AID in 2017 through to the date of deconsolidation (February 2017 and March 2017, respectively); b) the contributions of Telepass, Stalexport Autostrady and the related subsidiaries (companies deconsolidated at the end of 2016) in 2016, in addition to those of the companies referred to in point a) above Earnings per share The following statement shows a breakdown of the calculation of earnings per share for the two comparative periods Weighted average of shares outstanding 622,027, ,027,000 Weighted average of shares outstanding 622,027, ,027,000 Profit for the period attributable to owners of the parent ( 000) 971, ,245 Earnings per share ( 000) Profit from continuing operations attributable to owners of the parent ( 000) 962, ,118 Basic earnings per share from continuing operations ( ) Profit/(Loss) from discontinued operations attributable to owners of the parent ( 000) 9, ,127 Basic earnings/(losses) per share from discontinued operations ( ) In the absence of options or convertible financial instruments issued by the Parent Company, diluted earnings per share coincides with the figure for basic earnings per share. Annual Report
174 9. Other financial information 9.1 Notes to the consolidated statement of cash flows Consolidated cash flow in 2017, compared with 2016, is analysed below. The consolidated statement of cash flows is included in the Consolidated financial statements. Cash flows during 2017 resulted in a reduction of 488,918 thousand in cash and cash equivalents (an increase of 607,975 thousand in 2016). Cash flows from operating activities amount to 1,912,812 thousand in 2017, up 65,283 thousand compared with 2016 ( 1,847,529 thousand) reflecting a combination of the following: a) the differing performance of movements in working capital and other changes in the two comparative periods, resulting in an inflow of 230,140 thousand in 2017, due essentially to an increase in trading liabilities and a reduction in trading assets, and an outflow of 215,139 thousand in 2016, primarily due to an increase in trading assets; b) a reduction of 379,996 million in operating cash flow, reflecting changes in the scope of consolidation between the two comparative periods. Cash from investing activities amounts to 963,089 thousand, marking a reduction of 1,588,240 thousand compared with the inflow of 625,151 thousand generated in 2016, primarily reflecting a combination of the following: a) the inflow generated in 2016 as a result of the impact of the transfer of the investments in Telepass and Stalexport Autostrady, totalling 1,554,717 thousand; b) deconsolidation of the cash and cash equivalents of the companies transferred to Atlantia as part of the Group restructuring described above, totalling 386,046 thousand; c) a reduction in investment in assets held under concession, after the related government grants, totalling 322,112 thousand, partly due to the Group s different scopes of consolidation in the two comparative periods. Net cash used for financing activities amounts to 1,448,343 thousand in 2017, marking a reduction of 450,230 thousand compared with 2016 ( 1,898,573 thousand), primarily reflecting a combination of the following: a) the differing contribution in the comparative periods of cash flows from the net change in other current and non-current financial liabilities, represented by an inflow of 969,932 thousand in 2017 as a result of short-term loans disbursed by Atlantia in 2017, and an outflow of 321,989 thousand in 2016; b) the repayment of loans from the parent, Atlantia, totalling 1,100,572 thousand, in 2016; c) the distribution to Atlantia, in 2017, of a portion of the available reserves, amounting to 1,101,312 thousand; d) the increase in outflows to repay bonds and medium/long-term borrowings, after the related bond issues, amounting to 850,153 thousand. The following table shows net cash flows generated from discontinued operations, including the contributions of the French companies (Ecomouv, Ecomouv D&B and Tech Solutions Integrators), Telepass, Stalexport, ADA and the related subsidiaries in the two periods. These cash flows are 174
175 CASH FLOWS FROM DISCONTINUED OPERATIONS m Net cash generated from/(used in) operating activities Net cash generated from/(used in) investing activities Net cash generated from/(used in) financing activities included in the consolidated statement of cash flows under operating, investing and financing activities. 9.2 Financial risk management The Autostrade per l Italia Group s financial risk management objectives and policies In the normal course of business, the Group is exposed to: a) market risk, principally linked to the effect of movements in interest and foreign exchange rates on financial assets acquired and financial liabilities assumed; b) liquidity risk, with regard to ensuring the availability of sufficient financial resources to fund the Group s operating activities and repayment of the liabilities assumed; c) credit risk, linked to both ordinary trading relations and the likelihood of defaults by financial counterparties. The Group s financial risk management strategy is derived from and consistent with the business goals set by Atlantia s Board of Directors, as contained in the long-term plans approved annually by the Board, taking into account Atlantia s role in the management and coordination of Autostrade per l Italia. Market risk The adopted strategy for each type of risk aims, wherever possible, to eliminate interest rate and currency risks and minimise borrowing costs, whilst taking account of stakeholders interests, as defined in the Financial Policy as approved by the Board of Directors of the parent, Atlantia. Management of these risks is based on prudence and best market practice. The main objectives set out in this policy are as follows: a) to protect the scenario forming the basis of the long-term plan from the effect of exposure to currency and interest rate risks, in the latter case identifying the best combination of fixed and floating rates; b) to pursue a potential reduction of the Group s borrowing costs within the risk limits determined by the Board of Directors; c) to manage derivative financial instruments taking account of their potential impact on the results of operations and financial position in relation to their classification and presentation. The Group's hedges outstanding as at 31 December 2017 are classified, in accordance with IAS 39, either as cash flow or fair value hedges, depending on the type of risk hedged. Fair value measurement of derivative financial instruments is dealt with in note 3, Accounting standards and policies applied. Amounts in currencies other than the euro are converted using closing exchange rates published by the European Central Bank. As at 31 December 2017, the Group s portfolio also includes non-hedge accounting transactions, including the derivatives embedded in certain medium/long-term and short-term borrowings obtained by Autostrade per l Italia and Autostrade Meridionali, with a notional value of 245,000 thousand and fair value losses of 638 thousand. The residual average term to maturity of the Group s debt as at 31 December 2017 is six years and five months. The average cost of medium to long-term debt for 2017 was 3.6%. Monitoring is, moreover, intended to assess, on a continuing basis, counterparty creditworthiness and the degree of risk concentration. Annual Report
176 Interest rate risk This risk is linked to uncertainty regarding the performance of interest rates, and takes two forms: a) cash flow risk: linked to financial assets and liabilities with cash flows indexed to a market interest rate. In order to reduce the amount of floating rate debt, the Group has entered into interest rate swaps (IRSs), classified as cash flow hedges. The hedging instruments and the underlying financial liabilities have matching terms to maturity and notional amounts. Following tests of effectiveness, changes in fair value are recognised in other comprehensive income. Interest income or expense deriving from the hedged instruments is recognised simultaneously in profit or loss. As part of a liability management transaction by Autostrade per l Italia, in which the Company issued bonds with a notional value of 700,000 thousand, and at the same time bought back a portion of the bonds maturing in 2019, 2020 and 2021 (a total of 522,614 thousand). This was treated for accounting purposes as a non-substantial modification of the existing financial liabilities. The Forward-Starting Interest Rate Swaps entered into in June 2015, to hedge highly likely future financial liabilities to be entered into through to 2017, were unwound. At the date of unwinding these derivatives, fair value losses recognised in equity amounted to 27,461 thousand. A part of this amount, totalling 20,502 thousand, relating to the portion of the par value of the novated bonds, has been reclassified to profit or loss as a financial expense. The remaining fair value losses, totalling 6,959 thousand, will be reclassified to profit or loss on occurrence of the interest flows linked to the newly issued bonds, in keeping with the nature of these instruments as cash flow hedges. The cost of issuing these bonds, including the impact of the hedges, was therefore 2.32%; b) fair value risk: the risk of losses deriving from an unexpected change in the value fixed rate financial assets and liabilities following an unfavourable shift in the market yield curve. As a result of cash flow hedges, 98% of interest bearing debt is fixed rate. Currency risk Currency risk can result in the following types of exposure: a) economic exposure incurred through purchases and sales denominated in currencies other than the individual companies functional currency; b) translation exposure through equity investments in subsidiaries and associates whose financial statements are denominated in a currency other than the Group s functional currency; c) transaction exposure incurred by making deposits or obtaining loans in currencies other than the individual companies functional currency. The Group's prime objective of currency risk is to minimise transaction exposure through the assumption of liabilities in currencies other than the Group s functional currency. In particular, currency risk derives primarily from the presence of financial assets and liabilities denominated in currencies other than the Company's functional currency and linkeed to the issuer substitution completed in In this regard, following the above issuer substitution, the Group is party to Cross Currency Swaps (CCIRSs) linked to the bonds denominated in sterling (GBP) and yen (JPY). Whilst, from an operational viewpoint, these derivatives hedge the bonds exposure to currency risk, they do not meet all the requirements for classification as hedges under IAS 39. As a result they are classified, from an accounting point of view, as non-hedge accounting. 8% of the Group s debt is denominated in currencies other than the euro (sterling and yen). Taking account of the Cross Currency Swaps linked to the foreign currency bonds, the Group s net debt is, therefore, effectively not exposed to currency risk on translation. 176
177 The following table summarises outstanding derivative financial instruments as at 31 December 2017 (compared with 31 December 2016) and shows the corresponding market and notional values of the hedged financial asset or liability. The following schedules show the distribution of loan maturities outstanding as at 31 December 2017 and 31 December December December 2016 Type Purpose of hedge Fair value Fair value Notional amount asset/(liability) asset/(liability) Notional amount Cash flow hedges (1) Interest Rate Swaps Interest rate risk -129,946 2,406, ,234 3,130,233 Total -129,946 2,406, ,234 3,130,233 Fair value hedges (1) IPCA x CDI Swaps ,012 (2) 172,187 Total , ,187 Non-hedge accounting derivatives Cross Currency Swaps (1) Currency and interest rate risk -299, , , ,176 Derivatives embedded in loans Interest rate risk ,000-2,814 (3) 445,000 FX Forwards Currency risk ,492 (2) 35,548 Total -299,836 1,144, ,210 1,379,724 Total derivatives -429,782 3,551, ,456 4,682,144 of which: fair value (asset) - - fair value (liability) -429, ,456 (1) The fair value of cash flow hedges excludes accruals at the measurement date. (2) The fair value as at 31 December 2016 is classified in liabilities held for sale. (3) As at 31 December 2016, the balance included the fair value of Euribor floors embedded in outstanding loans granted by Cassa Depositi e Prestiti to Autostrade per l'italia. The floors were unwound following renegotiation of Autostrade per l'italia's committed lines of credit on 13 December The amounts in the above tables include interest payments and exclude the impact of any offset agreements. The time distribution of terms to maturity is based on the residual contract term or on the earliest date on which repayment of the liability may be required, unless a better estimate is available. The distribution for transactions with amortisation schedules is based on the date on which each instalment falls due. Annual Report
178 ( 000) Carrying amount Total contractual flows 31 December 2017 Within 12 Between 1 and months 2 years Between 3 and 5 years After 5 years Non-derivative financial liabilities Bond issues (A) 8,092,619-9,909, , ,948-2,775,558-6,017,837 Medium/long-term borrowings (1) Total bank borrowings 2,380,229-3,040, , , ,406-2,087,658 Total other borrowings 1,260,142-1,039,320-1,039, of which due to Atlantia 996,256-1,039,320-1,039, Total medium/long-term borrowings (B) 3,640,371-4,079,907-1,232, , ,406-2,087,658 Total non-derivative financial liabilities (C)= (A)+(B) 11,732,990-13,989,643-1,494,527-1,044,657-3,344,964-8,105,495 Derivatives (2) Interest rate swaps (3) 129, ,224-30,728-32, , ,048 Cross Currency Swaps (4) 299, ,848-14,548-14, ,472-64,634 Total derivatives 429, ,072-45,276-46, , ,682 (1) Future cash flows relating to interest on bond issues and floating rate loans have been projected on the basis of the latest established rate and applied and held constant to final maturity. (2) As at 31 December 2017, expected contractual flows are linked to the hedging of outstanding and highly likely future financial liabilities to meet funding requirements through to (3) Future cash flows relating to differentials on interest rate swaps (IRSs) have been projected on the basis of the latest interest rate fixed and held constant to the maturity of the contract. (4) Expected future cash flows from differentials on cross currency swaps have been projected on the basis of the exchange rate fixed at the measurement date. ( 000) Carrying amount Total contractual flows 31 December 2016 Within 12 Between 1 and months 2 years Between 3 and 5 years After 5 years Non-derivative financial liabilities (1) Bond issues (A) 9,572,598-10,395,051-1,160, ,986-3,811,989-4,999,460 Medium/long-term borrowings - - Total bank borrowings 3,130,217-3,973, , ,996-1,067,237-2,306,748 Total other borrowings 1,217,340-1,078,640-39,320-1,039, of which due to Atlantia 992,320-1,078,640-39,320-1,039, Total medium/long-term borrowings (B) 4,347,557-5,051, ,479-1,356,316-1,067,237-2,306,748 Total non-derivative financial liabilities (C)= (A)+(B) (2) 13,920,155-15,446,831-1,482,095-1,779,302-4,879,226-7,306,208 Derivatives (3) (4) Interest rate swaps (5) 196, ,693-27,076-38, , ,470 Cross Currency Swaps 281, ,736-12,640-12,890-37, ,324 IPCA x CDI Swaps (5) (6) 6,012 70,079-4,076 2,086 30,592 41,477 Total derivatives 484, ,350-43,792-48, , ,317 (1) Future cash flows relating to interest on bond issues and floating rate loans have been projected on the basis of the latest established rate and applied and held constant to final maturity. The balance includes the fair value of and flows relating to liabilities classified as held for sale as at 31 December (2) As at 31 December 2016, the balance of non-derivative financial liabilities includes amounts relating to financial liabilities included in liabilities related to discontinued operations. (3) As at 31 December 2016, expected contractual flows are linked to the hedging of outstanding and highly likely future financial liabilities to meet funding requirements through to (4) Expected future cash flows from differentials on derivatives have been projected on the basis of the exchange rate fixed at the measurement date. (5) Future cash flows relating to differentials on interest rate swaps (IRSs) and IPCA x CDI Swaps have been projected on the basis of the latest interest rate fixed and held constant to the maturity of the contract. (6) This fair value as at 31 December 2016 is classified in liabilities held for sale. The following table shows the time distribution of expected cash flows from cash flow hedges, and the financial years in which they will be recognised in profit or loss. 000 Interest rate swaps Derivative liabilities -129, ,477-30,448-28,985-60,646-19, , ,496-26,668-36,334-97,354-43,140 Total cash flow hedges -129, ,477-30,448-28,985-60,646-19, , ,496-26,668-36,334-97,354-43,140 Accrued expenses on cash flow hedges -9,531-7,262 Total cash flow hedge derivative assets/liabilities -139, ,477-30,448-28,985-60,646-19, , ,496-26,668-36,334-97,354-43, Carrying amount Expected cash flows (1) Expected cash flows (1) 31 December December 2016 Within 12 months 31 December 2017 Within 12 months Between 1 and 2 years Between 1 and 2 years Between 3 and 5 years Between 3 and 5 years Expected cash flows Interest rate swaps Income from cash flow hedges 13, ,718 11, ,767 Losses on cash flow hedges -143,664-25,177-33,659-56,475-28, ,001-26,131-35, ,244-46,007 Total income (losses) from cash flow hedges -129,946-25,177-33,659-56,475-14, ,234-26,131-35, ,244-34,240 After 5 years After 5 years Carrying amount (1) Expected cash flows (1) Within 12 months Within 12 months 31 December 2016 Between 1 and 2 years Between 1 and 2 years Between 3 and 5 years Between 3 and 5 years After 5 years After 5 years (1) Expected cash flows from swap differentials are calculated on the basis of market curves at the measurement date. Sensitivity analysis Sensitivity analysis describes the impact that the interest rate and foreign exchange movements to which the Group is exposed, would have had on the consolidated income statement for 2017 and on equity as at 31 December The interest rate sensitivity analysis is based on the 178
179 exposure of derivative and non-derivative financial instruments at the end of the year, assuming, in terms of the impact on the income statement, a 0.10% (10 bps) shift in the market yield curve at the beginning of the year, whilst, with regard to the impact of changes in fair value on other comprehensive income, the 10 bps shift in the curve was assumed to have occurred at the measurement date. The results of the analyses were: a) in terms of interest rate risk, an unexpected and unfavourable 0.10% shift in market interest rates would have resulted in a negative impact on the consolidated income statement, totalling 3,028 thousand, and on other comprehensive income, totalling 18,830 thousand, before the related taxation; b) in terms of currency risk, an unexpected and unfavourable 10% shift in the exchange rate would have resulted in a negative impact on the consolidated income statement, totalling 21,870 thousand. Liquidity risk Liquidity risk relates to the risk that cash resources may be insufficient to fund the payment of liabilities as they fall due. The Group believes that its ability to generate cash, the ample diversification of its sources of funding and the availability of committed and uncommitted lines of credit provides access to sufficient sources of finance to meet its projected financial needs. As at 31 December 2017, the Group has cash reserves of 4,191 million, consisting of: a) 2,401 million in investments and cash maturing in the short term ( 2,183 million), Autostrade per l'italia s cash and cash equivalents ( 748 million), essentially relating to Autostrade per l Italia s role as a provider of centralised treasury management, partially offset by short-term borrowings ( 530 million), primarily linked to the loan from Atlantia in the form of cash deposits with Autostrade per l'italia (excluding the loan to SAM with a face value of 245 million and renewed for a further 12 months as at 31 December 2017, given that the process of awarding the concession for the A3 motorway had yet to be completed); b) 235 million in term deposits allocated primarily to part finance the execution of specific construction services; c) 1,555 million in undrawn committed lines of credit. The Group has lines of credit with a weighted average residual term to maturity of approximately eight years and a weighted average residual drawdown period of approximately three years and eight months. Details of drawn and undrawn committed lines of credit are shown below. 000 Borrower Line of credit Drawdown period expires 31 December 2017 Final maturity Available Drawn Undrawn Autostrade per l'italia Medium/long-term committed EIB line 2013 "Environment and Motorway Safety" 31 Dec Sept Autostrade per l'italia Medium/long-term committed line from CDP Dec Dec , Autostrade per l'italia Revolving Line of Credit from CDP Oct Dec Autostrade Meridionali Short-term loan from Banco di Napoli 31 Dec Dec Lines of credit 2, ,555 Credit risk The Group manages credit risk essentially through recourse to counterparties with high credit ratings, with no significant credit risk concentrations as required by Financial Policy. Credit risk deriving from outstanding derivative financial instruments can also be considered marginal in that the counterparties involved are major financial institutions. There are no margin agreements providing for the exchange of cash collateral if a certain fair value threshold is exceeded. Provisions for impairment losses on individually material items, on the other hand, are established when there is objective evidence that the Group will not be able to collect all or any of the amount due. The amount of the provisions takes account of estimated future cash flows and the date of collection, any future recovery costs and expenses, and the value of any security and guarantee deposits received from customers. General provisions, based on the available historical Annual Report
180 and statistical data, are established for items for which specific provisions have not been made. Details of the allowance for bad debts for trade receivables are provided in note 7.7, Trading assets. 180
181 10. Other information 10.1 Operating and geographical segments The following table shows an analysis of the Autostrade per l Italia Group s revenue and noncurrent assets by geographical area. Revenue (*) Non-current assets (**) m December December 2016 Italy 4,052 4,024 18,501 18,905 Poland France Sub-total Europe 4,053 4,029 18,501 18,905 Chile USA Total 4,055 4,032 18,501 18,905 (*) Revenue does not include income from discontinued operations. (**) In accordance with IFRS 8, non-current assets do not include non-current financial assets or deferred tax assets. Other than the "Italian motorways" segment (including the motorway concessions held by the Italian companies), it is highlighted that the Autostrade per l'italia Group does not include other operating segments that exceed the materiality threshold established by IFRS 8, as a result, the Group no longer presents the segment information required by this standard Disclosure of non-controlling interests in consolidated companies As required by IFRS 12, a list of the principal consolidated companies with non-controlling interests as at 31 December 2017 (with the relevant comparatives as at 31 December 2016) is provided below. The complete list of the Group s investments as at 31 December 2017 is provided in Annex 1, The Autostrade per l Italia Group s scope of consolidation and investments. Non-controlling interests in consolidated companies Country Group interest 31 December December 2016 Non-controlling interests Group interest Non-controlling interests Autostrade Meridionali SpA Italy 58,98% 41,02% 58,98% 41,02% Catterick Investments Spólka z o.o. Poland 90,00% 10,00% - - Società Italiana per Azioni per il Traforo del Monte Bianco SpA Italy 51,00% 49,00% 51,00% 49,00% Raccordo Autostradale Valle d'aosta SpA Italy 24,46% 75,54% 24,46% 75,54% Società Autostrada Tirrenica SpA Italy 99,99% 0,01% 99,99% 0,01% Ecomouv' SAS France 70,00% 30,00% 70,00% 30,00% Infoblu SpA Italy 75,00% 25,00% 75,00% 25,00% There are no consolidated companies deemed to be material for the Autostrade per l Italia Group, in terms of the percentage interest held by non-controlling interests, for the purposes of the financial disclosures required by IFRS Guarantees The Group has certain personal guarantees in issue to third parties as at 31 December These include, listed by importance: a) guarantees issued by Autostrade per l Italia securing the bonds issued by Atlantia, amounting to a total of 1,200,000 thousand and representing 120% of par value, in return for which Autostrade per l Italia receives intragroup loans with the same terms to maturity and a face value of 1,000,000 thousand as at 31 December 2017; Annual Report
182 b) bank guarantees provided by Tangenziale di Napoli ( 26,150 thousand) to the Ministry of Infrastructure and Transport, as required by the covenants in the relevant concession arrangement; Shares in the investees, Tangenziale Esterna and Bologna & Fiera Parking, have also pledged to the respective providers of financing Reserves As at 31 December 2017, Group companies have recognised contract reserves quantified by contractors in relation to: a) investing activities, totalling 1,361 million ( 1,132 million as at 31 December 2016). Based on past experience, only a small percentage of the reserves will actually have to be paid to contractors and, in this case, will be accounted for as an increase in the cost of intangible assets deriving from concession rights; b) non-investing activities, amounting to approximately 24 million, the estimated future cost of which is covered by existing provisions in the consolidated financial statements Related party transactions This section describes the Autostrade per l Italia Group s principal transactions with related parties, identified as such according to the criteria in the procedure for related party transactions adopted by the parent, Atlantia, in application of art bis of the Italian Civil Code, the Regulations adopted by the Commissione Nazionale per le Società e la Borsa (the CONSOB) in Resolution of 12 March 2010, as amended. The Procedure, which is available for inspection at establishes the criteria to be used in identifying related parties, in distinguishing between transactions of greater and lesser significance and in applying the rules governing the above transactions of greater and lesser significance, and in fulfilling the related reporting requirements. The following table shows material amounts in the income statement and statement of financial position generated by the Autostrade per l Italia Group s related party transactions, broken down by nature of the transaction (trading or financial), including those with Directors, Statutory Auditors and key management personnel at Autostrade per l Italia. 182
183 Principal trading transactions with related parties Assets Liabilities Income Expenses Trading and other assets Trading and other liabilities Trading and other income Trading and other expenses m Assets related Liabilities Revenue from Other trading Other noncurrent Total Total consumable Service costs Staff costs operating Total Raw and Other Trade Current tax to Trade Current tax Other current related to construction and other Total receivables assets discontinued payables liabilities liabilities discontinued services and assets liabilities materials costs operations operations other income 31 December Sintonia Atlantia Total parents Bologna and Fiera Parking Pavimental Spea Engineering Total associates Autogrill AB Concessoes(**) Autostrade Brasil(**) Autostrade dell'atlantico(**) Autostrade Holding do Sur(**) Autostrade Indian Infrastructure(***) Electronic Transaction Consultants(**) Aeroporti di Roma group Stalexport group(*) Los Lagos Pavimental Polska Sociedad Gestion Vial(**) Telepass(*) Telepass Pay(*) Total affiliates ASTRI pension fund CAPIDI pension fund Total pension funds Key management personnel Total key management personnel (1) TOTAL December Edizione Sintonia Atlantia Total parents Bologna and Fiera Parking Pavimental Spea Engineering Total associates Rodovias do Tietê Total joint ventures Autogrill Aeroporti di Roma group Stalexport group(*) Pavimental Polska Pune Solapur Expressways Private Telepass(*) Other affiliates Total affiliates ASTRI pension fund CAPIDI pension fund Total pension funds Key management personnel Total key management personnel (1) TOTAL (*) These companies were consolidated until the end of December (**) This company was consolidated until 28 February (***) This company was consolidated until 31 March (1) Autostrade per l'italia's "key management personnel" means the Company's Directors, Statutory Auditors and other key management personnel as a whole. Expenses for each period include emoluments, salaries, benefits in kind, bonuses and other incentives (including the fair value of share-based incentive plans) for Autostrade per l'italia staff and staff of the relevant subsidiaries. In addition to the information shown in the table, the consolidated financial statements also include contributions of 1.4 million paid on behalf of Directors, Statutory Auditors and other key management personnel and the related liabilities of 1.5 million. Annual Report
184 Principal financial transactions with related parties Assets Liabilities Income Expenses Financial assets Financial liabilities Financial income Financial expenses m Current financial assets deriving from government grants Intercompany current account receivables Other current financial assets Total Medium/longterm borrowings Short-term borrowings Intercompany current account payables Current portion of medium/longterm financial liabilities Other current borrowings Total Other financial income Total Other financial expenses Total 31 December Atlantia , , Total parents , , Pavimental Pedemontana Veneta (in liquidation) Società Infrastrutture Toscane (in liquidation) Spea Engineering Total associates Autogrill Autostrade dell'atlantico(**) Telepass(*) Total affiliates TOTAL , , December Atlantia , Total parents , Pavimental Pedemontana Veneta (in liquidation) Spea Engineering Total associates Autogrill Telepass(*) Total affiliates TOTAL , (*) This company was consolidated until the end of December (**) This company was consolidated until 28 February
185 As a matter of fact related party transactions do not include transactions of an atypical or unusual nature, and are conducted on an arm s length basis. The principal transactions entered into by the Group with related parties are described below. The Autostrade per l Italia Group s transactions with its parents With regard to trading relations, Autostrade per l Italia provides administrative, financial and tax services to Atlantia. As a result of the tax consolidation arrangement headed by Atlantia, in which Autostrade per l Italia and certain of its Italian subsidiaries participate, as at 31 December 2017 the Group has recognised tax liabilities and assets due to and from Atlantia of 24.9 million and 87.1 million, respectively. As at 31 December 2017, the Group reports tax assets due from the parent, Sintonia (which in 2012 absorbed Schemaventotto), totalling 6.3 million, relating to amounts receivable in the form of tax rebates applied for by Schemaventotto for income tax (IRES) paid during the period when this company headed the tax consolidation arrangement. With regard to transactions of a financial nature, as at 31 December 2017, financial liabilities (including the current portion) repayable to Atlantia amount to 1,507.8 million, marking an increase of million compared with 31 December 2016 ( 1,202.2 million). This essentially reflects an increase in short-term loans linked to cash deposits (totalling 500,000 thousand as at 31 December 2017) by Atlantia. Also, as a result of the centralised treasury services provided to the Atlantia Group by Autostrade per l Italia, the current account between the latter and Atlantia has a debit balance of 7.4 million as at 31 December Finally, financial expenses payable to the parent, Atlantia, in 2017 amount to 50.5 million, a reduction of million compared with 2016 (when the figure was million). The essentially reflects the impact of the issuer substitution carried out by Autostrade per l Italia and Atlantia in December The Autostrade per l Italia Group s transactions with other related parties With regard to transaction with other related parties, the above tables also show, for 2017, amounts resulting from transactions with AID, ADA and the related subsidiaries. The Group s investments in these companies were transferred to the parent, Atlantia, as part of the restructuring of the Atlantia Group described in note 6, Corporate actions. The Group reports trading liabilities payable to the associates, Pavimental and Spea. As at 31 December 2017, trade payables due to these companies total million and 72.8 million, respectively. These payables essentially regard maintenance and construction services provided by these companies to the Group s operators and regarding motorway infrastructure. In addition, the Group reports costs of million payable to Pavimental in return for the above services provided. Trade receivables due from the affiliate, Telepass, the investment in which was transferred to Atlantia at the end of 2016, amount to 28.1 million as at 31 December These primarily regard the fact that Telepass collects tolls on the Group s behalf through its Viacard and Telepass payment systems. With regard to relations between the Autostrade per l Italia Group s motorway operators and the Autogrill group (considered a related party as it is under the common control of Edizione Srl), as at 31 December 2017, Autogrill holds 102 food service concessions for service areas along the Group s motorway network. In 2017, the Group earned revenue of approximately 73.7 million on transactions with Autogrill, including 63.2 million in royalties deriving from the management of service areas. This recurring income is generated by contracts entered into over various years, of which a large part was awarded as a result of transparent and non-discriminatory competitive tenders. As at 31 December 2017, trading assets receivable from Autogrill amount to 31.9 million. Annual Report
186 Transactions of a financial nature as at 31 December 2017 include, as part of the Autostrade per l Italia s provision of centralised treasury services for the Atlantia Group, intercompany current account receivables of million due from Pavimental, whilst the amount due from Telepass totals million Disclosures regarding share-based payments In order to incentivise and foster the loyalty of directors and/or employees holding key positions and responsibilities within Atlantia or in Group companies, and to promote and disseminate a value creation culture in all strategic and operational decision-making processes, driving the Group s growth and boosting management efficiency, a number of share incentive plans based on Atlantia s shares have been introduced in previous years. The plans entail payment in the form of shares or cash and are linked to the achievement of predetermined corporate objectives. There were no changes, during 2017, in the share-based incentive plans already adopted by the Group as at 31 December 2015 and originally approved by the Annual General Meetings of Atlantia shareholders held on 20 April 2011 (later amended by subsequent Annual General Meetings) and 16 April In addition, two new plans have been approved in These are the 2017 Phantom Share Option Plan and the 2017 Phantom Share Grant Plan and are described below. Finally, on 2 August 2017, the General Meeting of Atlantia s shareholders, held in extraordinary session in order to approve the capital increase and amendments to the articles of association to service the Offer for Abertis, also approved adoption of a supplementary phantom share option plan for a limited number of core people involved in the process of building and creating value at the new Group that will be formed through the Company s integration with Abertis, should the tender offer be successful. Under this supplementary plan (which entails the award of phantom share options free of charge, being options that give beneficiaries the right to payment of a gross amount in cash, computed on the basis of the increase in the value of Atlantia s ordinary shares over a determinate period), no awards were therefore made in Details of each plan are contained in specific information circulars prepared pursuant to art. 84- bis of CONSOB Regulation 11971/1999, as amended, and in Atlantia s Remuneration Report prepared pursuant to art. 123 ter of the Consolidated Finance Act. These documents, to which reference should be made, are published in the Remuneration section of Atlantia s website at The following table shows the main aspects of existing incentive plans as at 31 December 2017, including the options and units awarded to directors and employees of the Atlantia Group and changes during 2017 (in terms of new awards and the exercise, conversion or lapse of rights). The table also shows the fair value (at the grant date) of each option or unit awarded, as determined by a specially appointed expert, using the Monte Carlo model and other assumptions. The amounts have been adjusted for the amendments to the plans originally approved by Atlantia s shareholders, which were required to ensure plan benefits remained substantially unchanged despite the dilution caused by the bonus issues approved by Atlantia s shareholders on 20 April 2011 and 24 April
187 Number of options/units awarded (***) Vesting date Exercise / Grant date Exercise price ( ) Fair value of each option or unit at grant date ( ) Expected expiration at grant date (years) Risk free interest rate used Expected volatility (based on historic mean) Expected dividends at grant date 2011 SHARE OPTION PLAN Options outstanding as at 1 January May 2011 grant 279, May May % 25.2% 4.09% - 14 October 2011 grant 13, May May (*) (*) (*) (*) (*) - 14 June 2012 grant 14, May May (*) (*) (*) (*) (*) 345, Jun Jun % 28.0% 5.05% - 8 November 2013 grant 1,592,367 8 Nov Nov % 29.5% 5.62% - 13 May 2014 grant 173,762 N/A (**) 14 May 2017 N/A (**) (**) (**) (**) (**) - 15 June 2015 grant 52,359 N/A (**) 14 Jun 2018 N/A (**) (**) (**) (**) (**) - 8 November 2016 grant 526,965 N/A (**) 9 Nov 2019 N/A (**) (**) (**) (**) (**) - options exercised -981,459 - options lapsed -279,110 Total 1,739,314 Changes in options in options exercised -1,461,216 - options lapsed -50,722 Options outstanding as at 31 December , SHARE GRANT PLAN Units outstanding as at 1 January May 2011 grant 192, May May 2016 N/A ,0-5,0 2.45% 26.3% 4.09% - 14 October 2011 grant 9, May May 2016 N/A (*) (*) (*) (*) (*) - 14 June 2012 grant 10, May May 2016 N/A (*) (*) (*) (*) (*) 348, Jun Jun 2017 N/A ,0-5,0 1.12% 29.9% 5.05% - 8 November 2013 grant 209,420 8 Nov Nov 2018 N/A ,0-5,0 0.69% 28.5% 5.62% - units converted into shares on 15 May ,439 - units converted into shares on 16 May ,197 - units converted into shares on 16 June ,582 - units lapsed -64,120 Total 406,576 Changes in units in units converted into shares on 15 June ,572 - units converted into shares on 13 Nov ,159 - units lapsed -95,509 Units outstanding as at 31 December ,336 MBO SHARE OPTION PLAN Units outstanding as at 1 January May 2012 grant 96, May May 2015 N/A % 27.2% 4.55% - 14 June 2012 grant 4, May May 2015 N/A (*) (*) (*) (*) (*) - 2 May 2013 grant 41,077 2 May May 2016 N/A % 27.8% 5.38% - 8 May 2013 grant 49,446 8 May May 2016 N/A % 27.8% 5.38% - 12 May 2014 grant 61, May May 2017 N/A % 28.2% 5.47% - units converted into shares on 15 May ,096 - units converted into shares on 3 May ,077 - units converted into shares on 9 May ,446 Total 61,627 Changes in units in units converted into shares on 15 May ,627 Units outstanding as at 31 December (*) These options and units were awarded as a result of bonus issues by Atlantia and, therefore, do not represent the award of new benefits. (**) These are phantom share options granted in place of certain conditional rights included in the grants of 2011 and 2012 which, therefore, do not represent the award of new benefits. (***) These are options and units awarded to beneficiaries throughout the Atlantia Group and not only to those at Autostrade per l'italia Share Option Plan Description As approved by the Annual General Meeting of Atlantia s shareholders on 20 April 2011, and amended by the Annual General Meeting of Atlantia s shareholders on 30 April 2013 and 16 April 2014, the 2011 Share Option Plan entails the award of up to 2,500,000 options free of charge in three annual award cycles (2011, 2012 and 2013). Each option will grant beneficiaries the right to purchase one ordinary Atlantia share held in treasury, with settlement involving either physical delivery or, at the beneficiary s option, a cash payment equivalent to the proceeds from the sale of the shares on the stock exchange organised and managed by Borsa Italiana SpA, after deduction of the full exercise price. The exercise price is equivalent to the average of the official prices of Atlantia s ordinary shares in the month prior to the date on which Atlantia s Board of Directors announces the beneficiary and the number of options to be awarded. The options granted will vest in accordance with the Plan terms and conditions and, in particular, only if, on expiration of the vesting period (three years from the date of award of the options to beneficiaries by the Board of Directors), cumulative FFO for the three annual reporting periods preceding expiration of the vesting period, adjusted for a number of specific items (total Annual Report
188 operating cash flow of the Group, Atlantia or of certain of its subsidiaries depending on the role held by the various beneficiaries of the Plan), is higher than a pre-established target, unless otherwise decided by the Board of Directors, which has the authority to assign beneficiaries further targets. Vested options may be exercised, in part, from the first day following expiration of the vesting period and, in part, from the end of the first year following expiration of the vesting period and, in any event, in the three years following expiration of the vesting period (subject to the clause in the Plan terms and conditions requiring executive Directors and key management personnel to retain a minimum holding). The maximum number of exercisable options will be calculated on the basis of a mathematical algorithm that takes account, among other things, of the current value and the exercise price, plus any dividends paid, so as to cap the realisable gain. Changes in options in 2017 During 2017, with regard to the second and third award cycles (the vesting periods for both of which have expired), a number of beneficiaries exercised vested options and paid the established exercise price; this entailed the allocation to them of Atlantia s ordinary shares held by the Company as treasury shares. This resulted in the transfer of: a) 33,259 of Atlantia s ordinary shares to beneficiaries in connection with the second cycle, the vesting period for which expired on 14 June 2015; moreover, 14,774 phantom options awarded in 2015 were exercised; b) 1,016,629 of Atlantia s ordinary shares to beneficiaries in connection with the third cycle; moreover, 396,554 phantom options awarded in 2016 were exercised. Thus, as at 31 December 2017, taking into account lapsed options at that date, the remaining options outstanding total 227,376, including 112,644 phantom options awarded under the second and third cycles (the unit fair values of which, as at 31 December 2017, were measured as and 14.22, in place of the unit fair values at the grant date) Share Grant Plan Description As approved by the Annual General Meeting of Atlantia s shareholders on 20 April 2011, and amended by the Annual General Meeting of Atlantia s shareholders on 30 April 2013, the 2011 Share Grant Plan entails the grant of up to 920,000 units free of charge in three annual award cycles (2011, 2012 and 2013). Each unit will grant beneficiaries the right to receive one Atlantia ordinary share held in treasury, with settlement involving either physical delivery or, at the beneficiary s option, a cash payment equivalent to the proceeds from the sale of the shares on the stock exchange organised and managed by Borsa Italiana SpA. The units granted will vest in accordance with the Plan terms and conditions and, in particular, only if, on expiration of the vesting period (three years from the date the units are granted to beneficiaries by the Board of Directors), cumulative FFO for the three annual reporting periods preceding expiration of the vesting period, adjusted for a number of specific items (total operating cash flow of the Group, Atlantia or of certain of its subsidiaries depending on the role held by the various beneficiaries of the Plan) is higher than a pre-established target, unless otherwise decided by Atlantia s Board of Directors. Vested units may be converted into shares, in part, after one year from the date of expiration of the vesting period and, in part, after two years from the date of expiration of the vesting period (subject to the clause in the Plan terms and conditions requiring executive Directors and key management personnel to maintain a minimum holding). The number of convertible units will be calculated on the basis of a mathematical algorithm that takes account, among other things, of the current value and initial value of the shares so as to cap the realisable gain. Changes in units in 2017 With regard to the second award cycle, the vesting period for which expired on 14 June 2015, on 15 June 2017 further vested units were converted, in accordance with the Plan Terms and 188
189 Conditions, into Atlantia s ordinary shares. As a result, Plan beneficiaries received 136,572 shares held by the Parent Company as treasury shares. The second award cycle for this Plan has thus also expired. Moreover, on 13 November 2017, the units awarded during the third award cycle (the vesting period for which expired on 9 November 2017) were converted, in accordance with the Plan Terms and Conditions, into Atlantia s ordinary shares. As a result, Plan beneficiaries received 77,159 shares held by the Parent Company as treasury shares. The remaining options are convertible into Atlantia s ordinary shares from 9 November As at 31 December 2017, taking into account lapsed units at that date, the remaining units outstanding total 97,336. MBO Share Grant Plan Description As approved by the Annual General Meetings of Atlantia s shareholders on 20 April 2011 and amended by the Annual General Meetings of 30 April 2013 and 16 April 2014, the MBO Share Grant Plan, serving as part payment of the annual bonus for the achievement of objectives assigned to each beneficiary under the Management by Objectives (MBO) plan adopted by the Atlantia Group in 2011, 2012 and 2013, entails the grant of up to 340,000 units free of charge annually for three years (2012, 2013 and 2014). Each unit will grant beneficiaries the right to receive one ordinary share in Atlantia SpA held in treasury. The units granted (the number of which is based on the unit price of the company s shares at the time of payment of the bonus, and on the size of the bonus effectively awarded on the basis of achievement of the assigned objectives) will vest in accordance with the Plan terms and conditions, on expiration of the vesting period (three years from the date of payment of the annual bonus to beneficiaries, following confirmation that the objectives assigned have been achieved). Vested units will be converted into a maximum number of shares on expiration of the vesting period (subject to the clause in the Plan terms and conditions requiring executive Directors and key management personnel to maintain a minimum holding), on the basis of a mathematical algorithm (that could result in the award of certain additional units) that takes account, among other things, of the current value and initial value of the shares, plus any dividends paid during the vesting period, so as to cap the realisable gain. Changes in the units in 2017 On 10 March 2017, Atlantia s Board of Directors, exercising the authority provided for in the Plan Terms and Conditions, awarded the plan beneficiaries a gross amount in cash in place of the additional units to be awarded as a result of the payment of dividends during the vesting period. This amount is computed in such a way as to enable beneficiaries to receive a net amount equal to what they would have received in case they had been awarded a number of Atlantia shares equal to the additional units and sold these shares in the market. In addition, on 12 May 2017, the vesting period for the 2013 MBO Plan expired. In accordance with the Terms and Conditions of this plan, all the units awarded thus vested, resulting in their conversion into Atlantia s ordinary shares and the allocation to beneficiaries of 61,627 shares held by the parent as treasury shares. As at 31 December 2017, all the units awarded under this plan have thus lapsed. The following table shows the main aspects of the Autostrade per l Italia Group s cash-settled incentive plans outstanding as at 31 December The table shows the options awarded to directors and employees of Autostrade per l Italia and its subsidiaries at this date and changes (in terms of new awards and the exercise, conversion or lapse of rights and transfers/secondments from/to other Atlantia Group companies) during The table also shows the fair values (at the Annual Report
190 grant date) of outstanding options, as determined by a specially appointed expert, using the Monte Carlo model and other assumptions. Number of options/units awarded (***) Vesting date Exercise/ Grant date Exercise price ( ) Fair value of each option or unit at grant date ( ) Expected expiration at grant date (years) Risk free interest rate used Expected volatility (based on historic mean) Expected dividends at grant date 2014 PHANTOM SHARE OPTION PLAN Options outstanding as at 1 January May 2014 grant 1,566,736 9 May May 2020 N/A (*) ,0-6,0 1.10% 28.9% 5.47% - deconsolidation of companies -125,222-8 May 2015 grant 1,436,941 8 May May 2021 N/A (*) ,0-6,0 1.01% 25.8% 5.32% - 10 Jun 2016 grant 1,617, June June 2022 N/A (*) ,0-6,0 0.61% 25.3% 4.94% - transfers/secondments 17,525 - options lapsed -151,213 Total 4,362,059 Changes in options in options exercised -456,694 - transfers/secondments -421,230 - options lapsed -121,942 Options outstanding as at 31 December ,362, PHANTOM SHARE OPTION PLAN Options outstanding as at 1 January Changes in options in May 2017 grant 882,917 1 July /07/23 N/A (*) ,13-6, % 25.6% 4.40% - transfers/secondments 6,717 - options lapsed -33,220 Options outstanding as at 31 December , PHANTOM SHARE GRANT PLAN Options outstanding as at 1 January Changes in options in May 2017 grant 79, June July 2023 N/A (*) ,13-6, % 25.6% 4.40% - transfers/secondments options lapsed -3,307 Options outstanding as at 31 December ,667 (*) Given that these are cash bonus plans, involving payment of a gross amount in cash, the 2014 Phantom Share Option Plan and the 2017 Phantom Share Option Plan do not require an exercise price. However, the Terms and Conditions of the plans indicate an "Exercise price" (equal to the arithmetic mean of Atlantia's share price in a determinate period) as the basis on which to calculate the gross amount to be paid to beneficiaries Phantom Share Option Plan Description On 16 April 2014, the Annual General Meeting of Atlantia s shareholders approved the new incentive plan named the 2014 Phantom Share Option Plan, subsequently approved, within the scope of its responsibilities, by Autostrade per l Italia s Boards of Directors on 13 June The plan entails the award of phantom share options free of charge in three annual award cycles (2014, 2015 and 2016), being options that give beneficiaries the right to payment of a gross amount in cash, computed on the basis of the increase in the value of Atlantia s ordinary shares in the relevant three-year period. In accordance with the Terms and Conditions of the plan, the options granted will only vest if, at the end of the vesting period (equal to three years from the date on which the options were awarded to the beneficiaries by the Board of Directors), a minimum operating/financial performance target for (alternatively) the Group, the Company or for one or more of Autostrade per l Italia s subsidiaries, as indicated for each Plan beneficiary (the hurdle ), has been met or exceeded. The vested options may be exercised from, in part, the first day immediately following the vesting period, with the remaining part exercisable from the end of the first year after the end of the vesting period and, in any event, in the three years after the end of the vesting period (without prejudice to the Terms and Conditions of the plan as regards minimum holding requirements for executive directors and key management personnel). The number of exercisable options is to be computed in application of a mathematical algorithm, taking into account, among other things, the current value, the target value and the exercise price, in order to cap the realisable gain. 190
191 Changes in options in 2017 The vesting period for the first cycle of the Plan expired on 9 May From this date until 31 December 2017 a total of 456,694 phantom options awarded under the first award cycle were exercised. Thus, as at 31 December 2017, taking into account lapsed options at that date, and changes resulting from transfers and/or secondments of staff to and from other Autostrade per l Italia Group companies, the remaining options outstanding total 3,362,193, including 727,818 phantom options awarded under the first cycle, 1,249,825 phantom options awarded under the second cycle and 1,384,550 phantom options awarded under the third cycle (the unit fair values of which as at 31 December 2017 were measured as 5.63, 3.37 and 3.05, respectively, in place of the unit fair values at the grant date) Phantom Share Option Plan Description On 21 April 2017, the Annual General Meeting of Atlantia s shareholders approved the new incentive plan named the 2017 Phantom Share Option Plan. The Plan entails the award of phantom share options free of charge in three annual award cycles (2017, 2018 and 2019), to be awarded to directors and employees with key roles within the Group. The options grant beneficiaries the right to payment of a gross amount in cash, computed on the basis of the increase in the value of Atlantia s ordinary shares in the relevant period. In accordance with the Terms and Conditions of the Plan, the options granted will only vest if, at the end of the vesting period (15 June 2020 for options awarded in 2017, 15 June 2021 for options awarded in 2018 and 15 June 2022 for options awarded in 2019), one or more minimum operating/financial performance targets for (alternatively) the Group, the Company or one or more of Autostrade per l Italia s subsidiaries, as indicated for each Plan beneficiary (the hurdle ), have been met or exceeded. A portion of the vested options may be exercised from the 1 July immediately following the end of the vesting period, with the remaining options exercisable from the end of the first year after the end of the vesting period and, in any event, in the three years from 1 July of the year in which the vesting period ends (without prejudice to the Terms and Conditions of the Plan as regards minimum holding requirements for executive directors and key management personnel). The number of exercisable options is to be computed in application of a mathematical algorithm, taking into account, among other things, the current value, the target value and the exercise price, in order to cap the realisable gain. Changes in options in 2017 On 12 May 2017, Atlantia s Board of Directors selected the beneficiaries for the first cycle of the Plan in question (subsequently approved, within the scope of its responsibilities, by Autostrade per l Italia s Boards of Directors on 8 June 2017 and then by the boards of its subsidiaries). This resulted in the award of a total of 882,917 phantom options with a vesting period from 12 May 2017 to 15 June 2020 and an exercise period from 1 July 2020 to 30 June As at 31 December 2017, taking into account lapsed options and transfers/secondments from/to other Atlantia Group companies, the remaining options outstanding amount to 856,414. The unit fair value of the options at that date was remeasured as 2.90, in place of the unit fair value at the grant date Phantom Share Grant Plan Description On 21 April 2017, the Annual General Meeting of Atlantia s shareholders approved the new incentive plan named the 2017 Phantom Share Grant Plan. The Plan entails the award of phantom shares free of charge in three annual award cycles (2017, 2018 and 2019), to be awarded to directors and employees with key roles within the Group. The units grant Annual Report
192 beneficiaries the right to payment of a gross amount in cash, computed on the basis of the value of Atlantia s ordinary shares in the period prior to the period in which the units are awarded. In accordance with the Terms and Conditions of the Plan, the units granted will only vest if, at the end of the vesting period (15 June 2020 for units granted in 2017, 15 June 2021 for units granted in 2018 and 15 June 2022 for units granted in 2019), one or more minimum operating/financial performance targets for (alternatively) the Group, the Company or one or more of Autostrade per l Italia s subsidiaries, as indicated for each Plan beneficiary (the hurdle ), have been met or exceeded. A portion of the vested units will be convertible from the 1 July immediately following the end of the vesting period, with the remaining options exercisable from the end of the first year of the exercise period and, in any event, in the three years from 1 July of the year in which the vesting period ends (without prejudice to the Terms and Conditions of the Plan as regards minimum holding requirements for executive directors and key management personnel). The number of exercisable options is to be computed in application of a mathematical algorithm, taking into account, among other things, the current value and initial value of the shares, in order to cap the realisable gain. Changes in units in 2017 On 12 May 2017, Atlantia s Board of Directors selected the beneficiaries for the first cycle of the Plan in question (subsequently approved, within the scope of its responsibilities, by Autostrade per l Italia s Boards of Directors on 8 June 2017 and then by the boards of its subsidiaries). This resulted in the award of a total of 79,305 units, vesting in the period from 12 May 2017 to 15 June 2020 and exercisable in the period from 1 July 2020 to 30 June As at 31 December 2017, taking into account lapsed options and transfers/secondments from/to other Atlantia Group companies, the remaining units outstanding amount to 76,667. The unit fair value of the options at that date was remeasured as 26.44, in place of the unit fair value at the grant date. The prices of Atlantia s ordinary shares in the various periods covered by the above plans are shown below: a) price as at 31 December 2017: 26.43; b) price as at 12 May 2017 (the grant date for new options or units, as described): 24.31; c) the weighted average price for 2017: d) the weighted average price for the period 12 May December 2017: In accordance with the requirements of IFRS 2, as a result of existing plans, in 2017 the Group has recognised staff costs of 11,923 thousand, based on the accrued fair value of the options and units awarded at that date, including 2,028 thousand accounted for as an increase in equity reserves. In contrast, the liabilities represented by phantom share options outstanding as at 31 December 2017 have been recognised in other current and non-current liabilities, based on the assumed exercise date. 192
193 10.7 Significant legal and regulatory aspects This section describes the main disputes outstanding and key regulatory aspects of importance to the Group s operators through to the date of approval of these consolidated financial statements. Current disputes are unlikely to give rise to significant charges for Group companies, in addition to the provisions already accounted for in the consolidated financial statements as at and for the year ended 31 December Italian motorways Toll increases with effect from 1 January 2017 The Minister of Infrastructure and Transport and Minister of the Economy and Finance issued the related decrees on 30 December 2016, determining the toll increases to come into effect from 1 January 2017: a) Autostrade per l Italia was to apply a toll increase of 0.64%, compared with the 0.77% requested. The reason given for the reduction with respect to the requested shortfall (equal to 0.13%) was that additional documentation was required in respect of the X and K tariff components. Once these documents had been submitted Autostrade per l Italia, on 21 September 2017, the Grantor decided to allow almost all the expenditure detailed in the additional documentation, announcing the need to resubmit the same documents when applying for the toll increase for 2018; b) Raccordo Autostradale Valle d Aosta and Autostrada Tirrenica were to apply an increase based on the target inflation rate (0.90%), whilst determining that any over or under recoveries, including those for previous years, will be assessed following revision of the operators financial plans. The companies thus challenged the related decree before the Regional Administrative Court. On 12 September 2017, the Court partially upheld the challenge brought by Raccordo Autostradale Valle d Aosta, cancelling the above provision; c) Tangenziale di Napoli was to apply a toll increase of 1.76%, thus lower than the requested increase, and that any over or under recoveries, including those for previous years, will be assessed following revision of the operator s financial plans. The company thus challenged the related decree before the Regional Administrative Court; d) Autostrade Meridionali, as in previous years, did not have the right to apply any toll increase, in view of the fact that its concession expired on 31 December Autostrade Meridionali has brought a legal challenge contesting the above decision, in line with the approach adopted in previous years, and for 2014, 2015 and 2016, the courts found in the company s favour. Campania Regional Administrative Court also upheld Autostrade Meridionali s challenge with respect to the increase for 2017, declaring the failure to allow the requested toll increase unlawful. In the case of Traforo del Monte Bianco, which operates under a different regulatory regime, on 2 December 2016, the Intergovernmental Committee for the Mont Blanc Tunnel gave the go-ahead for a toll increase of 0.06%, representing the average of the inflation rates registered in Italy (- 0.07%) and France (+0.2%). Toll increases with effect from 1 January 2018 The Minister of Infrastructure and Transport and Minister of the Economy and Finance issued decrees on 29 December 2017, determining the toll increases to come into effect from 1 January Specifically: a) Autostrade per l Italia was to apply a toll increase of 1.51%, including 0.49% as the inflationlinked component, 0.64% to provide a return capital expenditure via the X tariff component and -0.04% to provide a return on investment via the K tariff component (the shortfall in the increase awarded for 2017 was recouped for both these components) and 0.43% to recover the reduction in revenue earned in the period from June 2014 to 2017 as a result of the discounted tolls for frequent motorway users, introduced by the Memorandum of Understanding entered into with the Ministry. The shortfall in the increase with respect to Annual Report
194 the requested amount, equal to 0.01%, regards the X component. In response, as in 2017, the Company has submitted additional documentation to support its request, with the aim of recouping the shortfall as part of the toll increase for 2019; b) Raccordo Autostradale Valle d Aosta was awarded a toll increase of 52.69%, compared with a request for 81.12%. The company has challenged the decree before the Regional Administrative Court; c) Autostrade Meridionali was awarded a toll increase of 5.98%, compared with a request for 9.9%; d) Autostrade Tirrenica was awarded a toll increase of 1.33%, compared with a request for 36.51%. The company has challenged the decree before the Regional Administrative Court; e) Tangenziale di Napoli was awarded a toll increase of 4.31%, inclusive of the increase designed to make up for the lack of any increases in previous years, compared with a requested increase of 1.93%. The increase was awarded on the basis of the revised financial plan annexed to the Addendum signed on 8 September 2017 and, later, at the Grantor s request, signed digitally on 22 February The Addendum will be effective once it has been formally approved by decree, as required by law, and once the decree has been registered with Italy s Court of Auditors. In the case of Traforo del Monte Bianco which, as noted above, operates under a different regulatory regime, on 24 November 2017, the Intergovernmental Committee for the Mont Blanc Tunnel gave the go-ahead for a toll increase of 1.09%. This is based on the average of the inflation rates registered in Italy and France from 1 September 2016 to 31 August 2017, in addition to an extra 0.95% increase determined by the Committee. From 1 April 2018, tolls for all Euro 3 category heavy vehicles of over 3.5 tonnes, will be increased by 5%. II Addendum to Autostrade per l'italia s Single Concession Arrangement A II Addendum to Autostrade per l Italia s Single Concession Arrangement was signed on 10 July 2017, replacing the previous addendum signed on 10 December 2015, for which the related approval process had not been completed. The Addendum governs the inclusion of the Casalecchio Interchange Northern section among the operator s investment commitments in the Single Concession Arrangement. The project will involve expenditure of up to approximately 158 million, including around 2 million already incurred for design work, and almost 156 million to be paid to ANAS, which will carry out the work and then operate the infrastructure. This amount will be paid to ANAS on a stage of completion basis and under a specific agreement to be executed. The amount will then be recouped by Autostrade per l'italia through the specific K tariff component. During the approval process, the Grantor requested that the document be signed digitally. The Addendum was then signed on 22 February 2018 and will be effective once it has been approved by the Ministry of Infrastructure and Transport and the Ministry of the Economy and Finance, and once the related decree has been registered by Italy s Court of Auditors. Addendum to Tangenziale di Napoli s Single Concession Arrangement On 8 September 2017, the Addendum to Tangenziale di Napoli s Single Concession Arrangement was signed. The Addendum sets out the results of the five-yearly review ( ) of the financial plan annexed to the Arrangement. During the approval process, the Grantor requested that the document be signed digitally. The Addendum was then signed on 22 February 2018 and will be effective once it has been approved by the Ministry of Infrastructure and Transport and the Ministry of the Economy and Finance, and once the related decree has been registered by Italy s Court of Auditors. Agreement on the upgrade of the existing motorway system/ring road interchange serving Bologna 194
195 On 15 April 2016, Autostrade per l Italia, the Ministry of Infrastructure and Transport, Emilia- Romagna Regional Authority, the Bologna Metropolitan Authority and the Municipality of Bologna signed an agreement for the upgrade of the existing motorway system/ring road interchange serving the city of Bologna. On 16 December 2016, the signatories to the agreement signed a final memorandum following a public meeting. The memorandum confirms that Autostrade per l Italia has modified the design for the project in full compliance with the principles set out in the agreement, and that it will carry out the work needed to complete the road network connecting the urban and metropolitan area to the new motorway infrastructure. The environmental assessment is expected to come to a conclusion in early 2018 and, following receipt of all the necessary consents, the tender process will begin. Addendum to Autostrada Tirrenica s Single Concession Arrangement In response to observations from the European Commission regarding, among other things, extension of the concession to 2046 and following discussions with the Grantor, since 2014 Autostrada Tirrenica has prepared and submitted to the Grantor a number of drafts of a new addendum to its existing Single Concession Arrangement, providing for: a reduction in the concession term (initially to expire in 2043, then in 2040 and, finally, in 2038), the obligation to put all the works out to tender and the conditions for completion of the road. On 17 May 2017, the European Commission announced that the Commission had referred Italy to the European Court of Justice for violation of EU law regarding extension of the concession arrangement without conducting a tender process. On 5 October 2017, the Ministry of Infrastructure and Transport notified the company that it had lodged an appeal. In 2017, the Ministry of Infrastructure and Transport carried out a project review for the road running down the Thyrrenian coast (the Thyrrenian corridor ), which envisages construction of the Tarquinia Ansedonia section of motorway by Autostrada Tirrenica and the widening to four lanes of the existing dual carriageway (the SS 1) from Ansedonia to Orbetello Scalo by the same company. The date for expiry of the concession term was to be 31 December Work on the remaining section, from Orbetello Scalo to San Pietro in Palazzi, would be the sole responsibility of ANAS. The Interministerial Economic Planning Committee, at the session held on 22 December 2017, received the report on the process of modifying the proposed project for completion of Thyrrenian corridor. Discussions are ongoing with the Grantor to assess the administrative and financial feasibility of the new solution. Award of the concession for the A3 Naples Pompei Salerno motorway In 2012, the Ministry of Infrastructure and Transport issued a call for tenders for the new concession for the A3 Naples Pompei Salerno motorway. Following the challenges brought by Autostrade Meridionali and Consorzio Stable SIS before Campania Regional Administrative Court, contesting the Ministry s decision, dated 22 March 2016, to disqualify both bidders from the tender process, on 19 December 2016, Campania Regional Administrative Court announced that it did not have jurisdiction for either action, referring the challenges to Lazio Regional Administrative Court. On 29 and 30 December 2016, respectively, Consorzio Stable SIS and Autostrade Meridionali returned to court and, on 31 January 2017, Lazio Regional Administrative Court published its view that the Campania Regional Administrative Court had jurisdiction, referring the matter to the Council of State in order to decide on the question. Following the hearing before the Council of State, held on 27 June 2017, the Council issued an order dated 17 November 2017, finally assigning jurisdiction to Campania Regional Administrative Court. Following the return of the case to Campania Regional Administrative Court, the Court scheduled a hearing on the merits of both challenges brought by Autostrade Meridionali and SIS for 23 May Annual Report
196 Contractual discounts on noise abatement works On 12 June 2017, the Grantor announced that it had determined the extent of the contractual discounts to be applied in relation to 12 noise mitigation schemes contracted out by Autostrade per l'italia to its associate, Pavimental, in Believing the determination to be an error of law, backed up by an authoritative external legal opinion, on 11 September 2017, Autostrade per l'italia lodged a legal challenge before the Regional Administrative Court. Dispute over the Tunnel Safety Plan Phase 2 In the second half of 2017, Autostrade per l Italia initiated an administrative dispute, contesting certain measures adopted by the Ministry of Infrastructure and Transport in relation to Phase 2 of the Tunnel Safety Plan, a project included in Autostrade per l Italia s investment commitments and the cost of which is to be recouped through the X tariff component for investment. In particular, Autostrade per l Italia is contesting the fact that under the measures, Autostrade per l Italia will be liable for any additional costs incurred in carrying out the works provided for in Phase 2 of the Tunnel Safety Plan, over and above the amount referred to in the operator s financial plan, should such additional costs not be recognised during the subsequent five-yearly review of the financial plan. New legislation concerning tenders and concessions The 2018 Budget Law Law 205 of 27 December has amended art. 177 of the Public Contracts Code. The new article requires motorway operators holding a concession not awarded in the form of project financing, or by public tender in accordance with EU law, to award 60% of any contracts for works, services or goods by public tender, instead of the 80% generally applied. ANAC (the Autorità Nazionale Anti Corruzione, Italy s National Anti-Corruption Authority) is in the process of issuing interpretation guidelines for art Expert appraisals of contract variations In the second half of 2017, the Grantor has approved eleven expert appraisals of contract variations, removing numerous items provided for in the expenditure forecasts submitted. Believing such appraisals to be unlawful, Autostrade per l Italia has, therefore, filed legal challenges with the Regional Administrative Court, requesting the cancellation of all or part of the above decisions. Charges payable by motorway operators in accordance with Legislative Decree 35 of 2011 The Ministerial Decree of 7 August 2017 was published Official Gazette no. 250 on 26 October This legislation quantifies the charges to be paid by motorway operators for "the activities involved in overseeing projects, classification of the network and the inspection of existing roads" carried out by the Ministry of Infrastructure and Transport as the Competent Body in accordance with Legislative Decree 35/2011 (the infrastructure safety decree). At this time, the provisions of Legislative Decree 35/2011 require the issue of further legislation, given the Ministry s failure to issue implementing decrees. Despite this, the provisions, in event, represent legal standards to be taken duly into account in the day-to-day operations of motorway operators, during both the design of new works and the management of existing infrastructure. Publication of the decree calculating the charges and establishing the method and terms of payment by operators for the Ministry s activities as the Competent Body, such as the oversight of projects, classification of the network and inspections, is an issue of some importance given that the activities have yet to take place. 196
197 For this reason, whilst having proceeded to pay the amounts due for 2017 and 2018 expressly reserving the right to request restitution -, Autostrade per l Italia, in common with almost all other motorway operators, lodged an extraordinary appeal with the Head of State on 22 February 2018, challenging the above legislation. This is to avoid the risk that apparent acquiescence to the decree could lead the Ministry s inspections to be classified as an activity carried out as a Competent Body with responsibility for infrastructure safety. Discussions between the Ministry of Infrastructure and Transport and the European Commission regarding the extension of Autostrade per l Italia s concession In July 2017, the Ministry of Infrastructure and Transport reached an agreement with the European Commission. The agreement sets out the key conditions to be met in order to grant Autostrade per l Italia a 4-year extension to its concession in return for pre-determined toll increases and recognition of a takeover right on expiry. Press reports dated 28 February 2018 indicate that, following positive developments in is talks with the Ministry of Infrastructure and Transport, the European Commission is about to make a decision on the matter. Once the Commission has made its decision, Autostrade per l'italia will assess the details in order to decide on how to respond. Litigation regarding the Ministry of Infrastructure and Transport and the Ministry for Economic Development decree of 7 August 2015 and competitive tenders for oil and food services at service areas A number of legal challenges have been brought before Lazio Regional Administrative Court by a number of oil and food service providers, and by individual operators, with the aim of contesting a decree issued by the Ministry of Infrastructure and Transport and the Ministry for Economic Development on 7 August This approved the Restructuring Plan for motorway services areas and the competitive tender procedure for the award of concessions at service areas. Two of the challenges remain pending: a) the first, brought by the operator of the Agogna East service area, has been removed from the register by Lazio Regional Administrative Court, and the plaintiff has up to a year from the date of removal from the register to request a date for the case to be heard; b) the second, brought by the operator of the Aglio West service area, requesting a review of judgement 9779 handed down by Lazio Regional Administrative Court on 15 September 2016, which had declared the appellant s challenge inadmissible, is awaiting a date to be set for the hearing on the merits. To complete the picture, hearings on the merits for a further five challenges brought by operators at individual service areas, with the aim of cancelling the above decree issued by Ministry of Infrastructure and Transport and the Ministry for Economic Development, and for another challenge brought by a trade association representing operators have yet to be scheduled. Such hearings have not been requested by the plaintiffs. Accident on the Acqualonga viaduct on the A16 Naples-Canosa motorway on 28 July 2013 With regard to the accident that occurred on 28 July 2013, following completion of the preliminary investigation, the Public Prosecutor s Office in Avellino notified all the employees of Autostrade per l Italia SpA under investigation (twelve people in total, including executives, former managers and employees) of the Public Prosecutor s intention to charge the employees with being accessories to culpable multiple manslaughter and criminal negligence. This was followed by a request from the Public Prosecutor s Office in Avellino to commit all the above accused for trial to answer the above charges. Annual Report
198 At the initial hearing, held on 22 October 2015, the court admitted the entry of appearance of the civil parties and authorised, at the request of certain of these parties, the citation of Autostrade per l Italia and Reale Mutua Assicurazioni as liable in civil law. At the next hearing on 17 December 2015, Autostrade per l Italia SpA and Reale Mutua appeared before the court and the Public Prosecutors concluded their briefs requesting the indictment of all the defendants. At the subsequent hearing on 14 January 2016, the attorneys for the defence and for the civil parties presented their cases. This was followed, on 22 February and 14 March 2016, by hearings at which attorneys for the defence were heard. Having heard the arguments of the Public Prosecutors and the other parties, on 9 May 2016 the judge committed all the accused for trial before a single judge at the Court of Avellino. At the hearing of 9 November 2016, the court ruled on the admissibility of inclusion of the independent experts report previously prepared by the Public Prosecutor s Office and the Public Prosecutor s examination of the witnesses began. At subsequent hearings on 25 November 2016, 7 and 16 December 2016, 13 January 2017 and 3, 17 and 22 February 2017, the examination and cross examination of the witnesses for the prosecution continued. At the hearing held on 10 March 2017, the experts appointed by the Public Prosecutor s Office testified. At the next hearings, held on 31 March 2017 and 21 April 2017, examination of the witnesses for the prosecution came to an end and examination of the witnesses for the defence began. This continued during the hearings of 10 and 26 May 2017, 7 and 28 June 2017, 5 July 2017, 15 and 27 September 2017, and 6 and 18 October This preliminary process will continue during further hearings scheduled for 15 and 22 November The testimonies of the experts appointed by the defendants employed by Autostrade per l Italia were then heard on 6 and 20 December 2017, whilst their cross examination by the public prosecutors began during the hearings held on 24 and 31 January This process will conclude during the hearing to be held on 28 March Examination of the witnesses for the defence continued at the hearings scheduled for 2 and 16 March Finally, hearings have been scheduled for 6, 13 and 30 April 2018 in order to conclude examination of the defendants or for them to make statements to the court. To date, almost all of the civil parties whose entry of appearance in the criminal trial has been admitted have received compensation and have, therefore, withdrawn their actions following payment of their claims by Autostrade per l Italia s insurance provider under the existing general liability policy. In addition to the criminal proceedings, a number of civil actions have been brought by persons not party to the criminal trial. These actions have been combined by the Civil Court of Avellino. Following the combination of the various proceedings, judgement is thus pending before the Civil Court of Avellino in relation to: (i) the original action brought by Reale Mutua Assicurazioni, the company that insured the coach, in order to make the maximum claim payable available to the damaged parties, including Autostrade per l Italia ( 6 million), (ii) subsequent claims, submitted as counterclaims or on an individual basis, by a number of damaged parties, including claims against Autostrade per l Italia. Subject to the permission of the court, Autostrade per l Italia intends to refer claimants to its insurance provider (Swiss Re International), with a view to being indemnified against any claims should it lose the case. At the hearing of 20 October 2016, the court, in accepting the specific requests made by certain parties appearing before the court, appointed an independent expert to assess the psychological trauma caused to the above parties by the loss of close members of their families. During the same hearing, the court appointed further independent experts to reconstruct, among other things, the dynamics of the accident and to assess both its causes and the number of vehicles involved, identifying the victims and preparing a 198
199 document showing the family relations between these people and the defendants and plaintiffs. Autostrade per l Italia has appointed its own experts. The experts began their investigation on 15 November The court subsequently authorised access to a number of mechanical parts from the coach, which is currently under seizure, requesting the intervention of the fire service during the operations scheduled for 22 February 2017 and 10 March On 18 May 2017, the court then rejected the independent experts request to be permitted to carry out further mechanical testing of the coach and adjourned the hearing until 20 July 2017, when the court rejected a request from Autostrade per l Italia s counsel to put the civil action on hold whilst awaiting the outcome of the criminal trial. Subsequently, following submission of the experts draft report on 15 September 2017, the court set a deadline of 30 November 2017 for the experts appointed by the various parties to formulate their observations and adjourned the case until 15 February 2018, when the final report will be examined. In the course of this hearing, the court reserved judgement on the defendants request for new or additional independent expert appraisals, adjourning the case until 19 April 2018 when further counter-arguments will be presented by the Company s expert witnesses. Investigation by the Public Prosecutor s Office in Prato of a fatal accident to a worker employed by Pavimental On 27 August 2014, a worker employed by Pavimental SpA the company contracted by Autostrade per l Italia to carry out work on a section of carriageway on the A1 was involved in a fatal accident whilst at work. In response, the Public Prosecutor s Office in Prato has placed a number of Pavimental personnel under criminal investigation for reckless homicide, alleging violation of occupational health and safety regulations. In December 2014, Autostrade per l Italia received a request for information about the Company, accompanied by a request to appoint a defence counsel and to elect an address for service, as it was under investigation as a juridical person, pursuant to Legislative Decree 231/2001 (the Administrative liability of legal entities ). A similar request for information was received by Pavimental. Autostrade per l Italia has been charged with the offence provided for in art. 25 septies of Legislative Decree 231/2001, as defined in art. 589, paragraph 3 of the penal code ( Culpable homicide resulting from breaches of occupational health and safety regulations ). A similar charge has also been brought against, among others, Autostrade per l Italia s Project Manager. A hearing took place on 5 February 2016, following a request from the Public Prosecutor s Office for a pre-trial hearing for the appointment of experts to reconstruct the dynamics of the fatal accident and apportion liability, including that of companies pursuant to Legislative Decree 231/01. At the end of the related hearing, during which the companies Organisational, Management and Control Models were examined, the case against the companies was dismissed. The case then proceeded with the focus solely on the charges against the natural persons involved, with the preliminary hearing held on 8 February 2017, when the civil parties appeared before the court and it was requested that the accused be summoned to appear. Hearings were then held on 26 April 2017, to verify settlement of the damages requested by the parties to the civil action, and on 5 July 2017, to withdraw the actions brought by these parties and for any potential requests for an alternative procedure (an accelerated trial ). At the next hearing held on 8 November 2017, the parties concluded their depositions and the hearing was adjourned until 15 November 2017, when the court was to pronounce judgement. At the hearing of 15 November 2017, the court committed Autostrade per l Italia s Project Manager for trial and adjourned the hearing until 15 Annual Report
200 February 2018, when the parties were to begin giving evidence before the court. Due to the absence of the presiding judge, this hearing was then adjourned until 9 July Investigation by the Public Prosecutor s Office in Florence of the state of New Jersey barriers installed on the section of motorway between Barberino and Roncobilaccio On 23 May 2014, the Public Prosecutor s Office in Florence issued an order requiring Autostrade per l Italia to hand over certain documentation, following receipt, on 14 May 2015, of a report from Traffic Police investigators in Florence noting the state of disrepair of the New Jersey barriers on the section of motorway between Barberino and Roncobilaccio. The report alleges negligence on the part of unknown persons, as defined by art. 355, paragraph 2.3 of the penal code (breach of public supply contracts concerning goods or works designed to protect against danger or accidents to the public ). At the same time, the Prosecutor s Office ordered the seizure of the New Jersey barriers located along the right side of the carriageways between Barberino and Roncobilaccio, on ten viaducts, ordering Autostrade per l Italia to take steps to ensure safety on the relevant sections of motorway. This seizure was executed on 28 May In June 2014, Autostrade per l Italia s IV Section Department handed over the requested documents to the Police. The documentation concerns the maintenance work carried out over the years on the safety barriers installed on the above section of motorway. In October 2014, addresses for service were formally nominated for a former General Manager and an executive of Autostrade per l Italia, both under investigation in relation to the crime defined in art. 355 of the penal code. In addition, at the end of November 2014, experts appointed by the Public Prosecutor s Office, together with experts appointed by Autostrade per l Italia, carried out a series of sample tests on the barriers installed on the above motorway section to establish their state of repair. Following the experts tests, the barriers were released from seizure. According to the appointed defence counsel, the Public Prosecutor s Office in Florence has requested that the charges against Autostrade per l Italia s personnel be dropped. This request is currently being assessed by the local office of the preliminary investigating magistrate. Autostrade per l Italia -Autostrade Tech against Alessandro Patanè and companies linked to him and appeals brought before the Civil Court of Rome With regard to the writ served on Mr. Alessandro Patanè and the companies linked to him by Autostrade per l Italia and Autostrade Tech, at the hearing of 16 November 2016, at the Civil Court of Rome, having noted the withdrawal of Mr. Patanè s defence counsel, the court adjourned the proceedings until 30 March 2017, in order to enable the defendant to appoint a new counsel. At this later hearing, having acknowledged the appointment of a new counsel to represent Mr. Patanè, the court declared the action for fraud brought by Mr. Patanè, with regard to certain documents filed by Autostrade per l'italia and Autostrade Tech, to be inadmissible. The judge then adjourned the hearing until 10 January 2018 for admission of the facts. In the meantime, Mr. Patanè has lodged a further action for fraud similar to the previous one. At the hearing of 10 January 2018, the court acknowledged the action. The judges decision on the action for fraud and, therefore, on the admissibility of the action is awaited, the parties having been set a deadline pursuant to art. 190 of the code of civil procedure. Proceedings before the Supreme Court - Autostrade per l Italia versus Craft Srl On 4 November 2015, the First Civil Section of the Supreme Court handed down judgement no , rejecting Autostrade per l Italia s appeal regarding the fact that Craft s patent should be declared null and void and partially annulling the earlier sentence of the Court of Appeal in Rome, referring the case back to this court, to be heard by different judges, following the reinstatement 200
201 of proceedings by one of the parties. The Court of Appeal was asked to provide logical grounds for finding that Autostrade per l Italia has not infringed Craft s patent. On 6 May 2016, Craft notified Autostrade per l Italia of an application for the reinstatement of proceedings before the Court of Appeal, requesting the court, among other things, to rule that Autostrade per l Italia has infringed Craft s patent and to order the former to pay Craft compensation for the resulting damage to its moral and economic rights, calculated by the plaintiff to be approximately 3.5 million, with this sum to be reduced or increased by the court depending on the economic benefits obtained by the defendant. At the first hearing, held on 11 October 2016, the court scheduled a hearing for admission of the facts for 14 March At the hearing of 14 March 2017, the parties admitted the facts and the court reserved judgement, fixing a term pursuant to art. 190 of the code of civil procedure for the submission of closing and reply briefs. Claim for damages from the Ministry of the Environment A criminal case (initiated in 2007) pending before the Court of Florence involves two of Autostrade per l'italia s managers and another 18 people from contractors, who are accused of violating environmental laws relating to the reuse of soil and rocks resulting from excavation work during construction of the Variante di Valico. Between February 2016 and May 2016, all the witnesses and experts called to give evidence by the defence were heard. On conclusion, the court declared the hearing of 19 July 2016 to be the last occasion for the submission of documents. At the hearings held on 5 and 12 December 2016, the defendants wishing to file a deposition were heard. The Public Prosecutor made his closing statement at the hearings held on 6, 13 and 20 February The parties began to make their final depositions at the hearing of 27 March 2017 and this process continued at the hearings of 15 and 22 May 2017 and in June At the hearings of 17 July 2017 and 21 September 2017, the parties concluded their depositions and the hearing was adjourned until 30 October 2017, when the court was to pronounce judgement. At the hearing of 30 October 2017, the court acquitted the two managers from Autostrade per l Italia in accordance with art. 530, paragraph I of the criminal code, based on the fact that there was no case to answer and setting a term of 90 days for the court to file the reasons for its judgement. The deadline for filing the court s reasons for the judgements has been extended until 29 April Investigation by the Public Prosecutor s Office in Vasto of the fatal motorway accident of 21 September 2013 Following the motorway accident of 21 September 2013 at km 450 of the A14, operated by Autostrade per l Italia, in which several people were killed, the Public Prosecutor s Office in Vasto has launched a criminal investigation, initially against persons unknown. On 23 March 2015, the Chief Executive Officer and, later, further two executives of the Company received notice of completion of the investigation, containing a formal notification of charges. The charges relate to negligent cooperation resulting in reckless manslaughter. The Public Prosecutor, following initiatives taken by the defence counsel, has requested that the case be brought to court. Due to irregularities in the writs of summons sent to the defendants, the preliminary hearing was adjourned until 1 March At this hearing, in view of the request for an alternative procedure (an accelerated trial ) from the defence counsel representing the owner of the vehicle, the court adjourned the hearing until 17 May At the end of the last hearing, the court committed all the defendants for trial on 12 October 2016 before a single judge at the Court of Vasto. This hearing was adjourned until 24 November 2016 in order to for a new judge to be appointed. At the hearing of 24 November 2016, the parties requested leave to present their evidence to the court. Annual Report
202 At the hearing held on 23 February 2017, the court began to hear the witnesses for the prosecution, who continued and completed the process of giving evidence at the hearing held on 18 May At the next hearing held on 23 October 2017, the witnesses for the defence were heard and one of them was questioned. At the hearing held on 22 February 2018, the expert witnesses appointed by the counsel for Autostrade per l'italia s defendants were heard. The next hearing has been scheduled for 26 April 2018 to hear public prosecutors request for the court to appoint experts. Investigation by the Public Prosecutor s Office in Savona of the fatal accident suffered by an employee of a sub-contractor on 5 February 2016 Following the above fatal accident, Autostrade per l Italia received notice of completion of the investigation from the Public Prosecutor s Office in Savona, containing charges relating to articles 25-septies, paragraphs 2, 6 and 7 of Legislative Decree 231/2001, in respect of the violation of art. 589, paragraph 2 of the criminal code ( reckless homicide, involving violation of occupational health and safety regulations ). The charges relate to the death, on 5 February 2016, of an employee of S. Guglielmo, a subcontractor working for Pavimental at kilometre of the A10 motorway. The person concerned was working as a security guard at the site at which Autostrade per l Italia had previously contracted noise abatement work along the A10 Genoa-Savona, from kilometre to kilometre Autostrade per l Italia s Project Manager is one of the persons charged with the above violation. On 28 February 2018, the preliminary investing magistrate dismissed the charges against Autostrade per l Italia s Project Manager and the Company pursuant to Legislative Decree 231/2001. Investigation by the Public Prosecutor s Office in Ancona following the collapse of the motorway bridge on the SP10 crossing the A14 Bologna-Taranto motorway On 9 March 2017, the collapse of a bridge on the SP10, as it crosses the A14 motorway at km , caused the deaths of the driver and a passenger in a car and injuries to three workers employed by a sub-contractor of Pavimental SpA, to which Autostrade per l Italia had previously awarded the contract for the widening to three lanes of the Rimini North Porto Sant Elpidio section of the A14 Bologna-Bari-Taranto motorway. Autostrade per l Italia s legal representative was subsequently sent a notice of investigation issued by the Public Prosecutor s Office in Ancona. The investigation regards the alleged offence provided for in articles 25-septies, paragraphs 2 and 3, 6 and 7 of Legislative Decree 231/2001 (Art. 25-septies Culpable homicide and negligent injury or grievous bodily harm resulting from breaches of occupational health and safety regulations ; art. 6 Senior management and the entity s organisational models ; art. 7 Subordinates and the entity s organisational models ) regarding the offences provided for in art. 589, paragraph 2 of the penal code ( Culpable homicide resulting from breaches of occupational health and safety regulations ) and art. 590, paragraph 3 of the penal code ( Culpable injury resulting from breaches of occupational accident prevention ). In connection with this event, a number of Autostrade per l Italia s managers and employees are under investigation pursuant to articles 113, 434, paragraph 2 and 449 of the penal code ( accessory to culpable collapse ), 113 and 589, last paragraph of the penal code ( accessory to culpable multiple manslaughter ), 113 and 590, paragraph 3 of the penal code ( accessory to culpable multiple injury ). The investigations are currently in progress. 202
203 10.8 Events after 31 December 2017 Traffic figures for early 2018 Between the beginning of the year and 18 February (preliminary data), traffic volume using Autostrade per l Italia s network was up 5.1%, in particular with heavy vehicles (3 or more axles) up 6.1% and light vehicles (2 axles) rising 4.9%. Annual Report
204 Annexes to the consolidated financial statements Annex 1 - The Autostrade per l Italia Group s scope of consolidation and investments as at 31 December 2017 Annex 2 - Disclosure of the fees paid to the Independent Auditors The above annexes have not been audited. 204
205 Annex 1 The Autostrade per l Italia Group s scope of consolidation and investments as at 31 December 2017 NAME SHARE CAPITAL/CONSORTIUM REGISTERED OFFICE BUSINESS CURRENCY FUND AS AT 31 DECEMBER HELD BY 2017 (UNITS) % INTEREST IN SHARE CAPITAL/CONSORTIUM FUND AS AT 31 DECEMBER 2017 OVERALL GROUP INTEREST (%) NOTE PARENT COMPANY AUTOSTRADE PER L'ITALIA SpA ROME MOTORWAY OPERATION AND CONSTRUCTION EURO 622,027,000 SUBSIDIARIES CONSOLIDATED ON A LINE-BY-LINE BASIS AD MOVING SpA ROME ADVERTISING SERVICES EURO 1,000,000 Autostrade per l'italia SpA 100% 100% AUTOSTRADE MERIDIONALI SpA NAPLES MOTORWAY OPERATION AND CONSTRUCTION EURO 9,056,250 Autostrade per l'italia SpA 58.98% 58.98% (1) INFORMATION SYSTEM AND EQUIPMENT FOR THE AUTOSTRADE TECH SpA ROME CONTROL AND AUTOMATION OF TRAFFIC AND ROAD EURO 1,120,000 Autostrade per l'italia SpA 100% 100% SAFETY WARSAW POLISH CATTERICK INVESTMENTS SPÓLKA Z O.O. PROJECT COMPANY 5,000 Autostrade Tech SpA 90% 90% (POLAND) ZLOTY PARIS FINANCING/DESIGN/CONSTRUCTION/OPERATION OF ECOMOUV' SAS EURO 6,000,000 Autostrade per l'italia SpA 70.00% 70.00% (FRANCE) EQUIPMENT REQUIRED FOR ECO - TAXE ESSEDIESSE SOCIETÀ DI SERVIZI SpA ROME GENERAL AND ADMINISTRATIVE SERVICES EURO 500,000 Autostrade per l'italia SpA 100% 100% GIOVE CLEAR Srl ROME CLEANING SERVICES E MANUTENZIONI VARIE EURO 10,000 Autostrade per l'italia SpA 100% 100% INFOBLU SpA ROME TRAFFIC INFORMATION EURO 5,160,000 Autostrade per l'italia SpA 75.00% 75.00% Società Italiana per Azioni RACCORDO AUTOSTRADALE VALLE D'AOSTA SpA AOSTA MOTORWAY OPERATION AND CONSTRUCTION EURO 343,805, % 24.46% (2) per il Traforo del Monte Bianco SOCIETÀ AUTOSTRADA TIRRENICA p.a. ROME MOTORWAY OPERATION AND CONSTRUCTION EURO 24,460,800 Autostrade per l'italia SpA 99.93% 99.99% (3) PRE' SAINT DIDIER SOCIETÀ ITALIANA PER AZIONI PER IL TRAFORO DEL MONTE BIANCO MONT BLANC TUNNEL OPERATION AND CONSTRUCTION EURO 198,749,200 Autostrade per l'italia SpA 51.00% 51.00% (AOSTA) TANGENZIALE DI NAPOLI SpA NAPLES MOTORWAY OPERATION AND CONSTRUCTION EURO 108,077,490 Autostrade per l'italia SpA 100% 100% TECH SOLUTIONS INTEGRATORS SAS PARIS CONSTRUCTION, INSTALLATION AND MAINTENANCE OF EURO 2,000,000 Autostrade per l'italia SpA 100% 100% (FRANCE) ELECTRONIC TOLLING SYSTEMS (1) The company is listed on Borsa Italiana Spa's Expandi market. (2) The issued capital is made up of 284,350,000 in ordinary shares and 59,455,000 in preference shares. The percentage interest is calculated with reference to all shares in issue, whereas the 58.00% of voting rights is calculated with reference to ordinary voting shares. (3) On December 2015 Autostrada Tirrenica, following authorisation by the general meeting of shareholders held on the same date, purchased 109,600 own shares from non-controlling shareholders. Autostrade per l'italia's interest is, therefore, equal to 99.99% as at 31 December 2017 (the percentage interest calculated on the basis of the ratio of shares held by Autostrade per l'italia and the subsidiary's total shares is 99.93% ). Annual Report
206 NAME REGISTERD OFFICE BUSINESS CURRENCY SHARE CAPITAL/CONSORTIUM FUND AS AT 31 DECEMBER 2017 (UNITS) HELD BY % INTEREST IN SHARE CAPITAL/CONSORTIUM FUND AS AT 31 DECEMBER 2017 NOTE INVESTMENTS ACCOUNTED FOR AT COST OF FAIR VALUE Other investments CENTRO INTERMODALE TOSCANO AMERIGO VESPUCCI SpA TANGENZIALE ESTERNA SpA MILAN LIVORNO DISTRIBUTION CENTRE EURO 11,756,695 Società Autostrada Tirrenica p.a. 0.43% MOTORWAY OPERATION AND CONSTRUCTION EURO 464,945,000 Autostrade per l'italia SpA 0.25% TANGENZIALI ESTERNE DI MILANO SpA MILAN CONSTRUCTION AND OPERATION OF MILAN RING ROAD EURO 220,344,608 Autostrade per l'italia SpA 13.67% UIRNET SpA ROME OPERATION OF NATIONAL LOGISTICS EURO 1,061,000 Autostrade per l'italia SpA 1.51% VENETO STRADE SpA VENICE CONSTRUCTION AND MAINTENANCE OF ROAD AND TRAFFIC SERVICES EURO 5,163,200 Autostrade per l'italia SpA 5.00% AUTOSTRADE HOLDING DO SUR SA SANTIAGO (CHILE) HOLDING COMPANY CHILEAN PESO 51,496,805,692 Autostrade per l'italia SpA 0.00% (1) (1) The company's shares are held as follows: Autostrade dell'atlantico Srl (1,000,000 shares) and Autostrade per l'italia SpA (1 share). 206
207 NAME REGISTERED OFFICE BUSINESS CURRENCY SHARE CAPITAL/CONSORTIUM FUND AS AT 31 DECEMBER 2017 (UNITS) HELD BY % INTEREST IN SHARE CAPITAL/CONSORTIUM FUND AS AT 31 DECEMBER 2017 INVESTMENTS ACCOUNTED FOR USING THE EQUITY METHOD Associates PAVIMENTAL SpA ROME MOTORWAY AND AIRPORT CONSTRUCTION AND MAINTENANCE EURO 10,116,452 Autostrade per l'italia SpA 20.00% SPEA ENGINEERING SPA ROME INTEGRATED TECHNICAL ENGINEERING SERVICES EURO 6,966,000 Autostrade per l'italia SpA 20.00% DESIGN, CONSTRUCTION AND MANAGEMENT OF MULTI- BOLOGNA & FIERA PARKING SpA BOLOGNA EURO 2,715,200 Autostrade per l'italia SpA 36.81% LEVEL PUBLIC CAR PARKS PEDEMONTANA VENETA SpA MOTORWAY OPERATION AND CONSTRUCTION VERONA EURO 6,000,000 Autostrade per l'italia SpA 29.77% (IN LIQUIDATION) AUTOSTRADE E AEROPORTI SOCIETA' INFRASTRUTTURE TOSCANE SpA ROME MOTORWAY OPERATION AND CONSTRUCTION EURO 15,000,000 Autostrade per l'italia SpA 46.00% (IN LIQUIDATION) Joint ventures GEIE DEL TRAFORO DEL MONTE BIANCO COURMAYEUR (AOSTA) MAINTENANCE AND OPERATION OF MONT BLANC TUNNEL EURO 2,000,000 Società Italiana per Azioni per il Traforo del Monte Bianco 50.00% Annual Report
208 NAME REGISTERED OFFICE BUSINESS CURRENCY SHARE CAPITAL/ CONSORTIUM FUND AS AT 31 DECEMBER 2017 (UNITS) HELD BY % INTEREST IN SHARE CAPITAL/CONSORTIUM FUND AS AT 31 DECEMBER 2017 CONSORTIA CONSORZIO AUTOSTRADE ITALIANE ENERGIA ROME ELECTRICITY PROCUREMENT EURO 113,949 Autostrade per l'italia SpA 27.30% Tangenziale di Napoli SpA 2.00% Società Italiana per Azioni 1.90% per il Traforo del Monte Bianco Raccordo Autostradale Valle d'aosta SpA 1.10% Società Autostrada Tirrenica p.a. 0.30% Autostrade Meridionali SpA 0.90% 33.50% CONSORZIO MIDRA FLORENCE SCIENTIFIC RESEARCH FOR DEVICE BASED TECHNOLOGIES EURO 73,989 Autostrade Tech SpA 33.33% COSTRUZIONI IMPIANTI AUTOSTRADALI SCARL ROME CONSTRUCTION OF PUBLIC WORKS AND INFRASTRUCTURE EURO 10,000 Autostrade Tech SpA 20.00% CHATILLON IDROELETTRICA SCRL SELF-PRODUCTION OF ELECTRICITY EURO 50,000 Raccordo Autostradale Valle d'aosta SpA 0.10% (AOSTA) SAT LAVORI SCARL (IN LIQUIDATION) ROME CONSTRUCTION CONSORTIUM EURO 100,000 Società Autostrada Tirrenica p.a. 1.00% INVESTMENTS ACCOUNTED FOR IN CURRENT ASSETS STRADA DEI PARCHI SpA ROME MOTORWAY OPERATION AND CONSTRUCTION EURO 48,114,240 Autostrade per l'italia SpA 2.00% 208
209 Annex 2 Disclosure of the fees paid to the Independent Auditors Disclosures pursuant to art.149-duodecies of the CONSOB Regulation for Issuers Autostrade per l'italia SpA 000 Type of service Provider of service Note Fees Audit Parent Company's auditor 207 Certification Parent Company's auditor Other services Parent Company's auditor Other services Associate of Parent Company's auditor (1) 23 (2) 44 (3) 28 Total 302 Subsidiaries Type of service Provider of service Note Fees Audit Parent Company's auditor 170 Audit Associate of Parent Company's auditor 30 Other services Parent Company's auditor Total subsidiaries 254 (4) 54 Total Autostrade per l'italia Group 556 (1) Opinion on payment of interim dividends. (2) Signature of consolidated and 770 tax forms, comfort letter on offering circular and agreed upon procedures for data and accounting information. (3) Audit of internal control system. (4) Signature of consolidated and 770 tax forms and agreed upon procedures for data and accounting information. Annual Report

210

211 4.
212 Financial statements STATEMENT OF FINANCIAL POSITION (1) 31 December December 2016 ASSETS Non-current assets Property, plant and equipment 74,179,727 78,097,239 Property, plant and equipment 67,378,024 71,079,959 Investment property 6,801,703 7,017,280 Intangible assets 17,402,993,583 17,862,076,769 Intangible assets deriving from concession rights 11,271,193,321 11,733,951,688 Goodwill and other intangible assets with indefinite lives 6,111,199,924 6,111,200,204 Other intangible assets 20,600,338 16,924,877 Investments 225,016, ,605,373 Non-current financial assets 637,781, ,655,047 Non-current financial assets deriving from government grants 183,960, ,646,126 Non-current term deposits 183,960, ,646,125 Other non-current financial assets 269,861, ,362,796 Other non-current assets 242, ,082 Total non-current assets 18,340,214,591 18,803,703,510 Current assets Trading assets 465,337, ,990,167 Inventories 46,399,014 43,668,161 Contract work in progress 4,204,491 4,204,491 Trade receivables 414,734, ,117,515 Cash and cash equivalents 2,626,663,881 2,924,421,407 Cash 1,772,546,356 2,238,192,228 Cash equivalents 80,074, ,079,895 Intercompany current account receivables due from related parties 774,042, ,149,284 Current financial assets 142,805, ,507,767 Current financial assets deriving from government grants 52,264,631 50,476,105 Current term deposits 50,101,510 48,415,443 Current derivative assets - 2,491,965 Current portion of medium/long-term financial assets 32,495,375 13,570,449 Other current financial assets 7,943, ,805 Current tax assets 24,362,657 55,415,527 Other current assets 65,769,958 62,609,228 Investments held for sale or for distribution to shareholders or as discontinued operations 4,271,004 1,157,594,257 Total current assets 3,329,210,563 4,852,538,353 TOTAL ASSETS 21,669,425,154 23,656,241,863 (1) As required by CONSOB Resolution of 27 July 2006, the impact of related party transactions on Autostrade per l'italia SpA's statement of financial position is shown in the statement of financial position, expressed in thousands of euros, on the following pages. The impact is also described in further detail in note
213 STATEMENT OF FINANCIAL POSITION 31 December December 2016 EQUITY AND LIABILITIES Equity Issued capital 622,027, ,027,000 Reserves and retained earnings 847,112,573 2,668,758,341 Profit/(Loss) for the year after interim dividends 517,668, ,328,228 Total equity 1,986,808,214 3,605,113,569 Non-current liabilities Non-current portion of provisions for construction services required by contract 2,839,550,880 3,165,176,330 Non-current provisions 1,063,501,511 1,084,436,544 Non-current provisions for employee benefits 83,180,839 90,486,199 Non-current provisions for repair and replacement of motorway infrastructure 980,320, ,950,345 Non-current financial liabilities 10,963,893,026 11,994,359,819 Bond issues 8,092,619,378 8,005,129,577 Medium/long-term borrowings 2,442,129,222 3,508,783,392 Non-current derivative liabilities 429,144, ,446,850 Net deferred tax liabilities 588,604, ,062,310 Other non-current liabilities 32,568,470 30,344,196 Total non-current liabilities 15,488,118,419 16,734,379,199 Current liabilities Trading liabilities 1,306,268,792 1,228,726,796 Trade payables 1,306,268,792 1,228,726,796 Current portion of provisions for construction services required by contract 421,948, ,453,600 Current provisions 196,039, ,413,659 Current provisions for employee benefits 17,905,074 17,862,738 Current provisions for repair and replacement of motorway infrastructure 140,406, ,268,215 Current provisions for the risk of fines and penalties under the Single Concession Arrangement 4,306,206 3,178,106 Other current provisions 33,422,091 38,104,600 Current financial liabilities 1,971,680,110 1,156,167,367 Bank overdrafts repayable on demand Short-term borrowings 530,000,000 - Current derivative liabilities - 2,491,965 Intercompany current account payables due to related parties 56,927, ,828,169 Current portion of medium/long-term financial liabilities 1,381,302, ,846,999 Other current financial liabilities 3,450,000 - Current tax liabilities 88,293,429 3,360,023 Other current liabilities 210,268, ,627,650 Liabilities related to discontinued operations - - Total current liabilities 4,194,498,521 3,316,749,095 TOTAL LIABILITIES 19,682,616,940 20,051,128,294 TOTAL EQUITY AND LIABILITIES 21,669,425,154 23,656,241,863 Annual Report
214 INCOME STATEMENT (2) REVENUE Toll revenue 3,320,949,260 3,222,348,951 Revenue from construction services 94,822, ,566,012 Other operating income 293,145, ,623,106 TOTAL REVENUE 3,708,917,205 3,717,538,069 COSTS Raw and consumable materials -77,731,355-74,183,284 Service costs -812,306, ,938,091 Gains/(losses) on sale of property, plant and equipment 883, ,619 Staff costs -410,973, ,689,776 Other operating costs -506,275, ,477,541 Concession fees -441,624, ,523,583 Lease expense -6,342,149-6,060,327 Other -58,308,723-47,893,631 Operating change in provisions 7,536,731-62,807,806 Uses of provisions/(provisions) for repair and replacement of motorway infrastructure 17,205,694-59,757,326 (Provisions)/Uses of provisions -9,668,963-3,050,480 Use of provisions for construction services required by contract 406,967, ,365,408 Amortisation and depreciation -565,346, ,720,895 Depreciation of property, plant and equipment -20,239,845-19,867,094 Depreciation of investment property -410, ,459 Amortisation of intangible assets deriving from concession rights -529,543, ,286,096 Amortisation of other intangible assets -15,152,194-13,194,246 (Impairment losses)/reversals of impairment losses -1,135,645-1,318,534 TOTAL COSTS -1,958,379,529-2,076,371,900 OPERATING PROFIT/(LOSS) 1,750,537,676 1,641,166,169 Financial income 173,174,657 76,544,926 Dividends received from investees 50,487,561 27,091,250 Reversal of impairment losses on financial assets and investments 4,213,000 - Other financial income 118,474,096 49,453,676 Financial expenses -575,389, ,691,568 Financial expenses from discounting of provisions for construction services required by contract and other provisions -23,990,655-44,952,793 Impairment losses on financial assets and investments - -13,463,308 Other financial expenses -551,398, ,275,467 Foreign exchange gains/(losses) -14,419 8,578 FINANCIAL INCOME/(EXPENSES) -402,229, ,138,064 PROFIT BEFORE TAX FROM CONTINUING OPERATIONS 1,348,308, ,028,105 Income tax (expense)/benefit -380,292, ,467,762 Current tax expense -274,408, ,182,972 Differences on current tax expense for previous years 8,763,338 2,922,922 Deferred tax income and expense -114,646, ,207,712 PROFIT/(LOSS) FROM CONTINUING OPERATIONS 968,016, ,560,343 Dividends, after related taxation, from discontinued operations - 103,561,115 PROFIT FOR THE YEAR 968,016, ,121,458 (2) As required by CONSOB Resolution of 27 July 2006, the impact of related party transactions and components of income deriving from non-recurring transactions on Autostrade per l'italia SpA's income statement are shown in the income statement, expressed in thousands of euros, on the following pages. The impact is also described in further detail in note
215 STATEMENT OF CASH FLOWS (3) CASH FLOWS FROM (USED IN) OPERATING ACTIVITIES Profit for the year 968,016, ,121,458 Adjusted by: Amortisation and depreciation 565,346, ,720,895 Operating change in provisions -7,349,861 63,068,060 Financial expenses from discounting of provisions for construction services required by contract 23,990,655 44,952,793 (Reversal of impairment losses)/impairment losses on non-current financial assets and investments -4,213,000 13,463,308 Impairment losses/(reversal of impairment losses) on current and non-current assets 1,135,645 1,318,534 (Gains)/Losses on sale of non-current assets -883, ,619 Net change in deferred tax (assets)/liabilities through profit or loss 114,646, ,207,712 Other non-cash costs (income) -48,033, ,111,698 Change in working capital and other changes 224,199,162-78,994,687 Net cash generated from/(used in) operating activities [a] 1,836,855,528 1,603,571,152 CASH FLOWS FROM (USED IN) INVESTING ACTIVITIES Investment in assets held under concession -494,497, ,928,997 Purchases of property, plant & equipment -16,930,701-22,383,992 Purchases of other intangible assets -18,827,376-15,164,730 Government grants related to assets held under concession 1,496,754 1,540,641 Return of capital reserves from subsidiaries 398,252,955 - Proceeds from sales of property, plant and equipment, intangible assets and investments 1,081,332 1,265,979,660 Net change in other non-current assets 26,587 - Net change in current and non-current financial assets -21,830,804-34,954,925 Net cash generated from/(used in) investing activities [b] -151,228, ,087,657 CASH FLOWS FROM (USED IN) FINANCING ACTIVITIES Distribution of equity reserves -1,101,311,641 - Dividends paid -764,471, ,045,642 Repayment of loans from parent - -1,100,572,000 Issuance of bonds 130,633, ,097,614 Redemption of bonds -505,566,000 - Repayments of medium/long term borrowings -161,810, ,544,935 Net change in other current and non-current financial liabilities 604,041, ,502,741 Net cash generated from/(used in) financing activities [c] -1,798,484,088-1,829,567,704 Increase/ (decrease) in cash and cash equivalents [a+b+c] -112,857, ,091,105 NET CASH AND CASH EQUIVALENTS AT BEGINNING OF YEAR 2,682,593,004 2,348,501,899 NET CASH AND CASH EQUIVALENTS AT END OF YEAR 2,569,735,965 2,682,593,004 (3) As required by CONSOB Resolution of 27 July 2006, the impact of related party transactions on Autostrade per l'italia SpA's statement of cash flows is shown in the statement of cash flows, expressed in thousands of euros, on the following pages. Annual Report
216 STATEMENT OF FINANCIAL POSITION 000 Note 31 December 2017 ASSETS Non-current assets of which related party transactions 31 December 2016 Property, plant and equipment ,180 78,097 Property, plant and equipment 67,379 71,080 Investment property 6,801 7,017 Intangible assets ,402,996 17,862,077 Intangible assets deriving from concession rights 11,271,193 11,733,952 Goodwill and other intangible assets with indefinite lives 6,111,201 6,111,201 Other intangible assets 20,602 16,924 Investments , ,605 of which related party transactions Non-current financial assets , ,655 Non-current financial assets deriving from government grants 183, ,646 Non-current term deposits 183, ,646 Other non-current financial assets 269, , , ,941 Other non-current assets Total non-current assets 18,340,217 18,803,703 Current assets Trading assets , ,990 Inventories 46,399 43,668 Contract work in progress 4,204 4,204 Trade receivables 414, , , ,629 Cash and cash equivalents 6.7 2,626,664 2,924,421 Cash 1,772,546 2,238,192 Cash equivalents 80, ,080 Intercompany current account receivables due from related parties 774, , , ,149 Current financial assets , ,508 Current financial assets deriving from government grants 52,265 50,476 Current term deposits 50,102 48,416 Current derivative assets - 2,492 Current portion of medium/long-term financial assets 32,495 11,082 13,570 10,921 Other current financial assets 7,944 7, Current tax assets ,363 24,363 55,416 55,416 Other current assets ,770 62,609 Investments held for sale or for distribution to shareholders or as discontinued operations ,271 1,157,594 Total current assets 3,329,212 4,852,538 TOTAL ASSETS 21,669,429 23,656,
217 STATEMENT OF FINANCIAL POSITION 000 Note 31 December 2017 EQUITY AND LIABILITIES Equity of which related party transactions 31 December 2016 Issued capital 622, ,027 Reserves and retained earnings 847,113 2,668,760 Profit/(Loss) for the year after interim dividends 517, ,328 Total equity ,986,808 3,605,115 Non-current liabilities Non-current portion of provisions for construction services required by contract ,839,552 3,165,177 Non-current provisions ,063,501 1,084,436 Non-current provisions for employee benefits 83,181 90,486 Non-current provisions for repair and replacement of motorway 980, ,950 of which related party transactions Non-current financial liabilities ,963,892 11,994,360 Bond issues 8,092,619 8,005,130 Medium/long-term borrowings 2,442,129-3,508, ,320 Non-current derivative liabilities 429, ,447 Net deferred tax liabilities , ,065 Other non-current liabilities ,568 30,344 Total non-current liabilities 15,488,122 16,734,382 Current liabilities Trading liabilities ,306,269 1,228,727 Trade payables 1,306, ,895 1,228, ,917 Current portion of provisions for construction services required by contract , ,454 Current provisions , ,413 Current provisions for employee benefits 17,905 17,863 Current provisions for repair and replacement of motorway infrastructure 140, ,268 Current provisions for the risk of fines and penalties under the Single 4,306 3,178 Other current provisions 33,422 11,565 38,104 10,330 Current financial liabilities ,971,680 1,156,167 Short-term borrowings 530, , Current derivative liabilities - 2,492 Intercompany current account payables due to related parties 56,928 56, , ,828 Current portion of medium/long-term financial liabilities 1,381,302 1,000, ,847 4,344 Other current financial liabilities 3,450 - Current tax liabilities ,294 87,143 3,356 - Other current liabilities ,268 17, ,627 10,558 Liabilities related to discontinued operations Total current liabilities 4,194,499 3,316,744 TOTAL LIABILITIES 19,682,621 20,051,126 TOTAL EQUITY AND LIABILITIES 21,669,429 23,656,241 Annual Report
218 INCOME STATEMENT 000 Note 2017 of which related party 2016 of which related party REVENUE Toll revenue 7.1 3,320,949 3,222,349 Revenue from construction services , ,566 Other operating income ,145 97, ,624 95,903 TOTAL REVENUE 3,708,917 3,717,539 COSTS Raw and consumable materials ,731-74,183 Service costs , , , ,484 Gains/(losses) on sale of property, plant and equipment Staff costs ,973-17, ,690-16,076 Other operating costs , ,478 Concession fees -441, ,524 Lease expense -6,342-6,060 Other -58,309-47,894 Operating change in provisions 7.8 7,537-62,807 Uses of provisions/(provisions) for repair and replacement of motorway infrastructure 17,206-59,757 (Provisions)/Uses of provisions -9, ,050-4,526 Use of provisions for construction services required by contract , ,365 Amortisation and depreciation , ,722 Depreciation of property, plant and equipment -20,240-19,868 Depreciation of investment property Amortisation of intangible assets deriving from concession rights -529, ,286 Amortisation of other intangible assets -15,152-13,194 (Impairment losses)/reversals of impairment losses ,136-1,319 TOTAL COSTS -1,958,379-2,076,373 OPERATING PROFIT/(LOSS) 1,750,538 1,641,166 Financial income 173,175 76,545 Dividends received from investees 50,488 27,091 Reversal of impairment losses on financial assets and investments 4,213 - Other financial income 118,474 24,708 49,454 33,479 Financial expenses -575, ,691 Financial expenses from discounting of provisions for construction services required by contract and other provisions -23,991-44,954 Impairment losses on financial assets and investments ,463-10,941 Other financial expenses -551,399-62, , ,603 of which non-recurring , ,215 Foreign exchange gains/(losses) FINANCIAL INCOME/(EXPENSES) , ,138 PROFIT BEFORE TAX FROM CONTINUING OPERATIONS 1,348, ,028 Income tax (expense)/benefit , ,468 Current tax expense -274, ,183 Differences on current tax expense for previous years 8,763 2,923 Deferred tax income and expense -114, ,208 PROFIT/(LOSS) FROM CONTINUING OPERATIONS 968, ,560 Dividends, after related taxation, from discontinued operations ,561 PROFIT FOR THE YEAR 968, ,121 Note Basic earnings per share of which: from continuing operations from discontinued operations Diluted earnings per share of which: from continuing operations from discontinued operations
219 STATEMENT OF COMPREHENSIVE INCOME 000 Note Profit for the year (A) 968, ,121 of which from discontinued operations - 103,561 Fair value gains/(losses) on cash flow hedges ,666-73,522 Tax effect of fair value gains/(losses) on cash flow hedges -14,115 17,534 Deferred tax effect of issuer substitution of cash flow hedges - -49,535 Other comprehensive income/(loss) for the year reclassifiable to profit or loss (B) 24, ,523 Gains/(losses) from actuarial valuations of provisions for employee benefits ,978 Tax effect of gains/(losses) from actuarial valuations of provisions for employee benefits Other comprehensive income/(loss) for the year not reclassifiable to profit or loss (C) ,504 Reclassification of the cash flow hedge reserve arising from issuer substitution - 200,909 Other reclassifications of the cash flow hedge reserve to profit or loss for the year 20,144-2,865 Reclassifications of other components of comprehensive income to profit or loss for the year (D) 20, ,044 Total other comprehensive income/(loss) for the year (E=B+C+D) 44,003 91,017 Comprehensive income for the year (A+E) 1,012, ,138 Annual Report
220 STATEMENT OF CHANGES IN EQUITY 000 Balance as at 31 December 2015 Comprehensive income for the year Owner transactions and other changes Final dividend for 2015 ( per share, AGM of 21 April) Transfer of profit/(loss) for 2015 to retained earnings (AGM of 21 April) Interim dividend ( per share) Share-based incentive plans Increase in "Reserve for transactions under common control" due to sale of investments Balance as at 31 December 2016 Comprehensive income for the year Owner transactions and other changes Distribution of special dividend in kind, including effect on current taxation (OGM of 25 January) Final dividend for 2016 ( per share, AGM of 21 April) Transfer of profit/(loss) for 2016 to retained earnings (AGM of 21 April) Distribution of part of "Reserve for transactions under common control" (AGM of 21 April) Interim dividend ( per share) Share-based incentive plans Balance as at 31 December 2017 Reserves and retained earnings Issued capital Share premium reserve Legal reserve Cash flow hedge reserve Other reserves and retained earnings Total other reserves and retained earnings Profit for the year after interim dividends Total equity 622, , , ,413 1,230,838 1,323, ,680 2,565, ,521-1,504 91, , , , , , , , , , ,102 3,102-3, ,101,312 1,101,312-1,101, , , , ,892 2,483,176 2,668, ,328 3,605, , , ,016 1,012, , , , , , ,101,312-1,101, ,101, , , ,086 2,086-2, , , , , , , ,668 1,986,
221 STATEMENT OF CASH FLOWS 000 Note 2017 of which related party transactions 2016 CASH FLOWS FROM (USED IN) OPERATING ACTIVITIES Profit for the year 968, ,121 Adjusted by: of which related party transactions Amortisation and depreciation , ,722 Operating change in provisions -7,350 1,235 63,066 4,526 Financial expenses from discounting of provisions for construction services required by contract ,991 44,954 (Reversal of impairment losses)/impairment losses on non-current financial assets and investments ,213-4,213 13,463 10,941 Impairment losses/(reversal of impairment losses) on current and non-current assets 1,136 1,319 (Gains)/Losses on sale of non-current assets Net change in deferred tax (assets)/liabilities through profit or loss , ,208 Other non-cash costs (income) -48, ,111 Change in working capital and other changes 224, ,530-78, ,686 Net cash generated from/(used in) operating activities [a] 8.1 1,836,855 1,603,570 CASH FLOWS FROM (USED IN) INVESTING ACTIVITIES Investment in assets held under concession , ,929 Purchases of property, plant & equipment ,930-22,385 Purchases of other intangible assets ,830-15,164 Government grants related to assets held under concession 1,498 1,541 Return of capital reserves from subsidiaries , , Proceeds from sales of property, plant and equipment, intangible assets and investments 1,080-1,265,980 1,265,470 Net change in other non-current assets 27 - Net change in current and non-current financial assets -21,828-2,761-34,955-31,280 Net cash generated from/(used in) investing activities [b] , ,088 CASH FLOWS FROM (USED IN) FINANCING ACTIVITIES Distribution of equity reserves ,101,312 - Dividends paid , ,045 Repayment of loans from parent ,100,572-1,100,572 Issuance of bonds , ,098 Redemption of bonds ,566 - Repayments of medium/long term borrowings , ,545 Net change in other current and non-current financial liabilities 604, , , ,749 Net cash generated from/(used in) financing activities [c] 8.1-1,798,484-1,829,567 Increase/ (decrease) in cash and cash equivalents [a+b+c] , ,091 NET CASH AND CASH EQUIVALENTS AT BEGINNING OF YEAR 2,682,593 2,348,502 NET CASH AND CASH EQUIVALENTS AT END OF YEAR 2,569,736 2,682,593 ADDITIONAL INFORMATION TO THE CASH FLOW STATEMENT Income taxes paid(refunded) 160, ,712 Interest income and other financial income collected 52,556 40,003 Interest expense and other financial expenses paid 527, ,420 Dividends received 42, ,096 Foreign exchange gains collected Foreign exchange losses incurred RECONCILIATION OF NET CASH AND CASH EQUIVALENTS Net cash and cash equivalents at beginning of year 2,682,593 2,348,502 Cash and cash equivalents 6.7 2,924,421 2,422,343 Intercompany current account payables due to related parties ,828-73,841 Net cash and cash equivalents at end of year 2,569,736 2,682,593 Cash and cash equivalents 6.7 2,626,664 2,924,421 Intercompany current account payables due to related parties , ,828 Annual Report
222 NOTES 1. Introduction Autostrade per l Italia (or hereinafter the Company ) is a public limited company incorporated in 2003 with its registered office at Via Bergamini, 50 in Rome. The Company does not have branch offices. The duration of the Company is until 31 December The Company s core business is the operation of motorways under a concession granted by the Ministry of Infrastructure and Transport, which assumed the role of Grantor previously fulfilled by ANAS SpA (Italy s Highways Agency) from 1 October Under the concession arrangements, the Company and its motorway subsidiaries are responsible for the construction, management, improvement and upkeep of the sections of motorway in Italy. Further information on the Company s concession arrangement is provided in note 4, Concession arrangement % of the Company s share capital is held by Atlantia SpA (also referred to as "Atlantia"), which is listed on the screen-based trading system (Mercato Telematico Azionario) operated by Borsa Valori SpA, and is responsible for the management and coordination of the Company. At the date of preparation of these separate financial statements, Sintonia SpA is the shareholder that holds a relative majority of the issued capital of Atlantia. Neither Sintonia SpA nor its direct parent, Edizione Srl, manages or coordinates Atlantia. In addition, the sale of 11.94% of Autostrade per l'italia to minority shareholders was completed in 2017, as described in section 2.8.1, Autostrade per l'italia SpA s ownership structure, in the Report on Operations accompanying these financial statements. These separate financial statements as at and for the year ended 31 December 2017 were approved by the Company s Board of Directors at its meeting of 1 March The Company, which holds significant controlling interests in other companies, also prepares consolidated financial statements for the Group, published together with these separate financial statements. 2. Basis of preparation The financial statements as at and for the year ended 31 December 2017, have been prepared on a going concern basis and in accordance with articles 2 and 4 of Legislative Decree 38/2005, as well as with International Financial Reporting Standards (IFRS) in force on the balance sheet date, as issued by the International Accounting Standards Board and endorsed by the European Commission. These standards reflect the interpretations issued by the International Financial Reporting Interpretations Committee (IFRIC), in addition to previous International Accounting Standards (IAS) and previous interpretations issued by the Standard Interpretations Committee (SIC) and still in force at the end of the reporting period. For the sake of simplicity, all standards and interpretations are hereinafter referred to as IFRS. Moreover, the measures introduced by the CONSOB, in application of paragraph 3 of article 9 of Legislative Decree 38/2005, relating to the preparation of financial statements, have also been taken into account. The financial statements consist of the statement of financial position, the income statement, the statement of comprehensive income, the statement of changes in equity, the statement of cash flows and these notes, applying the historical cost convention, with the exception of those items that are required by IFRS to be recognised at fair value, as explained in the accounting policies for individual items described in note 3, Accounting standards and policies applied. The statement of financial position is based on the format that separately discloses current and 222
223 non-current assets and liabilities. The income statement is classified by nature of expense, whilst the statement of cash flows has been prepared in application of the indirect method. IFRS have been applied in accordance with the Conceptual Framework for Financial Reporting, and no events have occurred that would require exemptions pursuant to paragraph 19 of IAS 1. CONSOB Resolution of 27 July 2006 requires that, in addition to the specific requirements of IAS 1 and other IFRS, financial statements must, where material, include separate sub-items providing (i) disclosure of amounts deriving from related party transactions; and, with regard to the income statement, (ii) separate disclosure of income and expenses deriving from events and transactions that are non-recurring in nature, or transactions or events that do not occur on a frequent basis in the normal course of business. As in 2016, no non-recurring, atypical or unusual transactions, having a material impact on the Company s income statement and statement of financial position, were entered into in 2017, either with third or related parties. There were no non-recurring events and/or transactions in An issuer substitution was completed in This has resulted in Autostrade per l Italia taking Atlantia s place as the issuer of certain bonds entered into by the latter, with a significant impact on the operating results and financial position. More details are provided in note 5.2, Issuer substitution, in the separate financial statements as at and for the year ended 31 December Amounts in the statement of financial position, the income statement and the statement of cash flows are shown in euros, whilst amounts in the statement of comprehensive income, the statement of cash flows, the statement of changes in equity and these notes are shown in thousands of euros, unless otherwise indicated. With regard to the mentioned CONSOB Resolution of 27 July 2006 relating to the format for financial statements, a specific supplementary statement of financial position, income statement and statement of cash flows, with amounts in thousands of euros, showing material related party transactions, has been included as well as the positive and/or negative components of income from any non-recurring transactions occurred during the reference and comparison periods. The euro is both the Company s functional currency and its presentation currency. Each item in the financial statements is compared with the corresponding amount for the previous year. The comparative amounts have not been restated and/or reclassified with respect to those presented in the consolidated financial statements as at and for the year ended 31 December 2016, given that there have not been any events or material changes to the accounting standards applied that have resulted in the need to adjust or reclassify prior year amounts. 3. Accounting standards and policies applied A description follows of the more important accounting standards and policies employed by the Company for its financial statements as at and for the year ended 31 December These accounting standards and policies are consistent with those applied in preparation of the financial statements for the previous year, as no new standards, interpretations, or amendments to existing standards became effective in 2017, having a material effect on the Company s financial statements. The following amendments to existing standards and interpretations were applicable from 1 January 2017: a) IAS 7 Statement of Cash Flows. The amendments has introduced a requirement to provide a specific disclosure enabling the users of financial statements to assess changes in liabilities arising from financing activities, with the introduction of a specific reconciliation; Annual Report
224 b) IAS 12 Income Taxes. The amendments to this standard have clarified how to account for deferred tax assets on debt instruments measured at fair value, and how to estimate future taxable profit. Property, plant and equipment Property, plant and equipment is stated at cost. Cost includes expenditure that is directly attributable to the acquisition of the items and financial expenses incurred during construction of the asset. As permitted by IFRS 1, assets acquired through business combinations prior to 1 January 2004 are stated at previous amounts, as determined under the previous Italian GAAP for those business combinations and representing deemed cost. The cost of assets determined as above with finite useful lives is systematically depreciated on a straight-line basis applying rates that represent the expected useful life of the asset. Each component of an asset with a cost that is significant in relation to the total cost of the item, and that has a different useful life, is accounted for separately. Land, even if undeveloped or annexed to residential and industrial buildings, is not depreciated as it has an indefinite useful life. Investment property, which is held to earn rentals or for capital appreciation, or both, is recognised at cost measured in the same manner as property, plant and equipment. The relevant fair value of such assets has also been disclosed. The bands of annual rates of depreciation used in 2017, are shown in the table below by asset class. Property, plant and equipment Rate of depreciation Buildings 3% % Industrial and business equipment 10% - 25% Other assets 12% - 20% Assets acquired under finance leases are initially accounted for as property, plant and equipment, and have as a contra entry the underlying liability recorded in the balance sheet, at an amount equal to the relevant fair value or, if lower, the present value of the minimum payments due under the contract. Lease payments are apportioned between the interest element, which is charged to the income statement as incurred, and the capital element, which is deducted from the financial liability. Property, plant and equipment is tested for impairment, as described below in the relevant note, whenever events or changes in circumstances indicate that the carrying amount may not be recoverable. Property, plant and equipment is derecognised on disposal. Any gains or losses (determined as the difference between disposal proceeds, less costs to sell, and the carrying amount of the asset) are recognised in profit or loss in the period in which the asset is sold. Intangible assets Intangible assets are identifiable assets without physical substance, controlled by the entity and from which future economic benefits are expected to flow, and purchased goodwill. Identifiable intangible assets are those purchased assets that, unlike goodwill, can be separately distinguished. This condition is normally met when the intangible asset: (i) arises from a legal or contractual right, or (ii) is separable, meaning that it may be sold, transferred, licensed or exchanged, either individually or as an integral part of other assets. The asset is controlled by the entity if the entity has the ability to obtain future economic benefits from the asset and can limit access to it by others. 224
225 Internally developed assets are recognised as assets to the extent that: (i) the cost of the asset can be measured reliably; (ii) the entity has the intention, the available financial resources and the technical expertise to complete the asset and either use or sell it; (iii) the entity is able to demonstrate that the asset is capable of generating future economic benefits. Intangible assets are stated at cost which, apart from concession rights, is determined in the same manner as the cost of property, plant and equipment. The cost of concession rights is recovered in the form of payments received from road users and includes the following: a) the fair value of construction services and/or improvements carried out on behalf of the Grantor (measured as described in the note on "Construction contracts and services in progress") less finance-related amounts, consisting of (i) the amount funded by government grants. In particular, the following give rise to intangible assets deriving from concession rights: 1) rights received as consideration for specific obligations to provide construction services for road widening and improvement for which the operator does not receive additional economic benefits. These rights are initially recognised at the fair value of the construction services to be provided in the future (equal to their present value, less the portion covered by grants, and excluding any financial expenses that may be incurred during provision of the services), with a contra entry of an equal amount in Provisions for construction services required by contract, accounted for in liabilities in the statement of financial position. In addition to the impact of amortisation, the initial value of the rights changes over time as a result of periodic reassessment of the fair value of the part of the construction services still to be rendered at the end of the reporting period (equal to their present value, less the portion covered by grants, and excluding any financial expenses that may be incurred during provision of the services; 2) rights received as consideration for construction and/or upgrade services rendered for which the operator receives additional economic benefits in the form of specific toll increases and/or significant increases in the expected number of users as a result of expansion/upgrade of the infrastructure; b) rights to infrastructure constructed and financed by service area concession holders which have reverted free of charge to the Company on expiry of the related concessions Concession rights, on the other hand, are amortised over the concession term in a pattern that reflects the estimated manner in which the economic benefits embodied in the right are consumed. For this purpose, given that the Company does not expect to obtain material increases in traffic over the concession term, amortisation is calculated on a straight-line basis from the accounting period in which the rights in question begin to generate economic benefits. Amortisation of other intangible assets with finite useful lives begins when the asset is ready for use and is based on the remaining economic benefits to be obtained in relation to their residual useful lives. The bands of annual rates of amortisation used in 2017 are shown in the table below, presented by homogeneus asset classes. Intangible assets Rate of amortisation Concession rights On the commencement of generation of economic benefits for the entity, based on the residual term of the concession (4.55% for concessions whose amortisation commenced from 2017). Development costs 20% % Industrial patents and intellectual property rights 10% % Licences and similar rights 3.3% % Annual Report
226 Intangible assets are tested for impairment, as described below in the note on impairments and reversals, whenever events or changes in circumstances indicate that the carrying amount may not be fully recoverable. Gains and losses on disposal of the intangible assets are determined as the difference between the disposal proceeds, less costs to sell, and the carrying amount of the asset and then recognised in profit or loss in the period in which the asset is disposed of. Business combinations and Goodwill Acquisitions of companies and business units are accounted for using the acquisition method, as required by IFRS 3. For this purpose, identifiable assets and liabilities acquired through business combinations are measured at their fair value at the acquisition date. The cost of an acquisition is measured as the fair value, at the date of exchange, of the assets acquired, liabilities assumed and any equity instruments issued by the Company in exchange for control. Ancillary costs directly attributable to the business combination are recognised as an expense in the income statement when incurred. Goodwill is initially measured as the positive difference between 1) the acquisition cost, plus the fair value at the acquisition date of any previous non-controlling interests held in the acquiree, and 2) the fair value of net assets acquired and liabilities assumed. The goodwill, as measured on the date of acquisition, is allocated to each of the substantially independent cash generating units or groups of cash generating units which are expected to benefit from the synergies of the business combination. A negative difference between the cost of the acquisition, as increased by the above components, and the fair value of the net assets acquired is recognised as income in profit or loss in the year of acquisition. Goodwill on acquisitions of investments is included in the carrying amount of the relevant investment. If the Company is not in possession of all the information necessary to determine the fair value of the assets acquired and the liabilities assumed, these are recognised on a provisional basis in the year in which the business combination is completed and retrospectively adjusted within twelve months of the acquisition date. After initial recognition, goodwill is no longer amortised and is carried at cost less any accumulated impairment losses, determined as described in the note on impairment testing. IFRS 3 was not applied retrospectively to acquisitions prior to 1 January As a result, the carrying amount of goodwill on these acquisitions is that determined under the previous Italian GAAP, which is the net carrying amount at this date, subject to impairment testing and the recognition of any impairment losses. Investments Investments in subsidiaries, associates and joint ventures are accounted for at cost and include any directly related transaction costs. Impairment losses are identified in accordance with IAS 36, as described below in the note on Impairment of assets and reversals (impairment testing). The impairment is reversed in the event the circumstances giving rise to the impairment cease to exist; the reversal may not exceed the original carrying amount of the investment. Provisions are made to cover any losses of an associate or joint venture exceeding the carrying amount of the investment, to the extent that the shareholder is required to comply with actual or constructive obligations to cover such losses. Investments in other companies, which qualify as available-for-sale financial instruments, as defined by IAS 39, are initially accounted for at cost at the settlement date, in that, this represents fair value, including any directly attributable transaction costs. After initial recognition, these investments are measured at fair value, if determinable through the statement of comprehensive income and hence in a specific equity reserve. On realisation or recognition of an impairment loss in the income statement, the accumulated gains and losses in that reserve are taken to the income statement. 226
227 Impairment losses, identified as described in the note on Impairment of assets and reversals (impairment testing), are reversed through comprehensive income if the circumstances that resulted in the loss no longer exist. When fair value cannot be reliably determined, investments classified as available-for-sale are measured at cost less any impairment losses. In this case impairment losses may not be reversed. Acquisitions or disposals of companies and/or business units between companies belonging to the same group (entities or businesses under common control) are treated, in accordance with IAS 1 and IAS 8, on the basis of their economic substance, with confirmation of the fact that the purchase consideration is determined on the basis of fair value and that added value is generated for all the parties involved, resulting in significant measurable changes in the cash flows generated by the investments transferred before and after the transaction. In this regard: a) in the case of the disposal of an intra-group investment, if both requirements to be confirmed are met, the difference between the purchase consideration received and the carrying amount of the investment transferred is recognised in profit or loss. In the other cases, the difference is recognised directly in equity; b) in the case of acquisitions of intragroup investments, if both requirements to be confirmed are met, such investments are recognised at cost (as defined above); in the other cases, the investment is accounted for at the same amount at which it was accounted for in the financial statements of the transferee. The difference between the purchase consideration paid and this amount is recognised as an increase/reduction in the value of the investment held in the transferee. Construction contracts and services in progress Construction contracts are accounted for on the basis of the contract revenue and costs that can be reliably estimated with reference to the stage of completion of the contract, in accordance with the percentage of completion method, as determined by a survey of the works carried out or based on the ratio of costs incurred to total estimated costs. Contract revenue is allocated to the individual reporting periods in proportion to the stage of contract completion. Any positive or negative difference between contract revenue and any advance payments received is recognised in assets or liabilities, taking account of any impairment of the value of the completed work, in order to reflect the risks linked to the inability to recover the value of work performed on behalf of customers. In addition to contract payments, contract revenue includes changes in contract work, price reviews and claims to the extent that they can be measured reliably. Expected losses are recognised immediately in profit or loss regardless of the stage of contract completion. Revenue from construction and/or upgrade services provided to the Grantor and relating to the concessions arrangement held by the Group companies, are recognised on a percentage of completion basis in the income statement. In particular, construction and/or upgrade service revenues, representing the consideration for services provided, are measured at fair value, calculated on the basis of the total costs incurred (consisting primarily of the cost of materials and external services, relevant employee benefits and financial expenses, and the latter only in the case of construction and/or upgrade services for which the operator receives additional economic benefits). The double entry of construction and /or upgrade service revenue is represented by financial assets deriving from concession rights and/or grants, or by intangible assets deriving from concession rights, as explained in the relevant note. Inventories Inventories, primarily consisting of stocks and spare parts used in the maintenance and assembly of plant, are measured at the lower of purchase or conversion costs and net realisable value obtained on their sale in the ordinary course of business. The cost of purchase is to be determined using the weighted average cost formula. Annual Report
228 Receivables and payables Receivables are initially recognised at the fair value of the underlying asset, after any directly attributable transaction proceeds, and subsequently measured at amortised cost, using the effective interest method, less any allowance for bad debts. The amount of the allowance is based on the present value of expected future cash flows. These cash flows take account of expected collection times, estimated realisable value, any guarantees received, and the expected costs of recovering amounts due. Impairment losses are reversed in future periods if the circumstances that resulted in the loss no longer exist. In this case, the reversal is accounted for in the income statement and may not in any event exceed the amortised cost of the receivable that had no previous impairment losses been recognised. Payables are initially recognised at fair value of the liability underlying, after any directly attributable transaction costs. After initial recognition, payables are recognised at amortised cost, using the effective interest method. Trade receivables and payables, which are subject to normal commercial terms and conditions, are not discounted to present value. Cash and cash equivalents Cash and cash equivalents are recognised at face value and include highly liquid demand or very short-term instruments of excellent quality which are subject to an insignificant risk of changes in value. Derivative financial instruments All derivative financial instruments are recognised at fair value at the end of the year. As required by IAS 39, derivatives are designated as hedging instruments when the relationship between the derivative and the hedged item is formally documented and the periodically assessed effectiveness of the hedge is high and ranges between 80% and 125%. Changes in the fair value of cash flow hedges hedging assets and liabilities (including those that are pending and highly likely to arise in the future) are recognised in the statement of comprehensive income. The gain or loss relating to the ineffective portion is recognised in profit or loss. Changes in the value of fair value hedged assets or liabilities are recognised in profit or loss for the period. Analogously, the hedged assets and liabilities are restated at fair value through profit or loss. Changes in the fair value of derivative instruments that do not qualify for hedge accounting under IAS 39 are recognised in profit or loss. Other financial assets and liabilities Other financial assets that the Company intends and is able to hold to maturity and other financial liabilities are recognised at the fair value of the purchase consideration at the settlement date, with assets being increased and liabilities being reduced by transaction costs directly attributable to the purchase of the assets or issuance of the liabilities. After initial recognition, financial assets and liabilities are measured at amortised cost using the original effective interest method. Financial assets and liabilities are derecognised when, following their sale or settlement, the Group is no longer involved in their management and has transferred all risks and rewards of the ownership related to these instruments sold/settled. If there is a modification of one or more terms of an existing financial instrument (including as a result of its novation), it is necessary to conduct a qualitative and quantitative analysis in order to assess whether or not the modification is substantial with respect to the existing terms. In the event of non-substantial modifications, the instrument continues to be accounted for at the previously recognised amortised cost, and the instrument s effective interest rate is 228
229 remeasured on a prospective basis. If the modifications are substantial, the existing instrument is derecognised and the fair value of the new instrument is recognised, with the related difference recognised in profit or loss. Financial assets held for trading in the short term are recognised and measured at fair value through profit or loss. Other categories of financial asset classified as available-for-sale financial instruments are recognised and measured at fair value through comprehensive income and, consequently, in a specific equity reserve. The financial instruments in these categories have never been reclassified. Financial assets also include amounts due from public entities as grants or similar compensation relating to the construction of infrastructure (construction and/or upgrade services). Fair value measurement and the fair value hierarchy For all transactions or balances (financial or non-financial) for which an accounting standard requires or permits fair value measurement and which fall within the application of IFRS 13, the Group applies the following criteria: a) identification of the unit of account, defined as the level at which an asset or a liability is aggregated or disaggregated in an IFRS for recognition purposes; b) identification of the principal market or, in the absence of such a market, the most advantageous market in which the particular asset or liability to be measured could be traded; unless otherwise indicated, it is assumed that the market currently used coincides with the principal market or, in the absence of such a market, the most advantageous market; c) definition for non-financial assets of the highest and best use of the asset; unless otherwise indicated, highest and best use is the same as the asset's current use; d) definition of valuation techniques that are appropriate for the measurement of fair value, maximising the use of relevant observable inputs that market participants would use when determining the price of an asset or liability; e) determination of the fair value of assets, based on the price that would be received to sell an asset, and of liabilities and equity instruments, based on the price paid to transfer a liability in an orderly transaction between market participants at the measurement date; f) inclusion of non-performance risk in the measurement of assets and liabilities and above all, in the case of financial instruments, determination of a valuation adjustment when measuring fair value to include, in addition to counterparty risk (CVA - credit valuation adjustment), the own credit risk (DVA - debit valuation adjustment). Based on the inputs used for fair value measurement, a fair value hierarchy for classifying the assets and liabilities measured at fair value, or the fair value of which is disclosed in the financial statements, has been identified: a) level 1: includes quoted prices in active markets for identical assets or liabilities; b) level 2: includes inputs other than quoted prices included within level 1 that are observable, such as the following: i) quoted prices for similar assets or liabilities in active markets; ii) quoted prices for similar or identical assets or liabilities in markets that are not active; iii) other observable inputs (interest rate and yield curves, implied volatilities and credit spreads); c) level 3: unobservable inputs used to the extent that observable data is not available. The unobservable inputs used for fair value measurement should reflect the assumptions that market participants would use when pricing the asset or liability being measured. Definitions of the fair value hierarchy level in which individual financial instruments measured at fair value have been classified, or for which the fair value is disclosed in the financial statements, are provided in the notes to individual components of the financial statements. There are no assets or liabilities classifiable in level 3 of the fair value hierarchy. No transfers between the various levels of the fair value hierarchy took place during the year. Annual Report
230 The fair value of derivative financial instruments is based on expected cash flows that are discounted at rates derived from the market yield curve at the measurement date and the curve for listed credit default swaps entered by the counterparty and the Company, to include the non-performance risk explicitly provided for by IFRS 13. In the case of medium/long-term financial instruments, other than derivatives, where market prices are not available, the fair value is determined by discounting expected cash flows, using the market yield curve at the measurement date and taking into account counterparty risk in the case of financial assets and the own credit risk in the case of financial liabilities. Provisions for construction services required by contract and other provisions Provisions for construction services required by contract relate to specific contractual obligations still to be implemented having regard to motorway expansion and upgrading for which the operator receives no additional economic benefit. Since the performance of such obligations is treated as part of the consideration for the concession, an amount equal to the fair value of future construction services (equal to the present value of the services, less the portion covered by grants, and excluding any financial expenses that may be incurred during provision of the services) is initially recognised. The double entry is concession rights for works without additional economic benefits. The fair value of the residual liability for future construction services (equal to their present value, less the portion covered by grants, and excluding any financial expenses that may be incurred during provision of the services) is periodically reassessed and changes to the measurement of the liabilities (such as, for example, changes to the estimated cash outflows necessary to discharge the obligation, a change in the discount rate or a change in the construction period) are recognised as a matching increase or reduction in the corresponding intangible asset. Any increase in provisions to reflect the time value of money is recognised as a financial expense. Provisions are made when: (i) the Company has a present (actual or constructive) obligation as a result of a past event; (ii) it is probable that an outflow of resources will be required to settle the obligation; and (iii) the related amount can be reliably estimated. Provisions are measured on the basis of management s best estimate of the expenditure required to settle the present obligation at the end of the reporting period. If the discount to present value is material, provisions are determined by discounting future expected cash flows to their present value at a rate that reflects the market view of the time value of money. Subsequent to the computation of present value, the increase in provisions over time is recognised as a financial expense. Provisions for the repair and replacement of motorway infrastructure cover the liability represented by the contractual obligation to repair and replace assets to be handed over, as required by the concession arrangements entered into with the Grantor. These provisions are calculated on the basis of the usage and wear and tear of motorways at the end of the reporting period, taking into account, if material, the time value of money. Routine maintenance costs are, in contrast, recognised in the income statement when incurred and are not, therefore, included in the provisions. The provisions for cyclical maintenance include the estimated cost of a single cycle and are determined separately for each category of infrastructure (viaducts, flyovers, tunnels, safety barriers, motorway surfaces). The following process is applied for each category, based on specific technical assessments, the available information, the current state of motorway traffic and existing materials and technologies: a) the duration of the cycle linked to the repair or replacement work is estimated; b) the serviceability of the infrastructure is assessed, classifying the various types of intervention based on the state of repair of the infrastructure and the number of years remaining until the scheduled maintenance work; c) the cost for each category is determined, based on the verifiable and documented evidence available at the time and comparable work; d) the total value of the work included in the relevant cycle is determined; 230
231 e) the provisions at the reporting date are calculated, allocating the cost to the income statement in relation to the number of years remaining until the date of the scheduled maintenance work, in line with the above classification based on the state of repair of the infrastructure, discounting the resulting amount to present value at the measurement date using an interest rate with a duration in line with that of the expected cash flows. The above effects are recognised in the following income statement items: a) the Operating change in provisions, reflecting the impact of the revision of estimates as a result of technical assessments (the value of the works to be carried out and the expected timing of such works) and the change in the discount rate used compared with the previous year; b) Financial expenses from discounting of provisions, reflecting the time value of money, calculated based on the value of the provisions and the interest rate used to discount the provisions to present value at the prior year reporting date. When the cost of the works is actually incurred, the cost is recognised by nature and the item Operating change in provisions reflects use of the provisions previously made, as described in point e) above. Employee benefits Short-term employee benefits, provided during the period of employment, are recognised on an accruals basis as the accrued liability at the end of the reporting period. Liabilities deriving from medium/long-term employee benefits are recognised in the vesting period, less any plan assets and advance payments made. They are determined on the basis of actuarial assumptions and, if material, recognised on an accruals basis in line with the period of service necessary to obtain the benefit. Post-employment benefits in the form of defined benefit plans are recognised at the amount accrued at the end of the reporting period. Post-employment benefits in the form of defined benefit plans are recognised in the vesting period, less any plan assets and advance payments made. Such defined benefit plans primarily regard the obligation as determined on the basis of actuarial assumptions and recognised on an accruals basis in line with the period of service necessary to obtain the benefit. The obligation is calculated by independent actuaries. Any resulting actuarial gain or loss is recognised in full in other components of comprehensive income in the period to which it relates. Non-current assets held for sale, assets and liabilities included in disposal groups or held for distribution to shareholders and/or related to discontinued operations Where the carrying amount of non-current assets held for sale, or of assets and liabilities included in disposal groups or held for distribution to shareholders and/or related to discontinued operations is to be recovered primarily through sale rather than through continued use, these items are presented separately in the statement of financial position. Immediately prior to being classified as held for sale or for distribution, each asset and liability is recognised under the specific IFRS applicable and subsequently accounted for at the lower of the carrying amount and fair value. Any impairment losses are recognised immediately in the income statement. Disposal groups or operations held for sale or for distribution are recognised in profit or loss as discontinued operations provided when the following conditions are met: a) they represent a major line of business or geographical area of operation; b) they are part of a single coordinated plan to dispose of a separate major line of business or geographical area of operation; c) they are subsidiaries acquired exclusively with a view to resale. Annual Report
232 After tax gains and losses resulting from the management or sale or distribution of such operations are recognised as one amount in profit or loss with comparatives. Revenue Revenue is recognised when the fair value can be reliably measured and it is probable that the economic benefits associated with the transactions will flow to the Company. Depending on the type of transaction, revenue is recognised on the basis of the following specific criteria: a) toll revenue is accrued with reference to traffic volumes; b) to the extent, for sales of goods, that significant risks and rewards of ownership are transferred to the buyer; c) the provision of services is prorated to percentage of completion of work, based on the previously described criteria used for construction contracts and services in progress, which also include the construction and/or upgrade services provided to the Grantor, in application of IFRIC 12. When revenue cannot be reliably determined, it is only recognised to the extent that expenses are considered to be recoverable; d) rental income or royalties, on an accruals basis, based on the agreed terms and conditions of the contract. This revenue includes amounts generated by the subconcession of retail and office space to third parties within the airports and motorway networks operated by the Group and, as they substantially equate to the lease of portions of infrastructure, are subject to IAS 17. This revenue, under existing contractual agreements, is partly dependent on the revenue earned by the sub-operator and, as a result, the related amount varies over time; e) interest income (so does interest expense) is calculated with reference to the amount of the financial asset or liability, in accordance with the effective interest method; f) dividend income is recognised when the right to receive payment is established. Government grants Government grants are accounted for at fair value when: (i) the related amount can be reliably determined and there is reasonable certainty that (ii) they will be received and that (iii) the conditions attaching to them will be satisfied. Grants related to income are accounted for in the income statement for the accounting period in which they accrue, in line with the corresponding costs. Grants received for investment in motorways and airports are accounted for as construction service revenue, as explained in the note on "Construction contracts and services work in progress". Any grants received to fund investment in property, plant and equipment and/or intangible assets (other than concession rights) are accounted for as a reduction in the cost of the asset to which they refer and result in a reduction in depreciation. Income taxes Income taxes are recognised on the basis of an estimate of tax expense to be paid, in compliance with the regulations in force. Deferred tax assets and liabilities are determined on the basis of temporary differences between the carrying amounts of assets and liabilities as in the Company's books (resulting from application of the accounting policies described in note 3), and the corresponding tax bases (resulting from application of the tax regulations in force), as follows: a) deferred tax assets are only recognised to the extent that it is probable that future taxable profits will be available against which the asset can be utilised; b) deferred tax liabilities are always recognised (unless the liability derives from the initial recognition of goodwill or as a result of temporary taxable differences relating to investments in subsidiaries, associates and joint ventures, when the Company has control over the timing of the reversal of the temporary differences and it is likely that the temporary difference will not reverse in the foreseeable future). 232
233 The parent, Atlantia SpA, operates a tax consolidation arrangement in which Autostrade per l Italia participates. In this regard, relations between the companies are regulated by a specific contract. This contract establishes that participation in the tax consolidation arrangement may not, under any circumstances, result in economic or financial disadvantages for the participating companies compared with the situation that would have arisen had they not participated in the arrangement. Should such disadvantages arise, they are to be offset by a corresponding indemnity to be paid to the participating companies concerned. Income tax expense is recognised in current tax liabilities in the statement of financial position, less any payments on account, and includes the portion of IRES transferred to Atlantia under the tax consolidation arrangement. Any tax credits are recognised in current tax assets. Share-based payments The cost of services provided by directors and/or employees remunerated through sharebased incentive plans, and settled through the award of financial instruments, is based on the fair value of the rights at the grant date. Fair value is computed using actuarial assumptions and with reference to all characteristics, at the grant date (vesting period, any consideration due and conditions of exercise, etc.), of the rights and the plan's underlying securities. The obligation is determined by independent actuaries. The cost of these plans is recognised in profit or loss, with a contra-entry in equity, over the vesting period, based on a best estimate of the number of options that will vest. In case the beneficiaries are administrators and employees of subsidiaries the cost is determined as an increase in the value of the related investment. The cost of any services provided by Directors and/or employees and remunerated through share-based payments, but settled in cash, is instead measured at the fair value of the liability assumed and recognised in profit or loss, with a contra entry in liabilities, over the vesting period, based on a best estimate of the number of options that will vest. Fair value is remeasured at the end of each reporting period until such time as the liability is settled, with any changes recognised in profit or loss. If the beneficiaries are the directors or employees of subsidiaries, where the Company has an obligation to settle the transaction, the cost is recognised as an increase in the value of the investment. Impairment of assets and reversals (impairment testing) At the end of the reporting period, the Company tests property, plant and equipment, intangible assets, financial assets and investments for impairment. If there are indications that these assets have been impaired, the recoverable amounts of such assets are estimated in order to verify and eventually measure the amount of the impairment loss. Irrespective of whether there is an indication of impairment, intangible assets with indefinite lives and those which are not yet available for use are tested for impairment at least annually, or more frequently, if an event has occurred or there has been a change in circumstances that could cause an impairment. If it is not possible to estimate the recoverable amounts of individual assets, the recoverable amount of the cash-generating unit to which a particular asset belongs is estimated. This entails estimating the recoverable amount of the asset (represented by the higher of the asset's fair value less costs to sell and its value in use) and comparing it with the carrying amount. If the recoverable amount of an asset is estimated to be less than its carrying amount, the carrying amount is reduced to its recoverable amount. If the recoverable amount of an asset is estimated to be less than its carrying amount, the carrying amount is reduced to its recoverable amount. In calculating value in use, expected future pre-tax cash flow is discounted using a pre-tax rate that reflects current market assessments of the cost of capital which embodies the time value of money and the risks specific to the business. In estimating Annual Report
234 an operating CGU s future cash flows, after-tax cash flows and discount rates are used because the results are substantially the same as pre-tax computations. Impairments are recognised in profit or loss in a variety of classifications depending on the nature of the impaired asset. Losses are reversed if the circumstances that resulted in the loss no longer exist, provided that the reversal does not exceed the cumulative impairment losses previously recognised, unless the impairment loss relates to goodwill and investments measured at cost, where the related fair value cannot be reliably determined. Estimates and judgements Preparation of financial statements in compliance with IFRS involves the use of estimates and judgements, which are reflected in the measurement of the carrying amounts of assets and liabilities and in the disclosures provided in the notes to the financial statements, including contingent assets and liabilities at the end of the reporting period. These estimates are primarily used in determining amortisation and depreciation, impairment testing of assets (including the measurement of receivables), provisions, employee benefits, the fair value of financial assets and liabilities, and deferred tax assets and liabilities. The amounts subsequently recognised may, therefore, differ from these estimates. Moreover, these estimates and judgements are periodically reviewed and updated, and the resulting effects of each change immediately recognised in the financial statements. Translation of foreign currency items Transactions in currencies other than the functional currency are recognised by application of the exchange rate of the transaction date. Assets and liabilities denominated in currencies other than the euro are, subsequently, remeasured by application of the closing exchange rate. Any exchange differences on remeasurement are recognised in profit or loss. Non-monetary assets and liabilities denominated in foreign currencies and recognised at historic cost are translated using the exchange rate of the date of initial recognition. Earnings per share Basic earnings per share is computed by dividing profit attributable to owners of the parent by the weighted average number of shares outstanding during the accounting period. Diluted earnings per share is computed by dividing profit attributable to owners of the parent by the above weighted average, also taking into account the effects deriving from the subscription, exercise or conversion of all potential shares that may be issued as a result of the exercise of any outstanding rights. New accounting standards and interpretations, or revisions and amendments of existing standards, that have either yet to come into effect As required by IAS 8 Accounting Policies, Changes in Accounting Estimates and Errors, this section describes new accounting standards and interpretations, and amendments of existing standards and interpretations that are already applicable, but that have either yet to come into effect at the reporting date, and that may in the future be applied in the Company s financial statements. 234
235 Name of document Effective date of IASB document Date of EU endorsement New accounting standards and interpretations IFRS 9 Financial Instruments 1 January 2018 November 2016 IFRS 15 Revenue from Contracts with Customers 1 January 2018 September 2016 IFRS 16 Leases 1 January 2019 October 2017 Amendments to existing standards and interpretations Amendments to IFRS 2 Share-based Payment 1 January 2018 Not endorsed Annual Improvements to IFRSs: January February 2018 Annual Improvements to IFRSs: January 2019 Not endorsed IFRS 9 Financial Instruments In July 2014, the IASB published the final version of IFRS 9, the standard created to replace the existing IAS 39 for the classification and measurement of financial instruments. The standard introduces new rules for the classification and measurement of financial instruments, a new impairment model for financial assets and a new hedge accounting model. Classification and measurement IFRS 9 envisages a single approach for the assessment and classification of all financial assets, including those containing embedded derivatives. The classification and related measurement is driven by both the business model in which the financial asset is held and the contractual cash flow characteristics of the asset. The financial asset is measured at amortised cost subject to both of the following conditions: a) the asset is held in conjunction with a business model whose objective is to hold assets in order to collect contractual cash flows; and b) the contractual terms of the financial asset give rise on specified dates to cash flows that are solely payments of principal and interest on the principal amount outstanding. The financial asset is measured at fair value, with any changes recognised in comprehensive income, if the objectives of the business model are to hold the financial asset to collect the contractual cash flows, or to sell it. Finally, the standard envisages a residual category of financial asset measured at fair value through profit or loss, which includes assets held for trading. A financial asset meeting the conditions to be classified and measured at amortised cost may, on initial recognition, be designated as a financial asset at fair value through profit or loss, to the extent that this accounting treatment would eliminate or significantly reduce a measurement or recognition inconsistency (sometimes referred to as an accounting mismatch ) that would otherwise arise from measuring assets or liabilities or recognising the gains and losses on them on different bases. In addition, the new standard provides that an entity may, with respect to investments in equity instruments, which consequently may not be carried and measured at amortised cost unless such instruments are shares that are not held for trading but rather for strategic reasons, make an irrevocable election on initial recognition to present changes in the fair value in comprehensive income. The new IFRS 9, on the other hand, has confirmed the provisions of IAS 39 for financial liabilities including the relative measurement at amortised cost or, in specific circumstances, at fair value through profit or loss. Annual Report
236 As a result of the amendment approved on 12 October 2017 (and effective from 1 January 2019), it has been specified that: a) in the event of non-substantial modifications to the terms of a financial instrument, the difference between the present value of the modified cash flows (determined using the instrument s effective interest rate at the date of modification) and the carrying amount of the instruments is accounted for in profit or loss; b) a debt instrument with a prepayment option may comply with the definition of contractual cash flows alone required by IFRS 9 and, as a result, be accounted for at amortised cost or at fair value through other comprehensive income, even when the contract provides for negative compensation for the lender. The requirements of IAS 39 that have been changed are primarily: a) the reporting of changes in fair value in connection with the credit risk of certain liabilities, which IFRS 9 requires to be recognised in comprehensive income rather than in profit or loss as movements in fair value as a result of other risks; b) the elimination of the option to measure, at amortised cost, financial liabilities consisting of derivative financial instruments entailing the delivery of unlisted equity instruments. The consequence of the change is that all derivative financial instruments must now be recognised at fair value. Impairment IFRS 9 has defined a new impairment model for financial assets, with the objective of providing the users of financial statements with more useful information about an entity s expected losses. The model requires an entity to recognise expected credit losses at all times and to update the amount of expected losses recognised at each reporting date to reflect changes in the credit risk of the financial instruments. It is, therefore, no longer necessary to wait for evidence of a trigger event before testing for impairment and recognition of a credit loss. All financial instruments must be tested for impairment, with the exception of those measured at fair value through profit or loss. Hedge accounting The most important changes introduced by IFRS 9 regard: (a) the extended scope of the risks eligible for hedge accounting, to include those to which nonfinancial assets and liabilities are exposed, also permitting the designation of groups and net positions as hedged items, also including any derivatives; (b) the option of designating a financial instrument at fair value through profit or loss as a hedging instrument; (c) the alternative method of accounting for forwards and options, when included in a hedge accounting relationship; (d) changes to the method of conducting hedge effectiveness tests, following introduction of the principle of the economic relationship between the hedged item and the hedging instrument; in addition, retrospective hedge effectiveness testing is no longer required; (e) the possibility of rebalancing an existing hedge where the risk management objectives continue to be valid. IFRS 15 Revenue from Contracts with Customers IFRS 15 replaces the previous IAS 18, in addition to IAS 11, regarding contract work, and the related interpretations, IFRIC 13, IFRIC 15, IFRIC 18 and SIC 31. IFRS 15 establishes the standards to follow in recognising revenue from contracts with customers, with the exception of contracts falling within the scope of application of standards governing leases, insurance contracts and financial instruments. The new standard provides an overall framework for identifying the timing and amount of revenue to be recognised in the financial statements. Under the new standard, the entity must 236
237 analyse the contract and the related accounting effects using the following steps: a) identification of the contract; b) identification of the performance obligations in the contract; c) determination of the transaction price; d) allocation of the transaction price to each identified performance obligation; e) recognition of revenue when the performance obligation is satisfied. The amount recognised as revenue by an entity must, therefore, reflect the consideration to which the entity is entitled in exchange for goods transferred to the customer and/or services rendered. This revenue is to be recognised when the entity has satisfied its performance obligations under the contract. In addition, in recognising revenue, the standard stresses the need to assess the likelihood of obtaining/collecting the economic benefits linked to the proceeds. In the case of contract work in progress, currently governed by IAS 11, the new standard introduces the requirement to recognise revenue taking into account the effect of discounting to present value resulting from the deferral of collections over time. If it is not possible to retrospectively apply the new standard, a modified approach can be used upon first-time adoption. Under this approach, the effects of application of the new standard must be recognised in opening equity at the beginning of the reporting period of first-time adoption. IFRS 16 Leases On 13 January 2016, the IASB published the final version of the new accounting standard regarding the accounting treatment for finance leases. This new standard replaces IAS 17, IFRIC 4, SIC 15 and SIC 27, and its adoption, subject to endorsement by the European Union, is required from 1 January Earlier application is permitted if IFRS 15 Revenue from Contracts with Customers has been applied. The new accounting standard provides a single lessee accounting model for both operating and finance leases. IFRS 16 requires the lessee to recognise the leased assets in its statement of financial position, with the assets recognised and classified as a right-of-use asset (thus, in intangible assets), regardless of the nature of the leased asset, to be amortised over the life of the right. On initial recognition, the lessee recognises the right-of-use asset and the related lease liability, based on the present value of the minimum lease payments payable over the lease term. IFRS 16 also clarifies that a lessor, with regard to contracts that contain a lease component, must separate the lease components (to which IFRS 16 applies) from the nonlease components, to which other IFRS are applicable. Application of the new method of presentation is not required, in terms of significance for the lessee, when the lease term is 12 months or less or the underlying asset has a low value. In terms of the lessor, the alternative accounting models for finance or operating leases continue to be substantially applicable, depending on the nature of the contract, as currently governed by IAS 17. As a result, it will be necessary to recognise the receivable (if a finance lease) or the fixed asset (if an operating lease). Amendments to IFRS 2 Share-based Payment On 20 June 2016, the IASB published a number of amendments to IFRS 2 in order to clarify the method of accounting for cash-settled share-based payments linked to performance indicators, the classification of share-based payments settled net of tax withholdings and the method of accounting in the event of modification of share-based payment transactions from cash-settled to equity-settled. Annual Improvements to IFRSs: On 8 December 2016, the IASB published its Annual Improvements to IFRSs: cycle. Annual Report
238 The principal amendments that could be relevant to the Group regard IFRS 12 Disclosure of Interest in Other Entities. The document clarifies the scope of the standard, specifying that the disclosures required by the standard, with the exception of those in paragraphs B10-B16, also apply to investments in other entities held for sale, held for distribution or as discontinued operations in accordance with IFRS 5. Annual Improvements to IFRSs: On 12 December 2017, the IASB published its Annual Improvements to IFRSs: cycle, introducing amendments to a number of standards as part of its annual improvements process. The principal amendments that could be relevant to the Company regard: a) IFRS 3 Business Combinations, and IFRS 11 Joint Arrangements. The amendment establishes that if an entity acquires control of a business that is a joint operation, it must remeasure any previous interests in the business at fair value. In contrast, this approach does not apply to acquisitions of joint control; b) IAS 12 Income Taxes. The amendment clarifies that an entity must account for all income tax consequences of dividend payments (including payments on financial instruments classified as equity) in the same way as the transaction that generated them. They will, therefore, be recognised in the income statement, in comprehensive income or in equity. The Company is currently evaluating the effects of the future application of newly issued standards, as well as of revisions and amendments to existing standards. These effects cannot currently be reasonably estimated, with the exception of IFRS 9, IFRS 15 and IFRS 16, to which the following applies. With regard to the new standard, IFRS 9, the Company has proceeded with an assessment of the potential impact of application of the standard. This process has focused on the principal financial statement items that may be affected, consisting of trade receivables, financial assets deriving from concession rights, financial liabilities and derivative financial instruments. The impact of the procedures required by the new standard on the above items has been analysed and, as a result of the tests and evaluations conducted, it is not expected to have a material impact on Autostrade per l Italia s financial statements. The only modification of note regards the non-substantial modifications of financial liabilities carried out in 2017 and described in note 6.14, Financial liabilities. Under the new standard, these modifications would have resulted in recognition, in profit or loss, of the difference between the present value of the modified cash flows (determined using the instrument s effective interest rate at the date of the modification) and the carrying amount of the instrument at the date of the modification. This difference, estimated to be approximately 35 million before the related taxation, will be recognised in consolidated equity at 1 January 2018, representing the effect of adoption of IFRS 9. With reference to IFRS 15, the Company has substantially completed its assessment of the applicability of the new standard to the various types of existing contracts, and the potential operational and accounting effects. The assessment examined the applicability of the new standard to the concession arrangement to which the Company is party, to the subconcessions granted for motorway service areas and retail space on motorways, and to the other important contracts with customers. The process has resulted in the view that the concession arrangement to which the Company is party does not fall within the scope of application of IFRS 15. As a result, the current methods of presentation, described above in these notes, are not expected to change, including the treatment of revenue from construction services and the above sub-concession arrangements, 238
239 which are excluded from application of the new standard as they are governed by IAS 17 Leases, given that they are leases of specific assets. Adoption of the new standard is also not expected to result in significant changes to the way in which other important contracts are accounted for. Therefore, based on the analyses and evaluations conducted, the adoption of IFRS 15 is not expected to have a material impact on the Company s financial statements. The Company has also assessed the potential impact of the introduction of IFRS 16. The Company is not party to significant lease arrangements as a lessee. In addition, with regard to arrangements in which the Company is the lessor, essentially represented by sub-concession arrangements involving the lease of space used by retailers and food service providers along the motorways operated under concession, IFRS 16 has not introduced changes to the accounting treatment of lease arrangements by lessors, compared with the requirements of IAS 17. As a result, introduction of the new standard is not currently expected to have a material impact. Annual Report
240 4. CONCESSION ARRANGEMENT The Single Concession Arrangement executed by the Company and ANAS (whose role as Grantor was assumed by the Ministry of Infrastructure and Transport from 1 October 2012) on 12 October 2007 and approved by Law 101/2008. Its purpose is the construction and operation of the motorways for which the concession is granted. The Single Concession Arrangement terminates on 31 December Very briefly, the concession gives the Company, on the one hand, the right to retain tolls collected from motorway users, less the concession fees payable to ANAS SpA, with such tolls being revised annually based on a toll formula contained in the Single Concession Arrangement, while, on the other hand, requiring the Company to upgrade and modernise the motorway infrastructure operated under concession and provide maintenance and operating services. At the end of the concession term, the operator shall hand over the motorway operated under the concession and the related assets free of charge to the Grantor in a good state of repair and unencumbered. On 24 December 2013 the Grantor and Autostrade per l Italia signed an Addendum to the Single Concession Arrangement. This document contained the five-yearly revision of the financial plan annexed to the Arrangement, as provided for by art. 11 of the Arrangement. The above Addendum was approved by a ministerial decree of 30 December 2013 and was registered with the Italian Court of Auditors on 29 May A II Addendum to Autostrade per l Italia s Single Concession Arrangement was signed on 10 July 2017, replacing the previous addendum signed on 10 December 2015, for which the related approval process had not been completed. The Addendum governs the inclusion of the Casalecchio Interchange Northern section among the operator s investment commitments in the Single Concession Arrangement. The project will involve expenditure of up to approximately 158 million, including around 2 million already incurred for design work, and almost 156 million to be paid to ANAS, which will carry out the work and then operate the infrastructure. This amount will be paid to ANAS on a stage of completion basis and under a specific agreement to be executed. The amount will then be recouped by Autostrade per l'italia through the specific K tariff component. During the approval process, the Grantor requested that the document be signed digitally. The Addendum was then signed on 22 February 2018 and will be effective once it has been approved by the Ministry of Infrastructure and Transport and the Ministry of the Economy and Finance, and once the related decree has been registered by Italy s Court of Auditors. With regard to the existing concession, the Company is engaged in the implementation of a programme of investment in Major Works (including the works envisaged by the 1997 Agreement, the IV Addendum of 2002 and other investment). The investment programme, which forms part of the Company s financial plan, updated to December 2013, essentially regards the upgrade of existing motorways. The total value of the above programme as at 31 December 2017 is 17.6 billion, including approximately 10.1 billion already completed as at 31 December 2017 ( 9.8 billion as at 31 December 2016). The item, Current provisions for fines and penalties under the Single Concession Arrangement, in the statement of financial position reflects estimated fines and penalties that may be imposed on the Company by the Grantor, in connection with alleged breaches of the concession terms and conditions and/or non-fulfilment of its obligations under Annex N of the existing Concession Arrangement. In this regard, Autostrade per l Italia has brought four actions before Lazio Regional Administrative Court, contesting the application of fines and penalties. A detailed analysis of the provisions is contained in note 6.13, Provisions. 240
241 The following table lists the sections of motorway operated under the concession as at 31 December Section of motorway Kilometres in service A1 Milan Naples (*) A4 Milan Brescia 93.5 A7 Genoa Serravalle 50.0 A8/9 Milan lakes 77.7 A8 / A26 link road 24.0 A10 Genoa Savona 45.5 A11 Florence Pisa North 81.7 A12 Genoa Sestri Levante 48.7 A12 Rome Civitavecchia 65.4 A13 Bologna Padua A14 Bologna Taranto A16 Naples Canosa A23 Udine Tarvisio A26 Genoa Gravellona Toce A27 Mestre Belluno 82.2 A30 Caserta Salerno 55.3 Total 2,854.6 (*) including 32 km upgraded through doubling of capacity via construction of new carriageway (Variante di Valico ). Annual Report
242 5. CORPORATE ACTIONS 5.1 Restructuring of the Atlantia Group As previously indicated in note 5.1, Restructuring of the Atlantia Group, in the separate financial statements as at and for the year ended 31 December 2016, as part of the restructuring of the Atlantia Group, the General Meeting of Autostrade per l Italia s shareholders held on 25 January 2017 approved the distribution, to the parent, Atlantia, of a special dividend in kind. This entailed the use of available equity reserves of 755 million, via use of the Extraordinary reserve through the transfer of Autostrade per l Italia s entire interests in Autostrade dell Atlantico and Autostrade Indian Infrastructure Development, amounting to 754 million and 1 million, respectively, and with effect from 1 and 22 March 2017, respectively. The transaction is classifiable as a transaction under common control. As the transaction was based on the related carrying amounts, as above, and represents a mere restructuring, without generating added value for any of the parties involved, the Company has recognised the reduction in equity resulting from payment of the above special dividend in kind and the related current taxation, amounting to 12 million. In addition, on 21 April 2017, the Annual General Meeting of the Company s shareholders approved the distribution of a portion of the available reserves to Atlantia, by transferring the amount of 1,101 million from the Reserve for transactions under common control. 242
243 6. Notes to the consolidated statement of financial position The following notes provide information on items in the consolidated statement of financial position as at 31 December Comparative amounts as at 31 December 2016 are shown in brackets. Details of amounts in the consolidated statement of financial position deriving from related party transactions are provided in note 9.3, Related party transactions. 6.1 Property, plant and equipment - 74,180 thousand ( 78,097 thousand) The following table provides details of property, plant and equipment at the beginning and end of the period, showing the original cost and accumulated depreciation at the end of the period. 31 December December Cost Accumulated depreciation Carrying amount Cost Accumulated depreciation Carrying amount Property, plant and equipment 278, ,371 67, , ,356 71,080 Investment property 17,313-10,512 6,801 16,847-9,830 7,017 Total property, plant and equipment 296, ,883 74, , ,186 78,097 The following table shows amounts at the beginning and end of the period for the different categories of asset, and the related changes in the carrying amounts. CHANGES DURING THE YEAR 000 Carrying amount as at 31 December 2016 Additions: purchases and capitalisations Assets entering service Disposals (cost) Reclassifications Additions (accumulated depreciation) Disposals (accumulated depreciation) Carrying amount as at 31 December 2017 Land 1, ,140 Buildings 18, ,189-17,237 Industrial and business equipment 31,805 7,341 4,546-10, ,650 9,943 29,848 Other assets 14,431 8, , ,764 Property, plant and equipment under construction and advance payments 5, , ,390 Property, plant and equipment 71,080 16, , ,240 9,954 67,379 Land Buildings 6, ,397 Investment property 7, ,801 Total property, plant and equipment 78,097 16, , ,651 9,954 74,180 The reduction in the carrying amount of property, plant and equipment with respect to 31 December 2016, amounting to 3,917 thousand, primarily reflects depreciation for the year of 20,651 thousand, partially offset by capital expenditure during the year of 16,930 thousand). Investment property refers to portions of buildings and land not used in operations, and leased (primarily to Atlantia Group companies). The properties are valued at cost. The total fair value of these assets is estimated to be 23 million, based on independent appraisals and information on property markets relevant to these types of investment property, and is higher than the corresponding carrying amount. The properties generated rental income of 1,896 thousand in 2017, compared with direct maintenance and management costs of 2,770 thousand. Annual Report
244 There were no significant changes in the expected useful lives of these assets during Finally, as at 31 December 2017, property, plant and equipment is free of mortgages, liens or other collateral guarantees restricting use. 6.2 Intangible assets - 17,402,996 thousand ( 17,862,077thousand) The following table provides details of property, plant and equipment at the beginning and end of the period, showing the original cost and accumulated amortisation at the end of the period December December 2016 Cost Accumulated amortisation Carrying amount Cost Accumulated amortisation Carrying amount Intangible assets deriving from concession rights 16,710,399-5,439,206 11,271,193 16,643,614-4,909,662 11,733,952 Goodwill and other intangible assets with indefinite lives 6,111,201-6,111,201 6,111,201-6,111,201 Other intangible assets 235, ,045 20, , ,893 16,924 Intangible assets 23,057,247-5,654,251 17,402,996 22,971,632-5,109,555 17,862,077 The following table shows amounts at the beginning and end of the period for the different categories of intangible asset, and the related changes in the carrying amounts. 244
245 CHANGES DURING THE YEAR 000 Carrying amount as at 31 December 2016 Additions: purchases and capitalisations Additions free of charge Additions/ Reductions due to changes in present value of contractual obligations Additions due to completion of construction services Reductions due to government grants Amortisation Carrying amount as at 31 December 2017 Concession rights accruing from construction services for which no additional economic benefits are received 8,384, , ,085 7,976,245 Concession rights accruing from construction services for which additional economic benefits are received 3,244, , ,362 3,187,905 Concession rights accruing from construction services provided by suboperators 104,847-7, , ,043 Intangible assets deriving from concession rights 11,733,952-7,293-26,540 87,530-1, ,544 11,271,193 Goodwill 6,111, ,111,198 Trademarks Goodwill and other intangible assets with indefinite lives 6,111, ,111,201 Development costs 7,893 9, ,449 9,230 Industrial patents and intellectual property rights 5,711 8, ,501 7,741 Concessions and licenses Intangible assets under development and advance payments 2, ,758 Other intangible assets 16,924 18, ,152 20,602 Intangible assets 17,862,077 18,830 7,293-26,540 87,530-1, ,696 17,402,996 Annual Report
246 The reduction in intangible assets compared with 31 December 2016, amounting to 459,081 thousand, essentially reflects the combined effect of the following changes in concession rights: a) amortisation for the year ( 529,544 thousand); b) investment in construction services for which additional economic benefits are received ( 87,530 thousand). There were no significant changes in the expected useful lives of intangible assets during the period. The following analysis shows the various components of investment in assets held under concession effected through construction services, as also reported in the statement of cash flows. Further details of the Company s capital expenditure is provided in section 2.5, Group operating review, in the sub-section, Capital expenditure, in the Report on Operations accompanying these separate financial statements Increase/ (Decrease) Use of provisions for construction services required by contract for which no additional economic benefits are received 406, ,365-37,397 Revenue from government grants for construction services for which no additional economic benefits are received Increase in intangible concession rights accruing from completed construction services for which additional economic benefits are received 87, , ,702 Investment in assets held under concession 494, , ,431 Goodwill was recognised following the transfer of motorway assets from the former Autostrade Concessioni e Costruzioni Autostrade SpA (now Atlantia), as part of the Group s reorganisation in This amount has been determined under the previous accounting standards (in accordance with the exemption permitted by IFRS 1) and coincides with the carrying amount as at 1 January 2004, Atlantia s IFRS transition date. With regard to the recoverability of goodwill and the concession rights belonging to the Company (given the overall size of these items), the related impairment test was conducted. To this end, as in previous years, the Company s entire activities were allocated to a single CGU, as the cash flows generated by the sections of motorway operated under concession are closely related. As a result, the impairment test permits an overall assessment of the recoverability of all the intangible assets and net invested capital as a whole. The related value in use was, therefore, estimated on the basis of the long-term plan drawn up by the Company, prepared on the basis of the regulatory mechanisms included in the Single Concession Arrangement, containing traffic, investment, revenue and cost projections for the full term of the concession. The use of a long-term plan covering the entirety of the concession term is deemed more appropriate than the approach provisionally suggested by IAS 36 (namely, a limited explicit projection period and the estimated terminal value), given the intrinsic nature of the motorway concession arrangement, above all with regard to the regulations governing the sector and the predetermined duration of the arrangement. In particular the long-term plan used for the test has been prepared on the basis of the following assumptions: a) an average annual growth (CAGR) for traffic of 1.24 compared with 2017; b) an average annual toll increase, linked to inflation alone, of 1.30% (for the period ). This is 70% below the annual target inflation rates (2% between 2020 and 2023) 246
247 forming part of the medium-term scenario indicated in the Italian government s Stability programme included in the Revised Budget for 2017 ; c) an average annual toll increase to provide a return on investment to be carried out of 1.36%. this component of the toll increase is recognised on a proportionate basis if expected capital expenditure is only partially carried out. In this case, it would also be necessary to take into account the financial impact of the shortfall in investment. The projected after-tax cash flows in the long-term plan were discounted to present value using the after-tax rate of 5.68% (5.14% in 2016), representing the Company s medium/longterm WACC and determined on the basis of the requirements of IAS 36. Reference was primarily made to published external sources, integrated, where appropriate, by estimates based partly on historical data. The impairment tests confirmed that the carrying amounts of goodwill and the concession rights accounted for as at 31 December 2017 are fully recoverable. In addition, sensitivity analyses were conducted on the recoverable amounts, increasing the indicated discount rates by 1%, and reducing the average annual rate of traffic growth by 1%. The results of these analyses have, in any event, confirmed that the assets recognised in the financial statements are fully recoverable. Finally, as a matter of fact in 2017, research and development expenditure of approximately 557 thousand ( 438 thousand in 2016) was charged against income. The purpose of research and development is to improve infrastructure, the services offered and safety levels and to develop software in house, as well as environmental protection. 6.3 Investments - 225,017 thousand ( 220,605 thousand) The following tables show: a) amounts at the beginning and end of the period (showing the original cost and any accumulated revaluations and impairments) for the investments held by the Company, classified by category, and the related changes during the year; b) details of investments, showing, as well as other information, the percentage interest and relevant carrying amount as at 31 December 2017 (net of any unpaid, called-up issued capital). Annual Report
248 CHANGES DURING THE YEAR AUTOSTRADE PER L'ITALIA 31 December 2016 Cost Impairments 31 December Cost Accumulated (impairments) Carrying amount Increases related to share-based incentive plans (Additions)/ Reductions Cost Accumulated (impairments) Carrying amount Autostrada Tirrenica pa 90,605-90, ,605-90,605 Tangenziale di Napoli SpA 54,510-54, ,511-54,511 Autostrade Meridionali SpA 15,031-15, ,106-15,106 Autostrade Tech SpA 5,530-5, ,593-5,593 Ecomouv SAS 4,200-4, ,200-4,200 Infoblu SpA 3,875-3, ,875-3,875 Società Italiana per Azioni per il Traforo del Monte Bianco pa 2,318-2, ,318-2,318 AD Moving SpA 3,995-3, ,995-3, EssediEsse Società di Servizi SpA Giove Clear Srl Tech Solutions Integrators SAS 2,000-2, ,000-2,000 - Investments in subsidiaries (A) 182,585-5, , ,724-5, ,559 Pavimental SpA 9,661-7,100 2, ,213 9,696-2,887 6,809 Società Infrastrutture Toscane SpA (in liquidation) 3, , , ,062 Pedemontana Veneta SpA (in liquidation) 1,935-1, ,935-1,935 Spea Engineering SpA 1,759-1, ,784-1,784 Consorzio Autostrade Italiane Energia Bologna & Fiera Parking SpA Investments in associates (B) 17,603-8,257 9, ,213 17,663-4,044 13,619 Tangenziali Esterne di Milano SpA 34,514-2,522 31, ,514-2,522 31,992 Tangenziale Esterna SpA 1,163-1, ,163-1,163 Uirnet SpA Veneto Strade SpA Autostrade Holding do Sur SA (*) Investments in other companies (C) 36,361-2,522 33, ,361-2,522 33,839 Investments (A+B+C) 236,549-15, , , ,748-11, ,
249 Name Registered office Number of shares/units Par value Capital/ Consortium fund Interest (%) Number of shares/units held Profit/(Loss) for 2017 ( 000) (1) Equity as at 31 December 2017 ( 000) (1) Carrying amount as at 31 December 2017 ( 000) Società Autostrada Tirrenica pa Rome 163,072,000 euro 0.15 euro 24,460, % (2) 162,953, ,552 90,605 Tangenziale di Napoli SpA Naples 20,945,250 euro 5.16 euro 108,077, % 20,945,250 7, ,212 54,511 Autostrade Meridionali SpA Naples 4,375,000 euro 2.07 euro 9,056, % 2,580,500 19, ,139 15,106 Autostrade Tech SpA Rome 1,120,000 euro 1.00 euro 1,120, % 1,120,000 5,888 69,806 5,593 Ecomouv SAS Paris (France) 300,000 euro euro 6,000, % 210,000-6,379 4,200 Infoblu SpA Rome 1,000,000 euro 5.16 euro 5,160, % 750, ,923 3,875 Società Italiana per Azioni per il Traforo del Monte Bianco pa Prè Saint Didier 3,848,000 euro euro 198,749, % 1,962,480 12, ,499 2,318 AD Moving SpA Rome 1,000,000 euro 1.00 euro 1,000, % 1,000, EssediEsse Società di Servizi SpA Rome 500,000 euro 1.00 euro 500, % 500, , Giove Clear Srl Rome 10,000 euro 1.00 euro 10, % 10, , Tech Solutions Integrators SAS Paris (France) 2,000,000 euro 1.00 euro 2,000, % 2,000,000-5,381 (3) -16,110 (3) - Investments in subsidiaries (A) 177,559 Pavimental SpA Rome 77,818,865 euro 0.13 euro 10,116, % 15,563,773 15,794 31,477 6,809 Società Infrastrutture Toscane SpA (in liquidation) Rome 30,000,000 euro 0.50 euro 15,000, % 13,800, (4) 6,763 (4) 3,062 Pedemontana Veneta SpA (in liquidation) Verona 12,000 euro euro 6,000, % 3, (5) 5,723 (5) 1,935 Spea Engineering SpA Rome 1,350,000 euro 5.16 euro 6,966, % 270,000 6,870 88,349 1,784 Consorzio Autostrade Italiane Energia Rome - euro - euro 113, % - - (6) 114 (6) 29 Bologna & Fiera Parking SpA Bologna 2,715,200 euro 1.00 euro 2,715, % 999,440 1,587 (6) 614 (6) - Investments in associates (B) 13,619 Tangenziali Esterne di Milano SpA Milan 293,792,811 euro 0.75 euro 220,344, % 40,174, (7) 232,969 (7) 31,992 Tangenziale Esterna SpA Milan 464,945,000 euro 1.00 euro 464,945, % 1,162,363-16,809 (7) 345,553 (7) 1,163 Uirnet SpA Rome 1,061 euro 1, euro 1,061, % (6) 5,545 (6) 426 Veneto Strade SpA Venice 5,163,200 euro 1.00 euro 5,163, % 258, (6) 6,885 (6) 258 Autostrade Holding do Sur SA Santiago (Chile) 1,000,001 Chilean peso 51, Chilean peso 51,496,805, % 1 57,786 (6) 70,492 (6) - Investments in other companies (C) 33,839 Investments (A+B+C) 225,017 (1) The figures have been taken from the latest financial statements approved by the board of directors of each company. (2) On 29 December 2015, Autostrada Tirrenica, following authorisation by the general meeting of shareholders held on the same date, purchased 109,600 own shares from non-controlling shareholders. Autostrade per l'italia's interest is, therefore, equal to 99.99% as at 31 December 2017 (the percentage interest calculated on the basis of the ratio of shares held by Autostrade per l'italia and the subsidiary's total shares is 99.93% ). (3) Provisions of 11,185 thousand have been made in relation to this investment as at 31 December 2017, as described in note 6.13, "Provisions". (4) The figures have been taken from the interim liquidation financial statements as at 31 December 2016, approved on 27 April (5) The figures have been taken from the interim liquidation financial statements as at 31 December 2016, approved on 28 June (6) The figures have been taken from the latest financial statements approved by shareholders (31 December 2016). (7) The figures have been taken from the interim financial statements as at 30 June Annual Report
250 With regard to the recoverability of the carrying amounts of investments as at 31 December 2017, the investment in Pavimental was tested for impairment, after recognition of an impairment loss of 7,100 thousand in 2016, in view of clear evidence that the circumstances leading to the impairment no longer apply. In terms of the method used in carrying out the impairment test for these two companies, which essentially provide support services to the Atlantia Group s operators, it was also considered appropriate to estimate value in use on the basis of the same period covered by the long-term plans of the operators to which they provide their services (until 2044), without estimating the terminal value. The discount rate used in the impairment tests was 6.39%, determined in accordance with the criteria established in IAS 36. Both the estimate of cash flows and the estimates on which the discount rate was determined, were based primarily on published external sources, integrated, where appropriate, by estimates based partly on historical data. The impairment tests confirmed the need to recognise a partial reversal of the impairment loss on the investment in Pavimental, totalling 4,213 thousand. In the case of Autostrade Meridionali, the operator s motorway concession expired on 31 December The operator is continuing to operate the relevant motorway, whilst awaiting the conclusion of the tender process that will select the new operator, which will be required (i) to pay the outgoing operator compensation equal to the unamortised carrying amount of the capital expenditure carried out in the final years of the concession arrangement, and (ii) to assume the obligations relating to sale and purchase agreements entered into by the previous operator, excluding those of a financial nature, and to outstanding legal actions and disputes. In this regard, the value of this company s net assets is recoverable due to the above obligations to be honoured by the incoming operator. This guarantees that the carrying amount of Autostrade per l Italia s investment is fully recoverable, as it is lower than the related share of equity. There was no evidence of potential impairment losses on other investments. In addition to the above, the carrying amount of the investment in Autostrada Tirrenica is significantly higher that the respective share of equity. However, this does not represent an indication of a potential impairment of the investment, as the carrying amount is deemed to be fully recoverable, based on the estimated present value of the company s future net operating cash flows. With regard to the carrying amount of zero attributed to the investment in Tech Solutions Integrators as at 31 December 2017, note 6.13, Provisions, provides details of the accounting effects resulting from the company s liquidation via the universal transfer to the Company of all the assets and liabilities. 6.4 Financial assets (non-current) - 637,782 thousand ( 642,655 thousand) (current) - 142,806 thousand ( 115,508 thousand) The following analysis shows the composition of financial assets at the beginning and end of the period, together with the current and non-current portions. 250
251 000 Note 31 December December 2016 Carrying amount Current portion Non-current portion Carrying amount Current portion Non-current portion Financial assets deriving from concession rights (1) 236,225 52, , ,122 50, ,646 Term deposits (2) 234,062 50, , ,062 48, ,646 Derivative assets (3) ,492 2,492 - Medium/long-term loans 268,988 7, , ,334 7, ,035 Accrued income on medium/long-term financial assets 23,387 23,387-4,753 4,753 - Staff loans 7,868 1,373 6,495 8,606 1,419 7,187 Prepaid financial expenses Other loans and receivables 1,190-1,190 1,141-1,141 Other medium/long-term financial assets (1) 302,357 32, , ,933 13, ,363 Short-term loans Other financial assets 7,762 7, Other current financial assets (1) 7,944 7, Financial assets 780, , , , , ,655 (1) These assets include financial instruments primarily classified as "loans and receivables" under IAS 39. The carrying amount is equal to fair value. (2) These assets have been classified as "available-for-sale" financial instruments and in level 2 of the fair value hierarchy. The carrying amount is equal to fair value. (3) These assets consist of derivative financial instruments classified as non-hedging in level 2 of the fair value hierarchy. The balance, including the current and non-current portions, is up 22,425 thousand compared with 31 December 2016, essentially due to: a) an increase in accrued income on differentials connected with Cross Currency Swaps ( 18,876 thousand) hedging the sterling and yen denominated bonds; b) recognition, in other current financial assets, of the receivable ( 7,761 thousand) resulting from the distribution of retained earnings, on 24 October 2017, by the general meeting of the shareholders of the subsidiary, Società Italiana per Azioni per il Traforo del Monte Bianco. With regard to the most significant items: a) financial assets deriving from government grants include amounts payable by the Grantor, third parties or other government entities as grants payable for construction services carried out. As regards grants due from the Grantor, these grants are recognised at the time that the Grantor certifies the effective performance of the works on the A1 Milan-Naples, and relating to a number of lots included in the Variante di Valico and the upgrade of Florence interchange; b) term bank deposits relate to loans disbursed by banks as a condition precedent for the grants required by laws 662/1996, 345/1997 and 135/1997, relating to the above works on the A1 motorway mentioned in point a). The balances on the accounts may not be withdrawn until such time as the Grantor specifically certifies the substantial completion of the works and the stage of completion; c) medium/long-term loans primarily include the loans granted to the subsidiaries, Autostrada Tirrenica ( 230,000 thousand, at a fixed rate of 5.75% and maturing on 30 September 2020) and Tangenziale di Napoli ( 28,941 thousand, at a fixed rate of 5.20% and maturing on 21 March 2021). There was no evidence of impairment for any of the financial assets reported in the financial statements. 6.5 Other non-current assets thousand ( 269 thousand) This item, which is not of a material amount, includes amounts due from the Municipality of Rome following work on the enlargement of one of the car parks outside the Via Bergamini offices. Annual Report
252 6.6 Trading assets - 465,338 thousand ( 536,990 thousand) As at 31 December 2017, trading assets consist of: a) inventories of 46,399 thousand ( 43,668 thousand as at 31 December 2016), primarily relating to stocks and spare parts used in motorway maintenance or the assembly of machinery; b) contract work in progress of 4,204 thousand and unchanged with respect to 31 December 2016, connected to work carried out for the Grantor, in this case a customer; c) trade receivables of 414,735 thousand ( 489,118 as at 31 December 2016), which consist of the following December December 2016 Trade receivables due from: Customers 216, ,129 Sub-operators at motorway service areas 84, ,938 Sundry customers 109, ,653 Gross trade receivables 411, ,720 Allowance for bad debts -31,990-28,570 Other trading assets 35,584 40,968 Net trade receivables 414, ,118 The reduction in trade receivables of 74,383 thousand, compared with 31 December 2016, essentially reflects: 1) a reduction in the amounts due from sub-operators at service areas, totalling 37,018 thousand, essentially reflecting collection in February 2017 of receivables recognised as at 31 December 2016 (relating to contracts executed prior to 2014, under which billing takes place annually), partially offset by an increase in the value of bills issued on a quarterly basis under the new contracts; 2) a decrease in receivables due from motorway customers, totalling 32,315 thousand, primarily due to a reduction in tolls to be billed at the end of the year. The following table shows an ageing schedule for trade receivables. 000 Total receivables Total not yet due Less than 90 days overdue Between 90 and 365 days overdue More than one year overdue Trade receivables 411, ,887 11,581 11,939 56,734 Overdue receivables regard uncollected and unpaid tolls, in addition to royalties due from service area operators and sales of other goods and services, such as agreements relating to authorisations to cross motorways and sales of proprietary services and goods. The following table shows movements in the allowance for bad debts for trade receivables during the year, determined with reference to the management and measurement of receivables and historical data regarding losses on receivables, also taking into account guarantee deposits and other collateral given by customers. 252
253 December 2016 Additions Uses 31 December 2017 Allowance for bad debts -28,570-3, ,990 The increase in the allowance for bad debts compared with 31 December 2016, amounting to 3,420 thousand, primarily relates to unpaid tolls. The carrying amount of trade receivables approximates to the related fair value. 6.7 Cash and cash equivalents - 2,626,664 thousand ( 2,924,421 thousand) This item includes: a) cash, totalling 1,772,546 thousand ( 2,238,192 thousand as at 31 December 2016), essentially relating to demand bank deposits; b) cash equivalents, totalling 80,075 thousand ( 200,080 thousand as at 31 December 2016), which primarily regard bank deposits convertible within the short term; c) balance receivable on current accounts with related parties, totalling 774,043 thousand ( 486,149 thousand as at 31 December 2016), reflecting the centralised treasury management service provided by the Company. Details of the cash flows resulting in the increase in cash and cash equivalents during 2017 are provided in note 8.1 Notes to the statement of cash flows, taking into account the fact that the net cash and cash equivalents described therein include current account payables due to related parties, as described in note 6.14, Financial liabilities. 6.8 Current tax assets and liabilities Current tax assets - 24,363 thousand ( 55,416 thousand) Current tax liabilities thousand ( 3,356 thousand) Current tax assets and liabilities at the beginning and end of the period are detailed below December December December December 2016 Current tax assets Current tax liabilities IRES on taxable income - 30,191 87,143 - Claims for IRES refunds 24,299 25, Other IRES credits IRES 24,363 55,416 87,143 - IRAP - - 1,151 3,356 Total 24,363 55,416 88,294 3,356 The Company participates in the tax consolidation national arrangement headed by Atlantia, with the balance for current IRES accounted for in amounts due to and from the consolidating entity. The balance of net current tax liabilities as at 31 December 2017 essentially consists of the amount payable to Atlantia in the form of IRES, amounting to 87,143 thousand. This is almost entirely due to tax for the year ( 229,041 thousand, including current tax expense of 11,558 thousand recognised as a reduction in equity following distribution of the special dividend in kind, described in note 5.1, Restructuring of the Atlantia Group ) after payments on account or offsets against IRES during the year ( 141,312 thousand). Annual Report
254 The balance of current tax assets as at 31 December 2017 essentially consists of refundable IRES of 24,299 thousand, following the non-deductibility of IRAP on staff costs in the five-year period , in accordance with the provisions of Law 44 of 26 April 2012 and the tax authorities ruling of 17 December The balance regards: a) 18,597 thousand in amounts due from Atlantia for the years ; b) 5,702 thousand due from Sintonia, which led the tax consolidation arrangement during The reduction in the current tax assets compared with 31 December 2016, amounting to 31,053 thousand, essentially reflects collection of refundable IRES deriving from the balance of income tax for the previous year ( 30,191 thousand). 6.9 Other current assets - 65,770 thousand ( 62,609 thousand) This item consists of receivables and other current assets that are not eligible for classification as trading or financial. The composition of this item is shown below December December 2016 Receivables due from end users and insurance companies for damages 18,182 19,429 Receivable from public entities 13,123 9,107 Receivables from social security institutions Payments on account and other sundry receivables 38,592 38,710 Other current assets (gross) 70,387 67,672 Allowance for bad debts 4,617 5,063 Other current assets (net) 65,770 62,609 The balance is up 3,161 thousand on 31 December 2016, substantially reflecting an increase in amounts due from public entities, primarily relating to the subsidy due from the Grantor under the memorandum of understanding signed on 24 February 2014, which introduced discounts for commuters using Telepass in 2017 (amounting to 3,892 thousand). Based on the interministerial decrees issued by the Ministry of Infrastructure and Transport and the Ministry of the Economy and Finance on 27 December 2017, from 1 January 2018 the Company benefits from a specific toll component designed to recover the amount accruing between 1 June 2014 and 31 December 2017, totalling 12,732 thousand at the date of these financial statements. The allowance for bad debts for other current assets entirely refers to estimated losses on amounts due from road users and insurance companies to cover damage to the motorway infrastructure managed by the Company Investments held for sale or for distribution to shareholders or related to discontinued operations - 4,271 thousand ( 1,157,594 thousand) Liabilities related to discontinued operations - - (-) This item is down 1,153,323 thousand compared with 31 December 2016, following: a) the return of capital reserves by Autostrade per l Atlantico in January 2017, totalling 398,253 thousand; b) distribution of the special in kind via the transfer, to Atlantia, of the investments in Autostrade dell'atlantico and Autostrade Indian Infrastructure Development, amounting to 754,584 thousand and 486 thousand, respectively, as already described above in note 5.1, Restructuring of the Atlantia Group. 254
255 The balance as at 31 December 2017 thus refers solely to the remaining 2% interest in Strada dei Parchi that is the subject of put and call options agreed with Toto Costruzioni Generali. Exercise of the option is subject to the completion of certain works required by Strada dei Parchi s Single Concession Arrangement Equity - 1,986,808 thousand ( 3,605,115 thousand) Issued capital is fully subscribed and paid-in and consists of 622,027,000 ordinary shares of a par value of 1 each, amounting to a total of 622,027 thousand. This figure did not undergo any changes in The reduction in this item compared with 31 December 2016, amounting to 1,618,307 thousand, is shown in detail in the statement of changes in equity. This essentially reflects a combination of the following: a) the impact of the restructuring of the Group, as described in note 5.1, Restructuring of the Atlantia Group, involving: 1) distribution of a special dividend in kind, totalling 755,070 thousand, via use of the Extraordinary reserve and recognition of the related current tax expense of 11,558 thousand; 2) distribution of a portion of the Reserve for transactions under common control, amounting to 1,101,312 thousand; b) payment of the final dividend for 2016, totalling 314,124 thousand ( per share); c) payment of the interim dividend for 2017, totalling 450,348 thousand ( per share); d) comprehensive income for the year of 1,012,019 thousand, almost entirely consisting of profit for the year ( 968,016 thousand). Other comprehensive income reflects: a) an increase of 38,666 thousand in the fair value of Interest Rate Swaps and Forward- Starting Interest Rate Swaps, linked to the increase in interest rates as at 31 December 2017, compared with 31 December 2016; b) the reclassification to financial expenses in the income statement of the cash flow hedge reserve ( 20,502 thousand) accounted for in relation to the derivatives wound up as part of the liability management transaction described in note 6.14, Financial liabilities. Autostrade per l Italia aims to manage its capital directly in order to create value for shareholders, ensure the Company remains a going concern, safeguard the interests of stakeholders and guarantee efficient access to external sources of funding to adequately support the growth of the Company s businesses and fulfil the commitments given in concession arrangements. The table below shows an analysis of issued capital and equity reserves, showing their permitted uses and distributable amounts. Annual Report
256 Description Balance as at 31 December 2017 ( 000) Permitted uses (A, B, C, D)* Available portion ( 000) Uses between 1 January 2014 and 31 December 2016 (art. 2427, 7 bis of Italian Civil Code) To cover losses For other reasons Issued capital 622,027 B Share premium reserve 216,070 A, B, C 216, Legal reserve 124,406 B Cash flow hedge reserve -110, Extraordinary reserve 441,269 A, B, C 441, Reserve for actuarial gains and losses on post-employment benefits -15, , Undistributable portion of IFRS transition reserve 272,016 B Distributable portion of IFRS transition reserve 296,622 A, B, C 296, Reserve for first-time adoption of IFRIC , , Reserve for share-based incentive plans 1,418 A, B, C 1, Reserve for transactions under common control (1) 34,369 A, B, C 34, Retained earnings 549,162 A, B, C 549, Other reserves and retained earnings 616, , Reserves and retained earnings (2) 847, ,888 Total 1,469, , of which: Non-distributable (3) 9,230 Distributable 551,658 * Key: A: capital increases B: to cover losses C: shareholder distributions D: subject to other restrictions imposed by articles of association/shareholder resolutions Notes: (1) This reserve was established following the transfer of investments in subsidiaries to Atlantia Group companies. These transactions, excluded from the scope of application of IFRS 3 as they are business combinations under common control, have been recognised applying the accounting policy election described in note 3, "Accounting standards and policies applied", in the financial statements as at and for the year ended 31 December (2) As a result of article 109, paragraph 4, letter b of the Consolidated Income Tax Act (abrogated by Law 244 of 24 December 2007 and replaced, without retroactive effect, by article 103, paragraph 3- bis ), the sum of 584,790 thousand is taxable if distributed to shareholders, unless there are sufficient reserves. The new legislation has abolished all restrictions on the distribution of equity reserves imposed by tax legislation arising in connection with the amortisation of trademarks and goodwill. As a result, there should be no increase in the amount of dividends subject to additional taxation. (3) This represents the undistributable portion to cover unamortised development costs, in accordance with art. 2426, paragraph 5 of the Italian Civil Code Provisions for construction services required by contract (non-current) - 2,839,552 thousand ( 3,165,177 thousand) (current) - 421,949 thousand ( 521,454 thousand) The following table shows provisions for construction services required by contract at the beginning and end of the year and changes during 2017, showing the non-current and current portions. 000 Carrying amount 31 December 2016 CHANGES DURING THE YEAR 31 December 2017 Changes due to non-current portion current portion revised present value of obligations Financial provisions Uses to finance works Carrying amount non-current portion current portion Upgrade of Florence - Bologna section 1,299, , , ,850 1,078, , ,375 Third and fourth lanes 12,444 11, , ,192 5,464 5,464 - Other construction services 2,374,330 2,167, ,796-17,992 9, ,310 2,178,033 2,016, ,574 Provisions for construction services required by contract 3,686,631 3,165, ,454-26,540 8, ,968 3,261,501 2,839, ,949 The reduction of 425,130 thousand compared with 31 December 2016 essentially reflects the use of provisions for construction services for which no additional economic benefits are received performed during the period ( 406,968 thousand). Further details of the Company s capital expenditure is provided in section 2.5, Group operating review, in the sub-section, Capital expenditure, in the Report on Operations accompanying these separate financial statements. 256
257 6.13 Provisions (non-current) - 1,063,501 thousand ( 1,084,436 thousand) (current) - 196,039 thousand ( 188,413 thousand) The following table shows details of provisions by type, showing the non-current and current portions. 31 December December 2016 non-current current non-current 000 Carrying amount Carrying amount portion portion portion current portion Provisions for employee benefits 101,086 83,181 17, ,349 90,486 17,863 Provisions for repair and replacement of motorway infrastructure 1,120, , ,406 1,123, , ,268 Concession Arrangement 4,306-4,306 3,178-3,178 Provisions for tax risk 6,491-6,491 1,831-1,831 Provisions for universal transfer from Tech Solution Integrators 11,185-11,185 10,330-10,330 Sundry provisions 15,746-15,746 25,943-25,943 Other provisions 33,422-33,422 38,104-38,104 Provisions 1,259,540 1,063, ,039 1,272,849 1,084, ,413 The following table shows provisions at the beginning and end of the period and changes in Annual Report
258 December 2016 CHANGES DURING THE YEAR Carrying amount Operating provisions Financial provisions Actuarial gains/(losses) recognised in comprehensive income Reductions due to payment of benefits and advances Reductions due to reversal of overprovisions Transfers (to)/from other companies Uses Direct Indirect 31 December Carrying amount Provisions for employee benefits 108, , , ,086 Provisions for repair and replacement of motorway infrastructure 1,123, ,858 14, ,064 1,120,726 Provisions for the risk of fines and penalties under the Single Concession Arrangement 3,178 1, ,306 Provisions for tax risk 1,831 4, ,491 Provisions for universal transfer from Tech Solution Integrators 10, ,185 Sundry provisions 25,943 2, , ,690-15,746 Other provisions 38,104 8, , ,733-33,422 Provisions 1,272, ,714 15, ,943-3,490-1,316-9, ,064 1,259,
259 PROVISIONS FOR EMPLOYEE BENEFITS (non-current) 83,181 thousand ( 90,486 thousand) (current) 17,905 thousand ( 17,863 thousand) As at 31 December 2017, and likewise as at 31 December 2016, this item consists almost entirely of provisions for post-employment benefits to be paid to staff employed under the Italian law. The reduction of 7,263 thousand essentially reflects uses of provisions for benefits and advances paid ( 7,943 thousand). The most important actuarial assumptions used to measure post-employment benefits at 31 December 2017 are summarised below. Financial assumptions Annual discount rate (1) 0.88% Annual inflation rate 1.5% Annual rate of increase in post-employment benefits 2.625% Annual rate of increase in real salaries 0.65% Annual turnover rate 0.75% Annual rate for advances paid 0.75% Duration (years) 7.2 (1) The annual discount rate is used to determined the present value of the obligation and was, in turn, determined with reference to the average yield curve taken from the Iboxx Eurozone Corporate AA on the valuation date for durations of 7-10 years. Demographic assumptions Mortality Disability Retirement age Government General Accounting Office INPS tables by age and sex Mandatory state pension retirement age The following table shows a sensitivity analysis of provisions for post-employment benefits for each actuarial assumption at the end of 2017, indicating the effects on the defined benefit obligation of reasonably possible changes in the actuarial assumptions used at that date. 000 Balance of postemployment benefits Sensitivity analysis as at 31 December 2017 Change in actuarial assumption turnover rate inflation rate discount rate +1% -1% +0.25% -0.25% +0.25% -0.25% 100, , , ,195 99, ,928 Annual Report
260 PROVISIONS FOR REPAIR AND REPLACEMENT OF MOTORWAY INFRASTRUCTURE (non-current) - 980,320 thousand ( 993,950 thousand) (current) - 140,406 thousand ( 129,268 thousand) These provisions are in line with the figure for 31 December 2016, primarily due to the fact that the following movements offset each other: a) the operating change ( 17,206 thousand) in connection with repairs and replacements carried out during the period, after new operating provisions; b) financial provisions ( 14,714 thousand). PROVISION FOR FINES AND PENALTIES UNDER THE SINGLE CONCESSION ARRANGEMENT (current) 4,306 thousand ( 3,178 thousand) The value of these provisions as at 31 December 2017 consists of: a) the total amount of 2,562 thousand ( 1,489 thousand as at 31 December 2016) for penalties imposed (or that could be imposed based on the alleged breaches) by the Grantor pursuant to Annex N of the Single Concession Arrangement. These penalties for breach of contract, which are cumulative for the years from 2009 to 2015, relate to failure to meet the requirements of the Annual Audit Plan required under the Arrangement; b) the total amount of 1,744 thousand ( 1,689 thousand as at 31 December 2016) for penalties or fines imposed in relation to snow events e or disruption to traffic. The increase of 1,128 thousand compared with 31 December 2016 primarily reflects provisions ( 980 thousand) made for penalties imposed for non-compliance identified by the Annual Audit for 2015 and announced by the Grantor on 6 May The Company is contesting a number of the above penalties before Lazio Regional Administrative Court and the related judgements are pending. Further information on significant legal and regulatory aspects is provided in note 9.5, Significant legal and regulatory aspects. OTHER PROVISIONS (current) 33,422 thousand ( 38,104 thousand) These provisions relate to potential contingencies and liabilities at the end of the period. The balance is down 4,682 thousand on the figure for 31 December 2016, primarily due to a combination of the following: a) direct uses, amounting to 9,733 thousand, essentially following the settlement of contractual disputes; b) a reduction due to the release of provisions considered excess to requirements, amounting to 3,490 thousand, following the settlement of a number of claims for damages; c) operating provisions of 8,541 thousand, primarily relating to a number of tax demands received regarding local taxes. Provisions for the universal transfer from Tech Solution Integrators, amounting to 11,185 thousand as at 31 December 2017, are linked to the planned liquidation of the subsidiary, approved by the Company s Board of Directors in December 2015, via the universal transfer to the Company of all the assets and liabilities (as provided for in French law governing the voluntary liquidation of companies with a sole shareholder). 260
261 Further details of developments in disputes pending as at 31 December 2017 are provided in note 9.5, Significant legal and regulatory aspects Financial liabilities (non-current) - 10,963,892 thousand ( 11,994,360 thousand) (current) - 1,971,680 thousand ( 1,156,167 thousand) MEDIUM/LONG-TERM FINANCIAL LIABILITIES (non-current) 10,963,892 thousand ( 11,994,360 thousand) (current) 1,381,302 thousand ( 911,847 thousand) The following two tables provide an analysis of medium/long-term financial liabilities, showing the following aspects: a) an analysis of the balance by the corresponding face value and maturity (current and non-current portions): Annual Report
262 000 Face value 31 December December 2016 Carrying amount Current portion of which Maturity of which Non-current portion between 13 and 60 months after 60 months Face value Carrying amount Current portion Non-current portion Bond (GBP) (1) 750, , , , , , ,194 Bond ,000, , , ,139 1,000, , ,570 Bond (JPY) (1) 149, , , , , , ,045 Bond , , ,947 - Bond , , , , , , ,142 Bond , , , , , , ,093 Bond , , , , , , ,106 Bond ,000 35,000-35,000-35,000 35,000 35,000-35,000 Bond (Zero Coupon Bond) 65,222 65,222-65,222-65,222 61,943 61,943-61,943 Bond , , , , , , ,105 Bond ,000 72,686-72,686-72,686 75,000 72,592-72,592 Bond , , , , , , ,754 Bond ,000 72,649-72,649-72,649 75,000 72,587-72,587 Bond , , , , , , ,306 Bond , , , , , , ,078 Bond , , , , , , ,617 Bond , , , , , , ,543 Bond , , , , , , ,455 Bond , , , , Bond issues (2) 8,244,396 8,092,619-8,092,619 2,824,924 5,267,695 8,569,297 8,510, ,947 8,005,130 Loans from Atlantia 1,000, , , ,000, , ,320 Loans from parents (A) 1,000, , , ,000, , ,320 European Investment Bank (EIB) 1,583,886 1,583,886 99,200 1,484, ,635 1,049,051 1,673,123 1,673,123 89,237 1,583, Cassa Depositi e Prestiti and SACE (3) 806, ,343 22, ,482 91, , , ,091 22, , Borrowings linked to grants (4) ,320 49,320 49,320 - Bank borrowings (B) 2,390,863 2,380, ,061 2,258, ,281 1,730,887 2,552,676 2,541, ,398 2,380,136 ANAS (5) 234, ,062 50, , , , ,742 48, ,327 Other borrowings (C) 234, ,062 50, , , , ,742 48, ,327 Medium/long-term borrowings (A+B+C) (1) 3,624,925 3,610,547 1,168,418 2,442, ,242 1,730,887 3,737,418 3,718, ,813 3,508,783 Derivative liabilities (6) 429, , , , , ,447 Accrued expenses on medium/long-term financial liabilities (2) 212, , , ,087 - Other medium/long-term financial liabilities 212, , , ,087 - Medium/long-term financial liabilities 12,345,194 1,381,302 10,963,892 3,801,560 7,162,332 12,906, ,847 11,994,360 (1) As at 31 December 2017, these borrowings are hedged against interest rate and currency risk with notional amounts and maturities matching those of the underlyings. These are included in "Derivative liabilities" and classified as nonhedge accounting following the issuer substitution of December (2) These financial instruments are classified in the category for financial liabilities measured at amortised cost, in accordance with IAS 39. Theface value of the bonds denominated in sterling and yen are shown at the exchange rate of the Cross Currency Swaps hedging the bonds. (3) As at 31 December 2017, certain of these borrowings are hedged against interest rate and currency risk with notional amounts and maturities matching those of the underlyings. These are classified as cash flow hedges in accordance with IAS 39 and included in "Derivative liabilities". (4) This item refers to borrowings linked to the grants provided for in laws 662/1996, 135/1997 and 345/1997 and designed to finance work on infrastructure for the "Florence North - Florence South" and "Cà Nova - Aglio" sections of motorway (Variante di Valico ). In 2017, ANAS completed repayment of these borrowings, as described in the following note. (5) This item includes amounts payable to ANAS deriving from payment, made directly by ANAS, in relation to the funding programme to finance investment, of repayments due on the borrowings indicated in note (4). These borrowings will be reduced when the Grantor specifically approves the release of grants, to be recognised as financial assets, in relation to the stage of completion of the related works. (6) This item includes the derivatives referred to above in notes 1 and 3 and Forward-Starting Interest Rate Swaps executed in June 2015 and February
263 b) type of interest rate, maturity and fair value: December December 2016 Maturity Carrying amount (1) Fair value (2) Carrying amount (1) Fair value (2) Bond (issued GBP) (3) , , , ,834 Bond (issued 2004) ,139 1,317, ,570 1,358,370 Bond (issued JPY) (3) , , , ,009 Bond (issued 2010) , ,524 Bond (issued 2010) , , , ,455 Bond (issued 2012) , , , ,990 Bond (issued 2012) , , , ,265 Bond (issued 2012) ,000 46,235 35,000 47,776 Bond (issued Zero Coupon Bond) ,222 98,302 61,943 94,191 Bond (issued 2013) , , , ,038 Bond (issued 2013) ,686 86,101 72,592 90,025 Bond (issued 2014) , , , ,253 Bond (issued 2014) ,649 86,640 72,587 89,990 Bond (issued 2015) , , , ,368 Bond (issued 2015) , , , ,883 Bond (issued 2015) , , , ,435 Bond (issued 2015) , , , ,420 Bond (issued 2016) , , , ,286 Bond (issued 2017) , , listed fixed rate 8,092,619 8,885,248 8,510,077 9,539,112 Bond issues 8,092,619 8,885,248 8,510,077 9,539,112 Loan from Atlantia (issued 2012) ,256 1,035, ,320 1,071,347 fixed rate 996,256 1,035, ,320 1,071,347 Loans from parents (A) 996,256 1,035, ,320 1,071,347 European Investment Bank (EIB) from 2018 to ,583,886 1,830,067 1,673,123 1,976,107 fixed rate 1,583,886 1,830,067 1,673,123 1,976,107 Cassa Depositi e Prestiti from 2018 to , , , ,758 Cassa Depositi e Prestiti and SACE , ,234 floating rate 796, , , ,992 Borrowings linked to grants ,320 49,320 non-interest bearing ,320 49,320 Bank borrowings (B) 2,380,229 2,655,097 2,541,534 2,891,419 ANAS 234, , , ,742 Other borrowings (C) 234, , , ,742 Medium/long-term borrowings (A+B+C) Derivative liabilities Accrued expenses on medium/long-term financial liabilities Other medium/long-term financial liabilities Medium/long-term financial liabilities 3,610,547 3,925,119 3,718,596 4,147, , , , , , , , , , , , ,087 12,345,194 13,452,395 12,906,207 14,364,154 (1) The value of medium/long-term financial liabilities shown in the table includes both the non-current and current portions. (2) The fair value shown is classified in level 2 of the fair value hierarchy. Details of the criteria used to determine the fair values shown in the table are provided in note 3, Accounting standards and policies applied ; c) a comparison of the face value of bond issues and medium/long-term borrowings and the related carrying amount, by issue currency, showing the corresponding average and effective interest rate: Annual Report
264 Currency Face value ( 000) Carrying amount ( 000) Average interest rate applied to 31 December 2017 (1) Effective interest rate as at 31 December 2017 Face value ( 000) Carrying amount ( 000) Euro (EUR) 10,970,145 10,843, % 3.63% 11,407,539 11,311,434 Sterling (GBP) 750, , % 2.20% 750, ,194 Yen (JPY) 149, , % 3.39% 149, ,045 Total 11,869,321 11,703, % 12,306,715 12,228,673 (1) This amount includes the effect of interest rate and currency hedges as at 31 December December December 2016 d) movements during the period in the carrying amounts of outstanding bond issues and medium/long-term borrowings expressed in the financial statements: 000 Carrying amount as at 31 December 2016 (1) New borrowings Repayments Exchange rate differences and other changes Change in exposure to ANAS Carrying amount as at 31 December 2017 (1) Bond issues 8,510, , ,566-42,526-8,092,619 Loans from parents 992, , ,256 Bank borrowings 2,541, , ,380,229 Other borrowings (2) 184, , ,062 Medium/long-term borrowings 3,718, ,811 4,442 49,320 3,610,547 Total 12,228, , ,377-38,084 49,320 11,703,166 (1) The value of medium/long-term financial liabilities shown in the table includes both the non-current and current portions. (2) The increase of 49,320 thousand in amounts repayable to ANAS reflects payment, made directly by ANAS, in relation to the funding programme to finance investment, as noted in note 4 in the table in point a), of repayments due on the Company's bank borrowings. More detailed information on financial risks and the manner in which they are managed, in addition to details of outstanding financial instruments held by the Group, is contained in note 8.2, Financial risk management. BOND ISSUES (non-current) - 8,092,619 thousand ( 8,005,130 thousand) (current) - thousand ( 504,947 thousand) This item consists of: a) bonds issues in 2015, 2016 and 2017, totalling 2,963,736 thousand ( 2,477,921 thousand as at 31 December 2016), issued to institutional investors as part of the Company s Euro Medium Term Note Programme launched in October 2014 and authorised for an amount of up to 7 billion; b) bonds issued to retail investors in 2015, totalling 737,273 thousand, and maturing in 2023 ( 735,078 thousand as at 31 December 2016); c) bonds recognised following the issuer substitution carried out in December 2016, totalling 4,391,610 thousand ( 5,297,078 thousand as at 31 December 2016). The balance is down 417,458 thousand compared with 31 December 2016, due to the following changes: a) repayment of the bond issue in September 2017, totalling 505,566 thousand; b) the reduction in bond issues denominated in pounds sterling and Japanese yen, transferred as a result of the issuer substitution completed in December 2016, essentially due to release of the fair value recognised at that time ( 24,383 thousand) and a strengthening of the euro against the above currencies ( 34,377 thousand); c) the net effect of a liability management transaction completed by Autostrade per l Italia on 26 September 2017, by which the Company: 1) issued bonds maturing in September 2029 to institutional investors, amounting to a par value of 700,000 thousand (coupon interest of 1.875%); 264
265 2) bought back a portion of the bonds maturing in 2019, 2020, February 2021 and November 2021 (all guaranteed by Atlantia, with the exception of the bonds maturing in November 2021), amounting to a total par value of 522,614 thousand. In terms of the notional value of the new bond matching the value of the repurchased bonds, the transaction represents, from an accounting point of view, in accordance with IAS 39, a nonsubstantial modification of existing financial liabilities (and not the extinguishment of existing liabilities or the recognition of new ones). This has resulted in remeasurement of the amortised cost of these financial liabilities on a prospective basis, taking into account the premium paid in order to buy back the bonds (amounting to 40,969 thousand). As part of the same transaction, Autostrade per l Italia unwound a number of Forward-Starting Interest Rate Swaps. Details are provided in note 8.2, Financial risk management. MEDIUM/LONG-TERM BORROWINGS (non-current) 2,442,129 thousand ( 3,508,783 thousand) (current) 1,168,418 thousand ( 209,813 thousand) The balance of this item, including both current and non-current portions as at 31 December 2017, primarily consists of bank borrowings and the remaining intercompany loan from Atlantia, corresponding with the retail bond issue of 2012, maturing in This issue was not included in the issuer substitution that took place at the end of December The balance for 2017 is down 108,049 thousand compared with 31 December 2016, essentially due to the repayment of bank borrowings, totalling 161,811 thousand. It is stated that the committed lines of credit obtained from Cassa Depositi e Prestiti were renegotiated on 13 December The facilities (maturing in 2021 and 2014 and having a total notional value of 1,700,000 thousand, compared with debt with a face value of 400,000 thousand) consist of a Term Loan and a Revolving Line of Credit (maturing in 2027 and 2022, respectively, and having notional values of 1,100,000 thousand and 600,000 thousand). The transaction, as regards the loans disbursed on the basis of the renegotiated committed lines of credit, represents, from an accounting point of view, in accordance with IAS 39, a nonsubstantial modification of existing financial liabilities (and not the extinguishment of existing liabilities or the recognition of new ones). This has resulted in remeasurement of the amortised cost of these financial liabilities on a prospective basis, taking into account the charges and fees effectively paid. A number of the medium/long-term loan agreements include negative pledge provisions, in line with international practice. Under these provisions, it is not possible to create or maintain (unless required to do so by law) collateral guarantees on all or a part of any proprietary assets, with the exception of the debt deriving from project finance. The above agreements also require compliance with certain financial covenants. The method of selecting the variables to compute the ratios is specified in detail in the relevant loan agreements. Breach of these covenants, at the relevant measurement dates, could constitute a default event and result in the lenders calling in the loans, requiring the early repayment of principal, interest and of further sums provided for in the agreements. The most important covenants are those relating to the loan agreements with Cassa Depositi e Prestiti that require compliance with a minimum threshold for Operating cash flow available for Debt Service/Debt Service (DSCR). The Company is in compliance with these covenants. Annual Report
266 DERIVATIVE LIABILITIES (non-current) - 429,144 thousand ( 480,447thousand) (current) - - (-) As at 31 December 2017, this item regards hedging and non-hedging derivatives, entered into with a number of banks to hedge the exposure to interest rate and currency risks of certain medium/long-term financial liabilities, including highly likely future financial liabilities to be assumed through to The overall reduction in this item compared with 31 December 2016, amounting to 51,303 thousand, is linked to a combination of the following: a) the reduction due to fair value losses ( 27,461 thousand) recognised on the unwinding of Forward-Starting Interest Rate Swaps linked to the bonds issued by the Company in September 2017, as part of the above settlement of the liability management transaction more fully described in note 8.2, Financial risk management ; b) a reduction of 32,540 thousand in fair value losses on outstanding Interest Rate Swaps and Forward-Starting Interest Rate Swaps (other than those referred to above), essentially reflecting an increase in interest rates as at 31 December 2017, compared with 31 December 2016; c) a 17,295 thousand increase in fair value losses on Cross Currency Swaps linked to the bonds denominated in pounds sterling and Japanese yen, resulting from a weakening of these currencies ( 34,377 thousand), after the change in fair value ( 17,082 thousand) recognised in financial income following the issuer substitution. The following have been recognised as at 31 December 2017 in relation to the Forward- Starting Interest Rate Swaps: a) financial instruments entered into to hedge highly likely future financial liabilities to be entered into by the Company through to 2018 in order meet its funding requirements, amounting to 43,999 thousand, and having a notional value of 700 million; b) financial instruments entered into to hedge highly likely future financial liabilities to be entered into by the Company through to 2019 in order meet its funding requirements, amounting to 3,345 thousand, and having a notional value of 900 million. Further details are provided in note 8.2, Financial risk management. OTHER MEDIUM/LONG-TERM FINANCIAL LIABILITIES (non-current) - - (-) (current) 212,884 thousand ( 197,087 thousand) The balance of this item as at 31 December 2017 consists primarily of accrued interest payable on the following: a) bond issues ( 152,165 thousand); b) loans obtained from banks and Atlantia ( 24,448 thousand); c) differentials on outstanding derivatives ( 35,564 thousand). SHORT-TERM FINANCIAL LIABILITIES 590,378 thousand ( 244,320 thousand) The composition of short-term financial liabilities is shown below. 266
267 December December 2016 Short-term borrowings 530,000 - Intercompany current account payables due from related parties 56, ,828 Other current financial liabilities 3,450 - Derivative liabilities (1) - 2,492 Short-term financial liabilities 590, ,320 (1) These liabilities primarily include derivative instruments that do not qualify for hedge accounting and that are classified in level 2 of the fair value hierarchy. The increase in short-term financial liabilities of 346,058 compared with 31 December 2016, primarily reflects a combination of the following: a) an increase in short-term borrowings in the form of cash deposits by Atlantia (totalling 500,000 thousand as at 31 December 2017); b) a reduction of 184,900 thousand in amounts in intercompany current accounts repayable to related parties, connected to Autostrade per l Italia s role as a provider of centralised treasury management. The decrease is essentially due to a reduction in the amount payable to Atlantia. More detailed information on financial risks and the manner in which they are managed, in addition to outstanding derivative financial instruments, is contained in note 8.2, Financial risk management. NET DEBT IN COMPLIANCE WITH ESMA RECOMMENDATION OF 20 MARCH 2013 An analysis of the various components of consolidated net debt is shown below with amounts payable to and receivable from related parties, as required by CONSOB Ruling DEM/ of 28 July 2006, in accordance with European Securities and Markets Authority ("ESMA") Recommendation of 20 March 2013 (which does not entail the deduction of non-current financial assets from debt). 000 Note 31 December 2017 of which related of 31 December 2016 party transactions which related party transactions Cash -1,772,546-2,238,192 Cash equivalents and intercompany current account receivables due from related parties -854, , , ,149 Cash and cash equivalents (A) 6.7-2,626,664-2,924,421 Current financial assets (B) ,806-19, ,508-10,921 Current portion of medium/long-term financial liabilities 1,381,302 1,000, ,847 4,344 Other borrowings 590, , , ,828 Current financial liabilities (C) 1,971,680 1,156,167 Current net debt (D=A+B+C) -797,790-1,883,762 Bond issues 8,092,619 8,005,130 Medium/long-term borrowings 2,442,129-3,508, ,320 Other non-current borrowings 429, ,447 Non-current financial liabilities (E) 10,963,892 11,994,360 (Net funds) / Net debt as defined by ESMA recommendation (F=D+E) 10,166,102 10,110,598 Non-current financial assets (G) , , , ,941 Net debt (H=F+G) 9,528,320 9,467, Net deferred tax liabilities - 588,609 thousand ( 460,065 thousand) The following tables show deferred tax liabilities, after offsetting against deferred tax assets. Annual Report
268 December December 2016 Deferred tax liabilities (IRES) 1,243,563 1,159,379 Deferred tax liabilities (IRAP) 178, ,875 Deferred tax liabilities 1,421,710 1,323,254 Deferred tax assets eligible for offset (IRES) 725, ,868 Deferred tax assets eligible for offset (IRAP) 107, ,321 Deferred tax assets eligible for offset 833, ,189 Net deferred tax liabilities 588, ,065 The nature of the temporary differences giving rise to deferred taxation and changes during the period are summarised in the following table. CHANGES DURING THE YEAR December 2016 Provisions Releases Deferred tax assets/liabilities recognised in other comprehensive income Changes in prior year estimates 31 December 2017 Off-balance sheet amortisation of goodwill 1,317,288 98, ,415,925 Derivative assets 4, ,180 Actuarial valuation of provisions for employee benefits through 1, ,600 Other temporary differences Deferred tax liabilities 1,323,254 99, ,421,710 Restatement of total amount subject to IFRIC , , ,925 Provisions 375,393 90,579-83, ,098 Derivative liabilities 53, ,844-38,980 Actuarial gains and losses on provisions for employee benefits 3, ,543 Impairment of receivables and inventories 3, ,065 2,986 Other temporary differences 3, ,569 Deferred tax assets eligible for offset 863,189 91, ,381-14, ,101 Net deferred tax liabilities 460,065 7, ,381 13, ,609 As shown above, the balance as at 31 December 2017 substantially includes the following: a) deferred tax liabilities, recognised since 2003, relating to the deduction, solely for tax purposes, of goodwill amortisation; b) the residual balance of deferred tax assets deriving from the restatement over 29 years, from 2010, of the total amount determined on first-time application of IFRIC 12, in accordance with art. 11, paragraph 3 of the Ministerial Decree of 8 June 2011 on the harmonisation of tax rules and international financial reporting standards; c) the undeducted portion of provisions, primarily for the repair and replacement of motorway infrastructure. The increase of 128,544 thousand compared with 31 December 2016 essentially reflects: a) the provision of deferred taxes on the above deduction, for tax purposes, of goodwill amortisation ( 98,637 thousand); b) the net release of the accrued portion ( 21,170 thousand) of deferred tax assets on the total amount deriving from application of IFRIC 12; c) the net release ( 14,115 thousand) of deferred tax assets on the change in fair value losses on hedging derivatives; d) the net provision ( 6,595 thousand) of deferred tax assets on the portion of provisions, primarily for the repair and replacement of motorway infrastructure, deductible in future years. 268
269 6.16 Other non-current liabilities - 32,568 thousand ( 30,344 thousand) This item consists of payables and other non-current liabilities that are neither trading nor financial in nature. The composition of this item as at 31 December 2017 is shown below December December 2016 Accrued expenses of a non-trading nature 24,609 25,120 Payable to staff 7,441 5,224 Social security contributions payable Other non-current liabilities 32,568 30,344 The increase compared with 31 December 2016, amounting to 2,224 thousand, primarily reflects recognition of the accrued amount payable under management incentive plans for the period ( 1,768 thousand) and the related contributions Trading liabilities - 1,306,269 thousand ( 1,228,727 thousand) Trading liabilities primarily consist of the following December December 2016 Payable to operators of interconnecting motorways 692, ,902 Amounts payable to suppliers 543, ,427 Tolls in the process of settlement 69,892 83,292 Other trading liabilities Trading liabilities 1,306,269 1,228,727 The increase in trading liabilities, totalling 77,542 thousand, primarily reflects a an increase in amounts payable to suppliers, reflecting the performance of investment carried out during the last quarters of the comparative periods, and an increase in amounts payable to the operators of interconnecting motorways, linked to the increase in the operators toll revenue and in keeping with contractually agreed collection times. The carrying amount of trading liabilities approximates to the related fair value Other current liabilities - 210,268 thousand ( 218,627 thousand) This item consists of payables and other current liabilities that are neither trading nor financial in nature. An analysis of the balance as at 31 December 2017 is shown below. Annual Report
270 December December 2016 Lease rentals payable 91,623 91,371 Payable to staff 28,307 29,035 Taxation other than income taxes 23,030 25,360 Social security contributions payable 18,002 20,753 Amounts payable for expropriations 8,452 10,612 Guarantee deposits by road users who pay by direct debit 1,693 1,693 Other payables 39,161 39,803 Other current liabilities 210, ,627 The balance as at 31 December 2017 is down 8,359 thousand compared with 31 December 2016, primarily reflecting a combination of the following: a) a reduction of 5,283 thousand in VAT payable to the tax authorities in January 2018; b) a reduction in social security contributions payable, amounting to 2,751 thousand. 270
271 7. NOTES TO THE INCOME STATEMENT This section includes the notes to amounts in the income statement, with negative components of the income statement shown with a sign in the headings and tables and amounts for 2016 shown in brackets. Details of amounts in the income statement deriving from related party transactions are provided in note 9.3, Related party transactions. 7.1 Toll revenue - 3,320,949 thousand ( 3,222,349 thousand) Toll revenue is up 98,600 thousand on This essentially reflects: a) a 2.2% increase in traffic, (including the impact of the different traffic mix, the increase in toll revenue is estimated to be 73 million); b) application of annual toll increases for 2017 (a rise of 0.64% from 1 January), boosting toll revenue by an estimated 18 million. Further information on points a) and b) is provided in the sub-sections, Traffic and Toll increases, in section 2.5, Group operating review, in the Report on operations accompanying these separate financial statements. Toll revenue includes the additional concession fees payable to ANAS, totalling 359,526 thousand ( 349,341 thousand as at 31 December 2016), and accounted for under concession fees in operating costs. Further details are provided in note 7.7, Other operating costs. As required by the CIPE Resolution of 20 December 1996, tables containing monthly traffic figures for the various motorway sections operated under concession have been annexed to these notes. 7.2 Revenue from construction services - 94,823 thousand ( 201,566 thousand) An analysis of this revenue is shown below Increase/ (Decrease) Revenue from construction services for which additional economic benefits are received 87, , ,702 Revenue from construction services: government grants for services for which no additional economic benefits are received Revenue from construction services provided by sub-operators 7,293 11,002-3,709 Revenue from construction services 94, , ,743 Revenue from construction services essentially consist of services for which additional economic benefits are received. It represents the fair value of the consideration for construction and upgrade services rendered during the year, determined on the basis of the operating costs and financial expenses incurred (the latter solely in the case of investment in assets held under concession), determined according to the criteria described in note 3, Accounting standards and policies applied. Revenue from construction services are decreased compared with This is essentially due to a decrease of 102,702 thousand in construction services for which additional benefits are received, primarily due to reduced work on the A14 Bologna-Taranto motorway (the Senigallia- Ancona North and Ancona North-Ancona South sections). Further details are provided in section 2.5, Group operating review, in the sub-section, Capital expenditure, in the Report on Operations accompanying these separate financial statements. Annual Report
272 In 2017, the Company carried out additional construction services for which no additional benefits are received, amounting to 406,968 thousand, net of related government grants, for which the Company made use of a portion of the specifically allocated Provisions for construction services required by contract. Uses of these provisions are classified as a reduction in operating costs for the period, as explained in note 7.9, Use of provisions for construction services required by contract. Details of total investment in assets held under concession during the year are provided in note 6.2, Intangible assets. 7.3 Other operating income - 293,145 thousand ( 293,624 thousand) An analysis of other operating income is provided below Increase/ (Decrease) Revenue from sub-concessions at service areas 174, ,574-3,049 Damages and compensation 20,848 16,564 4,284 Refunds 20,158 19, Other revenue from motorway operation 17,077 17, Revenue from services 16,814 18,749-1,935 Maintenance revenue 14,253 14, Advertising revenue 4,349 4, Release of overprovisions 3,490 4, Revenue from the sale of technology devices and services Other income 21,200 20, Other operating income 293, , Other operating income is broadly in line with The most significant changes regard: a) a 3,049 thousand reduction in revenue from sub-concessions, primarily reflecting the impact of discounts applied to service area royalties under agreements with a number of sub-operators (above all oil service providers); b) an increase of 4,284 thousand in damages and compensation from insurance companies, primarily linked to higher payouts for accidents on the motorway network. 7.4 Raw and consumable materials ,731 thousand (- 74,183 thousand) This item consists of purchases of materials and the change in inventories of raw and consumable materials Increase/ (Decrease) Electrical and electronic materials -29,058-21,733-7,325 Lubricants and fuel -9,940-8,804-1,136 Construction materials -8,022-11,464 3,442 Other raw and consumable materials -34,879-37,896 3,017 Cost of materials -81,899-79,897-2,002 Change in inventories of raw, ancillary and consumable materials and goods for resale 2,731 4,749-2,018 Capitalised cost of raw materials 1, Raw and consumable materials -77,731-74,183-3,548 This item is up on the figure for 2016, primarily reflecting an increase in the cost of electrical and electronic materials. 272
273 7.5 Service costs ,306 thousand (- 947,938 thousand) This item includes construction, insurance, transport and professional services primarily relating to the maintenance and upgrade of motorways. An analysis of the balance is shown below. Increase/ (Decrease) Construction and similar -558, , ,775 Professional services -141, ,030-6,306 Utilities -31,008-33,813 2,805 Transport and similar -19,814-13,983-5,831 Insurance -9,749-8,450-1,299 Advertising -3,445-5,547 2,102 Board of Statutory Auditors' fees Other services -48,667-55,089 6,422 Service costs -812, , ,632 The decrease in service costs compared with 2016, amounting to 135,632 thousand, essentially reflects a reduction in construction services, linked substantially to the lower volume of investment in assets held under concession. 7.6 Staff costs ,973 thousand (- 409,690 thousand) Staff costs break down as follows Increase/ (Decrease) Wages and salaries -281, , Social security contributions -83,990-85,990 2,000 Post-employment benefits (including payments to supplementary pension funds or to INPS) -17,425-19,396 1,971 Cost of share-based incentive plans -10,987-6,810-4,177 Directors' remuneration -2,717-2, Recovery of cost of seconded staff 7,712 7, Other staff costs -22,498-20,511-1,987 Staff costs -410, ,690-1,283 Staff costs are essentially in line with the figure for The substantially unchanged amount reflects: a) an increase in the average unit cost, primarily due to contract renewals; b) a reduction in the average workforce of 162, essentially reflecting the transfer of staff from Autostrade per l Italia s Contact centre to Telepass, of staff from Autostrade per l Italia s Foreign Department to Atlantia, as well as slower turnover among toll collectors, partly offset by the hiring of staff to fill specific roles within certain organisational units. The following table shows the average number of employees (by category and including agency staff). Annual Report
274 Category Increase/ (Decrease) Information on equity-settled and cash-settled share-based incentive plans for certain of the Company s Directors and employees is provided in note 9.4, Disclosures regarding sharebased payments. 7.7 Other operating costs ,275 thousand (- 485,478thousand) An analysis of other operating costs is shown below. Other operating costs are up on the previous year due to: a) an increase in in grants and donations ( 10,622 Thousand), reflecting the increased costs incurred in 2017 for work on the upgrade of infrastructure operated by public entities, as part of construction services relating to assets held under concession; b) an increase in concession fees ( 10,100 thousand), including the additional fee introduced. The increase reflects previously discussed traffic growth. Also, the Law 102 of 3 August 2009 converting Law Decree 78 of 1 July 2009, with amendments, eliminated the toll surcharge pursuant to Law 296/2006, while increasing concession fees computed on the distance travelled by each vehicle on a motorway in the amount of 6 thousandths of a euro per kilometre for toll classes A and B and 18 thousandths of a euro per kilometre for classes 3, 4 and 5. The fees payable to the Grantor are recouped through a matching increase in the tolls charged to road users, thereby not having an impact on the Company s results. 7.8 Operating change in provisions - 7,537 thousand (- 62,807 thousand) This item reflects the impact on profit or loss of operating changes (new provisions and uses) in provisions, excluding those for employee benefits, made by the Company during the period in order to meet the legal and contractual obligations that it is presumed will require the use of financial resources in future years. The impact of this item in 2017 essentially reflects: a) the positive operating change in provisions for the repair and replacement of motorway infrastructure ( 17,206 thousand), relating primarily to an updated estimate of repairs needed to the motorway network, given that the discount rates used as at 31 December of both comparative periods are substantially unchanged; b) other provisions of 9,669 thousand, previously described in note 6.13, Provisions. 274 Senior managers Middle managers Administrative staff 1,943 2, Toll collectors 1,963 2, Manual workers Average workforce 5,270 5, Increase/ (Decrease) Concession fees -441, ,524-10,100 Lease expense -6,342-6, Grants and donations -31,626-21,004-10,622 Compensation for damages and penalties -13,594-14, Direct and indirect taxes -9,180-8, Other -3,909-4, Other costs -58,309-47,894-10,415 Other operating costs -506, ,478-20,797
275 In contrast, in 2016, the operating change was essentially due to an increase in the discount rate applied at 31 December 2016, compared with the rate applied at 31 December Use of provisions for construction services required by contract 406,968 thousand ( 444,365 thousand) This item regards the use of provisions for construction services required by contract, relating to services for which no additional economic benefits are received rendered in 2017, less accrued government grants (recognised in revenue from construction services, as explained in note 7.2, Revenue from construction services ). The item represents the indirect adjustment to construction costs classified by nature in the cost of materials and external services and staff costs. The reduction of 37,397 compared with 2016, is broadly linked to reduced investment in the upgrade of the A1 Milan-Naples between Bologna and Florence. Further details are provided in section 2.5, Group operating review, in the sub-section, Capital expenditure, in the Report on Operations accompanying these separate financial statements. Further information on construction services in 2017 is provided in note 6.2, Intangible assets, and note 7.2, Revenue from construction services Amortisation and depreciation ,347 thousand (- 539,722 thousand) The increase of 25,625 thousand compared with 2016 essentially reflects an increase in amortisation of: a) concession rights deriving from construction services for which no additional economic benefits are received, totalling 18,846 thousand, mainly in relation to an updated estimate of the present value on completion of investment in construction services recognised as at 31 December 2016; b) concession rights deriving from construction services for which additional economic benefits are received, totalling 4,080 thousand, mainly in relation to investment in construction services during the year (Impairment losses) and reversals of impairment losses on current and noncurrent assets - - 1,136 thousand (- 1,319 thousand) The balance primarily reflects the impairment of trade receivables, amounts due from insurance companies and unpaid tolls relating to previous years, reflecting the risk of partial non-collection of the same. Annual Report
276 7.12 Financial income/(expenses) ,229 thousand (- 830,138 thousand) Financial income 173,175 thousand ( 76,545 thousand) Financial expenses - 575,390 thousand (- 906,691 thousand) Foreign exchange gains/(losses) - 14 thousand ( 8 thousand) An analysis of financial income and expenses is shown below Increase/ (Decrease) Dividends received from investees 50,488 27,091 23,397 Income from derivative financial instruments 68,028 13,663 54,365 Interest income 19,754 21,981-2,227 Income from measurement of financial instruments at amortised cost 24,439 2,801 21,638 Financial income accounted for as an increase in financial assets Other 5,302 10,051-4,749 Other financial income 118,474 49,454 69,020 Reversal of impairment losses on financial assets and investments 4,213-4,213 Total financial income (a) 173,175 76,545 96,630 Financial expenses from discounting of provisions for construction services required by contract and other provisions -23,991-44,954 20,963 Interest expense -394, ,218 21,308 Losses on derivative financial instruments -117,749-76,428-41,321 Expenses from measurement of financial instruments at amortised cost -15,838-10,340-5,498 Financial expenses accounted for as an increase in financial liabilities -3, ,200 Other -19, , ,586 of which non-recurring (1) , ,215 Other financial expenses -551, , ,875 Impairment losses on financial assets and investments - -13,463 13,463 Total financial expenses (b) -575, , ,301 Foreign exchange gains/(losses) (c) Financial income/(expenses) (a+b+c) -402, , ,909 (1) Details of non-recurring financial transactions are provided in note 7.17, "Material non-recurring transactions", in the financial statements as at and for the year ended 31 December Dividends received from investees are up 23,397 thousand, primarily due to an increase in dividends declared by Autostrade Tech ( 24,998 thousand in 2017 and 6,104 thousand in 2016) and Società Italiana per Azioni per il Traforo del Monte Bianco ( 13,825 thousand in 2017 and 5,181 thousand in 2016). In 2017, Reversals of impairment losses on financial assets and investments reflects the reversal of the impairment loss on the investment in Pavimental, as described in note 6.3, Investments. Financial expenses from the discounting of provisions for construction services required by contract and other provisions decreased by 20,963 thousand compared with The reduction in these financial expenses, computed on the basis of the value of the provisions and the discount rates used at 31 December of the year prior to the reporting period, primarily 276
277 reflects the reduction in interest rates applied as at 31 December 2016 compared with the end of Impairment losses on financial assets and investments, amounting to zero in 2017, in 2016 essentially regarded impairment losses on the investments in Pavimental ( 7,100 thousand) and AD Moving ( 3,165 thousand). Net other financial expenses of 432,939 thousand are down 365,873 thousand compared with the previous year ( 798,812 thousand). As a result of the issuer substitution implemented at the end of 2016, the following were recognised: a) non-recurring financial expenses ( 307,780 thousand) in 2016 following recognition of the fair value of bond issues denominated in foreign currency and of the related Cross Currency Swaps; b) non-recurring income of 41,465 thousand in 2017, linked to release of the above fair value initial recognition of the bond issues denominated in foreign currency ( 24,383 thousand) and the change in the fair value of the related derivative financial instruments ( 17,082 thousand). After excluding the above effects, net other financial expenses are down 16,628 thousand, primarily reflecting a combination of the following: a) non-recurring financial expenses linked to partial early repayment of certain loans from Atlantia, completed in 2016 prior to the issuer substitution (amounting to 19,435 thousand); b) interest and financial expenses paid in 2016, reflecting the loan granted by Atlantia in 2009 and repaid in May 2016 ( 15,764 thousand); c) financial expenses recognised in 2017 ( 20,502 thousand) after the unwinding of a number of Forward-Starting Interest Rate Swaps on which fair value losses were incurred as part of the liability management transaction described in greater detail in note 8.2, Financial risk management Income tax (expense)/benefit ,293 thousand (- 295,468 thousand) An analysis of income tax expense is shown below Increase/ (Decrease) IRES -217, ,394-83,089 IRAP -56,926-55,789-1,137 Current tax expense -274, ,183-84,226 Differences on current tax expense for previous years 8,763 2,923 5,840 Provisions 91, ,816-13,942 Releases -106, ,198 2,817 Change in prior year estimates ,932 4,977 Deferred tax income -15,462-9,314-6,148 Provisions -99,185-98, Deferred tax expense -99,185-98, Net deferred tax expense -114, ,208-6,439 Income tax (expense)/benefit -380, ,468-84,825 The increase in income tax expense compared with 2016 essentially reflects the increase in pre-tax profit, having benefitted from the reduction in the IRES rate from 1 January 2017 (down from 27.5% to 24%), which has had an estimated impact of 38,252 thousand. Annual Report
278 The following table shows a reconciliation of the statutory rate of IRES with the effective charge in the two comparative periods. 000 Taxable income Tax expense Tax expense Taxable Tax Rate income Tax Rate Profit/(loss) before tax from continuing operations 1,348, ,028 Tax expense/(benefit) at statutory rate of IRES 323, % 223, % Temporary differences deductible in future years: 323,761 77, % 368, , % Provisions for the repair and replacement of motorway infrastructure 315,669 75, ,528 99,420 Other differences 8,092 1,942 6,902 1,898 Temporary differences taxable in subsequent years: -353,806-84, % -351,519-96, % Off-balance sheet deduction of goodwill -351,521-84, ,519-96,668 Actuarial valuation of provisions for post-employment benefits through profit or loss -2, Reversal of temporary differences arising in previous years -361,509-86, % -335,406-92, % Release of provisions for the repair and replacement of motorway infrastructure -277,166-66, ,662-64,257 Realignment of overall balance due to application of IFRIC12-67,651-16,236-67,651-18,604 Other differences -16,692-4,007-34,093-9,376 Permanent differences -50,572-12, % -3,826-1, % Non-taxable dividends -48,351-11,605-25,736-7,077 Tax-exempt (reversals of impairment losses)/imparment losses on investments -4,213-1,011 13,463 3,702 Other permanent differences 1, ,447 2,323 Income assessable to IRES 906, ,706 IRES for the year 217, % 134, % IRAP for the year 56, % 55, % Current income tax expense 274, % 190, % 7.14 Dividends, after the related taxation, from discontinued operations - - thousand ( 103,561 thousand) This item breaks down as follows in the two comparative periods The figure for 2016 included dividends, after the related taxation, declared by Telepass and Autostrade dell Atlantico, control of which was transferred to Atlantia between the end of 2016 and the first quarter of 2017 as part of the Atlantia Group s restructuring Earnings per share The following statement shows a breakdown of the calculation of earnings per share for the two comparative periods. In the absence of options or convertible bonds issued by the Company, diluted earnings per share coincides with the figure for basic earnings per share. 278 Increase/ (Decrease) Dividends declared by Autostrade dell'atlantico - 50,000-50,000 Taxation Dividends declared by Autostrade dell'atlantico, after related taxation - 49,312-49,312 Dividends declared by Telepass - 55,005-55,005 Taxation Dividends declared by Telepass, after related taxation - 54,249-54,249 Dividends, after related taxation, from discontinued operations - 103, , Weighted average number of shares outstanding 622,027, ,027,000 Profit for the year ( 000) 968, ,121 Earnings per share ( ) Profit from continuing operations ( 000) 968, ,560 Basic earnings per share from continuing operations ( ) Profit/(Loss) from discontinued operations ( 000) - 103,561 Basic earnings/(losses) per share from discontinued operations ( )
279 8. OTHER FINANCIAL INFORMATION 8.1 Notes to the statement of cash flows Cash and cash equivalents is down 112,857 thousand in 2017, compared with the increase of 334,091 thousand recorded in Cash flows from operating activities amount to 1,836,855 thousand, up 233,285 thousand compared with the figure for 2016 ( 1,603,570 thousand). This is essentially due to the differing performance of movements in working capital in the two comparative periods ( 303,193 thousand). This reflects in particular: a) an inflow in 2017 ( 224,198 thousand), essentially due to an increase in current tax liabilities ( 104,433 thousand, after excluding current taxation recognised in equity following distribution of the special dividend in kind to the parent, Atlantia, described in note 5.1., Restructuring of the Atlantia Group ), an increase in trading liabilities ( 77,542 thousand) and a reduction in trade receivables ( 74,383 thousand); b) an outflow in 2016 ( 78,995 thousand), essentially relating to a reduction in trading liabilities ( 61,974 thousand), reflecting the volume of investment in the second halves of the two years, and an increase in amounts due from sub-operators at service areas ( 18,692 thousand). Cash used in investing activities amounts to 151,228 thousand, compared with the inflow from investing activities in 2016 ( 560,088 thousand). This negative difference of 711,316 primarily reflects a combination of the following: a) the inflow generated at the end of 2016 as a result of the impact of the transfer of the investments in Telepass and Stalexport Autostrady, as part of the restructuring of the Atlantia Group (for a total consideration of 1,247,072 thousand); b) the return of capital reserves by Autostrade dell Atlantico in 2017 ( 398,253 thousand); c) reduced capital expenditure in 2017 ( 142,220 thousand). Net cash used for financing activities amounts to 1,798,484 thousand ( 1,829,567 thousand in 2016). The reduction of 31,083 thousand primarily regards the fact the following events almost offset each other: a) the distribution to Atlantia, in 2017, of a portion of the Reserve for transactions under common control, amounting to 1,101,312 thousand; b) the benefit in the two comparative periods of the cash deposited by the parent, Atlantia ( 900,000 thousand); c) the net balance of new bond issues, bank borrowings and loans from the parent, Atlantia, in 2017 compared with 2016, having a positive impact on cash flows ( 107,276 thousand). The following table shows the net cash flows for the two comparative periods generated by the investments in Telepass and Autostrade dell Atlantico, consisting of dividends paid to the Company classified in Investments held for sale or for distribution to shareholders or related to discontinued operations in 2016, as required by IFRS Net cash generated from/(used in) operating activities - 105,005 Net cash generated from/(used in) investing activities - - Net cash generated from/(used in) financing activities - - Annual Report
280 8.2 Financial risk management Financial risk management objectives and policies In the normal course of its business and finances, the Company is exposed to: a) market risk, principally with respect to the effect of movements in interest and foreign exchange rates on financial liabilities assumed and financial assets acquired; b) liquidity risk, with regard to ensuring the availability of sufficient financial resources to fund operating activities and repayment of the liabilities assumed; c) credit risk, linked to both ordinary trading relations and the likelihood of defaults by financial counterparties. The Company s financial risk management strategy is derived from and consistent with the business goals set by Atlantia s Board of Directors that are contained in the various long-term business plans approved annually by the Board, and taking into account Atlantia s role in the management and coordination of Autostrade per l Italia. Market risk The objective of market risk strategy is to minimise interest rate risk and borrowing costs, as defined in the Financial Policy approved by the Board of Directors of the parent, Atlantia. Management of these risks is based on prudence and best market practice. The main objectives set out in this policy are as follows: a) to protect the scenario forming the basis of the long-term plan from the effect of exposure to currency and interest rate risks, identifying the best combination of fixed and floating rates; b) to pursue a potential reduction of the Group s borrowing costs within the risk limits determined by the Board of Directors; c) to manage derivative financial instruments taking account of their potential impact on the results of operations and financial position in relation to their classification and presentation. As at 31 December 2017, the derivatives in the Company s portfolio are classified as follows in application of IAS 39: a) non-hedge accounting, as regards Cross Currency Swaps; b) cash flow hedges, for the other hedging derivatives, consisting of Interest Rate Swaps (IRSs) and Forward-Starting Interest Rate Swaps. Details of the criteria used to determine the fair value of derivative financial instruments are provided in note 3, Accounting standards and policies applied. The residual average term to maturity of the Company s debt as at 31 December 2017 is approximately six years and seven months. The average cost of medium to long-term debt for 2017 was 3.6%. Monitoring is, moreover, intended to assess, on a continuing basis, counterparty creditworthiness and the degree of risk concentration. Interest rate risk Interest rate risk is linked to uncertainty regarding the performance of interest rates, and takes two forms: a) cash flow risk: linked to financial assets and liabilities with cash flows indexed to a market interest rate. In order to reduce the amount of current and highly likely future floating rate debt, the Company has entered into interest rate swaps (IRSs), classified as cash flow hedges. The hedging instruments and the underlying financial liabilities have matching terms to maturity and notional amounts. Following tests of effectiveness, 280
281 changes in fair value are essentially recognised in other comprehensive income. The tests conducted did not reveal the presence of significant ineffective portions to be recognised in profit or loss in Interest income or expense deriving from the hedged instruments is or will be recognised simultaneously in profit or loss. As part of a liability management transaction, in which the Company issued bonds with a notional value of 700,000 thousand, and at the same time bought back a portion of the bonds maturing in 2019, 2020 and 2021 (a total of 522,614 thousand). This was treated for accounting purposes as a non-substantial modification of the existing financial liabilities. The Forward-Starting Interest Rate Swaps entered into in June 2015, to hedge highly likely future financial liabilities to be entered into through to 2017, were unwound. At the date of unwinding these derivatives, fair value losses recognised in equity amounted to 27,461 thousand. A part of this amount, totalling 20,502 thousand, relating to the portion of the par value of the novated bonds, has been reclassified to profit or loss as a financial expense. The remaining fair value losses, totalling 6,959 thousand, will be reclassified to profit or loss on occurrence of the interest flows linked to the newly issued bonds, in keeping with the nature of these instruments as cash flow hedges. The cost of issuing these bonds, including the impact of the hedges, was therefore 2.32%; b) fair value risk: this represents the risk of losses deriving from an unexpected change in the value a financial asset or liability following an unfavourable shift in the market interest rate curve. As at 31 December 2017, the Company has not entered into derivatives classified as fair value hedges. As a result of cash flow hedges, 95% of interest bearing debt is fixed rate as at 31 December The remaining 5% subject to a floating rate regards short-term loans in the form of cash deposits by Atlantia and intercompany current account payables due to related parties. Currency risk Currency risk derives primarily from the presence of financial assets and liabilities denominated in currencies other than the Company's functional currency. With regard to the Cross Currency Swaps (CCIRSs) linked to the bonds denominated in sterling (GBP) and yen (JPY), which were involved in the issuer substitution at the end of 2016, whilst, from an operational viewpoint, these derivatives hedge the bonds exposure to currency risk, they do not meet all the requirements for classification as hedges under IAS 39 and have been classified as non-hedge accounting. 8% of the Group s medium/long-term debt is denominated in currencies other than the euro. Taking into account the above Cross Currency Swaps (CCIRSs), the percentage of debt exposed to currency risk on translation into euros is, in any event, zero. The following table summarises outstanding derivative financial instruments as at 31 December 2017 (compared with 31 December 2016), showing the corresponding market value. Annual Report
282 December December 2016 Type Purpose of hedge Fair value asset/(liability) Notional amount Fair value asset/(liability) Notional amount Cash flow hedges (1) Interest Rate Swaps Interest rate risk -129,946 2,406, ,234 3,130,233 Non-hedge accounting derivatives -129,946 2,406, ,234 3,130,233 Cross Currency Swaps Interest rate and currency risk -299, , , ,176 Interest rate floors (2) Interest rate risk , ,000 FX Forwards (3) Currency risk ,492 35,548 FX Forwards (3) Currency risk - - 2,492-35, , , ,213 1,099,176 Sensitivity analysis Sensitivity analysis describes the impact that the interest rate and currency movements to which the Company is exposed would have had on the income statement for 2016 and on equity as at 31 December The interest rate sensitivity analysis is based on the exposure of derivative and non-derivative financial instruments at the end of the reporting period, assuming, in terms of the impact on the income statement, a 0.10% (10 bps) shift in the interest rate curve at the beginning of the year, whilst, with regard to the impact of changes in fair value on comprehensive income, the 10 bps shift in the curve was assumed to have occurred at the measurement date. Based on the above analysis: a) in terms of interest rate risk, an unexpected and unfavourable 10 bps shift in market interest rates would have resulted in a negative impact on the income statement, totalling 3,103 thousand, and on other comprehensive income, totalling 18,830 thousand, before the related taxation; b) in terms of currency risk, an unexpected and unfavourable 10% shift in the exchange rate would have resulted in a negative impact on the consolidated income statement, totalling 21,870 thousand, due to the change in fair value losses on Cross Currency Swaps in sterling (GBP) and yen (JPY), which, as noted above, have been classified as nonhedges. Liquidity risk Total -429,144 3,306, ,447 4,229,409 of which: fair value asset - 2,492 fair value liability -429, ,939 (1) The fair value of cash flow hedges excludes accruals at the measurement date. (2) The fair value of the embedded derivative was linked to the zero-based Euribor floor included in the outstanding loan from Cassa Depositi e Prestiti. The floor was then unwound following renegotiation of the committed lines of credit on 13 December (3) The fair value of these derivatives is classified in short-term financial liabilities and assets. Liquidity risk relates to the possibility that cash resources may be insufficient to fund the payment of liabilities as they fall due. The Company believes that its ability to generate cash, the ample diversification of its sources of funding and the availability of committed and uncommitted lines of credit provides access to sufficient sources of finance to meet its projected financial needs. The Company s cash reserves as at 31 December 2017 are estimated at 3,773,798 thousand made up of: a) 2,039,736 thousand in cash and/or investments maturing in the short term, after net short-term payables due to Atlantia Group companies, essentially in relation to the Company s provision of centralised treasury services, as described in note 6.7, Cash and cash equivalents, and note 6.14, Financial liabilities ; 282
283 b) 234,062 thousand in term deposits to part finance the execution of specific works, as described in note 6.4, Financial assets ; c) 1,500,000 thousand in undrawn committed lines of credit, with a weighted average residual term to maturity of approximately eight years and nine months and a weighted average residual drawdown period of approximately two years and three months, details of which are shown in the following table December 2017 Line of credit Drawdown period expires Final maturity Available Drawn Undrawn Medium/long-term committed EIB line 2013 "Environment and Motorway Safety" 31 Dec Sept , ,000 Medium/long-term committed line from Cassa Depositi e Prestiti 31 Dec Dec ,100, , ,000 Revolving Line of Credit from Cassa Depositi e Prestiti 2 Oct Dec , ,000 Lines of credit 1,900, ,000 1,500,000 The following schedule shows the distribution of maturities for medium/long-term financial liabilities outstanding as at 31 December 2017 and 31 December 2016, excluding accrued financial expenses at those dates. 000 Carrying amount Total contractual flows 31 December 2017 Within 12 Between 1 and 2 months years Between 3 and 5 years After 5 years Non-derivative financial liabilities (1) Bond (GBP) -663, ,662-35,222-35, ,218 - Bond ,139-1,411,089-58,750-58, ,250-1,117,339 Bond (JPY) -195, ,063-4,044-4,044-12, ,843 Bond Bond , ,000-21,875-21,875-65, ,625 Bond , ,734-26, , Bond , ,578-21,950-21, ,678 - Bond ,000-60,200-1,680-1,680-5,040-51,800 Bond (Zero Coupon Bond) -65, , ,000 Bond , ,948-17,094-17, ,760 - Bond , ,002-2,813-2,813-8, ,938 Bond , ,850-4,050-4,050-12, ,600 Bond , ,099-2,719-2,719-8, ,504 Bond , ,980-5,404-5, ,172 - Bond retail -737, ,127-12,188-12,188-36, ,188 Bond , ,000-9,375-9,375-28, ,125 Bond , ,125-13,125-13,125-39, ,500 Bond , ,779-12,279-10,500-31, ,500 Bond , ,500-13,125-13,125-39, ,875 Total bond issues -8,092,619-9,909, , ,948-2,775,558-6,017,837 Loans from parents Atlantia loan ,256-1,039,320-1,039, Total loans from parents (A) -996,256-1,039,320-1,039, Bank borrowings European Investment Bank (EIB) -1,583,886-2,141, , , ,877-1,331,355 Cassa Depositi e Prestiti and SACE -796, ,804-29,170-28,802-84, ,303 Borrowings linked to grants Total bank borrowings (B) -2,380,229-3,040, , , ,406-2,087,658 Other borrowings ANAS -234, Total other borrowings (C) -234, Total medium/long-term borrowings (A+B+C) -3,610,547-4,079,907-1,232, , ,406-2,087,658 Derivative liabilities (2) Interest Rate Swaps -129, ,224-30,728-32, , ,048 Cross Currency Swaps -299, ,848-14,548-14, ,472-64,634 Floors Total derivative liabilities -429, ,072-45,276-46, , ,682 (1) Future cash flows relating to interest on floating rate loans have been projected on the basis of the latest established rate and applied and held constant to final (2) As at 31 December 2017, expected contractual flows are linked to the hedging of outstanding and highly likely future financial liabilities to meet funding requirements through to Expected future cash flows from differentials on interest rate swaps have been projected on the basis of the interest rate fixed at the measurement date and held constant to final maturity. Annual Report
284 000 Carrying amount Total contractual flows 31 December 2016 Within 12 Between 1 and 2 months years Between 3 and 5 years After 5 years Non-derivative financial liabilities (1) Bond (GBP) -706, ,985-36,499-36, , ,489 Bond ,570-1,470,000-58,750-58, ,250-1,176,250 Bond (JPY) -211, ,417-4,425-4,425-13, ,293 Bond , , , Bond , ,875-21,875-21,875-65, ,500 Bond , ,579-30,314-30, ,951 - Bond , ,349-27,790-27, ,769 - Bond ,000-61,880-1,680-1,680-5,040-53,480 Bond (Zero Coupon Bond) -61, , ,000 Bond , ,873-21,563-21, ,747 - Bond , ,844-2,813-2,813-8, ,773 Bond , ,911-4,050-4,050-12, ,661 Bond , ,825-2,719-2,719-8, ,230 Bond , ,564-7,313-7, ,938 - Bond retail -735, ,314-12,188-12,188-36, ,375 Bond , ,375-9,375-9,375-28, ,500 Bond , ,250-13,125-13,125-39, ,625 Bond , ,807-12,307 31, ,000 Total bond issues -8,510,077-9,049, , ,172-3,352,407-4,682,176 Loans from parents Atlantia loan ,320-1,078,640-39,320-1,039, Total loans from parents (A) -992,320-1,078,640-39,320-1,039, Bank borrowings European Investment Bank (EIB) -1,673,123-2,301, , , ,898-1,481,226 Cassa Depositi e Prestiti and SACE -819, ,942-36,801-36, , ,997 Borrowings linked to grants (2) -49, Total bank borrowings (B) -2,541,534-3,240, , , ,665-2,040,223 Other borrowings ANAS -184, Total other borrowings (C) -184, Total medium/long-term borrowings (A+B+C) -3,718,596-4,319, ,009-1,241, ,665-2,040,223 Derivative liabilities (3) Interest Rate Swaps -196, ,693-27,076-38, , ,470 Cross Currency Swaps -281, ,736-12,640-12,890-37, ,324 Floors -2, Total derivative liabilities -480, ,429-39,716-51, , ,794 (1) Future cash flows relating to interest on floating rate loans have been projected on the basis of the latest established rate and applied and held constant to final (2) Repayment of these non-interest bearing loans is due from ANAS in accordance with the provisions of laws 662/1996, 345/1997 and 135/1997. (3) As at 31 December 2016, expected contractual flows are linked to the hedging of outstanding and highly likely future financial liabilities to meet funding requirements through to Expected future cash flows from differentials on interest rate swaps have been projected on the basis of the interest rate fixed at the measurement date and held constant to final maturity. The amounts shown in the tables include interest payments and exclude the impact of any offset agreements. The time distribution of terms to maturity is based on the residual contract term or on the earliest date on which repayment of the liability may be required, unless a better estimate is available. The distribution for liabilities with amortisation schedules is based on the date on which each instalment falls due. The following table shows the time distribution of expected cash flows from cash flow hedges, as defined by IAS 39, and the periods in which they will be recognised in profit or loss. 000 Carrying amount Expected cash flows (1) Interest rate swaps Derivative assets Derivative liabilities -129, ,477-30,448-28,985-60,646-19, , ,496-26,668-36,334-97,354-43,140 Total cash flow hedges -129, ,234 Accrued expenses on cash flow hedges -9,531-7,262 Accrued income on cash flow hedges - - Total cash flow hedge derivative assets/liabilities -139, ,477-30,448-28,985-60,646-19, , ,496-26,668-36,334-97,354-43,140 Flussi attesi (1) Interest rate swaps Expenses on cash flow hedges -143,664-25,177-33,659-56,475-28, ,001-26,131-35, ,244-46,007 Income from cash flow hedges 13, ,718 11, ,767 Total income (losses) from cash flow hedges -129,946-25,177-33,659-56,475-14, ,234-26,131-35, ,244-34,240 (1) Expected cash flows from swap differentials are calculated on the basis of market curves at the measurement date. 31 December December 2016 Expected Between 1 Between 3 After 5 Carrying Within 12 cash flows and 2 years and 5 years years amount months (1) Within 12 months Entro l'esercizio Da 1 anno a 2 anni Da 3 anni a 5 anni Oltre 5 anni Flussi attesi (1) Entro l'esercizio Between 1 Between 3 and 2 years and 5 years Da 1 anno a 2 anni Da 3 anni a 5 anni After 5 years Oltre 5 anni 284
285 Credit risk Credit risk is the exposure of the Company to potential losses as a result of a default in a counterparty s obligations. The risk can arise both from factors that are strictly technical and commercial or administrative and legal in nature (disputes regarding the nature quality of service, on the interpretation of contractual provisions, supporting invoices, etc.), as well as from factors that are financial in nature, such as the credit standing of a counterparty. Trade receivables essentially arise in connection with the provision of services and relate to activities linked to the core business. These types of receivables include: a) concession fees and royalties receivable in connection with service areas; b) receivables relating to agreements permitting motorway crossings or the location of equipment; c) receivables relating to the sale of goods and services; d) receivables related to property rentals. Trade receivables, on the other hand, do not include receivables arising in connection with the invoicing of tolls in arrears, following the execution of a novation agreement for this particular type of receivable with the subsidiary of Atlantia, Telepass. Credit risk deriving from outstanding derivative financial instruments can be considered marginal in that the counterparties involved are major financial institutions. Provisions for impairment losses on individually material items are established when there is objective evidence that the Company will not be able to collect all or any of the amount due. The amount of the provisions takes account of estimated future cash flows and the date of collection, any future recovery costs and expenses, and the value of guarantees. General provisions, based on the available historical and statistical data, are established for items for which specific provisions have not been made. Details of the allowance for bad debts for trade receivables are provided in note 6.6, Trading assets, whilst information on other financial assets is provided in note 6.4, Financial assets. Annual Report
286 9. OTHER INFORMATION 9.1 Guarantees As at 31 December 2016, the Company reports the following outstanding personal and collateral guarantees issued to third parties, including the following material items: a) guarantees securing the bonds issued by Atlantia in 2012 and maturing in 2018 ( 1,000,000 thousand, in return for which the Company has received a loan of the same amount and term to maturity), amounting to a total of 1,200,000 thousand and representing 120% of par value; b) sureties issued on behalf of certain subsidiaries and associates that operate motorway infrastructure, amounting to 17,412 thousand; c) the joint and several guarantee issued with Autostrada Tirrenica in favour of the Grantor ( 14,003 thousand) following the latter s release of a surety; d) the pledge to credit institutions, as security for loans issued, of the shares in Bologna & Fiera Parking ( 999 thousand), of the 2% interest in Strada dei Parchi ( 1,355 thousand), and the direct (0.25%) interest in Tangenziale Esterna ( 1,163 thousand). Shares representing the indirect investment in Tangenziale Esterna (6.52%), held through the vehicle entity, Tangenziali Esterne di Milano, have also been pledged as security to banks. In December 2017, given that the concession for the A3 Naples-Salerno motorway has yet to be awarded to either Autostrade Meridionali or a third party, the Company, at the subsidiary s request, renewed the guarantee in favour of Intesa Sanpaolo-Banco di Napoli (ISP), issued in December 2016, for the whole of This guarantee, amounting to up to 300 million, relates to the loan of the same amount disbursed to the company by the bank in December 2015, of which 245 million has been drawn down as at 31 December This loan has been extended until 31 December 2018, with the potential for further annual extensions using the same mechanism. 9.2 Reserves As at 31 December 2017, the Company has recognised contract reserves quantified by contractors in relation to: a) investing activities, totalling 849 million ( 965 million as at 31 December 2016). Based on past experience, only a small percentage of the reserves will actually have to be paid to contractors and, in this case, will be accounted for as an increase in intangible assets deriving from concession rights; b) non-investing activities, amounting to approximately 24 million, the estimated future cost of which is covered by existing provisions in the financial statements. 9.3 Related party transactions This section describes the Company s principal transactions with related parties, identified as such according to the criteria in the procedure for related party transactions adopted by the parent, Atlantia, in application of art bis of the Italian Civil Code, the Regulations adopted by the Commissione Nazionale per le Società e la Borsa (the CONSOB) in Resolution of 12 March 2010, as amended. The Procedure, published in the section, Articles of Association, codes and procedures, on Atlantia s website at establishes the criteria to be used in identifying related parties, in distinguishing between transactions of greater and lesser significance and in applying the rules governing the above transactions of greater and lesser significance, and in fulfilling the related reporting requirements. The following tables show amounts of a trading or financial nature in the income statement and statement of financial position generated by related party transactions, including those with the Company s Directors, Statutory Auditors and other key management personnel. 286
287 Principal trading and non-financial transactions with related parties Assets Liabilities Income Expenses 000 Trading and other assets Trading and other liabilities Trading and other income Trading and other expenses Other trading Other noncurrent Total construction operating Total consumable Service costs operating Total (3) Revenue from Other Raw and Other Trade Current tax Trade Current tax Other current Staff Lease and other Total receivables assets payables liabilities liabilities costs (2) expense assets liabilities services income (2) materials costs 31 December Atlantia (5) and (6) 4,426 18,661-23,087-3,671 87,143-90,814-2,615 2, , ,736 Sintonia - 5,702-5, Total parents 4,426 24,363-28,789-3,671 87,143-90,814-2,615 2, , ,736 2, ,657-3, ,578-4,491 4,491-3, ,813 AD Moving Autostrade Meridionali , , Autostrade Tech 15, ,564-3, ,871-7,140 7, , ,948 EsseDiEsse Società di Servizi 7, ,712-8, ,790-5,029 5,029-20,547-1, ,434 Giove Clear , , ,190-1, ,045 Infoblu Raccordo Autostradale Valle d'aosta , , Società Italiana per Azioni per il Traforo del Monte Bianco Tangenziale di Napoli 1, ,030-11, , Tech Solutions Integrators Società Autostrada Tirrenica , ,816-1,154 1, Other subsidiaries (1) Total subsidiaries (4) 31, ,444-55, ,671-19,913 19, ,884-6, ,159 Bologna and Fiera Parking 1, , Pavimental 1, , ,044-6, ,890-1,169 1, , ,435 Spea Ingegneria Europea 23, ,166-64, , , ,822 Società Infrastrutture Toscane Other associates (1) , , ,542-6, ,388-1,863 1, , ,272 Total associates Atlantia Bertin Participacoes 1, , ,112 1, Autogrill 30, ,081-1, ,528 2,072 68,154 70,226 2, ,721 Autostrade dell'atlantico Electronic Transaction Consultants Co 2, , Gruppo Aeroporti di Roma 1, , Telepass 14, ,415-10, ,820-4,481 4,481-10, ,527 Other affiliates (1) Total affiliates 50, ,158-13,702-1,112 14,814 2,072 73,015 75,087 2,077 10,517-2, , ,207 5, , ,246 ASTRI pension fund CAPIDI pension fund ,159 1, , ,874 Total pension funds ,366 6, , , ,756 5, , Key management personnel (5) Total key management personnel , ,756 5, , ,130 TOTAL 111,674 24, ,062 2, ,895 87,143 17, ,309 2,072 97,406 99,478 2, ,955 17, , , December Atlantia 3,720 48, ,746-3, ,758-1,671 1, Sintonia - 6,542-6, Total parents 3,720 55, ,288-3, ,758-1,671 1, AD Moving 2, ,649-3, ,751-4,873 4,873-4, ,957 Atlantia Bertin Participacoes 1, , Autostrade dell'atlantico Autostrade Meridionali , , Autostrade Tech 11, ,646-4, ,363-6,177 6, , ,845 Electronic Transaction Consultants Co 2, , EsseDiEsse Società di Servizi 10, ,565-14, ,145-4,932 4,932-20, ,077 Giove Clear , , ,764-1, ,648 Infoblu Raccordo Autostradale Valle d'aosta , , Società Italiana per Azioni per il Traforo del Monte Bianco Tangenziale di Napoli 1, ,003-11, , Tech Solutions Integrators Società Autostrada Tirrenica 1, ,031-6, , Other subsidiaries (1) , ,685-59,795-1,527 61,322-19,029 19, ,376-6, ,277 Total subsidiaries (4) Bologna and Fiera Parking 1, , Pavimental , , , ,302 Spea Ingegneria 25, ,966-70, , , ,266 Europea Other associates (1) , , , ,693-1,507 1, , ,568 Total associates Autogrill 35, ,030-3, ,831 2,294 64,601 66, Telepass 17, ,277-6, ,496-9,034 9,034-9, ,630 Other affiliates (1) 53, ,295-10, ,671 2,294 73,696 75, ,828-1, ,610 Total affiliates - ASTRI pension fund ,514 4, , ,850 CAPIDI pension fund ,083 2, , ,431 Total pension funds ,597 6, , ,281 Key management personnel (5) , ,434 4, , ,750 Total key management personnel , ,434 4, , ,750 TOTAL 118,629 55, ,225 1, ,917-10, ,384 2,294 95,903 98, ,484 16, ,919 (1) This item includes balances for companies where the relevant amount is not material. (2) "Staff costs" include cost recoveries. (3) The total expenses for both periods do not include provisions, in 2017 for risks associated with Tech Solutions Integrators ( 855 thousand) and Autogrill ( 380 thousand) and in 2016 for risks associated with Tech Solutions Integrators ( 4,526 thousand). (4) The total also includes indirect subsidiaries. (5) Autostrade per l'italia's "key management personnel" means the Company's Directors, Statutory Auditors and other key management personnel. The expenses shown for each period, including amounts charged by Atlantia for 2017 ( 2,237 thousand), include the accrued amount payable as emoluments, salaries, benefits in kind, bonuses and other incentives (including the fair value of share-based incentive plans based on the shares of the parent, Atlantia). (6) Current tax liabilities include 11,558 thousand in taxation resulting from distribution of the special dividend in kind, accounted for as reduction in equity, as described in note 5.1, "Restructuring of the Atlantia Group". Annual Report
288 Principal financial transactions with related parties Assets Liabilities Income Expenses 000 Financial Financial assets Financial income Financial expenses liabilities Other noncurrent financial assets Current financial assets deriving from government grants Non-current derivative assets Intercompany current account receivables Current portion of medium/longterm financial assets Other current financial assets Total Medium/longterm borrowings Short-term borrowings Intercompany current account payables Current portion of medium/longterm financial liabilities Other current financial liabilities Total Other financial income (1) Total Other financial expenses (1) Total 31 December Atlantia ,000 7,448 1,000,411-1,507,859 1,541 1,541 50,462 50,462 Total parents 50, ,000 7,448 1,000,411-1,507,859 1,541 1,541 50,462 AD Moving , , Autostrade Meridionali , , ,767 3, Autostrade Tech , , EsseDiEsse Società di Servizi , , Giove Clear Infoblu , , Raccordo Autostradale Valle d'aosta , , Società Italiana per Azioni per il Traforo del Monte Bianco ,761 7, , , Tangenziale di Napoli 21, ,427 7,702-36, ,885 1, Tech Solutions Integrators , , Società Autostrada Tirrenica 230, , , , ,396 13,794 13, Total subsidiaries (2) 251, ,086 11,082 7, , , ,971 19,453 19, Pavimental , , Spea Ingegneria Europea Società Infrastrutture Toscane ,450 3, Other associates (3) Total associates , , ,450 3, Autogrill Autostrade dell'atlantico , ,137 2,518 2,518 3,270 3,270 Telepass 8,699 11,969 62, , , ,699 Total affiliates , , , ,137 2,871 2,871 11,969 TOTAL 251, ,043 11,082 7,943 1,044, ,000 56,928 1,000,411 3,450 1,560,789 24,708 24,708 62, December Atlantia , ,539 4,344-1,202,203 12,271 12, , ,662 Total parents 653, , ,539 4,344-1,202,203 12,271 12, ,662 AD Moving , , Autostrade dell'atlantico - - 2, , , ,181 3,335 3,335 1,688 1,688 Autostrade Meridionali , , Autostrade Tech , , EsseDiEsse Società di Servizi Giove Clear , , Infoblu , , Raccordo Autostradale Valle d'aosta , , Società Italiana per Azioni per il Traforo del Monte Bianco , , Tangenziale di Napoli 28, ,299-36, , ,993 2,268 2, Tech Solutions Integrators , , Società Autostrada Tirrenica 225, , , , ,780 13,856 13, Total subsidiaries (2) 253,941-2,492 3,179 10, , , ,059 19,560 19,560 1,688 1,688 Pavimental , , Spea Ingegneria Europea Other associates (3) Total associates , , Autogrill Telepass , , ,252 8,252 Total affiliates , , ,252 8,252 TOTAL 253, , ,149 10, , , ,828 4,344-1,238,492 33,479 33, , ,603 (1) The table does not include dividends from investees or reversals of impairment losses on financial assets and investments. (2) The total also includes indirect subsidiaries. (3) This item includes balances for companies where the relevant amount is not material. As in 2016, no atypical or unusual transactions, having a material impact on the Company s income statement and statement of financial position, were entered into with related parties in
289 There were no non-recurring events and/or transactions in An issuer substitution was completed in This has resulted in Autostrade per l Italia taking Atlantia s place as the issuer of certain bonds entered into by the latter, with a significant impact on the operating results and financial position. More details are provided in note 5.2, Issuer substitution, in the separate financial statements as at and for the year ended 31 December The principal transactions entered into with related parties are described below. Transactions with parents The Company is subject to management and coordination by Atlantia, as also provided for in Atlantia s Corporate Governance Code. A condensed version of Atlantia s approved financial statements, showing key financial indicators, is included in note 10. With regard to transactions relating to tax (note 6.8, Current tax assets and liabilities ), as at 31 December 2017 the Company reports net liabilities due to Atlantia of 68,482 thousand, deriving from its participation in the tax consolidation arrangement headed by the parent. The Company is also owed 5,702 thousand by Sintonia, relating to the expected refund of income tax (IRES) paid during the periods when this company headed the tax consolidation arrangement. In terms of trading relations, the Company provides administrative and financial services, in addition to providing support for activities not relating to its core business (training, welfare, procurement, IT) and financial transactions with Atlantia. With regard to transactions of a financial nature, described in note 6.14, Financial liabilities, the following are outstanding as at 31 December 2017: a) a medium/long-term loan to the Company from Atlantia, amounting to a face value of 1,000,000 thousand. The conditions applicable to the loan replicate those applicable to retail bonds issued by Atlantia in 2012 and maturing in 2018; b) a short-term loan of 500,000 thousand, represented by cash deposited by Atlantia. As a result of the centralised treasury services provided to the Atlantia Group by Autostrade per l Italia, the current account between the latter and Atlantia has a debit balance of 7,448 thousand as at 31 December 2017, as described earlier in note 6.14, Financial liabilities. In addition to the information in the tables included in this section, it should be noted that the Company also distributed a special dividend in kind to Atlantia and a portion of the Reserve for transactions under common control, as described in note 5.1, Restructuring of the Atlantia Group. Relations with Edizione group companies Autostrade per l Italia provides services to a number of subsidiaries, associates and other Atlantia Group companies. The criteria used to determine the related fees take account of the estimated commitment of resources, for each company, broken down by area of activity. In 2017, these contracts primarily regarded the following services: a) administrative, accounting and tax services; b) organisation, management and development of personnel; c) corporate and legal affairs, including the conduct of legal actions; d) the purchase of goods and services and the administration of and accounting for contracts; e) risk management in the mapping of areas of risk, including the analyses required by Legislative Decree 231/01. Autostrade per l Italia also provides treasury, financial, insurance and the related risk management services to its subsidiaries, associates and other Atlantia Group companies. Annual Report
290 Under specific agreements with the Company s Italian motorway subsidiaries and associates, the Company also provides services relating to the recording of traffic data and the settlement of amounts due to and from the operators of interconnecting motorways. Other material transactions involving the purchase of goods and services from subsidiaries, associates and other Atlantia Group companies include the following: a) the activities involved in motorway construction and maintenance contracts with Spea Engineering, including design, project management, supervision and infrastructure inspection services, and with Pavimental for the construction of infrastructure, under the related contracts, and for maintenance and road surfacing; b) relations with Telepass primarily regard a novation agreement by which Telepass collects motorway tolls due to Autostrade per l Italia by way of the Viacard and Telepass deferred toll payment systems; c) the services provided by Autostrade Tech following the spin-off to this company of the business unit responsible for the research, development, production, marketing and operation of technology equipment, systems and services; d) the provision of accounting, credit recovery, human resources, general and real estate services by EsseDiEsse; e) the lease of advertising space along the motorway network to AD Moving. Finally, the Company engages in transactions of a trading nature with Autogrill, with which it shares its ultimate parent, Edizione Srl. As at 31 December 2017, Autogrill holds: a) 98 food service concessions for service areas along the Company s motorway network, including 4 operated in temporary consortia with other companies; b) 9 oil service concessions, including 1 in temporary consortia with other companies. In 2017, the Company s net revenue arising from its relationship with Autogrill amounted to 67,505 thousand, including 62,825 thousand in royalties relating to the management of service areas. This income is generated by contracts entered into over various years, of which a large part was awarded as a result of transparent and non-discriminatory competitive tenders. A further 2,072 thousand was generated by the transfer, free of charge, of buildings located at certain service areas. Transactions of a financial nature include current accounts with Atlantia Group companies as part of the Company s provision of centralised treasury services. The conditions on these accounts are all at arm s length. As at 31 December 2017, the Company has provided medium/long-term loans to the following companies, as described earlier in note 6.4, Financial assets : a) Autostrade Tirrenica, totalling 230,000 thousand, maturing in September 2020; b) Tangenziale di Napoli, totalling 28,941 thousand, maturing in March Disclosures regarding share-based payments In order to incentivise and foster the loyalty of directors and/or employees holding key positions and responsibilities within Atlantia or in Group companies, and to promote and disseminate a value creation culture in all strategic and operational decision-making processes, driving the Group s growth and boosting management efficiency, a number of share incentive plans based on Atlantia s shares have been introduced in previous years. The plans entail payment in the form of shares or cash and are linked to the achievement of predetermined corporate objectives. 290
291 There were no changes, during 2017, in the share-based incentive plans already adopted by the Group as at 31 December 2015 and originally approved by the Annual General Meetings of Atlantia shareholders held on 20 April 2011 (later amended by subsequent Annual General Meetings) and 16 April In addition, two new plans have been approved in These are the 2017 Phantom Share Option Plan and the 2017 Phantom Share Grant Plan and are described below. Finally, on 2 August 2017, the General Meeting of Atlantia s shareholders, held in extraordinary session in order to approve the capital increase and amendments to the articles of association to service the Offer for Abertis, also approved adoption of a supplementary phantom share option plan for a limited number of core people involved in the process of building and creating value at the new Group that will be formed through the Company s integration with Abertis, should the tender offer be successful. Under this supplementary plan (which entails the award of phantom share options free of charge, being options that give beneficiaries the right to payment of a gross amount in cash, computed on the basis of the increase in the value of Atlantia s ordinary shares over a determinate period), no awards were therefore made in Details of each plan are contained in specific information circulars prepared pursuant to art. 84-bis of CONSOB Regulation 11971/1999, as amended, and in Atlantia s Remuneration Report prepared pursuant to art. 123 ter of the Consolidated Finance Act. These documents, to which reference should be made, are published in the Remuneration section of Atlantia s website at The following table shows the main aspects of existing incentive plans as at 31 December 2017, including the options and units awarded to directors and employees of the Atlantia Group and changes during 2017 (in terms of new awards and the exercise, conversion or lapse of rights). The table also shows the fair value (at the grant date) of each option or unit awarded, as determined by a specially appointed expert, using the Monte Carlo model and other assumptions. The amounts have been adjusted for the amendments to the plans originally approved by Atlantia s shareholders, which were required to ensure plan benefits remained substantially unchanged despite the dilution caused by the bonus issues approved by Atlantia s shareholders on 20 April 2011 and 24 April Annual Report
292 Number of options/units awarded (***) Vesting date Exercise / Grant date Exercise price ( ) Fair value of each option or unit at grant date ( ) Expected expiration at grant date (years) Risk free interest rate used Expected volatility (based on historic mean) Expected dividends at grant date 2011 SHARE OPTION PLAN Options outstanding as at 1 January May 2011 grant 279, May May % 25.2% 4.09% - 14 October 2011 grant 13, May May (*) (*) (*) (*) (*) - 14 June 2012 grant 14, May May (*) (*) (*) (*) (*) 345, Jun Jun % 28.0% 5.05% - 8 November 2013 grant 1,592,367 8 Nov Nov % 29.5% 5.62% - 13 May 2014 grant 173,762 N/A (**) 14 May 2017 N/A (**) (**) (**) (**) (**) - 15 June 2015 grant 52,359 N/A (**) 14 Jun 2018 N/A (**) (**) (**) (**) (**) - 8 November 2016 grant 526,965 N/A (**) 9 Nov 2019 N/A (**) (**) (**) (**) (**) - options exercised -981,459 - options lapsed -279,110 Total 1,739,314 Changes in options in options exercised -1,461,216 - options lapsed -50,722 Options outstanding as at 31 December , SHARE GRANT PLAN Units outstanding as at 1 January May 2011 grant 192, May May 2016 N/A ,0-5,0 2.45% 26.3% 4.09% - 14 October 2011 grant 9, May May 2016 N/A (*) (*) (*) (*) (*) - 14 June 2012 grant 10, May May 2016 N/A (*) (*) (*) (*) (*) 348, Jun Jun 2017 N/A ,0-5,0 1.12% 29.9% 5.05% - 8 November 2013 grant 209,420 8 Nov Nov 2018 N/A ,0-5,0 0.69% 28.5% 5.62% - units converted into shares on 15 May ,439 - units converted into shares on 16 May ,197 - units converted into shares on 16 June ,582 - units lapsed -64,120 Total 406,576 Changes in units in units converted into shares on 15 June ,572 - units converted into shares on 13 Nov ,159 - units lapsed -95,509 Units outstanding as at 31 December ,336 MBO SHARE OPTION PLAN Units outstanding as at 1 January May 2012 grant 96,282 14/05/15 14/05/15 N/A % 27.2% 4.55% - 14 June 2012 grant 4,814 14/05/15 14/05/15 N/A (*) (*) (*) (*) (*) - 2 May 2013 grant 41,077 02/05/16 02/05/16 N/A % 27.8% 5.38% - 8 May 2013 grant 49,446 08/05/16 08/05/16 N/A % 27.8% 5.38% - 12 May 2014 grant 61,627 12/05/17 12/05/17 N/A % 28.2% 5.47% - units converted into shares on 15 May ,096 - units converted into shares on 3 May ,077 - units converted into shares on 9 May ,446 Total 61,627 Changes in units in units converted into shares on 15 May ,627 Units outstanding as at 31 December (*) These options and units were awarded as a result of bonus issues by Atlantia and, therefore, do not represent the award of new benefits. (**) These are phantom share options granted in place of certain conditional rights included in the grants of 2011 and 2012 which, therefore, do not represent the award of new benefits. (***) These are options and units awarded to beneficiaries throughout the Atlantia Group and not only to those at Autostrade per l'italia Share Option Plan Description As approved by the Annual General Meeting of Atlantia s shareholders on 20 April 2011, and amended by the Annual General Meeting of Atlantia s shareholders on 30 April 2013 and 16 April 2014, the 2011 Share Option Plan entails the award of up to 2,500,000 options free of charge in three annual award cycles (2011, 2012 and 2013). Each option will grant beneficiaries the right to purchase one ordinary Atlantia share held in treasury, with settlement involving either physical delivery or, at the beneficiary s option, a cash payment equivalent to the proceeds from the sale of the shares on the stock exchange organised and managed by Borsa Italiana SpA, after deduction of the full exercise price. The exercise price is equivalent to the average of the official prices of Atlantia s ordinary shares in the month prior to the date on which Atlantia s Board of Directors announces the beneficiary and the number of options to be awarded. The options granted will vest in accordance with the Plan terms and conditions and, in particular, only if, on expiration of the vesting period (three years from the date of award of the options to beneficiaries by the Board of Directors), cumulative FFO for the three annual reporting periods preceding expiration of the vesting period, adjusted for a number of specific items (total operating cash flow of the Group, Atlantia or of certain of its subsidiaries 292
293 depending on the role held by the various beneficiaries of the Plan), is higher than a preestablished target, unless otherwise decided by the Board of Directors, which has the authority to assign beneficiaries further targets. Vested options may be exercised, in part, from the first day following expiration of the vesting period and, in part, from the end of the first year following expiration of the vesting period and, in any event, in the three years following expiration of the vesting period (subject to the clause in the Plan terms and conditions requiring executive Directors and key management personnel to retain a minimum holding). The maximum number of exercisable options will be calculated on the basis of a mathematical algorithm that takes account, among other things, of the current value and the exercise price, plus any dividends paid, so as to cap the realisable gain. Changes in options in 2017 During 2017, with regard to the second and third award cycles (the vesting periods for both of which have expired), a number of beneficiaries exercised vested options and paid the established exercise price; this entailed the allocation to them of Atlantia s ordinary shares held by the Company as treasury shares. This resulted in the transfer of: a) 33,259 of Atlantia s ordinary shares to beneficiaries in connection with the second cycle. Moreover, 14,774 phantom options awarded in 2015 were exercised; b) 1,016,629 of Atlantia s ordinary shares to beneficiaries in connection with the third cycle, whilst 396,554 phantom options awarded in 2016 were exercised. Thus, as at 31 December 2017, taking into account lapsed options at that date, the remaining options outstanding total 227,376, including 112,644 phantom options awarded under the second and third cycles (the unit fair values of which, as at 31 December 2017 were measured as and 14.22, respectively, in place of the unit fair values at the grant date) Share Grant Plan Description As approved by the Annual General Meeting of Atlantia s shareholders on 20 April 2011, and amended by the Annual General Meeting of Atlantia s shareholders on 30 April 2013, the 2011 Share Grant Plan entails the grant of up to 920,000 units free of charge in three annual award cycles (2011, 2012 and 2013). Each unit will grant beneficiaries the right to receive one Atlantia ordinary share held in treasury, with settlement involving either physical delivery or, at the beneficiary s option, a cash payment equivalent to the proceeds from the sale of the shares on the stock exchange organised and managed by Borsa Italiana SpA. The units granted will vest in accordance with the Plan terms and conditions and, in particular, only if, on expiration of the vesting period (three years from the date the units are granted to beneficiaries by the Board of Directors), cumulative FFO for the three annual reporting periods preceding expiration of the vesting period, adjusted for a number of specific items (total operating cash flow of the Group, Atlantia or of certain of its subsidiaries depending on the role held by the various beneficiaries of the Plan) is higher than a pre-established target, unless otherwise decided by Atlantia s Board of Directors. Vested units may be converted into shares, in part, after one year from the date of expiration of the vesting period and, in part, after two years from the date of expiration of the vesting period (subject to the clause in the Plan terms and conditions requiring executive Directors and key management personnel to maintain a minimum holding). The number of convertible units will be calculated on the basis of a mathematical algorithm that takes account, among other things, of the current value and initial value of the shares so as to cap the realisable gain. Changes in units in 2017 With regard to the second award cycle, the vesting period for which expired on 14 June 2015, on 15 June 2017 vested units were converted, in accordance with the Plan Terms and Conditions, into Atlantia s ordinary shares. As a result, Plan beneficiaries received 136,572 shares held by the Company as treasury shares. The second award cycle for this Plan has thus also expired. Annual Report
294 In addition, in accordance with the Plan Terms and Conditions, on 13 November 2017, a portion of the vested units granted to the beneficiaries of the third award cycle (the vesting period for which expired on 9 November 2017), with beneficiaries receiving 77,159 shares held by the Company as treasury shares. The remaining units will be converted into Atlantia s ordinary shares from 9 November As at 31 December 2017, taking into account lapsed units at that date, the remaining units outstanding total 97,336. MBO Share Grant Plan Description As approved by the Annual General Meetings of Atlantia s shareholders on 20 April 2011 and amended by the Annual General Meetings of 30 April 2013 and 16 April 2014, the MBO Share Grant Plan, serving as part payment of the annual bonus for the achievement of objectives assigned to each beneficiary under the Management by Objectives (MBO) plan adopted by the Atlantia Group in 2011, 2012 and 2013, entails the grant of up to 340,000 units free of charge annually for three years (2012, 2013 and 2014). Each unit will grant beneficiaries the right to receive one ordinary share in Atlantia SpA held in treasury. The units granted (the number of which is based on the unit price of the company s shares at the time of payment of the bonus, and on the size of the bonus effectively awarded on the basis of achievement of the assigned objectives) will vest in accordance with the Plan terms and conditions, on expiration of the vesting period (three years from the date of payment of the annual bonus to beneficiaries, following confirmation that the objectives assigned have been achieved). Vested units will be converted into a maximum number of shares on expiration of the vesting period (subject to the clause in the Plan terms and conditions requiring executive Directors and key management personnel to maintain a minimum holding), on the basis of a mathematical algorithm that takes account, among other things, of the current value and initial value of the shares, plus any dividends paid during the vesting period, so as to cap the realisable gain. Changes in the units in 2017 On March , Atlantia s Board of Directors, exercising the authority provided for in the Plan Terms and Conditions, awarded the plan beneficiaries of the MBO award linked to the objectives for 2013, a gross amount in cash in place of the additional units to be awarded as a result of the payment of dividends during the vesting period. This amount is computed in such a way as to enable beneficiaries to receive a net amount equal to what they would have received in case they had been awarded a number of Atlantia shares equal to the additional units and sold these shares in the market. In addition, on 12 May 2017, the related vesting period expired. In accordance with the Terms and Conditions of this plan, all the units awarded thus vested, resulting in their conversion into Atlantia s ordinary shares and the allocation to beneficiaries of 61,627 shares held by the parent as treasury shares. As at 31 December 2017, all the units awarded under this plan have thus lapsed. The following table shows the main aspects of the cash-settled incentive plans outstanding. The table shows the options awarded to directors and employees of the Company and changes (in terms of new awards and the exercise, conversion or lapse of rights, and transfers or secondments to other Atlantia Group companies) during The table also shows the fair value (at the grant date) of each option awarded, as determined by a specially appointed expert, using the Monte Carlo model and other assumptions. 294
295 Number of options/units awarded (***) Vesting date Exercise/ Grant date Exercise price ( ) Fair value of each option or unit at grant date ( ) Expected expiration at grant date (years) Risk free interest rate used Expected volatility (based on historic mean) Expected dividends at grant date 2014 PHANTOM SHARE OPTION PLAN Options outstanding as at 1 January May 2014 grant 1,244,647 9 May May 2020 N/A (*) ,0-6,0 1.10% 28.9% 5.47% - 8 May 2015 grant 1,258,364 8 May May 2021 N/A (*) ,0-6,0 1.01% 25.8% 5.32% - 10 Jun 2016 grant 1,438, June June 2022 N/A (*) ,0-6,0 0.61% 25.3% 4.94% - transfers/secondments 112,070 - options lapsed -94,905 Total 3,958,966 Changes in options in options exercised -408,903 - transfers/secondments -416,464 - options lapsed -90,986 Options outstanding as at 31 December ,042, PHANTOM SHARE OPTION PLAN Options outstanding as at 1 January Changes in options in May 2017 grant 808,611 1 July July 2023 N/A (*) ,13-6, % 25.6% 4.40% - transfers/secondments 7,369 - options lapsed -22,147 Options outstanding as at 31 December , PHANTOM SHARE GRANT PLAN Options outstanding as at 1 January Changes in options in May 2017 grant 71, June July 2023 N/A (*) ,13-6, % 25.6% 4.40% - transfers/secondments options lapsed -2,206 Options outstanding as at 31 December ,437 (*) Given that these are cash bonus plans, involving payment of a gross amount in cash, the 2014 Phantom Share Option Plan and the 2017 Phantom Share Option Plan do not require an exercise price. However, the Terms and Conditions of the plans indicate an "Exercise price" (equal to the arithmetic mean of Atlantia's share price in a determinate period) as the basis on which to calculate the gross amount to be paid to beneficiaries Phantom Share Option Plan Description On 16 April 2014, the Annual General Meeting of Atlantia s shareholders approved the new incentive plan named the 2014 Phantom Share Option Plan, subsequently approved, within the scope of its responsibilities, by Autostrade per l Italia s Boards of Directors on 13 June The plan entails the award of phantom share options free of charge in three annual award cycles (2014, 2015 and 2016), being options that give beneficiaries the right to payment of a gross amount in cash, computed on the basis of the increase in the value of Atlantia s ordinary shares in the relevant three-year period. In accordance with the Terms and Conditions of the plan, the options granted will only vest if, at the end of the vesting period (equal to three years from the date on which the options were awarded to the beneficiaries by the Board of Directors), a minimum operating/financial performance target for (alternatively) the Group, the Company or for one or more of Autostrade per l Italia s subsidiaries, as indicated for each Plan beneficiary (the hurdle ), has been met or exceeded. The vested options may be exercised from, in part, the first day immediately following the vesting period, with the remaining part exercisable from the end of the first year after the end of the vesting period and, in any event, in the three years after the end of the vesting period (without prejudice to the Terms and Conditions of the plan as regards minimum holding requirements for executive directors and key management personnel). The number of exercisable options is to be computed in application of a mathematical algorithm, taking into account, among other things, the current value, the target value and the exercise price, in order to cap the realisable gain. Changes in options in 2017 The vesting period for the first cycle of the Plan expired on 9 May From this date until 31 December 2017 a total of 408,903 phantom options awarded under the first award cycle were exercised. Annual Report
296 Thus, as at 31 December 2017, taking into account lapsed options at that date, and changes resulting from transfers and/or secondments of staff to and from other Atlantia Group companies, the remaining options outstanding total 3,042,613, including 651,372 phantom options awarded under the first cycle, 1,135,111 phantom options awarded under the second cycle and 1,256,130 phantom options awarded under the third cycle (the unit fair values of which as at 31 December 2017 were measured as 5.63, 3.37 and 3.05, respectively, in place of the unit fair values at the grant date) Phantom Share Option Plan Description On 21 April 2017, the Annual General Meeting of Atlantia s shareholders approved the new incentive plan named the 2017 Phantom Share Option Plan. The Plan entails the award of phantom share options free of charge in three annual award cycles (2017, 2018 and 2019), to be awarded to directors and employees with key roles within the Group. The options grant beneficiaries the right to payment of a gross amount in cash, computed on the basis of the increase in the value of Atlantia s ordinary shares in the relevant period. In accordance with the Terms and Conditions of the Plan, the options granted will only vest if, at the end of the vesting period (15 June 2020 for options awarded in 2017, 15 June 2021 for options awarded in 2018 and 15 June 2022 for options awarded in 2019), one or more minimum operating/financial performance targets for (alternatively) the Group, the Company or one or more of Autostrade per l Italia s subsidiaries, as indicated for each Plan beneficiary (the hurdle ), have been met or exceeded. A portion of the vested options may be exercised from the 1 July immediately following the end of the vesting period, with the remaining options exercisable from the end of the first year after the end of the vesting period and, in any event, in the three years from 1 July of the year in which the vesting period ends (without prejudice to the Terms and Conditions of the Plan as regards minimum holding requirements for executive directors and key management personnel). The number of exercisable options is to be computed in application of a mathematical algorithm, taking into account, among other things, the current value, the target value and the exercise price, in order to cap the realisable gain. Changes in options in 2017 On 12 May 2017, Atlantia s Board of Directors selected the beneficiaries for the first cycle of the Plan in question (subsequently approved, within the scope of its responsibilities, by Autostrade per l Italia s Boards of Directors on 8 June 2017 and then by the boards of its subsidiaries). This resulted in the award of a total of 808,611 phantom options with a vesting period from 12 May 2017 to 15 June 2020 and an exercise period from 1 July 2020 to 30 June As at 31 December 2017, taking into account lapsed options and transfers/secondments from/to other Atlantia Group companies, the remaining options outstanding amount to 793,833. The unit fair value of the options at that date was remeasured as 2.90, in place of the unit fair value at the grant date Phantom Share Grant Plan Description On 21 April 2017, the Annual General Meeting of Atlantia s shareholders approved the new incentive plan named the 2017 Phantom Share Grant Plan. The Plan entails the award of phantom shares free of charge in three annual award cycles (2017, 2018 and 2019), to be awarded to directors and employees with key roles within the Group. The units grant beneficiaries the right to payment of a gross amount in cash, computed on the basis of the value of Atlantia s ordinary shares in the period prior to the period in which the units are awarded. In accordance with the Terms and Conditions of the Plan, the units granted will only vest if, at the end of the vesting period (15 June 2020 for units granted in 2017, 15 June 2021 for units 296
297 granted in 2018 and 15 June 2022 for units granted in 2019), one or more minimum operating/financial performance targets for (alternatively) the Group, the Company or one or more of Autostrade per l Italia s subsidiaries, as indicated for each Plan beneficiary (the hurdle ), have been met or exceeded. A portion of the vested units will be convertible from the 1 July immediately following the end of the vesting period, with the remaining options exercisable from the end of the first year of the exercise period and, in any event, in the three years from 1 July of the year in which the vesting period ends (without prejudice to the Terms and Conditions of the Plan as regards minimum holding requirements for executive directors and key management personnel). The number of exercisable options is to be computed in application of a mathematical algorithm, taking into account, among other things, the current value and initial value of the shares, in order to cap the realisable gain. Changes in units in 2017 On 12 May 2017, Atlantia s Board of Directors selected the beneficiaries for the first cycle of the Plan in question (subsequently approved, within the scope of its responsibilities, by Autostrade per l Italia s Boards of Directors on 8 June 2017 and then by the boards of its subsidiaries). This resulted in the award of a total of 71,909 units, vesting in the period from 12 May 2017 to 15 June 2020 and exercisable in the period from 1 July 2020 to 30 June As at 31 December 2017, taking into account lapsed options and transfers/secondments from/to other Atlantia Group companies, the remaining units outstanding amount to 70,437. The unit fair value of the options at that date was remeasured as 26.44, in place of the unit fair value at the grant date. The prices of Atlantia s ordinary shares in the various periods covered by the above plans are shown below: a) price as at 31 December 2017: 26.43; b) price as at 12 May 2017 (the grant date for new options or units, as described): 24.31; c) the weighted average price for 2017: d) the weighted average price for the period 12 May December 2017: In accordance with the requirements of IFRS 2, as a result of existing plans, in 2017 the Company has recognised staff costs of 10,987 thousand, based on the accrued fair value of the options and units awarded at that date, including 1,887 thousand accounted for as an increase in equity reserves. In contrast, the liabilities represented by phantom share options outstanding as at 31 December 2017 have been recognised in other current and non-current liabilities, based on the assumed exercise date. In addition, the Company has recognised the accrued portion of share-based incentive plans, with regard to the benefits awarded to certain directors and employees at its subsidiaries, in Investments. This amount totals 199 thousand. 9.5 Significant legal and regulatory aspects This section describes the main disputes outstanding and key regulatory aspects in Current disputes are unlikely to give rise to significant charges for the Company, in addition to the provisions already accounted for in the consolidated financial statements as at and for the year ended 31 December Toll increases with effect from 1 January 2017 The Minister of Infrastructure and Transport and Minister of the Economy and Finance issued the related decrees on 30 December 2016, with effect from 1 January 2017 determining that Autostrade per l Italia was to apply a toll increase of 0.64%, compared with the 0.77% requested. The reason given for the reduction with respect to the requested shortfall (equal to 0.13%) was that additional documentation was required in respect of the X and K tariff components. Once these documents had been submitted Autostrade per l Italia, on 21 Annual Report
298 September 2017, the Grantor decided to allow almost all the expenditure detailed in the additional documentation, announcing the need to resubmit the same documents when applying for the toll increase for Toll increases with effect from 1 January 2018 The Minister of Infrastructure and Transport and Minister of the Economy and Finance issued decrees on 29 December 2017, determining that Autostrade per l Italia SpA was to apply a toll increase of 1.51%, including 0.49% as the inflation-linked component, 0.64% to provide a return capital expenditure via the X tariff component and -0.04% to provide a return on investment via the K tariff component (the shortfall in the increase awarded for 2017 was recouped for both these components) and 0.43% to recover the reduction in revenue earned in the period from June 2014 to 2017 as a result of the discounted tolls for frequent motorway users, introduced by the Memorandum of Understanding entered into with the Ministry. The shortfall in the increase with respect to the requested amount, equal to 0.01%, regards the X component. In response, as in 2017, the Company has submitted additional documentation to support its request, with the aim of recouping the shortfall as part of the toll increase for II Addendum to Autostrade per l'italia s Single Concession Arrangement A II Addendum to Autostrade per l Italia s Single Concession Arrangement was signed on 10 July 2017, replacing the previous addendum signed on 10 December 2015, for which the related approval process had not been completed. The Addendum governs the inclusion of the Casalecchio Interchange Northern section among the operator s investment commitments in the Single Concession Arrangement. The project will involve expenditure of up to approximately 158 million, including around 2 million already incurred for design work, and almost 156 million to be paid to ANAS, which will carry out the work and then operate the infrastructure. This amount will be paid to ANAS on a stage of completion basis and under a specific agreement to be executed. The amount will then be recouped by Autostrade per l'italia through the specific K tariff component. During the approval process, the Grantor requested that the document be signed digitally. The Addendum was then signed on 22 February 2018 and will be effective once it has been approved by the Ministry of Infrastructure and Transport and the Ministry of the Economy and Finance, and once the related decree has been registered by Italy s Court of Auditors. Agreement on the upgrade of the existing motorway system/ring road interchange serving Bologna On 15 April 2016, Autostrade per l Italia, the Ministry of Infrastructure and Transport, Emilia- Romagna Regional Authority, the Bologna Metropolitan Authority and the Municipality of Bologna signed an agreement for the upgrade of the existing motorway system/ring road interchange serving the city of Bologna. On 16 December 2016, the signatories to the agreement signed a final memorandum following a public meeting. The memorandum confirms that Autostrade per l Italia has modified the design for the project in full compliance with the principles set out in the agreement, and that it will carry out the work needed to complete the road network connecting the urban and metropolitan area to the new motorway infrastructure. The environmental assessment is expected to come to a conclusion in early 2018 and, following receipt of all the necessary consents, the tender process will begin. Contractual discounts on noise abatement works On 12 June 2017, the Grantor announced that it had determined the extent of the contractual discounts to be applied in relation to 12 noise mitigation schemes contracted out by Autostrade per l'italia to its associate, Pavimental, in
299 Believing the determination to be an error of law, backed up by an authoritative external legal opinion, on 11 September 2017, Autostrade per l'italia lodged a legal challenge before the Regional Administrative Court. Dispute over the Tunnel Safety Plan Phase 2 In the second half of 2017, Autostrade per l Italia initiated an administrative dispute, contesting certain measures adopted by the Ministry of Infrastructure and Transport in relation to Phase 2 of the Tunnel Safety Plan, a project included in Autostrade per l Italia s investment commitments and the cost of which is to be recouped through the X tariff component for investment. In particular, Autostrade per l Italia is contesting the fact that under the measures, Autostrade per l Italia will be liable for any additional costs incurred in carrying out the works provided for in Phase 2 of the Tunnel Safety Plan, over and above the amount referred to in the operator s financial plan, should such additional costs not be recognised during the subsequent five-yearly review of the financial plan. New legislation concerning tenders and concessions The 2018 Budget Law Law 205 of 27 December has amended art. 177 of the Public Contracts Code. The new article requires motorway operators holding a concession not awarded in the form of project financing, or by public tender in accordance with EU law, to award 60% of any contracts for works, services or goods by public tender, instead of the 80% generally applied. ANAC (the Autorità Nazionale Anti Corruzione, Italy s National Anti- Corruption Authority) is in the process of issuing interpretation guidelines for art Expert appraisals of contract variations In the second half of 2017, the Grantor has approved eleven expert appraisals of contract variations, removing numerous items provided for in the expenditure forecasts submitted. Believing such appraisals to be unlawful, Autostrade per l Italia has, therefore, filed legal challenges with the Regional Administrative Court, requesting the cancellation of all or part of the above decisions. Charges payable by motorway operators in accordance with Legislative Decree 35 of 2011 The Ministerial Decree of 7 August 2017 was published Official Gazette no. 250 on 26 October This legislation quantifies the charges to be paid by motorway operators for "the activities involved in overseeing projects, classification of the network and the inspection of existing roads" carried out by the Ministry of Infrastructure and Transport as the Competent Body in accordance with Legislative Decree 35/2011 (the infrastructure safety decree). At this time, the provisions of Legislative Decree 35/2011 require the issue of further legislation, given the Ministry s failure to issue implementing decrees. Despite this, the provisions, in event, represent legal standards to be taken duly into account in the day-to-day operations of motorway operators, during both the design of new works and the management of existing infrastructure. Publication of the decree calculating the charges and establishing the method and terms of payment by operators for the Ministry s activities as the Competent Body, such as the oversight of projects, classification of the network and inspections, is an issue of some importance given that the activities have yet to take place. For this reason, whilst having proceeded to pay the amounts due for 2017 and 2018 expressly reserving the right to request restitution -, Autostrade per l Italia, in common with almost all other motorway operators, lodged an extraordinary appeal with the Head of State on 22 February 2018, challenging the above legislation. This is to avoid the risk that apparent Annual Report
300 acquiescence to the decree could lead the Ministry s inspections to be classified as an activity carried out as a Competent Body with responsibility for infrastructure safety. Discussions between the Ministry of Infrastructure and Transport and the European Commission regarding the extension of Autostrade per l Italia s concession In July 2017, the Ministry of Infrastructure and Transport reached an agreement with the European Commission. The agreement sets out the key conditions to be met in order to grant Autostrade per l Italia a 4-year extension to its concession in return for pre-determined toll increases and recognition of a takeover right on expiry. Press reports dated 28 February 2018 indicate that, following positive developments in is talks with the Ministry of Infrastructure and Transport, the European Commission is about to make a decision on the matter. Once the Commission has made its decision, Autostrade per l'italia will assess the details in order to decide on how to respond. Litigation regarding the Ministry of Infrastructure and Transport and the Ministry for Economic Development decree of 7 August 2015 and competitive tenders for oil and food services at service areas A number of legal challenges have been brought before Lazio Regional Administrative Court by a number of oil and food service providers, and by individual operators, with the aim of contesting a decree issued by the Ministry of Infrastructure and Transport and the Ministry for Economic Development on 7 August This approved the Restructuring Plan for motorway services areas and the competitive tender procedure for the award of concessions at service areas. Two of the challenges remain pending: a) the first, brought by the operator of the Agogna East service area, has been removed from the register by Lazio Regional Administrative Court, and the plaintiff has up to a year from the date of removal from the register to request a date for the case to be heard; b) the second, brought by the operator of the Aglio West service area, requesting a review of judgement 9779 handed down by Lazio Regional Administrative Court on 15 September 2016, which had declared the appellant s challenge inadmissible, is awaiting a date to be set for the hearing on the merits. To complete the picture, hearings on the merits for a further five challenges brought by operators at individual service areas, with the aim of cancelling the above decree issued by Ministry of Infrastructure and Transport and the Ministry for Economic Development, and for another challenge brought by a trade association representing operators have yet to be scheduled. Such hearings have not been requested by the plaintiffs. Accident on the Acqualonga viaduct on the A16 Naples-Canosa motorway on 28 July 2013 With regard to the accident that occurred on 28 July 2013, following completion of the preliminary investigation, the Public Prosecutor s Office in Avellino notified all the employees of Autostrade per l Italia SpA under investigation (twelve people in total, including executives, former managers and employees) of the Public Prosecutor s intention to charge the employees with being accessories to culpable multiple manslaughter and criminal negligence. This was followed by a request from the Public Prosecutor s Office in Avellino to commit all the above accused for trial to answer the above charges. At the initial hearing, held on 22 October 2015, the court admitted the entry of appearance of the civil parties and authorised, at the request of certain of these parties, the citation of Autostrade per l Italia and Reale Mutua Assicurazioni as liable in civil law. 300
301 At the next hearing on 17 December 2015, Autostrade per l Italia SpA and Reale Mutua appeared before the court and the Public Prosecutors concluded their briefs requesting the indictment of all the defendants. At the subsequent hearing on 14 January 2016, the attorneys for the defence and for the civil parties presented their cases. This was followed, on 22 February and 14 March 2016, by hearings at which attorneys for the defence were heard. Having heard the arguments of the Public Prosecutors and the other parties, on 9 May 2016 the judge committed all the accused for trial before a single judge at the Court of Avellino. At the hearing of 9 November 2016, the court ruled on the admissibility of inclusion of the independent experts report previously prepared by the Public Prosecutor s Office and the Public Prosecutor s examination of the witnesses began. At subsequent hearings on 25 November 2016, 7 and 16 December 2016, 13 January 2017 and 3, 17 and 22 February 2017, the examination and cross examination of the witnesses for the prosecution continued. At the hearing held on 10 March 2017, the experts appointed by the Public Prosecutor s Office testified. At the next hearings, held on 31 March 2017 and 21 April 2017, examination of the witnesses for the prosecution came to an end and examination of the witnesses for the defence began. This continued during the hearings of 10 and 26 May 2017, 7 and 28 June 2017, 5 July 2017, 15 and 27 September 2017, and 6 and 18 October This preliminary process will continue during further hearings scheduled for 15 and 22 November The testimonies of the experts appointed by the defendants employed by Autostrade per l Italia were then heard on 6 and 20 December 2017, whilst their cross examination by the public prosecutors began during the hearings held on 24 and 31 January This process will conclude during the hearing to be held on 28 March Examination of the witnesses for the defence continued at the hearings scheduled for 2 and 16 March Finally, hearings have been scheduled for 6, 13 and 30 April 2018 in order to conclude examination of the defendants or for them to make statements to the court. To date, almost all of the civil parties whose entry of appearance in the criminal trial has been admitted have received compensation and have, therefore, withdrawn their actions following payment of their claims by Autostrade per l Italia s insurance provider under the existing general liability policy. In addition to the criminal proceedings, a number of civil actions have been brought by persons not party to the criminal trial. These actions have been combined by the Civil Court of Avellino. Following the combination of the various proceedings, judgement is thus pending before the Civil Court of Avellino in relation to: (i) the original action brought by Reale Mutua Assicurazioni, the company that insured the coach, in order to make the maximum claim payable available to the damaged parties, including Autostrade per l Italia ( 6 million), (ii) subsequent claims, submitted as counterclaims or on an individual basis, by a number of damaged parties, including claims against Autostrade per l Italia. Subject to the permission of the court, Autostrade per l Italia intends to refer claimants to its insurance provider (Swiss Re International), with a view to being indemnified against any claims should it lose the case. At the hearing of 20 October 2016, the court, in accepting the specific requests made by certain parties appearing before the court, appointed an independent expert to assess the psychological trauma caused to the above parties by the loss of close members of their families. During the same hearing, the court appointed further independent experts to reconstruct, among other things, the dynamics of the accident and to assess both its causes and the number of vehicles involved, identifying the victims and preparing a document showing the family relations between these people and the defendants and plaintiffs. Annual Report
302 Autostrade per l Italia has appointed its own experts. The experts began their investigation on 15 November The court subsequently authorised access to a number of mechanical parts from the coach, which is currently under seizure, requesting the intervention of the fire service during the operations scheduled for 22 February 2017 and 10 March On 18 May 2017, the court then rejected the independent experts request to be permitted to carry out further mechanical testing of the coach and adjourned the hearing until 20 July 2017, when the court rejected a request from Autostrade per l Italia s counsel to put the civil action on hold whilst awaiting the outcome of the criminal trial. Subsequently, following submission of the experts draft report on 15 September 2017, the court set a deadline of 30 November 2017 for the experts appointed by the various parties to formulate their observations and adjourned the case until 15 February 2018, when the final report will be examined. In the course of this hearing, the court reserved judgement on the defendants request for new or additional independent expert appraisals, adjourning the case until 19 April 2018 when further counter-arguments will be presented by the Company s expert witnesses. Investigation by the Public Prosecutor s Office in Prato of a fatal accident to a worker employed by Pavimental On 27 August 2014, a worker employed by Pavimental SpA the company contracted by Autostrade per l Italia to carry out work on a section of carriageway on the A1 was involved in a fatal accident whilst at work. In response, the Public Prosecutor s Office in Prato has placed a number of Pavimental personnel under criminal investigation for reckless homicide, alleging violation of occupational health and safety regulations. In December 2014, Autostrade per l Italia received a request for information about the Company, accompanied by a request to appoint a defence counsel and to elect an address for service, as it was under investigation as a juridical person, pursuant to Legislative Decree 231/2001 (the Administrative liability of legal entities ). A similar request for information was received by Pavimental. Autostrade per l Italia has been charged with the offence provided for in art. 25 septies of Legislative Decree 231/2001, as defined in art. 589, paragraph 3 of the penal code ( Culpable homicide resulting from breaches of occupational health and safety regulations ). A similar charge has also been brought against, among others, Autostrade per l Italia s Project Manager. A hearing took place on 5 February 2016, following a request from the Public Prosecutor s Office for a pre-trial hearing for the appointment of experts to reconstruct the dynamics of the fatal accident and apportion liability, including that of companies pursuant to Legislative Decree 231/2001. At the end of the related hearing, during which the companies Organisational, Management and Control Models were examined, the case against the companies was dismissed. The case then proceeded with the focus solely on the charges against the natural persons involved, with the preliminary hearing held on 8 February 2017, when the civil parties appeared before the court and it was requested that the accused be summoned to appear. Hearings were then held on 26 April 2017, to verify settlement of the damages requested by the parties to the civil action, and on 5 July 2017, to withdraw the actions brought by these parties and for any potential requests for an alternative procedure (an accelerated trial ). At the next hearing held on 8 November 2017, the parties concluded their depositions and the hearing was adjourned until 15 November 2017, when the court was to pronounce judgement. At the hearing of 15 November 2017, the court committed Autostrade per l Italia s Project Manager for trial and adjourned the hearing until 15 February 2018, when the parties were to begin 302
303 giving evidence before the court. Due to the absence of the presiding judge, this hearing was then adjourned until 9 July Investigation by the Public Prosecutor s Office in Florence of the state of New Jersey barriers installed on the section of motorway between Barberino and Roncobilaccio On 23 May 2014, the Public Prosecutor s Office in Florence issued an order requiring Autostrade per l Italia to hand over certain documentation, following receipt, on 14 May 2015, of a report from Traffic Police investigators in Florence noting the state of disrepair of the New Jersey barriers on the section of motorway between Barberino and Roncobilaccio. The report alleges negligence on the part of unknown persons, as defined by art. 355, paragraph 2.3 of the penal code (breach of public supply contracts concerning goods or works designed to protect against danger or accidents to the public ). At the same time, the Prosecutor s Office ordered the seizure of the New Jersey barriers located along the right side of the carriageways between Barberino and Roncobilaccio, on ten viaducts, ordering Autostrade per l Italia to take steps to ensure safety on the relevant sections of motorway. This seizure was executed on 28 May In June 2014, Autostrade per l Italia s IV Section Department handed over the requested documents to the Police. The documentation concerns the maintenance work carried out over the years on the safety barriers installed on the above section of motorway. In October 2014, addresses for service were formally nominated for a former General Manager and an executive of Autostrade per l Italia, both under investigation in relation to the crime defined in art. 355 of the penal code. In addition, at the end of November 2014, experts appointed by the Public Prosecutor s Office, together with experts appointed by Autostrade per l Italia, carried out a series of sample tests on the barriers installed on the above motorway section to establish their state of repair. Following the experts tests, the barriers were released from seizure. According to the appointed defence counsel, the Public Prosecutor s Office in Florence has requested that the charges against Autostrade per l Italia s personnel be dropped. This request is currently being assessed by the local office of the preliminary investigating magistrate. Autostrade per l Italia -Autostrade Tech against Alessandro Patanè and companies linked to him and appeals brought before the Civil Court of Rome With regard to the writ served on Mr. Alessandro Patanè and the companies linked to him by Autostrade per l Italia and Autostrade Tech, at the hearing of 16 November 2016, at the Civil Court of Rome, having noted the withdrawal of Mr. Patanè s defence counsel, the court adjourned the proceedings until 30 March 2017, in order to enable the defendant to appoint a new counsel. At this later hearing, having acknowledged the appointment of a new counsel to represent Mr. Patanè, the court declared the action for fraud brought by Mr. Patanè, with regard to certain documents filed by Autostrade per l'italia and Autostrade Tech, to be inadmissible. The judge then adjourned the hearing until 10 January 2018 for admission of the facts. In the meantime, Mr. Patanè has lodged a further action for fraud similar to the previous one. At the hearing of 10 January 2018, the court acknowledged the action. The judges decision on the action for fraud and, therefore, on the admissibility of the action is awaited, the parties having been set a deadline pursuant to art. 190 of the code of civil procedure. Proceedings before the Supreme Court - Autostrade per l Italia versus Craft Srl On 4 November 2015, the First Civil Section of the Supreme Court handed down judgement no , rejecting Autostrade per l Italia s appeal regarding the fact that Craft s patent should be declared null and void and partially annulling the earlier sentence of the Court of Appeal in Rome, referring the case back to this court, to be heard by different judges, following the Annual Report
304 reinstatement of proceedings by one of the parties. The Court of Appeal was asked to provide logical grounds for finding that Autostrade per l Italia has not infringed Craft s patent. On 6 May 2016, Craft notified Autostrade per l Italia of an application for the reinstatement of proceedings before the Court of Appeal, requesting the court, among other things, to rule that Autostrade per l Italia has infringed Craft s patent and to order the former to pay Craft compensation for the resulting damage to its moral and economic rights, calculated by the plaintiff to be approximately 3.5 million, with this sum to be reduced or increased by the court depending on the economic benefits obtained by the defendant. At the first hearing, held on 11 October 2016, the court scheduled a hearing for admission of the facts for 14 March At the hearing of 14 March 2017, the parties admitted the facts and the court reserved judgement, fixing a term pursuant to art. 190 of the code of civil procedure for the submission of closing and reply briefs. Claim for damages from the Ministry of the Environment A criminal case (initiated in 2007) pending before the Court of Florence involves two of Autostrade per l'italia s managers and another 18 people from contractors, who are accused of violating environmental laws relating to the reuse of soil and rocks resulting from excavation work during construction of the Variante di Valico. Between February 2016 and May 2016, all the witnesses and experts called to give evidence by the defence were heard. On conclusion, the court declared the hearing of 19 July 2016 to be the last occasion for the submission of documents. At the hearings held on 5 and 12 December 2016, the defendants wishing to file a deposition were heard. The Public Prosecutor made his closing statement at the hearings held on 6, 13 and 20 February The parties began to make their final depositions at the hearing of 27 March 2017 and this process continued at the hearings of 15 and 22 May 2017 and in June At the hearings of 17 July 2017 and 21 September 2017, the parties concluded their depositions and the hearing was adjourned until 30 October 2017, when the court was to pronounce judgement. At the hearing of 30 October 2017, the court acquitted the two managers from Autostrade per l Italia in accordance with art. 530, paragraph I of the criminal code, based on the fact that there was no case to answer and setting a term of 90 days for the court to file the reasons for its judgement. The deadline for filing the court s reasons for the judgements has been extended until 29 April Investigation by the Public Prosecutor s Office in Vasto of the fatal motorway accident of 21 September 2013 Following the motorway accident of 21 September 2013 at km 450 of the A14, operated by Autostrade per l Italia, in which several people were killed, the Public Prosecutor s Office in Vasto has launched a criminal investigation, initially against persons unknown. On 23 March 2015, the Chief Executive Officer and, later, further two executives of the Company received notice of completion of the investigation, containing a formal notification of charges. The charges relate to negligent cooperation resulting in reckless manslaughter. The Public Prosecutor, following initiatives taken by the defence counsel, has requested that the case be brought to court. Due to irregularities in the writs of summons sent to the defendants, the preliminary hearing was adjourned until 1 March At this hearing, in view of the request for an alternative procedure (an accelerated trial ) from the defence counsel representing the owner of the vehicle, the court adjourned the hearing until 17 May At the end of the last hearing, the court committed all the defendants for trial on 12 October 2016 before a single judge at the 304
305 Court of Vasto. This hearing was adjourned until 24 November 2016 in order to for a new judge to be appointed. At the hearing of 24 November 2016, the parties requested leave to present their evidence to the court. At the hearing held on 23 February 2017, the court began to hear the witnesses for the prosecution, who continued and completed the process of giving evidence at the hearing held on 18 May At the next hearing held on 23 October 2017, the witnesses for the defence were heard and one of them was questioned. At the hearing held on 22 February 2018, the expert witnesses appointed by the counsel for Autostrade per l'italia s defendants were heard. The next hearing has been scheduled for 26 April 2018 to hear public prosecutors request for the court to appoint experts. Investigation by the Public Prosecutor s Office in Savona of the fatal accident suffered by an employee of a sub-contractor on 5 February 2016 Following the above fatal accident, Autostrade per l Italia received notice of completion of the investigation from the Public Prosecutor s Office in Savona, containing charges relating to articles 25-septies, paragraphs 2, 6 and 7 of Legislative Decree 231/2001, in respect of the violation of art. 589, paragraph 2 of the criminal code ( reckless homicide, involving violation of occupational health and safety regulations ). The charges relate to the death, on 5 February 2016, of an employee of S. Guglielmo, a subcontractor working for Pavimental at kilometre of the A10 motorway. The person concerned was working as a security guard at the site at which Autostrade per l Italia had previously contracted noise abatement work along the A10 Genoa-Savona, from kilometre to kilometre Autostrade per l Italia s Project Manager is one of the persons charged with the above violation. On 28 February 2018, the preliminary investing magistrate dismissed the charges against Autostrade per l Italia s Project Manager and the Company pursuant to Legislative Decree 231/2001. Investigation by the Public Prosecutor s Office in Ancona following the collapse of the motorway bridge on the SP10 crossing the A14 Bologna-Taranto motorway On 9 March 2017, the collapse of a bridge on the SP10, as it crosses the A14 motorway at km , caused the deaths of the driver and a passenger in a car and injuries to three workers employed by a sub-contractor of Pavimental SpA, to which Autostrade per l Italia had previously awarded the contract for the widening to three lanes of the Rimini North Porto Sant Elpidio section of the A14 Bologna-Bari-Taranto motorway. Autostrade per l Italia s legal representative was subsequently sent a notice of investigation issued by the Public Prosecutor s Office in Ancona. The investigation regards the alleged offence provided for in articles 25-septies, paragraphs 2 and 3, 6 and 7 of Legislative Decree 231/2001 (Art. 25-septies Culpable homicide and negligent injury or grievous bodily harm resulting from breaches of occupational health and safety regulations ; art. 6 Senior management and the entity s organisational models ; art. 7 Subordinates and the entity s organisational models ) regarding the offences provided for in art. 589, paragraph 2 of the penal code ( Culpable homicide resulting from breaches of occupational health and safety regulations ) and art. 590, paragraph 3 of the penal code ( Culpable injury resulting from breaches of occupational accident prevention ). In connection with this event, a number of Autostrade per l Italia s managers and employees are under investigation pursuant to articles 113, 434, paragraph 2 and 449 of the penal code ( accessory to culpable collapse ), 113 and 589, last paragraph of the penal code ( accessory to culpable multiple manslaughter ), 113 and 590, paragraph 3 of the penal code ( accessory to culpable multiple injury ). The investigations are currently in progress. Annual Report
306 9.6 Events after 31 December 2017 Traffic figures for early 2018 Between the beginning of the year and 18 February (preliminary data), traffic volume using the network was up 5.1%, in particular with heavy vehicles (3 or more axles) up 6.1% and light vehicles (2 axles) rising 4.9%. 306
307 10. KEY INDICATORS EXTRACTED FROM THE MOST RECENT FINANCIAL STATEMENTS OF THE COMPANY EXERCISING MANAGEMENT AND COORDINATION, AS DEFINED BY ART BIS OF THE ITALIAN CIVIL CODE Key indicators extracted from the most recent financial statements of the parent, Atlantia, which exercises management and coordination of the Company, are shown below. These financial statements are available to the public at the Company s registered office or on line in the section Financial statements and reports at KEY INDICATORS EXTRACTED FROM THE MOST RECENT FINANCIAL STATEMENTS OF THE COMPANY EXERCISING MANAGEMENT AND COORDINATION, AS DEFINED BY ART BIS OF THE ITALIAN CIVIL CODE ATLANTIA SpA KEY INDICATORS FROM THE FINANCIAL STATEMENTS AS AT AND FOR THE YEAR ENDED 31 DECEMBER 2016 ( 000) STATEMENT OF FINANCIAL POSITION Non-current assets 12,148,365 Current assets 325,939 Total assets 12,474,304 Equity 9,745,926 of which issued capital 825,784 Non-current liabilities 1,004,963 Current liabilities 1,723,415 Total liabilities and equity 12,474,304 INCOME STATEMENT Operating revenue 2,170 Operating costs -38,690 Operating loss -36,520 Profit for the year 919,230 Annual Report
308 11. PROPOSED APPROPRIATION OF PROFIT FOR THE YEAR FOR AUTOSTRADE PER L ITALIA SPA S ANNUAL GENERAL MEETING Dear Shareholders, In conclusion, we invite you: a) to approve the financial statements as at and for the year ended 31 December 2017, which report profit of 968,016,188.98, having taken note of the accompanying documents; b) to appropriate the 517,668, in profit for the year remaining, after payment of the interim dividend of 450,347, (equal to per share) in 2017, as follows: 1) 517,526, to pay a final dividend of per share, payable to holders of each of the 622,027,000 dividend-bearing shares with a par value of 1.00 in issue; 2) the remaining 142, to retained earnings; c) to establish the dividend payment date as 16 May ) For the Board of Directors The Chairman 308
309 ANNEXES TO THE FINANCIAL STATEMENTS Annex 1 - Disclosures pursuant to art.149-duodecies of the CONSOB Regulation for Issuers 11971/1999 Annex 2 - Traffic figures (pursuant to the CIPE Resolution of 20 December 1996) Annex 3 - Table of investment required by art. 2 of the Single Concession Arrangement of 2007 Annex 4 - Subsidiaries, associates and joint ventures accounted for using the equity method (article 3, point 1.1 of the 2007 Single Concession Arrangement) The above annexes are unaudited. Annual Report
310 Annex 1 Disclosures pursuant to art.149-duodecies of the CONSOB Regulation for Issuers 11971/1999 Autostrade per l'italia SpA Audit Certification Other services Other services Type of service Provider of service Note Fees ( 000) Parent Company's auditor 207 Parent Company's auditor (1) 23 Parent Company's auditor (2) 44 Associate of Parent Company's auditor (3) 28 Total 302 (1) Opinion on payment of the interim dividends. (2) Signature of consolidated and 770 tax forms, comfort letter on offering circular and agreed upon procedures for data and accounting information. (3) Audit of internal control system. 310
311 Annex 2 Traffic figures (pursuant to the CIPE Resolution of 20 December 1996) The figures for toll paid kilometres travelled shown in the following tables relate to traffic during the year paying the additional toll, calculated on the number of kilometres travelled by each vehicle using the motorway infrastructure, to be paid to ANAS pursuant to Law 102/2009, as amended, which abolished the previous surcharge introduced by art. 15 of Law 531/1982, as amended by Law 407/1990. These figures, therefore, in addition to not including non-paying traffic, also exclude traffic that failed to pay the required toll and that was only recorded when the toll was subsequently paid. The following are categories of non-paying traffic: traffic exempted by agreement or for operational reasons (company vehicles, motorway police, ACI, which provides breakdown services, emergency vehicles and employees travelling to work); estimates traffic during toll collectors strikes; and other non-paying traffic (users who fail to pay the required toll, etc.). The kilometres travelled on Autostrade per l Italia s network, as reported in the sub-section Traffic, in section 2.5, Group operating review in the Report on operations, regard all traffic using the network, including traffic for which the relevant toll was not paid, recognised at the time effective use of the motorway is recorded. Annual Report
312 AUTOSTRADE PER L'ITALIA: WHOLE NETWORK YEAR: 2017 TOLL PAYING TRAFFIC BY MONTH (in thousands of kilometres travelled) Toll class Total Month A B Low ground High ground Low ground High ground Low ground High ground Low ground High ground Low ground High ground Low ground High ground Overall January 2,039, , ,201 45,060 41,237 7,047 32,035 6, ,803 69,590 2,654, ,089 3,181,334 February 1,919, , ,244 47,217 44,564 7,519 34,713 7, ,090 74,135 2,572, ,989 3,079,647 March 2,247, , ,577 58,218 53,981 9,249 40,271 8, ,754 86,990 3,023, ,198 3,621,965 April 2,569, , ,824 59,149 50,001 9,258 33,459 7, ,929 71,828 3,254, ,512 3,933,465 May 2,464, , ,584 63,713 58,877 10,850 39,257 8, ,093 85,701 3,263, ,177 3,921,902 June 2,737, , ,338 65,427 60,448 12,212 38,069 8, ,671 81,947 3,518, ,174 4,269,028 July 3,229, , ,172 66,497 64,742 13,239 38,210 7, ,180 82,581 4,027, ,166 4,901,577 August 3,378, , ,138 59,620 54,953 12,052 28,054 5, ,814 69,432 4,028, ,293 4,925,318 September 2,696, , ,921 64,181 60,061 12,026 39,077 8, ,591 83,174 3,478, ,239 4,203,268 October 2,465, , ,267 61,507 58,111 10,488 39,982 8, ,221 84,176 3,255, ,847 3,907,325 November 2,188, , ,518 53,436 52,990 9,291 39,313 8, ,526 84,386 2,933, ,613 3,502,777 December 2,416, , ,711 50,221 47,804 8,364 34,000 6, ,836 70,580 3,074, ,338 3,678,199 YEAR 30,352,958 6,188,843 3,488, , , , ,440 91,431 4,159, ,520 39,085,170 8,040,635 47,125,805 MOTORWAY: MILAN - NAPLES SECTION: A1 MILAN-BOLOGNA YEAR: 2017 TOLL PAYING TRAFFIC BY MONTH (in thousands of kilometres travelled) Toll class Total Month A B Low ground High ground Low ground High ground Low ground High ground Low ground High ground Low ground High ground Low ground High ground Overall January 285,879-33,399-7,393-6,572-59, , ,472 February 274,201-35,286-8,101-7,111-63, , ,235 March 330,210-43,792-9,768-8,179-74, , ,542 April 378,476-41,931-8,746-6,672-60, , ,054 May 363,174-46,657-10,381-7,979-73, , ,832 June 415,907-46,719-10,415-7,706-70, , ,772 July 478,693-46,722-11,214-7,685-69, , ,068 August 475,489-38,632-9,425-5,723-54, , ,767 September 401,164-48,275-10,420-8,103-70, , ,983 October 358,739-46,581-10,125-8,265-72, , ,559 November 317,882-41,920-9,088-8,284-71, , ,565 December 335,203-37,804-7,982-7,106-60, , ,393 YEAR 4,415, , ,058-89, ,064-5,925,242-5,925,242 MOTORWAY: MILAN - NAPLES SECTION: A1 BOLOGNA-FLORENCE YEAR: 2017 TOLL PAYING TRAFFIC BY MONTH (in thousands of kilometres travelled) Toll class Total Month A B Low ground High ground Low ground High ground Low ground High ground Low ground High ground Low ground High ground Low ground High ground Overall January 98 88, , , , , , ,240 February 90 77, , , , , , ,329 March , , , , , , ,615 April , , , , , , ,713 May , , , , , , ,396 June , , , , , , ,792 July , , , , , , ,179 August , , , , , , ,732 September , , , , , , ,288 October , , , , , , ,436 November 99 90, , , , , , ,537 December , , , , , , ,927 YEAR 1,218 1,305, , , , ,983 1,479 1,849,705 1,851,184 MOTORWAY: MILAN - NAPLES SECTION: A1 FLORENCE-ROME YEAR: 2017 TOLL PAYING TRAFFIC BY MONTH (in thousands of kilometres travelled) Toll class Total Month A B Low ground High ground Low ground High ground Low ground High ground Low ground High ground Low ground High ground Low ground High ground Overall January 260,447-31,690-5,231-6,061-51, , ,211 February 228,778-32,122-5,386-6,440-53, , ,922 March 267,292-38,802-6,656-7,590-63, , ,363 April 325,012-38,686-6,669-6,285-51, , ,517 May 294,278-42,188-7,428-7,251-61, , ,279 June 313,613-41,131-7,364-7,097-58, , ,833 July 364,190-41,923-7,708-7,127-58, , ,545 August 428,500-35,830-6,797-5,160-46, , ,329 September 322,016-41,161-7,468-7,447-57, , ,443 October 299,588-41,302-7,321-7,614-59, , ,559 November 263,583-36,633-6,570-7,433-60, , ,408 December 320,295-35,510-6,192-6,699-52, , ,460 YEAR 3,687, ,978-80,790-82, ,305-4,981,869-4,981,
313 MOTORWAY: MILAN - NAPLES SECTION: A1 FIANO-SAN CESAREO YEAR: 2017 TOLL PAYING TRAFFIC BY MONTH (in thousands of kilometres travelled) Toll class Total Month A B Low ground High ground Low ground High ground Low ground High ground Low ground High ground Low ground High ground Low ground High ground Overall January 14,996 12,491 2,181 1, ,868 2,378 22,986 17,103 40,089 February 12,152 11,025 2,217 1, ,064 2,478 20,418 15,789 36,207 March 14,301 12,780 2,665 2, ,925 2,887 24,051 18,391 42,442 April 20,135 15,714 2,752 2, ,916 2,392 28,842 20,701 49,543 May 16,767 14,506 2,919 2, ,818 2,848 26,663 20,247 46,910 June 18,924 15,618 2,830 2, ,584 2,726 28,494 21,155 49,649 July 23,370 18,303 2,879 2, ,524 2,667 32,954 23,830 56,784 August 32,953 21,278 2,555 1, ,334 2,103 40,806 25,818 66,624 September 20,096 15,921 2,838 2, ,454 2,643 29,580 21,362 50,942 October 17,389 14,805 2,851 2, ,592 2,726 27,026 20,392 47,418 November 14,844 13,106 2,534 1, ,608 2,723 24,139 18,453 42,592 December 20,251 15,786 2,584 1, ,958 2,411 28,895 20,730 49,625 YEAR 226, ,333 31,805 23,946 7,039 4,424 6,187 3,286 63,645 30, , , ,825 MOTORWAY: MILAN - NAPLES SECTION: A1 ROME-NAPLES YEAR: 2017 TOLL PAYING TRAFFIC BY MONTH (in thousands of kilometres travelled) Toll class Total Month A B Low ground High ground Low ground High ground Low ground High ground Low ground High ground Low ground High ground Low ground High ground Overall January 263,447-28,370-4,296-3,634-32, , ,663 February 236,409-28,789-4,341-3,855-34, , ,771 March 272,989-34,654-5,119-4,501-39, , ,004 April 320,876-33,894-4,758-3,800-33, , ,376 May 302,554-37,682-5,414-4,431-39, , ,767 June 321,927-35,925-5,775-4,242-38, , ,233 July 374,488-36,775-6,042-4,358-38, , ,549 August 420,969-31,893-5,455-3,131-32, , ,620 September 324,605-35,346-5,855-4,389-37, , ,104 October 304,072-35,900-5,874-4,396-38, , ,682 November 272,578-32,126-5,600-4,210-37, , ,343 December 323,738-31,098-5,353-3,746-33, , ,670 YEAR 3,738, ,452-63,882-48, ,103-4,690,782-4,690,782 MOTORWAY: TURIN -TRIESTE SECTION: A4 MILAN-BRESCIA YEAR: 2017 TOLL PAYING TRAFFIC BY MONTH (in thousands of kilometres travelled) Toll class Total Month A B Low ground High ground Low ground High ground Low ground High ground Low ground High ground Low ground High ground Low ground High ground Overall January 216,393-27,981-4,516-1,990-25, , ,422 February 208,478-29,954-4,897-2,222-27, , ,881 March 239,234-35,762-5,870-2,679-32, , ,575 April 251,792-32,113-5,119-2,243-25, , ,993 May 251,651-36,798-6,069-2,690-31, , ,578 June 253,193-35,265-6,035-2,551-29, , ,032 July 280,034-35,777-6,483-2,563-29, , ,825 August 243,528-27,323-4,759-1,754-21, , ,496 September 253,364-35,068-5,977-2,619-30, , ,335 October 258,443-36,532-5,960-2,737-31, , ,618 November 228,731-33,379-5,378-2,619-30, , ,998 December 234,959-29,590-4,420-2,161-24, , ,585 YEAR 2,919, ,542-65,483-28, ,685-3,750,338-3,750,338 MOTORWAY: MILAN - SERRAVALLE - GENOA SECTION: A7 SERRAVALLE-GENOA YEAR: 2017 TOLL PAYING TRAFFIC BY MONTH (in thousands of kilometres travelled) Toll class Total Month A B Low ground High ground Low ground High ground Low ground High ground Low ground High ground Low ground High ground Low ground High ground Overall January - 33,131-3, ,043-42,422 42,422 February - 30,597-3, ,315-40,305 40,305 March - 36,539-4, ,174-48,015 48,015 April - 42,366-3, ,071-52,271 52,271 May - 39,516-4, ,170-51,176 51,176 June - 45,017-4, ,931-56,379 56,379 July - 51,072-4, ,879-62,417 62,417 August - 45,484-3, ,733-54,806 54,806 September - 42,647-4, ,674-53,696 53,696 October - 40,248-4, ,768-51,414 51,414 November - 34,811-3, ,044-45,747 45,747 December - 34,713-3, ,936-44,006 44,006 YEAR - 476,141-45,698-8,072-6,005-66, , ,654 Annual Report
314 MOTORWAY: MILAN - LAKES SECTION: A8/A9 MILAN-LAKES YEAR: 2017 TOLL PAYING TRAFFIC BY MONTH (in thousands of kilometres travelled) Toll class Total Month A B Low ground High ground Low ground High ground Low ground High ground Low ground High ground Low ground High ground Low ground High ground Overall January 152,899 9,453 12, , , ,426 10, ,051 February 146,934 8,858 13, , , ,004 10, ,124 March 170,683 10,499 16, , , , ,540 12, ,594 April 174,799 12,094 15, , , ,476 13, ,159 May 180,230 11,973 17, , , , ,020 13, ,760 June 180,406 12,460 17, , , , ,558 14, ,860 July 196,950 14,979 17,224 1,008 2, , , ,802 16, ,727 August 155,443 12,782 12, , , ,578 14, ,991 September 181,170 12,732 17,383 1,056 2, , , ,656 14, ,335 October 185,214 12,275 17, , , , ,261 14, ,346 November 167,208 10,236 15, , , , ,759 11, ,478 December 166,509 10,545 13, , , ,855 11, ,667 YEAR 2,058, , ,204 10,023 27,123 1,912 11, ,580 6,468 2,380, ,157 2,539,092 MOTORWAY: A08/A26 SECTION: A8/A26 GALLARATE-GATTICO SPUR TOLL PAYING TRAFFIC BY MONTH (in thousands of kilometres travelled) Toll class Total Month A B Low ground High ground Low ground High ground Low ground High ground Low ground High ground Low ground High ground Low ground High ground Overall January 22,082 8,345 2, , ,591 9,744 35,335 February 21,202 7,812 2, , ,097 9,371 34,468 March 25,351 9,294 2,734 1, , ,136 11,219 41,355 April 28,123 10,898 2,534 1, , ,372 12,662 45,034 May 27,230 10,064 2,871 1, , ,161 12,088 44,249 June 29,499 11,178 2,820 1, , ,344 13,180 47,524 July 32,549 12,758 2,881 1, , ,485 14,811 52,296 August 27,211 11,513 1, ,542 12,939 43,481 September 27,384 10,630 2,706 1, , ,019 12,540 44,559 October 28,017 10,617 2,822 1, , ,929 12,612 45,541 November 24,185 9,008 2,553 1, , ,699 10,836 39,535 December 24,421 9,332 2, , ,117 10,811 38,928 YEAR 317, ,449 30,294 12,058 4,599 1,798 1, ,735 6, , , ,305 MOTORWAY: GENOA-VENTIMIGLIA SECTION: A10 GENOA-SAVONA YEAR: 2017 TOLL PAYING TRAFFIC BY MONTH (in thousands of kilometres travelled) Toll class Total Month A B Low ground High ground Low ground High ground Low ground High ground Low ground High ground Low ground High ground Low ground High ground Overall January - 47,201-4, ,921-58,583 58,583 February - 44,368-4, ,327-56,373 56,373 March - 51,270-5, ,466-65,782 65,782 April - 60,876-5, ,226-74,093 74,093 May - 57,426-6, ,156-72,077 72,077 June - 67,428-6, ,733-81,737 81,737 July - 81,032-6, ,620-95,385 95,385 August - 82,327-5, ,273-94,571 94,571 September - 61,333-5, ,552-75,040 75,040 October - 55,064-5, ,914-68,939 68,939 November - 46,928-4, ,082-60,141 60,141 December - 49,672-4, ,683-60,931 60,931 YEAR - 704,925-65,801-8,525-6,448-77, , ,652 MOTORWAY: A11 FLORENCE - PISA NORTH SECTION: A11 FLORENCE-COAST YEAR: 2017 TOLL PAYING TRAFFIC BY MONTH (in thousands of kilometres travelled) Toll class Total Month A B Low ground High ground Low ground High ground Low ground High ground Low ground High ground Low ground High ground Low ground High ground Overall January 89, , , , , ,924 February 86, , , , , ,545 March 100, , , , , ,382 April 107, , , , , ,232 May 108, , , , , ,425 June 119, , , , , ,467 July 132, , , , , ,768 August 120, , , , , ,017 September 109, , , , , ,859 October 105, , , , , ,284 November 96, , , , , ,128 December 95, , , , , ,679 YEAR 1,271, , , , , ,513,585 1,125 1,514,
315 MOTORWAY: GENOA-LIVORNO-CIVITAVEC.-ROME SECTION: A12 GENOA-SESTRI YEAR: 2017 TOLL PAYING TRAFFIC BY MONTH (in thousands of kilometres travelled) Toll class Total Month A B Low ground High ground Low ground High ground Low ground High ground Low ground High ground Low ground High ground Low ground High ground Overall January - 49,606-4, ,221-58,634 58,634 February - 47,213-5, ,424-56,671 56,671 March - 55,633-6, ,053-67,227 67,227 April - 64,428-6, ,419-75,067 75,067 May - 61,563-6, ,963-73,546 73,546 June - 67,400-6, ,719-79,053 79,053 July - 77,629-6, ,664-89,346 89,346 August - 77,435-6, ,984-87,586 87,586 September - 63,778-6, ,676-74,976 74,976 October - 59,493-6, ,846-70,735 70,735 November - 52,059-5, ,884-62,556 62,556 December - 53,080-5, ,140-62,181 62,181 YEAR - 729,317-71,883-7,886-5,499-42, , ,578 MOTORWAY: GENOA-LIVORNO-CIVITAVEC.-ROME SECTION: A12 ROME-CIVITAVECCHIA YEAR: 2017 TOLL PAYING TRAFFIC BY MONTH (in thousands of kilometres travelled) Toll class Total Month A B Low ground High ground Low ground High ground Low ground High ground Low ground High ground Low ground High ground Low ground High ground Overall January 34,568-2, ,300-40,287-40,287 February 33,468-2, ,439-39,430-39,430 March 39,755-3, ,779-46,934-46,934 April 47,575-3, ,312-54,615-54,615 May 47,603-4, ,744-55,949-55,949 June 57,621-4, ,704-66,125-66,125 July 69,587-4, ,686-78,241-78,241 August 67,550-4, ,619-75,428-75,428 September 48,075-4, ,614-55,928-55,928 October 43,427-4, ,641-51,204-51,204 November 37,332-3, ,620-44,124-44,124 December 38,729-2, ,058-44,476-44,476 YEAR 565,290-46,474-5,508-4,953-30, , ,741 MOTORWAY: BOLOGNA - PADUA SECTION: A13 BOLOGNA-PADUA YEAR: 2017 TOLL PAYING TRAFFIC BY MONTH (in thousands of kilometres travelled) Toll class Total Month A B Low ground High ground Low ground High ground Low ground High ground Low ground High ground Low ground High ground Low ground High ground Overall January 104,368-13,584-2,588-1,781-17, , ,089 February 101,435-14,277-2,874-1,814-19, , ,485 March 119,667-17,570-3,520-2,109-22, , ,443 April 126,942-17,011-3,243-1,782-18, , ,553 May 125,877-19,077-3,682-2,042-22, , ,348 June 133,977-18,842-3,695-2,040-22, , ,560 July 149,439-19,202-3,954-2,082-22, , ,450 August 145,726-16,317-3,222-1,633-18, , ,973 September 135,819-18,691-3,674-2,113-22, , ,469 October 128,148-18,612-3,575-2,130-22, , ,248 November 113,577-16,476-3,206-2,125-22, , ,659 December 118,754-15,075-2,885-1,830-18, , ,314 YEAR 1,503, ,734-40,118-23, ,529-2,021,591-2,021,591 MOTORWAY: BOLOGNA - TARANTO SECTION: A14 RAVENNA SPUR YEAR: 2017 TOLL PAYING TRAFFIC BY MONTH (in thousands of kilometres travelled) Toll class Total Month A B Low ground High ground Low ground High ground Low ground High ground Low ground High ground Low ground High ground Low ground High ground Overall January 8, ,898-11,763-11,763 February 8, ,127-12,189-12,189 March 11,259-1, ,482-15,138-15,138 April 13,022-1, ,916-16,277-16,277 May 13,091-1, ,481-17,149-17,149 June 16,404-1, ,182-20,149-20,149 July 18,393-1, ,138-22,120-22,120 August 16,306-1, ,576-19,220-19,220 September 12,542-1, ,180-16,154-16,154 October 10,985-1, ,394-14,773-14,773 November 9, ,380-13,323-13,323 December 9, ,829-12,403-12,403 YEAR 148,887-12,875-2,194-1,119-25, , ,658 Annual Report
316 MOTORWAY: BOLOGNA - TARANTO SECTION: A14 BOLOGNA-ANCONA YEAR: 2017 TOLL PAYING TRAFFIC BY MONTH (in thousands of kilometres travelled) Toll class Total Month A B Low ground High ground Low ground High ground Low ground High ground Low ground High ground Low ground High ground Low ground High ground Overall January 263,481-30,773-6,299-4,452-46, , ,946 February 249,625-32,281-7,103-4,848-51, , ,580 March 297,062-39,165-8,740-5,438-60, , ,591 April 351,513-38,649-7,970-4,550-49, , ,755 May 333,404-43,079-9,494-5,327-59, , ,858 June 408,304-44,478-9,704-5,159-56, , ,626 July 500,414-46,580-10,524-5,184-58, , ,831 August 532,260-40,799-8,832-3,918-45, , ,850 September 382,681-44,049-9,513-5,264-58, , ,522 October 316,899-41,216-9,093-5,380-60, , ,638 November 282,373-36,979-8,275-5,334-58, , ,130 December 311,646-34,072-7,454-4,514-49, , ,741 YEAR 4,229, , ,001-59, ,917-5,517,068-5,517,068 MOTORWAY: BOLOGNA - TARANTO SECTION: A14 ANCONA-PESCARA YEAR: 2017 TOLL PAYING TRAFFIC BY MONTH (in thousands of kilometres travelled) Toll class Total Month A B Low ground High ground Low ground High ground Low ground High ground Low ground High ground Low ground High ground Low ground High ground Overall January 86,566-11,154-2,136-1,726-15, , ,395 February 88,299-12,696-2,485-2,008-18, , ,820 March 102,058-15,191-2,997-2,255-21, , ,706 April 122,006-14,561-2,715-1,879-17, , ,455 May 113,884-16,368-3,426-2,154-21, , ,943 June 130,514-17,054-3,415-2,101-20, , ,427 July 171,878-18,468-3,593-2,101-20, , ,868 August 204,229-16,947-3,151-1,564-16, , ,656 September 134,644-16,624-3,228-2,131-21, , ,695 October 114,428-16,044-3,217-2,221-21, , ,333 November 102,539-14,549-3,078-2,141-20, , ,187 December 117,809-13,422-2,873-1,836-17, , ,918 YEAR 1,488, ,078-36,314-24, ,040-1,965,403-1,965,403 MOTORWAY: BOLOGNA - TARANTO SECTION: A14 PESCARA-LANCIANO YEAR: 2017 TOLL PAYING TRAFFIC BY MONTH (in thousands of kilometres travelled) Toll class Total Month A B Low ground High ground Low ground High ground Low ground High ground Low ground High ground Low ground High ground Low ground High ground Overall January 6,919 15, , ,577 2,964 9,807 21,180 30,987 February 7,197 16,455 1,148 2, ,878 3,528 10,659 23,156 33,815 March 8,430 19,021 1,381 2, ,184 4,080 12,510 26,885 39,395 April 10,428 22,743 1,325 2, ,757 3,240 13,955 29,498 43,453 May 9,476 20,971 1,497 3, ,140 4,012 13,647 29,037 42,684 June 11,354 24,543 1,560 3, ,086 3,856 15,536 32,580 48,116 July 15,794 33,762 1,708 3, ,126 3,932 20,181 42,208 62,389 August 20,085 42,903 1,629 3, ,730 3,193 23,911 50,346 74,257 September 11,587 26,047 1,484 3, ,152 3,984 15,738 34,133 49,871 October 9,462 21,171 1,466 2, ,206 4,065 13,666 29,201 42,867 November 8,554 18,972 1,324 2, ,144 3,947 12,536 26,539 39,075 December 10,304 22,892 1,243 2, ,856 3,444 13,860 29,755 43,615 YEAR 129, ,033 16,717 34,191 3,363 6,393 2,500 4,656 23,836 44, , , ,524 MOTORWAY: BOLOGNA - TARANTO SECTION: A14 LANCIANO-CANOSA YEAR: 2017 TOLL PAYING TRAFFIC BY MONTH (in thousands of kilometres travelled) Toll class Total Month A B Low ground High ground Low ground High ground Low ground High ground Low ground High ground Low ground High ground Low ground High ground Overall January 31,797 14,107 3,763 1, ,806 3,444 43,752 20,198 63,950 February 26,972 13,893 4,134 2, ,618 4,018 40,331 20,984 61,315 March 31,105 15,897 4,868 2, ,765 4,602 46,612 24,140 70,752 April 45,621 20,906 5,249 2, ,216 3,703 59,790 28,125 87,915 May 38,452 18,391 5,532 2,954 1, ,662 4,528 54,738 26,919 81,657 June 52,679 22,986 5,964 3,125 1, ,508 4,381 69,278 31, ,822 July 83,171 33,405 6,829 3,446 1, ,681 4, ,992 42, ,504 August 119,312 45,117 7,198 3,431 1, ,254 3, ,859 53, ,273 September 57,854 24,782 5,989 3,077 1, ,026 4,694 75,046 33, ,782 October 38,987 18,631 5,447 2,901 1, ,033 4,758 55,545 27,443 82,988 November 32,685 16,395 4,662 2,566 1, ,823 4,651 48,177 24,774 72,951 December 47,128 21,224 4,798 2,444 1, ,989 4,033 61,829 28,727 90,556 YEAR 605, ,734 64,433 33,349 13,564 7,252 9,808 5,073 98,381 51, , ,516 1,154,
317 MOTORWAY: BOLOGNA - TARANTO SECTION: A14 CANOSA-TARANTO YEAR: 2017 TOLL PAYING TRAFFIC BY MONTH (in thousands of kilometres travelled) Toll class Total Month A B Low ground High ground Low ground High ground Low ground High ground Low ground High ground Low ground High ground Low ground High ground Overall January 32,523-3, ,427-41,864-41,864 February 29,469-3, ,330-38,797-38,797 March 33,780-4, ,895-44,522-44,522 April 42,903-4, ,101-52,886-52,886 May 39,362-5, ,932-50,899-50,899 June 49,139-5, ,746-60,387-60,387 July 71,712-5,623-1, ,956-83,900-83,900 August 97,250-5,709-1, , , ,688 September 52,955-5,149-1, ,012-64,675-64,675 October 40,851-4, ,064-52,449-52,449 November 34,856-4, ,960-45,811-45,811 December 43,936-4, ,609-54,447-54,447 YEAR 568,736-57,722-10,204-6,402-56, , ,325 MOTORWAY: NAPLES - CANOSA SECTION: A16 NAPLES-CANOSA YEAR: 2017 TOLL PAYING TRAFFIC BY MONTH (in thousands of kilometres travelled) Toll class Total Month A B Low ground High ground Low ground High ground Low ground High ground Low ground High ground Low ground High ground Low ground High ground Overall January 32,949 33,675 3,544 4, ,686 5,406 40,111 45,240 85,351 February 34,410 35,708 3,802 5, ,752 5,593 41,927 48,078 90,005 March 39,662 40,929 4,573 6, , ,234 6,542 48,606 55, ,167 April 43,057 48,300 4,215 6, ,700 5,308 50,929 61, ,188 May 42,873 45,930 4,770 6, , ,287 6,486 52,110 61, ,171 June 45,837 49,118 4,570 6, , ,343 6,228 55,029 63, ,446 July 51,194 57,065 4,631 6, , ,423 7,073 60,581 72, ,816 August 51,484 67,598 3,939 5, , ,031 9,990 59,582 84, ,456 September 46,090 49,899 4,770 6, , ,503 8,703 55,723 67, ,747 October 46,415 47,521 4,925 6, , ,471 6,629 56,194 62, ,991 November 42,543 42,472 4,649 6, , ,314 6,528 51,789 57, ,792 December 44,347 47,051 4,296 5, , ,015 5,724 52,851 60, ,073 YEAR 520, ,266 52,684 73,743 9,621 13,378 4,507 6,174 37,759 80, , ,771 1,364,203 MOTORWAY: UDINE - TARVISIO SECTION: A23 UDINE-TARVISIO YEAR: 2017 TOLL PAYING TRAFFIC BY MONTH (in thousands of kilometres travelled) Toll class Total Month A B Low ground High ground Low ground High ground Low ground High ground Low ground High ground Low ground High ground Low ground High ground Overall January 12,940 8,262 1,504 1, ,378 4,813 18,157 14,654 32,811 February 11,558 6,767 1,576 1, ,698 5,189 17,216 13,644 30,860 March 12,524 7,408 1,903 1, ,278 5,987 19,191 15,496 34,687 April 15,056 11,707 2,144 2, ,612 5,133 21,380 19,652 41,032 May 16,994 13,750 2,531 2, ,220 5,951 24,508 23,042 47,550 June 25,563 24,743 3,109 3,255 1,013 1, ,022 5,760 34,016 35,437 69,453 July 31,914 31,698 3,237 3,389 1,202 1, ,046 5,833 40,727 42,883 83,610 August 33,303 33,441 3,170 3,391 1,209 1, ,316 4,785 41,271 43,544 84,815 September 23,444 22,241 2,963 3, , ,948 5,656 31,455 32,370 63,825 October 14,621 9,836 2,144 1, ,318 6,258 21,670 18,676 40,346 November 11,196 6,597 1,695 1, ,245 6,129 17,621 14,670 32,291 December 14,606 9,804 1,633 1, ,335 4,770 19,982 16,441 36,423 YEAR 223, ,254 27,609 26,756 6,231 7,359 3,219 3,876 46,416 66, , , ,703 MOTORWAY: GENOA VOLTRI-GRAVELLONA TOCE SECTION: A26 VOLTRI-ALESSANDRIA YEAR: 2017 TOLL PAYING TRAFFIC BY MONTH (in thousands of kilometres travelled) Toll class Total Month A B Low ground High ground Low ground High ground Low ground High ground Low ground High ground Low ground High ground Low ground High ground Overall January - 47,571-4, ,828-65,826 65,826 February - 42,592-4, ,603-61,843 61,843 March - 51,850-6, ,091-14,702-74,968 74,968 April - 74,267-7, ,454-95,681 95,681 May - 62,502-7,079-1,063-1,039-14,657-86,340 86,340 June - 84,519-7,336-1,152-1,030-13, , ,810 July - 105,207-7,591-1, , , ,654 August - 108,387-6,874-1, , , ,776 September - 72,236-7,044-1, ,305-94,702 94,702 October - 58,553-6,743-1, ,754-81,049 81,049 November - 45,269-5, ,136-66,769 66,769 December - 51,466-5, ,649-69,931 69,931 YEAR - 804,419-76,773-11,961-11, ,940-1,061,349 1,061,349 Annual Report
318 MOTORWAY: GENOA VOLTRI-GRAVELLONA TOCE SECTION: A26 ALESSANDRIA-GRAVELLONA YEAR: 2017 TOLL PAYING TRAFFIC BY MONTH (in thousands of kilometres travelled) Toll class Total Month A B Low ground High ground Low ground High ground Low ground High ground Low ground High ground Low ground High ground Low ground High ground Overall January 40,336 13,215 4,427 1, , ,422 15,645 67,067 February 38,408 12,173 4,838 1, , ,388 14,870 65,258 March 45,467 14,323 6,070 1, ,743 1,134 59,902 17,642 77,544 April 54,256 18,423 6,166 1, , ,641 21,636 89,277 May 50,213 16,131 6,643 2,027 1, ,962 1,176 65,553 19,750 85,303 June 57,459 18,999 6,669 2,092 1, ,673 1,155 72,531 22,676 95,207 July 67,909 22,734 6,878 2,134 1, ,630 1,182 83,162 26, ,649 August 64,012 22,405 5,417 1, , ,476 25, ,756 September 54,834 18,228 6,595 2,057 1, ,322 1,087 69,399 21,778 91,177 October 51,659 17,782 6,727 2,012 1, ,702 1,176 66,770 21,367 88,137 November 43,068 14,295 5,801 1, ,797 1,124 57,244 17,513 74,757 December 44,522 15,563 5,166 1, , ,551 18,191 74,742 YEAR 612, ,271 71,397 21,739 11,578 3,075 6,809 1,299 74,112 12, , ,835 1,018,874 MOTORWAY: VENICE - BELLUNO SECTION: A27 MESTRE-BELLUNO YEAR: 2017 TOLL PAYING TRAFFIC BY MONTH (in thousands of kilometres travelled) Toll class Total Month A B Low ground High ground Low ground High ground Low ground High ground Low ground High ground Low ground High ground Low ground High ground Overall January 34,271 17,939 3,512 1, , ,257 20,027 61,284 February 33,341 16,220 3,807 1, , ,032 18,488 59,520 March 37,566 16,610 4,551 1, , ,674 19,234 65,908 April 36,163 15,263 4,028 1, , ,008 17,499 61,507 May 36,810 14,101 4,734 1, , ,271 16,790 63,061 June 38,206 18,282 4,535 1, , ,368 21,137 68,505 July 43,141 25,065 4,759 2, , ,603 28,324 80,927 August 40,702 28,397 3,766 1, , ,881 31,219 79,100 September 38,391 17,204 4,454 1, , ,479 19,944 67,423 October 39,253 16,026 4,613 1, , ,670 18,733 67,403 November 35,222 13,872 4,269 1, , ,154 16,386 60,540 December 38,831 20,317 4,019 1, , ,706 22,701 69,407 YEAR 451, ,296 51,047 20,675 8,137 2,305 3, ,043 7, , , ,585 MOTORWAY: CASERTA-NOLA-SALERNO SECTION: A30 CASERTA-SALERNO YEAR: 2017 TOLL PAYING TRAFFIC BY MONTH (in thousands of kilometres travelled) Toll class Total Month A B Low ground High ground Low ground High ground Low ground High ground Low ground High ground Low ground High ground Low ground High ground Overall January 44,901-5,775-1, ,055-58,668-58,668 February 41,591-5,967-1, ,315-55,899-55,899 March 48,477-7,140-1, ,278-65,314-65,314 April 54,174-6,518-1, ,046-68,819-68,819 May 52,223-7,303-1, ,060-68,995-68,995 June 57,390-7,318-1, ,896-74,064-74,064 July 71,408-7,577-1, ,237-88,729-88,729 August 81,502-6,642-1, ,732-97,050-97,050 September 58,047-7,176-1, ,095-74,738-74,738 October 53,665-7,276-1, ,990-70,368-70,368 November 49,121-6,802-1, ,991-65,340-65,340 December 55,880-6,571-1, ,420-71,101-71,101 YEAR 668,379-82,065-17,667-9,859-81, , ,
319 Annex 3 Table of investment required by art. 2 of the Single Concession Arrangement of 2007 The following table shows a summary of the investment envisaged by art. 2 of the Single Concession Arrangement of The figures shown are presented on the basis of Italian GAAP and not under IFRS, which have been used in preparation of the financial statements as at and for the year ended 31 December Annual Report
320 AUTOSTRADE PER L ITALIA - SINGLE CONCESSION ARRANGEMENT - ART. 2 ( Italian GAAP) Contractually agreed amounts (9) Gross approved Net amount as per Completed as at 31 December Completed as at 31 December 2017 amount Arrangement (10) (11) Base tender Available Financial Base tender Available Financial Base tender Available Financial Art. 2 PROJECT TOTAL TOTAL TOTAL TOTAL TOTAL price (*) funding expenses price (*) funding expenses price (*) funding expenses UPGRADE OF THE BOLOGNA-FLORENCE SECTION Aa) Casalecchio-Sasso Marconi 68,106 82,042 64,610 18,263 2,559 85, ,610 18,263 2,559 85,432 Ab)+Ba2) Sasso Marconi-La Quercia (1) 628, , , ,457 38, , , ,488 38, ,964 Ac) La Quercia-Aglio (2) 2,305,185 (12) 2,592,908 2,473, , ,952 3,336,670 27,148 23, ,128 2,500, , ,853 3,387,797 Ad) Aglio-Barberino 310,928 (12) 365, ,349 71,094 73, ,168-3,368 2, ,981 73,495 73, ,202 Ae) Barberino- Florence North 987, , ,050 83,610 36, ,923 93,391 9,512 12, , ,441 93,123 49, ,664 Af) Florence North-Florence South 585, , , ,780 74, ,617 26,033 8,894 2,935 37, , ,674 77, ,480 Ag) Florence South-Incisa 623, , ,297 6,546 33,478 16,082 5,814 1,529 23,425 16,717 32,111 8,075 56,903 Ah) Construction of the Florence access roads 27,272 25,012-23,668 6,968 30,636-1,872 1,070 2,942-25,540 8,038 33,578 Ai) Landscaping 160,077 (13) 298,045 53, ,206 25, , ,371 2,707 6,760 53, ,577 27, ,197 TOTAL 4,207,135 1,091, ,826 5,951, ,580 54,975 21, ,535 4,367,716 1,146, ,805 6,189,217 REMAINING INVESTMENT IN THIRD AND FOURTH LANES Ba1) Bologna Modena (3) 148, ,359 29,494 2, ,904-1, , ,156 29,494 2, , ,731 Ba1) Bologna-Modena Complementary works (14) - 1, , , ,597 Ba3) Rome-Orte (3) 156, , ,991 33,244 8, , ,991 33,250 8, ,823 Ba4) Remaining investment in third lanes (3) 29,642 27,826 9,015 14, , ,015 14, ,635 B) Milan-Lakes (4) 44,857 64,733 35,186 29, , ,186 29, ,771 B) Bologna Ring Road (4) 169,158 59,393 47,754 11,639 1,383 60, ,754 11,639 1,383 60,776 TOTAL 366, ,948 13, ,429-1, , , ,959 13, ,303 ADDITIONAL WORKS UNDER THE IV ADDENDUM OF 2002 Da1)+Dg) A1 - Fiano-Settebagni and Castelnuovo di Porto junction 125, , ,186 26,160 2, , ,128 26,879 2, ,023 Db1) Milan-Bergamo 525, , , ,339 3, , , ,723 3, ,141 Db2) Structural repairs to Adda and Brembo bridges 11,438 9,767 9,374 1, , ,458 1, ,757 Dc1) A9 - Lainate-Como 465, , ,408 69,742 6, ,449 2, , ,073 69,644 6, ,016 Dc1) A8 - Milan North-Lainate 220, ,726 38,760 16, ,022 1,516 2,875-4,391 40,276 19, ,412 Dd1.2) A14 - Lot 1 Rimini North-Cattolica 538, , ,468 78,125 5, ,568-4,461-4, ,468 82,587 5, ,029 Dd1.3) A14 - Lot 2 Cattolica-Fano (5) 550, , ,193 81,931 7, ,074 6,914 2, , ,108 84,913 8, ,230 Dd1.4) A14 - Lot 3 Fano-Senigallia 362, , ,612 87,061 2, , , ,244 87,517 2, ,632 Dd1.5) A14 - Lot 4 Senigallia-Ancona North and Marina di Monte Marciano junction 474, , ,121 58,016 39, , ,784-7, ,255 65,800 39, ,106 Dd1.6) A14 - Lot 5 Ancona North-Ancona South (6) 384, , ,979 50,967 21, ,246 5,664 1,752-7, ,643 52,719 21, ,662 Dd1.7) A14 Lot 6A Ancona South-P.S.Elpidio, Phase 1 153, , ,137 24,321 8, , ,344-1, ,153 25,665 8, ,416 Dd1.8) A14 - Lot 6 B Ancona South-P.S. Elpidio, Phase 2 and Porto S. Elpidio junction 173, , ,802 25,056 2, , , , ,316 26,273 2, ,859 Dd1.9) A14 Lot 7A P.S.Elpidio-Pedaso, Phase 1 (14) 4,240-4,301 2,236 6, ,304 2,521 6,825 Dd1.10) A14 - Lot 7B P.S.Elpidio-Pedaso, Phase 2 (14) 1,568-1, , ,568 1,049 2,617 Dd1.11) A14 - Lot 0 23,716 22,106 19,290 2,358 11,050 32, ,290 2,358 11,050 32,698 De1)+De3) Genoa bypass (8) 4,755,205 3,187,015-59, ,933-5, ,812-65, ,746 De2) San Benigno Interchange 74,502 75,740 13,731 8,593 1,411 23,735-1, ,931 13,731 10,422 1,513 25,666 Df) Milan Exhibition Centre 93,334 86,298 78,582 7,578-86, ,582 7,578-86,160 Dh) Guidonia Junction 11,841 14,869 8,527 4,291-12, ,527 4,291-12,818 Di) Padua Industrial Estate junction and A13-A4 link at KM ,194 39,776 20,296 5,668 1,371 27,335 2,930 1,034-3,964 23,226 6,702 1,371 31,299 Dl) Rubicone Junction 19,851 15,691 10,728 2,727-13, ,728 2,727-13,455 Dm) Villa Marzana Junction 4,429 4,008 2,147 1,862-4, ,147 1,862-4,009 Dn) Ferentino Junction 17,384 16,604 9,158 7,479-16, ,158 7,479-16,637 Do) Maddaloni Junction 13,369 12, Dp) Tunnel Safety Plan 346,176 (15) 244, ,578 28, ,564 2,129 15,472-17, ,706 44, ,165 TOTAL 2,820, , ,523 3,710,755 23,148 47,877 1,133 72,158 2,843, , ,656 3,782,914 OTHER SPECIFIC PROJECTS REQUIRED UNDER ART. 2 C1) Upgrade of service areas and related facilities Ca4) Reggello West Serivce Area 3,552 3,425 1,747 1,656-3, ,747 1,706-3,453 Ca5) Prenestina East Service Area 2,321 (16) 1, , , ,944 Ca6) Teano East Service Area 2,818 (16) 1,194 1,494-2, ,194 1,494-2,688 Ca6) Teano West Service Area 4,869 4,996 2,697 1,738-4, ,697 1,754-4,451 Ca7) Nicola West Service Area 5,916 (16) 3,656 1,243-4, ,656 1,250-4,906 Ca8) S. Zenone East Service Area (22) 2, (23) ,116 Ca8) S. Zenone West Service Area (22) 3, Ca9) Cantagallo East Service Area (22) 5,539 1, , ,007 1,062-2,069 Ca9) Cantagallo West Service Area 7,420 5,996 5,353 1,084-6, ,325-2,082 6,110 2,409-8,518 Ca10) S. Martino East Service Area (22) 2, Ca10) S. Martino West Service Area (22) 2, Ca11) Lucignano West Service Area 2,047 1,540 1, , , ,909 Ca12) La Macchia West Service Area (22) 2, Cb1) Brianza North Service Area (17) (16) 464 2,435-2, ,435-2,899 Cb2) Lambro South Service Area 3,715 (16) 1,492 1,789-3, ,492 1,789-3,281 Cb3) Valtrompia North Service Area 1,723 (16) 1, , , ,460 Cb4) Sebino North Service Area (22) 1, Cb4) Sebino South Service Area (22) 3, Cd1) Villoresi East Service Area (21) Cd1) Villoresi West Service Area (21) 1, Cf1) Po West Service Area 3,001 (16) 1, , , ,226 Cf2) San Pelagio East Service Area (22) (23) Cf2) San Pelagio West Service Area (22) 1, (23) Cg2) Metauro West Service Area 4,996 4,210 4,978 1,337-6, ,100 1,356-6,456 Cg3) Esino East Service Area 4,587 4,763 3,867 1,392-5, ,854 1,402-5,256 Cg3) Esino West Service Area 1,997 (16) 1, , , ,739 Cg4) Sillaro East Service Area 5,613 8,631 5,226 4,677-9, ,226 4,729-9,955 Cg5) Santerno East Service Area (22) 2, (23) Cg5) Santerno West Service Area (22) 2, Cg6) La Pioppa East Service Area 5,232 4,871 3,290 1,771-5, ,290 1,766-5,056 Cg7) Murge West Service Area (22) (23) Cg8) Bevano West Service Area (22) (23) Cg9) Montefeltro East Service Area (22) 2, Cg10) Chienti West Service Area (22) 1, (23) TOTAL 43,784 28,070-71,855 1,482 2,158-3,640 45,267 30,228-75,
321 C2) Toll stations, junctions and other network investment at Caprara di Campegine Ca1) New junction 12,765 10,007 2,989-12,996 1, ,322 11,301 3,016-14,318 Ca2) New junction and toll station at Ceprano 8,578 5,394 2,610-8, ,394 2,610-8,004 Ca3) Junction and toll station at S. Maria Capua Vetere 11,338 6,035 4,348-10, ,035 4,348-10,383 (16) Cc1) Upgrade of Busalla Junction 1,787 1, , , ,701 Ce1) New junction at Capannori 15,187 14,429 4,148-18, ,179 4,221-18,400 Cg1) Giulianova Junction 1, , ,635 37,814 15,482-53,295 1, ,146 38,859 15,582-54,441 TOTAL - Upgrade and expansion of the motorway network and motorway feeder roads, improvement of traffic flows on access roads at port hubs and other minor investments including five new automated toll stations Construction of a new junction at Arezzo and interchange with the Strada dei Due Ch1) (14) 45, Mari and the A1 and feeder roads Ch2) New Bazzanese 41,400 41,400-18,630-18,630-10,350-10,350-28,980-28,980 Ch3) S. Cesario Interchange 26,539 26,539-5, , ,436 1,010 6,446 Improvement of local feeder roads to the A1 motorway at the Barberino- Ch4) Calenzano-Florence South-Incisa junctions with works on SP8-SS67-SS69-SP34 (19) 86,705 30,810 8,107 5,048 43,965 14, ,095 16,329 44,824 8,326 7,143 60,293 support road to the Calenzano and Rignano industrial estates. Ch5) Rho-Monza (Section 1) 183, ,559 77,026 28,678 7, ,179 2,155 2,873 5,007 10,034 79,181 31,550 12, ,213 Ch6) Port access road (Voltri) (14) 15, Ch7) New Crespellano (previously La Muffa) Junction 31,504 27,749 14,765 7, , ,767 7, ,566 Ch8) Local roads and improvement of access at the Lavagna toll station (Viale Kasman) (14) 20, Ch10) Bologna Ring Road (7) (20) 118,704 95,257 21,577 3, , ,260 21,708 3, ,214 C3) Upgrade of fourth lane A4 between V.le Certosa and Sesto San Giovanni junctions 224, ,540 12,826 8,572 1,760 23,158 30,656 3, ,476 43,482 11,671 2,481 57,634 C3) New S.Maria del Piave toll station (14) 13, C3) New Foggia Industral Park toll station 14,222 11,669 10,098 2,183-12, ,100 2,690-12,790 C3) New Bisceglie toll station (14) 5, C3) New Orvieto North toll station (14) 13, C3) New Borgonovo toll station 9,890 9, ,010 4, ,629 4,896 1, ,639 C3) Construction of new Dalmine (14) 10, toll plaza C3) Link road joining Val Fontanabuona and A12 (14) 5,950-5, , , ,989 C3) Ordinary link road serving Bologna Interporto junction (14) 2, C3) Completion of Baveno junction 2,462 2, C3) Completion of Rapallo junction 1,098 1, C3) Change to A11 Florence-Pisa North exit road on to SS1 Aurelia at Migliarino (14) 1, C3) TOTAL 241, ,824 19, ,974 51,547 18,635 8,313 78, , ,459 27, ,470 TOTAL OTHER SPECIFIC PROJECTS REQUIRED UNDER ART , ,376 19, ,124 54,075 20,894 8,313 83, , ,270 27, ,406 OTHER UNSPECIFIED INVESTMENT areas and buildings used in operations C1) Upgrade of service C2) Toll stations, junctions and remaining network investments Upgrade and expansion of the motorway network and motorway feeder roads and C3) other minor investments (unspecified works). (18) (18) 2,121,196 1,671 2,118,784 99,676 99,676 (23) 2,220,872 1,671 2,222,543 C4) Noise abatement plan C5) Improvement of safety standards C6) Technological plant improvements C7) Other improvements and capitalised non-routine maintenance TOTAL OTHER UNSPECIFIED 2,121,196 99,676 2,220,872 INVESTMENT 1,671 2,118,784-99,676 1,671 2,222,543 E) New investment remunerated pursuant to CIPE Resolution 39 of 15 June 2007 (18) (18) 160,980 14, ,820 4,853 1,206-6, ,833 16, ,879 12,149, ,094 12,615,490 GRAND TOTAL 805,282 12,954,678 31, , ,773 13,452,263 Handover of service areas free of charge 134,502 7, ,796 New works under art. 15 of the 2007 Single Concession Arrangement 41,013 4,336 45,349 Capitalised staff costs, change in advances paid to suppliers and other sundries 352,856 22, ,724 TOTAL INVESTMENT IN ASSETS TO BE HANDED OVER 13,483, ,083 14,015,132 (1) Includes Ab) "Sasso Marconi-La Quercia", Ba2) "Sasso Marconi-La Quercia completion of lot 4 and complementary works" and completed contracts under the 1997 Arrangement. (2) Local works relating to the section are included in Ai) Landscaping. (3) Including works completed under the 1997 Arrangement. (4) Works completed under the 1997 Arrangement. (5) Includes Lot 2 Bis. (6) Includes Lot 5 Bis. (7) Percentage of the works included in "Other investments". (8) Includes noise abatement work Pra' Palmaro area. (9) Information provided only for specific projects. (10) Unless otherwise indicated: the gross amount to be financed by Autostrade per l'italia as per final/executive designs (including the variation appraisal) of projects, or related lots/phases, for which at 31 December 2017 approval has been given by the Grantor, or the amount expected to be financed by Autostrade per l'italia in the agreements with final approval from the Grantor at 31 December 2017 (for projects to be carried out by third parties). If the document approving the design/appraisal/agreement relating to the project (or to one of the related Lots/phases) does not show the gross amount of the base tender price, the figure shown is the net amount indicated in the document itself. (11) Net amount envisaged per project(s) in the Addendum to the Single Concession Arrangement of 24 December 2013, as updated by the report of 15 September (12) The gross approved amount for the "Barberino toll station" and the "Plan for Completion of the Base Tunnel, Mugello Lot 1st phase and upgrade of the A1 Aglio-Barberino" is included in the gross amount approved for the "La Quercia - Aglio" section. (13) The gross approved amount for landscaping work for the Casalecchio-Sasso Marconi and Sasso Marconi- La Quercia sections is included in the gross amounts approved for the "Ab - Sasso Marconi-LaQuercia", "Ac - La Quercia-Aglio" and "Ad - Aglio Barberino" projects. (14) At 31 December 2017, approval has not been given for the final/executive design for the project or for the related lots/phases, or for the agreements governing construction where this is to be carried out by third parties. (15) The gross approved amount only includes the designs for the lots that have received approval. (16) Project(s) whose value is not shown in the Addendum to the Single Concession Arrangement of 24 December 2013, as updated by the report of 15 September (17) The completion of expansion of the Brianza North service area was included in the first variation appraisal for the fourth lane of the Milan-Bergamo Lot 1 (net amount). (18) Unspecified project(s). (19) The gross approved amount for the project is included in the item "Ae) Barberino - Florence North", forming part of the Bologna-Florence upgrade. (20) The gross approved amount is included in item "B) Bologna Ring Road" in "Remaining investment in third and fourth lanes". (21) Works relating to the Villoresi East and West service areas have been included in the designs for lots 1 and 2 for the widening to five lanes of the A8. (22) Amounts currently being determined following the Grantor's approval of the new Plan. (23) Includes 377,000 in costs to be met by Autostrade per l'italia. (*) Base Tender Price includes advance payments, reserves and savings to be refunded to the contractor pursuant to art. 11, Ministerial Decree 145/2000 and statutory payments for changes in prices of materials. NB: compared with the financial statements for 2016, a number of amounts have been reclassified, although the total remains unchanged. Total investment in assets to be handed over (pursuant to art. 2 of the Single Concession Arrangement of 2007) 532,083 Adjusted by: Capitalised financial expenses (relating to construction services for which no additional economic benefits are received) -30,292 Handover, free of charge, of service areas -7,293 Total investment in assets held under concession (as indicated in note 6.2) 494,498 Annual Report
322 Annex 4 Subsidiaries and associates accounted for using the equity method as at 31 December 2017 (article 3, point 1.1 of the 2007 Single Concession Arrangement) 000 MEASUREMENT CARRYING DIFFERENCE BETWEEN NAME (ART. 2426, para. 1, 4(1) OF ITALIAN CIVIL CODE) AMOUNT MEASUREMENT PURSUANT TO ART 2426, PARA. 1, 4(1) OF ITALIAN CIVIL CODE AND CARRYING AMOUNT (A) (B) (A-B) Investments in subsidiaries Società Autostrada Tirrenica pa 112,731 90,605 22,126 Tangenziale di Napoli SpA 177,983 54, ,472 Autostrade Meridionali SpA 88,131 15,106 73,025 Autostrade Tech SpA 76,031 5,593 70,438 Ecomouv SAS 4,175 4, Infoblu SpA 4,422 3, Società Italiana per Azioni per il Traforo del Monte Bianco 107,379 2, ,061 AD Moving SpA EssediEsse Società di Servizi SpA Giove Clear Srl 1, ,755 Tech Solutions Integrators SAS -16, ,058 (2) 558, , ,899 Investments in associates Pavimental SpA 6,724 6, Società Infrastrutture Toscane SpA (in liquidation) 3,105 3, Pedemontana Veneta SpA (in liquidation) 1,674 1, Spea Engineering SpA 17,504 1,784 15,720 Bologna & Fiera Parking SpA Consorzio Autostrade Italiane Energia , , ,316 (1) Measurement of subsidiaries and associates using the equity method is consistent with IFRS, as applied by Autostrade per l'italia. (2) Further details are provided in notes 6.3, "Investments", and 6.13, "Provisions". 322
323 (This page intentionally left blank) Annual Report
324
325 5.
326 Attestations of the consolidated and separate financial statements Attestation of the consolidated financial statements pursuant to art. 81-ter of CONSOB Regulation of 14 May 1999, as amended 1. We, the undersigned, Giovanni Castellucci and Giancarlo Guenzi, as Chief Executive Officer and as the manager responsible for Autostrade per l Italia SpA s financial reporting, having taken account of the provisions of art. 154-bis, paragraphs 3 and 4 of Legislative Decree 58 of 24 February 1998, attest to: the adequacy with regard to the nature of the Company and the effective application of the administrative and accounting procedures adopted in preparation of the consolidated financial statements during The administrative and accounting procedures adopted in preparation of the consolidated financial statements as at and for the year ended 31 December 2017 were drawn up, and their adequacy assessed, on the basis of the regulations and methods drawn up by Autostrade per l Italia SpA in accordance with the Internal Control Integrated Framework model issued by the Committee of Sponsoring Organizations of the Treadway Commission. This Commission has established a body of general principles providing a standard for internal control systems that is generally accepted at international level. 3. We also attest that 3.1 the consolidated financial statements: a) have been prepared in compliance with international accounting standards approved for application in the European Community by EC Regulation 1606/2002, passed by the European Parliament and by the Council on 19 July 2002; b) are consistent with the underlying accounting books and records; c) present a true and fair view of the financial position and results of operations of the issuer and the consolidated companies; 3.2 the report on operations contains a reliable analysis of operating trends and results, in addition to the state of affairs of the issuer and the consolidated companies, together with a description of the principal risks and uncertainties to which they are exposed. 1 March 2018 Giovanni Castellucci Chief Executive Officer Giancarlo Guenzi Manager responsible for financial reporting 3
327 Attestation of the separate financial statements pursuant to art. 81-ter of CONSOB Regulation of 14 May 1999, as amended 1. We, the undersigned, Giovanni Castellucci and Giancarlo Guenzi, as Chief Executive Officer and as the manager responsible for Autostrade per l Italia SpA s financial reporting, having taken account of the provisions of art. 154-bis, paragraphs 3 and 4 of Legislative Decree 58 of 24 February 1998, attest to: the adequacy with regard to the nature of the Company and the effective application of the administrative and accounting procedures adopted in preparation of the separate financial statements during The administrative and accounting procedures adopted in preparation of the separate financial statements as at and for the year ended 31 December 2017 were drawn up, and their adequacy assessed, on the basis of the regulations and methods drawn up by Autostrade per l Italia SpA in accordance with the Internal Control Integrated Framework model issued by the Committee of Sponsoring Organizations of the Treadway Commission. This Commission has established a body of general principles providing a standard for internal control systems that is generally accepted at international level. 3. We also attest that 3.1 the separate financial statements: a) have been prepared in compliance with international accounting standards approved for application in the European Community by EC Regulation 1606/2002, passed by the European Parliament and by the Council on 19 July 2002; b) are consistent with the underlying accounting books and records; c) present a true and fair view of the financial position and results of operations of the issuer; 3.2 the report on operations contains a reliable analysis of operating trends and results, in addition to the state of affairs of the issuer, together with a description of the principal risks and uncertainties to which it is exposed. 1 March 2018 Giovanni Castellucci Chief Executive Officer Giancarlo Guenzi Manager responsible for financial reporting Annual Report
328 Report of the Board of Statutory Auditors To the Annual general Meeting of Autostrade per l Italia SpA s shareholders (pursuant to art. 153 of Legislative Decree 58/1998 and art. 2429, paragraph two of the Italian Civil Code) During the financial year ended 31 December 2017, we performed the audit procedures required by law, adopting, inter alia, the Standards recommended by the Italian accounting profession. In 2015, Autostrade per l Italia issued securities admitted to listing on the screen-based exchange organised and managed by Borsa Italiana SpA, in accordance with art. 16 of Legislative Decree 39/2010, and is now classified as a public interest entity. Accordingly, in accordance with art. 19 of the above Legislative Decree 39/2010, the Board of Statutory Auditors has, from 2015, assumed the role of Internal and Statutory Audit Committee. Specifically: we verified compliance with the law and the articles of association; we obtained reports from the Directors, providing adequate information on the Company s activities and on transactions carried out by the Company and its subsidiaries with a major impact on the Company s results of operations, financial position and cash flow, ensuring that the actions decided on and carried out were in compliance with the law and the articles of association, were not subject to any potential conflict of interest or contrary to the resolutions adopted by the General Meeting, and were not clearly imprudent or risky or such as to compromise the value of the Company; in accordance with our responsibilities, we obtained information on and checked the adequacy of the Company s organisational structure and on observance of the principles of good governance, by means of direct observation, the gathering of information from the heads of the various departments and through meetings with the independent auditors with a view to exchanging the relevant data and information; in this regard we have no particular observations to make; we assessed and verified the adequacy of the administrative/accounting system and its ability to correctly represent operating activities, by gathering information from the respective heads of department, examining corporate documents and analysing the results of the work carried out by the independent auditors; we verified that the company is subject to the management and coordination of Atlantia SpA. In addition, with reference to relations between Autostrade per l Italia and its parent, Atlantia, a restructuring of the Atlantia Group was completed in early This has involved the transfer to Atlantia, at the end of 2016, of Autostrade per l Italia s investments in Telepass and Stalexport Autostrady and, in the first quarter of 2017, the transfer of Autostrade per l Italia s investments in Autostrade dell Atlantico (the sub-holding company that controls the Group s Chilean and Brazilian motorway businesses and holds the controlling interest in Electronic Transaction Consultants) and in Autostrade Indian Infrastructure Development, in the form of a special dividend in kind payable to Atlantia. In relation to the role of sub-holding company for the motorway sector assumed by Autostrade per l Italia SpA, from the time of the Atlantia Group s reorganisation in 2017 (currently, following the restructuring carried out between the end of 2016 and the beginning of 2017, with regard to the Italian motorway operators alone), in order to improve and develop strategy with the aim of achieving performance targets and in accordance with the regulations governing the role of holding companies within corporate groups, Autostrade per l Italia has established various committees (consisting of the main heads of the operating departments and presided over by senior management). The Company currently has an Executive Committee, a Post Audit Committee, a Consultative Committee for the Monitoring of Reserves and a Register of Suppliers Committee; Legislative Decree 39/2010, as amended by Legislative Decree 135/2016, requires the Board of Statutory Auditors (identified by art. 19 of the decree as the Internal and Statutory Audit Committee ) is responsible for: 328
329 6. Dati essenziali delle controllate a) b) c) d) e) f) informing the management body of the audited entity of the outcome of the statutory audit and submitting to this body the additional report required by article 11 of the European Regulation, accompanied any eventual observations; monitoring the financial reporting process and submitting recommendations or suggestions designed to safeguard its integrity; controlling the effectiveness of the entity s internal quality control and risk management systems and, where applicable, its internal audit systems, in relation to the audited entity s financial reporting, without impinging on its independence; overseeing the statutory audit of the separate and consolidated financial statements, also taking into account the results and conclusions of the quality controls conducted by the CONSOB in accordance with article 26, paragraph 6 of the European Regulation, where available; verifying and monitoring the independence of the statutory auditors or the independent auditors in accordance with articles 10, 10-bis, 10-ter, 10-quater and 17 of the above decree and article 6 of the European Regulation, above all with regard to the appropriateness of any non-audit services provided to the audited entity, in compliance with article 5 of the Regulation; the procedure for selecting statutory or independent auditors and recommending the statutory or independent auditors to be engaged pursuant to article 16 of the European Regulation. With specific reference to the requirements of Legislative Decree 39/2010, the following should be noted. Reporting to the Board of Directors on the outcome of the statutory audit and on the additional report required by art. 11 of the European Regulation (EU) 537/2014 The Board states that the independent auditors, Deloitte & Touche SpA ( Deloitte & Touche ) issued the additional report required by art. 11 of the European Regulation on 29 March 2018, describing the results of its statutory audit of the accounts and including the written confirmation of independence required by art. 6, paragraph 2.a) of the Regulation, in addition to the disclosures required by art. 11 of the Regulation, without noting any significant shortcomings. The Board of Statutory Auditors will inform the Company s Board of Directors of the outcome of the statutory audit. Oversight of the financial reporting process The Board of Statutory Auditors has verified the existence of regulations and procedures governing the process of preparing and publishing financial information. In this regard, the report on operations includes section 2.8 Corporate governance, which also represents the report on corporate governance required by art. 123-bis of Legislative Decree 58 of 24 February 1998 (the CFA ). This section defines guidelines for the establishment and management of administrative and accounting procedures. The Board of Statutory Auditors, with the assistance of the manager responsible for financial reporting, examined the procedures involved in preparing the Company s financial statements and the consolidated financial statements, in addition to periodic financial reports. The Board of Statutory Auditors also received information on the process that enables the manager responsible for financial reporting and the Chief Executive Officer to issue the attestations required by art. 154-bis of the CFA. In this regard, on 1 March 2018, the Chief Executive Officer and the manager responsible for financial reporting issued the attestations of the consolidated and separate financial statements required by art. 81-ter of the CONSOB Regulations of 14 May 1999, as amended. The Board of Statutory Auditors thus believes the financial reporting process to be adequate and deems that there is nothing to report to the General Meeting. Annual Report
330 Oversight of the effectiveness of the internal control, internal audit and risk management systems and the statutory audit of the annual and consolidated accounts The Board of Statutory Auditors has assessed and verified the adequacy of the internal control system and the effectiveness of internal control and risk management systems. Following changes to the structure of the Atlantia Group and its organisation, in 2014 the Company s Internal Audit department was closed down and, from 1 January 2015, the parent, Atlantia, established a Group Internal Audit department, reporting to the Chairman of Atlantia, with responsibility for conducting audit activities throughout the Atlantia Group. In order to monitor and improve the effectiveness and efficiency of the internal control and risk management system, Autostrade per l Italia therefore depends on the Group Internal Audit department set up by the parent, Atlantia. On 16 February 2017, Autostrade per l Italia s Board of Directors approved the 2017 Audit Plan. As part of the internal control system, as it relates to the financial reporting process, the group headed by Autostrade per l Italia has implemented and regularly revises internal controls over financial reporting, based on a series of administrative and accounting procedures designed to ensure reliability, accuracy, integrity and timeliness in accordance with the regulations governing financial reporting. During our periodic meetings with the Head of Atlantia s Group Internal Audit department and the Risk Officer, the Board of Statutory Auditors was kept fully informed regarding internal auditing activities (with a view to assessing the adequacy and functionality of the internal control system, and compliance with the law and with internal procedures and regulations), and the activities of the Risk Officer in identifying, measuring, managing and monitoring the risks included in the Company s current Business Risk Model (compliance, regulatory and operational risks), in order to provide the necessary support to these departments in reviewing the design of the internal control system and monitoring implementation of the resulting changes. The Board of Statutory Auditors held periodic meetings with the independent auditors, Deloitte & Touche SpA, to obtain information and data regarding the audits conducted, overseeing the audit of the annual and consolidated accounts. We have nothing to report in this regard. Furthermore, we note that, during 2017, Autostrade per l Italia s Supervisory Board, with the help of an expert in criminal law, continued its review of the organisational, management and control model ( OMCM ) adopted by Autostrade per l Italia, pursuant to Legislative Decree 231/2001, in order to ensure that the model had kept pace with changes in legislation and in the Company s organisational structure during the year. In particular, in the second half of 2017, the Supervisory Board completed its revision of the OMCM in view of changes in the related legislation and in the Company s operating environment and organisational structure. The revised OMCM was approved by Atlantia s Board of Directors on 14 December 2017, without any amendments to the text proposed by the Supervisory Board. The Supervisory Board also implemented the plan of action for monitoring and assessing the adequacy and effective implementation of the OMCM. The Board of Statutory Auditors examined the Supervisory Board s reports on their activities in the first and second halves of 2017 and we do not have anything to mention in this regard in this report. Finally, it should be noted that, pursuant to art. 13, paragraph 1 of Legislative Decree 39/2010, on 1 March 2018, the Board of Statutory Auditors submitted its reasoned proposal, to be put to Autostrade per l Italia s shareholders, in relation to Deloitte & Touche s request for the payment of additional fees of 9,995, received by the Company on 16 February The request follows an increase, of a recurring nature, in the workload of the independent auditors as a result of the new legislative framework for statutory audits and the new audit standards (ISA Italy) for each of the years between 2017 and Independence of the independent auditors, above all with regard to non-audit services The Board of Statutory Auditors verified, also with reference to the provisions of art. 19 of 330
331 6. Dati essenziali delle controllate Legislative Decree 39/2010, the independence of the independent auditors, Deloitte & Touche, checking the nature and entity of any services other than auditing provided to Autostrade per l Italia and its subsidiaries by the auditors and by their associates. We also checked that, in compliance with the requirements of art. 149-duodecies of CONSOB Regulation 11971/1999, information on the type of services provided to Autostrade per l Italia and its subsidiaries by Deloitte & Touche or associates of Deloitte & Touche in 2017, and the related fees, is provided in an annex to the financial statements. The fees paid by the Autostrade per l Italia Group to the independent auditors, Deloitte & Touche or associates of Deloitte & Touche, are as follows: audit 407 thousand certification (audit-related) 23 thousand other services 126 thousand making a total of 556 thousand. It should be noted that: the category Other services (other than audit or certification services) includes 98 thousand for services relating to signature of the Company s tax return and Form 770, comfort letters on offering circulars and agreed-upon procedures on accounting data and information, and 28 thousand regarding checks on the internal control system. Other Services accounted for 29.30% of the total fees paid for Audit and Certification (auditrelated) services. In the light of the above, we therefore deem that the independent auditors, Deloitte & Touche, meet the requirements for independence. In addition, on 29 March 2018, Deloitte & Touche provided their annual confirmation of independence. Procedure for selecting independent auditors The parent, Atlantia, has adopted the procedure for selecting independent auditors and the recommendation for independent auditors pursuant to article 16 of European Regulation 537/2014. This procedure also applies to all audited consolidated Group companies, pursuant to articles 2 and 3 of Legislative Decree 38/2005, in compliance with International Financial Reporting Standards (IFRS). with respect to the contractual obligations deriving from the Single Concession Arrangement signed by ANAS and Autostrade per l Italia on 12 October 2007, which became fully effective from 8 June 2008, the day following publication of Law 101/2008 in the Official Gazette, which approved the single concession arrangements entered into at that time, including that of Autostrade per l Italia, we had meetings with the head of the department responsible for compliance with the terms of the Single Concession Arrangement, and for preparing periodic reports for senior management on compliance with the terms of the Single Concession Arrangement with ANAS, in order to be periodically updated on the Company s compliance with the terms of the Single Concession Arrangement; we held meetings with representatives of the independent auditors, pursuant to art. 150, paragraph 2 of Legislative Decree 58/98, and no significant information that should be included in this report has come to light; as noted in reports for previous years, Autostrade per l Italia has opted to participate in the tax consolidation arrangement prepared by the parent, Atlantia; as reported in the notes to the consolidated financial statements, the consolidated financial statements as at and for the year ended 31 December 2017, prepared on the basis that the Parent Company and consolidated companies are going concerns, have been prepared pursuant to articles 2 and 3 of Legislative Decree 38/2005, and in compliance with the International Financial Reporting Standards (IFRS) issued by the International Accounting Standards Board and endorsed by the European Commission, as in force at the end of the Annual Report
332 reporting period. These standards include the interpretations issued by the International Financial Reporting Interpretations Committee (IFRIC), in addition to previous International Accounting Standards (IAS) and interpretations issued by the Standard Interpretations Committee (SIC) and still in force at the end of the reporting period. Moreover, the measures introduced by the CONSOB, in application of paragraph 3 of article 9 of Legislative Decree 38/2005, relating to the preparation of financial statements, have also been taken into account; as described in the Introduction to the section Group financial review, the accounting standards applied during preparation of the consolidated accounts for the year ended 31 December 2017 are consistent with those adopted for the consolidated financial statements for the previous year, in that the amendments to existing standards that have come into effect in 2017 have not had a material impact on the accounts. The above-mentioned restructuring of the Atlantia Group, initiated in 2016 and completed in the first quarter of 2017, has involved: the deconsolidation, from 28 February 2017, of Autostrade dell Atlantico and the related subsidiaries and, from 31 March 2017, of Autostrade Indian Infrastructure Development; classification, in application of IFRS 5, of the contributions of Autostrade Indian Infrastructure Development, Autostrade dell Atlantico and the related subsidiaries to the Group s operating results for the two comparative periods, and of the contributions of Telepass and Stalexport Autostrady and the related subsidiaries for 2016 alone, in Profit/Loss) from discontinued operations ; the accounts have been submitted to the required controls by the independent auditors, Deloitte & Touche SpA, appointed by the Annual General Meeting of 24 April 2012 for the annual reporting periods, During periodic meetings with the Board, the independent auditors had nothing to report in this regard; we checked that no complaints have been lodged under art of the Italian Civil Code, and no complaints of any kind have been presented; the Board of Statutory Auditors issued the mandatory opinion required by art. 154-bis of the CFA relating to the appointment of the manager responsible for financial reporting (confirmation received during the Board of Directors meeting of 21 April 2017); we have examined the financial statements as at and for the year ended 31 December 2017, with regard to which we state the following. In view of the fact that it is not our responsibility to audit the Company s separate and consolidated financial statements, we checked the overall basis of presentation of the financial statements and their general compliance with the laws relating to their preparation and structure; we have no particular observations to make in this regard. We verified compliance with the laws governing preparation of the report on operations and have no particular observations to make in this regard. To the best of our knowledge, in preparing the financial statements, the Directors did not elect to apply any of the exemptions permitted by art. 2433, paragraph 4 of the Italian Civil Code. We verified that the financial statements are consistent with the information in our possession, as a result of carrying out our duties, and have no particular observations to make in this regard. We note that the report on operations includes a section entitled Significant regulatory aspects, in which the Directors provide information on certain events in 2017, including reference to their potential implications for the future. In particular, full information is provided about: Toll increases with effect from 1 January 2017; Toll increases with effect from 1 January 2018; II Addendum to Autostrade per l Italia s Single Concession Arrangement; Addendum to Tangenziale di Napoli s Single Concession Arrangement; 332
333 6. Dati essenziali delle controllate Agreement on the upgrade of the existing motorway system/ring road interchange serving Bologna; Addendum to Autostrada Tirrenica s Single Concession Arrangement; Award of the concession for the A3 Naples Pompei Salerno motorway; Enabling Act on tenders and concessions; Charges payable by motorway operators in accordance with Legislative Decree 35 of 2011; Discussions between the Ministry of Infrastructure and Transport and the European Commission regarding the extension of Autostrade per l Italia s concession. We note that the report on operations includes a section, Outlook and risks or uncertainties, in which the Directors state that, overall, forecasts for 2018 lead us to expect the Group to post earnings growth and improvements in key performance indicators. The above audit procedures were carried out during 13 meetings of the Board of Statutory Auditors and by taking part in 12 meetings of the Board of Directors. As a result of the audit procedures carried out and on the basis of the information obtained from the independent auditors, we are not aware of any negligence, fraud, irregularities or any other material events that would require a report to be made to regulatory bodies or disclosed in this report. We also approve the proposal of the Board of Directors with respect to the appropriation of profit for the year. The independent auditors report, containing their opinion on the fact that the separate and consolidated financial statements comply with the applicable laws and accounting standards, and their opinion on the consistency of the report on operations with the financial statements, was issued on 29 March 2018, without any qualifications or emphasis of matter. In the light of the above, we invite the Annual General Meeting to approve the Annual Report for the year ended 31 December 2017, as prepared by the Directors. Finally, the Board of Statutory Auditors reminds the Meeting that the term of office of the Board of Statutory Auditors expires with approval of the financial statements for the year ended 31 December You are thus invited to elect new members of the Board. Rome, 29 March 2018 Board of Statutory Auditors The Chairman Antonio Mastrapasqua Annual Report
334 Independent Auditor s Report 334

335 6. Dati essenziali delle controllate Annual Report
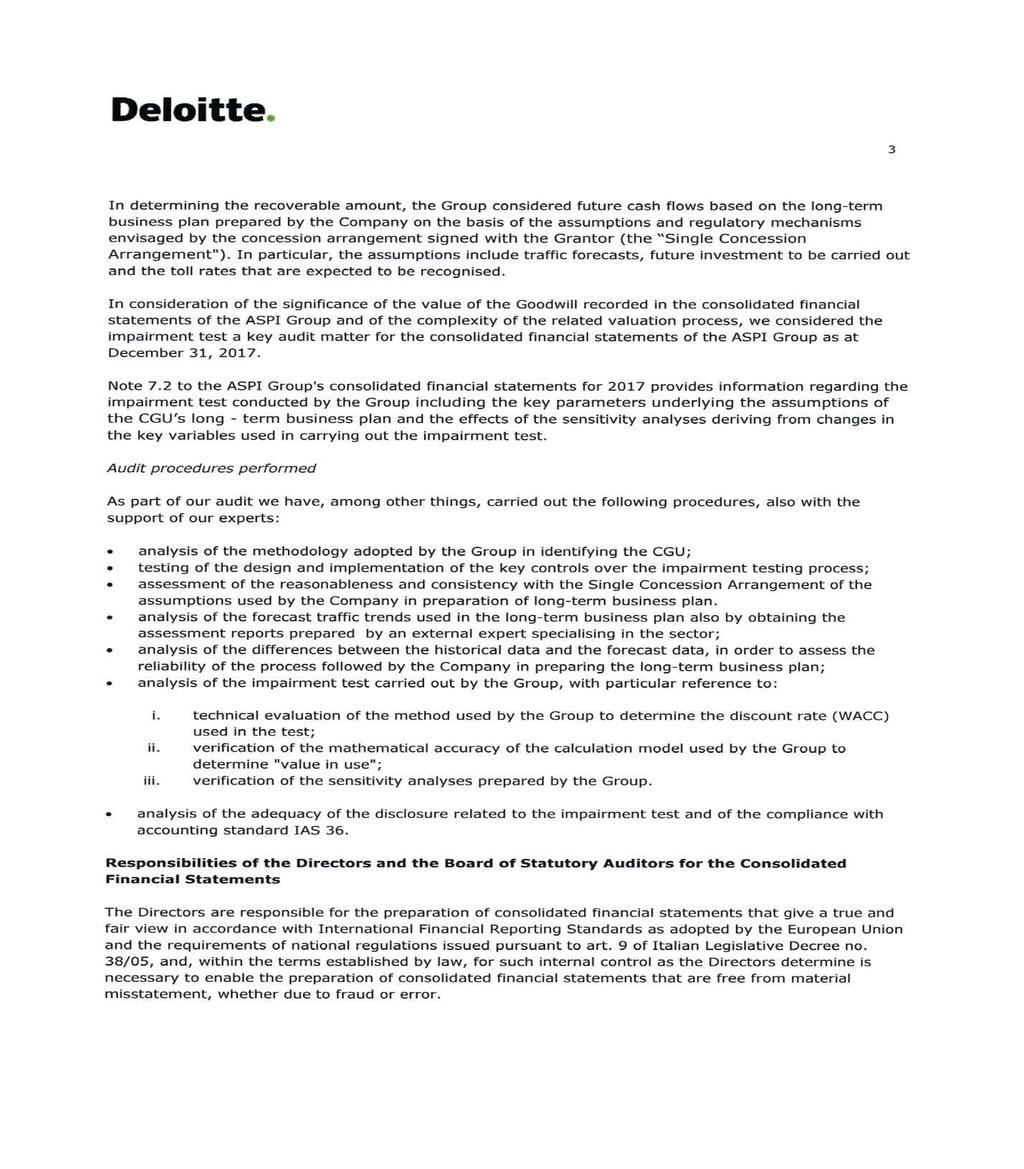
336 336

337 6. Dati essenziali delle controllate Annual Report
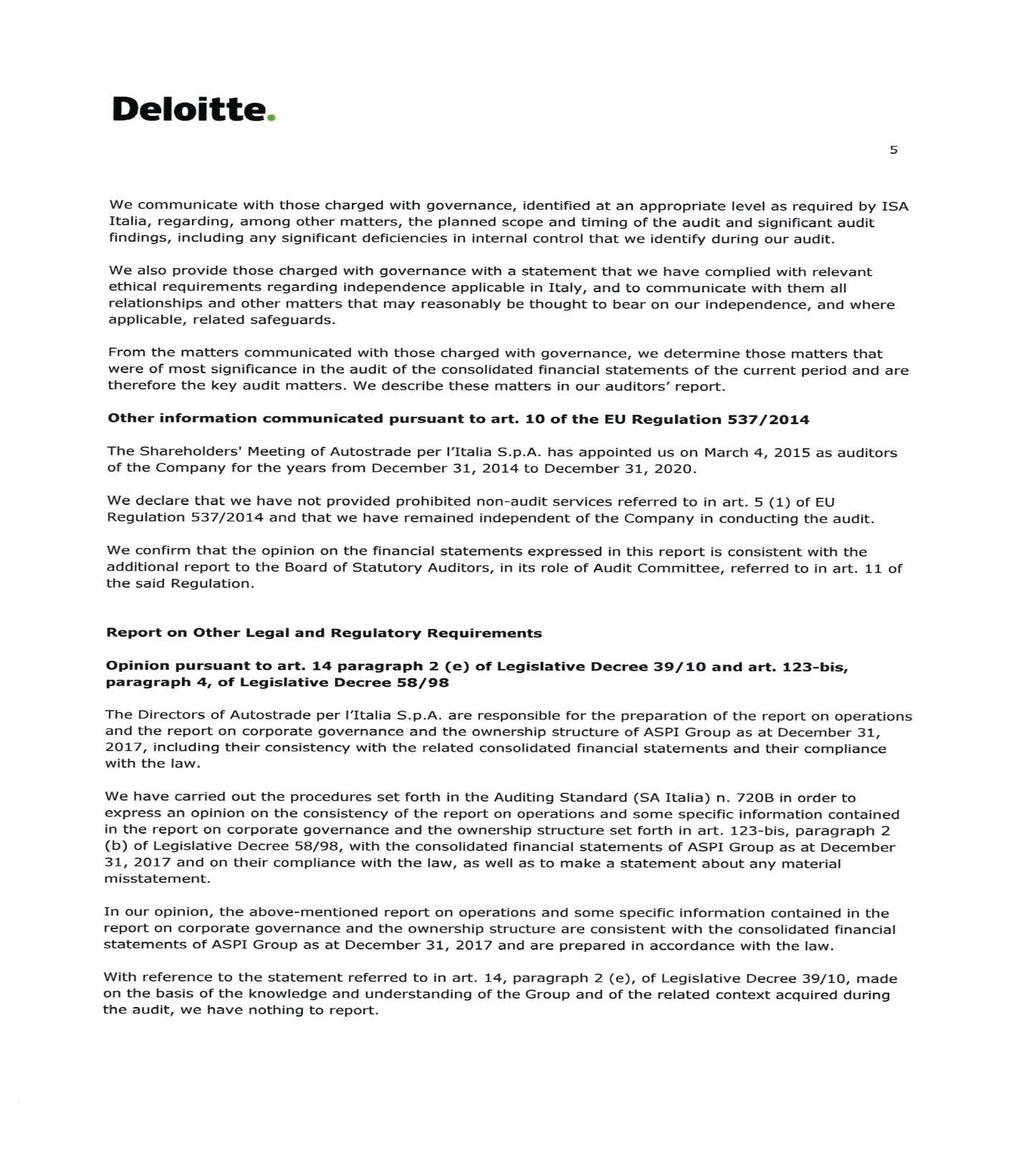
338 338
339 6. Dati essenziali delle controllate Annual Report
340 340

341 6. Dati essenziali delle controllate Annual Report
342 342

343 6. Dati essenziali delle controllate Annual Report
344 344
345 34 (this page intentionally left blank)
346
347 6.
348 KEY INDICATORS EXTRACTED FROM THE FINANCIAL STATEMENTS OF SUBSIDIARIES, ASSOCIATES AND JOINT VENTURES, AS DEFINED BY PARAGRAPHS 3 AND 4 OF ART OF THE ITALIAN CIVIL CODE The figures provided below were extracted from the companies' most recent approved financial statements. The companies reporting date is 31 December of each year, unless otherwise indicated. Autostrade Meridionali presents financial statements prepared in accordance with international financial reporting standards, whereas the other companies financial statements are prepared in accordance with local accounting standards generally accepted in their countries. Subsidiaries Società Autostrada Tirrenica Pa 000 FINANCIAL POSITION 31 DECEMBER DECEMBER 2016 Non-current assets 347, ,162 of which non-current investments Current assets 29,691 32,678 Other assets Total assets 377, ,061 Equity 81,552 81,737 of which issued capital 24,461 24,461 Provisions and post-employment benefits 7,711 7,790 Payables 272, ,047 Other liabilities 15,457 17,487 Total equity and liabilities 377, , RESULTS OF OPERATIONS Value of production 42,881 44,199 Costs of production -28,580-28,652 Operating profit/(loss) 14,301 15,547 Profit/(Loss) for the period ,035 Tangenziale di Napoli SpA 000 FINANCIAL POSITION 31 DECEMBER DECEMBER 2016 Non-current assets 257, ,073 of which non-current investments 2 2 Current assets 28,995 33,795 Other assets Total assets 286, ,199 Equity 192, ,257 of which issued capital 108, ,077 Provisions and post-employment benefits 33,588 33,373 Payables 60,351 64,991 Other liabilities Total equity and liabilities 286, , RESULTS OF OPERATIONS Value of production 70,712 71,098 Costs of production -57,742-52,425 Operating profit/(loss) 12,970 18,673 Profit/(Loss) for the period 7,610 11,125 (*) Figures modified in application of Legislative Decree 139/
349 6. Dati essenziali delle controllate Autostrade Meridionali SpA 000 FINANCIAL POSITION 31 DECEMBER DECEMBER 2015 Non-current assets 19,454 21,345 Current assets 429, ,980 Total assets 449, ,325 Equity 133, ,615 of which issued capital 9,056 9,056 Non-current liabilities 19,675 23,761 Current liabilities 296, ,949 Total equity and liabilities 449, , RESULTS OF OPERATIONS Operating revenue 85,220 91,289 Operating costs -55,846-73,005 Operating profit/(loss) 29,374 18,284 Profit/(Loss) for the period 15,088 9,321 Autostrade Tech SpA 000 FINANCIAL POSITION 31 DECEMBER DECEMBER 2016 Non-current assets 2,481 2,521 of which non-current investments Current assets 96, ,733 Other assets Total assets 100, ,545 Equity 69,806 88,815 of which issued capital 1,120 1,120 Provisions and post-employment benefits 1,526 1,530 Payables 27,657 25,993 Other liabilities 1, Total equity and liabilities 100, , RESULTS OF OPERATIONS Value of production 59,832 60,670 Costs of production -51,227-53,424 Operating profit/(loss) 8,605 7,246 Profit/(Loss) for the period 5,888 49,756 Ecomouv SAS 000 FINANCIAL POSITION 31 DECEMBER DECEMBER 2015 Unpaid called-up capital - 2,976 Non-current assets 8 10 of which non-current investments - - Current assets 8,567 42,213 Total assets 8,575 45,199 Equity 6,379 37,570 of which issued capital 6,000 30,000 Provisions and post-employment benefits 592 4,322 Payables 1,604 3,307 Total equity and liabilities 8,575 45, RESULTS OF OPERATIONS Operating revenue 3,756 16,430 Operating costs -2,841-16,057 Operating profit/(loss) Profit/(Loss) for the period Annual Report
350 Infoblu SpA 000 FINANCIAL POSITION 31 DECEMBER DECEMBER 2016 Non-current assets of which non-current investments - - Current assets 7,763 7,670 Other assets Total assets 9,214 9,092 Equity 5,923 6,269 of which issued capital 5,160 5,160 Provisions and post-employment benefits Payables 3,142 2,687 Other liabilities - - Total equity and liabilities 9,214 9, RESULTS OF OPERATIONS Value of production 5,483 5,622 Costs of production -4,832-4,413 Operating profit/(loss) 651 1,209 Profit/(Loss) for the period Società Italiana per azioni per il Traforo del Monte Bianco 000 FINANCIAL POSITION 31 DECEMBER DECEMBER 2016 Non-current assets 233, ,165 of which non-current investments 165, ,752 Current assets 232, ,683 Other assets 660 1,226 Total assets 467, ,074 Equity 232, ,809 of which issued capital 198, ,749 Provisions and post-employment benefits 95,772 79,239 Payables 138,730 62,847 Other liabilities Total equity and liabilities 467, , RESULTS OF OPERATIONS Value of production 69,434 64,674 Costs of production -52,102-43,981 Operating profit/(loss) 17,332 20,693 Profit/(Loss) for the period 12,451 12,634 Ad Moving SpA 000 FINANCIAL POSITION 31 DECEMBER DECEMBER 2016 Non-current assets 1,047 1,124 of which non-current investments - - Current assets 6,131 6,976 Other assets Total assets 7,192 8,112 Equity of which issued capital 1,000 1,000 Provisions and post-employment benefits Payables 6,047 7,016 Other liabilities Total equity and liabilities 7,192 8, RESULTS OF OPERATIONS Value of production 7,260 7,809 Costs of production -7,198-7,886 Operating profit/(loss) Profit/(Loss) for the period
351 6. Dati essenziali delle controllate EsseDiEsse Società di Servizi SpA 000 FINANCIAL POSITION 31 DECEMBER DECEMBER 2016 Non-current assets of which non-current investments - - Current assets 15,661 20,412 Other assets Total assets 16,239 21,036 Equity 1,476 1,535 of which issued capital Provisions and post-employment benefits 4,440 4,739 Payables 9,879 14,332 Other liabilities Total equity and liabilities 16,239 21, RESULTS OF OPERATIONS Value of production 27,966 27,603 Costs of production -26,708-26,177 Operating profit/(loss) 1,258 1,426 Profit/(Loss) for the period Giove Clear Srl 000 FINANCIAL POSITION 31 DECEMBER DECEMBER 2016 Non-current assets of which non-current investments - - Current assets 4,998 4,935 Other assets Total assets 5,284 5,267 Equity 1,941 2,131 of which issued capital Provisions and post-employment benefits 1, Payables 1,936 1,927 Other liabilities Total equity and liabilities 5,284 5, RESULTS OF OPERATIONS Value of production 12,271 11,818 Costs of production -11,682-10,978 Operating profit/(loss) Profit/(Loss) for the period Tech solutions Integrators SAS 000 FINANCIAL POSITION 31 DECEMBER DECEMBER 2015 Unpaid called-up capital - - Non-current assets - - of which non-current investments - - Current assets 3,065 10,387 Total assets 3,065 10,387 Equity -16,110-10,729 of which issued capital 2,000 2,000 Provisions and post-employment benefits 5, Payables 13,645 20,985 Total equity and liabilities 3,065 10, RESULTS OF OPERATIONS Operating revenue 600 1,755 Operating costs ,734 Operating profit/(loss) Profit/(Loss) for the period Annual Report
352 Associates Pavimental SpA 000 FINANCIAL POSITION 31 DECEMBER DECEMBER 2016 Non-current assets 101,623 89,521 of which non-current investments 5,392 5,392 Current assets 279, ,165 Other assets 5,990 6,376 Total assets 387, ,062 Equity 31,477 15,394 of which issued capital 10,116 10,116 Provisions and post-employment benefits 12,823 15,117 Payables 343, ,546 Other liabilities Total equity and liabilities 387, , RESULTS OF OPERATIONS Value of production 397, ,116 Costs of production -371, ,954 Operating profit/(loss) 25,526-43,838 Profit/(Loss) for the period 15,794-33,707 Società Infrastrutture Toscane SpA (in liquidation) 000 FINANCIAL POSITION 31 DECEMBER DECEMBER 2015 Unpaid called-up capital - - Non-current assets - - of which non-current investments - - Current assets 6,921 14,960 Other assets - - Total assets 6,921 14,960 Equity 6,763 14,656 of which issued capital 15,000 15,000 Provisions and post-employment benefits Payables Other liabilities - - Total equity and liabilities 6,921 14, RESULTS OF OPERATIONS Value of production - - Costs of production Operating profit/(loss) Profit/(Loss) for the period Pedemontana Veneta SpA (in liquidation) 000 FINANCIAL POSITION 31 DECEMBER DECEMBER 2015 Non-current assets - - of which non-current investments - - Current assets 9,258 9,279 Other assets - - Total assets 9,258 9,279 Equity 5,723 5,833 of which issued capital 6,000 6,000 Provisions and post-employment benefits Payables 3,386 3,297 Other liabilities - - Total equity and liabilities 9,258 9, RESULTS OF OPERATIONS Value of production 3 85 Costs of production Operating profit/(loss) Profit/(Loss) for the period
353 6. Dati essenziali delle controllate SPEA Engineering SpA 000 FINANCIAL POSITION 31 DECEMBER DECEMBER 2016 Non-current assets 7,689 6,459 of which non-current investments Current assets 182, ,785 Other assets 1,088 1,001 Total assets 191, ,245 Equity 88,349 93,628 of which issued capital 6,966 6,966 Provisions and post-employment benefits 20,380 19,525 Payables 82,458 81,092 Other liabilities - - Total equity and liabilities 191, ,245 (' 000) RESULTS OF OPERATIONS Value of production 112, ,987 Costs of production -102, ,404 Operating profit/(loss) 10,433 25,583 Profit/(Loss) for the period 6,870 17,734 Bologna & Fiera Parking SpA 000 FINANCIAL POSITION 31 DECEMBER DECEMBER 2015 (*) Non-current assets 45,626 47,054 of which non-current investments - - Current assets 14,123 8,607 Other assets 5 5 Total assets 59,754 55,666 Equity 614-1,543 of which issued capital 2,715 2,715 Provisions and post-employment benefits 2,907 3,654 Payables 51,133 49,839 Other liabilities 5,100 3,716 Total equity and liabilities 59,754 55, RESULTS OF OPERATIONS Value of production 2,534 2,078 Costs of production -2,843-2,492 Operating profit/(loss) Profit/(Loss) for the period 1,587-1,672 (*) Figures modified in application of Legislative Decree 139/2015. Annual Report
354 354 (this page intentionally left blank)
355 Legal information and contacts Registered Office and Operational Headquarters Via Alberto Bergamini, Roma Tel info@autostrade.it Legal information Autostrade per l Italia SpA A company managed and coordinated by Atlantia SpA Issued capital: 622,027,000 (fully paid) Tax code, VAT number and Rome Companies Register number: REA no Media Relations Tel ufficiostampa@autostrade.it Investor Relations investor.relations@autostrade.it
356 336
INTERIM REPORT OF THE AUTOSTRADE PER L'ITALIA GROUP FOR THE SIX MONTHS ENDED 30 JUNE 2018
 INTERIM REPORT OF THE AUTOSTRADE PER L'ITALIA GROUP FOR THE SIX MONTHS ENDED 30 JUNE 2018 Interim Report of the Autostrade per l Italia Group for the six months ended 30 June 2018 1 (This page intentionally
BOARD APPROVES AUTOSTRADE PER L ITALIA GROUP S INTERIM REPORT FOR SIX MONTHS ENDED 30 JUNE 2017
 Press Release BOARD APPROVES AUTOSTRADE PER L ITALIA GROUP S INTERIM REPORT FOR SIX MONTHS ENDED 30 JUNE 2017 Consolidated results (1) Motorway traffic on Group s Italian network up 2.9% in H1 2017 (up
BOARD APPROVES AUTOSTRADE PER L ITALIA GROUP S INTERIM REPORT FOR SIX MONTHS ENDED 30 JUNE 2016
 Press Release BOARD APPROVES AUTOSTRADE PER L ITALIA GROUP S INTERIM REPORT FOR SIX MONTHS ENDED 30 JUNE 2016 Consolidated results (1) Motorway traffic on Group s Italian network up 3.8% in H1 2016 Increase
AUTOSTRADE PER L ITALIA GROUP S RESULTS ANNOUNCEMENT FOR NINE MONTHS ENDED 30 SEPTEMBER 2017
 Press Release AUTOSTRADE PER L ITALIA GROUP S RESULTS ANNOUNCEMENT FOR NINE MONTHS ENDED 30 SEPTEMBER 2017 Consolidated results (1) Motorway traffic on Group s network up 2.3% in 9M 2017 (up 2.9% after
BOARD APPROVES CONSOLIDATED AND SEPARATE FINANCIAL STATEMENTS FOR 2017
 Press Release BOARD APPROVES CONSOLIDATED AND SEPARATE FINANCIAL STATEMENTS FOR 2017 Consolidated results in 2017 (1) Traffic on Group s Italian motorway network up 2.2% (up 2.8% after excluding leap-year
AUTOSTRADE PER L ITALIA GROUP S QUARTERLY RESULTS ANNOUNCEMENT FOR THREE MONTHS ENDED 31 MARCH 2018
 Press Release AUTOSTRADE PER L ITALIA GROUP S QUARTERLY RESULTS ANNOUNCEMENT FOR THREE MONTHS ENDED 31 MARCH 2018 Consolidated results for Q1 2018 (1) Traffic on Group s motorway network up 1.0% Gross
2014 ANNUAL REPORT ANNUAL REPORT
 2014 ANNUAL REPORT CONTENTS 1. Introduction 5 2. Report on operations 3. Consolidated financial statements 4. Separate financial statements 13 97 213 5. Reports 6. Key financial indicators of subsidiaries,
BOARD APPROVES ATLANTIA GROUP S INTERIM REPORT FOR SIX MONTHS ENDED 30 JUNE 2016
 Press Release BOARD APPROVES ATLANTIA GROUP S INTERIM REPORT FOR SIX MONTHS ENDED 30 JUNE 2016 Consolidated results (1) Motorway traffic on Group s Italian network up 3.8% in H1 2016 Increase in traffic
BOARD APPROVES NINE-MONTH REPORT FOR 2012
 Press release BOARD APPROVES NINE-MONTH REPORT FOR 2012 Consolidated revenue of 3,039m up 2.6% on 9M 2011. On like-for-like basis total revenue down 115.8m (3.9%) Motorway traffic on network operated under
Interim Report of the Atlantia Group for the nine months ended 30 September 2016
 Interim Report of the Atlantia Group for the nine months ended 30 September 2016 Interim Report of the Atlantia Group for the nine months ended 30 September 2016 (this page intentionally left blank) Contents
BOARD APPROVES CONSOLIDATED AND SEPARATE FINANCIAL STATEMENTS FOR 2011
 Press Release BOARD APPROVES CONSOLIDATED AND SEPARATE FINANCIAL STATEMENTS FOR 2011 Growth in EBITDA (up 5.1%) and capital expenditure (up 6.2%). Average workforce rises 440 on like-for-like basis. Net
AUTOSTRADE PER L ITALIA GROUP S RESULTS ANNOUNCEMENT FOR NINE MONTHS ENDED 30 SEPTEMBER 2018
 Press release AUTOSTRADE PER L ITALIA GROUP S RESULTS ANNOUNCEMENT FOR NINE MONTHS ENDED 30 SEPTEMBER 2018 Consolidated results for 9M 2018 (1) Motorway traffic on Group s network up 0.3% (2) Gross operating
Atlantia Group s Interim Report for Q1 2016
 Atlantia Group s Interim Report for Q1 2016 2 (This page intentionally left blank) 1. Introduction Contents 1. Introduction... 5 Consolidated financial highlights... 7 Ownership structure... 8 Share price
Interim report of the Atlantia Group for the nine months ended 30 September 2012
 Interim report of the Atlantia Group for the nine months ended 30 September 2012 Contents 1. Introduction... 5 Consolidated financial highlights... 6 Shareholder structure... 7 Atlantia share price performance...
Interim Report for the three months ended 31 March 2012
 Interim Report for the three months ended 31 March 2012 Interim Report for the three months ended 31 March 2012 Contents 1. Introduction... 5 Consolidated financial highlights... 6 Shareholders... 7
BOARD APPROVES REPORT FOR Q1 2012
 Press Release BOARD APPROVES REPORT FOR Q1 2012 Consolidated revenue of 856.9m stable (up 0.1%) versus Q1 2011 1 Motorway traffic on the network operated under concession in Italy 2 down 8.5% in Q1 2012,
Interim report of the Atlantia Group for the nine months ended 30 September 2011
 Interim report of the Atlantia Group for the nine months ended 30 September 2011 2 (This page intentionally left blank) Contents 1. Introduction... 5 Corporate bodies... 7 Group structure... 8 Consolidated
Consolidated interim financial report as at and for the six months ended 30 June 2011
 Consolidated interim financial report as at and for the six months ended 30 June 2011 Contents 1. Introduction... 3 Corporate bodies... 4 Group structure... 6 Consolidated financial highlights... 7 Shareholder
BOARD APPROVES CONSOLIDATED AND SEPARATE FINANCIAL STATEMENTS FOR 2017
 Press Release BOARD APPROVES CONSOLIDATED AND SEPARATE FINANCIAL STATEMENTS FOR 2017 Consolidated results for 2017 (1) Traffic on Group s Italian motorway network up 2.2% (up 2.8% after excluding leap-year
Consolidated interim report for the nine month ended 30 September 2009
 Consolidated interim report for the nine month ended 30 September 2009 ATLANTIA SpA Issued capital: E571,711,557.00, fully paid-up Tax code, VAT number and Rome Companies Register no. 03731380261 REA no.
Interim report of the Atlantia Group for the nine months ended 30 September 2014
 Interim report of the Atlantia Group for the nine months ended 30 September 2014 Interim report of the Atlantia Group for the nine months ended 30 September 2014 (This page intentionally left blank) Contents
Interim report of the Atlantia Group for the nine months ended 30 September 2013
 Interim report of the Atlantia Group for the nine months ended 30 September 2013 Contents 1. Introduction... 5 Consolidated financial highlights... 6 Shareholders... 7 Atlantia share price performance...
ATLANTIA GROUP S QUARTERLY RESULTS ANNOUNCEMENT FOR THREE MONTHS ENDED 31 MARCH 2017
 Press Release ATLANTIA GROUP S QUARTERLY RESULTS ANNOUNCEMENT FOR THREE MONTHS ENDED 31 MARCH 2017 Consolidated results (1) Motorway traffic on Group s Italian network up 2.7% in Q1 2017 after stripping
Consolidated interim report for the nine months ended 30 September 2010
 Consolidated interim report for the nine months ended 30 September 2010 ATLANTIA SpA Issued capital: 600,297,135.00, fully paid-up Tax code, VAT number and Rome Companies Register no. 03731380261 REA no.
Interim Report of the Atlantia Group for the six months ended 30 June 2017
 Interim Report of the Atlantia Group for the six months ended 30 June 2017 Interim Report of the Atlantia Group for the six months ended 30 June 2017 (This page intentionally left blank) Contents Contents
BOARD APPROVES NINE-MONTH REPORT FOR 2010 GROUP S INVESTMENTS UP 10%
 Press Release BOARD APPROVES NINE-MONTH REPORT FOR 2010 GROUP S INVESTMENTS UP 10% Operating performance Consolidated revenue of 2,838m up 9.1% on 9M 2009, of which 5.0% due to the rise in the concession
ATLANTIA GROUP S RESULTS ANNOUNCEMENT FOR NINE MONTHS ENDED 30 SEPTEMBER 2017
 Press Release ATLANTIA GROUP S RESULTS ANNOUNCEMENT FOR NINE MONTHS ENDED 30 SEPTEMBER 2017 Consolidated results (1) Motorway traffic on Group s network up 2.3% in 9M 2017 (up 2.9% after stripping out
Interim report for the three month ended 31 March 2008
 Interim report for the three month ended 31 March 2008 Interim report for the three month ended 31 March 2008 ATLANTIA SpA Issued capital: 571,711,557.00, fully paid-up Tax code, VAT number and Rome Companies
Consolidated interim report for the six months ended 30 June 2014
 Consolidated interim report for the six months ended 30 June 2014 Consolidated interim report for the six months ended 30 June 2014 This page intentionally left blank Contents Contents 1. Introduction...
Consolidated interim report for the six months ended 30 June 2013
 Consolidated interim report for the six months ended 30 June 2013 Contents 1. Introduction... 5 Consolidated financial highlights... 6 Shareholders... 7 Atlantia share price performance... 8 Group structure...
Autostrade per l Italia S.p.A. (incorporated as a joint stock company in the Republic of Italy)
") SUPPLEMENT DATED 8 SEPTEMBER 2017 TO THE OFFERING CIRCULAR DATED 27 OCTOBER 2016 Autostrade per l Italia S.p.A. (incorporated as a joint stock company in the Republic of Italy) 7,000,000,000 Euro Medium
SUPPLEMENT DATED 8 SEPTEMBER 2017 TO THE OFFERING CIRCULAR DATED 27 OCTOBER 2016 Autostrade per l Italia S.p.A. (incorporated as a joint stock company in the Republic of Italy) 7,000,000,000 Euro Medium
BOARD APPROVES CONSOLIDATED AND SEPARATE FINANCIAL STATEMENTS FOR 2010
 Press Release BOARD APPROVES CONSOLIDATED AND SEPARATE FINANCIAL STATEMENTS FOR 2010 Consolidated results Consolidated revenue of 3,750m in 2010 up 7.5% on 2009. On like-for-like basis 1 total revenue
BOARD APPROVES REPORT FOR Q1 2013
 Press Release BOARD APPROVES REPORT FOR Q1 2013 Consolidated revenue of 925m up 8.0% on Q1 2012. On like-for-like basis, total revenue is down 2.0% Motorway traffic on the network operated under concession
14 May Overview of the Adoption of IFRIC 12
 14 May 2010 Overview of the Adoption of IFRIC 12 First Time Application of IFRIC 12 This document is solely intended to provide a general overview of the principal effects on Atlantia s consolidated financial
2013 ANNUAL REPORT ANNUAL REPORT
 2013 ANNUAL REPORT CONTENTS 1. Highlights and overview 3 2. Introduction 3. Report on operations 4. Financial statements and notes 13 17 73 5. Reports 181 6. Key indicators extracted from the most recent
ANNUAL REPORT Autostrade per l Italia SpA Company subject to management and coordination by Atlantia SpA
 ANNUAL REPORT 2013 Autostrade per l Italia SpA Company subject to management and coordination by Atlantia SpA Issued capital: 622,027,000 (fully paid-in) Tax code, VAT number and Rome Companies Register
SUPPLEMENT DATED 8 SEPTEMBER 2010 TO THE OFFERING CIRCULAR DATED 22 OCTOBER Atlantia S.p.A.
 SUPPLEMENT DATED 8 SEPTEMBER 2010 TO THE OFFERING CIRCULAR DATED 22 OCTOBER 2009 Atlantia S.p.A. (incorporated as a joint stock company in the Republic of Italy) Unconditionally and irrevocably guaranteed
Consolidated revenue of 877m up 7.7% on Q On like-for-like basis 1 total revenue
 Press Release BOARD APPROVES Q1 REPORT FOR 2011 Consolidated revenue of 877m up 7.7% on Q1 2010. On like-for-like basis 1 total revenue up 2.7% Gross operating profit (EBITDA) of 524m up 8.1% Profit attributable
This page intentionally left blank
 Annual Report 2 3 This page intentionally left blank Contents 1. Introduction... 24 Consolidated financial highlights... 5 Key market data for Atlantia... 6 Ownership structure... 7 Share price performance...
ATLANTIA GROUP S RESULTS ANNOUNCEMENT FOR NINE MONTHS ENDED 30 SEPTEMBER 2018
 Press release ATLANTIA GROUP S RESULTS ANNOUNCEMENT FOR NINE MONTHS ENDED 30 SEPTEMBER 2018 Consolidated results for 9M 2018 (1) Traffic on Group s Italian motorway network up 0.3% (2) Traffic using Group
Annual Report
 Annual Report 2010 1 2 (This page intentionally left blank) Contents 1. Introduction... 5 Milestones... 6 Who we are... 8 Consolidated financial highlights... 9 Shareholder structure and share price performance...
Annual report
 Annual report 2009 1 1 (This page intentionally left blank) Contents 1. Introduction... 4 Corporate bodies... 6 Consolidated financial highlights... 7 Key market data... 8 Shareholder structure and share
9% on Q Capital expenditure of 236.5m up 7% on same period of 2008
 Press Release BOARD APPROVES Q1 REPORT FOR 2009 Traffic volumes down 3.1% on Q1 2009 on a like-for for-like basis (down 6.9% without adjusting for calendar and extraordinary events); same traffic trend
Interim report for the three month ended 31 March 2009
 Interim report for the three month ended 31 March 2009 ATLANTIA SpA Issued capital: 571,711,557.00, fully paid-up Tax code, VAT number and Rome Companies Register no. 03731380261 REA no. 1023691 Registered
Press Release BOARD APPROVES NINE-MONTH REPORT FOR 2009
 Press Release BOARD APPROVES NINE-MONTH REPORT FOR 2009 Signs of progressive recovery in traffic using Group s network as rate of decline eases to 0.7% in first nine months of year (1.9% after taking account
BOARD APPROVES INTERIM CONSOLIDATED RESULTS FOR SIX MONTHS ENDED 30 JUNE 2009
 Press Release BOARD APPROVES INTERIM CONSOLIDATED RESULTS FOR SIX MONTHS ENDED 30 JUNE 2009 Traffic down 2.4%% (-1.9% on like-for-like basis due to the leap year in 2008) on motorway network managed by
ANNUAL REPORT Autostrade per l Italia SpA Company subject to management and coordination by Atlantia SpA
 ANNUAL REPORT 2012 Autostrade per l Italia SpA Company subject to management and coordination by Atlantia SpA Issued capital: 622,027,000 (fully paid-in) Tax code, VAT number and Rome Companies Register
Press Release BOARD APPROVES 2009 FINANCIAL STATEMENTS. Consolidated results
 Press Release BOARD APPROVES 2009 FINANCIAL STATEMENTS Consolidated results Decline in traffic using the Group s Italian network in 2009 limited to 0.13% versus 2008. On like-for-like basis, traffic is
BOARD APPROVES HALF YEAR FINANCIAL REPORT FOR 2008
 Press release BOARD APPROVES HALF YEAR FINANCIAL REPORT FOR 2008 The basis of consolidation from the first half of 2008 now includes the Polish Stalexport Autostrady Group and the U. S. company, Electronic
Press Release BOARD APPROVES 2008 FINANCIAL STATEMENTS
 Press Release BOARD APPROVES 2008 FINANCIAL STATEMENTS Group s consolidated results Consolidated revenue of 3,477m up 6.3% on 2007, partly thanks to consolidation, from 1 January 2008, of US company, Electronic
Annual Report Annual Report
 Annual Report Annual Report 2013 Contents Contents 1. Introduction... 5 Highlights... 6 Consolidated financial highlights... 12 Key market data for Atlantia... 13 Ownership structure... 14 Share price
ICAP plc Annual Report 2016 FINANCIAL STATEMENTS. Strategic report. Page number
 FINANCIAL STATEMENTS ICAP plc Annual Report 77 Strategic report Page number Consolidated income statement 78 Consolidated statement of comprehensive income 80 Consolidated and Company balance sheet 81
Separate financial. statement. Separate financial. statement.
 Separate financial www.a2a.eu statement 2011 Separate financial 2011 statement Contents 3 Overview of performance, financial conditions and net debt 0.1 Financial statements 12 Balance sheet 14 Income
ANNEX I GENERAL. 2nd 2017 HALF-YEARLY FINANCIAL REPORT FOR FINANCIAL YEAR REPORTING DATE 12/31/ /07/2018 I. IDENTIFICATION DATA
 ANNEX I GENERAL 2nd 2017 HALF-YEARLY FINANCIAL REPORT FOR FINANCIAL YEAR REPORTING DATE PUBLICATION DATE 02/07/2018 I. IDENTIFICATION DATA Registered Company Name: ABERTIS INFRAESTRUCTURAS, S.A Registered
CONSOLIDATED FINANCIAL STATEMENTS
 CONSOLIDATED FINANCIAL STATEMENTS FOR THE YEAR ENDED 31 DECEMBER ENDESA, S.A. AND SUBSIDIARIES CONSOLIDATED STATEMENTS OF FINANCIAL POSITION AT 31 DECEMBER AND 31 DECEMBER ASSETS 31 December 31 December
RESULTS AT 31 MARCH 2018
 RESULTS AT 31 MARCH 2018 Disclaimer This Interim Reporting at 31 March 2018 has been translated into English solely for the convenience of the international reader. In the event of conflict or inconsistency
CONSOLIDATED FINANCIAL STATEMENTS
 CONSOLIDATED FINANCIAL STATEMENTS FOR THE SIX MONTHS ENDED 30 JUNE 2017 ENDESA, S.A. AND SUBSIDIARIES CONSOLIDATED STATEMENTS OF FINANCIAL POSITION AT 30 JUNE 2017 AND 31 DECEMBER 2016 (*) Unaudited ASSETS
86 MARKS AND SPENCER GROUP PLC FINANCIAL STATEMENTS CONSOLIDATED INCOME STATEMENT
 86 CONSOLIDATED INCOME STATEMENT Notes Underlying 53 weeks ended 2 April 52 weeks ended 28 March Non-underlying Underlying Non-underlying Revenue 2, 3 10,555.4 10,555.4 10,311.4 10,311.4 Operating profit
Financial Statements
 Financial Statements Financial statements Consolidated income statement Note Trading Acquisition and disposal costs Exceptional items Revenue 1 1,276 1,276 Operating expenses 3 (1,026) (59) (75) (1,160)
PRESS RELEASE. Results of the UBI Group for the period ended 30 th June 2018
 PRESS RELEASE Results of the UBI Group for the period ended 30 th June 2018 Stated net profit for the first half of 208.9 million Profit net of non-recurring items of 222.1 million, the best result in
STALEXPORT AUTOSTRADY S.A. CAPITAL GROUP CONDENSED CONSOLIDATED INTERIM FINANCIAL STATEMENTS
 STALEXPORT AUTOSTRADY S.A. CAPITAL GROUP CONDENSED CONSOLIDATED INTERIM FINANCIAL STATEMENTS for the three-month period ended 31 March 2012 Katowice, 9 May 2012 Contents Condensed consolidated interim
FINANCIAL STATEMENTS 31 DECEMBER 2017
 CARRARO S.p.A. Registered office in Campodarsego, Padua (Italy) Via Olmo 37 Share Capital 41,452,543.60 Euros, fully paid-up Tax Code/VAT Registration Number and In the Padua Companies Register 00202040283
Consolidated Income Statement (*)
") 130 Income Statement Income Statement (*) ( million) Note (*) 2010 Net revenues (1) 59,559 35,880 Cost of sales (2) 50,704 30,718 Selling, general and administrative costs (3) 5,047 2,956 Research and
130 Income Statement Income Statement (*) ( million) Note (*) 2010 Net revenues (1) 59,559 35,880 Cost of sales (2) 50,704 30,718 Selling, general and administrative costs (3) 5,047 2,956 Research and
PRESS RELEASE PRYSMIAN S.P.A. RESULTS AT 31 DECEMBER 2018*
 PRESS RELEASE PRYSMIAN S.P.A. RESULTS AT 31 DECEMBER 2018* COMBINED SALES (INCLUDING GENERAL CABLE FOR FULL YEAR 2018) AT 11,524M WITH +2.8% ORGANIC GROWTH ADJUSTED COMBINED EBITDA (INCLUDING GENERAL CABLE
(Translation from the Italian original which remains the definitive version)
") (Translation from the Italian original which remains the definitive version) DRAFT 2015 FINANCIAL STATEMENTS EVENTS AFTER THE REPORTING DATE GOING CONCERN OUTLOOK FOR 2016 ANNUAL REPORT ON CORPORATE GOVERNANCE
(Translation from the Italian original which remains the definitive version) DRAFT 2015 FINANCIAL STATEMENTS EVENTS AFTER THE REPORTING DATE GOING CONCERN OUTLOOK FOR 2016 ANNUAL REPORT ON CORPORATE GOVERNANCE
ATTACHMENTS TO THE PRESS RELEASE
 ATTACHMENTS TO THE PRESS RELEASE ALTERNATIVE PERFORMANCE MEASURES In this press release in addition to the conventional financial performance measures established by IFRS, certain alternative performance
BE VANDEMOORTELE NV 3 KEY FINANCIAL FIGURES
 BE 0429 977 343 VANDEMOORTELE NV 3 KEY FINANCIAL FIGURES BE 0429 977 343 VANDEMOORTELE NV 4 BE 0429 977 343 VANDEMOORTELE NV 5 CONSOLIDATED INCOME STATEMENT As the shares are not traded in a public market,
THE GALA CORAL GROUP PRELIMINARY INTERNATIONAL FINANCIAL REPORTING STANDARDS (IFRS) TRANSITION STATEMENTS
 TRANSITION STATEMENTS") THE GALA CORAL GROUP PRELIMINARY INTERNATIONAL FINANCIAL REPORTING STANDARDS (IFRS) TRANSITION STATEMENTS INTRODUCTION Implementation of International Financial Reporting Standards ( IFRS ) For the year
THE GALA CORAL GROUP PRELIMINARY INTERNATIONAL FINANCIAL REPORTING STANDARDS (IFRS) TRANSITION STATEMENTS INTRODUCTION Implementation of International Financial Reporting Standards ( IFRS ) For the year
B&C SPEAKERS GROUP. INTERIM REPORT at September,
 B&C SPEAKERS GROUP INTERIM REPORT at September, 30 2016 The Board of Directors November, 11 2016 CONTENTS 1 THE COMPANY B&C SPEAKERS S.P.A. CORPORATE BODIES... 3 2 INTRODUCTION... 4 3 THE MAIN ASPECTS
Change of accounting policy: consolidation by equity method of jointly controlled entities
 Change of : consolidation by equity method of jointly controlled entities 1. Accounting principles To improve its financial information, the VINCI Group has elected to apply, as from the financial year
IFRS First-time adoption at 1 January 2004 Main impacts on the financial statements. 9 February 2005
 IFRS First-time adoption at 1 January 2004 Main impacts on the financial statements 9 February 2005 Warning This document presents a summary of the impacts on VINCI's financial statements of the IFRSs
ATLANTIA: period from 7 May 2009 to 12 May 2010 NATURE OF INFORMATION SOURCE PUBLICATION DATE
 ATLANTIA: period from 7 May 2009 to 12 May 2010 NATURE OF INFORMATION SOURCE PUBLICATION DATE Release announcing approval of quarterly report for Q1 2009 Release announcing Board of Statutory Auditors
2007 Financial Statements. Consolidated Financial Statements of the Nestlé Group Financial Statements of Nestlé S.A.
 2007 Financial Statements Consolidated Financial Statements of the Nestlé Group Financial Statements of Nestlé S.A. Consolidated Financial Statements of the Nestlé Group Principal exchange rates...2 Consolidated
Notes to the Group Financial Statements
 Notes to the Group Financial Statements 1. Exchange rates The results of operations have been translated into US dollars at the average rates of exchange for the year. In the case of sterling, the translation
TRANSITION TO INTERNATIONAL ACCOUNTING STANDARDS STATUTORY FINANCIAL STATEMENTS. ENGINEERING INGEGNERIA INFORMATICA SpA
 TRANSITION TO INTERNATIONAL ACCOUNTING STANDARDS STATUTORY FINANCIAL STATEMENTS ENGINEERING INGEGNERIA INFORMATICA SpA Index Introduction... 2 Changes in accounting policies, errors, and changes in estimates...
Consolidated Statement of Profit or Loss (in million Euro)
") Consolidated Statement of Profit or Loss (in million Euro) Q3 2015 Q3 2016 % change 9m 2015 9m 2016 % change Revenue 661 625-5.4% 1,974 1,873-5.1% Cost of sales (453) (415) -8.4% (1,340) (1,239) -7.5%
Consolidated Statement of Profit or Loss (in million Euro) Q3 2015 Q3 2016 % change 9m 2015 9m 2016 % change Revenue 661 625-5.4% 1,974 1,873-5.1% Cost of sales (453) (415) -8.4% (1,340) (1,239) -7.5%
GEFRAN GROUP INTERIM FINANCIAL STATEMENTS AT 31 MARCH 2018
 1 GEFRAN GROUP INTERIM FINANCIAL STATEMENTS AT 31 MARCH 2018 2 3 SUMMARY 1. CORPORATE BODIES... 5 2. ALTERNATIVE PERFORMANCE INDICATORS... 6 3. STRUCTURE OF THE GEFRAN GROUP... 7 4. KEY CONSOLIDATED INCOME
Consolidated Statement of Profit or Loss (in million Euro)
") Consolidated Statement of Profit or Loss (in million Euro) Q1 2016 Q1 2017 % change Revenue 603 588-2.5% Cost of sales (408) (396) -2.9% Gross profit 195 192-1.5% Selling expenses (84) (86) 2.4% Research
Consolidated Statement of Profit or Loss (in million Euro) Q1 2016 Q1 2017 % change Revenue 603 588-2.5% Cost of sales (408) (396) -2.9% Gross profit 195 192-1.5% Selling expenses (84) (86) 2.4% Research
Piaggio & C. S.p.A. FINANCIAL POSITION AND PERFORMANCE OF PIAGGIO & C. S.p.A.
 Piaggio & C. S.p.A. Financial statements as of 31 December 2009 FINANCIAL POSITION AND PERFORMANCE OF PIAGGIO & C. S.p.A. In millions of Euro 2009 2008 Income statement (reclassified) Net revenues 1,125.8
Company Financial Statements. Subsidiaries 175 Joint Ventures and Associates 181
 Rolls-Royce Holdings plc Annual Report 115 Consolidated Company FINANCIAL STATEMENTS Consolidated Income Statement 116 Consolidated Statement of Comprehensive Income 117 Consolidated Balance Sheet 118
Finance$Case$ Studies$
 Finance$Case$ Studies$ Ted$Wainman$ ted@wainman.net$ 07802$863$768$ Annual Report and Accounts 2012/13 National Grid plc Trusted to connect ng1 Financial Statements Consolidated income statement for the
CONSOLIDATED INTERIM REPORT AS AT MARCH 31, 2017
 CONSOLIDATED INTERIM REPORT AS AT MARCH 31, 2017 Contents Governing and Control Bodies Consolidated Interim Report on Operations Consolidated Interim Financial Statement Explanatory Notes 3 Consolidated
Alternative format. Illustrative consolidated financial statements for the year ended 31 December International GAAP
 IFRS Core Tools Good Group (International) Limited Alternative format Illustrative consolidated financial statements for the year ended 31 December 2018 International GAAP Contents Abbreviations and key...
PRESS RELEASE. Results as at 31 March 2017 of the UBI Group
 PRESS RELEASE Results as at 31 March 2017 of the UBI Group The first quarter saw the completion of important strategic initiatives to evolve the Group s business and operating model in accordance with
Financial statements. Contents. Responsibility statements 94 Independent auditors report to the members of Anglo American plc 95
 Contents Responsibility statements 94 Independent auditors report to the members of Anglo American plc 95 Principal statements Consolidated income statement 96 Consolidated statement of comprehensive income
IFRS INDIVIDUAL FINANCIAL STATEMENTS
 IFRS INDIVIDUAL FINANCIAL STATEMENTS 2017 IFRS individual financial statements at 31 December 2017 IFRS INDIVIDUAL FINANCIAL STATEMENTS AT 31 DECEMBER 2017 2 Income statement 2 Statement of comprehensive
Introduction Consolidated statement of comprehensive income for the year ended 31 December 20XX... 6
 PKF International Limited administers a network of legally independent member firms which carry on separate businesses under the PKF Name. PKF International Limited is not responsible for the acts or omissions
(Translation from the Italian original which remains the definitive version)
") (Translation from the Italian original which remains the definitive version) DRAFT 2016 FINANCIAL STATEMENTS EVENTS AFTER THE REPORTING DATE GOING CONCERN AND OUTLOOK FOR 2017 ANNUAL REPORT ON CORPORATE
(Translation from the Italian original which remains the definitive version) DRAFT 2016 FINANCIAL STATEMENTS EVENTS AFTER THE REPORTING DATE GOING CONCERN AND OUTLOOK FOR 2017 ANNUAL REPORT ON CORPORATE
UNITED BANK FOR AFRICA PLC
 Consolidated Financial Statements for the three months ended 31 March 2015 NOTES TO THE FINANCIAL STATEMENTS UNITED BANK FOR AFRICA PLC SIGNIFICANT ACCOUNTING POLICIES 1 Reporting entity United Bank for
Good Group (International) Limited
 Limited") IFRS Core Tools Good Group (International) Limited Alternative Format Illustrative consolidated financial statements for the year ended 31 December 2016 International GAAP Contents Abbreviations and key...2
IFRS Core Tools Good Group (International) Limited Alternative Format Illustrative consolidated financial statements for the year ended 31 December 2016 International GAAP Contents Abbreviations and key...2
New Orders at EUR 8 billion, + 5% organically, thanks to all Divisions
 Results at 30 September 2017 Leonardo: Nine months results in line with expectations in Aeronautics and Defence Electronics. Revenue and EBITA 2017 Guidance updated due to Helicopters. Confirming core
Esprinet 2014 results approved by the Board
 Press release in accordance with Consob regulation n. 11971/99 Esprinet 2014 results approved by the Board Complete reversal to 75.6 million of the investment value in the Iberica subsidiary with a revaluation
A P P E N D I C E S B U S I N E S S A S U N U S U A L
 BUSINESS AS UNUSUAL A P P E N D I C E S 112 APPENDIX I. FINANCIAL SUMMARY APPENDIX I FINANCIAL SUMMARY CONSOLIDATED BALANCE SHEET FOR 2017 AND 2016 ASSETS 31.12.2017 31.12.2016 Property, plant and equipment
EXTENDED CONSOLIDATED REPORT OF THE CIECH GROUP FOR THE FIRST HALF OF 2016
 We are providing a courtesy English translation of our audited financial statements which were originally written in Polish. We take no responsibility for the accuracy of our translation. For an accurate
Consolidated Financial Statements AT DECEMBER 31, 2016
 AT DECEMBER 31, 2016 Index to Income Statement 136 Statement of Comprehensive Income/(Loss) 137 Statement of Financial Position 138 Statement of Cash Flows 139 Statement of Changes in Equity 140 Notes
For personal use only
 PRELIMINARY FINAL REPORT RULE 4.3A APPENDIX 4E APN News & Media Limited ABN 95 008 637 643 Preliminary final report Full year ended 31 December Results for Announcement to the Market As reported Revenue
BLUESCOPE STEEL LIMITED FINANCIAL REPORT 2011/2012
 BLUESCOPE STEEL LIMITED FINANCIAL REPORT / ABN 16 000 011 058 Annual Financial Report - Page Financial statements Statement of comprehensive income 2 Statement of financial position 3 Statement of changes
2013 HALF-YEAR FINANCIAL STATEMENTS (Translation into English of the original Italian version)
") 2013 HALF-YEAR FINANCIAL STATEMENTS (Translation into English of the original Italian version) JOINT-STOCK COMPANY - SHARE CAPITAL EURO 60,768,339.84 MANTOVA COMPANY REGISTER AND TAX CODE 00607460201 COMPANY
2013 HALF-YEAR FINANCIAL STATEMENTS (Translation into English of the original Italian version) JOINT-STOCK COMPANY - SHARE CAPITAL EURO 60,768,339.84 MANTOVA COMPANY REGISTER AND TAX CODE 00607460201 COMPANY
INTERIM FINANCIAL REPORT AT 30 SEPTEMBER 2012 FINMECCANICA
 INTERIM FINANCIAL REPORT AT 30 SEPTEMBER 2012 FINMECCANICA Disclaimer This Interim Financial Report at 30 September 2012 has been translated into English solely for the convenience of the international
BANCA CARIGE HALF YEARLY REPORT AT 30 JUNE 2005 IAS/IFRS COMPLIANT: INTERIM NET PROFIT OF MILLION EURO (CONSOLIDATED NET PROFIT OF 82.
 PRESS RELEASE Ufficio Comunicazione e Immagine Phone: +39 010 579 2697 Fax: +39 010 579 4927 BANCA CARIGE HALF YEARLY REPORT AT 30 JUNE 2005 IAS/IFRS COMPLIANT: INTERIM NET PROFIT OF 103.5 MILLION EURO