BOARD APPROVES AUTOSTRADE PER L ITALIA GROUP S INTERIM REPORT FOR SIX MONTHS ENDED 30 JUNE 2016
|
|
|
- Brenda O’Connor’
- 6 years ago
- Views:
Transcription

1 Press Release BOARD APPROVES AUTOSTRADE PER L ITALIA GROUP S INTERIM REPORT FOR SIX MONTHS ENDED 30 JUNE 2016 Consolidated results (1) Motorway traffic on Group s Italian network up 3.8% in H Increase in traffic using overseas network H totals 1.9%, after negative impact of crisis in Brazil Gross operating profit (EBITDA) of 1,350m up 4% on H (up 6% on like-forlike basis) Profit for period attributable to owners of parent amounts to 379m, down 8% mainly due to negative impact of discounting provisions for repair and replacement of motorway infrastructure (up 4% on like-for-like basis) Group capital expenditure totals 386m in H Operating cash flow totals 929m for H1 2016, up 9% on H (up 4% on likefor-like basis) Group s net debt at 30 June 2016 totals 10,521m, up 179m compared with 31 December 2015 (1) In addition to the reported amounts in the consolidated financial statements, this press release also presents and analyses alternative performance indicators ( APIs ), such as EBITDA, operating cash flow and capital expenditure, etc.. A detailed description of the principal APIs, including an explanation of the term "like-for-like basis", used in the following consolidated financial review, is provided below. Investor Relations investor.relations@autostrade.it Media Relations ufficiostampa@autostrade.it
2 Rome, 4 August 2016 Today s meeting of the Board of Directors of Autostrade per l Italia SpA, chaired by Fabio Cerchiai, has approved the Autostrade per l Italia Group s interim report for the six months ended 30 June 2016 ( H ), which will be published within the deadline established by the relevant statutory requirements, together with the results of the audit currently in progress. The consolidated accounts presented in the interim report have been prepared in accordance with the IFRS in effect at 30 June Consolidated financial review Introduction The accounting standards applied during preparation of this document are consistent with those adopted for the consolidated financial statements for the year ended 31 December 2015, in that the amendments to existing standards that have come into effect from 1 January 2016 have not had a material impact on the consolidated accounts. The scope of consolidation at 30 June 2016 is unchanged with respect to 31 December However, it should be noted that the first half of 2016 benefits from the contribution of Autostrada Tirrenica (SAT), consolidated from September The Group did not enter into non-recurring, atypical or unusual transactions during the first quarter of 2016, either with third or related parties. The amounts analysed below have been extracted from the reclassified consolidated financial statements attached to this release. In this regard, it should be noted that the Autostrade per l Italia Group s interim report for the six months ended 30 June 2016, which will be published within the deadline established by the relevant statutory requirements, includes the reconciliation of the reclassified and reported amounts published in the condensed consolidated interim financial statements Results Operating revenue Operating revenue for the first half of 2016 totals 2,143m, up 55m (3%) on the same period of 2015 ( 2,088m). Toll revenue of 1,875m is up 65m (4%) compared with the first half of 2015 ( 1,810m). At constant exchange rates, which in the first half of 2016 have had a negative impact of 2
3 40m, toll revenue is up 105m, primarily reflecting a combination of the following main factors: a 3.8% increase in traffic on the Italian network (up 3.3% after stripping out the leapyear effect) and the application of annual toll increases (up 1.09% at Autostrade per l Italia), boosting toll revenue by approximately 68m; an improved contribution from overseas operators (up 18m); SAT s contribution for the first half of 2016, totalling 15m. Other operating income of 255m is down 7m (3%) on the first half of After stripping out the effect of exchange rate movements ( 2m), the reduction is 5m, primarily reflecting reduced activity at Autostrade Tech, due to the lower volume of tolling and Tutor speedcheck systems supplied to external customers, and a reduction in Autostrade per l Italia s service area royalties, linked to the discounts granted to operators at areas where concessions were renewed in the first half of These decreases were partially offset by an increase in turnover at Telepass and SAT s contribution for the first half of Operating costs Net operating costs of 793m are in line with the figure for the first half of 2015 ( 792m). Net operating costs in the first half of 2016 essentially reflect the following: a reduction of 11m in the cost of materials and external services compared with the first half of 2015; after stripping out the effect of exchange rate movements, the cost of materials and external services is down 6m, primarily due to reduced operating costs incurred by Autostrade Tech and Autostrade per l Italia, partially offset by an increase in maintenance costs at overseas operators, above all as a result of maintenance cycles and resurfacing work on the Brazilian network, and SAT s contribution for the first half of 2016; a 9m (4%) increase in concession fees compared with the first half of 2015, primarily in line with the increase in toll revenue at the Italian operators; a 3m (1%) increase in staff costs, after deducting capitalised expenses, compared with the first six months of Staff costs, before deducting capitalised expenses, amount to 307m, marking an increase of 6m (2%) on the first half of At constant exchange rates, staff costs, before deducting capitalised expenses, amount to 310m, 3
4 an increase of 9m (3.3%) on the first half of This reflects a combination of the following: an increase in the average unit cost (up 1.6%), primarily due to the cost of contract renewals at the Group s Italian companies, partially offset by the reduced cost of incentive plans for management, early retirement incentives and the hiring of staff on different forms of contract by the Brazilian companies; an increase of 177 in the average workforce excluding agency staff (up 1.7%), primarily attributable to an increase in the Brazilian companies workforce (up 103 on average), following the decision to insource routine maintenance, and SAT s contribution for the first half of 2016 (up 75 on average). Results Gross operating profit (EBITDA) of 1,350m is up 54m (4%) on the first half of 2015 ( 1,296m). On a like-for-like basis, gross operating profit is up 75m (6%). Amortisation, depreciation, impairment losses and reversals of impairment losses amount to 350m, in line with the figure for the first half of The operating change in provisions and other adjustments is down 166m compared with the first half of This primarily reflects the different performance of provisions for the repair and replacement of motorway infrastructure, which in the first half of 2016 reflect charges of 108m following an adjustment to the present value of the provisions to reflect the significant decline in the related interest rates. In the first half of 2015, discounting of the provisions resulted in income of 63m due to increases in the matching interest rates. Operating profit (EBIT) of 877m is down 113m (11%) compared with the first half of 2015 ( 990m). Compared with the improvement in EBITDA, this reduction essentially reflects the negative impact of the above discounting of provisions for the repair and replacement of motorway infrastructure. Net other financial expenses of 234m are down 99m on the first half of 2015 ( 333m). The decrease primarily reflects the reduction in financial expenses incurred by the Group following partial early repayment of loans from the parent, Atlantia, matching bonds issued by the latter and maturing in 2016, 2017, 2019 and 2020, which were subject to a partial buyback by Atlantia (total expenses of 10m in the first half of 2016 and 82m in the first 4
5 half of 2015). The reduction also reflects reversal of the impairment loss of 25m on the carrying amount of the investment in the Portuguese operator, Lusoponte. Income tax expense for the first half of 2015 amounts to 212m, down 3m (1%) compared with the first half of 2015 ( 215 m). The reduction is proportionately less than the change in profit before tax, essentially due to the differing impact, in the two comparative periods, of the tax effects linked to the measurement of certain investments. Profit for the period attributable to owners of the parent, amounting to 379m, is down 32m (8%) on the first half of 2015 ( 411m). On a like-for-like basis, essentially stripping out the negative impact of discounting provisions for the repair and replacement of motorway infrastructure, the figure is up 16m (4%). Operating cash flow for the first half of 2016 amounts to 929m, up 73m on the first half of On a like-for-like basis, operating cash flow amounts to 951m, marking an increase of 33m (4%) on the first half of At 30 June 2016, the Group s net debt amounts to 10,521m, an increase of 179m compared with 31 December 2015, whilst cash reserves (consisting of cash, term deposits and undrawn committed lines of credit) amount to 4,803m. 5
6 Outlook Despite the continuing instability of the global economy, consolidated gross operating profit is expected to register an improvement in the current year. Italian motorways Traffic trends on the Group s Italian motorway network continue to show signs of a recovery. In addition, Autostrada Tirrenica will contribute to the full-year results and there will be a reduction in the royalties generated by service areas, partly as a result of the award of new sub-concessions. Overseas motorways Traffic continues to register overall traffic growth, with the exception of Brazil, where the performance of the local economy continues to weigh. The related contribution to the Group s results is, however, subject to movements in the respective currencies. The Group s results for 2016 will also benefit from the reduction in the cost of debt, thanks to the steps taken in 2015 to improve the capital structure. 6
7 Alternative performance indicators In application of the CONSOB Ruling of 3 December 2015, which applies the guidelines for alternative performance indicators ( APIs ) issued by the European Securities and Markets Authority (ESMA), and which are mandatory in order to meet regulatory reporting requirements or for accounts published after 3 July 2016, the basis used in preparing the APIs published by the Autostrade per l Italia Group is described below. The APIs shown in this release are deemed relevant to an assessment of the operating performance based on the Group s overall results and its operating segments. In addition, the APIs provide an improved basis for comparison of the results over time, even if they are not a replacement for or an alternative to the results published on a reported basis in accordance with international financial reporting standards (IAS/IFRS) in the condensed consolidated interim financial statements. With regard to the APIs relating to the consolidated results, as the Autostrade per l Italia Group presents the following reclassified financial statements as attachments to this release: the reclassified consolidated income statement, the reclassified consolidated statement of financial position and the consolidated statement of cash flows. In addition to amounts from the income statement and statement of financial position prepared under IAS/IFRS, these reclassified financial statements thus present a number of indicators and items derived from them, even when they are not required by the above standards and are, therefore, identifiable as APIs. A list of the APIs used in this release, together with a brief description and a reconciliation with reported amounts, is provided below: Gross operating profit (EBITDA) is the synthetic indicator of earnings from operations, calculated by deducting operating costs, with the exception of amortisation, depreciation, impairment losses and reversals of impairment losses, the operating change in provisions and other adjustments, from operating revenue; Operating profit (EBIT) is the indicator that measures the return on invested capital, calculated by deducting amortisation, depreciation, impairment losses and reversals of impairment losses, the operating change in provisions and other adjustments from EBITDA. Like EBITDA, EBIT does not include the capitalised component of financial expenses relating to construction services, which is shown in a specific item under financial income and expenses in the reclassified statement, whilst being included in 7
8 revenue in the income statement in the consolidated financial statements, on a reported basis; Net invested capital, showing the total value of non-financial assets, after deducting non-financial liabilities; Net debt, indicating the portion of net invested capital funded by net financial liabilities, calculated by deducting Current and non-current financial assets from Current and non-current financial liabilities ; Capital expenditure, indicating the total amount invested in development of the Group s businesses, calculated as the sum of cash used in investment in property, plant and equipment, in assets held under concession and in other intangible assets, excluding investment linked to transactions involving investees; Operating cash flow, indicating the cash generated by or used in operating activities. Operating cash flow is calculated as profit for the period + amortisation/depreciation +/- impairments/reversals of impairments of assets +/- provisions/releases of provisions + other adjustments + financial expenses from discounting of provisions +/- share of profit/(loss) of investees accounted for using equity method +/- (losses)/gains on sale of assets +/- other non-cash items +/- portion of net deferred tax assets/liabilities recognised in profit or loss. A number of API s, calculated as above, are also presented after deducting certain adjustments applied in order to provide a consistent basis for comparison over time. These adjustments to APIs are linked to the Like-for-like changes used in the analysis of changes in gross operating profit (EBITDA), profit for the period, profit for the period attributable to owners of the parent and operating cash flow, and calculated by excluding, where present, the impact of: (i) changes in the scope of consolidation; (ii) changes in exchange rates on the value of assets and liabilities denominated in functional currencies other than the euro; and (iii) events and/or transactions not strictly connected with operating activities that have an appreciable influence on amounts for at least one of the two comparative periods. In particular, like-for-like amounts for the two comparative periods have been determined by eliminating: a) from consolidated amounts for the first half of 2016: 1) SAT s contribution for the first half of 2016, as this represents a change in the scope of consolidation compared with the first half of 2015; 8
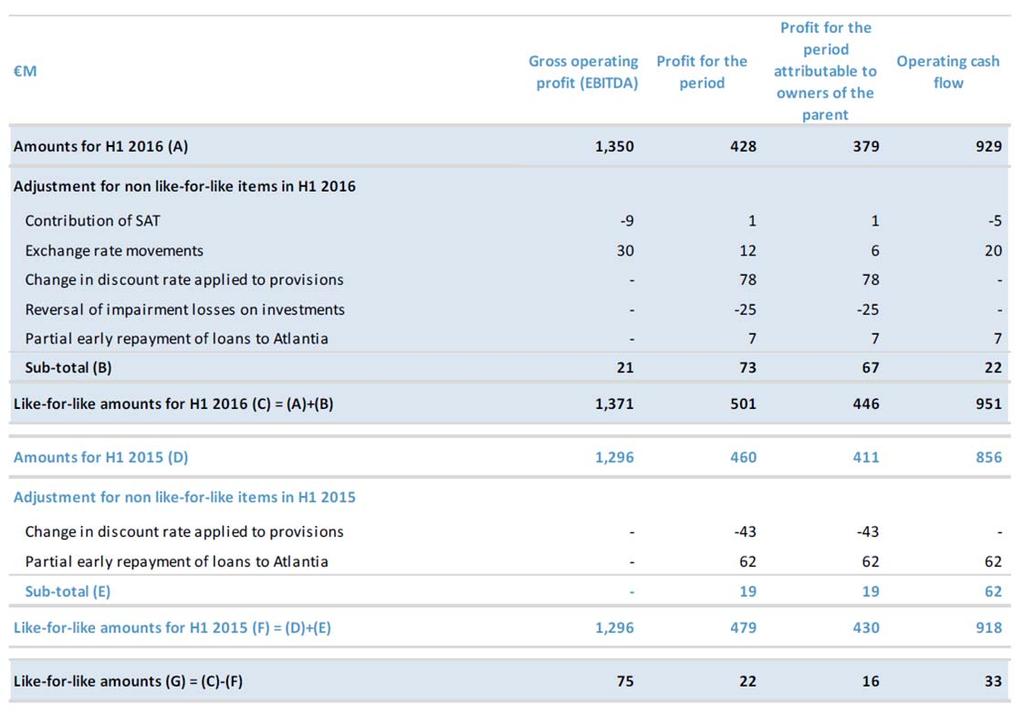
9 2) the difference between foreign currency amounts for the first half of 2016 for companies with functional currencies other than the euro, converted at average exchange rates for the period, and the matching amounts converted using average exchange rates for the same period of 2015; 3) the after-tax impact of the difference in the discount rates applied to the provisions accounted for among the Group s liabilities; 4) the financial income generated by reversal of the impairment loss on the investment in Lusoponte; 5) the financial expenses, after the related taxation, linked to the partial early repayment of medium/long-term loans from the parent, Atlantia; b) from consolidated amounts for the first half of 2015: 1) the after-tax impact of the difference in the discount rates applied to the provisions accounted for among the Group s liabilities; 2) the overall impact, including the related taxation, of the partial early repayment of certain medium/long-term loans from the parent, Atlantia, maturing in 2016, 2017 and The following table shows the reconciliation of like-for-like consolidated amounts for gross operating profit (EBITDA), profit for the period, profit for the period attributable to owners of the parent and operating cash flow for the comparative periods and the corresponding amounts presented in the reclassified consolidated income statement. 9
10 10
11 * * * The manager responsible for financial reporting, Giancarlo Guenzi, declares, pursuant to section 2 of article 154 bis of the Consolidated Finance Act, that the accounting information contained in this release is consistent with the underlying accounting records. The Group s net debt, as defined in the European Securities and Market Authority ESMA Recommendation of 20 March 2013 (which does not entail the deduction of non-current financial assets from debt), amounts to 12,520m at 30 June 2016, compared with 12,117m at 31 December The Autostrade per l Italia Group s reclassified income statement and statement of financial position, the statement of comprehensive income and the statement of cash flows as at and for the six months ended 30 June 2016 are attached hereinafter. The reclassified statements, which are included in the report on operations, have not been audited. At the date of this announcement, the audit of the Autostrade per l Italia Group s condensed consolidated interim financial statements for the six months ended 30 June 2016 has yet to be completed. 11
12 RECLASSIFIED CONSOLIDATED INCOME STATEMENT INCREASE (DECREASE) m H H ABSOLUTE % Toll revenue 1,875 1, Contract revenue Other operating income Total operating revenue 2,143 2, Cost of materials and external services Concession fees Staff costs Capitalised staff costs Total net operating costs n.s. Gross operating profit (EBITDA) 1,350 1, Amortisation, depreciation, impairment losses and reversals of impairment losses n.s. Changes on provisions and other adjustments n.s. Operating profit (EBIT) Financial income from discounting to present value of concession rights and government grants Financial expenses from discounting of provisions for construction services required by contract n.s Other financial expenses, after deducting other financial income Capitalised financial expenses deriving from intangible concession rights Share of profit/(loss) of associates and joint ventures accounted for using the equity method Profit (Loss) before tax from continuing operations Tax expense Profit/(Loss) from continuing operations Profit/(Loss) from discontinued operations n.s. Profit for the period Profit for the period attributable to non-controlling interests n.s. Profit for the period attributable to owners of the parent H H INCREASE (DECREASE) Basic earnings per share attributable to the owners of the parent ( ) of which: - continuing operations discontinued operations Diluted earnings per share attributable to the owners of the parent ( ) of which: - continuing operations discontinued operations
13 CONSOLIDATED STATEMENT OF COMPREHENSIVE INCOME m H H Profit for the period (A) Fair value gains/(losses) on cash flow hedges Tax espense on fair value gains/(losses) on cash flow hedges Gains/(losses) from translation of assets and liabilities of consolidated companies denominated in functional currencies other than the euro Gains/(Losses) from translation of investments in associates and joint ventures accounted for using the equity method denominated in functional currencies other than the euro Other comprehensive income/(loss) for the period reclassifiable to profit or loss (B) Other comprehensive income for the period not reclassifiable to profit or loss (C) - - Reclassifications of other components of comprehensive income to profit or loss (D) -1 8 Tax expense on reclassifications of other components of comprehensive income to profit or loss (E) - -3 Total other comprehensive income/(loss) for the period (F=B+C+D+E) Of which attributable to discontinued operations - 6 Comprehensive income for the period (A+F) Of which attributable to owners of the parent Of which attributable to non-controlling interests
14 RECLASSIFIED CONSOLIDATED STATEMENT OF FINANCIAL POSITION m 30/06/ /12/2015 INCREASE/ (DECREASE) Non-current non-financial assets Property, plant and equipment Intangible assets 21,782 21, Investments Deferred tax assets Other non current assets Total non-current non-financial assets (A) 22,231 22, Working capital Trading assets 1,274 1, Current tax assets Other current assets Non-financial assets held for sale or related to discontinued operations Current portion of provisions for construction services required by contract Current provisions Trading liabilities -1,463-1,466 3 Current tax liabilities Other current liabilities Non-financial liabilities related to discontinued operations Total working capital (B) -1,228-1, Gross invested capital (C=A+B) 21,003 20, Non-current non-financial liabilities Non-current portion of provisions for construction services required by contract -3,128-3, Non-current provisions -1,405-1, Deferred tax liabilities -1,246-1, Other non-current liabilities Total non-current non-financial liabilities (D) -5,873-5, NET INVESTED CAPITAL (E=C+D) 15,130 14, Equity Equity attributable to owners of the parent 2,905 3, Equity attributable to non-controlling interests 1,704 1, Total equity (F) 4,609 4, Net Debt Non-current net debt Non-current financial liabilities 13,596 13, Bond issues 3,405 3, Medium/long-term borrowings 9,649 9, Non-current derivative liabilities Other non-current financial liabilities Non-current financial assets -1,999-1, Non-current financial assets deriving from concession rights Non-current financial assets deriving from government grants Non-current term deposits Other non-current financial assets Total non-current net debt (G) 11,597 11, Current net debt Current financial liabilities 1,626 2, Bank overdrafts 1-1 Short-term borrowings Current derivative liabilities 1-1 Intercompany current account payables due to related parties Current portion of medium/long-term borrowings 728 1, Other current financial liabilities Cash and cash equivalents -1,868-2, Cash in hand -1,279-2, Cash equivalents Intercompany current account receivables due from related parties Cash and cash equivalents related to discontinued operations Current financial assets Current financial assets deriving from concession rights Current financial assets deriving from government grants Current term deposits Current portion of other medium/long-term financial assets Other current financial assets Total current net debt (H) -1,076-1, Total net debt (I=G+H) 10,521 10, NET DEBT AND EQUITY (L=F+I) 15,130 14,
15 CONSOLIDATED STATEMENT OF CASH FLOWS m H H CASH FLOWS FROM (USED IN) OPERATING ACTIVITIES Profit for the period Adjusted by: Amortisation and depreciation Provisions Financial expenses from discounting of provisions for construction services required by contract Impairment losses/(reversal of impairment losses) on non-current financial assets and investments accounted for at cost or fair value Share of (profit)/loss of investees accounted for using the equity method Impairment losses/(reversal of impairment losses) and adjustments of other current and non-current assets Net change in deferred tax (assets)/liabilities through profit or loss Other non-cash costs (income) Change in working capital and other changes Net cash generated from operating activities [a] ,051 CASH FLOWS FROM (USED IN) INVESTING ACTIVITIES Investment in assets held under concession Purchases of property, plant and equipment Purchases of other intangible assets Government grants related to assets held under concession Increase in financial assets deriving from concession rights (related to capital expenditure) Purchase of investments Proceeds from sales of property, plant and equipment, intangible assets and unconsolidated investments Net change in other non-current assets Net change in current and non-current financial assets Net cash generated used in investing activities [b] CASH FLOWS FROM (USED IN) FINANCING ACTIVITIES Dividends paid Repayment of loans from parent Issuance of bonds Increase in medium/long term borrowings (excluding finance lease liabilities) Bond redemptions Repayments of medium/long term borrowings (excluding finance lease liabilities) Net change in other current and non-current financial liabilities Net cash generated used in financing activities [c] , ,341-1,167 Net effect of foreign exchange rate movements on net cash and cash equivalents [d] Increase/(Decrease) in cash and cash equivalents for the period [a+b+c+d] NET CASH AND CASH EQUIVALENTS AT BEGINNING OF PERIOD NET CASH AND CASH EQUIVALENTS AT END OF PERIOD 2,812 1,467 1,826 1,070
16 Additional information on the consolidated statement of cash flows m H H Income taxes paid Interest income and other financial income collected Interest expense and other financial expenses paid Dividends received 6 - Reconciliation of net cash and cash equivalents m H H NET CASH AND CASH EQUIVALENTS AT BEGINNING OF PERIOD 2,812 1,467 Cash and cash equivalents 2,787 1,631 Bank overdrafts - - Intercompany current account payables due to related parties Cash and cash equivalents related to discontinued operations NET CASH AND CASH EQUIVALENTS AT END OF PERIOD 1,826 1,070 Cash and cash equivalents 1,837 1,150 Bank overdrafts -1-1 Intercompany current account payables due to related parties Cash and cash equivalents related to discontinued operations 31 54
BOARD APPROVES AUTOSTRADE PER L ITALIA GROUP S INTERIM REPORT FOR SIX MONTHS ENDED 30 JUNE 2017
 Press Release BOARD APPROVES AUTOSTRADE PER L ITALIA GROUP S INTERIM REPORT FOR SIX MONTHS ENDED 30 JUNE 2017 Consolidated results (1) Motorway traffic on Group s Italian network up 2.9% in H1 2017 (up
BOARD APPROVES NINE-MONTH REPORT FOR 2012
 Press release BOARD APPROVES NINE-MONTH REPORT FOR 2012 Consolidated revenue of 3,039m up 2.6% on 9M 2011. On like-for-like basis total revenue down 115.8m (3.9%) Motorway traffic on network operated under
BOARD APPROVES CONSOLIDATED AND SEPARATE FINANCIAL STATEMENTS FOR 2011
 Press Release BOARD APPROVES CONSOLIDATED AND SEPARATE FINANCIAL STATEMENTS FOR 2011 Growth in EBITDA (up 5.1%) and capital expenditure (up 6.2%). Average workforce rises 440 on like-for-like basis. Net
BOARD APPROVES ATLANTIA GROUP S INTERIM REPORT FOR SIX MONTHS ENDED 30 JUNE 2016
 Press Release BOARD APPROVES ATLANTIA GROUP S INTERIM REPORT FOR SIX MONTHS ENDED 30 JUNE 2016 Consolidated results (1) Motorway traffic on Group s Italian network up 3.8% in H1 2016 Increase in traffic
INTERIM REPORT OF THE AUTOSTRADE PER L'ITALIA GROUP FOR THE SIX MONTHS ENDED 30 JUNE 2018
 INTERIM REPORT OF THE AUTOSTRADE PER L'ITALIA GROUP FOR THE SIX MONTHS ENDED 30 JUNE 2018 Interim Report of the Autostrade per l Italia Group for the six months ended 30 June 2018 1 (This page intentionally
BOARD APPROVES REPORT FOR Q1 2012
 Press Release BOARD APPROVES REPORT FOR Q1 2012 Consolidated revenue of 856.9m stable (up 0.1%) versus Q1 2011 1 Motorway traffic on the network operated under concession in Italy 2 down 8.5% in Q1 2012,
AUTOSTRADE PER L ITALIA GROUP S RESULTS ANNOUNCEMENT FOR NINE MONTHS ENDED 30 SEPTEMBER 2017
 Press Release AUTOSTRADE PER L ITALIA GROUP S RESULTS ANNOUNCEMENT FOR NINE MONTHS ENDED 30 SEPTEMBER 2017 Consolidated results (1) Motorway traffic on Group s network up 2.3% in 9M 2017 (up 2.9% after
BOARD APPROVES CONSOLIDATED AND SEPARATE FINANCIAL STATEMENTS FOR 2017
 Press Release BOARD APPROVES CONSOLIDATED AND SEPARATE FINANCIAL STATEMENTS FOR 2017 Consolidated results in 2017 (1) Traffic on Group s Italian motorway network up 2.2% (up 2.8% after excluding leap-year
AUTOSTRADE PER L ITALIA GROUP S QUARTERLY RESULTS ANNOUNCEMENT FOR THREE MONTHS ENDED 31 MARCH 2018
 Press Release AUTOSTRADE PER L ITALIA GROUP S QUARTERLY RESULTS ANNOUNCEMENT FOR THREE MONTHS ENDED 31 MARCH 2018 Consolidated results for Q1 2018 (1) Traffic on Group s motorway network up 1.0% Gross
(This page intentionally left blank)
") (This page intentionally left blank) CONTENTS 1. Introduction... 5 1.1 Consolidated financial highlights (*)... 7 1.2 Structure of the Autostrade per l Italia Group (... 8 1.3 The Group s motorway operators...
(This page intentionally left blank) CONTENTS 1. Introduction... 5 1.1 Consolidated financial highlights (*)... 7 1.2 Structure of the Autostrade per l Italia Group (... 8 1.3 The Group s motorway operators...
BOARD APPROVES REPORT FOR Q1 2013
 Press Release BOARD APPROVES REPORT FOR Q1 2013 Consolidated revenue of 925m up 8.0% on Q1 2012. On like-for-like basis, total revenue is down 2.0% Motorway traffic on the network operated under concession
AUTOSTRADE PER L ITALIA GROUP S RESULTS ANNOUNCEMENT FOR NINE MONTHS ENDED 30 SEPTEMBER 2018
 Press release AUTOSTRADE PER L ITALIA GROUP S RESULTS ANNOUNCEMENT FOR NINE MONTHS ENDED 30 SEPTEMBER 2018 Consolidated results for 9M 2018 (1) Motorway traffic on Group s network up 0.3% (2) Gross operating
Interim Report of the Atlantia Group for the nine months ended 30 September 2016
 Interim Report of the Atlantia Group for the nine months ended 30 September 2016 Interim Report of the Atlantia Group for the nine months ended 30 September 2016 (this page intentionally left blank) Contents
Consolidated revenue of 877m up 7.7% on Q On like-for-like basis 1 total revenue
 Press Release BOARD APPROVES Q1 REPORT FOR 2011 Consolidated revenue of 877m up 7.7% on Q1 2010. On like-for-like basis 1 total revenue up 2.7% Gross operating profit (EBITDA) of 524m up 8.1% Profit attributable
BOARD APPROVES CONSOLIDATED AND SEPARATE FINANCIAL STATEMENTS FOR 2010
 Press Release BOARD APPROVES CONSOLIDATED AND SEPARATE FINANCIAL STATEMENTS FOR 2010 Consolidated results Consolidated revenue of 3,750m in 2010 up 7.5% on 2009. On like-for-like basis 1 total revenue
2014 ANNUAL REPORT ANNUAL REPORT
 2014 ANNUAL REPORT CONTENTS 1. Introduction 5 2. Report on operations 3. Consolidated financial statements 4. Separate financial statements 13 97 213 5. Reports 6. Key financial indicators of subsidiaries,
BOARD APPROVES CONSOLIDATED AND SEPARATE FINANCIAL STATEMENTS FOR 2017
 Press Release BOARD APPROVES CONSOLIDATED AND SEPARATE FINANCIAL STATEMENTS FOR 2017 Consolidated results for 2017 (1) Traffic on Group s Italian motorway network up 2.2% (up 2.8% after excluding leap-year
Atlantia Group s Interim Report for Q1 2016
 Atlantia Group s Interim Report for Q1 2016 2 (This page intentionally left blank) 1. Introduction Contents 1. Introduction... 5 Consolidated financial highlights... 7 Ownership structure... 8 Share price
BOARD APPROVES NINE-MONTH REPORT FOR 2010 GROUP S INVESTMENTS UP 10%
 Press Release BOARD APPROVES NINE-MONTH REPORT FOR 2010 GROUP S INVESTMENTS UP 10% Operating performance Consolidated revenue of 2,838m up 9.1% on 9M 2009, of which 5.0% due to the rise in the concession
Interim Report of the Atlantia Group for the six months ended 30 June 2017
 Interim Report of the Atlantia Group for the six months ended 30 June 2017 Interim Report of the Atlantia Group for the six months ended 30 June 2017 (This page intentionally left blank) Contents Contents
Interim report of the Atlantia Group for the nine months ended 30 September 2012
 Interim report of the Atlantia Group for the nine months ended 30 September 2012 Contents 1. Introduction... 5 Consolidated financial highlights... 6 Shareholder structure... 7 Atlantia share price performance...
Interim Report for the three months ended 31 March 2012
 Interim Report for the three months ended 31 March 2012 Interim Report for the three months ended 31 March 2012 Contents 1. Introduction... 5 Consolidated financial highlights... 6 Shareholders... 7
Interim report of the Atlantia Group for the nine months ended 30 September 2014
 Interim report of the Atlantia Group for the nine months ended 30 September 2014 Interim report of the Atlantia Group for the nine months ended 30 September 2014 (This page intentionally left blank) Contents
Press Release BOARD APPROVES NINE-MONTH REPORT FOR 2009
 Press Release BOARD APPROVES NINE-MONTH REPORT FOR 2009 Signs of progressive recovery in traffic using Group s network as rate of decline eases to 0.7% in first nine months of year (1.9% after taking account
ATLANTIA GROUP S RESULTS ANNOUNCEMENT FOR NINE MONTHS ENDED 30 SEPTEMBER 2018
 Press release ATLANTIA GROUP S RESULTS ANNOUNCEMENT FOR NINE MONTHS ENDED 30 SEPTEMBER 2018 Consolidated results for 9M 2018 (1) Traffic on Group s Italian motorway network up 0.3% (2) Traffic using Group
ATLANTIA GROUP S RESULTS ANNOUNCEMENT FOR NINE MONTHS ENDED 30 SEPTEMBER 2017
 Press Release ATLANTIA GROUP S RESULTS ANNOUNCEMENT FOR NINE MONTHS ENDED 30 SEPTEMBER 2017 Consolidated results (1) Motorway traffic on Group s network up 2.3% in 9M 2017 (up 2.9% after stripping out
Interim report of the Atlantia Group for the nine months ended 30 September 2013
 Interim report of the Atlantia Group for the nine months ended 30 September 2013 Contents 1. Introduction... 5 Consolidated financial highlights... 6 Shareholders... 7 Atlantia share price performance...
Interim report of the Atlantia Group for the nine months ended 30 September 2011
 Interim report of the Atlantia Group for the nine months ended 30 September 2011 2 (This page intentionally left blank) Contents 1. Introduction... 5 Corporate bodies... 7 Group structure... 8 Consolidated
ATLANTIA GROUP S QUARTERLY RESULTS ANNOUNCEMENT FOR THREE MONTHS ENDED 31 MARCH 2017
 Press Release ATLANTIA GROUP S QUARTERLY RESULTS ANNOUNCEMENT FOR THREE MONTHS ENDED 31 MARCH 2017 Consolidated results (1) Motorway traffic on Group s Italian network up 2.7% in Q1 2017 after stripping
Overview of consolidated financial statements
 Overview of consolidated financial statements Consolidated balance sheet On 31 December 2015 On 31 December 2014 In EUR millions Assets Cash and balances at central banks 64,943 43,409 Loans and advances
Consolidated interim financial report as at and for the six months ended 30 June 2011
 Consolidated interim financial report as at and for the six months ended 30 June 2011 Contents 1. Introduction... 3 Corporate bodies... 4 Group structure... 6 Consolidated financial highlights... 7 Shareholder
Consolidated interim report for the nine months ended 30 September 2010
 Consolidated interim report for the nine months ended 30 September 2010 ATLANTIA SpA Issued capital: 600,297,135.00, fully paid-up Tax code, VAT number and Rome Companies Register no. 03731380261 REA no.
CONSOLIDATED FINANCIAL STATEMENTS
 CONSOLIDATED FINANCIAL STATEMENTS FOR THE YEAR ENDED 31 DECEMBER ENDESA, S.A. AND SUBSIDIARIES CONSOLIDATED STATEMENTS OF FINANCIAL POSITION AT 31 DECEMBER AND 31 DECEMBER ASSETS 31 December 31 December
Consolidated interim report for the six months ended 30 June 2014
 Consolidated interim report for the six months ended 30 June 2014 Consolidated interim report for the six months ended 30 June 2014 This page intentionally left blank Contents Contents 1. Introduction...
CONSOLIDATED FINANCIAL STATEMENTS
 CONSOLIDATED FINANCIAL STATEMENTS FOR THE SIX MONTHS ENDED 30 JUNE 2017 ENDESA, S.A. AND SUBSIDIARIES CONSOLIDATED STATEMENTS OF FINANCIAL POSITION AT 30 JUNE 2017 AND 31 DECEMBER 2016 (*) Unaudited ASSETS
Consolidated interim report for the six months ended 30 June 2013
 Consolidated interim report for the six months ended 30 June 2013 Contents 1. Introduction... 5 Consolidated financial highlights... 6 Shareholders... 7 Atlantia share price performance... 8 Group structure...
Change of accounting policy: consolidation by equity method of jointly controlled entities
 Change of : consolidation by equity method of jointly controlled entities 1. Accounting principles To improve its financial information, the VINCI Group has elected to apply, as from the financial year
ANNEX I GENERAL. 2nd 2017 HALF-YEARLY FINANCIAL REPORT FOR FINANCIAL YEAR REPORTING DATE 12/31/ /07/2018 I. IDENTIFICATION DATA
 ANNEX I GENERAL 2nd 2017 HALF-YEARLY FINANCIAL REPORT FOR FINANCIAL YEAR REPORTING DATE PUBLICATION DATE 02/07/2018 I. IDENTIFICATION DATA Registered Company Name: ABERTIS INFRAESTRUCTURAS, S.A Registered
Consolidated Income Statement (*)
") 130 Income Statement Income Statement (*) ( million) Note (*) 2010 Net revenues (1) 59,559 35,880 Cost of sales (2) 50,704 30,718 Selling, general and administrative costs (3) 5,047 2,956 Research and
130 Income Statement Income Statement (*) ( million) Note (*) 2010 Net revenues (1) 59,559 35,880 Cost of sales (2) 50,704 30,718 Selling, general and administrative costs (3) 5,047 2,956 Research and
A P P E N D I C E S B U S I N E S S A S U N U S U A L
 BUSINESS AS UNUSUAL A P P E N D I C E S 112 APPENDIX I. FINANCIAL SUMMARY APPENDIX I FINANCIAL SUMMARY CONSOLIDATED BALANCE SHEET FOR 2017 AND 2016 ASSETS 31.12.2017 31.12.2016 Property, plant and equipment
Zignago Vetro S.p.A. PRESS RELEASE. The Board of Directors of Zignago Vetro S.p.A. approves the Interim Report at September 30, 2013
 Zignago Vetro S.p.A. PRESS RELEASE The Board of Directors of Zignago Vetro S.p.A. approves the Interim Report at September 30, 2013 revenues in 9M 2013 total Euro 215.8 million, decreasing 3.8%; export
- (1.7) (6.6) Profit attributable to ordinary shareholders Earnings per share 5 Basic 2.3p 2.5p 10.6p Diluted 2.3p 2.5p 10.
 (6.6) Profit attributable to ordinary shareholders Earnings per share 5 Basic 2.3p 2.5p 10.6p Diluted 2.3p 2.5p 10.") Consolidated Profit and Loss Account For the 13 weeks ended 1st May 2005 Notes Revenue 2 196.4 200.3 776.7 Cost of sales (117.5) (119.9) (462.2) Gross profit 78.9 80.4 314.5 Total operating expenses (61.4)
Consolidated Profit and Loss Account For the 13 weeks ended 1st May 2005 Notes Revenue 2 196.4 200.3 776.7 Cost of sales (117.5) (119.9) (462.2) Gross profit 78.9 80.4 314.5 Total operating expenses (61.4)
THE BOARD OF DIRECTORS APPROVES FULL YEAR 2017 RESULTS, CONFIRMING PRELIMINARY RESULTS PUBLISHED ON 19 FEBRUARY
 THE BOARD OF DIRECTORS APPROVES FULL YEAR 2017 RESULTS, CONFIRMING PRELIMINARY RESULTS PUBLISHED ON 19 FEBRUARY Rome, 29 March 2018 The Board of Directors of Poste Italiane S.p.A. ( Poste Italiane ), chaired
BOARD APPROVES INTERIM CONSOLIDATED RESULTS FOR SIX MONTHS ENDED 30 JUNE 2009
 Press Release BOARD APPROVES INTERIM CONSOLIDATED RESULTS FOR SIX MONTHS ENDED 30 JUNE 2009 Traffic down 2.4%% (-1.9% on like-for-like basis due to the leap year in 2008) on motorway network managed by
TATE & LYLE PLC EFFECT OF ADOPTION OF IFRS 11 JOINT ARRANGEMENTS
 29 May 2014 ACCOUNTING FOR JOINT VENTURES With effect from 1 April 2014, Tate & Lyle adopted IFRS 11 Joint Arrangements which will change significantly the basis of accounting for its interests in joint
PRESS RELEASE ACOTEL GROUP: Board approves interim report for H1 2014
 PRESS RELEASE ACOTEL GROUP: Board approves interim report for H1 2014 Consolidated revenue 35.2 million ( 51.9 million in H1 2013) Negative EBITDA 3.5 million (negative 3.1 million in H1 2013) Negative
FIRST HALF HIGHLIGHTS
 FIRST HALF HIGHLIGHTS Returning to growth, but later than expected Revenue down 2.3m to 54.8m Gross margin strengthened to 70.1% (2005: 69.1%) Operating profit unchanged at 0.5m Investment: 7 new Hobby
BOARD APPROVES HALF YEAR FINANCIAL REPORT FOR 2008
 Press release BOARD APPROVES HALF YEAR FINANCIAL REPORT FOR 2008 The basis of consolidation from the first half of 2008 now includes the Polish Stalexport Autostrady Group and the U. S. company, Electronic
Consolidated interim report for the nine month ended 30 September 2009
 Consolidated interim report for the nine month ended 30 September 2009 ATLANTIA SpA Issued capital: E571,711,557.00, fully paid-up Tax code, VAT number and Rome Companies Register no. 03731380261 REA no.
PRESS RELEASE ACOTEL GROUP: interim report for three months ended 30 September 2014.
 PRESS RELEASE ACOTEL GROUP: interim report for three months ended 30 September 2014. Consolidated results for 9M 2014: Revenue 52.4 million ( 79.1 million in 9M 2013) Negative EBITDA 6.9 million (negative
14 May Overview of the Adoption of IFRIC 12
 14 May 2010 Overview of the Adoption of IFRIC 12 First Time Application of IFRIC 12 This document is solely intended to provide a general overview of the principal effects on Atlantia s consolidated financial
Il Sole 24 ORE S.p.A.: BoD approves Half-Year Financial Report at 30 June 2017
 Press Release Pursuant to CONSOB Resolution 11971/99 as subsequently amended and supplemented Il Sole 24 ORE S.p.A.: BoD approves Half-Year Financial Report at 30 June 2017 LOSSES REDUCED Net of non-recurring
(Translation from the Italian original which remains the definitive version)
") (Translation from the Italian original which remains the definitive version) DRAFT 2016 FINANCIAL STATEMENTS EVENTS AFTER THE REPORTING DATE GOING CONCERN AND OUTLOOK FOR 2017 ANNUAL REPORT ON CORPORATE
(Translation from the Italian original which remains the definitive version) DRAFT 2016 FINANCIAL STATEMENTS EVENTS AFTER THE REPORTING DATE GOING CONCERN AND OUTLOOK FOR 2017 ANNUAL REPORT ON CORPORATE
9% on Q Capital expenditure of 236.5m up 7% on same period of 2008
 Press Release BOARD APPROVES Q1 REPORT FOR 2009 Traffic volumes down 3.1% on Q1 2009 on a like-for for-like basis (down 6.9% without adjusting for calendar and extraordinary events); same traffic trend
Press Release BOARD APPROVES 2009 FINANCIAL STATEMENTS. Consolidated results
 Press Release BOARD APPROVES 2009 FINANCIAL STATEMENTS Consolidated results Decline in traffic using the Group s Italian network in 2009 limited to 0.13% versus 2008. On like-for-like basis, traffic is
Zignago Vetro S.p.A. PRESS RELEASE. Board of Directors of Zignago Vetro S.p.A. approves 2014 First Quarter Report
 Zignago Vetro S.p.A. PRESS RELEASE Board of Directors of Zignago Vetro S.p.A. approves 2014 First Quarter Report Zignago Vetro Group key results improve in Q1 2014. Revenues total Euro 72.9 million, increasing
L1E Finance GmbH & Co. KG Consolidated Interim Financial Statements for the Period 1 January - 30 June 2017
 L1E Finance GmbH & Co. KG Consolidated Interim Financial Statements for the Period 1 January - 30 June - 2 - L1E Finance GmbH & Co. KG - Consolidated Income Statement 2. Quarter 2. Quarter Sales and other
(Translation from the Italian original which remains the definitive version)
") (Translation from the Italian original which remains the definitive version) DRAFT 2015 FINANCIAL STATEMENTS EVENTS AFTER THE REPORTING DATE GOING CONCERN OUTLOOK FOR 2016 ANNUAL REPORT ON CORPORATE GOVERNANCE
(Translation from the Italian original which remains the definitive version) DRAFT 2015 FINANCIAL STATEMENTS EVENTS AFTER THE REPORTING DATE GOING CONCERN OUTLOOK FOR 2016 ANNUAL REPORT ON CORPORATE GOVERNANCE
SEAT Pagine Gialle Group
 Reclassified statement of operations 2007 2006 Absolute % Revenues from sales and services 1,453.6 1,460.2 (6.6) (0.5) Materials and external services (*) (504.2) (568.9) 64.7 Salaries, wages and employee
The consolidated profit of approximately 23 thousand for the six months ended 30 June 2017 breaks down as follows:
 PRESS RELEASE ACOTEL GROUP: Board approves interim report for H1 2017 Revenue 9.4 million ( 11.7 million in H1 2016) Negative EBITDA 3.7 million (negative 3.6 million in H1 2016) Negative EBIT 4.6 million
Implementation of IFRS 16 Leases, Kesko Group s restated comparison figures for January-September 2018
 KESKO CORPORATION STOCK EXCHANGE RELEASE 19.12.2018 AT 09.00 Implementation of Leases, Kesko Group s comparison figures for January-September 2018 Leases takes effect on 1 January 2019. The standard addresses
Finance$Case$ Studies$
 Finance$Case$ Studies$ Ted$Wainman$ ted@wainman.net$ 07802$863$768$ Annual Report and Accounts 2012/13 National Grid plc Trusted to connect ng1 Financial Statements Consolidated income statement for the
L1E Finance GmbH & Co. KG Consolidated Interim Financial Statements for the Period 1 January - 30 September 2018
 L1E Finance GmbH & Co. KG Consolidated Interim Financial Statements for the Period 1 January - 30 September - 2 - L1E Finance GmbH & Co. KG - Consolidated Income Statement 1) 3. Quarter 3. Quarter 1) Sales
PRESS RELEASE. The Board of Directors Approves the Group s Report on Operations at March 31, 2009
 PRESS RELEASE This press release includes alternative performance indicators not considered under IFRS (EBITDA, Net Debt). These terms are defined in the appendix. The Board of Directors Approves the Group
Separate financial. statement. Separate financial. statement.
 Separate financial www.a2a.eu statement 2011 Separate financial 2011 statement Contents 3 Overview of performance, financial conditions and net debt 0.1 Financial statements 12 Balance sheet 14 Income
Interim report for the three month ended 31 March 2008
 Interim report for the three month ended 31 March 2008 Interim report for the three month ended 31 March 2008 ATLANTIA SpA Issued capital: 571,711,557.00, fully paid-up Tax code, VAT number and Rome Companies
Consolidated Statement of Profit or Loss (in million Euro)
") Consolidated Statement of Profit or Loss (in million Euro) Unaudited, consolidated figures following IFRS accounting policies. Q2 2017 Q2 2018 H1 2017 H1 2018 Revenue 622 559 1,210 1,108 Cost of sales
Consolidated Statement of Profit or Loss (in million Euro) Unaudited, consolidated figures following IFRS accounting policies. Q2 2017 Q2 2018 H1 2017 H1 2018 Revenue 622 559 1,210 1,108 Cost of sales
PRESS RELEASE PIAGGIO GROUP: 2018 HALF-YEAR FINANCIAL STATEMENTS 1
 PRESS RELEASE PIAGGIO GROUP: 2018 HALF-YEAR FINANCIAL STATEMENTS 1 In the first half of 2018 the Piaggio Group reported an improvement in performance from the year-earlier period, with progress on all
INTERIM FINANCIAL REPORT AS AT MARCH 31, 2018
 INTERIM FINANCIAL REPORT AS AT MARCH 31, 2018 (Translation into English of the original Italian version) JOINT-STOCK COMPANY - SHARE CAPITAL EURO 62,461,355.84 MANTOVA COMPANY REGISTER AND TAX CODE 00607460201
ATTACHMENTS TO THE PRESS RELEASE
 ATTACHMENTS TO THE PRESS RELEASE ALTERNATIVE PERFORMANCE MEASURES In this press release in addition to the conventional financial performance measures established by IFRS, certain alternative performance
CONSOLIDATED FINANCIAL STATEMENTS AS AT 31 DECEMBER 2016
 CONSOLIDATED FINANCIAL STATEMENTS AS AT 31 DECEMBER 2016 CONSOLIDATED INCOME STATEMENT (*) (THOUSAND EUROS) NOTE 2016 2015 Revenues 5 780,739 705,601 Other income 19,579 15,643 Purchases 6 (16,969) (14,049)
Half-year consolidated financial statements
 Half-year consolidated financial statements Key figures (in millions) First half 2018 First half 2017 Change first half 2018/2017 Full year 2017 Revenue (*) 19,758 18,513 6.7 % 40,248 Revenue generated
INTERIM FINANCIAL REPORT AS AT SEPTEMBER 30, 2013 (Translation into English of the original Italian version)
") INTERIM FINANCIAL REPORT AS AT SEPTEMBER 30, 2013 (Translation into English of the original Italian version) JOINTSTOCK COMPANY SHARE CAPITAL EURO 60,924,391.84 MANTOVA COMPANY REGISTER AND TAX CODE 00607460201
INTERIM FINANCIAL REPORT AS AT SEPTEMBER 30, 2013 (Translation into English of the original Italian version) JOINTSTOCK COMPANY SHARE CAPITAL EURO 60,924,391.84 MANTOVA COMPANY REGISTER AND TAX CODE 00607460201
PRESS RELEASE PIAGGIO GROUP: 2014 DRAFT FINANCIAL STATEMENTS
 PRESS RELEASE PIAGGIO GROUP: 2014 DRAFT FINANCIAL STATEMENTS Consolidated net sales 1,213.3 million euro from 1,212.5 mln in 2013 (2014 net sales 1,228.6 million euro at constant exchange rates) Ebitda
Il Sole 24 ORE S.p.A.: BoD approves Interim Management Statement at 31 March 2015
 Press Release Pursuant to CONSOB Resolution 11971/99 as subsequently amended and integrated Il Sole 24 ORE S.p.A.: BoD approves Interim Management Statement at 31 March 2015 Figures are shown on a like-for-like
TRANSITION TO INTERNATIONAL ACCOUNTING STANDARDS STATUTORY FINANCIAL STATEMENTS. ENGINEERING INGEGNERIA INFORMATICA SpA
 TRANSITION TO INTERNATIONAL ACCOUNTING STANDARDS STATUTORY FINANCIAL STATEMENTS ENGINEERING INGEGNERIA INFORMATICA SpA Index Introduction... 2 Changes in accounting policies, errors, and changes in estimates...
CONSOLIDATED INCOME STATEMENT
 FINANCIAL STATEMENTS CONSOLIDATED INCOME STATEMENT Continuing operations Before Non-Trading Items Non-Trading Items Before Non-Trading Items Non-Trading Items Revenue 2 6,607.6-6,607.6 6,407.9-6,407.9
Consolidated Profit and Loss account for the year ended 31 December 2003
 Consolidated Profit and Loss account for the year ended 31 December Before exceptional items and of intangibles Exceptional Before Exceptional items and exceptional items and items and of intangibles of
BOD APPROVES FIGURES FOR THE FIRST HALF OF 2018/2019
 BOD APPROVES FIGURES FOR THE FIRST HALF OF 2018/2019 Turin, 28 February 2019 The Board of Directors of Juventus Football Club S.p.A., chaired by Andrea Agnelli, has approved the Half-Yearly Financial Report
ICAP plc Annual Report 2016 FINANCIAL STATEMENTS. Strategic report. Page number
 FINANCIAL STATEMENTS ICAP plc Annual Report 77 Strategic report Page number Consolidated income statement 78 Consolidated statement of comprehensive income 80 Consolidated and Company balance sheet 81
Consolidated Statement of Profit or Loss (in million Euro)
") Consolidated Statement of Profit or Loss (in million Euro) Q3 2015 Q3 2016 % change 9m 2015 9m 2016 % change Revenue 661 625-5.4% 1,974 1,873-5.1% Cost of sales (453) (415) -8.4% (1,340) (1,239) -7.5%
Consolidated Statement of Profit or Loss (in million Euro) Q3 2015 Q3 2016 % change 9m 2015 9m 2016 % change Revenue 661 625-5.4% 1,974 1,873-5.1% Cost of sales (453) (415) -8.4% (1,340) (1,239) -7.5%
Consolidated Statement of Profit or Loss (in million Euro)
") Consolidated Statement of Profit or Loss (in million Euro) Q1 2016 Q1 2017 % change Revenue 603 588-2.5% Cost of sales (408) (396) -2.9% Gross profit 195 192-1.5% Selling expenses (84) (86) 2.4% Research
Consolidated Statement of Profit or Loss (in million Euro) Q1 2016 Q1 2017 % change Revenue 603 588-2.5% Cost of sales (408) (396) -2.9% Gross profit 195 192-1.5% Selling expenses (84) (86) 2.4% Research
PRESS RELEASE. The Board of Directors approves the Consolidated Interim Financial Report for the first half of 2016.
 PRESS RELEASE B&C Speakers S.p.A. The Board of Directors approves the Consolidated Interim Financial Report for the first half of 2016. Consolidated revenues of Euro 18.67 million (+0.9% compared with
THE GALA CORAL GROUP PRELIMINARY INTERNATIONAL FINANCIAL REPORTING STANDARDS (IFRS) TRANSITION STATEMENTS
 TRANSITION STATEMENTS") THE GALA CORAL GROUP PRELIMINARY INTERNATIONAL FINANCIAL REPORTING STANDARDS (IFRS) TRANSITION STATEMENTS INTRODUCTION Implementation of International Financial Reporting Standards ( IFRS ) For the year
THE GALA CORAL GROUP PRELIMINARY INTERNATIONAL FINANCIAL REPORTING STANDARDS (IFRS) TRANSITION STATEMENTS INTRODUCTION Implementation of International Financial Reporting Standards ( IFRS ) For the year
Esprinet 2014 results approved by the Board
 Press release in accordance with Consob regulation n. 11971/99 Esprinet 2014 results approved by the Board Complete reversal to 75.6 million of the investment value in the Iberica subsidiary with a revaluation
US DOLLAR SUPPLEMENT TO THE UNILEVER SECOND QUARTER AND HALF YEAR RESULTS 2006
 US DOLLAR SUPPLEMENT TO THE UNILEVER SECOND QUARTER AND HALF YEAR RESULTS 2006 1 This document is a supplement to the Unilever second quarter half year results 2006 is prepared for reference purposes only,
2013 HALF-YEAR FINANCIAL STATEMENTS (Translation into English of the original Italian version)
") 2013 HALF-YEAR FINANCIAL STATEMENTS (Translation into English of the original Italian version) JOINT-STOCK COMPANY - SHARE CAPITAL EURO 60,768,339.84 MANTOVA COMPANY REGISTER AND TAX CODE 00607460201 COMPANY
2013 HALF-YEAR FINANCIAL STATEMENTS (Translation into English of the original Italian version) JOINT-STOCK COMPANY - SHARE CAPITAL EURO 60,768,339.84 MANTOVA COMPANY REGISTER AND TAX CODE 00607460201 COMPANY
Half-Year Financial Report
 Financial Year -2012 Half-Year Financial Report A. HALF-YEAR MANAGEMENT REPORT B. CONDENSED CONSOLIDATED FINANCIAL STATEMENTS C. REPORT FROM THE STATUTORY AUDITORS D. CERTIFICATE OF THE PERSON RESPONSIBLE
ATTACHMENTS TO THE PRESS RELEASE
 ATTACHMENTS TO THE PRESS RELEASE ALTERNATIVE PERFORMANCE MEASURES... 2 TIM GROUP - SEPARATE CONSOLIDATED INCOME STATEMENTS... 4 TIM GROUP - CONSOLIDATED STATEMENTS OF COMPREHENSIVE INCOME... 5 TIM GROUP
FIRST HALF HIGHLIGHTS
 FIRST HALF HIGHLIGHTS Revenue at 54.6m (2006: 54.6m) Pre-exceptional gross margin at 69.9% (2006: 70.9%) Exceptional items cost reduction programme (0.6)m (2006: nil) Pre-exceptional operating profit up
Aston Martin Holdings (UK) Limited. Interim financial report. for the period ended 30 June 2018
 Limited. Interim financial report. for the period ended 30 June 2018") Interim financial report for the period ended 30 June 2018 Interim financial report for the period ended 30 June 2018 Pages Business review and outlook 1 Financial review - income statement 2 Financial
Interim financial report for the period ended 30 June 2018 Interim financial report for the period ended 30 June 2018 Pages Business review and outlook 1 Financial review - income statement 2 Financial
Regulated information
 Regulated information JENSEN-GROUP Half-Year Results 2015 1 Consolidated, non-audited key figures Income Statement 30/06/2015-30/06/2014 Non-audited, consolidated key figures June 30, 2015 June 30, 2014
2017 Alternative Performance Measures reconciliations 4th Quarter and 12 Months 2017
 REPSOL Group Translation of a report originally issued in Spanish. In the event of a discrepancy, the Spanish language version prevails 2017 Alternative Performance Measures reconciliations 4th Quarter
ZIGNAGO VETRO S.P.A. Press Release. Board of Directors of Zignago Vetro S.p.A. approves 2014 Half-Year Report
 ZIGNAGO VETRO S.P.A. Press Release Board of Directors of Zignago Vetro S.p.A. approves 2014 Half-Year Report revenue growth in H1 2014. Cash generation also improves (*). Revenues total Euro 152 million,
ASSETS 30 June December 2017
 Condensed Consolidated Interim Balance Sheet as at Audited ASSETS 31 December 2017 Current Assets Cash and Cash Equivalents 11.628 7.132 Financial Investments 395 736 Trade Receivables -Trade Receivables
Accounting Policies. Key accounting policies
 Accounting Policies Basis of accounting The financial statements have been prepared in accordance with International Financial Reporting Standards (IFRS) adopted for use in the European Union (EU) and
VUE INTERNATIONAL BIDCO PLC
 Registered number: 08514872 UNAUDITED FINANCIAL STATEMENTS FOR THE 3 MONTHS ENDED 28 FEBRUARY INTERIM CONDENSED CONSOLIDATED PROFIT AND LOSS ACCOUNT (unaudited) FOR THE PERIOD ENDED 28 FEBRUARY (1) Restated
ZORLU ENERJİ ELEKTRİK ÜRETİM AŞ
 ZORLU ENERJİ ELEKTRİK ÜRETİM AŞ SUMMARY FINANCIAL STATEMENTS FOR THE PERIOD 01.01.2018-30.09.2018 (Originally issued in Turkish) CONDENSED INTERIM CONSOLIDATED BALANCE SHEETS AS OF 30 SEPTEMBER 2018 AND
Press Release BOARD APPROVES 2008 FINANCIAL STATEMENTS
 Press Release BOARD APPROVES 2008 FINANCIAL STATEMENTS Group s consolidated results Consolidated revenue of 3,477m up 6.3% on 2007, partly thanks to consolidation, from 1 January 2008, of US company, Electronic
INTERIM FINANCIAL REPORT AS AT SEPTEMBER 30, 2017 (Translation into English of the original Italian version)
") INTERIM FINANCIAL REPORT AS AT SEPTEMBER 30, 2017 (Translation into English of the original Italian version) JOINT-STOCK COMPANY - SHARE CAPITAL EURO 62.393.755,84 MANTOVA COMPANY REGISTER AND TAX NO.
INTERIM FINANCIAL REPORT AS AT SEPTEMBER 30, 2017 (Translation into English of the original Italian version) JOINT-STOCK COMPANY - SHARE CAPITAL EURO 62.393.755,84 MANTOVA COMPANY REGISTER AND TAX NO.