Aurubis AG Annual General Meeting. Hamburg, Februar 26, 2014
|
|
|
- Jeremy Marshall
- 6 years ago
- Views:
Transcription

1 Aurubis AG Annual General Meeting Hamburg, Februar 26, 2014
2 Agenda 1. Fiscal year 2012/13 2. Events in fiscal year 2012/13 3. Current fiscal year 2013/14 4. Outlook ANNUAL GENERAL MEETING /26/2014 2
3 Moderately rising copper prices with falling metal exchange inventories during the last few months Metal exchange inventories LME copper price (settlement, monthly avg.) in 1,000 t 1500 FY 2012/13 in US$/t /11 04/12 10/12 04/13 10/13 Exchange inventories in days of usage (late January 2014): world 8 days ANNUAL GENERAL MEETING /26/2014 3
4 The fertilizer industry is the largest source of sulfuric acid demand worldwide Aurubis sulfuric acid output by sector/industry 19% [10%] 44% [27%] by sales region 37% [63%] [ ] world sulfuric acid production Fertilizer Chemicals Metals» Sulfuric acid is a by-product of concentrate processing that is produced during flue gas desulfurization. ~ 1 t of sulfuric acid is produced from ~ 1 t of concentrates.» Global market volume ~ 200 mill. t. 30% 14% 18%» Aurubis produces a total of ~ 2.1 mill. t of sulfuric acid. 21% 17% Germany Bulgaria Turkey Rest Europe ANNUAL GENERAL MEETING /26/2014 4
5 Refining charges for copper scrap decreased a great deal Refining charges for copper scrap and copper price (in /t Cu) European refining charge (CRU) Copper price (settlement) » The percentage of global cathode output coming from recycling material is rising, while the proportion of total output remains the same at 17 % » The supply on the copper scrap market is reduced due to lower copper prices and limited investment activities» Refining charges adjusted downwards accordingly ANNUAL GENERAL MEETING /26/2014 5


6 Metal prices fell significantly during the fiscal year Metal prices in FY 2012/ %= Oct. 1, % 100% 90% 80% 70% Kupferpreis Copper price Silberpreis Silver price Goldpreis price 60% 50% Okt Oct 12 Jan 13 Apr 13 Jul 13 Okt Oct 13 ANNUAL GENERAL MEETING /26/2014 6

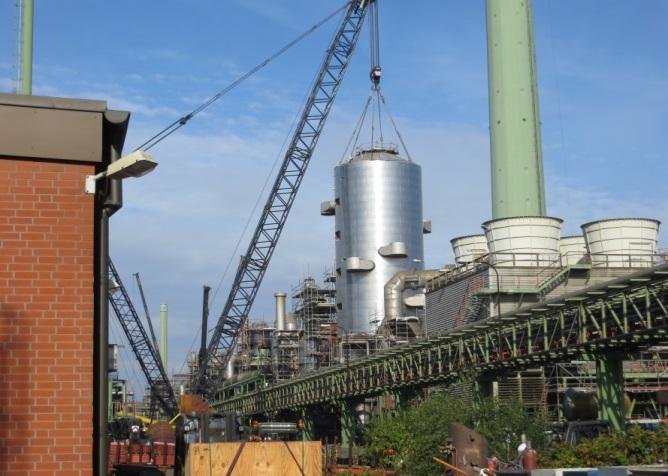


7 Large-scale shutdown at the Hamburg site in September / October 2013 ANNUAL GENERAL MEETING /26/2014 7
8 Group figures considerably below very good previous year (based on operating IFRS) FY 2012/13 FY 2011/12 Revenues ( m) 12,346 13,789 Gross profit ( m) 936 1,136 EBITDA ( m) EBT ( m) Net cash flow ( m) (86) 383 Operating ROCE (%) ,5 ANNUAL GENERAL MEETING /26/2014 8

9 Operating EBT impacted by difficult market environment and repair shutdown Operating EBT (in m, rounded up) FY 2012/13 FY 2011/ EBT IFRS Adjustments Operating EBT Operating EBT ANNUAL GENERAL MEETING /26/2014 9
10 Reduced total assets and stronger equity (in accordance with operating IFRS in million) Assets Liabilities 3,983 3,983 Fixed assets Inventories Receivables, etc. Cash and cash equivalents 33 (1%) 3,495 1,379 (40 %) 1,443 (41 %) 640 (18 %) 1,301 (32 %) 1,228 (31 %) 785 (20 %) 669 (17 %) 9/30/13 9/30/12 Equity* Provisions Borrowings Other liabilities 3,495 1,618 (46 %) 371 (11 %) 498 (14 %) 1,008 (29 %) 1,569 (39 %) 383 (10 %) 774 (19 %) 1,257 (32 %) 9/30/13 9/30/12 * incl. consolidated profit, non-controlling interests ANNUAL GENERAL MEETING /26/
11 Weaker business performance reflected in profitability figure (based on operating IFRS) 9/30/2013 operating 9/30/2012 operating Profitability ROCE 6.8 % 20.5 % Capital structure - Equity ratio (equity/total liabilities) - Fixed asset cover (equity/fixed assets) - Intensity of investments (fixed assets/ current assets) 46.3 % % 39.4 % 39.4 % % 32.7 % Debt and interest coverage - Net borrowings/ebitda EBITDA/net interest expense Liquidity - Quick ratio (current assets - inventories + cathodes + credit lines/current liabilities) 94.7 % % ANNUAL GENERAL MEETING /26/

")

 FY 12/13 FY 11/12 EBT 19")

 0.8 3.")


12 Business Unit results considerably down on the previous year Operating results in the BUs (fiscal year 12/13) BU Primary Copper (rounded up in million) FY 12/13 FY 11/12 EBT ROCE (%) BU Recycling/ Precious Metals (rounded up in million) FY 12/13 FY 11/12 EBT ROCE (%) BU Copper Products (rounded up in million) FY 12/13 FY 11/12 EBT (8) 10 ROCE (%) (Quantities in 1,000 t) Concentrates Copper scrap Cathodes BU Sulfuric acid (Quantities in 1,000 t) KRS throughput Copper scrap Cathodes BU (Quantities in 1,000 t) Wire rod Shapes Strip and wire products ANNUAL GENERAL MEETING /26/
13 Supervisory Board and Executive Board propose a dividend of 1.10 Aurubis dividend (in per share) Payout ratio (in %) /10 10/11 11/12 12/13 proposal 09/10 10/11 11/12 12/13 proposal ANNUAL GENERAL MEETING /26/
14 Agenda 1. Fiscal year 2012/13 2. Events in fiscal year 2012/13 3. Current fiscal year 2013/14 4. Outlook ANNUAL GENERAL MEETING /26/


15 Demand for refined copper determined by global trends in the long term Energy Society Growing energy demand Continued urbanization Changes in energy transmission and distribution Growing global middle class Decentralization of energy production Economy Balance in financial markets and global economy Uncertain trend in production relocation Technology New engine technologies Copper substitution and emerging new materials ANNUAL GENERAL MEETING /26/


16 Aurubis strategy is based on seven core segments We will strengthen our leading market position and add more value for our suppliers and customers Markets Rising copper demand More complex materials Sustainability Core metal copper Increasing recycling efforts Internationalization Production capability & innovation Multi-metal supply and recovery Growing sustainability ambitions Full synergy potential of value chain Solutions for customers & suppliers ANNUAL GENERAL MEETING /26/
17 Aurubis AG Annual General Meeting Hamburg, February 26, 2014


 Scrap")


18 The target must be a far-reaching, closed value chain and increasing sustainability Our Copper for your Life: Successfully producing the future tomorrow even more responsibly than today. Primary copper concentrate Copper ore Scrap collection (from production) Scrap processors Scrap collection (after product use) Copper in use Aurubis copper production Aurubis copper processing/copper products 2 nd fabrication step 1 st fabrication step Producers of final products Losses ANNUAL GENERAL MEETING /26/
19 Aurubis AG Annual General Meeting Hamburg, February 26, 2014
20 Agenda 1. Fiscal year 2012/13 2. Events in fiscal year 2012/13 3. Current fiscal year 2013/14 4. Outlook ANNUAL GENERAL MEETING /26/
 140 Consolidated net income m (2) 104 Net cash flow m 284 88 *rollierend 4 Quartale Return on capital employed (ROCE) % 0.5 22.")
21 Group figures significantly down on the very good first quarter of the previous year (on the basis of operating IFRS) 3 months 3 months 2013/ /13 Revenues m 2,804 3,395 Gross profit m EBITDA m EBIT m EBT m (3) 140 Consolidated net income m (2) 104 Net cash flow m *rollierend 4 Quartale Return on capital employed (ROCE) % ANNUAL GENERAL MEETING /26/
22 Agenda 1. Fiscal year 2012/13 2. Events in fiscal year 2012/13 3. Current fiscal year 2013/14 4. Outlook ANNUAL GENERAL MEETING /26/
23 Aurubis AG Annual General Meeting Hamburg, February 26, 2014
Conference Call. on December 14, Conference Call. Fiscal Year 2015/16. Jürgen Schachler CEO
 Conference Call on December 14, 2016 Conference Call Fiscal Year 2015/16 Jürgen Schachler CEO 1 Aurubis results align with market expectations 12M FY 2015/16 12M FY 2014/15 Operating EBT ( million) 213
Quarterly Report First 3 Months 2016/17. Analyst Conference Call February 13, 2017
 Quarterly Report First 3 Months 2016/17 Analyst Conference Call February 13, 2017 Aurubis fulfills expectations in Q1 of fiscal year 2016/17 3M FY 2016/17 3M FY 2015/16 Operating EBT ( million) 18 36 Net
Interim Report First 9 Months 2014/15. Analyst Conference Call on August 13, 2015
 Interim Report First 9 Months 2014/15 Analyst Conference Call on August 13, 2015 1 Aurubis generates very good results after first nine months 9 months FY 2014/15 9 months FY 2013/14 Operating EBT ( million)
Quarterly Report First 9 Months 2016/17. Analyst Conference Call August 10, 2017
 Quarterly Report First 9 Months 2016/17 Analyst Conference Call August 10, 2017 Aurubis fulfills expectations with significantly positive results for the first 9 months 9M FY 2016/17 9M FY 2015/16 Operating
Company Release Fiscal Year 2016/17
 Company Release Fiscal Year 2016/17 October 1, 2016 to September 30, 2017 At a Glance Key Aurubis Group figures Q4 Fiscal year 2016/17 2015/16 Change 2016/17 2015/16 Change Revenues m 2,851 2,399 19 %
Highlights. » EBT on the basis of IFRS after the first three months of FY 12/13 amounts to 13 million ( 213 million in the previous year)
") Aurubis generated earnings before taxes of 13 million ( 213 million in the previous year) in the first quarter of fiscal year 2012/13 on the basis of IFRS. Operating EBT was 140 million and was thus significantly
Aurubis generated earnings before taxes of 13 million ( 213 million in the previous year) in the first quarter of fiscal year 2012/13 on the basis of IFRS. Operating EBT was 140 million and was thus significantly
Company Release Fiscal Year 2014/15
 Company Release Fiscal Year October 1, 2014 to September 30, 2015 At a Glance Key Aurubis Group figures 4th quarter Fiscal year Change Change Revenues m 2,528 2,944-14 % 10,995 11,241-2 % Gross profit
Quarterly Report First 9 Months 2017/18
 Quarterly Report First 9 Months 2017/18 October 1, 2017 to June 30, 2018 At a Glance Key Aurubis Group figures Operating Aurubis Group output/throughput 2017/18 20 Change 2017/18 20 Change Concentrate
Highlights. » EBT on basis IFRS after nine months of fiscal year 2011/12 amounts to 392 million ( 469 million in the previous year)
") The Aurubis Group continued the good economic trend of the first half of fiscal year 2011/12, achieving earnings before taxes (EBT) of 392 million after nine months operating EBT was 247 million, which
The Aurubis Group continued the good economic trend of the first half of fiscal year 2011/12, achieving earnings before taxes (EBT) of 392 million after nine months operating EBT was 247 million, which
At a Glance. Q1 2015/ /15 Change. Key Aurubis Group figures
 Quarterly Report 2015/16 October 1, 2015 to December 31, 2015 At a Glance Key Aurubis Group figures 2015/16 20 Change Revenues m 2,398 2,635-9 % Gross profit m 174 238-27 % Operating gross profit m 241
Company Release Fiscal Year 2015/16
 Company Release Fiscal Year 215/16 October 1, 215 to September 3, 216 At a Glance Key Aurubis Group figures Q4 214/15 2,528 135 288 12 34 33 5 % > 1 % 1 % 1 % 9% 9% 215/16 9,475 1,4 1,5 449 135 129 Fiscal
CONTACTS; Group Communications Michaela Hessling Head Tel
 Aurubis AG continues to perform well in fiscal year 2009/10 and generated a very good pre-tax profit in the amount of 167 million and an pre-tax operating result of 77 million in the first half-year» EBT
INTERIM REPORT First Three Months 2013/14
 INTERIM REPORT First Three Months 2013/14 October 1, 2013 to December 31, 2013 CONTENTS CONTENTS I. Highlights 3 II. Overview of Group key figures 4 III. Interim Group management report for the first three
Business performance compared with the first nine months of the prior year was mainly influenced by the following factors:
 Despite the weak economic environment Aurubis AG breaks even in the first nine months of fiscal year 2008/09 and records a significantly higher net cash flow than in the prior year Hamburg, 12 August 2009
Quarterly Report First 9 Months 2017/18. Analyst Conference Call on August 9, 2018
 Quarterly Report First 9 Months 2017/18 Analyst Conference Call on August 9, 2018 Operating earnings before taxes up 25 % on previous year 9M 2017/18 9M 2016/17 Operating EBT ( million) 264 211 Net cash
Quarterly Report First 3 Months 2017/18
 Quarterly Report First 3 Months 2017/18 October 1, 2017 to December 31, 2017 At a Glance Key Aurubis Group figures 2017/18 20 Change Revenues m 2,872 2,462 17 % Gross profit m 382 315 21 % Operating gross
NA increases earnings yet again and reveals prospect of very good dividend
 NA increases earnings yet again and reveals prospect of very good dividend Hamburg, 10 August 2006 Norddeutsche Affinerie AG (NA) has generated an accumulated pre-tax profit (EBT) of 75 million after nine
Boliden. Interim Report January - June Mines Smelters Zinc Copper. Boliden AB
 Boliden Interim Report January - June 2005 Mines Smelters Zinc Copper Boliden AB 1 Boliden AB 2 Continued strong growth in China lower growth rate in the rest of the world Global Q2 2005* - Cu-consumption
Interim Report January September 2011
 Interim Report January September 2 Lennart Evrell President & CEO Mikael Staffas CFO Summary Market Financial turmoil - low visibility Price drop end of period Low growth in construction and automotive
Management Report and Financial Statements 2012/13 Aurubis AG
 Management Report and Financial Statements 2012/13 Aurubis AG TABLE OF CONTENTS 2 MANAGEMENT REPORT 3 Business and environment 11 Business performance at Aurubis AG in 2012/13 14 Fiscal situation 20 Non-financial
Full year Report. January December Lennart Evrell. Johan Fant. Bildplatshållare. President & CEO CFO
 Full year Report January December 2008 Bildplatshållare Lennart Evrell President & CEO Johan Fant CFO 1 2009-02-13 Fourth Quarter 2008 Market Lower demand for base metals Negative growth in mature regions
Disclaimer FORWARD LOOKING STATEMETNS. This text includes forward looking statements.
 May 2017 Disclaimer This presentation has been prepared by Halcor S.A. (the «Company») for use during the Hellenic Fund and Asset Management Association. This text is provided under confidentiality for
Interim report January March 2013
 Interim report January March 213 Lennart Evrell President & CEO Mikael Staffas CFO Summary Revenues 9,249 (1,321) MSEK EBIT ex PIR* 751 (1,258) MSEK EBIT 695 (1 54) MSEK Free Cash Flow -22 (888) MSEK Msek
Hindalco. Investor Presentation Q4 FY17 Mumbai, May 30, Excellence by Design
 Hindalco Investor Presentation Q4 FY17 Mumbai, May 30, 2017 Forward Looking & Cautionary Statement Certain statements in this report may be forward looking statements within the meaning of applicable securities
Market analysis. Mines Smelters Zinc Copper. President & CEO Jan Johansson. Boliden s Capital Markets Days 7-8 June 2006 Odda, Norway
 Boliden s Capital Markets Days 7-8 June 2006 Odda, Norway Market analysis President & CEO Jan Johansson Mines Smelters Zinc Copper Boliden s Capital Markets Days 7-8 June 2006 Odda, Norway 2 Continued
THERE S MORE TO IT. Financial Statements of Aurubis AG 2017/18
 THERE S MORE TO IT Financial Statements of Aurubis AG 2017/18 2 The Management Report of Aurubis AG is combined with the Management Report of the Aurubis Group in accordance with Section 315 (3) of the
Report of the Supervisory Board
 Report of the Supervisory Board Collaboration between the Supervisory Board and Executive Board The joint target of the Executive Board and Supervisory Board is to increase the enterprise value of Aurubis
Interim report Q2 2014
 Interim report Q2 214 Lennart Evrell President & CEO Mikael Staffas CFO Summary Q2 214 Revenues 9 438 (8 35) MSEK EBIT ex PIR* 374 (37) MSEK EBIT 478 (-59) MSEK Free Cash Flow 92 (-1 477) MSEK MSEK 1 8
AUDITED RESULTS FOR THE YEAR ENDED 31 DECEMBER 2016
 AUDITED RESULTS FOR THE YEAR ENDED 31 DECEMBER 2016 AGENDA 2 1 Opening remarks / market update 2 Financial results 3 Operational review 4 Strategy update 5 Outlook 1 2 3 4 5 OPENING REMARKS / MARKET UPDATE
Boliden. Full Year Report Mines Smelters Zinc Copper. Boliden AB 1 February 9, 2005
 Boliden AB 1 Boliden Full Year Report 2004 Mines Smelters Zinc Copper Boliden AB 2 Strong global financial recovery Growth 2004 Global - Cu consumption 7 % - Cu production 6 % - Zn consumption 7 % - Zn
Saudi Arabian Mining Company (Ma aden)
") Saudi Arabian Mining Company (Ma aden) Earnings Conference Call Q2 2017 August 1, 2017 Earnings Call Presentation Q2, 2017 1 Walid Al-Hakim Head Investor Relations Earnings Call Presentation Q2, 2017 2
Saudi Arabian Mining Company (Ma aden) Earnings Conference Call Q2 2017 August 1, 2017 Earnings Call Presentation Q2, 2017 1 Walid Al-Hakim Head Investor Relations Earnings Call Presentation Q2, 2017 2
Saudi Arabian Mining Company (Ma aden)
") Saudi Arabian Mining Company (Ma aden) Earnings Conference Call Second Quarter 2018 July 26, 2018 1 Reem M. Asaad Head of Investor Relations 2 Forward looking statement This presentation contains statements
Saudi Arabian Mining Company (Ma aden) Earnings Conference Call Second Quarter 2018 July 26, 2018 1 Reem M. Asaad Head of Investor Relations 2 Forward looking statement This presentation contains statements
BEFESA BEFESA. Second Quarter 2016 Earnings Presentation
 BEFESA Second Quarter 2016 Earnings Presentation 24 th August 2016 Forward-looking Statement This presentation contains forward-looking statements and information relating to Befesa and its affiliates
Interim report January June 2012
 Interim report January June 212 Lennart Evrell President & CEO Mikael Staffas CFO Q2 Summary Revenues 1,363 (9,896) MSEK EBIT excl. PIR* 931 (1,12) MSEK Operating profit MSEK 769 (1,134) Free Cash Flow
Financial Results: Fourth Quarter & Fiscal October 24, 2017
 Financial Results: Fourth Quarter & Fiscal 2017 October 24, 2017 Safe Harbor SAFE HARBOR Statements and information included in this presentation by Schnitzer Steel Industries, Inc. (the "Company") that
Hindalco Industries Limited. Q2 FY19 Earnings Presentation 02 nd November, 2018
 Hindalco Industries Limited Q2 FY19 Earnings Presentation 02 nd November, 2018 SAFE HARBOUR Certain statements in this report may be forward looking statements within the meaning of applicable securities
Boliden. Interim Report January - March Mines Smelters Zinc Copper. Boliden AB 1 May 4, 2006
 Boliden AB 1 Boliden Interim Report January - March 2006 Mines Smelters Zinc Copper Boliden AB 2 Continued strong growth in China lower growth rate in the rest of the world Global 2006 Q1* - Cu-consumption
The New Leader in Global Copper. August 1, Second Quarter 2013
 The New Leader in Global Copper August 1, 2013 Second Quarter 2013 Cautionary Note Regarding Forward-Looking Statement Certain statements and information contained in this presentation, including all statements
Interim Report January June 2010
 Interim Report January June 21 Lennart Evrell President & CEO Johan Fant CFO Second quarter 21 The Market Concerns over China price volatility Improving demand Metal prices down gold, silver up Tight concentrate
Financial Statements of Aurubis AG 2016/17
 Financial Statements of Aurubis AG 2016/17 2 The Management Report of Aurubis AG is combined with the Management Report of the Aurubis Group in accordance with Section 315 (3) German Commercial Code (HGB)
BEFESA ZINC BEFESA ZINC. First Quarter 2012 Earnings Presentation. 16 th May Innovative Technology Solutions for Sustainability
 Innovative Technology Solutions for Sustainability BEFESA ZINC First Quarter 0 Earnings Presentation 6 th May 0 Forward-looking Statement This presentation contains forward-looking statements and information
High-quality aluminium coils of AMAG Austria Metall AG
 High-quality aluminium coils of AMAG Austria Metall AG Financial Report 1 st half year of 2015 2 AMAG Financial Report Key figures for the AMAG Group Key figures for the Group in EUR million Q2/2015 Q2/2014
Annual Accounts CEO Roeland Baan CFO Chris de la Camp. February 2, 2017
 Annual Accounts 216 CEO Roeland Baan CFO Chris de la Camp February 2, 217 Today s attendees from Outokumpu Roeland Baan CEO Chris de la Camp CFO Tommi Järvenpää Director Investor Relations 2 Disclaimer
AUDITED RESULTS FOR THE YEAR ENDED 31 DECEMBER 2015
 AUDITED RESULTS FOR THE YEAR ENDED 31 DECEMBER 2015 AGENDA 2 1 Opening remarks / market update Richard 2 Financial results David 3 Operational review Richard 4 Strategy update Richard 5 Outlook Richard
Revised October 17, 2016
 Revised October 17, 2016 60 ISM Manufacturing Purchasing Managers Index (September 2015 September 2016) 58 56 54 52 50 48 46 44 42 Sept-15 Oct Nov Dec Jan-16 Feb Mar Apr May Jun Jul Aug Sept Purchasing
November 6, 2012 INVESTOR PRESENTATION
 Q2 November 6, 2012 INVESTOR PRESENTATION HIGHLIGHTS AND FINANCIAL PERFORMANCE 2 Q2, : Highlights ¾Operational performance sequentially better than Q1 ` Crore Sales EBITDA Q2 % Increase over Q1 6 164 6,164
Second Quarter 2014 Results. July 24, 2014
 Second Quarter 2014 Results July 24, 2014 Forward Looking Information Both these slides and the accompanying oral presentation contain certain forward-looking statements within the meaning of the United
BEFESA BEFESA. Fiscal Year 2016 Earnings Presentation
 BEFESA Fiscal Year 2016 Earnings Presentation 6 th April 2017 Introduction Business Highlights Steel Dust Recycling Services Aluminium Salt Slags Services Financials Business Outlook Q&A Appendix Wolf
The operating profit, excluding the revaluation of process inventory, totalled SEK 711 million (SEK 603 m).
.") The operating profit, excluding the revaluation of process inventory, totalled SEK 711 million (SEK 603 m). Improvements in zinc prices and a weaker SEK had a positive impact on the profit. Copper concentrate
The operating profit, excluding the revaluation of process inventory, totalled SEK 711 million (SEK 603 m). Improvements in zinc prices and a weaker SEK had a positive impact on the profit. Copper concentrate
Interim Results Half year ended 31 December 2013
 Interim Results Half year ended 31 December 2013 Galdino Claro, Group Chief Executive Officer Rob Larry, Group Chief Financial Officer 14 February 2014 Disclaimer Cautionary Statements Regarding Forward-Looking
NKT. Annual Report 2010 Live presentation 1 March 2011 at 11:00 am. NKT Holding A/S / IR presentation / Annual Report
 NKT Annual Report 2010 Live presentation 1 March 2011 at 11:00 am NKT Holding A/S / IR presentation / Annual Report 2010 1 Agenda NKT Group 2010 in headlines Expectations 2011 Financial results 2010 NKT
2 nd Quarter CMC Business Model. Overview. North America. Vertical Integration. Product Diversification Global Geographic Dispersion
 CMC Business Model Vertical Integration 2 nd Quarter 2009 Product Diversification Global Geographic Dispersion Current Market Conditions & Outlook Overview Current Market Conditions & Outlook North America
Nickel Market Outlook
 22/9/215 Nickel Market Outlook Stuart Harshaw This presentation may include statements that present Vale's expectations about future events or results. All statements, when based upon expectations about
NEWS RELEASE Lundin Mining Second Quarter Results
 Corporate Office 150 King Street West, Suite 2200 P.O. Box 38 Toronto, ON M5H 1J9 Phone: +1 416 342 5560 Fax: +1 416 348 0303 NEWS RELEASE Lundin Mining Second Quarter Results Toronto, July 25, 2018 (TSX:
30 OCTOBER Q Interim Management Statement
 30 OCTOBER 2018 Q3 2018 Interim Management Statement Important Notice This presentation has been prepared by the management of Nyrstar NV (the "Company"). It does not constitute or form part of, and should
2013 INTERIM RESULTS. Operating income severely impacted by scheduled maintenance shutdowns as well as high scrap metals prices
 2013 INTERIM RESULTS severely impacted by scheduled maintenance shutdowns as well as high scrap metals prices Suresnes, August 29, 2013: the Board of Directors of Recylex SA (NYSE Euronext Paris: FR0000120388
Financial & Business Highlights For the Year Ended June 30, 2017
 Financial & Business Highlights For the Year Ended June, 17 17 16 15 14 13 12 Profit and Loss Account Operating Revenue 858 590 648 415 172 174 Investment gains net 5 162 909 825 322 516 Other 262 146
Third-quarter earnings burdened by raw material-related losses. Group adjusted EBITDA at EUR 56 million
 1 (23) Contents Highlights in the third quarter of 2017... 2 Highlights during the first nine months of 2017... 2 Business and financial outlook for the fourth quarter of 2017... 3 CEO Roeland Baan...
Results of the first nine months 2018
 Results of the first nine months 2018 Salzgitter, November 14, 2018 Key data per 2018/11/14 9M 2018 9M 2017 Q3 2018 Q2 2018 Q1 2018 Crude steel production kt 5,203.6 5,151.0 52.6 1,674.7 1,755.1 1,773.8
Investor Presentation
 Investor Presentation November 2018 Nasdaq: SCHN Safe Harbor SAFE HARBOR Statements and information included in this presentation by Schnitzer Steel Industries, Inc. (the "Company") that are not purely
HTL INTERNATIONAL HOLDINGS LIMITED 2015 RESULTS BRIEFING
 HTL INTERNATIONAL HOLDINGS LIMITED 2015 RESULTS BRIEFING Business Conditions Agenda Financial Highlights Outlook, Initiatives and Challenges Business Conditions Page 3 Business Conditions Macro Uncertain
CHELYABINSK ZINC PLANT Annual Results
 CHELYABINSK ZINC PLANT 2010 Annual Results Disclaimer This Presentation (the Presentation ) of JSC Chelyabinsk Zinc Plant (the Company ) has been prepared solely for informational purposes in connection
The free cash flow was negatively affected by high stock levels, and totalled SEK 91 m (953).
.") The operating profit, excluding revaluation of process inventory, increased to SEK 1,318 m (1,055). Improved metal prices had a positive effect on the profit. The free cash flow was negatively affected
The operating profit, excluding revaluation of process inventory, increased to SEK 1,318 m (1,055). Improved metal prices had a positive effect on the profit. The free cash flow was negatively affected
BEFESA BEFESA. Fiscal Year 2015 Earnings Presentation
 BEFESA Fiscal Year 2015 Earnings Presentation 25 th February 2016 Forward-looking Statement This presentation contains forward-looking statements and information relating to Befesa and its affiliates that
Corporate Update. Right Time, Right Business, Right Model
 Corporate Update Right Time, Right Business, Right Model Feb 2018 Disclaimer The information contained in this presentation is intended solely for your personal reference and may not be reproduced, redistributed
BUSINESS YEAR 2017/18 2 nd QUARTER, 1 st HALF
 BUSINESS YEAR 2017/18 2 nd QUARTER, 1 st HALF Investor Relations November 2017 www.voestalpine.com OVERVIEW BUSINESS MODEL» voestalpine is a leading technology and capital goods group with combined material
Press Release December 15, 2017
 ISRA VISION AG: 2016 / 2017 financial year Revenues and EBT +11 %, cash flow significantly stronger ISRA again matches full year guidance: Heading for the next revenue level with double-digit growth rates
ANNUAL PRESS CONFERENCE FOR 2015
 CREATING TOMORROW S SOLUTIONS ANNUAL PRESS CONFERENCE FOR 215 Dr. Rudolf Staudigl, President & CEO, March 17, 216 March 17, 216 Economic Output Increases across Every Region in 215 Worldwide GDP Trend
The new hot rolling mill
 The new hot rolling mill Financial Report 3 rd Quarter 2015 2 AMAG Financial Report Key figures for the AMAG Group Key figures for the Group in EUR million Q3/2015 Q3/2014 Change in % Q1-Q3/2015 Q1-Q3/2014
Status Quo and Outlook of China's nonferrous metal futures Market
 Status Quo and Outlook of China's nonferrous metal futures Market Shanghai Futures Exchange Zhu Jianghong Istanbul Turkey 13,May,2014 Shanghai Futures Exchange 12 listed commodity futures contracts: Non-Ferrous
Results for the first three quarters of 2010 November 8, 2010
 Results for the first three quarters of November 8, ANDRITZ GROUP /Q1 results at a glance Favorable business development in Order intake: 932 in : +11 vs. 3,236 in Q1 : +27 vs. Q1 Order backlog: 5,478
BMO Capital Markets 2017
 BMO Capital Markets 2017 Global Metals & Mining Conference 27 th February 2017 Iván Arriagada Chief Executive Officer Cautionary statement This presentation has been prepared by Antofagasta plc. By reviewing
The Brazilian boom is it happening and what will it mean for copper industry growth in this newly industrializing economy?
 The Brazilian boom is it happening and what will it mean for copper industry growth in this newly industrializing economy? Presented by Paranapanema S.A. Brazil Mario L. Lorencatto Table of Contents 1.
Copper market outlook: Transitioning to deficits
 Copper market outlook: Transitioning to deficits Prepared for: Nonferrous Metals Forum of the Shanghai Derivatives Market Forum, 25 th May 27 Prepared by: Erik Heimlich, Senior Consultant, Copper Price
Press Release May 31, 2017
 ISRA VISION AG: 1st half year 2016 / 2017 A further step to 150 +: Revenues and EBT each grow by +11% Double-digit growth in the first six months ISRA continues growth path with high order backlog Revenues
Positive trend in earnings and strong cash flow
 Positive trend in earnings and strong cash flow Presentation of the Q3/2017 result Martin Lindqvist, President & CEO Håkan Folin, CFO October 25, 2017 Agenda Q3/2017 and performance by division Financials
The Aurubis Copper Mail informs you monthly about current trends on the copper market.
 Copper Mail No. 137 June 30, 2016 The Aurubis Copper Mail informs you monthly about current trends on the copper market. In focus In a referendum held on June 23, 2016, a majority of the British population
Company Presentation. Cable Conference. ABN AMRO - London, 10th January 2008
 Company Presentation Cable Conference ABN AMRO - London, 10th January 2008 Agenda Company Overview Financials Outlook Appendix 1 A Global Cable Manufacturer The Prysmian Group operates 54 plants, has subsidiaries
CMA 2010 Support Package
 CMA 2010 Support Package Ratio Definitions CMA EXAM RATIO DEFINITIONS Abbreviations EBIT = Earnings before interest and taxes EBITDA = Earnings before interest, taxes, depreciation and amortization EBT
2009 FULL YEAR FINANCIAL RESULTS
 OZ MINERALS 2009 FULL YEAR FINANCIAL RESULTS TERRY BURGESS MANAGING DIRECTOR & CEO ANDREW COLES CHIEF FINANCIAL OFFICER 25 February 2010 WWW.OZMINERALS.COM OZ MINERALS NOVEMBER 2009 PAGE 1 IMPORTANT NOTICE
NEWS RELEASE LUNDIN MINING FOURTH QUARTER AND FULL YEAR RESULTS
 Corporate Office 150 King Street West, Suite 1500 P.O. Box 38 Toronto, ON M5H 1J9 Phone: +1 416 342 5560 Fax: +1 416 348 0303 UK Office Hayworthe House, Market Place Haywards Heath, West Sussex RH16 1DB
Financial Statements Release 2017
 Financial Statements Release 217 CEO Roeland Baan CFO Chris de la Camp January 31, 218 Disclaimer This presentation contains, or may be deemed to contain, statements that are not historical facts but forward-looking
Roadshow Kepler Cheuvreux. November 7, 2016, London. Driving transformation. Shaping the future.
 Roadshow Kepler Cheuvreux November 7, 2016, London Driving transformation. Shaping the future. Disclaimer Note: This presentation contains statements concerning the future business trend of the Vossloh
NEWS RELEASE LUNDIN MINING THIRD QUARTER RESULTS
 Corporate Office 150 King Street West, Suite 1500 P.O. Box 38 Toronto, ON M5H 1J9 Phone: +1 416 342 5560 Fax: +1 416 348 0303 UK Office Hayworthe House, Market Place Haywards Heath, West Sussex RH16 1DB
High metal grades and increased smelter production
 26-10-2009 Interim Report Boliden AB (publ) Box 44, 101 20 Stockholm, Sweden Tel +46 8 610 15 00, Fax +46 8 31 55 45 www.boliden.com Corp. ID no. 556051-4142 Interim Report, January September 2009 High
The KME Group. Roadshow. July, 2006
 The KME Group Roadshow July, 2006 Disclaimer THESE SLIDES HAVE BEEN PREPARED BY THE COMPANY SOLELY FOR THE USE AT THE ANALYST PRESENTATION THE INFORMATION CONTAINED HEREIN HAS NOT BEEN INDEPENDENTLY VERIFIED.
Southern Copper Corporation Highlights
 Southern Copper Corporation Highlights ht Southern Copper Corporation Highlights March 2009 January 2009 0 Safe Harbor Statement This presentation contains forward-looking statements, as defined by federal
Q Interim Report
 Q1 2013 Interim Report David Woolley (CEO) & David Bessant (CFO) 1 Agenda Q1 2013 Highlights DW Summary of financial results DB Q2 2013 Outlook DW Q&A DW & DB 2 Q1 2013 Highlights Activity in Q1 2013 showed
Q PRESENTATION
 Q2 2018 PRESENTATION August 1, 2018 Cautionary Information This presentation contains forward-looking information within the meaning of applicable Canadian and United States securities legislation. All
Bank of America Merrill Lynch Global Metals, Mining & Steel Conference. Iván Arriagada CEO Antofagasta Minerals 12 May 2015
 Bank of America Merrill Lynch Global Metals, Mining & Steel Conference Iván Arriagada CEO Antofagasta Minerals 12 May 2015 Cautionary statement This presentation has been prepared by Antofagasta plc. By
This is the Scrap Metal, Commodities, Recycling and Economic Report, by BENLEE and Raleigh and Goldsboro Recycling, July 24th, 2017.
 This is the Scrap Metal, Commodities, Recycling and Economic Report, by BENLEE and Raleigh and Goldsboro Recycling, July 24th, 2017. Last week commodity prices were mixed and economic reports were somewhat
First quarter report 1
 report 1 2 FIRST QUARTER REPORT Contents Contents Financial review 3 Overview 3 Market developments and outlook 5 Additional factors impacting Hydro 7 Underlying EBIT 8 Finance 12 Tax 12 Items excluded
Company results. for Q August Presentation for Analysts Meeting 8 August 2007
 Company results for Q2 2007 August 2007 Presentation for Analysts Meeting 8 August 2007 Contents Macroeconomic conditions Production results Financial results Costs by type and unit cost Balance sheet
Fourth Quarter and Full Year 2014 Financial Results March 5, 2015 TREC
 Your Click Specialty to edit Master Chemical title Partner style Fourth Quarter and Full Year 2014 Financial Results March 5, 2015 TREC Safe Harbor Statements in this presentation that are not historical
The Aurubis Copper Mail informs you monthly about current trends on the copper market.
 Copper Mail No. 133 March 2, 2016 The Aurubis Copper Mail informs you monthly about current trends on the copper market. In focus February 2016 was uneventful on the copper market and was impacted by significantly
Analyst Meet Presentation Standalone Financial Results, Quarter Ended 30 Sep 2011
 Analyst Meet Presentation Standalone Financial Results, Quarter Ended 30 Sep 2011 Agenda Business Environment Key Developments Performance Overview Projects Update Guidance Update 2 Global economy Recovery
LME EV Battery Materials
 LME EV Battery Materials December 2017 SETTING THE GLOBAL STANDARD LME is at the core of the global metal markets LME is the leading global exchange in all non-ferrous metals LME provides market leading
BUSINESS YEAR 2017/18 1 st QUARTER
 BUSINESS YEAR 2017/18 1 st QUARTER Investor Relations September 2017 www.voestalpine.com voestalpine GROUP OVERVIEW» voestalpine is a leading technology and capital goods group with combined material and
Investors Conference HSBC SRI Conference. February 7, 2017, Frankfurt. Driving transformation. Shaping the future.
 Investors Conference HSBC SRI Conference February 7, 2017, Frankfurt Driving transformation. Shaping the future. Disclaimer Note: This presentation contains statements concerning the future business trend