Corporate Presentation. April 2015
|
|
|
- Lindsay Aubrie Parker
- 5 years ago
- Views:
Transcription
1 Corporate Presentation April 2015
2 Future Oriented Information (See additional advisories at the end of this document) In the interest of providing information regarding Paramount Resources Ltd. ("Paramount" or the "Company"), including management's assessment of the Company's future plans and operations, this presentation contains certain forwardlooking information and forward-looking statements. The projections, estimates and beliefs contained in such forward-looking information and statements necessarily involve a number of assumptions and are subject to known and unknown risks and uncertainties which may cause the Company's actual performance and financial results in future periods to differ materially from any estimates or projections of future performance or results expressed or implied by such forward-looking statements. The material assumptions, risks and uncertainties are referred to in the advisories contained in the Advisories Appendix. Accordingly, shareholders and potential investors are cautioned that events or circumstances could cause actual results to differ materially from those predicted. Any use of information contained within this presentation is expressly forbidden. 2

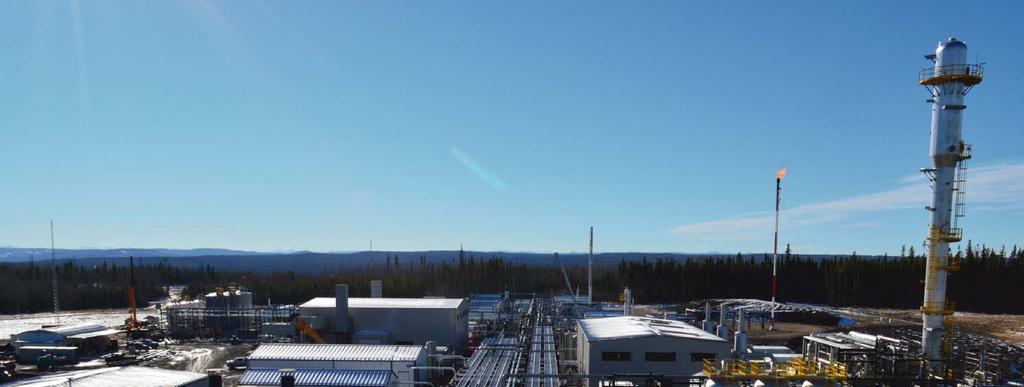
3 Corporate Profile Corporate Profile Founded in 1974; IPO in 1978 TSX: POU Market Cap: MM $32.00/share ~ $3.4 Billion ~50% insider ownership Net Debt (December 31, 2014): $1.5 Billion 2015 Capital Guidance: $400 MM Low Risk/Repeatable Growth Operations focused on large-scale Deep Basin development Large contiguous acreage Multi-zone potential High condensate/gas ratios Owned and firm service access to infrastructure Significant near-term growth in production and cash flow Surpass 70,000 Boe/d in 2015 following facilities expansion (1) Average 55,000 to 65,000 Boe/d for 2015 (1) Production mix evolving to ~50% liquids Exposure to emerging plays and Strategic Investments Duvernay Oil sands Liard Basin shale gas (1) Production dependent on availability of downstream NGLs transportation and processing capacity (2) Average sales volumes for the fourth quarter of
 ~5 + Bcf")
 Potential conventional Devonian exploration Potential Duvernay Shale rock play *Graphic courtesy of www.")
 Internal estimates: EUR denotes Estimated Ultimate Recovery, DGIIP denotes Discovered Gas Initially In Place.")
4 Deep Basin Resource Paramount Acreage (gross): 544 Sections Cretaceous Rights 364 Sections Montney Rights 249 Sections Duvernay Rights Deep Basin liquids-rich gas resources in multiple stacked horizons Bcf/section DGIIP (1) ~5 + Bcf EUR/Hz well (1) >10 Tcf DGIIP + NGLs net to POU (1) Liquids-rich Montney gas play ~70 + Bcf/section DGIIP (1) ~ 22 Tcf DGIIP + NGLs net to POU (1) Potential conventional Devonian exploration Potential Duvernay Shale rock play *Graphic courtesy of (1) Internal estimates: EUR denotes Estimated Ultimate Recovery, DGIIP denotes Discovered Gas Initially In Place. Please refer to "Oil and Gas Measures and Definitions" in the Advisories section of this presentation for further information. 4


 at 20.8 MPa IP: 12.")


5 Cretaceous Gas Resource Hz Dunvegan well at Resthaven Tested 11.3 MMcf/d (1) at 6.2 MPa IP: 8.3 MMcf/d Currently producing ~1.1 MMcf/d Cost: $8.3 MM d/c/t Hz Falher well at Musreau Tested 16.4 MMcf/d (1) at 20.8 MPa IP: 12.0 MMcf/d Currently producing ~2.0 MMcf/d Cost: $8.6 MM d/c/t (1) Please refer to the heading "Test Results" in the Advisories section of this presentation for further information 5
: 4.")
 NPV 10%: $2.")
6 Cretaceous Economics Assumptions Capital: $7.0 MM horizontal well IP: 9.0 MMcf/d Natural Gas (raw): 4.9 Bcf Raw Condensate Gas Ratio: 17 Bbl/MMcf C2-C4 NGLs: 61 Bbl/MMcf Deep Cut Facility Economics : $2.75 AECO, US$55.00 WTI (Deep-Cut) NPV 10%: $2.5 MM IRR: 31% Payout (Months): 30 P/I: 1.7 6
7 Montney Gas Resource Liquids-rich Montney gas play Paramount holds ~315 net sections of Montney rights 2011/2012 program included 16 Hz Montney wells: tested MMcf/d (1) Montney 2013 program: Drilled 15 wells; commenced drilling 25 additional wells off 3 pads in Musreau; participated in 5 non-op Montney wells in Karr 34 Montney wells rig released in 2014 including 23 pad wells at Musreau; participated in 2 non-op Montney wells in Karr well pad at Musreau completed in Q with combined test rates of 108 MMcf/d + NGLs (1) well pad at Musreau completed in Q with combined test rates of 130 MMcf/d + NGLs (1) Two new 6-well pads at Musreau will rig release in March 2015 (1) Please refer to the heading "Test Results" in the Advisories section of this presentation for further information 7
: 3.")

8 Montney Economics Assumptions Capital: $10.0 MM horizontal well IP: 5.8 MMcf/d Natural Gas (raw): 3.0 Bcf Raw Condensate Gas Ratio (CGR): 150 Bbl/MMcf (50 Bbl/MMcf Bbl/MMcf) C2-C4 NGLs: 90 Bbl/MMcf Deep Cut Facility $2.75 AECO, US$55.00 WTI (Deep Cut) NPV 10%: $7.7 MM IRR: 56% Payout (Years): 1.8 P/I: 1.8 8
9 Montney Drilling/Completion Improvements Pad drilling/pad layout Bits/muds/motors Well design: monobores/orientation/reservoir placement Toe up/toe down: effects on production Natural gas fueled rigs Plug and perf/sliding sleeves Cemented liners/open-hole packers (ECP s) Frac sizing/spacing/clusters Frac fluid selection/fluid handling Pumping techniques Frac fluid recycling Proppants Flow back/production practices Working with material and service providers to reduce costs 9
10 Musreau 2014: Drilled 24 (24 net) horizontal Montney wells Started drilling 15 (15 net) Montney wells on three pads Drilled 7 (6.3 net) horizontal Falher/Wilrich wells Drilled 2 (1.5 net) vertical wells to hold lands 2015: Drill 19 (19 net) horizontal Montney wells Drill 5 Cretaceous horizontal/directional wells Complete Stabilizer expansion: $18 MM Musreau gathering system expansion: $31 MM 10

 horizontal Montney wells with test rates of 2 MMcf/d to 12 MMcf/d + NGLs (1) 2015:")
 horizontal Montney wells Gathering System/Facility expansion: $15MM (1) Please refer")
11 Karr Multi-zone potential, including Halfway, Montney sour and Gething, Bluesky, Falher sweet commingled gas Current plant and gathering systems 40 MMcf/d; expanding by 40 MMcf/d in Q : Drilled 2 (1.0 net) horizontal Cretaceous wells Drilled 10 (9.3 net) horizontal Montney wells with test rates of 2 MMcf/d to 12 MMcf/d + NGLs (1) 2015: Drill 6 (5.5 net) horizontal Montney wells Gathering System/Facility expansion: $15MM (1) Please refer to the heading "Test Results" in the Advisories section of this presentation for further information 11


12 Deep Basin Processing Capacity Gross Raw Gas Capacity MMcf/d Net POU Raw Gas Capacity MMcf/d Potential Sales Volumes Boe/d (1) Musreau Deep Cut Facility ,000 Musreau Refrig Plant ,500 Smoky Deep Cut Facility ,000 Karr Capacity ,000 Other Musreau area capacity ,400 Stabilizer Expansion ,000 Subtotal ,900 Future Capacity Karr Expansion , Plant , Plant ,000 Subtotal ,000 Projected Total ,900 (1) Please refer to the heading Potential Sales Volumes in the Advisories section for further information. 12
 Please refer to the heading Deep")

13 Deep Basin Processing Capacity (1) (1) Please refer to the heading Deep Basin Processing Capacity in the Advisories section for further information. 13

14 Full Capacity at Musreau Currently limited to 120 MMcf/d; 8,000 Bbl/d C2+ base capacity and stabilization capacity of 8,500 Bbl/d Full Capacity at Musreau Liquids transportation Pembina HVP in-service LVP in-service De-ethanization capacity Current 8,000 Bbl/d gross C2+ capacity Interruptible capacity with other fractionators Keyera De-ethanizer expansion Phase 1 by Q (13,000 Bbl/d) Phase 2 mid-2015 (19,000 Bbl/d) Condensate stabilizer expansion to 23,500 Bbl/d Additional 15,000 Bbl/d Commission Q1 2015; onstream Q Long-term contracts Firm service with TCPL 10 year liquids transportation with Pembina 10 year de-ethanization and fractionation with Keyera 10 year ethane sales agreement with NOVA Chemicals 14
15 Musreau 8-13 Complex October 13,
16 Illustrative Deep-Cut - Montney Wells 200 MMcf/d x 23% Shrinkage = 154 MMcf/d Sales Gas (25,667 Boe/d) + 22,000 Bbl/d condensate + 18,000 Bbl/d NGLs Price Deep-Cut Sales Gas $2.75/Mcf Yield Bbl/MMcf 154 MMcf/d $423,500 Condensate $65.00/Bbl ,000 Bbl/d $1,430,000 Butane $35.00/Bbl ,500 Bbl/d $87,500 Propane $10.00/Bbl 25 5,000 Bbl/d $50,000 Ethane $10.00/Bbl ,500 Bbl/d $105,000 Total: 65,667 Boe/d $2,096,000/day Royalty 5% ($104,800/day) Operating Cost ($3.00/Boe) ($197,000/day) Total: 24.0 MMBoe/year $1,794,200/day $655 MM/year $27.29/Boe 16
17 Paramount Deep-Cut Montney - Illustrative Project Economics Paramount s shallow rights will add substantially to the RLI Paramount has de-risked a substantial amount of its land base and thus could have the potential to add a series of refrigeration or deep cut plants Simple Payout from free cash flow after start up is less than two years Resource Needed: 200 MMcf/d x 365 ~ 73 Bcf/year x 10 year RLI = 730 Bcf 70 ~ 50% recovery = ~ 20 Sections Cost 60 (5 MMcf/d wells) x $10 MM/well = $600 MM Gas Plant = $250 MM Total: $850 MM Annual Deep - Cut Cash Flow Annual Capital = 25 (3.0 Bcf) wells x $10 MM/well Free Cash Flow $655 MM/year $250 MM/year $405 MM/year 17
18 Pembina Peace Pipeline Expansion Numbers provided by Pembina Pipelines LVP Capacity (Bbl/d) HVP Capacity (Bbl/d) In-Service Current 195, ,000 Phase 2 Expansion 55,000 20,000* 2015 Phase 3 Expansion 470,000** 2016/2017 Total 855,000 * By displacement onto 53,000 Bbl/d Pembina North Expansion * *LVP/HVP combined; split to be determined 18
 Drilled and completed 2 Hz Duvernay wells to date: Well #1")


 Includes Duvernay lands to be earned (2) Please")
19 Willesden Green Duvernay Shale Play 64,452 (34,305 net) acres of land when earning complete (1) Drilled and completed 2 Hz Duvernay wells to date: Well #1 flowed back ~12,200 Bbl of condensate and oil and ~11.0 MMcf of natural gas, brought on production Q4 2014; Cum production to Feb 15, 2015 is 60 MMcf natural gas + 46 MBbl oil (2) Well #2 flowed back ~3,600 Bbl of condensate and oil and ~16.0 MMcf of natural gas; scheduled to be brought on production in 2015; >200 Bbl/MMcf Drilled one additional Hz Duvernay well in Q1 2015; completion Q Paramount has explored for ideal combinations of rock quality/liquids ratio/pressure gradient (1) Includes Duvernay lands to be earned (2) Please refer to the heading "Test Results" in the Advisories section of this presentation for further information 19
 Montney wells tested 3.0-12.5 MMcf/d + NGLs/Condensate (1) Doig wells tested 2.")
 Montney rights Montney shale play (50% WI) Seven Hz Montney wells Production has been processed through pilot")
 Based on results from Paramount's wells and publicly disclosed results")
20 Montney Valhalla: ~65 sections (~49 net) Montney/~67 sections (~34 net) Doig rights Montney/Doig Play 16 wells tied in at restricted rates (midstream constraints) Montney wells tested MMcf/d + NGLs/Condensate (1) Doig wells tested MMcf/d + NGLs/Condensate (1) Evaluating long term production/economics to determine future investment levels Birch: ~67 sections (~34 net) Montney rights Montney shale play (50% WI) Seven Hz Montney wells Production has been processed through pilot facility limited to 3 MMcf/d NGL yields average 60 Bbl/MMcf (1) Please refer to the heading "Test Results" in the Advisories section of this presentation for further information (2) Based on results from Paramount's wells and publicly disclosed results of competitor wells. 20
21 Paramount Investments
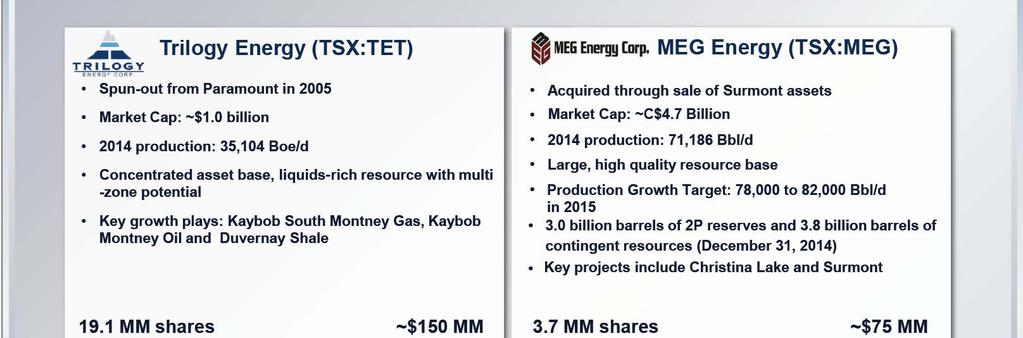
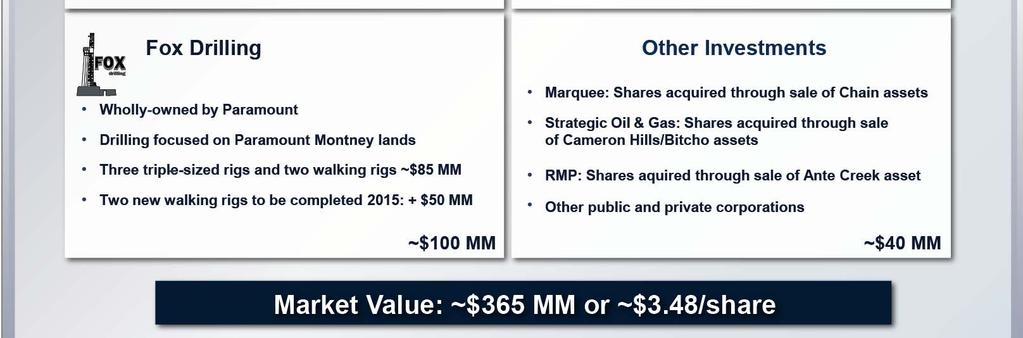
22 Paramount Investments 22

23 Cavalier Energy Inc.

 sections Prospective primarily for conventional oilsands, bitumen in carbonates, and cold-flow heavy oil Hoole Project: 100% WI")

24 Cavalier Energy Inc. Corporate Profile Created in December 2011; experienced team led by CEO Dr. Will Roach Paramount contributed its oilsands assets and seed capital to Cavalier Funding at the Cavalier level will be via a combination of equity and debt Assets retained as 100% WI within Cavalier Energy Regulatory approval for the development of the first 10,000 Bbl/d SAGD project at Hoole received June 2014 Corporate Resources Approximately 345 (net) sections Prospective primarily for conventional oilsands, bitumen in carbonates, and cold-flow heavy oil Hoole Project: 100% WI (1) Resource estimates are Best Estimates based on McDaniel independent engineering reports dated as of October 31, 2011 for Saleski, House, Granor and Orchid; April 30, 2010 for Eagles Nest; and December 31, 2014 for Hoole. Please refer to "Oil Sands Measures and Definitions" in the Advisories section of this presentation for oil sands reserves, resources and related definitions (including NPV). 24


 Probable Reserves NPV BT 10%: $363 Million (1)")
 Kjoli_fou 275 250 Kgrand_rp (1)")


25 Hoole Grand Rapids - 1st Project Grand Rapids Reservoir Φ = 30 %, k = 1 to 4 D d = 250m, h ~ 20m, p = 1,500 kpa Viscosity = 200,000 to 2,000,000 cp McDaniel Best Estimate: DEBIP = 2.5 Billion Bbl (1) 80 wells drilled to date; 42 cored 93 Million Bbl Probable Undeveloped Reserves and 1,157 Million Bbl Best Estimate Contingent Resource (1) Probable Reserves NPV BT 10%: $363 Million (1) Contingent Resource Best Estimate NPV BT 10%: $2.4 Billion (1) Kjoli_fou Kgrand_rp (1) Independent evaluation by McDaniel & Associates Consultants Ltd. effective December 31, 2014 Please refer to "Oil Sands Measures and Definitions" in the Advisories section of this presentation for oil sands reserves, resources and related definitions 25
26 Liard Basin Shale Gas
 : 170-500 Bcf / section OGIP ~20% expected recovery ~34-100 Bcf sales gas/section Paramount holds ~133 net")

 or in accordance with the COGE Handbook.")
27 Liard Basin Besa River Shale Play Drilled and completed b-40-i Completion of d-57-d horizontal deferred as land earning completed Completed drilling d-71-g Spud c-37-d at La Biche Liard Basin industry estimates (1) : Bcf / section OGIP ~20% expected recovery ~ Bcf sales gas/section Paramount holds ~133 net sections with production potential from the Besa River shale gas formation (1) As publicly disclosed by a large U.S. public E&P company with significant landholdings in the Liard Basin. The resource evaluation disclosed by such E&P company was not noted as having been prepared independently or by a qualified reserves evaluator or auditor (as such terms are defined in NI ) or in accordance with the COGE Handbook. This information is relevant to Paramount s landholdings in the Liard Basin as the information is in respect of landholdings in the Liard Basin that are close to Paramount s lands and are, accordingly, likely to have similar geology. 27
 Central Mackenzie Land holdings ~1,300,000")
 625 MMBbl (2)")


 Estimates of DOIIP and UOIIP are based on internal engineering studies")


28 MGM Energy Mackenzie Delta Land holdings ~ 300,000 (155,000 net) acres Contingent Resources 473 Bcf (1) Central Mackenzie Land holdings ~1,300,000 (725,000 net) acres Nogha Contingent Resources 92 Bcf (1) Canol Resource Summary Discovered Oil Initially-In-Place ("DOIIP") 625 MMBbl (2) Undiscovered Oil Initially-In-Place ("UOIIP") 4,800 MMBbl (2) (1) Contingent resource estimates are Best Estimates based on internal engineering studies completed by qualified reserves evaluators and audited by a qualified reserves auditor as of December 31, 2007 for Olivier, Langley, Ellice, Nogha and Umiak and as of March 16, 2009 for Qavvik. Refer to "Oil and Gas Measures and Definitions" in the advisories section of this presentation for further information. (2) Estimates of DOIIP and UOIIP are based on internal engineering studies completed by qualified reserves evaluators as of December 31, These estimates include adjustments for working interest, but not for royalties or other encumbrances and reflect the mean volume of OIIP from the probabilistic assessment of oil that is in place. Refer to "Oil and Gas Measures and Definitions" in the advisories section of this presentation for further information. 28

29 Quarterly Operating Results 29


30 Conventional Reserves Columns may not add due to rounding. Conventional reserves only. Includes nominal amounts of estimated reserves in respect of Paramount's initial shale gas well at Patry, B.C. Reserves evaluated by McDaniel &Associates Consultants Ltd. in accordance with National Instrument definitions, standards and procedures. 30
31 Exposure to significant reserve opportunities Kaybob Deep Basin: Cretaceous, Montney Karr: Montney Valhalla: Montney, Doig Willesden Green: Duvernay Birch: Montney Significant asset value Trilogy MEG Energy Cavalier Energy Liard Shale Gas Paramount continues to provide long-term value creation for shareholders Summary 31
32 ADVISORIES APPENDIX
33 Advisories Certain statements in this presentation constitute forward-looking information under applicable securities legislation. Forward-looking information typically contains statements with words such as "anticipate", "believe", "estimate", "will", "expect", "plan", "intend", "propose", or similar words suggesting future outcomes or an outlook. Forward looking information in this presentation includes, but is not limited to: projected production and sales volumes including the liquids component thereof; forecast capital expenditures; exploration, development and associated operational plans and strategies (including planned drilling and completion programs, well tie ins and potential facility expansions and additions and the anticipated timing of such activities); projected timelines for, constructing, commissioning and/or starting-up new and expanded natural gas processing and associated facilities, and the Company's Deep Basin processing capacity following the completion of these facilities; reserves and resources estimates (including internal estimates of DGIIP, EUR, OIIP and contingent resources related to Paramount's properties and estimated net present values of reserves and resources); illustrative deep-cut project economics (including the commodity price, royalty rate, capital and operating cost, production volume, NGLs yield, well reserves, reserve life index, cash flow and payout assumptions used therein); Paramount s potential ability to build and utilize additional processing facilities; projected type well production profiles, net present value estimates, internal rates of return and payout (and the initial production rate, reserves, capital and operating cost, shrinkage, NGLs yield and NGLs pricing assumptions used to generate such profiles and estimates); and general business strategies and objectives. Such forward-looking information is based on a number of assumptions which may prove to be incorrect. Assumptions have been made with respect to the following matters, in addition to any other assumptions identified in this presentation or Paramount s continuous disclosure documents: future natural gas, condensate, Other NGLs, oil and bitumen and other commodity prices; royalty rates, taxes and capital, operating, general & administrative and other costs; foreign currency exchange rates and interest rates; general economic and business conditions; the ability of Paramount to obtain the required capital to finance its exploration, development and other operations; the ability of Paramount to obtain equipment, services, supplies and personnel in a timely manner and at an acceptable cost to carry out its activities; the ability of Paramount to secure adequate product processing, transportation, de-ethanization, fractionation and storage capacity on acceptable terms; the ability of Paramount to market its natural gas, condensate, Other NGLs, oil and bitumen successfully to current and new customers; the ability of Paramount and its industry partners to obtain drilling success (including in respect of anticipated production volumes, reserves additions and liquids yields and resource recoveries) and operational improvements, efficiencies and results consistent with expectations; the timely receipt of required governmental and regulatory approvals; and anticipated timelines and budgets being met in respect of drilling programs and other operations (including well completions and tie-ins and the construction, commissioning and start-up of new and expanded facilities). Although Paramount believes that the expectations reflected in such forward looking information are reasonable, undue reliance should not be placed on them as Paramount can give no assurance that such expectations will prove to be correct. Forward-looking information is based on current expectations, estimates and projections that involve a number of risks and uncertainties which could cause actual results to differ materially from those anticipated by Paramount and described in the forward-looking information. These risks and uncertainties include and/or relate (but are not limited) to: fluctuations in natural gas, condensate, Other NGLs, oil and bitumen and other commodity prices; changes in foreign currency exchange rates and interest rates; the uncertainty of estimates and projections relating to future revenue, future production, reserve additions, liquids (including condensate and natural gas ratios), resources recoveries, yields, royalty rates, taxes and costs and expenses; the ability to secure adequate product processing, transportation, de-ethanization, fractionation and storage capacity on acceptable terms; operational risks in exploring for, developing and producing natural gas, condensate, Other NGLs, oil and bitumen; the ability to obtain equipment, services, supplies and personnel in a timely manner and at an acceptable cost; potential disruptions or unexpected technical or other difficulties in designing, developing, expanding or operating new, expanded or existing facilities (including third party facilities); industry wide processing, pipeline, de-ethanization, and fractionation infrastructure outages, disruptions and constraints; risks and uncertainties involving the geology of oil and gas deposits; the uncertainty of reserves and resources estimates (including internal estimates of DGIIP, EUR, DOIIP, OIIP and contingent resources); the ability to generate sufficient cash flow from operations and obtain financing at an acceptable cost to fund planned exploration, development and operational activities and meet current and future obligations (including costs of anticipated new and expanded facilities and other projects and product processing, transportation, de-ethanization, fractionation and similar commitments); changes in, or in the interpretation of, laws, regulations or policies (including environmental laws); the ability to obtain required governmental or regulatory approvals in a timely manner and to enter into and maintain leases and licenses; general business, economic and market conditions; the effects of weather; the timing and costs of future abandonment and reclamation obligations and potential liabilities for environmental damage and contamination; uncertainties regarding aboriginal claims and in maintaining relationships with local populations and other stakeholders; the outcome of existing and potential lawsuits, regulatory actions, audits and assessments; and other risks and uncertainties described elsewhere in this presentation and in Paramount s filings with Canadian securities authorities, including its Annual Information Form. The foregoing list of risks is not exhaustive. Additional information concerning these and other factors which could impact Paramount are included in Paramount s most recent Annual Information Form. The forward-looking information contained in this presentation is made as of the date hereof and, except as required by applicable securities law, Paramount undertakes no obligation to update publicly or revise any forward-looking statements or information, whether as a result of new information, future events or otherwise. 33
34 Advisories cont d Oil and Gas Measures and Definitions This presentation contains disclosure expressed as "Boe", "MBoe", "MMBoe, and "Boe/d". All oil and natural gas equivalency volumes have been derived using the ratio of six thousand cubic feet of natural gas to one barrel of oil. Equivalency measures may be misleading, particularly if used in isolation. A conversion ratio of six thousand cubic feet of natural gas to one barrel of oil is based on an energy equivalency conversion method primarily applicable at the burner tip and does not represent a value equivalency at the well head. For the year ended December 31, 2014, the value ratio between crude oil and natural gas was approximately 18:1. This value ratio is significantly different from the energy equivalency ratio of 6:1. Using a 6:1 ratio would be misleading as an indication of value. This presentation contains internal estimates of Discovered Gas Initially in Place ("DGIIP") and Estimated Ultimate Recovery ("EUR") in respect of the Company s Kaybob area lands and DOIIP and UOIIP in respect of the Company s Mackenzie Valley lands. DGIIP means that quantity of gas that is estimated, as of a given date, to be contained in known accumulations prior to production. The recoverable portion of DGIIP includes production, reserves and contingent resources; the remainder is unrecoverable. DGIIP is the most specific category that could be assigned to the applicable gas resource. There is no certainty that it will be commercially viable to produce any portion of this DGIIP. EUR means those quantities of oil or gas which are estimated, on a given date, to be potentially recoverable from an accumulation, plus those quantities of oil or gas already produced therefrom. DOIIP and UOIIP mean that quantity of oil that is estimated, as of a given date, to be contained in known accumulations prior to production. There is no certainty that it will be commercially viable to produce any portion of the resources. DOIIP is the most assignable category for the resources assigned to EL 466 as a well specifically targeting the Canol shale oil play has been drilled, however, there is insufficient data to determine an expected recovery factor and therefore a contingent or prospective resource or reserve amount cannot be estimated. UOIIP is the most assignable category to the remaining Mackenzie Valley Canol oil leases as no wells specifically targeting the Canol shale oil play have been drilled on these exploration licenses. Also, there is insufficient data to determine an expected recovery factor and therefore a contingent or prospective resource or reserve amount cannot be estimated. There is no certainty that any portion of the resources will be discovered. If discovered, there is no certainty that it will be commercially viable to produce any portion of the resources. Paramount has provided information with respect to certain of its plays and emerging opportunities which is analogous information as defined in NI This analogous information includes Paramount's internal estimates of DGIIP, DOIIP, UOIIP or EUR, all as defined in the Canadian Oil and Gas Evaluation Handbook ( COGEH ) or by the Society of Petroleum Engineers - Petroleum Resources Management System ( SPE-PRMS ), and/or production type curves in respect of proved plus probable reserves. This analogous information is presented on a basin, subbasin or area basis utilizing data derived from Paramount's internal sources, as well as from a variety of publicly available information sources which are predominantly independent in nature. These internal estimates are subject to the specific assumptions identified by Paramount in respect of such estimates plus other assumptions contained herein and are not determinative of the actual resources or production rates associated with Paramount's properties and wells. Contingent Resources in respect of the Company s Mackenzie Delta lands the means those quantities of natural gas estimated on a given date to be potentially recoverable from known accumulations but are not currently economic due to: (i) lack of pipeline infrastructure, making the project uneconomic on a stand-alone basis; (ii) potential regulatory issues with respect to the construction of the pipeline and facility infrastructure; (iii) lack of demonstrated intent to bring the volumes to market within a specific time frame; and (iv) insufficient drilling or technical data to accurately estimate total pool productivity. Conventional reserve estimates include nominal amounts of volumes and future net revenues related to Paramount s completed shale gas well. The estimates of reserves and future net revenue for individual properties may not reflect the same confidence level as estimates of reserves and future net revenue for all properties, due to the effects of aggregation. Estimates of future net revenue do not represent fair market value. Non-GAAP Measures In this presentation Net Debt and Funds Flow (collectively, the Non-GAAP measures ) are used and do not have any standardized meanings as prescribed by GAAP. Net Debt is a measure of a company's overall debt position after adjusting for certain working capital amounts and is used by management to assess a company s overall leverage position. Funds flow refers to cash from operating activities before net changes in operating non-cash working capital, geological and geophysical expenses and asset retirement obligation settlements. Funds flow is commonly used in the oil and gas industry to assist management and investors in measuring a company s ability to fund capital programs and meet financial obligations. Non-GAAP measures should not be considered in isolation or construed as alternatives to their most directly comparable measure calculated in accordance with GAAP, or other measures of financial performance calculated in accordance with GAAP. The Non-GAAP measures are unlikely to be comparable to similar measures presented by other issuers. Test Results The test rates disclosed in this document represent the average rate of gas-flow during post clean-up production testing at the largest choke setting. The flow tests typically range from 4 to 55 hours in duration. 34
35 Advisories cont d Pressure transient analyses and well-test interpretations have not been carried out for any of these wells and, as such, all data should be considered preliminary until such analyses or interpretations have been done. Liquids yields have not been included in the Musreau, Resthaven, Smoky, Karr-Gold Creek and Valhalla test results as the bulk of the tested wells were fracture stimulated using frac oil with the result that substantially all liquids recovered during the test period were load fluid. Test results are not necessarily indicative of long-term performance or of ultimate recovery. Wellhead condensate-gas ratios ("CGRs") disclosed in this document are calculated by dividing total raw liquids volumes produced by total raw natural gas volumes produced during such period. Raw volumes as measured at the wellhead. Sales volumes are lower due to shrinkage. Potential Sales Volumes "Potential Sales Volumes" means the potential volumes of saleable natural gas and NGLs (expressed on a combined basis in Boe/d) that could result from processing the associated quantities of raw natural gas set out in the "Net POU Raw Gas Capacity" column. These potential sales volumes should not be construed as a projection of Paramount's Deep Basin area production at or by any particular date, as they will include some unavoidably commingled third-party production, and are subject to a number of factors and contingencies including the following: (a) production volumes sufficient to fill Paramount's capacity will not be available in all periods and under certain conditions; (b) during maintenance periods and at other times, the facilities will not operate at design capacity; and (c) NGLs sales volumes will vary depending on the liquids content of individual wells and the manner in which the facilities are operated. The potential sales volumes for each facility, other than the 6-18 Plant and 3-15 Plant (the "New Plants"), have been estimated assuming that natural gas processing and condensate stabilization capacity is fully utilized. The potential sales volumes for the New Plants have been estimated assuming that natural gas processing and condensate stabilization capacity is fully utilized, except for approximately 5,000 Bbl/d of potential sales volumes for each New Plant related to oversized condensate stabilization capacity. Deep Basin Processing Capacity "Deep Basin Processing Capacity" means the aggregate capacity of the Company's owned and firm service natural gas and condensate processing facilities in the Deep Basin. These capacity estimates are subject to a number of assumptions and risks and should not be construed as projections of Paramount's Deep Basin area production volumes at or by any particular date or dates. The Company's net sales volumes will be lower than the capacity shown because of a number of factors including, but not limited to: a) some unavoidably commingled third-party volumes will be processed using Paramount capacity; b) the liquids content of wells will vary; c) production volumes sufficient to fill capacity will not be available in all periods and under certain conditions; and d) during maintenance periods and at other times, the facilities will not operate at design capacity. Increases capacity are shown at the mid-point of the period in which new facilities and facilities expansions are scheduled to be completed. However, the completion of such facilities may occur at any point during such period or may occur in a different period and the actual ramp-up will be different than depicted. Oil Sands Measures and Definitions This presentation contains disclosure of certain results of (i) an updated independent evaluation by McDaniel of the bitumen reserves and resources of Cavalier Energy Inc. s (Cavalier) in the Grand Rapids formation in Cavalier s Hoole oil sands property as of December 31, 2014; (ii) an independent evaluation by McDaniel of Cavalier s bitumen resources in its Saleski and other carbonate bitumen properties (House, Orchid and Granor) as of October 31, 2011; and (iii) an independent evaluation by McDaniel of Cavalier's bitumen resources in its Eagle Nest oil sands property as of April 30, 2010 (collectively, the McDaniel Evaluations). Specifically, this presentation includes McDaniel s assessment as of December 31, 2014 of Cavalier s probable undeveloped reserves, best estimate economic contingent resources and discovered exploitable bitumen in place in the Grand Rapids formation at Hoole (and the estimated net present value of these probable undeveloped reserves and economic contingent resources); McDaniel s best estimate as of October 31, 2011 of Cavalier s contingent resources (technology under development) in its Saleski carbonate bitumen property and of the discovered and undiscovered exploitable bitumen in place at Saleski and Cavalier s other carbonate bitumen properties; and McDaniel's best estimate as of April 30, 2010 of Cavalier's discovered and undiscovered bitumen in place in its Eagle's Nest property. These terms, as used in the McDaniel Evaluations, have the following meanings: Probable reserves are reserves that are less certain to be recoverable than proved reserves. Specifically, whereas proved reserves are reserves that can be estimated with a high degree of certainty to be recoverable (i.e. it is likely that the actual remaining quantities recovered will exceed the estimated proved reserves), in the case of probable reserves it is equally likely that the actual quantities recovered will be greater or less than the estimated probable reserves (or where there are both proved and probable reserves the sum of the estimated proved plus probable reserves). 35
36 Advisories cont d "Contingent resources" are those quantities of bitumen resources estimated, as of a given date, to be potentially recoverable from known accumulations using established technology or technology under development, but which are classified as resources rather than reserves due to one or more contingencies, such as the absence of regulatory applications, detailed design estimates or near term development plans. "Economic contingent resources" are a sub-category of contingent bitumen resources that are considered to be currently economically recoverable based on the reserves evaluator s then current forecasts of commodity prices and costs. At Hoole, a portion of Cavalier s economic contingent resources were re-classified by McDaniel as probable reserves in McDaniel's evaluation effective as of December 31, 2012 by virtue of Cavalier having finalized its plans for a pilot project and submitted a regulatory application for this pilot project. Cavalier will need to finalize plans for the commercial development of the balance of the Hoole oil sands properties and submit regulatory applications for their development before the balance of Cavalier's contingent resources at Hoole can be re-classified as probable reserves. These same contingencies will also have to be overcome in the case of the Saleski carbonate bitumen property in order for Cavalier s contingent resources in this property to be reclassified as probable reserves. In addition, as sustained commercial production has not yet been obtained from any carbonate bitumen reservoirs, it will also be necessary in the case of the Saleski property to demonstrate the successful application of SAGD or other production technology to the Saleski reservoir (or a reasonable analog thereof). It is for this reason that Cavalier s bitumen resources at Saleski are referred to as contingent resources (technology under development). There is no certainty that it will be commercially viable to produce any portion of Cavalier s contingent resources at either Hoole or Saleski. "Discovered bitumen in place" or "DBIP" (equivalent to discovered resources) is the aggregate quantity of bitumen that is estimated, as of a given date, to be contained in a known accumulation prior to production. To qualify as discovered exploitable bitumen in place" or "DEBIP" these volumes must be contained in a reservoir that meets or exceeds certain characteristics, such as minimum continuous net pay, porosity and mass bitumen content. DBIP or DEBIP volumes that are considered to be recoverable as of a given date are classified as reserves or contingent resources (with the remaining DBIP or DEBIP volumes being those that are considered to be unrecoverable as of that date). "Undiscovered bitumen in place" or "UDBIP" (equivalent to undiscovered resources) is the aggregate quantity of bitumen that is estimated, as of a given date, to be contained in accumulations that have yet to be discovered. To qualify as undiscovered exploitable bitumen in place or "UDEBIP" these volumes must have been mapped using known data points penetrating the applicable subsurface stratigraphic intervals and possess definitive geophysical log data along with seismic data and regional mapping. At Hoole, DEBIP volumes have been ascribed by McDaniel to those portions of the Grand Rapids formation where they felt minimum continuous net pay, porosity, mass bitumen content and other reservoir characteristics allowed for the commercial application of known recovery technologies. For Saleski and the other carbonate bitumen properties, DEBIP volumes have been restricted to those portions of the reservoirs that have a minimum thickness of 10 meters of substantially clean, continuous predominantly bitumen-saturated carbonate with log porosity of at least 10 percent and bitumen saturation greater than 50 percent, and with competent top and lateral reservoir containment. In addition, DEBIP volumes have generally been limited to areas within one mile of known data points that penetrate the applicable stratigraphic intervals and possess definitive geophysical log data. However, in certain circumstances DEBIP volumes have been assigned to areas outside these one mile limits were it was felt that reservoir continuity existed between offsetting data points. There is no certainty that it will ever be commercially viable to produce any portion of: (i) the DEBIP at Hoole or at Saleski or any of the other carbonate bitumen properties; or (ii) the DBIP at Eagles Nest. There is also no certainty that any of the UDEBIP at Saleski and the other carbonate bitumen properties, or the UDBIP at Eagles Nest, will ever be discovered, or if it is discovered that it will ever be commercially viable to produce any portion of it. "Best estimate" is considered to be the best estimate of the quantity of contingent resources that will actually be recovered. It is equally likely that the actual remaining quantities recovered will be greater or less than the best estimate (or stated another way, there is a 50 percent confidence level that the actual quantities recovered will equal or exceed the best estimate amount). Net present value or NPV of Cavalier s probable undeveloped reserves and economic contingent resources at Hoole represents McDaniel s estimates of Cavalier s share of future net revenues, before the deduction of income taxes, from these reserves and resources discounted at 10%. In calculating these NPVs McDaniel considered items such as revenues, royalties, operating costs, abandonment costs and capital expenditures (but excluded financing and general and administrative costs). Their calculations assume natural gas is used as a fuel for steam generation, and are based on their forecast commodity prices as of January 1, 2015 and forecast costs as of December 31, Royalties were calculated based on Alberta s Royalty Framework applicable to oil sands projects. McDaniel s estimated NPVs do not represent fair market value. 36
37 4700 Bankers Hall West 888 Third Street S.W. Calgary, Alberta Canada T2P 5C5 Telephone: (403) Facsimile: (403)
Corporate Presentation. January 2015
 Corporate Presentation January 2015 Future Oriented Information (See additional advisories at the end of this document) In the interest of providing information regarding Paramount Resources Ltd. ("Paramount"
Corporate Presentation. September 2015
 Corporate Presentation September 2015 Future Oriented Information (See additional advisories at the end of this document) In the interest of providing information regarding Paramount Resources Ltd. ("Paramount"
EPAC OIL & GAS INVESTOR CONFERENCE. June 12, 2013
 EPAC OIL & GAS INVESTOR CONFERENCE June 12, 2013 1 Future Oriented Information (See additional advisories at the end of this document) In the interest of providing information regarding Paramount Resources
Corporate Presentation. May 2016
 Corporate Presentation May 2016 Future Oriented Information (See additional advisories at the end of this document) In the interest of providing information regarding Paramount Resources Ltd. ("Paramount"
Corporate Presentation. August 2016
 Corporate Presentation August 2016 Future Oriented Information (See additional advisories at the end of this document) In the interest of providing information regarding Paramount Resources Ltd. ("Paramount"
Corporate Presentation. January 2017
 Corporate Presentation January 2017 Future Oriented Information (See additional advisories at the end of this document) In the interest of providing information regarding Paramount Resources Ltd. ("Paramount"
Corporate Presentation. April, 2017
 Corporate Presentation April, 2017 Future Oriented Information (See additional advisories at the end of this document) In the interest of providing information regarding Paramount Resources Ltd. ("Paramount"
Corporate Presentation. March 2017
 Corporate Presentation March 2017 Future Oriented Information (See additional advisories at the end of this document) In the interest of providing information regarding Paramount Resources Ltd. ("Paramount"
Strategic Transactions Review. July 2017
 Strategic Transactions Review July 2017 Future Oriented Information In the interest of providing information regarding Paramount Resources Ltd. ("Paramount", "PRL" or the "Company") and its future plans
Annual Information Form For the Year Ended December 31, 2016
 Annual Information Form For the Year Ended December 31, 2016 March 8, 2017 TABLE OF CONTENTS TABLE OF CONTENTS... 2 INTRODUCTORY INFORMATION... 3 NOTE REGARDING FORWARD-LOOKING STATEMENTS AND ADVISORIES...
Liquids sales revenue totaled $38.0 million in the first quarter of 2017, 69 percent of the Company s total petroleum and natural gas sales revenue.
 Paramount Resources Ltd. Announces First Quarter 2017 Results: Sales Volumes Average 16,163 Boe/d; Karr 6-18 Facility Expansion On- Stream Ahead of Schedule Calgary, Alberta May 10, 2017 OIL AND GAS OPERATIONS
Liquids sales comprised 59 percent of total revenue and 40 percent of total sales volumes in the second quarter of 2015.
 PARAMOUNT RESOURCES LTD. ANNOUNCES SECOND QUARTER 2015 RESULTS; SALES VOLUMES INCREASE 107% TO 42,604 BOE/D; LIQUIDS SALES VOLUMES INCREASE 320% TO 16,877 BBL/D August 5, 2015 Calgary, Alberta OIL AND
Corporate Presentation
 Corporate Presentation January 2019 Advisories In the interest of providing information regarding Paramount Resources Ltd. ("Paramount", "PRL" or the "Company") and its future plans and operations, this
Corporate Presentation
 Corporate Presentation July 2018 Advisories In the interest of providing information regarding Paramount Resources Ltd. ("Paramount", "PRL" or the "Company") and its future plans and operations, this presentation
Corporate Presentation. January 2018
 Corporate Presentation January 2018 Future Oriented Information In the interest of providing information regarding Paramount Resources Ltd. ("Paramount", "PRL" or the "Company") and its future plans and
The Company has commenced drilling its second exploratory vertical evaluation well on its Liard Basin Besa River shale gas lands.
 OPERATIONAL UPDATE Oil and Gas Operations Sales volumes in the third quarter were impacted by scheduled and unscheduled third party downstream NGLs processing disruptions, which shut-in up to 6,000 Boe/d
Paramount Resources Ltd. Reports Second Quarter 2018 Results Calgary, Alberta August 8, 2018
 Paramount Resources Ltd. Reports Second Quarter 2018 Results Calgary, Alberta August 8, 2018 OIL AND GAS OPERATIONS Paramount s sales volumes averaged 86,741 Boe/d in the second quarter of 2018. Liquids
Paramount Resources Ltd. Reports First Quarter 2018 Results Calgary, Alberta May 9, 2018
 Paramount Resources Ltd. Reports First Quarter 2018 Results Calgary, Alberta May 9, 2018 OIL AND GAS OPERATIONS Paramount s sales volumes averaged 92,203 Boe/d in the first quarter of 2018 compared to
CEQUENCE ENERGY ANNOUNCES OPERATIONAL UPDATE AND 2014 RESERVES AND FINANCIAL AND OPERATING RESULTS
 CEQUENCE ENERGY ANNOUNCES OPERATIONAL UPDATE AND 2014 RESERVES AND FINANCIAL AND OPERATING RESULTS CALGARY, March 5, 2015 Cequence Energy Ltd. ("Cequence" or the "Company") (TSX: CQE) is pleased to announce
Annual Information Form For the Year Ended December 31, 2017
 Annual Information Form For the Year Ended December 31, 2017 March 7, 2018 TABLE OF CONTENTS TABLE OF CONTENTS... 2 INTRODUCTORY INFORMATION... 3 NOTE REGARDING FORWARD-LOOKING STATEMENTS AND ADVISORIES...
Corporate Presentation. February 2018
 Corporate Presentation February 2018 Advisories In the interest of providing information regarding Paramount Resources Ltd. ("Paramount", "PRL" or the "Company") and its future plans and operations, this
TSX V: HME. Achieved a two year average F&D cost of $9.22/boe (including changes in FDC) for a recycle ratio of 1.8.
 for a recycle ratio of 1.8.") HEMISPHERE ENERGY INCREASES PROVED PLUS PROBABLE RESERVE VALUE BY 77% TO $116.6 MILLION (DISCOUNTED AT 10%), AND NET ASSET VALUE BY 68% TO $1.12 PER SHARE TSX V: HME Vancouver, British Columbia, March
HEMISPHERE ENERGY INCREASES PROVED PLUS PROBABLE RESERVE VALUE BY 77% TO $116.6 MILLION (DISCOUNTED AT 10%), AND NET ASSET VALUE BY 68% TO $1.12 PER SHARE TSX V: HME Vancouver, British Columbia, March
CEQUENCE ENERGY ANNOUNCES 35% GROWTH IN RESERVES AND 2012 FINANCIAL AND OPERATING RESULTS
 CEQUENCE ENERGY ANNOUNCES 35% GROWTH IN RESERVES AND 2012 FINANCIAL AND OPERATING RESULTS CALGARY, March 7, 2013 Cequence Energy Ltd. ("Cequence" or the "Company") (TSX: "CQE") is pleased to announce its
Corporate Presentation
 Corporate Presentation April 2019 Advisories In the interest of providing information regarding Paramount Resources Ltd. ("Paramount", "PRL" or the "Company") and its future plans and operations, this
PAINTED PONY ANNOUNCES A 52% INCREASE IN PROVED PLUS PROBABLE RESERVES TO 1.7 TCFE WITH A NET PRESENT VALUE DISCOUNTED AT 10% OF $1.
 1 FOR IMMEDIATE RELEASE March 4, 2014 PAINTED PONY ANNOUNCES A 52% INCREASE IN PROVED PLUS PROBABLE RESERVES TO 1.7 TCFE WITH A NET PRESENT VALUE DISCOUNTED AT 10% OF $1.5 BILLION March 4, 2014 Calgary,
CEQUENCE ENERGY ANNOUNCES 2015 INDEPENDENT RESERVES EVALUATION
 CEQUENCE ENERGY ANNOUNCES 2015 INDEPENDENT RESERVES EVALUATION CALGARY, February 22, 2016 Cequence Energy Ltd. ("Cequence" or the "Company") (TSX: CQE) is pleased to announce the results of its year end
Paramount Resources Ltd. Reports Third Quarter 2018 Results Calgary, Alberta - November 8, 2018
 Paramount Resources Ltd. Reports Third Quarter 2018 Results Calgary, Alberta - November 8, 2018 OIL AND GAS OPERATIONS Sales volumes averaged 80,471 Boe/d in the third quarter of 2018, including 29,831
Advantage Announces 2011 Year End Financial Results and Provides Interim Guidance
 Press Release Page 1 of 10 Advantage Oil & Gas Ltd Advantage Announces 2011 Year End Financial Results and Provides Interim Guidance (TSX: AAV, NYSE: AAV) CALGARY, ALBERTA, March 22, 2012 ( Advantage or
Corporate Presentation
 Corporate Presentation March 2019 Advisories In the interest of providing information regarding Paramount Resources Ltd. ("Paramount", "PRL" or the "Company") and its future plans and operations, this
Paramount Resources Ltd. Reports 2018 Annual Results and Provides 2019 Guidance
 Paramount Resources Ltd. Reports 2018 Annual Results and Provides 2019 Guidance Calgary, Alberta March 7, 2019 OIL AND GAS OPERATIONS Annual sales volumes averaged 85,941 Boe/d (37 percent liquids) in
A N N U A L R E P O R T
 2009 ANNUAL REPORT Letter to Shareholders 2 Review of Operations 4 Management s Discussion & Analysis 18 Financial Statements 40 Corporate Information IBC Annual Meeting of Shareholders Shareholders are
CEQUENCE ENERGY ANNOUNCES 2015 FINANCIAL AND OPERATING RESULTS
 CEQUENCE ENERGY ANNOUNCES 2015 FINANCIAL AND OPERATING RESULTS CALGARY, March 29, 2015 Cequence Energy Ltd. ("Cequence" or the "Company") (TSX: CQE) is pleased to announce its operating and financial results
Obsidian Energy. Peters & Co. Annual Energy Conference. January 2018
 Obsidian Energy Peters & Co. Annual Energy Conference January 2018 Important Notices to the Readers This presentation should be read in conjunction with the Company's audited consolidated financial statements,
take a closer look Encana Corporation Key Resource Play Statistics As at June 30, 2011
 take a closer look Encana Corporation Key Resource Play Statistics As at June 3, 211 Definitions Supply Cost: The flat NYMEX natural gas price that yields a risked internal rate of return of 9% and does
TSXV: TUS September 8, 2015
 TSXV: TUS September 8, 2015 TSXV: TUS SEPTEMBER 8, 2015 2 Why Buy Tuscany Now? Tuscany has built a large inventory of horizontal oil locations on properties with significant potential oil in place 80 to
Liquids-Rich Montney Natural Gas Resource Play in Alberta s Deep Basin Q4 2012
 Liquids-Rich Montney Natural Gas Resource Play in Alberta s Deep Basin Q4 2012 Forward-Looking Statements Certain information and statements contained in this presentation contain forward-looking information
ANNUAL INFORMATION FORM For the Year Ended December 31, 2010
 ANNUAL INFORMATION FORM For the Year Ended December 31, 2010 March 3, 2011 TABLE OF CONTENTS INTRODUCTORY INFORMATION... 2 NOTE REGARDING FORWARD-LOOKING STATEMENTS AND ADVISORIES... 2 CORPORATE STRUCTURE...
Obsidian Energy. Corporate Presentation. January 2018
 Obsidian Energy Corporate Presentation January 2018 Important Notices to the Readers This presentation should be read in conjunction with the Company's audited consolidated financial statements, management's
Net wells drilled
 FINANCIAL AND OPERATING HIGHLIGHTS (1) ($ millions, except as noted) Three months ended September 30 Nine months ended September 30 2010 2009 Change % 2010 2009 Change % Financial Petroleum and natural
BELLATRIX ANNOUNCES 2018 YEAR END RESERVES HIGHLIGHTED BY 13% RESERVE GROWTH AND LOW COST RESERVE ADDITIONS
 For Immediate Release Calgary, Alberta TSX: BXE BELLATRIX ANNOUNCES 2018 YEAR END RESERVES HIGHLIGHTED BY 13% RESERVE GROWTH AND LOW COST RESERVE ADDITIONS CALGARY, ALBERTA (March 14, 2019) Bellatrix Exploration
NEWS RELEASE FEBRUARY 14, 2018 TOURMALINE ADDS 558 MMBOE OF 2P RESERVES, GROWS LIQUID RESERVES BY 73% AND 2P RESERVE VALUE BY $2.
 NEWS RELEASE FEBRUARY 14, 2018 TOURMALINE ADDS 558 MMBOE OF 2P RESERVES, GROWS LIQUID RESERVES BY 73% AND 2P RESERVE VALUE BY $2.4 BILLION (1) Calgary, Alberta - Tourmaline Oil Corp. (TSX:TOU) ( Tourmaline
Corporate Presentation, November 2017
 Corporate Presentation, November 2017 Advisory This presentation is for informational purposes only and is not intended as a solicitation or offering of securities of Traverse Energy Ltd. ( Traverse or
FORM F1 STATEMENT OF RESERVES DATA AND OTHER OIL AND GAS INFORMATION. Year Ended December 31, 2016
 FORM 51-101F1 STATEMENT OF RESERVES DATA AND OTHER OIL AND GAS INFORMATION Year Ended December 31, 2016 March 2, 2017 TABLE OF CONTENTS DATE OF STATEMENT AND RELEVANT DATES... 1 DISCLOSURE OF RESERVES
TD Securities Duvernay Overview October 8, 2013
 TD Securities Duvernay Overview October 8, 2013 Forward-Looking Statement This presentation contains forward-looking information that involves various risks, uncertainties and other factors. All information
BAYTEX REPORTS 2016 RESULTS, STRONG RESERVES GROWTH IN THE EAGLE FORD AND RESUMPTION OF DRILLING ACTIVITY IN CANADA
 BAYTEX REPORTS 2016 RESULTS, STRONG RESERVES GROWTH IN THE EAGLE FORD AND RESUMPTION OF DRILLING ACTIVITY IN CANADA CALGARY, ALBERTA (March 7, 2017) - Baytex Energy Corp. ("Baytex")(TSX, NYSE: BTE) reports
CHINOOK ENERGY INC. ANNOUNCES FOURTH QUARTER 2016 RESULTS AND PROVIDES OPERATIONAL UPDATE
 CHINOOK ENERGY INC. ANNOUNCES FOURTH QUARTER 2016 RESULTS AND PROVIDES OPERATIONAL UPDATE CALGARY, ALBERTA March 23, 2017 Chinook Energy Inc. ("our", "we", or "us") (TSX: CKE) is pleased to announce its
Year-end 2017 Reserves
 Year-end 2017 Reserves Baytex's year-end 2017 proved and probable reserves were evaluated by Sproule Unconventional Limited ( Sproule ) and Ryder Scott Company, L.P. ( Ryder Scott ), both independent qualified
SURVIVE TO THRIVE 2016 CAPP SCOTIABANK INVESTMENT SYMPOSIUM
 SURVIVE TO THRIVE 2016 CAPP SCOTIABANK INVESTMENT SYMPOSIUM April 12, 2016 1 CORPORATE PROFILE Corporate Summary Q4/2015 Avg. Daily Production 67,934 boe/d Production Mix 1 ~60% liquids/40% gas Corporate
September 28, 2018 SEPTEMBER PRESENTATION
 September 28, 2018 SEPTEMBER PRESENTATION BIGSTONE PROLIFIC, LIQUIDS RICH MONTNEY Pure play MONTNEY E&P company with WORLD CLASS ASSETS: Successful delineation drilling to the west and south Growing condensate
Forward-Looking Information and Definitions
 2013 National Bank Financial Markets Energy Conference Intermediate Energy Growth & Yield Conference Toronto, Ontario February 13 th & 14 th, 2013 Forward-Looking Information and Definitions Certain information
POSITIONED FOR LIQUIDS-RICH GAS GROWTH
 POSITIONED FOR LIQUIDS-RICH GAS GROWTH December 2017 1 Summary of Forward-Looking Statements or Information FORWARD- LOOKING INFORMATION AND DEFINITIONS Certain information included in this presentation
DELPHI ENERGY RELEASES YEAR END 2015 RESERVES
 DELPHI ENERGY RELEASES YEAR END 2015 RESERVES CALGARY, ALBERTA February 29, 2016 Delphi Energy Corp. ( Delphi or the Company ) is pleased to report its crude oil and natural gas reserves information for
DELPHI ENERGY CORP. REPORTS 2018 YEAR END RESERVES
 DELPHI ENERGY CORP. REPORTS 2018 YEAR END RESERVES CALGARY, ALBERTA March 4, 2019 Delphi Energy Corp. ( Delphi or the Company ) is pleased to announce its crude oil and natural gas reserves information
PETRUS RESOURCES ANNOUNCES FOURTH QUARTER AND YEAR END 2017 FINANCIAL & OPERATING RESULTS AND YEAR END RESERVE INFORMATION
 PETRUS RESOURCES ANNOUNCES FOURTH QUARTER AND YEAR END 2017 FINANCIAL & OPERATING RESULTS AND YEAR END RESERVE INFORMATION CALGARY, ALBERTA, Thursday, March 8 th, 2018 Petrus Resources Ltd. ( Petrus or
March 2013 TD 2013 Securities Calgary Energy Conference
 March 2013 TD 2013 Securities Calgary Energy Conference Forward-Looking Information and Definitions Certain information included in this presentation constitutes forward-looking information under applicable
Light Oil North America Jeff Wilson, Senior Vice-President, Exploration
 Light Oil North America Jeff Wilson, Senior Vice-President, Exploration Investor Open House Premium Value Defined Growth Independent 1 Forward Looking Statements Certain statements relating to Canadian
Peters & Co. Low Cost and Large Scale Resource Conference Winnipeg, Montreal, Toronto - March 2013
 Peters & Co. Low Cost and Large Scale Resource Conference Winnipeg, Montreal, Toronto - March 2013 March 2013 Forward-Looking Information and Definitions Certain information included in this presentation
NEWS RELEASE NOVEMBER 7, 2018
 NEWS RELEASE NOVEMBER 7, 2018 TOURMALINE DELIVERS STRONG Q3 EARNINGS AND CASH FLOW GROWTH, INCREASES 2018 EXIT AND 2019 PRODUCTION ESTIMATES AND REDUCES 2019 CAPITAL PROGRAM Calgary, Alberta - Tourmaline
Premium Pipestone Asset Acquisition. August 9, 2018
 Premium Pipestone Asset Acquisition August 9, 2018 READER ADVISORY GENERAL A final short form prospectus containing important information relating to the offering (the "Offering") of subscription receipts
ANNUAL MEETING OF SHAREHOLDERS
 President & Chief Executive Officer s Message 1 2017 Highlights 4 2017 Overview 6 Review of Operations 8 Management s Discussion & Analysis 22 Financial Statements 52 Corporate Information 88 ANNUAL MEETING
Bank of America Merrill Lynch 2016 Energy Credit Conference
 Bank of America Merrill Lynch 2016 Energy Credit Conference New York, New York, June 8, 2016 Rod Gray Chief Financial Officer Advisory Forward-Looking Statements In the interest of providing Baytex's shareholders
Border Petroleum Corp.
 Border Petroleum Corp. 2000, 840-7th Avenue SW Calgary, AB T2P 3G2 T: (403) 538-8450 F: (403) 444-5042 Border Announces Initial Slave Point Well Results and Financials and Reserves Data TSX Venture: BOR
Liquid Rich Montney Natural Gas Resource Play In the Deep Basin - West Central Alberta Q3 2012
 Liquid Rich Montney Natural Gas Resource Play In the Deep Basin - West Central Alberta Q3 2012 Forward-looking Statement Certain information and statements contained in this presentation contain forward-looking
TRILOGY ENERGY CORPORATION 2011 ANNUAL REPORT
 TRILOGY ENERGY CORPORATION 2011 ANNUAL REPORT OUR ASSETS DICTATE OUR STRATEGY FINANCIAL HIGHLIGHTS 1 MESSAGE TO SHAREHOLDERS 2 REVIEW OF OPERATIONS 5 OPERATING AREAS 12 RESERVES 22 ENVIRONMENTAL HEALTH
Heavy Oil. Gems. November TSX:PXX; OMX:PXXS
 Heavy Oil TSX:PXX; OMX:PXXS November 2010 Gems www.blackpearlresources.ca 1 Introduction Corporate: Symbol: PXX, PXXS Exchanges: TSX, OMX Shares Outstanding (MM): Basic (1) 282.9 Fully Diluted(options
CEQUENCE ENERGY LTD. ANNOUNCES OVER 36 % GROWTH IN RESERVES AND RESERVE VALUE AND FOURTH QUARTER AND YEAR END 2011 RESULTS
 CEQUENCE ENERGY LTD. ANNOUNCES OVER 36 % GROWTH IN RESERVES AND RESERVE VALUE AND FOURTH QUARTER AND YEAR END 2011 RESULTS CALGARY, March 8, 2012 Cequence Energy Ltd. ("Cequence" or the "Company") (TSX:
For Immediate Release Granite Oil Corp. Announces 2017 Record Year End Reserve Metrics and Operational Update
 For Immediate Release Granite Oil Corp. Announces 2017 Record Year End Reserve Metrics and Operational Update CALGARY, ALBERTA (Marketwired March 7, 2018) GRANITE OIL CORP. ( Granite or the Company ) (TSX:GXO)(OTCQX:GXOCF)
A SPRINGBOARD FOR GROWTH
 A SPRINGBOARD FOR GROWTH May 2011 1 TSX:PXX OMX:PXXS www.blackpearlresources.ca Cautionary Statements FORWARD LOOKING STATEMENTS This presentation contains certain forward looking statements and forward
CEQUENCE ENERGY ANNOUNCES OPERATIONAL UPDATE, 2016 FINANCIAL AND OPERATING RESULTS AND RESERVES
 CEQUENCE ENERGY ANNOUNCES OPERATIONAL UPDATE, 2016 FINANCIAL AND OPERATING RESULTS AND RESERVES CALGARY, March 13, 2017 Cequence Energy Ltd. ("Cequence" or the "Company") (TSX: CQE) is pleased to provide
NEWS RELEASE FEBRUARY 20, 2019 TOURMALINE ADDS 338 MMBOE OF RESERVES IN 2018, 2P RESERVES INCREASED TO 2.46 BILLION BOE
 NEWS RELEASE FEBRUARY 20, 2019 TOURMALINE ADDS 338 MMBOE OF RESERVES IN 2018, 2P RESERVES INCREASED TO 2.46 BILLION BOE Calgary, Alberta - Tourmaline Oil Corp. (TSX:TOU) ( Tourmaline or the ) is pleased
Driving New Growth TSX:PGF. Peters & Co Presentation September 11, 2018
 Driving New Growth Peters & Co Presentation September 11, 2018 Advisories Caution Regarding Forward Looking Information: This presentation contains forward-looking statements within the meaning of securities
Investor Presentation TSX, NYSE: AAV July, Page 1
 Pure Play Montney Producer with a proven operating team, industry leading cost structure & clear visibility to a significant drilling inventory creates a solid foundation for multi-year growth Investor
May 2018 HIGH-MARGIN, LIQUIDS-RICH PRODUCTION IN THE WORLD- CLASS MONTNEY BIGSTONE REGION
 May 2018 HIGH-MARGIN, LIQUIDS-RICH PRODUCTION IN THE WORLD- CLASS MONTNEY BIGSTONE REGION WHY OWN DELPHI. Pure play MONTNEY E&P company with WORLD CLASS ASSETS: Robust well economics driven by: High condensate
Corporate Presentation
 Corporate Presentation March 2016 David J. Wilson, President & Chief Executive Officer Sadiq H. Lalani, Vice President, Finance & Chief Financial Officer www.keltexploration.com Advisory Regarding Forward-Looking
April 2018 HIGH-MARGIN, LIQUIDS-RICH PRODUCTION IN THE WORLD- CLASS MONTNEY BIGSTONE REGION
 April 2018 HIGH-MARGIN, LIQUIDS-RICH PRODUCTION IN THE WORLD- CLASS MONTNEY BIGSTONE REGION WHY OWN DELPHI. Pure play MONTNEY E&P company with WORLD CLASS ASSETS: Robust well economics driven by: High
SPARTAN ENERGY CORP. ANNOUNCES STRATEGIC SOUTHEAST SASKATCHEWAN LIGHT OIL ACQUISITION
 Suite 500, 850 2 nd Street SW Calgary, AB T2P 0R8 Canada Ph.: (403) 355-8920 Fax: (403) 355-2779 SPARTAN ENERGY CORP. ANNOUNCES STRATEGIC SOUTHEAST SASKATCHEWAN LIGHT OIL ACQUISITION CALGARY, ALBERTA (May
INPLAY OIL CORP. ANNOUNCES 2016 YEAR END RESERVES AND AN OPERATIONS UPDATE
 March 14, 2017 INPLAY OIL CORP. ANNOUNCES 2016 YEAR END RESERVES AND AN OPERATIONS UPDATE CALGARY, ALBERTA (March 14, 2017) InPlay Oil Corp. ("InPlay" or the "Company") (TSX:IPO) is pleased to present
Yangarra Announces 2017 Year End Corporate Reserves Information
 Suite 1530, 715 5 Avenue S.W. Calgary, Alberta T2P 2X6 Phone: (403) 262-9558 Fax: (403) 262-8281 Webpage: www.yangarra.ca Email: info@yangarra.ca February 13, 2018 Yangarra Announces 2017 Year End Corporate
KELT REPORTS SIGNIFICANT INCREASES IN RESERVES AND PRODUCTION IN 2014
 PRESS RELEASE (Stock Symbol KEL TSX) February 10, 2015 Calgary, Alberta KELT REPORTS SIGNIFICANT INCREASES IN RESERVES AND PRODUCTION IN 2014 Kelt Exploration Ltd. ( Kelt or the Company ) has released
PETERS & CO. LIMITED ENERGY CONFERENCE
 PETERS & CO. LIMITED ENERGY CONFERENCE Sherri Brillon, Executive Vice-President & CFO Encana Corporation September 9, 2014 Business Strategy GETTING BACK TO WINNING VISION: LEADING NORTH AMERICAN RESOURCE
Corporate Presentation
 Corporate Presentation Advisory This presentation should be read in conjunction with the Company s Annual Information Form and the Consolidated Financial Statements and Management s Discussion and Analysis
January 2018 HIGH-MARGIN, LIQUIDS-RICH PRODUCTION IN THE WORLD- CLASS MONTNEY BIGSTONE REGION
 January 2018 HIGH-MARGIN, LIQUIDS-RICH PRODUCTION IN THE WORLD- CLASS MONTNEY BIGSTONE REGION WHY OWN DELPHI. Pure play MONTNEY E&P company with WORLD CLASS ASSETS: Robust well economics driven by: High
Annual and Special Shareholder Meeting May 17, 2018
 Annual and Special Shareholder Meeting May 17, 2018 2017 in Review Mandate: Increase light oil exposure Increase netbacks Reduce operating Costs Maintain dividend 2 Grande Prairie Acquisition (March 2017)
HEMISPHERE ENERGY ANNOUNCES Q FINANCIAL AND OPERATING RESULTS
 HEMISPHERE ENERGY ANNOUNCES Q2 2017 FINANCIAL AND OPERATING RESULTS TSX V: HME Vancouver, British Columbia, August 23, 2017 Hemisphere Energy Corporation (TSX V: HME) ("Hemisphere" or the "Company") announces
BUILT TO LAST. April 2016
 BUILT TO LAST April 2016 Built to Last Low Debt Low Decline Strong Capital Efficiencies 2 Cardinal Energy Profile Shares Outstanding (1) TSX: CJ Basic 65,124,209 ergy Ltd. Fully Diluted 67,595,248 Annual
InPlay Oil Corp. Announces First Quarter 2018 Financial and Operating Results Highlighted by a 24 % Increase in Light Oil Production
 InPlay Oil Corp. Announces First Quarter 2018 Financial and Operating Results Highlighted by a 24 % Increase in Light Oil Production May 10, 2018 - Calgary Alberta InPlay Oil Corp. (TSX: IPO) (OTCQX: IPOOF)
Athabasca Oil Corporation Announces 2018 Year end Results
 FOR IMMEDIATE RELEASE March 6, 2019 Athabasca Oil Corporation Announces 2018 Year end Results CALGARY Athabasca Oil Corporation (TSX: ATH) ( Athabasca or the Company ) is pleased to provide its 2018 year
Emerging Deep Basin Plays
 Emerging Deep Basin Plays Peter s & Co. 2010 North American Oil & Gas Conference September 14, 2010 Forward--Looking Statements Forward Certain information regarding PERPETUAL ENERGY in this presentation
Seven Generations sharpens focus on returns in multi-year, fully-funded organic growth plan with expanded core drilling inventory
 NEWS RELEASE TSX: VII Seven Generations sharpens focus on returns in multi-year, fully-funded organic growth plan with expanded core drilling inventory Capital investment drives 7G towards 100,000 boe/d
Horizon Petroleum Ltd.
 Horizon Petroleum Ltd. Suite 1500, 700 4 th Ave. S.W., Calgary, AB, CANADA, T2P 3J4 www.horizon-petroleum.com Horizon Petroleum Announces NI51-101 Reserves and Resources Report for Poland Acquisition,
InPlay Oil Corp. Announces Second Quarter 2018 Financial and Operating Results and Increases Production Guidance
 InPlay Oil Corp. Announces Second Quarter 2018 Financial and Operating Results and Increases Production Guidance August 9, 2018 - Calgary Alberta InPlay Oil Corp. (TSX: IPO) (OTCQX: IPOOF) ( InPlay or
CANADIAN NATURAL RESOURCES LIMITED ANNOUNCES 2016 YEAR END RESERVES CALGARY, ALBERTA FEBRUARY 14, 2017 FOR IMMEDIATE RELEASE
 CANADIAN NATURAL RESOURCES LIMITED ANNOUNCES 2016 YEAR END RESERVES CALGARY, ALBERTA FEBRUARY 14, 2017 FOR IMMEDIATE RELEASE Canadian Natural Resources Limited ( Canadian Natural or the Company ) is pleased
POSITIONED FOR SUCCESS
 POSITIONED FOR SUCCESS CORPORATE PRESENTATION November 2018 TSX: BNE 1 Forward Looking Information Certain statements contained in this Presentation include statements which contain words such as anticipate,
NOT FOR DISTRIBUTION TO U.S. NEWS WIRE SERVICES OR FOR DISSEMINATION IN THE U.S.
 NEWS RELEASE June 25, 2014 200, 707 7 Avenue SW Calgary, Alberta T2P 3H6 Telephone: (403) 262-1901 Facsimile (403) 262-1905 TSXV Trading Symbol: MVN OTC Trading Symbol: MDLNF NOT FOR DISTRIBUTION TO U.S.
to announce Operating Results March 22, 2011 boe/d. $38.5 million to funds from cash flow for $45.1 million the increasing optimization of our other
 Press Release Advantage Oil & Gas Ltd Page 1 of 6 News Release Advantage Announces 2010 Year End Financial Results Glacier Production Exceeding 100 mmcf/d March 22, 2011 (TSX: AAV, NYSE: AAV) CALGARY,
DELPHI ENERGY ANNOUNCES CLOSING OF DISPOSITION OF WAPITI ASSETS
 DELPHI ENERGY ANNOUNCES CLOSING OF DISPOSITION OF WAPITI ASSETS CALGARY, ALBERTA July 22, 2015 Delphi Energy Corp. ( Delphi or the Company ) is pleased to report that it has closed the previously announced
CHINOOK ENERGY INC. ANNOUNCES SECOND QUARTER 2017 RESULTS
 CHINOOK ENERGY INC. ANNOUNCES SECOND QUARTER 2017 RESULTS CALGARY, ALBERTA August 10, 2017 Chinook Energy Inc. ("our", "we", or "us") (TSX: CKE) is pleased to announce its second quarter 2017 financial
Tuscany has built a large inventory of horizontal oil locations
 TSXV: TUS June 2015 TSXV: TUS June 2015 2 Why Buy Tuscany Now? Tuscany has built a large inventory of horizontal oil locations 80 to 191 potential locations in eight areas (1) 34 of potential locations
Financial and Operating Highlights. InPlay Oil Corp. #920, th Ave SW Calgary, AB T2P 3G4. Three months ended Dec 31 Year ended Dec 31
 InPlay Oil Corp. Announces 2017 Financial and Operating Results and Reserves Including an 11% Increase in Proved Developed Producing Light Oil Reserves. March 21, 2018 - Calgary Alberta InPlay Oil Corp.
FOR IMMEDIATE RELEASE CALGARY, ALBERTA MARCH 8, 2011
 FOR IMMEDIATE RELEASE CALGARY, ALBERTA MARCH 8, 2011 BAYTEX ANNOUNCES FOURTH QUARTER 2010 RESULTS AND YEAR-END 2010 RESERVES CALGARY, ALBERTA (March 8, 2011) - Baytex Energy Corp. ( Baytex ) (TSX, NYSE: