Small-Cap Investing: Discover the Growth Potential
|
|
|
- Sharyl Bond
- 5 years ago
- Views:
Transcription
1 Small-Cap Investing: Discover the Growth Potential Presented by: Brian C. Fitzsimons, CFA Partner Portfolio Manager, Analyst - WTSGX May 13, 2015 For institutional use only. Small-Cap Investing 0 Speaker Biography Brian C. Fitzsimons, CFA Partner Portfolio Manager, Analyst Brian Fitzsimons, CFA is a portfolio manager and analyst for the Westcore MIDCO Growth Fund, the Westcore Select Fund and the Westcore Small-Cap Growth Fund. He is also a portfolio manager and analyst on the Small- &MidC Mid-Cap Growth team and a partner at Denver Investments. Prior to joining the firm in 2005, Mr. Fitzsimons was with Newmont Capital Ltd. as a finance manager for one year. He also worked as an equity analyst at A.G. Edwards & Sons, Inc. for two years and Berger Financial Group for one year. Additionally, Mr. Fitzsimons worked with a professional athletic league for three years as the director of finance and controller, and with Marsico Endowment Fund as a portfolio manager. Mr. Fitzsimons received a BS from Metropolitan State College of Denver and MBA from the University of Denver. He is a CFA charterholder and a member of CFA Institute and CFA Society Colorado. For institutional use only. Small-Cap Investing 1 1
 Investing in small-cap stocks 3) Generating")


2 Small-Cap Investing Discover the growth potential 1) Overview of small-cap stocks 2) Investing in small-cap stocks 3) Generating alpha in small-cap stocks 4) Current opportunity in small-cap stocks For institutional use only. Small-Cap Investing 2 Small-Cap Investing Planning with the right tools El Capitan Yosemite National Park Tommy Caldwell & Kevin Jorgeson Free climb 3,000 foot rock formation Dec 27, 2014 Jan 14, segments Multiple year planning process and the right tools For institutional use only. Small-Cap Investing 3 2
3 Overview of Small-Cap Stocks composition Russell 2000 and Russell 2000 Growth Composition Median Number Of Ending Market Weighted Average Weighted Median Average Market Smallest Largest Market Holdings Value Market Cap Market Cap Cap Stock Stock Cap Russell ,043 $21,043,698,050 $110,869 $60,228 $21,000 $275 $647,361 $7,817 Russell ,011 $1,764,899, $1,907 $1,711 $1,046 $19 $9,750 $709 Russell 2000 Growth 1,205 $887,504,174 $2,090 $1,825 $1,137 $31 $9,750 $815 Russell ,054 $22,808,597,986 $102,438 $49,200 $7,861 $19 $647,361 $1,477 S&P $18,245,163 $125,022 $73,602 $37,553 $2,866 $647,361 $18,354 Determining Membership Russell 3000E Russell 3000 Russell Top 50 Mega Cap Russell Top 200 Russell 1000 Russell Midcap Russell 2000 Russell 2500 Russell Microcap Companies Included Companies #1 4,000 or 100% of all eligible securities Companies #1 3,000 Companies #1 50 Companies #1 200 Companies #1 1,000 Companies #201 1,000 Companies #1,001 3,000 Companies #501 3,000 Companies #2,001 4,000 Source: Morningstar Direct. As of 12/31/14. Performance data quoted represents past performance and does not guarantee future results. For institutional use only. Small-Cap Investing 4 Overview of Small-Cap Stocks ETF universe Five Largest Small-Cap ETF's by AUM Ticker Name Assets ($MM) IWM ishares Russell ,652 IJR ishares Core S&P Small-Cap 16,209 VB Vanguard Small-Cap ETF 11,188 IWO ishares Russell 2000 Growth 7,319 IWN ishares Russell 2000 Value 6,253 Five Largest Mid-Cap ETF's by AUM Ticker Name Assets ($MM) IJH ishares Core S&P Mid-Cap 25,868 MDY SPDR S&P MidCap 400 ETF 16,277 DVY ishares Select Dividend 15,018 IWR ishares Russell Mid-Cap 12,638 VO Vanguard Mid-Cap ETF 11,582 Five Largest Large-Cap ETF's byaum Ticker Name Assets ($MM) SPY SPDR S&P 500 ETF 181,930 IVV ishares Core S&P ,722 VTI Vanguard Total Stock Market ETF 55,075 QQQ PowerShares QQQ ETF 38,053 VOO Vanguard S&P 500 ETF 30,463 Source: Morningstar Direct. As of 4/2/2015. Top five ETF s in terms of assets under management. Performance data quoted represents past performance and does not guarantee future results. For institutional use only. Small-Cap Investing 5 3


 Cumulative Returns Source: Morningstar Direct.")
4 Overview of Small-Cap Stocks Russell 2000 Growth Value Russell 2000 Growth 12/31/1999 3/31/2015 Value Source: Morningstar Direct 12/31/1999 3/31/2015. Start date of chart was 12/31/1999, just prior to previous high of the index. Performance data quoted represents past performance and does not guarantee future results. For institutional use only. Small-Cap Investing 6 Overview of Small-Cap Stocks Small-caps outperformed over time Cumulative Returns 1/1/1992 3/31/ Cumulative Returns (%) Cumulative Returns Source: Morningstar Direct. Performance data quoted represents past performance and does not guarantee future results. For institutional use only. Small-Cap Investing 7 4
 Correlation Coefficients Source: Morningstar Direct. Performance data quoted represents past performance and does not guarantee future results.")
 Standard Deviation (%) The")
5 Overview of Small-Cap Stocks Small-caps offer lower correlation to other asset classes Correlation Coefficients 1/1/1992 3/31/ Correlation Coefficients (Relative to Russell 2000 ) Correlation Coefficients Source: Morningstar Direct. Performance data quoted represents past performance and does not guarantee future results. For institutional use only. Small-Cap Investing 8 Investing in Small-Cap Stocks S&P 500 Total Return vs Russell 2000 Total Return * 10 Year Constant Intervals 12/31/ /31/2014 Gain Per Annu m (%) Standard Deviation (%) The Efficient Frontier Source: Ned Davis Research, Inc. For the period 12/31/ /31/2014. > O indicates highest Reward/Risk ratio. *Ibbotson Small Cap Total Return (prior to 1979). Copyright 2015 Ned Davis Research, Inc. Further distribution prohibited without prior permission. All Rights Reserved. See NDR Disclaimer at For data vendor disclaimers refer to Performance data quoted represents past performance and does not guarantee future results. For institutional use only. Small-Cap Investing 9 5


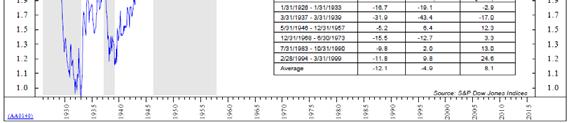
6 Investing in Small-Cap Stocks Long term: Relative performance of small-caps vs. large-caps Source: Ned Davis Research, Inc. Monthly data, 12/31/1925 3/31/2015. Copyright 2015 Ned Davis Research, Inc. Further distribution prohibited without prior permission. All Rights Reserved. See NDR Disclaimer at For data vendor disclaimers refer to Performance data quoted represents past performance and does not guarantee future results. For institutional use only. Small-Cap Investing 10 Investing in Small-Cap Stocks Short term: Relative performance of small-caps vs. large-caps Source: Ned Davis Research, Inc. Daily data, 1/02/1996 4/2/2015. Copyright 2015 Ned Davis Research, Inc. Further distribution prohibited without prior permission. All Rights Reserved. See NDR Disclaimer at For data vendor disclaimers refer to Performance data quoted represents past performance and does not guarantee future results. For institutional use only. Small-Cap Investing 11 6


7 Investing in Small-Cap Stocks Higher growth potential Historical EPS & Sales Growth 3 Year 12/31/2014 Forecast EPS Growth 1 Year 12/31/ % 12% 10% 8% 6% 4% 2% 16% 14% 12% 10% 8% 6% 4% 2% 0% Russell 1000 Russell 2000 Russell 2000 Growth Russell 3000 S&P 500 0% Russell 1000 Russell 2000 Russell 2000 Growth Russell 3000 S&P 500 Source: FactSet. Data quoted represents past performance and does not guarantee future results. For institutional use only. Small-Cap Investing 12 Investing in Small-Cap Stocks Higher growth potential Source: Ned Davis Research, Inc. Monthly data, 12/31/ /31/2014. Copyright 2015 Ned Davis Research, Inc. Further distribution prohibited without prior permission. All Rights Reserved. See NDR Disclaimer at For data vendor disclaimers refer to Performance data quoted represents past performance and does not guarantee future results. For institutional use only. Small-Cap Investing 13 7
8 Generating Alpha in Small-Cap Stocks Stronger fund track records in small-cap funds Average % of Mutual Funds Beating the Benchmark 1/1/ /31/ % 50% 40% 54% 53% 54% 47% 49% 52% 41% 45% 39% 40% 46% 39% 46% 53% 49% 42% 30% 20% 10% 0% R2000 R2000G R2000V R2500 R2500G R2500V RMid RMidG RMidV R1000 R1000G R1000V S&P 500 R3000 R3000G R3000V Source: Morningstar Direct. Based on annual excess returns since Performance data quoted represents past performance and does not guarantee future results. For institutional use only. Small-Cap Investing 14 Generating Alpha in Small-Cap Stocks Analyst coverage by market cap Analyst Coverage by Market Cap Company Size Avg # Analyst # Companies 0 Analysts 1 Analyst % 0 anlayst % 1 anlayst >$10b % 0.00 % $5b-$10b $2b-$5b $1b-$2b $500mm-$1b <$500mm 2 2,628 1, Source: S&P Capital IQ. Data as of 12/31/2014. Data quoted represents past performance and does not guarantee future results. For institutional use only. Small-Cap Investing 15 8


9 Generating Alpha in Small-Cap Stocks U.S. vs. International exposure in small-caps Source: Ned Davis Research, Inc. Yearly data, 12/31/ /31/2014. Copyright 2015 Ned Davis Research, Inc. Further distribution prohibited without prior permission. All Rights Reserved. See NDR Disclaimer at For data vendor disclaimers refer to Performance data quoted represents past performance and does not guarantee future results. For institutional use only. Small-Cap Investing 16 Generating Alpha in Small-Cap Stocks Cash on U.S. company balance sheets Cash on U.S. Company Balance Sheets 12/31/ /31/2014 $6,000 $5,000 $4,000 $ trillion's $3,000 $2,000 $1,000 $- 1/1/2009 1/1/2010 1/1/2011 1/1/2012 1/1/2013 1/1/2014 Source: FactSet, 12/31/ /31/2014. Performance data quoted represents past performance and does not guarantee future results. For institutional use only. Small-Cap Investing 17 9

10 Generating Alpha in Small-Cap Stocks The current M&A cycle Source: Evercore Investor Relations, Thomson Reuters; 2014 Annualized based on 11M Performance data quoted represents past performance and does not guarantee future results. For institutional use only. Small-Cap Investing 18 U.S. Merger Activity Number of M&A Deals Pre /31/2014 Percent of M&A Deals Pre /31/ % 90.00% 80.00% 70.00% 60.00% 50.00% 40.00% 30.00% % 10.00% % pre Source: S&P Capital IQ. Data quoted represents past performance and does not guarantee future results. For institutional use only. Small-Cap Investing 19 10


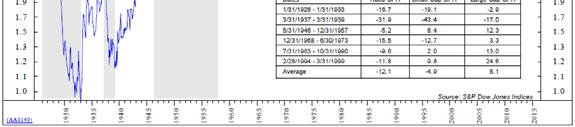
11 Current Opportunity in Small-Cap Stocks Long term: Relative performance of small-caps vs. large-caps Source: Ned Davis Research, Inc. Monthly data, 12/31/1925 3/31/2015. Copyright 2015 Ned Davis Research, Inc. Further distribution prohibited without prior permission. All Rights Reserved. See NDR Disclaimer at For data vendor disclaimers refer to Performance data quoted represents past performance and does not guarantee future results. For institutional use only. Small-Cap Investing 20 Current Opportunity in Small-Cap Stocks Short term: Relative performance of small-caps vs. large-caps Source: Ned Davis Research, Inc. Daily data, 1/02/1996 4/2/2015. Copyright 2015 Ned Davis Research, Inc. Further distribution prohibited without prior permission. All Rights Reserved. See NDR Disclaimer at For data vendor disclaimers refer to Performance data quoted represents past performance and does not guarantee future results. For institutional use only. Small-Cap Investing 21 11
12 Current Opportunity in Small-Cap Stocks Valuation Characteristics as of 12/31/2014 Dividend Beta vs P E Forecast P E Forecast P E Trailing Price Cash Price Sales X PB Value Yield S&P year 2 year 1 year Flow LTM Russell % $ $14.17 Russell % $ $15.26 Russell 2000 Growth 0.63% $ $17.81 Russell % $ $14.24 S&P % $ $14.04 Hist 5 Yr EPS Growth Hist 3 Yr EPS Growth EPS Growth EPS Growth Forecast 1 year Forecast 2 year EPS Growth 3 Year Dividend PS Growth 5 Year Hist 3 Year Sales Growth Russell % 9.55% 9.95% 20.34% 10.43% 13.55% 6.86% Russell % 10.05% 11.06% 27.11% 12.50% 8.51% 8.67% Russell 2000 Growth 13.06% 12.33% 13.45% 32.99% 15.00% 11.62% 12.59% Russell % 9.58% 10.02% 20.76% 10.50% 13.36% 6.98% S&P % 9.33% 9.63% 19.76% 10.07% 13.66% 6.57% Source: FactSet. Data quoted represents past performance and does not guarantee future results. For institutional use only. Small-Cap Investing 22 Important Disclosure Information CFA is a trademark owned by CFA Institute. RISKS: Investing in small-cap funds generally will be more volatile and loss of principal could be greater than investing in large-cap funds. Investing in foreign securities entails special risks, such as currency fluctuations and political uncertainties. An investor should consider investment objectives, risks, charges and expenses of the Fund(s) carefully before investing. This material must be accompanied or preceded by aprospectus,whichcontainsthisandotherimportant information about the Fund(s). To obtain additional copies of the prospectus, please call WEST (9378) or visit us online at Please read the prospectus carefully before investing. Westcore Funds and Powershares QQQ ETF (ticker: QQQ) are distributed by ALPS Distributors, Inc. The mountain logo together with "WestcoreFunds Denver Investments" is a registered service mark of Denver Investments. All indices are unmanaged and index performance figures do not reflect any fees, expenses or taxes. Investors cannot invest directly in an index. Russell Investments is the source and owner of the Russell data contained in this material and all trademarks and copyrights related thereto. Any further dissemination or redistribution is strictly prohibited. Russell Investments is not responsible for the formatting or configuration of this material or for any inaccuracy in Denver Investments presentation thereof. Standard & Poor s is the source and owner of the S&P data contained in this material and all trademarks and copyrights related thereto. Any further dissemination or redistribution is strictly prohibited. Standard & Poor s is not responsible for the formatting or configuration of this material or foranyinaccuracyin Denver Investments presentation thereof. The works of authorship contained herein including but not limited to all data, design, text, images, and charts or other data compilations or collective works are owned, except as otherwise expressly stated, by Ned Davis Research, Inc., ("NDR"), Ned Davis Research Group ("NDRG"), or one of their data providers and may not be copied, reproduced, transmitted, displayed, performed, distributed, rented, sublicensed, altered, stored for subsequent use or otherwise used in whole or in part in any manner without the prior written consent of NDRG. Ned Davis Research, Inc., Ned Davis Research Group, and logos are service/trademarks of Ned Davis Research, Inc. and are proprietary as such. The data and analysis contained herein are provided "as is" and without warranty of any kind, either expressed or implied. Ned Davis Research, Inc. (NDR), d.b.a. Ned Davis Research Group (NDRG), any NDRG affiliates or employees, or any third-party data provider, shall not have any liability for any loss sustained by anyone who has relied on the information contained in any NDRG publication. The data and analysis contained herein are provided "as is." NDRG disclaims any and all express or implied warranties, including, but not limited to, any warranties of merchantability, suitability or fitness for a particular purpose or use. NDRG's past recommendations and model results are not a guarantee of future results. This communication reflects our analysts' opinions as of the date of this communication and will not necessarily be updated as views or information change. All opinions expressed herein are subject to change without notice. NDRG or its affiliated companies or their respective shareholders, directors, officers and/or employees, may have long or short positions in the securities discussed herein and may purchase or sell such securities without notice. Using any graph, chart, formula or other device to assist in deciding which securities to trade or when totradethem presents many difficulties and their effectiveness has significant limitations, including that prior patterns may not repeat themselves continuously or on any particular occasion. In addition, market participants using such devices can impact the market in a way that changes the effectiveness of such device. For NDRG's important additional disclaimers, refer to For data vendor disclaimers, refer to Further distribution prohibited without prior permission. Copyright 2015 (c) Ned Davis Research, Inc. All rights reserved. For institutional use only. Small-Cap Investing 23 WES
Mid Cap Dividend Growth Strategy
 Mid Cap Dividend Growth Strategy Product Level Investment Process Stock Universe Companies that have increased their dividends with market capitalizations of $1 billion to $15 billion Stock Selection Top
Micro-Cap Investing. Expanding the Opportunity Set. Expanding the Investment Opportunity Set
 Micro-Cap Investing Expanding the Opportunity Set Micro-cap stocks present a unique opportunity for long-term investors. Defined as companies whose market capitalizations range from approximately $9 million
HEARTLAND VALUE FUND
 HEARTLAND VALUE FUND An investor should consider the Fund s investment objectives, risks, and charges and expenses carefully before investing or sending money. This and other important information can
Equity Rating and Report
 NDRG GUIDE TO Equity Rating and Report Ned Davis Research Group Generate Alpha. Identify risk. Choose Ned Davis Research. TABLE OF CONTENTS NDRG Equity Focus Ranks...1 Universe...1 Rating a Stock Based
QUARTERLY MARKET OUTLOOK THIRD QUARTER CLS-7/11/2017
 QUARTERLY MARKET OUTLOOK THIRD QUARTER 2017 Contents How did the markets perform? How did CLS portfolios perform? What is CLS thinking moving forward? What is CLS doing with portfolios? CLS Investment
INVESTMENT STRATEGIES FOR NON-DIVIDEND PAYERS
 Ned Davis Research Group NDR Solutions Quarterly Investment Insight from NDR's Custom Solutions Team INVESTMENT STRATEGIES FOR NON-DIVIDEND PAYERS MARCH 2016 LUCY LIU, CFA Senior Research Analyst, Custom
Dividends: A Timeless Component of Equity Return
 Dividends: A Timeless Component of Equity Return May 15, 2012 by Loomis Sayles & Company, L.P. With interest rates at historic lows and many dividend-paying stocks boasting yields comparable to or higher
Deconstructing Dividends: Five Reasons to Consider Small- and Mid-Cap Dividend-Paying Stocks
 Deconstructing Dividends: Five Reasons to Consider Small- and Mid-Cap Dividend-Paying Stocks Dividend-paying stocks historically outperform the market with less risk and low correlation with other investment
Copeland Capital Management Risk Managed Dividend Growth Fund (CDGRX) Class A (CDCRX) Class C (CDIVX) Class I. June 30, 2016
 Class A (CDCRX) Class C (CDIVX) Class I. June 30, 2016") Copeland Capital Management Risk Managed Dividend Growth Fund (CDGRX) Class A (CDCRX) Class C (CDIVX) Class I June 30, 2016 Page 1 NLD Review Code: 1303-NLD-8/22/2016 How the Fund Works - Three Components
Copeland Capital Management Risk Managed Dividend Growth Fund (CDGRX) Class A (CDCRX) Class C (CDIVX) Class I June 30, 2016 Page 1 NLD Review Code: 1303-NLD-8/22/2016 How the Fund Works - Three Components
Royce Premier Fund IMPACT AND ATTRIBUTION REPORT INVESTMENT CLASS
 FINANCIAL PROFESSIONALS ONLY Royce Premier Fund IMPACT AND ATTRIBUTION REPORT INVESTMENT CLASS March 31, 2018 Royce Premier Fund IMPACT AND ATTRIBUTION REPORT 2 Performance Performance and Expenses (%)
THE CASE FOR RISING DIVIDENDS
 WASHINGTON CROSSING ADVISORS THE CASE FOR RISING DIVIDENDS Growth in Value by Behavior t Growers: $7,499 t Payers: $5,227 t S&P 500: $2,741 t No Change: $2,285 $100 Starting Value (1972) t Non-Payers:
The Year of the Snake: Investing in a Rising Rate Environment
 The Year of the Snake: Investing in a Rising Rate Environment Duncan W. Richardson, CFA Chief Equity Investment Officer 13 th February 2013 1 Inflation Deflation 2 Depressing Cycle 3 Source: Baseline as
PROSPECTUS 2008 ANNUAL REPORT
 PROSPECTUS 2008 ANNUAL REPORT EQUITY & BOND FUNDS Retail and Institutional Class APRIL 30, 2017 DECEMBER 31, 2008 Fund WESTCORE EQUITY FUNDS Retail Class TICKER SYMBOLS WESTCORE WESTCORE EQUITY FUNDS GROWTH
Vanguard Inflation-Protected Securities Fund
 Vanguard - Product Summary Invests primarily in Treasury inflation-protected securities. Seeks inflation protection and income consistent with Treasury inflation-protected securities. Principal and interest
FOR 2018 GLOBAL MARKET OUTLOOK PRESS BRIEFING. PROVIDED TO DESIGNATED MEMBERS OF THE PRESS ONLY, NOT FOR FURTHER DISTRIBUTION.
 2018 Global Market Outlook Press Briefing U.S. EQUITIES Ann M. Holcomb, CFA Portfolio Manager November 14, 2017 FOR 2018 GLOBAL MARKET OUTLOOK PRESS BRIEFING. PROVIDED TO DESIGNATED MEMBERS OF THE PRESS
DIVIDEND GROWTH STRATEGY
 Fundamental Investing with Quantitative Tools DIVIDEND GROWTH STRATEGY 2017 Convergence Overview Fundamental Approach, Systematically Applied Founders have worked together for more than 20 years Long-standing
Investment Performance Review Period Ending June 30, City of Trenton Fire & Police Retirement System
 Investment Performance Review Period June 30, 2017 City of Trenton Fire & Police Retirement System Market Update June 30, 2017 Index Returns (%) Equities Month 3 M YTD 1 Year 3 Yr 5 Yr Ann Ann S&P 500
Can We Lower Portfolio Volatility and Still Meet Equity Return Expectations?
 Can We Lower Portfolio Volatility and Still Meet Equity Return Expectations? Richard Yasenchak, CFA Senior Vice President, Client Portfolio Manager, INTECH FOR INSTITUTIONAL INVESTOR USE/NOT FOR PUBLIC
Vanguard Institutional Index Fund
 Vanguard Institutional Product Summary Seeks to track the performance of the Standard & Poor s 500. U.S. large-cap equity diversified across growth and value styles. Passively managed, full-replication
Additional series available. Morningstar TM Rating. Funds in category. Equity style Market cap %
 Sun Life BlackRock Canadian Equity Fund Series A $13.5549 Net asset value per security (NAVPS) as of January 04, 2018 $0.0452 0.33% Benchmark S&P/TSX Capped Composite Index Fund category Canadian Focused
HSBC Vantage5 Index Methodology Guide
 HSBC Vantage5 Index Methodology Guide Table of contents Index overview 1 Index components 2 Vantage5 Index methodology 3 Monthly rebalancing process 4 Simulated historic volatility 5 Simulated portfolio
RAFI. Delivering on the Promise of Smart Beta. September 18, 2014 Feifei Li, PhD, FRM
 RAFI Delivering on the Promise of Smart Beta September 18, 2014 Feifei Li, PhD, FRM Examining Smart Beta The Advantages of Passive Investing» Index funds are a compelling choice for investors Broad market
Vanguard Total Stock Market ETF
 Vanguard Product Summary Seeks to track the performance of the CRSP US Total Market. Large-, mid-, and small-cap equity diversified across growth and value styles. Employs a passively managed, index-sampling
With Rates Retreating, Bonds Back in Fashion
 Defensive ETFs: December U.S. ETF 2011 Flows: Performance May 2014 FINANCIAL PRODUCTS RESEARCH ETF RESEARCH January & STRATEGY 9, 2011 U.S. ETF flows were $12.7 billion in May representing 0.7% of assets
Exchange Traded Service
 NDRG GUIDE TO Exchange Traded Service Ned Davis Research Group Generate Alpha. Identify risk. Choose Ned Davis Research. NED DAVIS RESEARCH GROUP (NDRG) PHILOSOPHY: The development of NDRG s ETF service,
Market Briefing: S&P 500 Revenues, Earnings, & Dividends
 Market Briefing: S&P Revenues, Earnings, & Dividends December 1, 16 Dr. Edward Yardeni 16-972-7683 eyardeni@ Joe Abbott 732-497-36 jabbott@ Debbie Johnson 48-664-1333 djohnson@ Mali Quintana 48-664-1333
Market Briefing: S&P 500 Revenues, Earnings, & Dividends
 Market Briefing: S&P Revenues, Earnings, & Dividends November 24, 17 Dr. Edward Yardeni 16-972-7683 eyardeni@ Joe Abbott 732-497-36 jabbott@ Debbie Johnson 48-664-1333 djohnson@ Mali Quintana 48-664-1333
QUARTERLY COMMENTARY HEARTLAND VALUE FUND
 HEARTLAND VALUE FUND d. *Prior to October 2009, index domestic equity ETF data included fewer than 7 actively managed domestic equity ETFs. Exchange Traded Fund (ETF) Source: Investment Company Institute,
Nimbus 9 PORTFOLIO MANAGEMENT PORTFOLIO SPECIALISTS
 Nimbus 9 STRATEGY HIGHLIGHTS Ticker: TRVLX CUSIP: 779578103 As of December 31, 2018 Total Large-Cap Value Assets : $98.3 billion 2 Total US Value Equity Strategy Assets: 1 $42.7 billion 2 Total Fund Assets:
Guided Equity Allocation
 September 2017 Guided Equity Allocation VanEck Vectors NDR CMG Long/Flat Allocation ETF Disclosures This material does not constitute an offer to sell or solicitation to buy any security, including shares
Sample Custom Account (using SSgA Common Trust Funds) 4th Quarter 2012
 4th Quarter 2012") Sample Custom Account (using SSgA Common Trust Funds) 4th Quarter 2012 Endowment Management Solutions 70/30 Equities/Fixed Income 60/40 Equities/Fixed Income 50/50 Equities/Fixed Income 100/0 Equities/Fixed
Sample Custom Account (using SSgA Common Trust Funds) 4th Quarter 2012 Endowment Management Solutions 70/30 Equities/Fixed Income 60/40 Equities/Fixed Income 50/50 Equities/Fixed Income 100/0 Equities/Fixed
Sample Custom Account (using SSgA Common Trust Funds) 3 rd Quarter 2013
 3 rd Quarter 2013") Sample Custom Account (using SSgA Common Trust Funds) 3 rd Quarter 2013 Endowment Management Solutions 70/30 Equities/Fixed Income 60/40 Equities/Fixed Income 50/50 Equities/Fixed Income 100/0 Fixed Income
Sample Custom Account (using SSgA Common Trust Funds) 3 rd Quarter 2013 Endowment Management Solutions 70/30 Equities/Fixed Income 60/40 Equities/Fixed Income 50/50 Equities/Fixed Income 100/0 Fixed Income
WisdomTree Dividend Growth Indexes FOR REGISTERED REPRESENTATIVE OR INSTITUTIONAL USE ONLY. NOT FOR PUBLIC USE OR VIEWING.
 WisdomTree Dividend Growth Indexes Important Information This information is provided to further analyze the long term performance of the WisdomTree Funds, specific components, characteristics of the funds
Risk Management for All Markets
 Risk Management for All Markets By Steve Blumenthal, CIO/CEO of CMG Capital Management Group, Inc. Investors need to invest differently in bull markets than they do in bear markets. Ned Davis Summary An
First Trust AlphaDEX Family of ETFs Fundamentally Different
 First Trust AlphaDEX Family of ETFs Fundamentally Different Dan Waldron ETF Strategist, Sr. Vice President First Trust ETF Assets $32,000,000,000 $28,000,000,000 $24,000,000,000 $20,000,000,000 AlphaDEX
Schwab Diversified Growth Allocation Trust Fund
 Fund Facts Trustee Fund Type Charles Schwab Bank Collective Trust Fund Category Global Asset Allocation Benchmark Global Growth Custom Index 1 Unit Class Inception Date 11/21/2012 Fund Inception Date 3/7/2012
PRESENTED BY AND O SHARES
 O SHARES I N V E S T M E N T S SM Elisabeth Kashner, CFA Director of ETF Research FactSet Research Systems ETFs Are A Disruptive Technology US ETF Growth 20,000 16,000 $2.08 Trillion $, Billions 12,000
Tactical Stocks-Bonds Strategy
 Tactical Stocks-Bonds Strategy FACT SHEET December 31, 2017 60 State Street, Suite 700 Boston, Massachusetts 02109 team@modelcapital.com 617-854-7417 http://modelcapital.com/ FIRM S INVESTMENT PHILOSOPHY
Seek to Improve US Equity Exposure
 Seek to Improve US Equity Exposure Seek Higher Returns by Investing Beyond Mega Caps Large US companies (ex mega caps) historically provided stronger returns than mega caps, 1 yet are under represented
Investment Comparison
 Investment Data as of 1/31/217 PAGE 2 OF 7 Fi36 FIDUCIARY SCORE OVERVIEW INVESTMENT ClearBridge Small Cap Value I MassMutual Premier Small Cap Opps R5 ishares Russell 2 Small-Cap Idx Instl Victory Integrity
Royce Opportunity Fund IMPACT AND ATTRIBUTION REPORT INVESTMENT CLASS
 FINANCIAL PROFESSIONALS ONLY Royce Opportunity Fund IMPACT AND ATTRIBUTION REPORT INVESTMENT CLASS December 31, 2017 Royce Opportunity Fund IMPACT AND ATTRIBUTION REPORT 2 Performance Performance and Expenses
Business Development Companies
 March 2018 Business Development Companies VanEck Vectors BDC Income ETF (BIZD ) ETF disclosure This material does not constitute an offer to sell or solicitation to buy any security, including shares of
Additional series available. Morningstar TM Rating. Funds in category 363. Fixed income % of fixed income allocation
 Sun Life BlackRock Canadian Balanced Fund Investment objective Series A $12.4584 Net asset value per security (NAVPS) as of August 20, 2018 $0.0128 0.10% Benchmark Blended benchmark Fund category Canadian
Stock Market Briefing: S&P vs. Thomson Reuters Earnings
 Stock Market Briefing: S&P vs. Thomson Reuters Earnings December, 1 Dr. Edward Yardeni 1-- eyardeni@ Joe Abbott -- jabbott@ Please visit our sites at www. blog. thinking outside the box Table Of Contents
RELY ON SPY THE LIQUIDITY LEADER LET S START
 RELY ON SPY THE LIQUIDITY LEADER LET S START WHY DOES LIQUIDITY MATTER? For ETF investors, liquidity directly influences trading costs. Driven by trading volume, liquidity manifests itself in the bid/ask
S&P Target Risk Index Series Methodology
 S&P Target Risk Index Series Methodology S&P Dow Jones Indices: Index Methodology October 2017 Table of Contents Introduction 2 Highlights 2 Eligibility Criteria 3 Eligibility Factors 3 Timing of Changes
Additional series available. Morningstar TM Rating. Funds in category. Equity style Market cap %
 Sun Life BlackRock Canadian Composite Equity Class Series A $11.6889 CAD Net asset value per security (NAVPS) as of August 31, 2018 $-0.0752-0.64% Benchmark S&P/TSX Capped Composite Index Fund category
Investment Style Guide
 Investment Style Guide October 19, Dr. Edward Yardeni 16-972-7683 eyardeni@ Joe Abbott 732-497-36 jabbott@ Please visit our sites at blog. thinking outside the box Table Of Contents Table Of Contents Index
Quarterly Scorecard 1st Quarter 2015 what s INSIDE
 Quarterly Scorecard 1st Quarter 2015 what s INSIDE ETF Stats Ticker: NAV Symbol:.NV Intraday Symbol:.IV Listing Exchange: NYSE Arca CUSIP: 00162Q 205 Fund Inception: 7/6/2009 Dividends Paid: Quarterly
Invesco Diversified Dividend Fund. Building a solid foundation
 Invesco Diversified Dividend Fund Building a solid foundation of dividend growers Equity Objective Seeks long-term capital growth with current income as its secondary objective Symbols A: LCEAX C: LCEVX
Schwab Diversified Growth Allocation Trust Fund (Closed to new investors) Institutional Unit Class As of June 30, 2017
 Institutional Unit Class As of June 30, 2017") Fund Facts Trustee Fund Type Charles Schwab Bank Collective Trust Fund Morningstar Category Allocation - 50-70% Equity Benchmark Global Growth Custom Index 1 Unit Class Inception Date 3/7/2012 Fund Inception
Fund Facts Trustee Fund Type Charles Schwab Bank Collective Trust Fund Morningstar Category Allocation - 50-70% Equity Benchmark Global Growth Custom Index 1 Unit Class Inception Date 3/7/2012 Fund Inception
Sector Investing: Essential Building Blocks for Portfolio Construction
 Sector Investing: Essential Building Blocks for Portfolio Construction April 30, 2014 Brett Hammond Managing Director Head of Index Applied Research MSCI Matthew Goulet, CFA Vice President Sector Investment
Market Briefing: Stock Market Valuation Metrics & Models
 Market Briefing: Stock Market Valuation Metrics & Models May, Dr. Edward Yardeni -972-73 eyardeni@ Joe Abbott 732-497- jabbott@ Mali Quintana 4-4-1333 aquintana@ Please visit our sites at www. blog. thinking
Nimbus 9 PORTFOLIO MANAGEMENT PORTFOLIO SPECIALISTS
 Nimbus 9 STRATEGY HIGHLIGHTS Ticker: TRBCX CUSIP: 77954Q106 As of June 30, 2018 Total Large-Cap Growth Assets: $208.4 billion 2 Total Strategy Assets: 1 $84.5 billion 2 Total Fund Assets: $50.1 billion
Active Index Advisors (AIA)
") Active Index Advisors (AIA) Unlocking tax alpha to grow and differentiate your business For Investment Professional Use Only 1 Table of contents Introduction What is tax alpha and why does it matter? How
Active Index Advisors (AIA) Unlocking tax alpha to grow and differentiate your business For Investment Professional Use Only 1 Table of contents Introduction What is tax alpha and why does it matter? How
AMG SouthernSun U.S. Equity Fund Class N (SSEFX) Class I (SSEIX) Class C (SSECX) September 2018
 Class I (SSEIX) Class C (SSECX) September 2018") Class N (SSEFX) Class I (SSEIX) Class C (SSECX) September 2018 FOR INVESTMENT PROFESSIONAL USE ONLY NOT FOR DISTRIBUTION TO OR USE WITH THE GENERAL PUBLIC QUARTERLY PERFORMANCE (%) AND EXPENSE RATIOS as
Class N (SSEFX) Class I (SSEIX) Class C (SSECX) September 2018 FOR INVESTMENT PROFESSIONAL USE ONLY NOT FOR DISTRIBUTION TO OR USE WITH THE GENERAL PUBLIC QUARTERLY PERFORMANCE (%) AND EXPENSE RATIOS as
Stock Market Briefing: S&P 500 Trailing P/E Ratios
 Stock Market Briefing: S&P Trailing P/E Ratios January 31, 18 Dr. Edward Yardeni 16-972-7683 eyardeni@ Joe Abbott 732-497-6 jabbott@ Mali Quintana 48-664-1333 aquintana@ Please visit our sites at www.
Spread and Volatility April 2013
 April 213 contact Asia Pacific +852.2846.35 Canada +1.416.874.9 EMEA +44.2.767.4 United States +1.212.588.4 info@itg.com www.itg.com Spread and Volatility April 213 VIX fluctuated widely in April while
52-Week High Trailing PE Week Low Forward PE Buy 8 Analysts. 1-Year Return: 1.1% 5-Year Return: 73.1%
 FIERA CAPITAL CORP (-T) Last Close 13.07 (CAD) Avg Daily Vol 115,974 52-Week High 15.20 Trailing PE 76.9 Annual Div 0.72 ROE 2.8% LTG Forecast -- 1-Mo -8.0% November 28 TORONTO Exchange Market Cap (Consol)
Revisiting Core Principles
 Russell RAFI US All Co Index (USD) As of 09/30/2017 Revisiting Core Principles The Russell RAFI Index series utilizes fundamental measures of company size (adjusted sales, retained cash flow, and dividends
Trailing PE Forward PE Buy 2 Analysts. 1-Year Return: -25.2% 5-Year Return: -22.0%
 BOSTON PIZZA ROYALTIES INCOME (-T) Last Close 16.46 (CAD) Avg Daily Vol 35,516 52-Week High 22.48 Trailing PE 12.5 Annual Div 1.38 ROE 7.6% LTG Forecast -- 1-Mo -4.1% November 12 TORONTO Exchange Market
Trailing PE 2.4. Forward PE 9.2. Buy 7 Analysts. 1-Year Return: -21.0% 5-Year Return: -27.3%
 JUST ENERGY GROUP INC (-T) Last Close 4.99 (CAD) Avg Daily Vol 333,517 52-Week High 6.42 Trailing PE 2.4 Annual Div 0.50 ROE 799.5% LTG Forecast -- 1-Mo 19.4% November 09 TORONTO Exchange Market Cap 745M
CONSENSUS OPERATING EARNINGS for the S&P 500, MidCap 400 and SmallCap 600 Indices, as well as the Sectors in the S&P /02/18
 CONSENSUS OPERATING EARNINGS for the S&P 500, MidCap 400 and SmallCap 600 Indices, as well as the Sectors in the S&P 500. 02/02/18 Operating EPS Y/Y % chgs. S&P 500 Sector Q1 Q2 2017 Q3 Q4E Year Q1E Q2E
Additional series available. Morningstar TM Rating. Funds in category 431. Credit quality %
 Sun Life MFS Dividend Income Fund Investment objective Series A $12.9438 CAD Net asset value per security (NAVPS) as of October 05, 2018 $-0.0365-0.28% Benchmark S&P/TSX Capped Composite Index Fund category
A sampling of research & data on exchange traded funds from AltaVista Research
 A sampling of research & data on exchange traded funds from AltaVista Research In this week's issue: Chart of the week: Nuclear vs. Clean Energy ETFs Fund Focus: ishares S&P Global Nuclear Energy (NUCL)...
Trailing PE Forward PE Buy 27 Analysts. 1-Year Return: -16.3% 5-Year Return: 22.0%
 CANADIAN NATURAL RESOURCES (-T) Last Close 39.12 (CAD) Avg Daily Vol 4.2M 52-Week High 49.08 Trailing PE 12.8 Annual Div 1.34 ROE 11.6% LTG Forecast 45.3% 1-Mo -5.4% November 06 TORONTO Exchange Market
52-Week High Trailing PE Week Low Forward PE Buy 17 Analysts. 1-Year Return: 33.6% 5-Year Return: 36.
 THOMSON REUTERS CORP (-T) Report Date: October 22, Last Close 54.60 (CAD) Avg Daily Vol 1.1M 52-Week High 55.28 Trailing PE 17.2 Annual Div 1.34 ROE 13.4% LTG Forecast 11.0% 1-Mo 1.6% October 21, TORONTO
52-Week High Trailing PE Week Low Forward PE Hold 14 Analysts. 1-Year Return: 8.7% 5-Year Return: 43.
 CADIAN IMPERIAL BANK (-T) Last Close 114.56 (CAD) Avg Daily Vol 868,326 52-Week High 120.83 Trailing PE 10.4 Annual Div 5.20 ROE 18.0% LTG Forecast 4.6% 1-Mo 1.7% November 23 TORONTO Exchange Market Cap
Additional series available. Morningstar TM Rating. Funds in category Equity style Market cap %
 Sun Life MFS U.S. Growth Class Series A Additional series available NOTE: This Fund is a class of mutual fund shares of Sun Life Global Investments Corporate Class Inc. $23.0172 CAD Net asset value per
Micro Cap Fund JMCRX
 James Advantage Funds Micro Cap Fund JMCRX James Investment Research, Inc., P.O. Box 8, Alpha, Ohio 45301 www.jamesfunds.com info@jamesfunds.com 1-800-99-JAMES Fund Info Fund Statistics as of June 30,
When do I plan to retire?
 1290 Retirement Funds Retirement planning may be as easy as asking yourself, When do I plan to retire? Select the 1290 Retirement Fund that lines up with your retirement date, and we ll take it from there.
Trailing PE Forward PE Buy 7 Analysts. 1-Year Return: 5.1% 5-Year Return: 99.8%
 OPEN TEXT CORP (-T) Last Close 44.09 (CAD) Avg Daily Vol 697,695 52-Week High 51.98 Trailing PE 37.1 Annual Div 0.81 ROE 6.7% LTG Forecast 11.4% 1-Mo -2.0% November 22 TORONTO Exchange Market Cap 11.7B
HSBC Vantage5 Index Guide
 HSBC Vantage5 Index Guide Table of contents HSBC Vantage5 Index 1 In brief 2 HSBC Vantage5 performance 3 Comparative results 5 Key drivers 6 HSBC Vantage5 strategy 7 Strategic allocation 8 Achieving balance
Investing in Small Cap Equities. Great Lakes Advisors
 Investing in Small Cap Equities Great Lakes Advisors Information as of June 30, 2012 What is a Small Cap Stock? 2 Flagship Product Big Mac SuperSONIC Cheeseburger # Locations 31,000 3,561 # of employees
Trailing PE 9.2. Forward PE 8.5. Hold 15 Analysts. 1-Year Return: -10.8% 5-Year Return: 20.4%
 CADIAN IMPERIAL BANK (-T) Last Close 107.09 (CAD) Avg Daily Vol 1.9M 52-Week High 125.21 Trailing PE 9.2 Annual Div 5.44 ROE 17.0% LTG Forecast 4.8% 1-Mo -6.5% December 13 TORONTO Exchange Market Cap 47.6B
Revisiting Core Principles
 FTSE RAFI Japan Index (USD) As of 09/30/2017 Revisiting Core Principles The FTSE RAFI Index series utilizes fundamental measures of company size (sales, cash flow, dividends, and book value) as a rebalancing
Stock Market Briefing: Selected P/E Ratios
 Stock Market Briefing: Selected P/E Ratios December 29, 17 Dr. Edward Yardeni -972-763 eyardeni@ Joe Abbott 732-497-6 jabbott@ Mali Quintana -664-1333 aquintana@ Please visit our sites at www. blog. thinking
September 30, 2013
 www.cempindex.com September 30, 2013 Compass Efficient Model Portfolios Compass EMP was founded in 1996. Compass EMP has served as consultants to large institutions such as governments, endowments, foundations,
Investors Have Allocated Less to Value
 Investors Have Allocated Less to Value by Over $1 Trillion Compared to 10 Years Ago Equity Asset Under Management $20,000,000,000,000 $18,000,000,000,000 $16,000,000,000,000 $14,000,000,000,000 $12,000,000,000,000
Active Opportunities in US Equities
 Active Opportunities in US Equities 11 June 2015 Grant Bowers Vice President Portfolio Manager Franklin Equity Group Franklin Advisers, Inc. Cumulative US GDP Growth (%) Total Cumulative US GDP Growth
Smart Beta Dashboard. Thoughts at a Glance. January By the SPDR Americas Research Team
 By the SPDR Americas Research Team Thoughts at a Glance 2017 marked another year of factor performance shifts. s comeback in the US on the heels of the US election and the potential for a Trump-flation
Prudential Premier Retirement Variable Annuity B Series SM
 Prudential Premier Retirement Variable Annuity B Series SM Portfolio Analysis Customized for: Joe Client Prepared by: John Q. Doe Firm name: Prudential Annuities Date Prepared: February 25, 2011 Pg. 1
Vanguard Precious Metals and Mining Fund
 Vanguard Fund Product Summary minerals sector fund. Seeks long-term capital appreciation. Diversified exposure to metals and mining industries, including both precious and common metals or minerals. Fundamental
Trailing PE 8.9. Forward PE 8.0. Hold 7 Analysts. 1-Year Return: -17.0% 5-Year Return: -13.9%
 ER CORPORATION OF CANADA (-T) Last Close 27.12 (CAD) Avg Daily Vol 905,847 52-Week High 33.21 Trailing PE 8.9 Annual Div 1.53 ROE 9.9% LTG Forecast 6.3% 1-Mo 0.9% November 15 TORONTO Exchange Market Cap
Top 10 Reasons This Remains A Misunderstood and Underutilized Asset Class. Please see last page for important disclosures.
 18 INTERNATIONAL SMALL CAP Top 10 Reasons This Remains A Misunderstood and Underutilized Asset Class Please see last page for important disclosures. 1 INTERNATIONAL INVESTING IS RISKY. 2 INTERNATIONAL
Additional series available. Morningstar TM Rating. Funds in category. Equity style Market cap %
 Sun Life MFS Dividend Income Fund Series A $13.3108 Net asset value per security (NAVPS) as of December 22, 2017 $-0.0115-0.09% Benchmark S&P/TSX Capped Composite Index Fund category Canadian Dividend
Monetta Core Growth Fund. Quarterly Fact Sheet monetta.com Monetta Core Growth Fund S&P 500 Index
 Monetta Core Growth Fund (MYIFX) March 31, 2019 Monetta Financial Services, Inc. Quarterly Fact Sheet monetta.com 1-800-241-9772 Fund Overview U.S. Large-Cap Growth Combines passive and active components
Additional series available. Morningstar TM Rating. Funds in category. Equity style Market cap % Giant 0.0 Large 1.9 Medium 58.5 Small 37.1 Micro 2.
 Sun Life Schroder Global Mid Cap Fund Series A $11.6434 CAD Net asset value per security (NAVPS) as of September 27, 2018 $0.0408 0.35% Benchmark MSCI World Small Cap Index Fund category Global Small/Mid
Mid Cap Fund JAMDX. James Investment Research, Inc., P.O. Box 8, Alpha, Ohio
 James Advantage Funds Mid Cap Fund JAMDX James Investment Research, Inc., P.O. Box 8, Alpha, Ohio 45301 www.jamesfunds.com info@jamesfunds.com 1-800-99-JAMES DECEMBER 31, 2017 Fund Info Fund Statistics
Additional series available. Morningstar TM Rating - Funds in category. Equity style Market cap % Micro 0.2. as of October 31, 2018
 Sun Life Excel India Fund Series A Additional series available Note: On June 18, 2018, the Excel India Fund changed its name to the Sun Life Excel India Fund. $35.1566 CAD Net asset value per security
Fidelity Small Cap Value Fund
 QUARTERLY FUND REVIEW AS OF SEPTEMBER 30, 2017 Fidelity Small Cap Value Fund Investment Approach Fidelity Small Cap Value Fund takes a value approach to investing, focusing on companies with low implied
Trailing PE Forward PE Buy 8 Analysts. 1-Year Return: -6.2% 5-Year Return: 326.0%
 GROUP INC (-T) Last Close 48.09 (CAD) Avg Daily Vol 196,600 52-Week High 61.25 Trailing PE 12.3 Annual Div 1.50 ROE 25.5% LTG Forecast -- 1-Mo -5.4% October 05 TORONTO Exchange Market Cap 3.0B 52-Week
Exchange-traded funds ETF Flows - 2Q15 2 July 2015
 ETF Flows - 2Q15 2 July 2015 CIO WM Research David Perlman, ETF Strategist, david.perlman@ubs.com This report highlights quarterly ETF flows by issuer and market segment. Flow estimates are obtained through
Revisiting Core Principles
 FTSE RAFI All World 3000 - QSR Index (USD) As of 09/30/2017 Revisiting Core Principles The FTSE RAFI QSR Index series utilizes fundamental measures of company size (sales, cash flow, dividends, and book
Smart Beta Dashboard. Thoughts at a Glance. March By the SPDR Americas Research Team
 By the SPDR Americas Research Team Thoughts at a Glance For the first two months of Q1, US outperformed the broader market by nearly 5%. However, as 10-year Treasury yields and inflation expectations came
Revisiting Core Principles
 Russell RAFI Global All Co Index (USD) As of 06/30/2017 Revisiting Core Principles The Russell RAFI Index series utilizes fundamental measures of company size (adjusted sales, retained cash flow, and dividends
Investment Style Guide
 Investment Style Guide April 27, 2 Dr. Edward Yardeni 16-972-7683 eyardeni@ Joe Abbott 732-497-36 jabbott@ Please visit our sites at www. blog. thinking outside the box Table Of Contents Table Of Contents
AMG GW&K Small Cap Core Fund Class N (GWETX) Class I (GWEIX) Class Z (GWEZX) September 2018
 Class I (GWEIX) Class Z (GWEZX) September 2018") Class N (GWETX) Class I (GWEIX) Class Z (GWEZX) September 2018 FOR INVESTMENT PROFESSIONAL USE ONLY NOT FOR DISTRIBUTION TO OR USE WITH THE GENERAL PUBLIC QUARTERLY PERFORMANCE () AND EXPENSE RATIOS as
Class N (GWETX) Class I (GWEIX) Class Z (GWEZX) September 2018 FOR INVESTMENT PROFESSIONAL USE ONLY NOT FOR DISTRIBUTION TO OR USE WITH THE GENERAL PUBLIC QUARTERLY PERFORMANCE () AND EXPENSE RATIOS as
Why Dividends? Market Commentary January 2018
 Why Dividends? Market Commentary January 2018 OVER THE YEARS, INVESTOR APPETITE FOR DIVIDENDS has waxed and waned. Historically, research in dividend investing has measured everything from performance
S&P 500 High Beta High Dividend Index Methodology
 S&P 500 High Beta High Dividend Index Methodology S&P Dow Jones Indices: Index Methodology January 2017 Table of Contents Introduction 3 Highlights 3 Eligibility Criteria 4 Index Eligibility 4 Eligibility