Strong Production Growth, Top Quartile Well Results and Lowest Corporate Cash Costs in the Montney Underpins Glacier Plant Expansion Plans to 350
|
|
|
- Sydney Fox
- 5 years ago
- Views:
Transcription
 Investor Presentation TSX / NYSE: AAV")
1 Strong Production Growth, Top Quartile Well Results and Lowest Corporate Cash Costs in the Montney Underpins Glacier Plant Expansion Plans to 350 MMcf/d (58,330 Boe/d) Investor Presentation TSX / NYSE: AAV July 2016
 Market Capitalization @ June 30, 2016 As at March 31, 2016: Bank Debt (45% drawn on $450 million Credit")
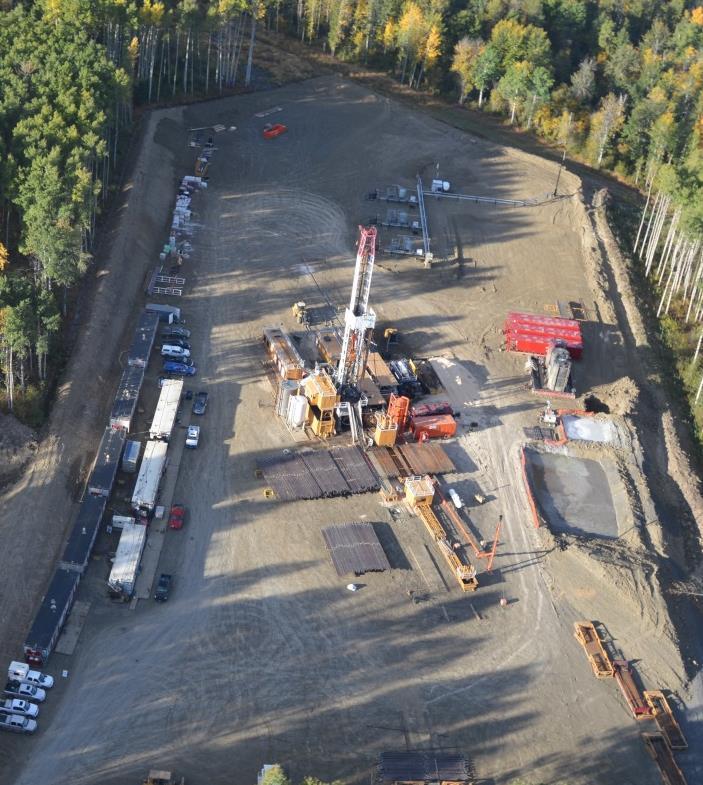
2 ADVANTAGE AT A GLANCE TSX, NYSE: AAV TSX 52-week trading range $ $8.36 Shares Outstanding (basic) million 2016 Annual Production Target 39% Annual Production Growth 200 mmcfe/d (33,300 boe/d) Market June 30, 2016 As at March 31, 2016: Bank Debt (45% drawn on $450 million Credit Facility) Total Debt (including working capital deficit) Total Year-end Debt /Trailing Cash Flow (based on 2016 Budget at Aeco Cdn $2.00/mcf) $1.3 billion $203 million $213 million 1.2x (1) View of Glacier Plant Process Train approximately 1000 feet long (1) Estimated debt and cash flow based on Advantage s 2016 Budget & Guidance assumptions 2

 Progress (Future) 9 net Montney sections 48.")
3 FOCUSED ON GLACIER DEVELOPMENT SINCE 2008 ADDITIONAL MONTNEY LANDS PROVIDES FUTURE UPSIDE Current development at Glacier including dry and liquids rich gas drilling with a future drilling inventory >1,000 locations New Montney lands at Valhalla, Wembley & Progress contain multiple layers and requires delineation Total 138 net Montney sections (88,480 net acres) Glacier 81 net sections 100% owned Glacier Gas Plant Valhalla (Evaluating) Progress (Future) 9 net Montney sections net Montney sections Wembley (Future) 3
 50 to 100 mmcfe/d 2014-2015 30% Well IP30 + EUR (1) $0.")
4 ADVANTAGE S GROWTH & ACHIEVEMENTS Resource Appraisal Gen 1 Fracs (6-10 frac stages) First 25 mmcf/d U&L Montney Delineation Gen 2 Fracs (10-14 frac stages) Opex costs <$0.38/mcfe 25 to 50 mmcfe/d Middle Montney Liquids Gen 3 Fracs (16-18 frac stages, slickwater, OH packers) 50 to 100 mmcfe/d % Well IP30 + EUR (1) $0.82/mcfe Total Cash Costs 250 mmcf/d Plant expansion 130 to 180 mmcfe/d Record Low Cash Costs $0.75/mcfe Gen 4 Fracs (ports, 25+ frac stages) 350 mmcf/d Plant expansion plan in progress 180 to 200 mmcfe/d 58,330 Boe/d 200 to 350 mmcfe/d (1) IP30 is initial average well 30 day production rate and 2P Estimated Ultimate Recovery per Management estimates. Comparison is made to prior Management estimated average well type curve. 4

 Lowest Cash Cost Montney Producer (3)")
 Total debt to")

 % of estimated annual production net of")

5 CREATED A PROFITABLE & SUSTAINABLE GROWTH MODEL World Class Montney Asset Strong Balance Sheet 1.2x D/CF (1) 2016 Hedged to Protect Future Cash Flow (2) Lowest Cash Cost Montney Producer (3) Operating & Financial Flexibility Own & Operate 100% Plant & Infrastructure (1) Total debt to trailing cash flow based on 2016 Advantage Budget & AECO Cdn $2.00/mcf See Advantage press release December 16, 2015 (2) % of estimated annual production net of royalties, $3.62 Cdn/mcf, $3.24 Cdn/mcf 2017, $3.10 Cdn/mcf (3) Total corporate cash costs of $0.75/mcfe Q1 2016

 Management estimated initial 30 day average well production rate (IP30).")
6 WITH OPERATIONAL FLEXIBILITY >70 mmcf/d Surplus Well Productivity from 10 Completed Standing Wells (1) 50 mmcf/d Currently Available Glacier Plant Capacity 100 mmcf/d Plant Expansion plan to 350 mmcf/d in progress 200 mmcf/d Additional Sales Gas Pipeline Capacity, Total 400 mmcf/d capacity 100% Facilities Ownership No Onerous 3 rd Party Commitments/Constraints Well Pads Planned to 2019 Glacier Gas Plant Current Capacity 250 mmcf/d May 2016 (1) Management estimated initial 30 day average well production rate (IP30). Additional 14 wells remain drilled and uncompleted. 6


7 CONTINUOUS IMPROVEMENT HAS CREATED INDUSTRY LEADING EFFICIENCIES 7
8 DRIVING STRONG GROWTH & FINANCIAL FLEXIBILITY IN OUR 2016 BUDGET ($ million) Surplus Cash $146 $120 $26 $ Budget Highlights ~$65 million in H Drill 13 wells $35 Complete 13 standing wells $41 40% Production Growth 190 to 210 mmcfe/d Annual Average Production (31,670 35,000 Boe/d) $0.75/mcf Total Cash Costs ~$55 million in H Pipeline looping $18 Utilities GGS $17 Other $ Capital Budget 2016 Cash Flow (1) 2016 Cash Flow (1) 2016 Capital Budget 2016 Cash Flow 2016 Cash Flow AECO $2.00/Mcf AECO $1.25/Mcf 12% Cash Flow Per Share Growth (2) Capital Program Includes Wells for 2017 Production (1) Cash Flow estimates includes Advantage s current hedging positions. AECO Cdn $1.25/mcf sensitivity case assumes full year at $1.25/mcf for 2016 (2) Based on AECO Cdn $2.00/mcf 8
9 STRONG NETBACKS & RECYCLE RATIOS ARE ACHIEVABLE EVEN WITHOUT HEDGING $/Mcfe $3.50 $3.00 $2.50 $2.00 $1.50 $1.00 $0.50 $- Select Montney Natural Gas Producers Total Corporate Cash Cost Structure - Q AAV s Total Cash Costs are more than $1.00/mcfe lower than the average Average $2.28/Mcfe AAV TOU BIR PPY ARX CR VII KEL NVA POU Glacier Netbacks Illustrative AECO Cdn $2.00/mcf Illustrative AECO Cdn $3.00/mcf Revenue (Realized Price) $1.80 (1) $2.80 (1) Royalties ($0.09) ($0.14) Operating + Transportation ($0.35) ($0.35) Costs (2) Operating Netback $1.36 $2.31 G&A ($0.10) ($0.10) Finance Expense & other ($0.12) ($0.12) Cash Flow Netback NO HEDGING INCLUDED $1.14/mcfe or $6.84/boe $2.09/mcfe or $12.54/boe Recycle Ratio x 2.7x 2P $0.77/mcfe (3) Interest & other ($/mcfe) Royalties ($/mcfe) G&A ($/mcfe) Operating costs & transportation ($/mcfe) (1) Advantage's transportation includes liquids transportation costs. As required by accounting standards, Advantage's gas sales contract requires gas transportation costs of ~$0.27/mcf be included in revenue. Source: RBC Capital Markets, Public Disclosures (1) Revenue includes adjustments for heat value offset by natural gas transportation costs of $0.28/mcf (2) Operating costs include estimate for liquids transportation costs (3) 2P F&D includes Future Development Capital and is based on Sproule s 2015 year-end 2P reserves report. 9
10 MAINTENANCE CAPITAL AND SURPLUS CASH FLOW SENSITIVITY Surplus Cash Flow Above AECO $2.00/Mcf (NO HEDGING INCLUDED) Based on average well type curve (1) $110 million $200 million $155 million Based on top quartile type well (2) $90 million $110 million Mantenance Capital at 245 mmcfe/d Cash Flow at AECO $2.00/Mcf Cash Flow at AECO $2.50/Mcf Cash Flow at AECO $3.00/Mcf Notes (1) Assumes 7.2 mmcf/d /7.2 Bcf for Upper/Lower Montney wells and 4.5 mmcf/d /4.5 Bcf for Middle Montney wells (2) Assumes 9 mmcf/d /9 Bcf for Upper/Lower Montney wells and 6 mmcf/d /6 Bcf for Middle Montney wells 10
11 ADVANTAGE DEVELOPMENT PLAN 2015 THROUGH 2017 (1) 141 Annual Average Production (mmcfe/d) 40% % 22% CAGR (2) 235 $165 Capital Spending ($ millions) $485 million Total (original estimate $700 million) $120 $ Actual 2016 Budget 2017 Estimate 2015 Actual 2016 Budget 2017 Estimate $0.72 Cash Flow per Share 30% 12% $0.80 $1.04 $20,400 ALL-IN Capital Efficiency ($/boe/d) $13,300 per boe/d Average Capital Efficiency $12,500 $7, Actual 2016 Budget 2017 Estimate 2015 Actual 2016 Budget 2017 $2.00 Cdn AECO/mcf Notes: (1) Price assumptions: 2016 AECO $2.00/mcf and 2017 AECO $2.75/mcf. See Appendix pg. 22 for Plan details (2) Compound annual growth rate. (3) Capital Efficiency calculated using 30% per annum decline and includes total annual capital expenditures 11

12 DEVELOPMENT PLAN SENSITIVITY & HEDGING POSITIONS (1) Current hedging program reduces downside risk and maintains upside torque Period Production (2) Hedged (net) Average AECO Floor Price % $3.62/mcf % $3.24/mcf % $3.04/mcf Notes: (1) Includes Advantage s current hedges (2) % of estimated annual production, net of royalties 12
 for >50 years (1) >1,000 Future Drill Locations at Glacier supports future growth (1) 297 undeveloped locations booked in 2P reserves")
 Management Estimates (2) Based on Sproule December 31, 2015 Glacier Reserves Report (3) As of Dec.")
13 SIGNIFICANT DRILLING INVENTORY INCLUDES DRY AND LIQUIDS RICH NATURAL GAS LOCATIONS AT GLACIER Capable of maintaining 245 mmcfe/d (40,830 boe/d) for >50 years (1) >1,000 Future Drill Locations at Glacier supports future growth (1) 297 undeveloped locations booked in 2P reserves Year End 2015 (2) >1000 Future Drilling Locations (Management Estimate) 2P Reserves Undeveloped Wells 297 Drilled Wells 169 Drilled (3) Wells by Layer Upper 104 Middle 23 Lower 42 (1) Management Estimates (2) Based on Sproule December 31, 2015 Glacier Reserves Report (3) As of Dec. 31,


14 OPERATIONAL EXCELLENCE 14
 UPPER MONTNEY $5.5 $4.")
 (25 fracs) $5.")
15 IMPROVING WELL PERFORMANCE AND LOWER WELL COSTS THROUGH DRILLING & COMPLETION TECHNOLOGY Recent TOP Quartile Wells (1) Increasing frac count has improved long term production performance in all layers Well Costs Reduced ($ millions) UPPER MONTNEY $5.5 $4.5 9 mmcf/d 21 mmcf/d 18 mmcf/d 18 mmcf/d 13 mmcf/d 13 mmcf/d 16 mmcf/d Upper Montney Middle Montney Lower Montney 10 mmcf/d 6 mmcf/d 13 mmcf/d 18 mmcf/d 12 mmcf/d 11 mmcf/d MIDDLE MONTNEY $ $ (18 fracs) (25 fracs) $5.8 (18 fracs) (25 fracs) (18 fracs) "2016 Annual Target of 200 mmcfe/d attainable with current standing inventory of wells" 10 Wells Currently Completed & Standing 14 Wells Drilled & Uncompleted LOWER MONTNEY $ (25 fracs) (1) Initial on production rate based on approximately first ten days of in line test at gas gathering system pressure. Wells are then choked to 10 mmcf/d to manage frac sand flow back per AAV operating practices 15
 Budget Type Curve (IP30 7.2 mmcf/d & 7.")
16 UPPER & LOWER MONTNEY WELLS OUTPERFORM LONG TERM PRODUCTION EXPECTATIONS New wells are normally restricted to 10 mmcf/d for frac sand flowback control during initial 6 months Wells tested, not on-production. 13 recent wells are demonstrating strong performance Production from 22 previously completed slick water wells (2013) Budget Type Curve (IP mmcf/d & 7.2 Bcf) Top Quartile Type Well (IP30 9 mmcf/d & 9 Bcf) Data: updated to June 28,
 12-2 well (2013) cumulative production > 3.0 Bcfe (restricted) with current flowing pressure ~ 1,000 psi. Middle Montney Budget Type Curve (IP30 4.5 mmcf/d & 4.")
17 IMPROVING LIQUIDS RICH MIDDLE MONTNEY WELL PERFORMANCE AT GLACIER 10 New MM wells could exceed type curve Wells tested, not on-production New 12-3 well (2014) cumulative production > 1.4 Bcf in 8 months (restricted) 12-2 well (2013) cumulative production > 3.0 Bcfe (restricted) with current flowing pressure ~ 1,000 psi. Middle Montney Budget Type Curve (IP mmcf/d & 4.5 Bcf) Data: updated to June 28,
18 ROBUST UPPER & LOWER MONTNEY DRY GAS WELL ECONOMICS Advantage achieved >20% DC & E well cost reduction & despite increasing frac count 59% Upper & Lower Montney (Dry Gas) 89% Middle Montney (50 bbls/mmcf C3+, 45% C5+) 81% 45% Type Curve & Cost Higher IP & EUR Case Type Curve & Cost Higher IP & EUR Case $4.9MM $4.9MM $5.4MM $5.4MM IP30 Bcf Well Cost (DC&E) mmcf/d Assumptions: Management Estimates of IP30, 2P EUR & Capital Costs for the next phase of drilling Cdn Aeco $3.00/mcf, flat Cdn $40/bbl blended C3+ price based on $55 U.S./bbl WTI 18

KIM.")
19 GROWTH BEYOND 350 MMCF/D CAN BE ACCOMMODATED ON EXISTING PLANT SITE 100% Owned Glacier Gas Plant Positioned for Production Ramp-up T78 R14 R13 R12 R11 Advantage Gas Plant R10 R9 R8 R7W6 T78 T77 T77 Room for Additional Expansion Beyond 350 mmcf/d To be expanded from 250 mmcf/d to 350 mmcf/d Dry & Liquids gas processing capacity TCPL Sales Meter Stations Alliance Sales Gas Line TCPL NW ALBERTA Main Sales Gas Line T76 T mmcf/d take away capacity to TCPL NW main sales gas pipeline Pembina NGL Line T74 T73 Company Land Company Gas Plant TransCanada Pipeline Pembina Pipeline Advantage Pipeline Alliance Pipeline T72 T71 Glacier Gas Plant Site near Major Natural Gas & Liquids Pipelines & Rail Access R13 R12 R11 File: GlacierInfra ( )KIM.M Datum: NAD27 Projection: Stereographic Center: N W Created in AccuMap, a product of IHS 2016 Sales Pipeline Loop increases capacity to 400 mmcf/d (Glacier plant to NW TCPL Mainline) Additional 35 mmcf/d TCPL Firm Service for 2018 Secured Additional 30 mmcf/d TCPL Firm Service for 2019 Secured R10 R9 R8 R7W6 19


20 Clear Vision for Growth Financial Strength Proven Expertise
21 APPENDIX 21
22 FULLY FUNDED GLACIER GROWTH PLAN DETAILS: 22% ANNUAL AVERAGE PRODUCTION GROWTH FOR 2015 TO Annual Average Production (1) (2) Development Plan (mmcfe/d) Annual Average Production Growth (3) 39% Actual 2016 Budget 2017 Estimate 22% average growth per year ( CAGR ) Actual Actual Pro Forma Budget Estimate Production Annual average (mmcfe/d) growth (3) 26% 7% 39% 18% Exit rate (mmcfe/d) growth (3) 24% 31% 16% 20% 2016 budgeted production includes up to an average of 1,200 bbls/d of natural gas liquids. Wells Drilled (net) Commodity Prices (4) NYMEX ($US/mmbtu) $4.41 $2.66 $2.35 $2.75 AECO ($/mcf) $4.49 $2.69 $2.50 $2.75 WTI ($US/bbl) $93.26 $48.69 $42.00 $48.00 Financial Capital ($ millions) $237 $165 $120 $200 Funds from operations ($ millions) $164 $124 $163 $192 per share (5) $0.97 $0.72 $0.90 $1.04 Bank debt ($ millions) (6) $110 $287 $145 $150 multiple of cash flow 0.7x 2.3x 0.9x 0.8x Total debt ($ millions) (6) $253 $294 $156 $164 multiple of cash flow 1.5x 2.4x 1.0x 0.9x 7% 18% 2015 Actual 2016 Budget 2017 Estimate Notes (1) All capital and operating input parameters are based on mid-point of estimates. (2) (3) Development Plan presented pro forma the offering of an additional 13.5 million Common Shares for net proceeds of $95 million that w as completed on Mar. 8, Grow th or CAGR represents the Compound Annual Grow th Rate during the period (2014 grow th calculation excludes production from asset dispositions completed in 2013). (4) Commodity prices based on forw ard prices as of the Budget approval date of Dec.16, (5) Basic Common Shares outstanding w as million on Mar. 8, (6) Estimated bank debt and total debt at the end of each calendar year. Total debt includes bank debt and w orking capital. Multiple of cash flow is based on the calendar year's funds from operations. 22

23 UPPER AND LOWER MONTNEY WELLS - IMPROVING PERFORMANCE SINCE 2008 Budget Type Curve (IP mmcf/d & 7.2 Bcf) Data: updated to June
24 EXCEPTIONAL UPPER & LOWER MONTNEY WELL ECONOMICS (1) Upper & Lower Montney Dry Gas (2) Budget Type Curve. Some recent Upper & Lower Montney wells are outperforming type curve (3) (1) Management estimates. NPV 10% pre-tax (2) Capital of $4.9 million per well based on management s estimate of Capital Cost for our next phase of drilling (3) Natural gas and NGL prices and costs escalated at 1.5%. Average C3+ Cdn NGL price of $40/bbl based on $55 U.S./bbl WTI 24
 Capital of $5.4 million per well based on management s estimate of Capital Cost for our next phase of drilling (3) Natural gas and NGL prices and costs escalated at 1.5%.")
25 STRONG EAST GLACIER MIDDLE MONTNEY WELL ECONOMICS (1) Middle Montney at 50 bbls/mmcf C3+ (2) 45% Budget type curve. Some recent MM wells are exceeding type curve. (3) (1) Management estimates. NPV 10% pre-tax (2) Capital of $5.4 million per well based on management s estimate of Capital Cost for our next phase of drilling (3) Natural gas and NGL prices and costs escalated at 1.5%. Average C3+ Cdn NGL price of $40/bbl based on U.S.$55/bbl WTI. C3+ NGL yields of 50 bbls/mmcf raw gas 25

 from west to")


 Based on")
26 2014 MIDDLE MONTNEY PROGRAM FOCUSED ON HIGHER LIQUID CONTENT IN EAST GLACIER Middle Montney wells to date illustrate higher liquid content (1) from west to east across Glacier West Glacier 18 to 30 bbls/mmcf C Well mmcf/d 43 bbls/mmcf 2014 Well mmcf/d 54 bbls/mmcf East Glacier 30 to 83 bbls/mmcf C Well mmcf/d 83 bbls/mmcf 2014 Well mmcf/d 47 bbls/mmcf Glacier C5+ 57 deg API Well mmcf/d 42 bbls/mmcf 6.6 > % MM wells drilled in 2014 program at Glacier MMCF/D average final test rate from ten completed 2014 wells MMCF/D demonstrated by 3 of the 10 wells BBLS/MMCF of C3+ liquids yield average East Glacier Average condensate in liquid yield 2014 Middle Montney wells completed & standing 2014 & 2015 Middle Montney wells waiting on completion (1) Based on C 3 + shallow cut liquids extraction process yields from well test data. 26
27 GLACIER MONTNEY ASSIGNED 2P EUR PER WELL & INTERVAL 2P Recoveries per Interval (1) # of Gross HZ Wells 2P Recovery [bcf/well] Interval Developed Undeveloped TOTAL Developed Undeveloped TOTAL Y E UM MM MM MM LM Total (1) Based on Sproule 2015 year-end reserve report. Indicated raw gas volumes per well. 27


28 GLACIER LOCATED IN THE HEART OF THE MONTNEY RESOURCE PLAY Montney Siltstone Comparison: 700 times more permeability 4x more formation thickness Very low clay content Liquids & Improved well efficiencies strong economics Up to 83 bbls/mmcf 28


29 2012 CORE AND COMPLETION STUDIES: INCREASED RESOURCE AND IMPROVED WELL RESULTS Core study determined original density porosity logs have to be recalibrated Re-calibration aligned log to actual core porosities evident through entire 290 meters of Montney formation at Glacier Well tests in all the Montney layers proved gas saturation and productivity IP30 s on open hole wells improved by 1.6x First year cumulative production improved by 1.7x from 0.7 bcf to 1.2 bcf Completion Study Area IP30 s with pump rates > 4m 3 /minute improved by 1.7x First year cumulative production improved by 2.4x from 0.7 bcf to 1.7 bcf Completion Study included 135 wells and over 1,400 fracs in the immediate Glacier area covering the EnCana Swan and Murphy Tupper properties Findings revealed that high frac pump rates and open hole packer system resulted in optimal performance (1) Composite log and core from several wells located across the Glacier land block 29
30 ADVISORY Certain statements contained in this presentation constitute forward-looking statements. These statements relate to future events or our future performance. All statements other than statements of historical fact may be forward-looking statements. Forward-looking statements are often, but not always, identified by the use of words such as "seek", "anticipate", "plan", "continue", "estimate", "expect", "may", "will", "project", "predict", "potential", "targeting", "intend", "could", "might", "should", "believe" and similar expressions. In particular, this presentation contains forward-looking statements pertaining to, but not limited to, the following: details of the Corporation's 2015 to 2017 development plan including expected production growth, estimate debt to cash flow ratio, expected capital expenditures, expected wells to be drilled, expected operating costs, expected economics, expected resulting free cash flow and expected number of drilling locations and inventory; expected number of wells required to be drilled to achieve certain levels of production; expected details and timing of the Glacier gas plant expansion; expected well economics associated with certain type curves; expected future production levels; expected sensitivities in cash flow per share and debt tocash flow levels tochanges in commodity prices; expected effect of refinement of drilling and completion technique; Advantage's guidance in respect of anticipated production levels, exit production rates, royalty rates, operating costs and netbacks; and projections of market prices and costs. In addition, statements relating to "reserves" or "resources" are deemed to be forward-looking statements, as they involve the implied assessment, based on certain estimates and assumptions that the reserves and resources described can be profitably produced in the future. These statements involve substantial known and unknown risks and uncertainties, certain of which are beyond Advantage's control, including, but not limited to: changes in general economic, market and business conditions; industry conditions; actions by governmental or regulatory authorities including increasing taxes or royalties; and changes in investment or other regulations; the effect of acquisitions; Advantage's success at acquisition, exploitation and development of reserves; changes in laws and regulations including the adoption of new environmental laws and regulations and changes in how they are interpreted and enforced; fluctuations in commodity prices and foreign exchange and interest rates; stock market volatility and market valuations; volatility in market prices for oil and natural gas; unexpected drilling results, changes in commodity prices, currency exchange rates, capital expenditures, reserves or reserves estimates and debt service requirements; the occurrence of unexpected events involved in the exploration for, and the operation and development of, oil and gas properties; hazards such as fire, explosion, blowouts, cratering, and spills, each of which could result in substantial damage to wells, production facilities, other property and the environment or in personal injury; changes or fluctuations in production levels; delays in anticipated timing of drilling and completion of wells; individual well productivity; competition from other producers; the lack of availability of qualified personnel or management; credit risk; our ability to comply with current and future environmental or other laws; liabilities inherent in oil and natural gas operations; uncertainties associated with estimating oil and natural gas reserves; competition for, among other things, capital, acquisitions of reserves, undeveloped lands and skilled personnel; incorrect assessments of the value of acquisitions; geological, technical, drilling and processing problems and other difficulties in producing petroleum reserves; ability to obtain required approvals of regulatory authorities; ability to access sufficient capital from internal and external sources. Many of these risks and uncertainties and additional risk factors are described in the Corporation's Annual Information Form which is available at and Readers are also referred to risk factors described in other documents Advantage files with Canadian securities authorities. With respect to forward-looking statements contained in this presentation, Advantage has made assumptions regarding, but not limited to: conditions in general economic and financial markets; effects of regulation by governmental agencies; current commodity prices and royalty regimes; future exchange rates; royalty rates; future operating costs; current commodity prices and royalty regimes; availability of skilled labor; availability of drilling and related equipment; timing and amount of capital expenditures; the impact of increasing competition; the price of crude oil and natural gas; that the Corporation will have sufficient cash flow, debt or equity sources or other financial resources required to fund its capital and operating expenditures and requirements as needed; that the Corporation's conduct and results of operations will beconsistent with its expectations; that the Corporation will have the ability to develop the Corporation's properties in the manner currently contemplated; current or, where applicable, proposed assumed industry conditions, laws and regulations will continue in effect or as anticipated; and the estimates of the Corporation's production and reserves volumes and the assumptions related thereto (including commodity prices and development costs) are accurate in all material respects. Advantage's actual decisions, activities, results, performance or achievement could differ materially from those expressed in, or implied by, such forward-looking statements and, accordingly, no assurances can be given that any of the events anticipated by the forward-looking statements will transpire or occur or, if any of them do, what benefits that Advantage will derive from them. Except as required by law, Advantage undertakes no obligation to publicly update or revise any forward-looking statements. For additional risk factors in respect of Advantage and its business, please refer to it Annual Information Form dated March 25, 2015which is available on SEDAR at and References in this presentation to initial test production rates, production type curves, initial "productivity", initial "flow" rates, final gas flow rates, average gas flow rates, average type curves, "flush" production rates and 30 day IP rates and other short-term production rates are useful in confirming the presence of hydrocarbons, however such rates are not 30
31 ADVISORY determinative of the rates at which such wells will commence production and decline thereafter and are not indicative of long term performance or of ultimate recovery. While encouraging, readers are cautioned not to place reliance on such rates in calculating the aggregate production for Advantage. A pressure transient analysis or well-test interpretation has not been carried out in respect of all wells. Accordingly, the Corporation cautions that the test results should be considered to be preliminary. Certain type curves presented herein represent estimates of the production decline and ultimate volumes expected to be recovered from wells over the life of the well. The 7.2 mmcf/d IP (which represents the average 30 day initial production rate) & 7.2 Bcf (which represents the ultimate volumes expected to be recovered from the wells over the life of the well based on the type curve) Upper and Lower Montney type curve and the 4.5 mmcf/d IP and 4.5 Bcf Middle Montney type curve are management generated type curves based on a combination of historical performance of older wells and management's expectation of what might be achieved from future wells. The type curves represent what management thinks an average well will achieve. Individual wells may be higher or lower but over a larger number of wells management expects the average to come out to the type curve. Over time type curves can and will change based on achieving more production history on older wells or more recent completion information on newer wells. Other type curves presented herein, including the 9 mmcf/d IP & 9 Bcf Upper and Lower Montney type curve have been provided to demonstrate the economics associated with wells that could potentially have that type of productivity and recovery but do not represent management estimates of how such wells will actually perform. This presentation discloses certain future drilling locations that have not been booked in Advantage's most recent independent reserves evaluation as prepared by Sproule as of December 31, Such drilling locations are internal estimates based on Advantage's prospective acreage and an assumption as to the number of wells that can be drilled per section based on industry practice and internal review. Such locations do not have attributed reserves or resources. Such drilling locations have been identified by management as anestimation of our multi-year drilling activities based on evaluation of applicable geologic, seismic, engineering, production and reserves information. There is no certainty that the Advantage will drill all drilling locations and if drilled there is no certainty that such locations will result in additional oil and gas reserves, resources or production. The drilling locations on which we actually drill wells will ultimately depend upon the availability of capital, regulatory approvals, seasonal restrictions, oil and natural gas prices, costs, actual drilling results, additional reservoir information that is obtained and other factors. While certain of the drilling locations have been derisked by drilling existing wells in relative close proximity to such drilling locations, other drilling locations are farther away from existing wells where management has less information about the characteristics of the reservoir and therefore there is more uncertainty whether wells will be drilled in such locations and if drilled there is more uncertainty that such wells will result in additional oil and gas reserves, resources or production. Throughout this presentation the terms boe (barrels of oil equivalent), mcfe (thousand of cubic feet of gas equivalent), mmcfe (millions of cubic feet of gas equivalent), bcfe (billions of cubic feet of gas equivalent) and Tcfe (trillion of cubic feet of gas equivalent) are used. Such terms may be misleading, particularly if used in isolation. The conversion ratio used herein of six thousand cubic feet per barrel (6 mcf: 1 bbl) of natural gas to barrels of oil equivalent and the conversion ratio used herein of 1 barrel per six thousand cubic feet (1 bbl: 6 mcf) of barrels of oil to natural gas equivalent is based on an energy equivalency conversion method primarily applicable at the burner tip and does not represent a value equivalency at the wellhead. Given that the value ratio based on the current price of crude oil as compared to natural gas is significantly different from the energy equivalency of 6:1, utilizing a conversion on a 6:1 basis may be misleading asan indication of value. The Corporation discloses several financial measures that do not have any standardized meaning prescribed under International Financial Reporting Standards ("IFRS"). These financial measures include funds from operations, total debt to cash flow ratio and operating netbacks. Management believes that these financial measures are useful supplemental information to analyze operating performance and provide an indication of the results generated by the Corporation s principal business activities. Investors should be cautioned that these measures should not beconstrued as an alternative to net income, cash provided by operating activities or other measures of financial performance as determined in accordance with IFRS. Advantage s method of calculating these measures may differ from other companies, and accordingly, they may not be comparable to similar measures used by other companies. Funds from operations, as presented, is based on cash provided by operating activities, adjusted for expenditures on decommissioning liability, changes in non-cash working capital and interest on bank indebtedness. Total debt to cash flow ratio is calculated as indebtedness under Advantage's credit facilities plus working capital deficit divided by funds from operations. Operating netbacks are calculated by deducting royalties and operating costs from revenue on a unit (boe or mcfe) basis. Please see the Corporation s most recent Management s Discussion and Analysis, which is available at and for additional information about certain of these financial measures, including a reconciliation of funds from operations to cash provided by operating activities. 31
32 ADVISORY The following abbreviations used in this press release, including in the appendices hereto, have the meanings set forth below: bbls barrels mcf thousand cubic feet bbls/d barrels per day mmcf million cubic feet mmcf/d million cubic feet per day mbbls thousand barrels bcf billion cubic feet boe barrels of oil equivalent of natural gas, on the basis of 1 barrel of oil or NGLs for 6 thousand cubic feet of natural gas mboe thousands of barrels of oil equivalent tcf trillion cubic feet bcfe billion cubic feet of natural gas equivalent on the basis of 1 barrel of oil or NGLs to 6 thousand cubic feet of natural gas boe/d barrels of oil equivalent per day tcfe trillion cubic feet of natural gas equivalent on the basis of 1 barrel of oil to 6 thousand cubic feet of natural gas 2P NGLs proved plus probable reserves natural gas liquids Where any disclosure of reserves data and resources is made in this presentation that does not reflect all reserves of Advantage, the reader should note that the estimates of reserves, future net revenue and resources for individual properties or groups of properties may not reflect the same confidence level as estimates of reserves and future net revenue for all properties, due to the effects of aggregation. This presentation includes calculations of finding and development ("F&D") costs which have been calculated in accordance with Section 5.15 of NI by adding together exploration costs, development costs and the change in future development costs and dividing the sum by reserves additions. The aggregate of the exploration and development costs incurred in the most recent financial year and the change during that year in estimated future development costs generally will not reflect total finding and development costs related to reserve additions for that year. In this presentation certain financial and operating metrics of other issuers are presented tocompare such metrics to Advantage's results. Such other issuers were included toshow how Advantage's performance compares to some of its peers. The financial and operating metrics of such issuers have been obtained from public sources and have not been independently verified by Advantage. Readers should not base an investment decision for the securities of such issuers based on the information available herein. Advantage disclaims any responsibility or liability for the accuracy of the information relating to such other issuers presented herein. This presentation contains projections of production growth based on drilling and recompletion opportunities identified by management of Advantage. Certain of the drilling opportunities identified have no associated reserves or resources which can presently be classified as recoverable. As such the initial rates of production and reserves per well identified herein do not represent estimates of future production or reserves associated with the drilling opportunities. The initial rates of production, reserves per well and the capital costs associated with drilling and recompletion identified below are based on Advantage's historical results and analogous public information received from other producers using similar technologies as Advantage intends to use in the same or similar areas and formations. The initial rates of production, reserves per well and capital costs associated with the wells have been provided herein to give an indication of management's assumptions used for budgeting, planning and forecasting purposes. The initial rates of production, reserves and capital costs will most likely be different than projected. 32

33 ADVANTAGE CONTACT INFORMATION Investor Relations Listed on NYSE and TSX: AAV Advantage Oil & Gas Ltd. Suite 300, 440 2nd Avenue SW Calgary, Alberta T2P 5E9 Main: Facsimile: Advantage 100% W.I. Glacier Gas Plant Andy Mah, P.Eng. Craig Blackwood, C.A. Neil Bokenfohr, P.Eng. Director, President & Chief Executive Officer VP Finance & Chief Financial Officer Senior Vice President
OUR MONTNEY JOURNEY HAS BEEN SERVED WELL BY OUR GUIDING PRINCIPLES SINCE 2008
 Annual General Meeting May 26, 2016 OUR MONTNEY JOURNEY HAS BEEN SERVED WELL BY OUR GUIDING PRINCIPLES SINCE 2008 Develop Glacier in a Sustainable manner Maintain a Strong Balance Sheet
2016 Budget Targets 39% Production Growth, $0.75/mcf Total Cash Costs and 1.6x Debt to Cash AECO Cdn $2.50/mcf
 2016 Budget Targets 39% Production Growth, $0.75/mcf Total Cash Costs and 1.6x Debt to Cash Flow @ AECO Cdn $2.50/mcf Investor Presentation TSX / NYSE: AAV December 2015 ADVANTAGE AT A GLANCE TSX, NYSE:
Advantage Production Reaches 183 mmcfe/d Target During Commissioning of Expanded Glacier Plant in July Excess Standing Well Productivity &
 Advantage Production Reaches 183 mmcfe/d Target During Commissioning of Expanded Glacier Plant in July 2015. Excess Standing Well Productivity & Spare Plant Capacity Sets the Foundation for Low Risk Development
Low Risk Glacier Montney Development, Strong Balance Sheet & Hedging Program Supports Profitable & Sustainable Growth
 Low Risk Glacier Montney Development, Strong Balance Sheet & Hedging Program Supports Profitable & Sustainable Growth Investor Presentation TSX / NYSE: AAV September 2015 ADVANTAGE: AT A GLANCE Canadian
Glacier Montney Outperformance Improves Capital Efficiencies, Enables Lower Capital and Maintains Future Production Growth. Highly Efficient 2014
 Glacier Montney Outperformance Improves Capital Efficiencies, Enables Lower Capital and Maintains Future Production Growth. Highly Efficient 2014 Reserve Additions Reaffirms High Quality Glacier Asset.
Production Growth, Record Low Cash Costs of $0.75/mcfe & Top Quartile Well Results Underpins Glacier Plant Expansion Plans to 350 MMcf/d (58,330
 Production Growth, Record Low Cash Costs of $0.75/mcfe & Top Quartile Well Results Underpins Glacier Plant Expansion Plans to 350 MMcf/d (58,330 Boe/d) Investor Presentation TSX / NYSE: AAV June 2016 ADVANTAGE
Strengthened Balance Sheet with Industry leading Total Cash Costs of $0.77 per mcfe, capital efficiencies and strong hedging positions Advantage for
 Strengthened Balance Sheet with Industry leading Total Cash Costs of $0.77 per mcfe, capital efficiencies and strong hedging positions Advantage for continual organic growth. Investor Presentation TSX
Record Low Reserve Addition Costs of PDP $0.84/Mcfe in 2016 Tops Off A Stellar Year of Operating & Financial Results. Development Plan Growth to 316
 Record Low Reserve Addition Costs of PDP $0.84/Mcfe in 2016 Tops Off A Stellar Year of Operating & Financial Results. Development Plan Growth to 316 mmcfe/d (52,670 boe/d) Underway" Investor Presentation
42% Production Growth to 238 mmcfe/d (39,635 boe/d) and a 79% Increase in Cash Flow to $54 Million Fully Funded our Q Capital Program.
 and a 79% Increase in Cash Flow to $54 Million Fully Funded our Q Capital Program.") 42% Production Growth to 238 mmcfe/d (39,635 boe/d) and a 79% Increase in Cash Flow to $54 Million Fully Funded our Q1 2017 Capital Program. 39% Increase in Undeveloped Montney Land Adds to Long Term Development
42% Production Growth to 238 mmcfe/d (39,635 boe/d) and a 79% Increase in Cash Flow to $54 Million Fully Funded our Q1 2017 Capital Program. 39% Increase in Undeveloped Montney Land Adds to Long Term Development
CURRENT HEADLINES PAINT AN OVERLY NEGATIVE PICTURE FOR CANADIAN PRODUCERS
 Annual General Meeting May 25, 2017 CURRENT HEADLINES PAINT AN OVERLY NEGATIVE PICTURE FOR CANADIAN PRODUCERS 2 CREATING UNCERTAINTY, FEAR AND NOISE Sky is Falling Opportunity or Not 3 BUT DON T FORGET
Investor Presentation TSX, NYSE: AAV July, Page 1
 Pure Play Montney Producer with a proven operating team, industry leading cost structure & clear visibility to a significant drilling inventory creates a solid foundation for multi-year growth Investor
Annual Production Budget
 Strong Glacier Operating Results Generate Surplus Cash & Strengthens Balance Sheet to 0.7x D/CF as of June 30, 2017. Delineation Drilling Commenced on Undeveloped Montney Lands" Enercom Presentation Denver,
Solid Cash Flow with Increased Production and Lower Costs Maintains Balance Sheet at 1.0x D/CF at End of Q H Investment Will Set the
 Solid Cash Flow with Increased Production and Lower Costs Maintains Balance Sheet at 1.0x D/CF at End of Q3 2017. H2 2017 Investment Will Set the Stage for 2018 and Beyond Investor Presentation TSX / NYSE:
2018 Cash Flow Funded Capital Budget Increases Focus on Liquids Development & Growth Driven by Strong Well Results
 2018 Cash Flow Funded Capital Budget Increases Focus on Liquids Development & Growth Driven by Strong Well Results Investor Presentation TSX / NYSE: AAV January 2018 ADVANTAGE AT A GLANCE TSX 52-week trading
Low Cost 2017 Reserve Additions Replaced 433% of Production at a 2P F&D Cost of $0.84/mcfe ($5.04/boe) with a 35% Increase in Liquids Reserves
 with a 35% Increase in Liquids Reserves") Low Cost 2017 Reserve Additions Replaced 433% of Production at a 2P F&D Cost of $0.84/mcfe ($5.04/boe) with a 35% Increase in Liquids Reserves Investor Presentation TSX / NYSE: AAV February 2018 ADVANTAGE
Low Cost 2017 Reserve Additions Replaced 433% of Production at a 2P F&D Cost of $0.84/mcfe ($5.04/boe) with a 35% Increase in Liquids Reserves Investor Presentation TSX / NYSE: AAV February 2018 ADVANTAGE
Accelerating Condensate Development in the Heart of the Montney While Retaining Capital Flexibility
 Accelerating Condensate Development in the Heart of the Montney While Retaining Capital Flexibility Investor Presentation TSX: AAV March 2019 ADVANTAGE AT A GLANCE TSX 52-week trading range $1.80 - $4.80
Record Q Production & Three Year Plan to Accelerate Pipestone Condensate Development
 Record Q3 2018 Production & Three Year Plan to Accelerate Pipestone Condensate Development Investor Presentation TSX: AAV December 2018 ADVANTAGE AT A GLANCE TSX 52 week trading range $1.82 $5.73 Shares
Accelerating Condensate Development in the Heart of the Montney While Retaining Capital Flexibility
 Accelerating Condensate Development in the Heart of the Montney While Retaining Capital Flexibility Investor Presentation TSX: AAV April 2019 ADVANTAGE AT A GLANCE TSX 52-week trading range $1.80 - $4.80
Disposition of Non-Core Assets
 Press Release Page 1 of 5 Advantage Oil & Gas Ltd Advantage Announces Disposition of Non-core Assets, Glacier Montney Update, Appointment of Financial Advisors and Natural Gas Hedging for 2013 (TSX: AAV,
to announce Operating Results March 22, 2011 boe/d. $38.5 million to funds from cash flow for $45.1 million the increasing optimization of our other
 Press Release Advantage Oil & Gas Ltd Page 1 of 6 News Release Advantage Announces 2010 Year End Financial Results Glacier Production Exceeding 100 mmcf/d March 22, 2011 (TSX: AAV, NYSE: AAV) CALGARY,
Well Results at Valhalla, Wembley and Progress Confirm A Significant & Growing Liquids Rich Drill Inventory. First Wembley Well with Liquids Yield up
 Well Results at Valhalla, Wembley and Progress Confirm A Significant & Growing Liquids Rich Drill Inventory. First Wembley Well with Liquids Yield up to 277 bbls/mmcf & Condensate Yields up to 211 bbls/mmcf
Advantage Announces 2011 Year End Financial Results and Provides Interim Guidance
 Press Release Page 1 of 10 Advantage Oil & Gas Ltd Advantage Announces 2011 Year End Financial Results and Provides Interim Guidance (TSX: AAV, NYSE: AAV) CALGARY, ALBERTA, March 22, 2012 ( Advantage or
Lowering Natural Gas Production & Increasing Liquids Rich Drilling. Liquids Production Could Reach 13% or More of Total Production in 2020
 Lowering Natural Gas Production & Increasing Liquids Rich Drilling. Liquids Production Could Reach 13% or More of Total Production in 2020 Investor Presentation TSX / NYSE: AAV May 2018 ADVANTAGE AT A
Q First Quarter Report
 Q1 2017 First Quarter Report Financial and Operating Highlights 2017 2016 Financial ($000, except as otherwise indicated) Sales including realized hedging $ 72,957 $ 41,625 Funds from operations $ 53,972
Lowering Natural Gas Production & Increasing Liquids-Rich Development. Liquids Production Could Reach 13% or More of Total Production in 2020
 Lowering Natural Gas Production & Increasing Liquids-Rich Development. Liquids Production Could Reach 13% or More of Total Production in 2020 Investor Presentation TSX / NYSE: AAV August 2018 ADVANTAGE
A PROUD CANADIAN CLEAN ENERGY PRODUCER FOCUSED ON DEVELOPMENT OF ITS SIGNIFICANT MONTNEY NATURAL GAS AND LIQUIDS RESOURCE
 A PROUD CANADIAN CLEAN ENERGY PRODUCER FOCUSED ON DEVELOPMENT OF ITS SIGNIFICANT MONTNEY NATURAL GAS AND LIQUIDS RESOURCE Annual General Meeting May 29, 2018 CANADIAN E&P COMPANIES CHALLENGING TIMES BUT
2011 Annual Report. Non-Consolidated Financial and Operating Highlights (1) Year ended December 31, Three months ended December 31, 2010
 Year ended December 31, Three months ended December 31, 2010") 2011 Annual Report Non-Consolidated Financial and Operating Highlights (1) Three months ended December 31, 2011 Three months ended December 31, 2010 December 31, 2011 December 31, 2010 Financial ($000,
2011 Annual Report Non-Consolidated Financial and Operating Highlights (1) Three months ended December 31, 2011 Three months ended December 31, 2010 December 31, 2011 December 31, 2010 Financial ($000,
PETRUS RESOURCES ANNOUNCES FOURTH QUARTER AND YEAR END 2017 FINANCIAL & OPERATING RESULTS AND YEAR END RESERVE INFORMATION
 PETRUS RESOURCES ANNOUNCES FOURTH QUARTER AND YEAR END 2017 FINANCIAL & OPERATING RESULTS AND YEAR END RESERVE INFORMATION CALGARY, ALBERTA, Thursday, March 8 th, 2018 Petrus Resources Ltd. ( Petrus or
RMP Energy Reports Second Quarter 2017 Results and Provides Initial Elmworth Production Information
 RMP Energy Reports Second Quarter 2017 Results and Provides Initial Elmworth Production Information CALGARY, Alberta, Aug. 14, 2017 (GLOBE NEWSWIRE) -- RMP Energy Inc. ( RMP or the Company ) (TSX:RMP)
Q First Quarter Report
 Q1 2018 First Quarter Report Financial and Operating Highlights 2018 2017 Financial ($000, except as otherwise indicated) Sales including realized hedging $ 73,378 $ 72,957 Net income and comprehensive
Q Second Quarter Report
 Q2 2018 Second Quarter Report Financial and Operating Highlights 2018 2017 2018 2017 Financial ($000, except as otherwise indicated) Sales including realized hedging (3) $ 45,319 $ 69,169 $ 118,697 $ 142,126
indicated) per share ( per boe , , ,487 41, , , ,390 80,
 per share ( per boe , , ,487 41, , , ,390 80,") 2010 Annual Report Financial ($000, except as otherwise indicated) Revenue before royalties (1) (2) per share ( per boe Funds from operations (2) per share ( per boe Net income (loss) (2) per share ( Expenditures
2010 Annual Report Financial ($000, except as otherwise indicated) Revenue before royalties (1) (2) per share ( per boe Funds from operations (2) per share ( per boe Net income (loss) (2) per share ( Expenditures
DELPHI ENERGY ANNOUNCES CLOSING OF DISPOSITION OF WAPITI ASSETS
 DELPHI ENERGY ANNOUNCES CLOSING OF DISPOSITION OF WAPITI ASSETS CALGARY, ALBERTA July 22, 2015 Delphi Energy Corp. ( Delphi or the Company ) is pleased to report that it has closed the previously announced
DELPHI ENERGY RELEASES YEAR END 2015 RESERVES
 DELPHI ENERGY RELEASES YEAR END 2015 RESERVES CALGARY, ALBERTA February 29, 2016 Delphi Energy Corp. ( Delphi or the Company ) is pleased to report its crude oil and natural gas reserves information for
CHINOOK ENERGY INC. ANNOUNCES FOURTH QUARTER 2016 RESULTS AND PROVIDES OPERATIONAL UPDATE
 CHINOOK ENERGY INC. ANNOUNCES FOURTH QUARTER 2016 RESULTS AND PROVIDES OPERATIONAL UPDATE CALGARY, ALBERTA March 23, 2017 Chinook Energy Inc. ("our", "we", or "us") (TSX: CKE) is pleased to announce its
RMP Energy Provides Second Quarter 2012 Financial and Operating Results
 NEWS RELEASE August 9, 2012 RMP Energy Provides Second Quarter 2012 Financial and Operating Results Calgary, Alberta RMP Energy Inc. ( RMP or the Company ) (TSX:RMP) today provided its financial and operating
CONSOLIDATED MANAGEMENT S DISCUSSION & ANALYSIS The following Management s Discussion and Analysis ( MD&A ), dated as of March 25, 2015, provides a
, dated as of March 25, 2015, provides a") CONSOLIDATED MANAGEMENT S DISCUSSION & ANALYSIS The following Management s Discussion and Analysis ( MD&A ), dated as of March 25, 2015, provides a detailed explanation of the consolidated financial and
CONSOLIDATED MANAGEMENT S DISCUSSION & ANALYSIS The following Management s Discussion and Analysis ( MD&A ), dated as of March 25, 2015, provides a detailed explanation of the consolidated financial and
NOT FOR DISTRIBUTION TO U.S. NEWS WIRE SERVICES OR FOR DISSEMINATION IN THE U.S.
 NEWS RELEASE June 25, 2014 200, 707 7 Avenue SW Calgary, Alberta T2P 3H6 Telephone: (403) 262-1901 Facsimile (403) 262-1905 TSXV Trading Symbol: MVN OTC Trading Symbol: MDLNF NOT FOR DISTRIBUTION TO U.S.
CEQUENCE ENERGY ANNOUNCES OPERATIONAL UPDATE AND 2014 RESERVES AND FINANCIAL AND OPERATING RESULTS
 CEQUENCE ENERGY ANNOUNCES OPERATIONAL UPDATE AND 2014 RESERVES AND FINANCIAL AND OPERATING RESULTS CALGARY, March 5, 2015 Cequence Energy Ltd. ("Cequence" or the "Company") (TSX: CQE) is pleased to announce
Yangarra Announces Second Quarter 2018 Financial and Operating Results
 Suite 1530, 715 5 Avenue S.W. Calgary, Alberta T2P 2X6 Phone: (403) 262-9558 Fax: (403) 262-8281 Webpage: www.yangarra.ca Email: info@yangarra.ca August 8, Yangarra Announces Second Quarter Financial and
2017 Annual Report. Financial and Operating Highlights
 2017 Annual Report Financial and Operating Highlights Three months ended 2017 2016 2017 2016 Financial ($000, except as otherwise indicated) Sales including realized hedging $ 65,779 $ 71,090 $ 259,611
NEWS RELEASE. March 21, 2017
 NEWS RELEASE March 21, 2017 RMP Energy Provides Operations Update Highlighting Elmworth Delineation Success, Updates Market Guidance and Reports Year-End Reserves and Fiscal 2016 Financial Results Calgary,
For Immediate Release Granite Oil Corp. Announces 2017 Record Year End Reserve Metrics and Operational Update
 For Immediate Release Granite Oil Corp. Announces 2017 Record Year End Reserve Metrics and Operational Update CALGARY, ALBERTA (Marketwired March 7, 2018) GRANITE OIL CORP. ( Granite or the Company ) (TSX:GXO)(OTCQX:GXOCF)
KELT REPORTS SIGNIFICANT INCREASES IN RESERVES AND PRODUCTION IN 2014
 PRESS RELEASE (Stock Symbol KEL TSX) February 10, 2015 Calgary, Alberta KELT REPORTS SIGNIFICANT INCREASES IN RESERVES AND PRODUCTION IN 2014 Kelt Exploration Ltd. ( Kelt or the Company ) has released
CEQUENCE ENERGY LTD. ANNOUNCES OVER 36 % GROWTH IN RESERVES AND RESERVE VALUE AND FOURTH QUARTER AND YEAR END 2011 RESULTS
 CEQUENCE ENERGY LTD. ANNOUNCES OVER 36 % GROWTH IN RESERVES AND RESERVE VALUE AND FOURTH QUARTER AND YEAR END 2011 RESULTS CALGARY, March 8, 2012 Cequence Energy Ltd. ("Cequence" or the "Company") (TSX:
CEQUENCE ENERGY ANNOUNCES 2015 INDEPENDENT RESERVES EVALUATION
 CEQUENCE ENERGY ANNOUNCES 2015 INDEPENDENT RESERVES EVALUATION CALGARY, February 22, 2016 Cequence Energy Ltd. ("Cequence" or the "Company") (TSX: CQE) is pleased to announce the results of its year end
PETRUS RESOURCES ANNOUNCES SECOND QUARTER 2018 FINANCIAL & OPERATING RESULTS
 PETRUS RESOURCES ANNOUNCES SECOND QUARTER 2018 FINANCIAL & OPERATING RESULTS CALGARY, ALBERTA, Thursday, August 9 th, 2018 Petrus Resources Ltd. ( Petrus or the Company ) is pleased to report financial
September 28, 2018 SEPTEMBER PRESENTATION
 September 28, 2018 SEPTEMBER PRESENTATION BIGSTONE PROLIFIC, LIQUIDS RICH MONTNEY Pure play MONTNEY E&P company with WORLD CLASS ASSETS: Successful delineation drilling to the west and south Growing condensate
PAINTED PONY ANNOUNCES A 52% INCREASE IN PROVED PLUS PROBABLE RESERVES TO 1.7 TCFE WITH A NET PRESENT VALUE DISCOUNTED AT 10% OF $1.
 1 FOR IMMEDIATE RELEASE March 4, 2014 PAINTED PONY ANNOUNCES A 52% INCREASE IN PROVED PLUS PROBABLE RESERVES TO 1.7 TCFE WITH A NET PRESENT VALUE DISCOUNTED AT 10% OF $1.5 BILLION March 4, 2014 Calgary,
CEQUENCE ENERGY ANNOUNCES OPERATIONAL UPDATE, 2016 FINANCIAL AND OPERATING RESULTS AND RESERVES
 CEQUENCE ENERGY ANNOUNCES OPERATIONAL UPDATE, 2016 FINANCIAL AND OPERATING RESULTS AND RESERVES CALGARY, March 13, 2017 Cequence Energy Ltd. ("Cequence" or the "Company") (TSX: CQE) is pleased to provide
BUILT TO LAST. April 2016
 BUILT TO LAST April 2016 Built to Last Low Debt Low Decline Strong Capital Efficiencies 2 Cardinal Energy Profile Shares Outstanding (1) TSX: CJ Basic 65,124,209 ergy Ltd. Fully Diluted 67,595,248 Annual
May 2018 HIGH-MARGIN, LIQUIDS-RICH PRODUCTION IN THE WORLD- CLASS MONTNEY BIGSTONE REGION
 May 2018 HIGH-MARGIN, LIQUIDS-RICH PRODUCTION IN THE WORLD- CLASS MONTNEY BIGSTONE REGION WHY OWN DELPHI. Pure play MONTNEY E&P company with WORLD CLASS ASSETS: Robust well economics driven by: High condensate
INPLAY OIL CORP. ANNOUNCES 2016 YEAR END RESERVES AND AN OPERATIONS UPDATE
 March 14, 2017 INPLAY OIL CORP. ANNOUNCES 2016 YEAR END RESERVES AND AN OPERATIONS UPDATE CALGARY, ALBERTA (March 14, 2017) InPlay Oil Corp. ("InPlay" or the "Company") (TSX:IPO) is pleased to present
DELPHI ENERGY CORP. REPORTS 2018 YEAR END RESERVES
 DELPHI ENERGY CORP. REPORTS 2018 YEAR END RESERVES CALGARY, ALBERTA March 4, 2019 Delphi Energy Corp. ( Delphi or the Company ) is pleased to announce its crude oil and natural gas reserves information
RMP Energy Announces $80 Million Disposition of Assets and Name Change
 RMP Energy Announces $80 Million Disposition of Assets and Name Change CALGARY, Alberta, Sept. 01, 2017 (GLOBE NEWSWIRE) -- RMP Energy Inc. ( RMP or the Company ) (TSX:RMP) is pleased to announce that
Athabasca Oil Corporation Announces 2018 Year end Results
 FOR IMMEDIATE RELEASE March 6, 2019 Athabasca Oil Corporation Announces 2018 Year end Results CALGARY Athabasca Oil Corporation (TSX: ATH) ( Athabasca or the Company ) is pleased to provide its 2018 year
CEQUENCE ENERGY ANNOUNCES 35% GROWTH IN RESERVES AND 2012 FINANCIAL AND OPERATING RESULTS
 CEQUENCE ENERGY ANNOUNCES 35% GROWTH IN RESERVES AND 2012 FINANCIAL AND OPERATING RESULTS CALGARY, March 7, 2013 Cequence Energy Ltd. ("Cequence" or the "Company") (TSX: "CQE") is pleased to announce its
CRESCENT POINT ANNOUNCES STRATEGIC CONSOLIDATION ACQUISITION OF CORAL HILL ENERGY LTD. AND UPWARDLY REVISED 2015 GUIDANCE
 PRESS RELEASE CRESCENT POINT ANNOUNCES STRATEGIC CONSOLIDATION ACQUISITION OF CORAL HILL ENERGY LTD. AND UPWARDLY REVISED 2015 GUIDANCE July 2, 2015 CALGARY, ALBERTA. Crescent Point Energy Corp. ( Crescent
RMP Energy Announces Record Quarterly Cash Flow and Production
 NEWS RELEASE May 14, 2014 RMP Energy Announces Record Quarterly Cash Flow and Production Calgary, Alberta RMP Energy Inc. ( RMP or the Company ) (TSX:RMP) is pleased to announce for the three months ended
Advantage Announces Creation of an Oil-weighted Subsidiary Longview Oil Corp. Longview Files Preliminary Prospectus for IPO
 NOT FOR DISTRIBUTION TO THE U.S. NEWS WIRES SERVICES OR DISSEMINATION IN THE UNITED STATES March 7, 2011 Advantage Announces Creation of an Oil-weighted Subsidiary Longview Oil Corp. Longview Files Preliminary
Yangarra Announces 2017 Year End Corporate Reserves Information
 Suite 1530, 715 5 Avenue S.W. Calgary, Alberta T2P 2X6 Phone: (403) 262-9558 Fax: (403) 262-8281 Webpage: www.yangarra.ca Email: info@yangarra.ca February 13, 2018 Yangarra Announces 2017 Year End Corporate
April 2018 HIGH-MARGIN, LIQUIDS-RICH PRODUCTION IN THE WORLD- CLASS MONTNEY BIGSTONE REGION
 April 2018 HIGH-MARGIN, LIQUIDS-RICH PRODUCTION IN THE WORLD- CLASS MONTNEY BIGSTONE REGION WHY OWN DELPHI. Pure play MONTNEY E&P company with WORLD CLASS ASSETS: Robust well economics driven by: High
LGX OIL + GAS INC. ANNOUNCES YEAR-END RESERVES AND FINANCIAL RESULTS AND FILING OF ANNUAL INFORMATION FORM
 NEWS RELEASE April 22, 2016 LGX OIL + GAS INC. ANNOUNCES YEAR-END RESERVES AND FINANCIAL RESULTS AND FILING OF ANNUAL INFORMATION FORM CALGARY, ALBERTA (April 22, 2016) LGX Oil + Gas Inc. ( LGX or the
RMP Energy Announces Strong Third Quarter Financial Results Underpinned by Record Quarterly Production
 NEWS RELEASE November 12, 2014 RMP Energy Announces Strong Third Quarter Financial Results Underpinned by Record Quarterly Production Calgary, Alberta RMP Energy Inc. ( RMP or the Company ) (TSX: RMP)
CRESCENT POINT ANNOUNCES SASKATCHEWAN VIKING CONSOLIDATION ACQUISITION AND UPWARDLY REVISED GUIDANCE FOR 2014
 PRESS RELEASE CRESCENT POINT ANNOUNCES SASKATCHEWAN VIKING CONSOLIDATION ACQUISITION AND UPWARDLY REVISED GUIDANCE FOR 2014 June 12, 2014 CALGARY, ALBERTA. Crescent Point Energy Corp. ( Crescent Point
BELLATRIX EXPLORATION LTD. ANNOUNCES FOURTH QUARTER 2018 AND YEAR END FINANCIAL AND OPERATING RESULTS
 For Immediate Release TSX: BXE BELLATRIX EXPLORATION LTD. ANNOUNCES FOURTH QUARTER 2018 AND YEAR END FINANCIAL AND OPERATING RESULTS CALGARY, ALBERTA (March 14, 2019) - Bellatrix Exploration Ltd. ( Bellatrix,
CANADIAN NATURAL RESOURCES LIMITED ANNOUNCES 2016 YEAR END RESERVES CALGARY, ALBERTA FEBRUARY 14, 2017 FOR IMMEDIATE RELEASE
 CANADIAN NATURAL RESOURCES LIMITED ANNOUNCES 2016 YEAR END RESERVES CALGARY, ALBERTA FEBRUARY 14, 2017 FOR IMMEDIATE RELEASE Canadian Natural Resources Limited ( Canadian Natural or the Company ) is pleased
TSX V: HME. Achieved a two year average F&D cost of $9.22/boe (including changes in FDC) for a recycle ratio of 1.8.
 for a recycle ratio of 1.8.") HEMISPHERE ENERGY INCREASES PROVED PLUS PROBABLE RESERVE VALUE BY 77% TO $116.6 MILLION (DISCOUNTED AT 10%), AND NET ASSET VALUE BY 68% TO $1.12 PER SHARE TSX V: HME Vancouver, British Columbia, March
HEMISPHERE ENERGY INCREASES PROVED PLUS PROBABLE RESERVE VALUE BY 77% TO $116.6 MILLION (DISCOUNTED AT 10%), AND NET ASSET VALUE BY 68% TO $1.12 PER SHARE TSX V: HME Vancouver, British Columbia, March
BAYTEX ANNOUNCES CLOSING OF STRATEGIC COMBINATION WITH RAGING RIVER, UPDATED 2018 GUIDANCE AND CONFIRMATION OF PRELIMINARY 2019 PLANS
 BAYTEX ANNOUNCES CLOSING OF STRATEGIC COMBINATION WITH RAGING RIVER, UPDATED 2018 GUIDANCE AND CONFIRMATION OF PRELIMINARY 2019 PLANS CALGARY, ALBERTA (August 22, 2018) Baytex Energy Corp. ( Baytex )(TSX,
Eagle Energy Trust Announces $15.0 Million 2015 Capital Budget, 2015 Guidance and 2015 Distribution
 NEWS RELEASE FOR IMMEDIATE RELEASE Eagle Energy Trust Announces $15.0 Million 2015 Capital Budget, 2015 Guidance and 2015 Distribution Calgary, Alberta December 17, 2014 - (TSX: EGL.UN): Eagle Energy Trust
Peters & Co North American Oil & Gas Conference September 11, 2012 The Game Plan Robert J. Waters, Senior Vice-President and Chief Financial
 Peters & Co. 2012 North American Oil & Gas Conference September 11, 2012 The Game Plan Robert J. Waters, Senior Vice-President and Chief Financial Officer Corporate Profile Ticker Symbol (TSX & NYSE) ERF
PETRUS RESOURCES ANNOUNCES THIRD QUARTER 2018 FINANCIAL & OPERATING RESULTS
 PETRUS RESOURCES ANNOUNCES THIRD QUARTER 2018 FINANCIAL & OPERATING RESULTS CALGARY, ALBERTA, Thursday, November 8 th, 2018 Petrus Resources Ltd. ( Petrus or the Company ) is pleased to report financial
Corporate Presentation. March 2018
 Corporate Presentation March 218 Advisory Regarding Forward-Looking Information and Statements This presentation contains forward-looking statements and forward-looking information within the meaning of
FORM F1 STATEMENT OF RESERVES DATA AND OTHER OIL AND GAS INFORMATION. Year Ended December 31, 2016
 FORM 51-101F1 STATEMENT OF RESERVES DATA AND OTHER OIL AND GAS INFORMATION Year Ended December 31, 2016 March 2, 2017 TABLE OF CONTENTS DATE OF STATEMENT AND RELEVANT DATES... 1 DISCLOSURE OF RESERVES
CHINOOK ENERGY INC. ANNOUNCES SECOND QUARTER 2017 RESULTS
 CHINOOK ENERGY INC. ANNOUNCES SECOND QUARTER 2017 RESULTS CALGARY, ALBERTA August 10, 2017 Chinook Energy Inc. ("our", "we", or "us") (TSX: CKE) is pleased to announce its second quarter 2017 financial
January 2018 HIGH-MARGIN, LIQUIDS-RICH PRODUCTION IN THE WORLD- CLASS MONTNEY BIGSTONE REGION
 January 2018 HIGH-MARGIN, LIQUIDS-RICH PRODUCTION IN THE WORLD- CLASS MONTNEY BIGSTONE REGION WHY OWN DELPHI. Pure play MONTNEY E&P company with WORLD CLASS ASSETS: Robust well economics driven by: High
BELLATRIX ANNOUNCES 2018 YEAR END RESERVES HIGHLIGHTED BY 13% RESERVE GROWTH AND LOW COST RESERVE ADDITIONS
 For Immediate Release Calgary, Alberta TSX: BXE BELLATRIX ANNOUNCES 2018 YEAR END RESERVES HIGHLIGHTED BY 13% RESERVE GROWTH AND LOW COST RESERVE ADDITIONS CALGARY, ALBERTA (March 14, 2019) Bellatrix Exploration
Premium Pipestone Asset Acquisition. August 9, 2018
 Premium Pipestone Asset Acquisition August 9, 2018 READER ADVISORY GENERAL A final short form prospectus containing important information relating to the offering (the "Offering") of subscription receipts
TSXV: TUS September 8, 2015
 TSXV: TUS September 8, 2015 TSXV: TUS SEPTEMBER 8, 2015 2 Why Buy Tuscany Now? Tuscany has built a large inventory of horizontal oil locations on properties with significant potential oil in place 80 to
SUSTAINABLE DIVIDEND & GROWTH September 2018
 SUSTAINABLE DIVIDEND & GROWTH September 2018 Cardinal Profile Shares Outstanding TSX: CJ Basic (1) Diluted (excluding debentures) 114.2 MM 117.9 MM 2018 Annual Dividend ($/share) $0.42 2018 Average Production
Bengal Energy Announces Fourth Quarter and Fiscal 2018 Year End and Reserve Results
 June 19, 2018 Bengal Energy Announces Fourth Quarter and Fiscal 2018 Year End and Reserve Results Calgary, Alberta Bengal Energy Ltd. (TSX: BNG) ("Bengal" or the "Company") today announces its financial
SPARTAN ENERGY CORP. ANNOUNCES STRATEGIC SOUTHEAST SASKATCHEWAN LIGHT OIL ACQUISITION
 Suite 500, 850 2 nd Street SW Calgary, AB T2P 0R8 Canada Ph.: (403) 355-8920 Fax: (403) 355-2779 SPARTAN ENERGY CORP. ANNOUNCES STRATEGIC SOUTHEAST SASKATCHEWAN LIGHT OIL ACQUISITION CALGARY, ALBERTA (May
Scotiabank CAPP Conference April 2016 CORPORATE PRESENTATION
 Scotiabank CAPP Conference April 2016 CORPORATE PRESENTATION DISCLAIMER Certain information regarding RMP Energy Inc. ( RMP ) (the Company ) contained within this corporate presentation may constitute
NEWS RELEASE MARCH 6, 2018 TOURMALINE GROWS 2017 CASH FLOW BY 65%, DELIVERS EARNINGS OF $346.8 MILLION, AND ANNOUNCES INAUGURAL DIVIDEND IN Q1 2018
 NEWS RELEASE MARCH 6, 2018 TOURMALINE GROWS 2017 CASH FLOW BY 65%, DELIVERS EARNINGS OF $346.8 MILLION, AND ANNOUNCES INAUGURAL DIVIDEND IN Q1 2018 Calgary, Alberta - Tourmaline Oil Corp. (TSX:TOU) ("Tourmaline"
DELPHI ENERGY CORP. REPORTS 2017 YEAR END RESULTS AND RESERVES AND PROVIDES OPERATIONS UPDATE
 DELPHI ENERGY CORP. REPORTS 2017 YEAR END RESULTS AND RESERVES AND PROVIDES OPERATIONS UPDATE CALGARY, ALBERTA March 7, 2018 Delphi Energy Corp. ( Delphi or the Company ) is pleased to announce its financial
NEWS RELEASE FEBRUARY 14, 2018 TOURMALINE ADDS 558 MMBOE OF 2P RESERVES, GROWS LIQUID RESERVES BY 73% AND 2P RESERVE VALUE BY $2.
 NEWS RELEASE FEBRUARY 14, 2018 TOURMALINE ADDS 558 MMBOE OF 2P RESERVES, GROWS LIQUID RESERVES BY 73% AND 2P RESERVE VALUE BY $2.4 BILLION (1) Calgary, Alberta - Tourmaline Oil Corp. (TSX:TOU) ( Tourmaline
SURVIVE TO THRIVE 2016 CAPP SCOTIABANK INVESTMENT SYMPOSIUM
 SURVIVE TO THRIVE 2016 CAPP SCOTIABANK INVESTMENT SYMPOSIUM April 12, 2016 1 CORPORATE PROFILE Corporate Summary Q4/2015 Avg. Daily Production 67,934 boe/d Production Mix 1 ~60% liquids/40% gas Corporate
Year-end 2017 Reserves
 Year-end 2017 Reserves Baytex's year-end 2017 proved and probable reserves were evaluated by Sproule Unconventional Limited ( Sproule ) and Ryder Scott Company, L.P. ( Ryder Scott ), both independent qualified
Driving New Growth TSX:PGF. Peters & Co Presentation September 11, 2018
 Driving New Growth Peters & Co Presentation September 11, 2018 Advisories Caution Regarding Forward Looking Information: This presentation contains forward-looking statements within the meaning of securities
NEWS RELEASE NOVEMBER 7, 2018
 NEWS RELEASE NOVEMBER 7, 2018 TOURMALINE DELIVERS STRONG Q3 EARNINGS AND CASH FLOW GROWTH, INCREASES 2018 EXIT AND 2019 PRODUCTION ESTIMATES AND REDUCES 2019 CAPITAL PROGRAM Calgary, Alberta - Tourmaline
SUSTAINABLE DIVIDEND & GROWTH May 2018
 SUSTAINABLE DIVIDEND & GROWTH May 2018 Cardinal Profile Shares Outstanding TSX: CJ Basic (1) Fully Diluted (excluding debentures) 110.8 MM 114.0 MM 2018 Annual Dividend ($/share) $0.42 2018 Average Production
May 22, 2018 AGM PRESENTATION
 May 22, 2018 AGM PRESENTATION BIGSTONE PROLIFIC, LIQUIDS RICH MONTNEY Pure play MONTNEY E&P company with WORLD CLASS ASSETS: Successful delineation drilling to the west and south Growing condensate production
Corporate Presentation. August 2016
 Corporate Presentation August 2016 Future Oriented Information (See additional advisories at the end of this document) In the interest of providing information regarding Paramount Resources Ltd. ("Paramount"
Eagle Energy Trust Trims 2015 Capital Budget, Maintains Distribution, Production and Cash Flow Guidance and Announces Expanded Credit Facility
 NEWS RELEASE FOR IMMEDIATE RELEASE Eagle Energy Trust Trims 2015 Capital Budget, Maintains Distribution, Production and Cash Flow Guidance and Announces Expanded Credit Facility Calgary, Alberta February
Corporate Presentation, November 2017
 Corporate Presentation, November 2017 Advisory This presentation is for informational purposes only and is not intended as a solicitation or offering of securities of Traverse Energy Ltd. ( Traverse or
18-10 November 14, 2018
 18-10 November 14, 2018 BIRCHCLIFF ENERGY LTD. ANNOUNCES STRONG THIRD QUARTER 2018 RESULTS, STRATEGIC MONTNEY LAND ACQUISITION IN POUCE COUPE AND PRELIMINARY 2019 PLANS Calgary, Alberta Birchcliff Energy
CEQUENCE ENERGY ANNOUNCES 2015 FINANCIAL AND OPERATING RESULTS
 CEQUENCE ENERGY ANNOUNCES 2015 FINANCIAL AND OPERATING RESULTS CALGARY, March 29, 2015 Cequence Energy Ltd. ("Cequence" or the "Company") (TSX: CQE) is pleased to announce its operating and financial results
FIRST QUARTER REPORT HIGHLIGHTS
 FIRST QUARTER REPORT For the three months ended March 31, 2018 Petrus Resources Ltd. ( Petrus or the Company ) (TSX: PRQ) is pleased to report financial and operating results for the first quarter of 2018.
GMP FirstEnergy - Energy Growth Conference November 15, 2016 Toronto, Ontario. Senior Vice President, Capital Markets & Public Affairs
 GMP FirstEnergy - Energy Growth Conference November 15, 2016 Toronto, Ontario Brian Ector Senior Vice President, Capital Markets & Public Affairs Advisory Forward-Looking Statements In the interest of
News Release March 7, Parex Resources Announces 2016 Fourth Quarter and Full Year Results
 News Release March 7, 2017 Parex Resources Announces 2016 Fourth Quarter and Full Year Results Calgary, Canada Parex Resources Inc. ( Parex or the Company ) (TSX:PXT) is pleased to announce its financial