Low Cost 2017 Reserve Additions Replaced 433% of Production at a 2P F&D Cost of $0.84/mcfe ($5.04/boe) with a 35% Increase in Liquids Reserves
|
|
|
- Alexander Perkins
- 5 years ago
- Views:
Transcription
 with a 35% Increase in Liquids Reserves Investor Presentation TSX / NYSE: AAV February")
1 Low Cost 2017 Reserve Additions Replaced 433% of Production at a 2P F&D Cost of $0.84/mcfe ($5.04/boe) with a 35% Increase in Liquids Reserves Investor Presentation TSX / NYSE: AAV February 2018


 2018 Guidance (10% Growth)")

 $202")
2 ADVANTAGE AT A GLANCE TSX 52-week trading range $ $9.29 Shares Outstanding (basic) 186 million Market Capitalization $0.8 billion 2017 Production Estimate (16% Growth) 236 mmcfe/d (39,330 boe/d) 2018 Guidance (10% Growth) 255 to 265 mmcfe/d (42,500 to 44,170 boe/d) 2018 Total Cash Costs $1.10/mcfe ($6.60/boe) Estimated as of December 31, 2017: Bank Debt (51% drawn on $400 million Credit Facility) $202 million Total Debt (including working capital deficit) $222 million Total Debt/Trailing 12 Month Cash Flow 1.2x 2
 Glacier Development will continue for decades. Initial delineation drilling at Valhalla, Wembley & Progress underway.")
 Wembley/ Pipestone (28 sections) Total 184 net Montney sections (117,760 acres) Total 94 net sections at Valhalla, Wembley & Progress")
3 B.C. Alberta MONTNEY LAND HOLDINGS PROVIDES GROWTH AND UPSIDE VALUE OPPORTUNITIES FOR DECADES Progress (30 sections) Glacier 90 net sections 100% owned Glacier Gas Plant Valhalla (36 sections) Glacier Development will continue for decades. Initial delineation drilling at Valhalla, Wembley & Progress underway. Up to 5 layers of dry and liquids rich gas with a future drilling inventory >1,200 locations Recent 4 well pad success 6,410 boe/d (32 mmcf/d gas + 1,075 bbls/d liquids) with certain yields >100 bbls/mmcf, 90% C5/oil) Wembley/ Pipestone (28 sections) Total 184 net Montney sections (117,760 acres) Total 94 net sections at Valhalla, Wembley & Progress acquired for a total of $18 million since


4 OUR STRATEGY VALUE CREATION THROUGH DISCIPLINED CAPITAL INVESTMENT Operating Flexibility World Class Montney Asset Own & Operate 100% Plant & Infrastructure VALUE CREATION Financial Flexibility - Strong Balance Sheet Industry Leading Low Cost Gas Supply Hedging & Market Diversification 4
 $1.")
5 SIGNIFICANT OPTIONALITY FOR 2018 AND BEYOND THROUGH FINANCIAL & OPERATIONAL FLEXIBILITY F I N A N CI A L (1) $1.10Cdn/mcfe 28% % of 2018 Revenue exposed to AECO prices 37% % of 2018 Hedges at average Cdn $3.21/mcf Total Corporate cash costs (includes transportation) $1.20Cdn/mcf AECO price to maintain production at x to 1.4x 2018 Total Debt to Trailing Cash Flow (AECO Cdn $1.50/mcf to $1.75/mcf) O PE R A TI N G (1) 8/18/50% # current completed / uncompleted wells / % liquids rich <4% Of liquids rich acreage drilled to date >1,200 Current drill inventory (Glacier & Valhalla only) 100% Ownership of Glacier gas plant & pipeline Infrastructure (significant process capacity to accommodate years of growth) <26% Decline rate/annum Gas Gathering System Connected to Valhalla, extendable to Wembley / Progress areas TCPL/Alliance Connected to both sales pipes (Q Alliance) Notes: (1) Management estimates or illustrated in following presentation pages 5
6 2018 CASH FLOW FUNDED BUDGET FOCUSES ON LIQUIDS GROWTH & RETAINS FLEXIBLITY ($ million) Glacier $30 $145 Valhalla, Wembley, Progress 2018 Highlights (1) (2) $175 to $200 Million Cash Flow & Positive Income 1.0 to 1.3x Year-end 2018 Total Debt/Cash Flow $175 Well Operations $80 Plant & Value Add Facilities $85 Other, $ Capital Estimate $175-$ Cash Flow 260 MMcfe/d (43,330 Boe/d) Average Production 255 to 265 mmcfe/d Annual Range 10% Annual Production Growth 50% Annual Liquids Production Growth to 1,900 bbls/d (73% C5 + ) $30 Million to Advance Liquids Development at Valhalla, Wembley and Progress Complete Glacier Gas Plant Expansion to 400 mmcf/d & 6,800 bbls/d of liquids extraction $1.10/mcfe Total Cash Costs Including Transportation $11,400/boe/d All-In Capital Efficiency (1) Midpoint of 2018 Guidance Range. (2) Based on an average AECO Cdn $1.75/mcf to $2.25/mcf ($1.66/GJ to $2.13/GJ) natural gas price for 2018 and Advantage s current hedge positions 6
 $17,000-32% $11,500 AECO $1.50/mcf AECO $2.")
7 2018 BUDGET AT A GLANCE 203 Annual Average Production (mmcfe/d) 16% % Liquids Production (bbls/d) 50% 1,900 32% 1,250 2,400 $128 Capital ($ million) $249-30% $ E 2018E E 2018E 2018Exit E 2018E Total Debt to Trailing Cash Flow Sensitivity % 3yr average $11,950 ALL-IN Capital Efficiency ($/boe/d) $17,000-32% $11,500 AECO $1.50/mcf AECO $2.00/mcf AECO $2.50/mcf 0.8 $7, E NOTES: 2018E E 2018E (1) Transportation costs shown includes natural gas transportation for all years. Prior to November 2016, our financial reports included gas transportation as a deduction to revenue. (2) Includes Dawn transportation costs effective November 2017 for direct sales to the Dawn, Ontario hub realizing higher revenue. (3) Capital Efficiency calculated using 28% per annum decline and includes all annual capital. (3) 7
8 STRONG NATURAL GAS FIXED PRICE HEDGES $/Mcf Cdn $4.42 $3.11 $4.42 $3.18 $3.21 % of estimated natural gas production, net of royalties $3.07 $3.08 $3.67 $2.89 $2.99 $4.01 $ Q Q Calendar 2019 Calendar AECO Fixed Dawn Fixed Advantage has exposure to commodity price risk at various market hubs and has fixed prices at multiple markets. These prices represent average Cdn prices based on fixed price hedges secured to date converted at an average Fx of $

9 MARKET & REVENUE DIVERSIFICATION - 28% REVENUE EXPOSURE TO AECO PRICES IN 2018 ADVANTAGE S 2018 TOTAL REVENUE IS 28% EXPOSED TO AECO PRICES 19% 11% 17% 28% 6% 15% 39% 8% AECO 11% 18% Henry Hub Liquids 53% 40% 19% Dawn 16% Fixed Price 2017 Q4 2018E 2019E Graph represents % of estimated revenue based on strip pricing at December 10,
 MAINTENANCE CAPITAL $115 million CASH FLOW $115 Million Cash Surplus $100 million per Year Based on top")
10 MAINTENANCE CAPITAL AND SURPLUS CASH FLOW SENSITIVITY ILLUSTRATIVE AT 280 MMCFE/D (Q4 2018) (NO HEDGING INCLUDED) Surplus Cash Flow Above $1.20/mcf 3 Year Cumulative Surplus $300 million $215 Million Based on average well type curve (1) MAINTENANCE CAPITAL $115 million CASH FLOW $115 Million Cash Surplus $100 million per Year Based on top quartile type well (2) $95 million 280 mmcfe/d Q Notes AECO $1.20/Mcf (3) Cash Flow at AECO $2.50/Mcf (1) Assumes 7.5 mmcf/d /7.5 Bcf for Upper/Lower Montney wells and 5.0 mmcf/d /5.0 Bcf for Middle Montney wells (2) Assumes 9 mmcf/d /9 Bcf for Upper/Lower Montney wells and 6 mmcf/d /6 Bcf for Middle Montney wells (3) Assumes Dawn at $3.30/mcf and a WTI price of $55 US/bbl. 10
11 $/mcfe $/Mcfe Profit Margin [%] Profit Margin [%] ATTRACTIVE NETBACKS & RECYCLE RATIOS ARE ACHIEVABLE WITHOUT HEDGING $7.00 AAV s industry leading low costs generates a top tier profit margin amongst dry or rich gas producers 50% Glacier Netbacks NO HEDGING INCLUDED Illustrative AECO Cdn $1.75/mcf Illustrative AECO Cdn $2.25/mcf $ % Revenue (1) $2.53 $2.94 $5.00 $4.00 $3.00 $ % 20% 10% 0% Royalties ($0.10) ($0.13) Operating Costs ($0.27) Transportation Costs (2) ($0.55) ($0.27) ($0.55) Operating Netback $1.61 $1.99 G&A ($0.09) ($0.09) Finance & other ($0.10) ($0.10) $1.00 $0.00 AAV VII TET KEL NVA CR TOU BIR PPY PEY AAV PDP PDP FD&A FD&A 2017E 2017E Cash Cash Costs Costs (Ex. Hedging) (Ex. Hedging) 2017E Gross Revenue ($/mcfe) Estimated Profit Margin (%) -10% -20% Cash Flow Netback $/mcfe $/Boe Recycle Ratio based on 3 Year Average 2P $0.52/mcfe (3) $1.42 $8.52 $1.80 $ x 3.4x Source: TD Securities (August 23, 2017) (1) Includes Dawn revenue, Natural Gas & Liquids revenue and adjustments for heat value (realized price). (2) Includes liquids transportation costs of $0.04/mcfe, AECO gas transportation costs of $0.29/mcfe and AECO to Dawn transportation costs of $1.10/mcfe. (3) 2P F&D includes Future Development Capital and is based on Sproule s 2015, 2016 and 2017 year-end 2P reserves reports. 11
12 NATURAL GAS TRANSPORTATION SERVICE SECURED TCPL Transportation Service 363 mmcf/d as of April, 2020 Increasing firm service secured to 2020 Ability to reduce future total service commitments through evergreen contract renewals Sales Gas Target Firm Contracted Service IT Service Estimate Alliance Pipeline Connection Proceeding TCPL New Alliance meter station planned for 2018 Provides future access to U.S. Midwest markets Glacier gas plant Alliance Proceeding with Alliance meter station connection for 2018 TCPL Meter Station Alliance Meter Station 12


13 ONGOING VALUE CREATION FROM OUR HIGH QUALITY ASSETS THROUGH OPERATIONAL EXCELLENCE 13

14 ADVANTAGE S LAND BLOCKS ARE IN A LIQUIDS RICH MONTNEY FAIRWAY Progress Glacier Valhalla Wembley Glacier Progress Upper Montney (Dry at Glacier to C3+ 40 bbls/mmcf at Valhalla) Middle Montney (C3+ 20 to >100 bbls/mmcf. 50% to 90% C5+/Oil) Valhalla Wembley Lower Montney (C3+ 0 to 10 bbls/mmcf) Source: Canadian Discovery Digest/Advantage Source: Canadian Discovery Digest/Advantage Recent Advantage Evaluation/Delineation wells Wells drilled within last 18 months 14
 Lower 51 Middle 31 Upper 115 >900 Glacier & Valhalla Undrilled Liquids Rich intervals Ranges from C3+ yields of 20 to >100 bbls/mmcf (45% to")
 Based on Sproule December 31, 2017 Reserves Report (3) As of December 31, 2017, gross Hz wells (includes producing and standing developed wells) >1,200 Future Drilling Locations")
15 SIGNIFICANT AND GROWING LIQUIDS & DRY GAS DRILLING INVENTORY Multi-Layer Montney Development Potential across Advantage Land Blocks Proved Developed Wells by Layer (3) TOTAL P Reserves Undeveloped Locations Booked (2) Lower 51 Middle 31 Upper 115 >900 Glacier & Valhalla Undrilled Liquids Rich intervals Ranges from C3+ yields of 20 to >100 bbls/mmcf (45% to 90% C5+) *Interval 6 not assigned reserves or resource # of locations are expected to grow as delineation drilling continues at Valhalla, Wembley & Progress (1) Management Estimates (2) Based on Sproule December 31, 2017 Reserves Report (3) As of December 31, 2017, gross Hz wells (includes producing and standing developed wells) >1,200 Future Drilling Locations (1) 15
 Progress (waiting on well results) CNQ KELT CNQ Valhalla (recent")
 Licensed Locations Advantage Lands Drill 1 well 12-18 Months (28 Net")

16 PROGRESS, WEMBLEY AND VALHALLA LAND BLOCKS ADVANTAGE DELINEATION DRILLING & COMPLETIONS UNDERWAY Pipestone/Wembley (waiting on well results) Progress (waiting on well results) CNQ KELT CNQ Valhalla (recent 4 well pad exceeded expectations) TOU ENCANA KELT SAN LING TAQA Pipestone Development CNQ Drill 3 wells Months (30 Net Sections) Licensed Locations Advantage Lands Drill 1 well Months (28 Net Sections) Total 94 net Montney sections Each area of sufficient size to support scalable drilling programs Multi-Layer Natural Gas and Liquids Potential Future Processing potential at Glacier Gas Plant Drill 4 Wells 2017 (36 Net Sections) 16

17 LIQUIDS RICH EXPERTISE DEVELOPED AT GLACIER WILL BENEFIT ALL ADVANTAGE LAND BLOCKS Recent Glacier Middle Montney Well Results (1) 8.4 mmcf/d 26 bbls/mmcf Increased frac stages & customized completion designs continue to improve well performance 13.7 mmcf/d 41 bbls/mmcf 9.3 mmcf/d 43 bbls/mmcf 5.7 mmcf/d 83 bbls/mmcf >20 frac stages Avg of 9 wells (post 2014) 15 mmcf/d 46 bbls/mmcf 9.8 mmcf/d 20 bbls/mmcf 5.7 mmcf/d 17 bbls/mmcf < = 20 frac stages Avg of 19 wells (pre 2014) 9.8 mmcf/d 54 bbls/mmcf 18 mmcf/d 47 bbls/mmcf Liquids comprised of approximately 45% C5+ in east Glacier Budget Type Curve (IP mmcf/d & 5.0 Bcf) IP mmcf/d & 6.0 Bcf Type Curve <=20 Fracs >20 Fracs (1) Based on gas rates and Glacier C3+ shallow cut liquid extraction process yields from well test initial flow data. Gas rate normalized to 3,000 kpa line pressure. 17

18 LIQUIDS RICH GLACIER MIDDLE MONTNEY WELL PERFORMANCE IMPROVEMENTS SINCE 2011 Recent well initial production test rate Wells Gen 5: Slickwater, OH Packers, Cased hole & Stage completions Avg 27 frac stages Middle Montney wells with frac design changes including >20 frac stages & numerous mechanical systems to be evaluated 28 total Middle Montney wells on-production across Glacier land block Production restrictions wells Gen 4: Slickwater, OH Packers Avg 19 frac stages wells Gen 3: Slickwater, OH Packers Avg 15 frac stages wells Gen 2: Poly CO2, & Slickwater Plug and Perf Avg 13 frac stages wells Gen 1: Poly CO2, Sand Plugs, Avg 15 frac stages Note: Recent wells Test Rates Production plot affected by low number of producing wells >350 days and wells being choked. Middle Montney Budget Type Curve (IP mmcf/d & 5.0 Bcf) Middle Montney IP mmcf/d & 6.0 Bcf Type Curve 18


19 DRY GAS EXPERTISE CONTINUES TO IMPROVE WELL ECONOMIC THRESHOLDS AT GLACIER 8 WELL PILOT PAD ON-PROD 2016 Wells producing at ~10mmcf/d after 365 days exceeding type curve 1.3 year payout at Cdn $2.00/mcf gas price Top Tier LM wells Budget Type Curve (IP mmcf/d & 7.5 Bcf) Budget Type Curve (IP mmcf/d & 7.5 Bcf) Longer Laterals, More Frac Stages 3 LM wells average 2,583 meters (longest 2,880 meters) 28 frac stages, 60 tonnes/stage Avg cost DCE&T $4.3 million/well 1 MM well 2,502 meters, 26 frac stages 11.3 mmcf/d, 30 bbls/mmcf C 3 +, $5.1 million DCE+T Upper Montney Middle Montney Lower Montney Production updated to December, Well Pad Shorter Laterals Evaluating Spacing & Recovery 3 LM wells average 1,656 meters Avg cost $3.7 million/well DCE&T 19

20 DRY GAS GLACIER UPPER AND LOWER MONTNEY WELLS - IMPROVING PERFORMANCE SINCE 2008 Production restrictions Budget Type Curve (IP mmcf/d & 7.5 Bcf) Data: updated to December,
 Capital of $4.")
21 LIQUIDS RICH EAST GLACIER MIDDLE MONTNEY WELL ECONOMIC SENSITIVITY (1) Middle Montney at 50 bbls/mmcf C3+ (2) Break-even below $1.50 Cdn gas price at U.S. $55/bbl WTI (3) (1) Management estimates. NPV 10% pre-tax. (2) Capital of $4.8 million per well based on management s estimate of DCE+T capital cost and includes a 4 month drill to on-production timeframe (3) Natural gas and NGL prices and costs escalated at 1.5%. Average C3+ Cdn NGL price of $37/bbl based on U.S.$55/bbl WTI. C3+ NGL yields of 50 bbls/mmcf raw gas 21
 (1) Management estimates. NPV 10% pre-tax. (2) Capital of $4.")
22 DRY GAS GLACIER UPPER & LOWER MONTNEY WELL ECONOMIC SENSITIVITY (1) Upper & Lower Montney Dry Gas (2) Break-even approximately $1.50/mcf Cdn with top tier Glacier dry gas wells (3) (1) Management estimates. NPV 10% pre-tax. (2) Capital of $4.8 million per well based on management s estimate of DCE+T capital cost and includes a 4 month drill to on-production timeframe (3) Natural gas and NGL prices and costs escalated at 1.5%. Average C3+ Cdn NGL price of $37/bbl based on $55 U.S./bbl WTI 22
23 GLACIER DRY GAS VS LIQUIDS RICH WELL ECONOMIC COMPARISON (1) Dry Gas vs Liquids Rich (2) At <$2.25/mcf Cdn price and $55 U.S/bbl WTI, Glacier s average liquids rich type curve (5/5) generates stronger well economics than dry gas wells <= 9 mmcfd IP30 & 9 Bcfe EUR (3) (1) Management estimates. NPV 10% pre-tax. (2) Capital of $4.8 million per well based on management s estimate of DCE+T capital cost and includes a 4 month drill to on-production timeframe (3) Natural gas and NGL prices and costs escalated at 1.5%. Average C3+ Cdn NGL price of $37/bbl based on $55 U.S./bbl WTI 23


 Total TCPL Natural Gas Firm Transportation Service of 363")
24 GROWTH BEYOND 400 MMCF/D CAN BE ACCOMMODATED ON EXISTING PLANT SITE 100% Owned Glacier Gas Plant Positioned for Production Ramp-up Room for Additional Expansion Beyond 400 mmcf/d Expanding from 250 to 400 mmcf/d & 6,800 bbls/d processing capacity 400 mmcf/d take away capacity to TCPL NW main sales gas pipeline Advantage Gas Plant TCPL Sales Meter Stations Alliance Sales Gas Line New Alliance Meter Station to be Installed 2018 TCPL NW ALBERTA Main Sales Gas Line Pembina NGL Line Company Land Company Gas Plant TransCanada Pipeline Pembina Pipeline Advantage Pipeline Alliance Pipeline Glacier Gas Plant Site near Major Natural Gas & Liquids Pipelines & Rail Access Sales Pipeline Loop capacity of 400 mmcf/d (Glacier plant to NW TCPL Mainline) Total TCPL Natural Gas Firm Transportation Service of 363 mmcf/d by April 2020 Secured 24
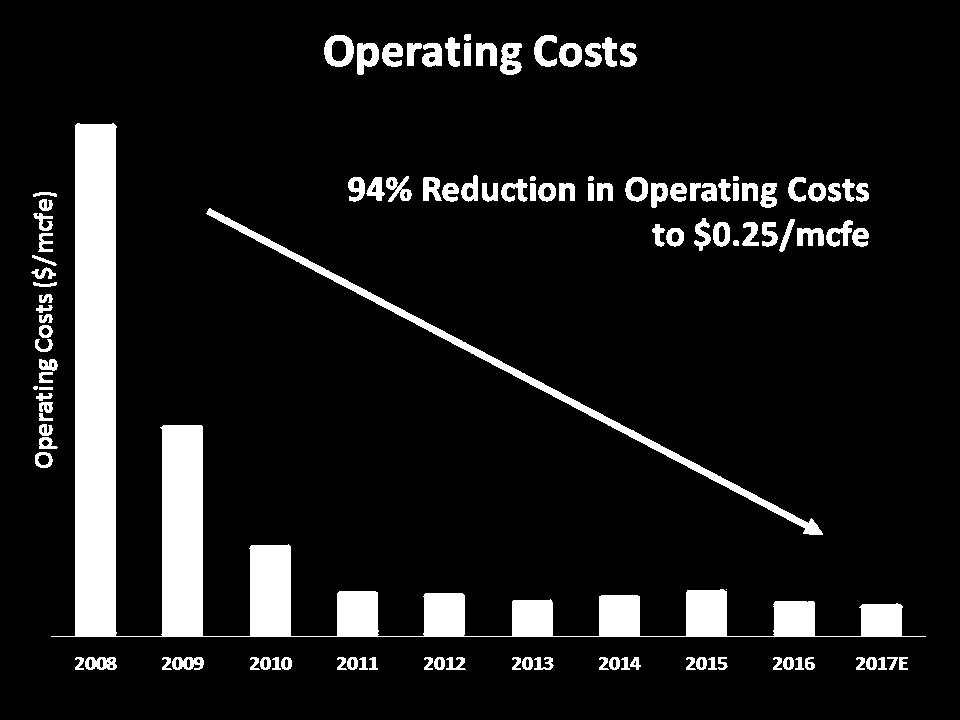
25 ADVANTAGE - LEADING LOW COST NATURAL GAS SUPPLY Select Montney and Marcellus Natural Gas Producers Cash Costs 2018 Estimates (Cdn$/mcfe) $2.77 Cdn $/Mcfe $2.56 $1.10 (1) (2) AAV Montney Marcellus Operating costs & transportation ($/mcfe) Royalties incl. GCA adjustments ($/mcfe) G&A ($/mcfe) Interest & other ($/mcfe) (3) (1) Advantage 2018 estimates at December 15, (2) RBC Capital Markets 2018 average cost estimate including ARX, BIR, CR, KEL, NVA, PPY, POU, TOU and VII at December 12, (3) Tudor, Pickering, Holt & Co average cost estimate including AR, CNX, COG, EQT, RICE and RRC at December 22, 2017 using a USD$/CAD$ foreign exchange rate of $
26 RETURN ON AVERAGE CAPITAL EMPLOD COMPARISON 5-AR AVERAGE (2013 TO 2017 ESTIMATE) Advantage Montney Development After tax 5.6% Before tax 7.9% Peers Average 1.4% Cdn Large Caps Average Cdn Small/Mid Caps Average Cdn Yields Average 0.8% 3.5% 5.2% Comparative data is shown on an after-tax basis. Advantage was not taxable in the last 5 years and is not expected to be taxable for the next 5 years or more due to its significant tax pools. US Large Caps Average 3.9% US Small/Mid Caps Average 3.9% Notes: 1. Advantage return on average capital employed (ROACE) is calculated by Management for the development of Glacier, Valhalla, Progress and Wembley since inception (legacy property disposition impacts have been excluded). 2. Comparative data is based on Macquarie Research September 11, 2017 and Peers Average includes ARX, BIR, BNP, CR, KEL, NVA, PEY, POU and VII. 3. ROACE as defined by Macquarie Research includes revenue and realized hedging gains/losses less royalty expense, operating expense, transportation expense, G&A expense, depreciation expense and income taxes (excludes unrealized hedging gains/losses and financing expense after taxes) divided by average capital employed. 26


27 Clear Vision for Growth Financial Strength Proven Expertise
28 APPENDIX
29 2018 BUDGET & GUIDANCE RANGE Average Annual Production Liquids Annual Liquids Exit 255 to 265 mmcfe/d (42,500 to 44, 170 boe/d) 1,900 bbls/d 2,400 bbls/d Royalty Rate 3% to 5% Operating Costs($/mcfe) $0.25 to $0.29 Transportation Costs ($/mcfe) $0.52 to $0.58 Total Corporate Cash Costs ($/mcfe) $1.00 to $1.20 Capital Expenditures $175 million 29


30 GLACIER LOCATED IN THE HEART OF THE MONTNEY RESOURCE PLAY Montney Siltstone Comparison: 700 times more permeability 4x more formation thickness Very low clay content Liquids & Improved well efficiencies strong economics Up to 83 bbls/mmcf 30
31 UPPER & LOWER MONTNEY WELL PRODUCTION CONTINUES TO IMPROVE New wells are normally restricted to ~10 mmcf/d for frac sand flowback control during initial 6 months Production Average (33 wells) Budget Type Curve (IP mmcf/d & 7.5 Bcf) IP mmcf/d & 9.0 Bcf Type Curve 33 Upper & Lower Montney Wells, average 20 frac stages, started production July Lower Montney Well results beginning to surpass Upper Montney Production updated to December,
 cumulative production > 4.1 Bcfe Middle Montney Budget Type Curve (IP30 5.0 mmcf/d & 5.")
32 GLACIER MIDDLE MONTNEY WELLS EXCEEDING AVERAGE BUDGET TYPE CURVE Wells are exceeding current type curves Ongoing delineation identifies sweet spots within different Middle Montney layers. Frac designs are tailored to further optimize results well (2013) cumulative production > 4.1 Bcfe Middle Montney Budget Type Curve (IP mmcf/d & 5.0 Bcf) Production updated to December,
 Budget Type Curve (IP30 7.5 mmcf/d & 7.")
33 MOST RECENT LOWER MONTNEY WELLS WITH UP TO 30 FRAC STAGES (OPEN-HOLE PACKERS AND CEMENTED PORTS) Wells restricted to ~ 10mmcf/d for frac sand flowback control during initial 6 months Additional Lower Montney wells with longer laterals, reduced frac spacing and cemented ports are continuing to be brought on production. Production Average (18 wells) Budget Type Curve (IP mmcf/d & 7.5 Bcf) IP mmcf/d & 9.0 Bcf Type Curve Production updated to December,


34 CONTINUOUS IMPROVEMENT HAS CREATED INDUSTRY LEADING EFFICIENCIES Production restrictions 34
35 GLACIER MONTNEY ASSIGNED 2P EUR PER WELL & INTERVAL Glacier - 2P Recoveries per Interval (1) # of Gross HZ Wells 2P Recovery [bcf/well] Interval 2015 Developed Undeveloped Total Developed Undeveloped Total UM MM MM MM LM Total Interval 2015 # of Gross HZ Wells 2P Recovery [bcf/well] Developed Undeveloped Total Developed Undeveloped Total Valhalla - 2P Recoveries per Interval (1) UM MM MM Total (1) Based on Sproule 2017 year-end reserve reports. Indicated raw gas volumes per well. 35
36 MARKET DIVERSIFICATION IN-PLACE ADVANTAGE HAS EXPOSURE TO MULTIPLE MARKETS TO MANAGE COMMODITY PRICE RISK 32% 3% 14% 44% 7% 4% 9% 53% 9% 5% AECO Henry Hub Liquids 51% 36% 17% 16% Dawn Fixed Price 2017 Q Graph represents % of estimated annual future total production, net of royalties 36
37 ADVISORY Certain statements contained in this presentation constitute forward-looking information, which relate to future events or our future performance. All statements other than statements of historical fact may be forward-looking statements. Forward-looking statements are often, but not always, identified by the use of words such as "anticipate", "plan", "continue", "estimate", "expect", "may", "will", "project", "predict", "potential", "targeting", "intend", "could", "might", "should", "believe" and similar expressions. In particular, this presentation contains forward-looking statements pertaining to, but not limited to, the following: details of Advantage's 2017 to 2019 development program; expected number of wells required to be drilled to achieve certain levels of production; expected well economics associated with certain type curves; expected sensitivities in cash flow per share and debt to cash flow levels to changes in commodity prices; projections of market prices and costs; anticipated number of future drilling locations and inventory and Advantage's focus on developing such locations including the timing thereof; the proposed expansion of Advantage's Glacier gas plant processing capacity, including the amount of such expansion, the anticipated timing of completion of the proposed expansion and the expected benefits to Advantage from such expansion; Advantage's 2018 capital program, including the amount thereof, the amount to be allocated to increase annual production, to drilling and completions, to land and to facilities and infrastructure; Advantage's drilling plans for 2017, 2018 and 2019, including the number of wells to be drilled and the timing of completion of certain wells; estimated three year annual return on capital; Advantage's anticipated capital expenditures, annual production, royalty rates, operating costs, liquids transportation costs, netbacks, annual cash flow, cash flow per share, funds from operations, total debt to trailing cash flow ratio, total debt to cash flow, cumulative cash surplus, well costs, bank debt and total corporate cash costs for 2017 and 2018; Advantage's anticipated capital expenditures, annual production, annual cash flow per share, funds from operations, all-in capital efficiency, netbacks, cumulative cash surplus, bank debt and total debt to trailing cash flow ratio for each of 2018 and 2019; expected increases in production in 2017, 2018 and 2019 resulting from Advantage s development plan; Advantage's future hedging positions; and other matters. These statements involve substantial known and unknown risks and uncertainties, certain of which are beyond Advantage s control, including, but not limited to: changes in general economic, market, industry and business conditions; impact of significant declines in market prices for oil and natural gas; actions by governmental or regulatory authorities including increasing taxes or royalties and changes in investment, or other regulations; changes in tax laws, environmental laws, royalty regimes and incentive programs relating to the oil and gas industry; the effect of acquisitions; Advantage's success at acquisition, exploitation and development of reserves; unexpected drilling results; changes in commodity prices, currency exchange rates, capital expenditures, reserves or reserves estimates and debt service requirements; the occurrence of unexpected events involved in the exploration for, and the operation and development of, oil and gas properties; changes or fluctuations in production levels; delays in anticipated timing of drilling and completion of wells; delays in completion of the expansion of the Glacier gas plant; lack of available capacity on pipelines; individual well productivity; the lack of availability of qualified personnel or management; liabilities inherent in oil and natural gas operations; uncertainties associated with estimating oil and natural gas reserves; competition for, among other things, capital, acquisitions of reserves, undeveloped lands and skilled personnel; geological, technical, drilling and processing problems and other difficulties in producing petroleum reserves; ability to obtain required approvals of regulatory authorities; ability to access sufficient capital from internal and external sources; and certain other risks and uncertainties described in Advantage's Annual Information Form which is available at and Readers are cautioned that the foregoing lists of factors are not exhaustive. With respect to forward-looking statements contained in this presentation, Advantage has made assumptions regarding, but not limited to: conditions in general economic and financial markets; effects of regulation by governmental agencies; current and future commodity prices, royalty regimes, exchange rates, royalty rates, operating costs, cash costs, well costs and liquids transportation costs; frac stages and lateral lengths per well; estimated EURs; availability of skilled labor and drilling and related equipment; timing and amount of capital expenditures; the impact of increasing competition; that Advantage will have sufficient cash flow, debt or equity sources or other financial resources required to fund its capital and operating expenditures and requirements as needed; that Advantage's conduct and results of operations will be consistent with its expectations; that Advantage will have the ability to develop its properties in the manner currently contemplated; available pipeline capacity; that Advantage will be able to complete the expansion and increase capacity at the Glacier gas plant; that Advantage's production will increase; current or, where applicable, proposed assumed industry conditions, laws and regulations will continue in effect or as anticipated; and that the estimates of Advantage's production and reserves volumes and the assumptions related thereto (including commodity prices and development costs) are accurate in all material respects. Production estimates contained herein for the years ended December 31, 2017, 2018 and 2019 are expressed as anticipated average production over the calendar year. In determining anticipated production for the years ended December 31, 2017, 2018 and 2019 Advantage considered historical drilling, completion and production results for prior years and took into account the estimated impact on production of Advantage's 2017, 2018 and 2019 expected drilling and completion activities. Management has included the above summary of assumptions and risks related to forward-looking information in order to provide shareholders with a more complete perspective on Advantage's future operations and such information may not be appropriate for other purposes. Advantage s actual decisions, activities, results, performance or achievement could differ materially from those expressed in, or implied by, these forward-looking statements and, accordingly, no assurance can be given that any of the events anticipated by the forward-looking statements will transpire or occur, or if any of them do so, what benefits that Advantage will derive there from. These forward-looking statements are made as of the date of this presentation and Advantage disclaims any intent or obligation to update publicly any forward-looking statements, whether as a result of new information, future events or results or otherwise, other than as required by applicable securities laws.. 37
38 ADVISORY Advantage discloses several financial measures that do not have any standardized meaning prescribed under International Financial Reporting Standards ("IFRS"). These financial measures include total debt to trailing cash flow ratio, total cash costs, funds from operations and operating netbacks. Total debt to trailing cash flow ratio is calculated as bank indebtedness under Advantage's credit facilities plus working capital deficit divided by funds from operations for the prior twelve month period. Total cash costs includes royalties, operating costs, liquids transportation, cash G&A, interest & other cash expenses. Funds from operations is based on cash provided by operating activities, before expenditures on decommissioning liability and changes in non-cash working capital, reduced for finance expense excluding accretion. Operating netbacks are calculated by deducting royalties and operating costs from revenue on a unit (boe or mcfe) basis. Management believes that these financial measures are useful supplemental information to analyze operating performance and provide an indication of the results generated by Advantage s principal business activities. Investors should be cautioned that these measures should not be construed as an alternative to net income, cash provided by operating activities or other measures of financial performance as determined in accordance with IFRS. Advantage s method of calculating these measures may differ from other companies, and accordingly, they may not be comparable to similar measures used by other companies. Please see Advantage s most recent Management s Discussion and Analysis, which is available at and for additional information about these financial measures, including a reconciliation of funds from operations to cash provided by operating activities. This presentation and, in particular the information in respect of Advantage's prospective cash flow debt to trailing cash flow ratio, total cash costs and cash costs per share, operating costs, capital expenditures, annual cash flow and funds from operations may contain future oriented financial information ("FOFI") within the meaning of applicable securities laws. The FOFI has been prepared by management to provide an outlook of Advantage's activities and results and may not be appropriate for other purposes. The FOFI has been prepared based on a number of assumptions, including the assumptions discussed above, and assumptions with respect to the costs and expenditures to be incurred by Advantage, capital equipment and operating costs, foreign exchange rates, taxation rates for Advantage, general and administrative expenses and the prices to be paid for Advantage's production. Management does not have firm commitments for all of the costs, expenditures, prices or other financial assumptions used to prepare the FOFI or assurance that such operating results will be achieved and, accordingly, the complete financial effects of all of those costs, expenditures, prices and operating results are not objectively determinable. The actual results of operations of Advantage and the resulting financial results may vary from the amounts set forth herein, and such variations may be material. Management believes that the FOFI has been prepared on a reasonable basis, reflecting management s best estimates and judgments. However, because this information is highly subjective and subject to numerous risks including the risks discussed above, it should not be relied on as necessarily indicative of future results. FOFI contained in this presentation was made as of the date of this presentation and Advantage disclaims any intention or obligations to update or revise any FOFI contained in this presentation, whether as a result of new information, future events or otherwise, unless required pursuant to applicable law. References in this presentation to initial test production rates, production type curves, initial "productivity", initial "flow" rates, final gas flow rates, average gas flow rates, average type curves, "flush" production rates and "30 day IP rates" and other short-term production rates are useful in confirming the presence of hydrocarbons, however such rates are not determinative of the rates at which such wells will commence production and decline thereafter and are not indicative of long term performance or of ultimate recovery. Additionally, such rates may also include recovered "load oil" fluids used in well completion stimulation. While encouraging, readers are cautioned not to place reliance on such rates in calculating the aggregate production for Advantage. A pressure transient analysis or well-test interpretation has not been carried out in respect of all wells. Accordingly, Advantage cautions that the test results should be considered to be preliminary. Certain type curves presented herein represent estimates of the production decline and ultimate volumes expected to be recovered from wells over the life of the well. The 7.5 mmcf/d IP (which represents the average 30 day initial production rate) and 7.5 Bcfe (which represents the ultimate volumes expected to be recovered from the wells over the life of the well based on the type curve) Upper and Lower Montney type curve and the 5 mmcf/d IP and 5 Bcfe Middle Montney type curve are management generated type curves based on a combination of historical performance of older wells and management's expectation of what might be achieved from future wells. The type curves represent what management thinks an average well will achieve. Individual wells may be higher or lower but over a larger number of wells management expects the average to come out to the type curve. Over time type curves can and will change based on achieving more production history on older wells or more recent completion information on newer wells. Other type curves presented herein, including the 9 mmcf/d IP and 9 Bcf Upper and LowerMontney type curve and the 6 mmcf/d IP and 6 Bcf Middle Montney type curve have been provided to demonstrate the economics associated with wells that could potentially have that type of productivity and recovery but do not represent management estimates of how such wells will actually perform. This presentation discloses over 1,100 undeveloped future drilling locations at Glacier in the following categories: (i) proved (247 locations); (ii) proved + probable (307 locations); and (iii) unbooked (over 793 additional locations). Proved locations and probable locations are derived from Advantage s most recent independent reserves evaluation as prepared by Sproule Associates Limited as of December 31, 2016 and account for drilling locations that have associated proved and/or probable reserves, as applicable. Unbooked locations are internal estimates based on Advantage s prospective acreage and an assumption as to the number of wells that can be drilled per section based on industry practice and internal review. Unbooked locations do not have attributed reserves or resources. Unbooked locations have been identified by management as an estimation of our multi-year drilling activities based on evaluation of applicable geologic, seismic, engineering, production and reserves information. There is no certainty that Advantage 38
39 ADVISORY will drill all unbooked drilling locations and if drilled there is no certainty that such locations will result in additional oil and gas reserves, resources or production. The drilling locations on which we actually drill wells will ultimately depend upon the availability of capital, regulatory approvals, seasonal restrictions, oil and natural gas prices, costs, actual drilling results, additional reservoir information that is obtained and other factors. While certain of the unbooked drilling locations have been derisked by drilling existing wells in relative close proximity to such unbooked drilling locations, other unbooked drilling locations are farther away from existing wells where management has less information about the characteristics of the reservoir and therefore there is more uncertainty whether wells will be drilled in such locations and if drilled there is more uncertainty that such wells will result in additional oil and gas reserves, resources or production. This presentation also contains projections of production growth based on drilling and recompletion opportunities identified by management of Advantage. Certain of the drilling opportunities identified have no associated reserves or resources which can presently be classified as recoverable. As such the initial rates of production and reserves per well identified herein do not represent estimates of future production or reserves associated with the drilling opportunities. The initial rates of production, reserves per well and the capital costs associated with drilling and recompletion identified below are based on Advantage's historical results and analogous public information received from other producers using similar technologies as Advantage intends to use in the same or similar areas and formations. The initial rates of production, reserves per well and capital costs associated with the wells have been provided herein to give an indication of management's assumptions used for budgeting, planning and forecasting purposes. The initial rates of production, reserves and capital costs will most likely be different than projected. Throughout this presentation the terms boe, mcfe (thousand of cubic feet of gas equivalent), mmcfe, bcfe and tcfe are used. Such terms may be misleading, particularly if used in isolation. The conversion ratio used herein of six thousand cubic feet per barrel (6 mcf: 1 bbl) of natural gas to barrels of oil equivalent and the conversion ratio used herein of 1 barrel per six thousand cubic feet (1 bbl: 6 mcf) of barrels of oil to natural gas equivalent is based on an energy equivalency conversion method primarily applicable at the burner tip and does not represent a value equivalency at the wellhead. Given that the value ratio based on the current price of crude oil as compared to natural gas is significantly different from the energy equivalency of 6:1, utilizing a conversion on a 6:1 basis may be misleading as an indication of value. This presentation contains certain oil and gas metrics, including EUR, PDP F&D, 2P F&D, 1P F&D, operating netbacks, cash flow netbacks, all-in netbacks, recycle ratio and CAGR which do not have standardized meanings or standard methods of calculation and therefore such measures may not be comparable to similar measures used by other companies and should not be used to make comparisons. Such metrics have been included herein to provide readers with additional measures to evaluate Advantage's performance; however, such measures are not reliable indicators of the future performance of Advantage and future performance may not compare to the performance in previous periods and therefore such metrics should not be unduly relied upon. EUR represents the 2P estimated ultimate recoverable conventional natural gas volumes per well assigned by Advantage's internal non-independent qualified reserves evaluator in accordance with the Canadian Oil & Gas Evaluation Handbook. PDP F&D is calculated by adding together all capital expenditures including exploration and development costs and dividing the sum by PDP reserves additions. 2P F&D is calculated by adding together all capital expenditures including exploration and development costs and the change in future development costs and dividing the sum by 2P reserve additions. 1P F&D is calculated by adding together all capital expenditures including exploration and development costs and the change in future development costs and dividing the sum by 1P reserve additions. The aggregate of the exploration and development costs incurred in the most recent financial year generally will not reflect total finding and development costs related to reserve additions for that year. Operating netbacks are calculated by deducting royalties, operating costs and transportation costs from revenue on a unit (mcfe) basis. Cash flow netbacks are calculated by deducting royalties, operating costs, transportation costs, cash G&A and cash finance expenses from revenue on a unit (mcfe) basis. All-in netbacks are calculated by deducting royalties, operating costs, transportation costs, cash G&A, cash finance expenses and PDP F&D from revenue on a unit (mcfe) basis. Recycle ratio is calculated as Cash flow netbacks divided by 2P F&D. CAGR is the Compound Annual Growth Rate representing the measure of average annual growth over multiple time periods. In this presentation certain financial and operating metrics of other issuers are also presented to compare such metrics to Advantage's results. Such other issuers were included to show how Advantage's performance compares to some of its peers. The financial and operating metrics of such issuers have been obtained from public sources and have not been independently verified by Advantage. Readers should not base an investment decision for the securities of such issuers based on the information available herein. Advantage disclaims any responsibility or liability for the accuracy of the information relating to such other issuers presented herein. Where any disclosure of reserves data and resources is made in this presentation that does not reflect all reserves of Advantage, the reader should note that the estimates of reserves, future net revenue and resources for individual properties or groups of properties may not reflect the same confidence level as estimates of reserves and future net revenue for all properties, due to the effects of aggregation. 39

40 ADVANTAGE CONTACT INFORMATION Investor Relations Listed on NYSE and TSX: AAV Advantage Oil & Gas Ltd. Suite 300, 440 2nd Avenue SW Calgary, Alberta T2P 5E9 Main: Facsimile: Advantage 100% W.I. Glacier Gas Plant Andy Mah, P.Eng. Craig Blackwood, C.A. Neil Bokenfohr, P.Eng. Director, President & Chief Executive Officer VP Finance & Chief Financial Officer Senior Vice President
2018 Cash Flow Funded Capital Budget Increases Focus on Liquids Development & Growth Driven by Strong Well Results
 2018 Cash Flow Funded Capital Budget Increases Focus on Liquids Development & Growth Driven by Strong Well Results Investor Presentation TSX / NYSE: AAV January 2018 ADVANTAGE AT A GLANCE TSX 52-week trading
Well Results at Valhalla, Wembley and Progress Confirm A Significant & Growing Liquids Rich Drill Inventory. First Wembley Well with Liquids Yield up
 Well Results at Valhalla, Wembley and Progress Confirm A Significant & Growing Liquids Rich Drill Inventory. First Wembley Well with Liquids Yield up to 277 bbls/mmcf & Condensate Yields up to 211 bbls/mmcf
Annual Production Budget
 Strong Glacier Operating Results Generate Surplus Cash & Strengthens Balance Sheet to 0.7x D/CF as of June 30, 2017. Delineation Drilling Commenced on Undeveloped Montney Lands" Enercom Presentation Denver,
Solid Cash Flow with Increased Production and Lower Costs Maintains Balance Sheet at 1.0x D/CF at End of Q H Investment Will Set the
 Solid Cash Flow with Increased Production and Lower Costs Maintains Balance Sheet at 1.0x D/CF at End of Q3 2017. H2 2017 Investment Will Set the Stage for 2018 and Beyond Investor Presentation TSX / NYSE:
Lowering Natural Gas Production & Increasing Liquids Rich Drilling. Liquids Production Could Reach 13% or More of Total Production in 2020
 Lowering Natural Gas Production & Increasing Liquids Rich Drilling. Liquids Production Could Reach 13% or More of Total Production in 2020 Investor Presentation TSX / NYSE: AAV May 2018 ADVANTAGE AT A
42% Production Growth to 238 mmcfe/d (39,635 boe/d) and a 79% Increase in Cash Flow to $54 Million Fully Funded our Q Capital Program.
 and a 79% Increase in Cash Flow to $54 Million Fully Funded our Q Capital Program.") 42% Production Growth to 238 mmcfe/d (39,635 boe/d) and a 79% Increase in Cash Flow to $54 Million Fully Funded our Q1 2017 Capital Program. 39% Increase in Undeveloped Montney Land Adds to Long Term Development
42% Production Growth to 238 mmcfe/d (39,635 boe/d) and a 79% Increase in Cash Flow to $54 Million Fully Funded our Q1 2017 Capital Program. 39% Increase in Undeveloped Montney Land Adds to Long Term Development
Record Low Reserve Addition Costs of PDP $0.84/Mcfe in 2016 Tops Off A Stellar Year of Operating & Financial Results. Development Plan Growth to 316
 Record Low Reserve Addition Costs of PDP $0.84/Mcfe in 2016 Tops Off A Stellar Year of Operating & Financial Results. Development Plan Growth to 316 mmcfe/d (52,670 boe/d) Underway" Investor Presentation
OUR MONTNEY JOURNEY HAS BEEN SERVED WELL BY OUR GUIDING PRINCIPLES SINCE 2008
 Annual General Meeting May 26, 2016 OUR MONTNEY JOURNEY HAS BEEN SERVED WELL BY OUR GUIDING PRINCIPLES SINCE 2008 Develop Glacier in a Sustainable manner Maintain a Strong Balance Sheet
Lowering Natural Gas Production & Increasing Liquids-Rich Development. Liquids Production Could Reach 13% or More of Total Production in 2020
 Lowering Natural Gas Production & Increasing Liquids-Rich Development. Liquids Production Could Reach 13% or More of Total Production in 2020 Investor Presentation TSX / NYSE: AAV August 2018 ADVANTAGE
CURRENT HEADLINES PAINT AN OVERLY NEGATIVE PICTURE FOR CANADIAN PRODUCERS
 Annual General Meeting May 25, 2017 CURRENT HEADLINES PAINT AN OVERLY NEGATIVE PICTURE FOR CANADIAN PRODUCERS 2 CREATING UNCERTAINTY, FEAR AND NOISE Sky is Falling Opportunity or Not 3 BUT DON T FORGET
Accelerating Condensate Development in the Heart of the Montney While Retaining Capital Flexibility
 Accelerating Condensate Development in the Heart of the Montney While Retaining Capital Flexibility Investor Presentation TSX: AAV March 2019 ADVANTAGE AT A GLANCE TSX 52-week trading range $1.80 - $4.80
Glacier Montney Outperformance Improves Capital Efficiencies, Enables Lower Capital and Maintains Future Production Growth. Highly Efficient 2014
 Glacier Montney Outperformance Improves Capital Efficiencies, Enables Lower Capital and Maintains Future Production Growth. Highly Efficient 2014 Reserve Additions Reaffirms High Quality Glacier Asset.
Strong Production Growth, Top Quartile Well Results and Lowest Corporate Cash Costs in the Montney Underpins Glacier Plant Expansion Plans to 350
 Strong Production Growth, Top Quartile Well Results and Lowest Corporate Cash Costs in the Montney Underpins Glacier Plant Expansion Plans to 350 MMcf/d (58,330 Boe/d) Investor Presentation TSX / NYSE:
Record Q Production & Three Year Plan to Accelerate Pipestone Condensate Development
 Record Q3 2018 Production & Three Year Plan to Accelerate Pipestone Condensate Development Investor Presentation TSX: AAV December 2018 ADVANTAGE AT A GLANCE TSX 52 week trading range $1.82 $5.73 Shares
2016 Budget Targets 39% Production Growth, $0.75/mcf Total Cash Costs and 1.6x Debt to Cash AECO Cdn $2.50/mcf
 2016 Budget Targets 39% Production Growth, $0.75/mcf Total Cash Costs and 1.6x Debt to Cash Flow @ AECO Cdn $2.50/mcf Investor Presentation TSX / NYSE: AAV December 2015 ADVANTAGE AT A GLANCE TSX, NYSE:
Low Risk Glacier Montney Development, Strong Balance Sheet & Hedging Program Supports Profitable & Sustainable Growth
 Low Risk Glacier Montney Development, Strong Balance Sheet & Hedging Program Supports Profitable & Sustainable Growth Investor Presentation TSX / NYSE: AAV September 2015 ADVANTAGE: AT A GLANCE Canadian
Advantage Production Reaches 183 mmcfe/d Target During Commissioning of Expanded Glacier Plant in July Excess Standing Well Productivity &
 Advantage Production Reaches 183 mmcfe/d Target During Commissioning of Expanded Glacier Plant in July 2015. Excess Standing Well Productivity & Spare Plant Capacity Sets the Foundation for Low Risk Development
Production Growth, Record Low Cash Costs of $0.75/mcfe & Top Quartile Well Results Underpins Glacier Plant Expansion Plans to 350 MMcf/d (58,330
 Production Growth, Record Low Cash Costs of $0.75/mcfe & Top Quartile Well Results Underpins Glacier Plant Expansion Plans to 350 MMcf/d (58,330 Boe/d) Investor Presentation TSX / NYSE: AAV June 2016 ADVANTAGE
Accelerating Condensate Development in the Heart of the Montney While Retaining Capital Flexibility
 Accelerating Condensate Development in the Heart of the Montney While Retaining Capital Flexibility Investor Presentation TSX: AAV April 2019 ADVANTAGE AT A GLANCE TSX 52-week trading range $1.80 - $4.80
Q First Quarter Report
 Q1 2017 First Quarter Report Financial and Operating Highlights 2017 2016 Financial ($000, except as otherwise indicated) Sales including realized hedging $ 72,957 $ 41,625 Funds from operations $ 53,972
Strengthened Balance Sheet with Industry leading Total Cash Costs of $0.77 per mcfe, capital efficiencies and strong hedging positions Advantage for
 Strengthened Balance Sheet with Industry leading Total Cash Costs of $0.77 per mcfe, capital efficiencies and strong hedging positions Advantage for continual organic growth. Investor Presentation TSX
A PROUD CANADIAN CLEAN ENERGY PRODUCER FOCUSED ON DEVELOPMENT OF ITS SIGNIFICANT MONTNEY NATURAL GAS AND LIQUIDS RESOURCE
 A PROUD CANADIAN CLEAN ENERGY PRODUCER FOCUSED ON DEVELOPMENT OF ITS SIGNIFICANT MONTNEY NATURAL GAS AND LIQUIDS RESOURCE Annual General Meeting May 29, 2018 CANADIAN E&P COMPANIES CHALLENGING TIMES BUT
Investor Presentation TSX, NYSE: AAV July, Page 1
 Pure Play Montney Producer with a proven operating team, industry leading cost structure & clear visibility to a significant drilling inventory creates a solid foundation for multi-year growth Investor
to announce Operating Results March 22, 2011 boe/d. $38.5 million to funds from cash flow for $45.1 million the increasing optimization of our other
 Press Release Advantage Oil & Gas Ltd Page 1 of 6 News Release Advantage Announces 2010 Year End Financial Results Glacier Production Exceeding 100 mmcf/d March 22, 2011 (TSX: AAV, NYSE: AAV) CALGARY,
Q First Quarter Report
 Q1 2018 First Quarter Report Financial and Operating Highlights 2018 2017 Financial ($000, except as otherwise indicated) Sales including realized hedging $ 73,378 $ 72,957 Net income and comprehensive
Advantage Announces 2011 Year End Financial Results and Provides Interim Guidance
 Press Release Page 1 of 10 Advantage Oil & Gas Ltd Advantage Announces 2011 Year End Financial Results and Provides Interim Guidance (TSX: AAV, NYSE: AAV) CALGARY, ALBERTA, March 22, 2012 ( Advantage or
Disposition of Non-Core Assets
 Press Release Page 1 of 5 Advantage Oil & Gas Ltd Advantage Announces Disposition of Non-core Assets, Glacier Montney Update, Appointment of Financial Advisors and Natural Gas Hedging for 2013 (TSX: AAV,
CHINOOK ENERGY INC. ANNOUNCES FOURTH QUARTER 2016 RESULTS AND PROVIDES OPERATIONAL UPDATE
 CHINOOK ENERGY INC. ANNOUNCES FOURTH QUARTER 2016 RESULTS AND PROVIDES OPERATIONAL UPDATE CALGARY, ALBERTA March 23, 2017 Chinook Energy Inc. ("our", "we", or "us") (TSX: CKE) is pleased to announce its
Q Second Quarter Report
 Q2 2018 Second Quarter Report Financial and Operating Highlights 2018 2017 2018 2017 Financial ($000, except as otherwise indicated) Sales including realized hedging (3) $ 45,319 $ 69,169 $ 118,697 $ 142,126
2017 Annual Report. Financial and Operating Highlights
 2017 Annual Report Financial and Operating Highlights Three months ended 2017 2016 2017 2016 Financial ($000, except as otherwise indicated) Sales including realized hedging $ 65,779 $ 71,090 $ 259,611
2011 Annual Report. Non-Consolidated Financial and Operating Highlights (1) Year ended December 31, Three months ended December 31, 2010
 Year ended December 31, Three months ended December 31, 2010") 2011 Annual Report Non-Consolidated Financial and Operating Highlights (1) Three months ended December 31, 2011 Three months ended December 31, 2010 December 31, 2011 December 31, 2010 Financial ($000,
2011 Annual Report Non-Consolidated Financial and Operating Highlights (1) Three months ended December 31, 2011 Three months ended December 31, 2010 December 31, 2011 December 31, 2010 Financial ($000,
DELPHI ENERGY RELEASES YEAR END 2015 RESERVES
 DELPHI ENERGY RELEASES YEAR END 2015 RESERVES CALGARY, ALBERTA February 29, 2016 Delphi Energy Corp. ( Delphi or the Company ) is pleased to report its crude oil and natural gas reserves information for
PETRUS RESOURCES ANNOUNCES FOURTH QUARTER AND YEAR END 2017 FINANCIAL & OPERATING RESULTS AND YEAR END RESERVE INFORMATION
 PETRUS RESOURCES ANNOUNCES FOURTH QUARTER AND YEAR END 2017 FINANCIAL & OPERATING RESULTS AND YEAR END RESERVE INFORMATION CALGARY, ALBERTA, Thursday, March 8 th, 2018 Petrus Resources Ltd. ( Petrus or
RMP Energy Reports Second Quarter 2017 Results and Provides Initial Elmworth Production Information
 RMP Energy Reports Second Quarter 2017 Results and Provides Initial Elmworth Production Information CALGARY, Alberta, Aug. 14, 2017 (GLOBE NEWSWIRE) -- RMP Energy Inc. ( RMP or the Company ) (TSX:RMP)
CRESCENT POINT ANNOUNCES STRATEGIC CONSOLIDATION ACQUISITION OF CORAL HILL ENERGY LTD. AND UPWARDLY REVISED 2015 GUIDANCE
 PRESS RELEASE CRESCENT POINT ANNOUNCES STRATEGIC CONSOLIDATION ACQUISITION OF CORAL HILL ENERGY LTD. AND UPWARDLY REVISED 2015 GUIDANCE July 2, 2015 CALGARY, ALBERTA. Crescent Point Energy Corp. ( Crescent
indicated) per share ( per boe , , ,487 41, , , ,390 80,
 per share ( per boe , , ,487 41, , , ,390 80,") 2010 Annual Report Financial ($000, except as otherwise indicated) Revenue before royalties (1) (2) per share ( per boe Funds from operations (2) per share ( per boe Net income (loss) (2) per share ( Expenditures
2010 Annual Report Financial ($000, except as otherwise indicated) Revenue before royalties (1) (2) per share ( per boe Funds from operations (2) per share ( per boe Net income (loss) (2) per share ( Expenditures
September 28, 2018 SEPTEMBER PRESENTATION
 September 28, 2018 SEPTEMBER PRESENTATION BIGSTONE PROLIFIC, LIQUIDS RICH MONTNEY Pure play MONTNEY E&P company with WORLD CLASS ASSETS: Successful delineation drilling to the west and south Growing condensate
DELPHI ENERGY ANNOUNCES CLOSING OF DISPOSITION OF WAPITI ASSETS
 DELPHI ENERGY ANNOUNCES CLOSING OF DISPOSITION OF WAPITI ASSETS CALGARY, ALBERTA July 22, 2015 Delphi Energy Corp. ( Delphi or the Company ) is pleased to report that it has closed the previously announced
CEQUENCE ENERGY ANNOUNCES OPERATIONAL UPDATE, 2016 FINANCIAL AND OPERATING RESULTS AND RESERVES
 CEQUENCE ENERGY ANNOUNCES OPERATIONAL UPDATE, 2016 FINANCIAL AND OPERATING RESULTS AND RESERVES CALGARY, March 13, 2017 Cequence Energy Ltd. ("Cequence" or the "Company") (TSX: CQE) is pleased to provide
CONSOLIDATED MANAGEMENT S DISCUSSION & ANALYSIS The following Management s Discussion and Analysis ( MD&A ), dated as of March 25, 2015, provides a
, dated as of March 25, 2015, provides a") CONSOLIDATED MANAGEMENT S DISCUSSION & ANALYSIS The following Management s Discussion and Analysis ( MD&A ), dated as of March 25, 2015, provides a detailed explanation of the consolidated financial and
CONSOLIDATED MANAGEMENT S DISCUSSION & ANALYSIS The following Management s Discussion and Analysis ( MD&A ), dated as of March 25, 2015, provides a detailed explanation of the consolidated financial and
May 2018 HIGH-MARGIN, LIQUIDS-RICH PRODUCTION IN THE WORLD- CLASS MONTNEY BIGSTONE REGION
 May 2018 HIGH-MARGIN, LIQUIDS-RICH PRODUCTION IN THE WORLD- CLASS MONTNEY BIGSTONE REGION WHY OWN DELPHI. Pure play MONTNEY E&P company with WORLD CLASS ASSETS: Robust well economics driven by: High condensate
CHINOOK ENERGY INC. ANNOUNCES SECOND QUARTER 2017 RESULTS
 CHINOOK ENERGY INC. ANNOUNCES SECOND QUARTER 2017 RESULTS CALGARY, ALBERTA August 10, 2017 Chinook Energy Inc. ("our", "we", or "us") (TSX: CKE) is pleased to announce its second quarter 2017 financial
April 2018 HIGH-MARGIN, LIQUIDS-RICH PRODUCTION IN THE WORLD- CLASS MONTNEY BIGSTONE REGION
 April 2018 HIGH-MARGIN, LIQUIDS-RICH PRODUCTION IN THE WORLD- CLASS MONTNEY BIGSTONE REGION WHY OWN DELPHI. Pure play MONTNEY E&P company with WORLD CLASS ASSETS: Robust well economics driven by: High
Yangarra Announces Second Quarter 2018 Financial and Operating Results
 Suite 1530, 715 5 Avenue S.W. Calgary, Alberta T2P 2X6 Phone: (403) 262-9558 Fax: (403) 262-8281 Webpage: www.yangarra.ca Email: info@yangarra.ca August 8, Yangarra Announces Second Quarter Financial and
SPARTAN ENERGY CORP. ANNOUNCES STRATEGIC SOUTHEAST SASKATCHEWAN LIGHT OIL ACQUISITION
 Suite 500, 850 2 nd Street SW Calgary, AB T2P 0R8 Canada Ph.: (403) 355-8920 Fax: (403) 355-2779 SPARTAN ENERGY CORP. ANNOUNCES STRATEGIC SOUTHEAST SASKATCHEWAN LIGHT OIL ACQUISITION CALGARY, ALBERTA (May
CEQUENCE ENERGY ANNOUNCES OPERATIONAL UPDATE AND 2014 RESERVES AND FINANCIAL AND OPERATING RESULTS
 CEQUENCE ENERGY ANNOUNCES OPERATIONAL UPDATE AND 2014 RESERVES AND FINANCIAL AND OPERATING RESULTS CALGARY, March 5, 2015 Cequence Energy Ltd. ("Cequence" or the "Company") (TSX: CQE) is pleased to announce
BUILT TO LAST. April 2016
 BUILT TO LAST April 2016 Built to Last Low Debt Low Decline Strong Capital Efficiencies 2 Cardinal Energy Profile Shares Outstanding (1) TSX: CJ Basic 65,124,209 ergy Ltd. Fully Diluted 67,595,248 Annual
INPLAY OIL CORP. ANNOUNCES 2016 YEAR END RESERVES AND AN OPERATIONS UPDATE
 March 14, 2017 INPLAY OIL CORP. ANNOUNCES 2016 YEAR END RESERVES AND AN OPERATIONS UPDATE CALGARY, ALBERTA (March 14, 2017) InPlay Oil Corp. ("InPlay" or the "Company") (TSX:IPO) is pleased to present
Corporate Presentation. August 2016
 Corporate Presentation August 2016 Future Oriented Information (See additional advisories at the end of this document) In the interest of providing information regarding Paramount Resources Ltd. ("Paramount"
2018 Annual Report. Financial and Operating Highlights. Financial Highlights
 2018 Annual Report Financial and Operating Highlights Three months ended Year ended Financial Highlights ($000, except as otherwise indicated) 2018 2017 2018 2017 Financial Statement Highlights Sales including
CRESCENT POINT ANNOUNCES SASKATCHEWAN VIKING CONSOLIDATION ACQUISITION AND UPWARDLY REVISED GUIDANCE FOR 2014
 PRESS RELEASE CRESCENT POINT ANNOUNCES SASKATCHEWAN VIKING CONSOLIDATION ACQUISITION AND UPWARDLY REVISED GUIDANCE FOR 2014 June 12, 2014 CALGARY, ALBERTA. Crescent Point Energy Corp. ( Crescent Point
CANADIAN NATURAL RESOURCES LIMITED ANNOUNCES 2016 YEAR END RESERVES CALGARY, ALBERTA FEBRUARY 14, 2017 FOR IMMEDIATE RELEASE
 CANADIAN NATURAL RESOURCES LIMITED ANNOUNCES 2016 YEAR END RESERVES CALGARY, ALBERTA FEBRUARY 14, 2017 FOR IMMEDIATE RELEASE Canadian Natural Resources Limited ( Canadian Natural or the Company ) is pleased
Corporate Presentation. March 2018
 Corporate Presentation March 218 Advisory Regarding Forward-Looking Information and Statements This presentation contains forward-looking statements and forward-looking information within the meaning of
NOT FOR DISTRIBUTION TO U.S. NEWS WIRE SERVICES OR FOR DISSEMINATION IN THE U.S.
 NEWS RELEASE June 25, 2014 200, 707 7 Avenue SW Calgary, Alberta T2P 3H6 Telephone: (403) 262-1901 Facsimile (403) 262-1905 TSXV Trading Symbol: MVN OTC Trading Symbol: MDLNF NOT FOR DISTRIBUTION TO U.S.
KELT REPORTS SIGNIFICANT INCREASES IN RESERVES AND PRODUCTION IN 2014
 PRESS RELEASE (Stock Symbol KEL TSX) February 10, 2015 Calgary, Alberta KELT REPORTS SIGNIFICANT INCREASES IN RESERVES AND PRODUCTION IN 2014 Kelt Exploration Ltd. ( Kelt or the Company ) has released
For Immediate Release Granite Oil Corp. Announces 2017 Record Year End Reserve Metrics and Operational Update
 For Immediate Release Granite Oil Corp. Announces 2017 Record Year End Reserve Metrics and Operational Update CALGARY, ALBERTA (Marketwired March 7, 2018) GRANITE OIL CORP. ( Granite or the Company ) (TSX:GXO)(OTCQX:GXOCF)
CEQUENCE ENERGY LTD. ANNOUNCES OVER 36 % GROWTH IN RESERVES AND RESERVE VALUE AND FOURTH QUARTER AND YEAR END 2011 RESULTS
 CEQUENCE ENERGY LTD. ANNOUNCES OVER 36 % GROWTH IN RESERVES AND RESERVE VALUE AND FOURTH QUARTER AND YEAR END 2011 RESULTS CALGARY, March 8, 2012 Cequence Energy Ltd. ("Cequence" or the "Company") (TSX:
RMP Energy Provides Second Quarter 2012 Financial and Operating Results
 NEWS RELEASE August 9, 2012 RMP Energy Provides Second Quarter 2012 Financial and Operating Results Calgary, Alberta RMP Energy Inc. ( RMP or the Company ) (TSX:RMP) today provided its financial and operating
POSITIONED FOR SUCCESS
 POSITIONED FOR SUCCESS CORPORATE PRESENTATION November 2018 TSX: BNE 1 Forward Looking Information Certain statements contained in this Presentation include statements which contain words such as anticipate,
Premium Pipestone Asset Acquisition. August 9, 2018
 Premium Pipestone Asset Acquisition August 9, 2018 READER ADVISORY GENERAL A final short form prospectus containing important information relating to the offering (the "Offering") of subscription receipts
Athabasca Oil Corporation Announces 2018 Year end Results
 FOR IMMEDIATE RELEASE March 6, 2019 Athabasca Oil Corporation Announces 2018 Year end Results CALGARY Athabasca Oil Corporation (TSX: ATH) ( Athabasca or the Company ) is pleased to provide its 2018 year
May 22, 2018 AGM PRESENTATION
 May 22, 2018 AGM PRESENTATION BIGSTONE PROLIFIC, LIQUIDS RICH MONTNEY Pure play MONTNEY E&P company with WORLD CLASS ASSETS: Successful delineation drilling to the west and south Growing condensate production
BELLATRIX EXPLORATION LTD. ANNOUNCES FOURTH QUARTER 2018 AND YEAR END FINANCIAL AND OPERATING RESULTS
 For Immediate Release TSX: BXE BELLATRIX EXPLORATION LTD. ANNOUNCES FOURTH QUARTER 2018 AND YEAR END FINANCIAL AND OPERATING RESULTS CALGARY, ALBERTA (March 14, 2019) - Bellatrix Exploration Ltd. ( Bellatrix,
Corporate Presentation. January 2017
 Corporate Presentation January 2017 Future Oriented Information (See additional advisories at the end of this document) In the interest of providing information regarding Paramount Resources Ltd. ("Paramount"
PAINTED PONY ANNOUNCES A 52% INCREASE IN PROVED PLUS PROBABLE RESERVES TO 1.7 TCFE WITH A NET PRESENT VALUE DISCOUNTED AT 10% OF $1.
 1 FOR IMMEDIATE RELEASE March 4, 2014 PAINTED PONY ANNOUNCES A 52% INCREASE IN PROVED PLUS PROBABLE RESERVES TO 1.7 TCFE WITH A NET PRESENT VALUE DISCOUNTED AT 10% OF $1.5 BILLION March 4, 2014 Calgary,
SURVIVE TO THRIVE 2016 CAPP SCOTIABANK INVESTMENT SYMPOSIUM
 SURVIVE TO THRIVE 2016 CAPP SCOTIABANK INVESTMENT SYMPOSIUM April 12, 2016 1 CORPORATE PROFILE Corporate Summary Q4/2015 Avg. Daily Production 67,934 boe/d Production Mix 1 ~60% liquids/40% gas Corporate
Year-end 2017 Reserves
 Year-end 2017 Reserves Baytex's year-end 2017 proved and probable reserves were evaluated by Sproule Unconventional Limited ( Sproule ) and Ryder Scott Company, L.P. ( Ryder Scott ), both independent qualified
January 2018 HIGH-MARGIN, LIQUIDS-RICH PRODUCTION IN THE WORLD- CLASS MONTNEY BIGSTONE REGION
 January 2018 HIGH-MARGIN, LIQUIDS-RICH PRODUCTION IN THE WORLD- CLASS MONTNEY BIGSTONE REGION WHY OWN DELPHI. Pure play MONTNEY E&P company with WORLD CLASS ASSETS: Robust well economics driven by: High
NEWS RELEASE. March 21, 2017
 NEWS RELEASE March 21, 2017 RMP Energy Provides Operations Update Highlighting Elmworth Delineation Success, Updates Market Guidance and Reports Year-End Reserves and Fiscal 2016 Financial Results Calgary,
Q Third Quarter Report
 Q3 2018 Third Quarter Report Financial and Operating Highlights 2018 2017 2018 2017 Financial ($000, except as otherwise indicated) Sales including realized hedging (3) $ 57,928 $ 51,706 $ 176,625 $ 193,832
Predictable & Sustainable Per Share Growth
 Predictable & Sustainable Per Share Growth January 23, 2018 T V E : T S X www.tamarackvalley.ca 1 Disclaimers Forward Looking Statements Certain information included in this presentation constitutes forward-looking
DELPHI ENERGY CORP. REPORTS 2018 YEAR END RESERVES
 DELPHI ENERGY CORP. REPORTS 2018 YEAR END RESERVES CALGARY, ALBERTA March 4, 2019 Delphi Energy Corp. ( Delphi or the Company ) is pleased to announce its crude oil and natural gas reserves information
Peters & Co North American Oil & Gas Conference September 11, 2012 The Game Plan Robert J. Waters, Senior Vice-President and Chief Financial
 Peters & Co. 2012 North American Oil & Gas Conference September 11, 2012 The Game Plan Robert J. Waters, Senior Vice-President and Chief Financial Officer Corporate Profile Ticker Symbol (TSX & NYSE) ERF
BONTERRA ENERGY CORP. AGM EFFICIENT SUSTAINABLE DISCIPLINED
 BONTERRA ENERGY CORP. AGM EFFICIENT SUSTAINABLE DISCIPLINED FORWARD LOOKING INFORMATION Certain statements contained in this Presentation include statements which contain words such as anticipate, could,
18-10 November 14, 2018
 18-10 November 14, 2018 BIRCHCLIFF ENERGY LTD. ANNOUNCES STRONG THIRD QUARTER 2018 RESULTS, STRATEGIC MONTNEY LAND ACQUISITION IN POUCE COUPE AND PRELIMINARY 2019 PLANS Calgary, Alberta Birchcliff Energy
NEWS RELEASE MARCH 6, 2018 TOURMALINE GROWS 2017 CASH FLOW BY 65%, DELIVERS EARNINGS OF $346.8 MILLION, AND ANNOUNCES INAUGURAL DIVIDEND IN Q1 2018
 NEWS RELEASE MARCH 6, 2018 TOURMALINE GROWS 2017 CASH FLOW BY 65%, DELIVERS EARNINGS OF $346.8 MILLION, AND ANNOUNCES INAUGURAL DIVIDEND IN Q1 2018 Calgary, Alberta - Tourmaline Oil Corp. (TSX:TOU) ("Tourmaline"
1 BIRCHCLIFF ENERGY LTD.
 BIRCHCLIFF ENERGY LTD. ANNOUNCES STRONG THIRD QUARTER 2018 RESULTS, STRATEGIC MONTNEY LAND ACQUISITION IN POUCE COUPE AND PRELIMINARY 2019 PLANS November 14, 2018, Calgary, Alberta Birchcliff Energy Ltd.
CEQUENCE ENERGY ANNOUNCES 35% GROWTH IN RESERVES AND 2012 FINANCIAL AND OPERATING RESULTS
 CEQUENCE ENERGY ANNOUNCES 35% GROWTH IN RESERVES AND 2012 FINANCIAL AND OPERATING RESULTS CALGARY, March 7, 2013 Cequence Energy Ltd. ("Cequence" or the "Company") (TSX: "CQE") is pleased to announce its
TSXV: TUS September 8, 2015
 TSXV: TUS September 8, 2015 TSXV: TUS SEPTEMBER 8, 2015 2 Why Buy Tuscany Now? Tuscany has built a large inventory of horizontal oil locations on properties with significant potential oil in place 80 to
Corporate Presentation. March 2017
 Corporate Presentation March 2017 Future Oriented Information (See additional advisories at the end of this document) In the interest of providing information regarding Paramount Resources Ltd. ("Paramount"
NEWS RELEASE FEBRUARY 14, 2018 TOURMALINE ADDS 558 MMBOE OF 2P RESERVES, GROWS LIQUID RESERVES BY 73% AND 2P RESERVE VALUE BY $2.
 NEWS RELEASE FEBRUARY 14, 2018 TOURMALINE ADDS 558 MMBOE OF 2P RESERVES, GROWS LIQUID RESERVES BY 73% AND 2P RESERVE VALUE BY $2.4 BILLION (1) Calgary, Alberta - Tourmaline Oil Corp. (TSX:TOU) ( Tourmaline
Tuscany has built a large inventory of horizontal oil locations
 TSXV: TUS June 2015 TSXV: TUS June 2015 2 Why Buy Tuscany Now? Tuscany has built a large inventory of horizontal oil locations 80 to 191 potential locations in eight areas (1) 34 of potential locations
NEWS RELEASE NOVEMBER 7, 2018
 NEWS RELEASE NOVEMBER 7, 2018 TOURMALINE DELIVERS STRONG Q3 EARNINGS AND CASH FLOW GROWTH, INCREASES 2018 EXIT AND 2019 PRODUCTION ESTIMATES AND REDUCES 2019 CAPITAL PROGRAM Calgary, Alberta - Tourmaline
Corporate Presentation. December 2017
 Corporate Presentation December 2017 Advisory Regarding Forward-Looking Information and Statements This presentation contains forward-looking statements and forward-looking information within the meaning
Bengal Energy Announces Fourth Quarter and Fiscal 2018 Year End and Reserve Results
 June 19, 2018 Bengal Energy Announces Fourth Quarter and Fiscal 2018 Year End and Reserve Results Calgary, Alberta Bengal Energy Ltd. (TSX: BNG) ("Bengal" or the "Company") today announces its financial
News Release March 7, Parex Resources Announces 2016 Fourth Quarter and Full Year Results
 News Release March 7, 2017 Parex Resources Announces 2016 Fourth Quarter and Full Year Results Calgary, Canada Parex Resources Inc. ( Parex or the Company ) (TSX:PXT) is pleased to announce its financial
CEQUENCE ENERGY ANNOUNCES 2015 INDEPENDENT RESERVES EVALUATION
 CEQUENCE ENERGY ANNOUNCES 2015 INDEPENDENT RESERVES EVALUATION CALGARY, February 22, 2016 Cequence Energy Ltd. ("Cequence" or the "Company") (TSX: CQE) is pleased to announce the results of its year end
SPARTAN ENERGY CORP. ANNOUNCES STRATEGIC LIGHT OIL ASSET ACQUISITION IN SOUTHEAST SASKATCHEWAN AND $505 MILLION EQUITY FINANCINGS
 Suite 500, 850 2 nd Street SW Calgary, AB T2P 0R8 Canada Ph.: (403) 355-8920 Fax: (403) 355-2779 SPARTAN ENERGY CORP. ANNOUNCES STRATEGIC LIGHT OIL ASSET ACQUISITION IN SOUTHEAST SASKATCHEWAN AND $505
BELLATRIX ANNOUNCES 2018 YEAR END RESERVES HIGHLIGHTED BY 13% RESERVE GROWTH AND LOW COST RESERVE ADDITIONS
 For Immediate Release Calgary, Alberta TSX: BXE BELLATRIX ANNOUNCES 2018 YEAR END RESERVES HIGHLIGHTED BY 13% RESERVE GROWTH AND LOW COST RESERVE ADDITIONS CALGARY, ALBERTA (March 14, 2019) Bellatrix Exploration
BAYTEX ANNOUNCES CLOSING OF STRATEGIC COMBINATION WITH RAGING RIVER, UPDATED 2018 GUIDANCE AND CONFIRMATION OF PRELIMINARY 2019 PLANS
 BAYTEX ANNOUNCES CLOSING OF STRATEGIC COMBINATION WITH RAGING RIVER, UPDATED 2018 GUIDANCE AND CONFIRMATION OF PRELIMINARY 2019 PLANS CALGARY, ALBERTA (August 22, 2018) Baytex Energy Corp. ( Baytex )(TSX,
INPLAY OIL CORP. PROVIDES OPERATIONS UPDATE AND 2019 CAPITAL BUDGET
 PRESS RELEASE INPLAY OIL CORP. PROVIDES OPERATIONS UPDATE AND 2019 CAPITAL BUDGET Calgary, Alberta: January 22, 2019 InPlay Oil Corp. ("InPlay" or the Company ) (TSX: IPO, OTCQX: IPOOF) is pleased to announce
Tamarack Valley Energy Ltd. Announces Record 2017 Financial and Operating Results and a 53% Increase in Proved Developed Producing Reserves
 TSX: TVE Tamarack Valley Energy Ltd. Announces Record 2017 Financial and Operating Results and a 53% Increase in Proved Developed Producing Reserves Calgary, Alberta March 6, 2018 Tamarack Valley Energy
News Release January 9, Parex Announces Drilling Success on Aguas Blancas and Cabrestero Blocks and Continued Production Growth on LLA-34
 News Release January 9, 2017 Parex Announces Drilling Success on Aguas Blancas and Cabrestero Blocks and Continued Production Growth on LLA-34 Calgary, Canada Parex Resources Inc. ( Parex or the Company
LGX OIL + GAS INC. ANNOUNCES YEAR-END RESERVES AND FINANCIAL RESULTS AND FILING OF ANNUAL INFORMATION FORM
 NEWS RELEASE April 22, 2016 LGX OIL + GAS INC. ANNOUNCES YEAR-END RESERVES AND FINANCIAL RESULTS AND FILING OF ANNUAL INFORMATION FORM CALGARY, ALBERTA (April 22, 2016) LGX Oil + Gas Inc. ( LGX or the
Scotiabank CAPP Conference April 2016 CORPORATE PRESENTATION
 Scotiabank CAPP Conference April 2016 CORPORATE PRESENTATION DISCLAIMER Certain information regarding RMP Energy Inc. ( RMP ) (the Company ) contained within this corporate presentation may constitute
Advantage Announces Creation of an Oil-weighted Subsidiary Longview Oil Corp. Longview Files Preliminary Prospectus for IPO
 NOT FOR DISTRIBUTION TO THE U.S. NEWS WIRES SERVICES OR DISSEMINATION IN THE UNITED STATES March 7, 2011 Advantage Announces Creation of an Oil-weighted Subsidiary Longview Oil Corp. Longview Files Preliminary
NOT FOR DISTRIBUTION TO THE U.S. NEWSWIRE OR FOR DISSEMINATION IN THE UNITED STATES
 PRESS RELEASE CRESCENT POINT ANNOUNCES STRATEGIC BAKKEN WATERFLOOD CONSOLIDATION ACQUISITION, A $525 MILLION BOUGHT DEAL FINANCING AND UPWARDLY REVISED 2012 GUIDANCE NOT FOR DISTRIBUTION TO THE U.S. NEWSWIRE
Corporate Presentation. April, 2017
 Corporate Presentation April, 2017 Future Oriented Information (See additional advisories at the end of this document) In the interest of providing information regarding Paramount Resources Ltd. ("Paramount"
SUSTAINABLE DIVIDEND & GROWTH September 2018
 SUSTAINABLE DIVIDEND & GROWTH September 2018 Cardinal Profile Shares Outstanding TSX: CJ Basic (1) Diluted (excluding debentures) 114.2 MM 117.9 MM 2018 Annual Dividend ($/share) $0.42 2018 Average Production
FORM F1 STATEMENT OF RESERVES DATA AND OTHER OIL AND GAS INFORMATION. Year Ended December 31, 2016
 FORM 51-101F1 STATEMENT OF RESERVES DATA AND OTHER OIL AND GAS INFORMATION Year Ended December 31, 2016 March 2, 2017 TABLE OF CONTENTS DATE OF STATEMENT AND RELEVANT DATES... 1 DISCLOSURE OF RESERVES