INVESTOR PRESENTATION. Financial Year 2012
|
|
|
- Prudence Matthews
- 5 years ago
- Views:
Transcription
1 INVESTOR PRESENTATION Financial Year
2 Disclaimer The information contained in this document has been provided on the basis of current knowledge, assumptions and expectations. In the event that any information is incorrect or any party misrepresented, Burgan Bank and its consultants cannot be held responsible for this. Various factors could cause future results, performance or events to differ materially from those given in this document. No obligation is undertaken to update this document or the statements / information contained in it. The information contained in this document should by no means be interpreted as an invitation to making any investment decision based on the same. Our continuous advice is that every investor must rely on his/her own advisor and resources to ensure the correctness of the information presented to him/her and then makes his/her investment decision accordingly. 2
3 Agenda 2012: Key Highlights Financial Performance Inorganic Highlights Capital Adequacy Performance vs. Peers Conclusion Appendix 3

4 2012: Key Highlights 4
5 FY 12: Key Highlights of 16% backed by growth in core income outpacing Peers. Solid Business Performance of 10% outperforming Peers reaching KD55.6M. of 27.5% and 21.3% respectively. at 12.4% and at 20.2% in FY 12. Improved Credit Quality drop from 11.5% in FY 11 to 7.1% in FY 12. improved from 131.1% to 171% (198% Ex. BBT). Fortified Balance Sheet of 31.5%. ; Tier 1 Ratio 12.0% & Capital Adequacy Ratio of 18.5%. Inorganic Growth completed transaction of ET in 21 st December 2012 & rebranded as Burgan Bank - Turkey (BBT). Approval received from Kuwait Regulator to acquire 25% stake in FIMBank, Malta. 5
6 Financial Performance 6
7 Strong Financial and Operating Performance Revenue (KD million) (1) 16.4% % Q4 11 Q4 12 FY 11 FY 12 Cost of Credit (KD million) (1) 3,384 2,252 2, Q4 11 Q4 12 FY 10 FY 11 FY 12 Additional Provisions Net Loans in KD million. Net Profit (KD million) (1) Q4 11 Q4 12 FY 11 FY 12 Key Indicators (1) Burgan Bank Group FY 11 FY 12 Revenue Growth (YoY) (0.9)% 16.4% Operating Profit Growth (YoY) 2.4% 16.6% Operating Profit Margin 62.4% 62.6% Cost to Income Ratio 37.6% 37.4% Jaws Ratio (YoY) 5.0% 0.5% Loans to Cust. Deposits 80.6% 86.9% Liquidity Ratio(2) 40.2% 31.5% NPL to Gross Loans 11.5% 7.1% NPL net of Collateral to Gross Loans 3.1% 1.9% ROE 12.0% 12.4% ROTE 21.1% 20.2% (1) Figures are reported after consolidation adjustments. (2) Liquid assets comprises of Cash & Cash eq., Treasury bills & bonds and Due from Banks & OFIS. 7
8 with quality earnings Revenue (KD million) Q1 11 Q1 12 Q2 11 Q2 12 Q3 11 Q3 12 Q4 11 Q4 12 Net Interest Income (2011) Non Interest Income (2011) Net Interest Income (2012) Non Interest Income (2012) BB Consolidated (KD mn) Operating Margin Q1 11 Q2 11 Q3 11 Q4 11 Q1 12 Q2 12 Q3 12 Q % 63.5% 65.7% 60.5% 62.3% 60.9% 64.2% 62.8% NIM^ (%) 2.5% 0.3% 2.5% 0.3% 2.2% 2.6% 2.6% 2.6% 2.2% Q4 11 Q1 12 Q2 12 Q3 12 Q4 12 Due to BBT Acquisition One Off* * One off of KD 2.5mn Revenue composition has remained stable across FY 12. Net interest income as a percent of total income was ~63% in FY12 Contribution of net interest income and Fee income to total income was ~83% in FY 12 Fee income contributed nearly ~54% of total non interest income in FY 12 Post BBT acquisition, earnings quality is expected to remain strong with net interest income and fee income contributing to ~87% of BBT s revenues in FY 12 ^ Net interest income divided by end of period interest earning assets i.e. cash, t-bills and bonds, due from banks and OFIs, loans and advances to customers, investment securities. 8
9 supported by solid balance sheet growth KD (million) Q4 11 Q1 12 Q2 12 Q3 12 Q4 12 (1) Q4 12 Loans & Advances 2,252 2,405 2,592 2,783 2,871 3,384 Total Assets 4,552 4,773 4,967 5,171 5,272 5,977 Deposits 2,796 3,040 3,164 3,330 3,392 3,895 Total Liabilities 3,986 4,205 4,386 4,573 4,652 5,357 Shareholder's Equity Liabilities & Sh. Equity 4,552 4,773 4,967 5,171 5,272 5,977 Assets Progression (KD billion) Liabilities Progression (KD billion) % 27.5% % 21.3% Q4 11 Q1 12 Q2 12 Q3 12 Q4 12 (Ex. BBT) Loans & Advances Total Assets Q4 12 (Inc. BBT) Q4 11 Q1 12 Q2 12 Q3 12 Q4 12 (Ex. BBT) Deposits Total Liabilities Q4 12 (Inc. BBT) (1)Excludes Burgan Bank Turkey. 9
10 and enhanced risk position Non Performing Loans (KD million) and Coverage Ratio % 145% 139% 154% 198% 171% 200% 150% % Q4 11 Q1 12 Q2 12 Q3 12 Q4 12 (Ex. BBT) Q4 12 (Inc. BBT) NPL NPL net of collateral Total provisions Coverage net of collateral 50% 0% NPLs to Gross Loans (%) NPLs net of collateral to Gross Loans Gross Loan Industry Split 2,348 3, % 10.6% 9.4% 8.8% 7.4% 7.1% 3.1% 2.8% 2.8% 2.5% 1.6% 1.9% 13.6% 30.4% 9.9% 15.7% 22.4% 27.0% 9.7% 15.1% 26.6% 19.8% 2011 Q1 12 Q2 12 Q3 12 Q4 12 *Q4 12 (Ex. BBT) (Inc. BBT) 2011 Q1 12 Q2 12 Q3 12 Q4 12 *Q4 12 (Ex. BBT) (Inc. BBT) FY 11 FY 12 Real estate Trade Construction Manufacturing Personal Others 10
11 Solid & improved shareholder returns Quarterly Net Profit (KD million) Annual Net Profit (KD million) Q1 11 Q2 11 Q3 11 Q4 11 Q1 12 Q2 12 Q3 12 Q4 12 FY 11 FY 12 Quarterly ROE (1) Annual ROE (2) % 16.9% 4.9% 3.7% 15.7% 16.4% 16.6% 16.6% 16.2% 7.8% 3.9% 2.4% 17.8% 9.9% 27.8% 26.5% 15.8% 16.3% 3.8% 3.9% 11.7% 13.2% 15.7% 8.6% 16.6% 12.7% 13.8% 7.9% 12.0% 12.4% Q1 11 Q2 11 Q3 11 Q4 11 Q1 12 Q2 12 Q3 12 Q4 12 Additional Provisions EPS for the year (Fils) Annual ROTE FY 11 FY 12 (1) ROE are calculated on a Quarterly basis (2) ROTE excl. additional provisions 11
12 Financial Performance - By Country 12
13 Strong Revenue Diversity Revenue FY 12 (1)(2) Operating Profit Margins FY 12 (1)(2) Burgan Group at KD190.1m. (2) Burgan Group at 62.6%. (2) Kuwait, KD94.2m, 49% Jordan, KD46.2m, 24% 69.6% (3) 70.6% (4) 69.4% (4) 54.1% (4) 57.6% (4) Algeria, KD34.7m, 18% 66.6% 69.2% 66.0% 50.4% Tunisia, KD3.3m, 2% Iraq, KD12.4m, 7% 37.0% Kuwait Jordan Algeria Iraq Tunisia FY 12 Revenues grew 16.4% from FY 11 levels led by Kuwait and Algeria (1) Reported contribution excluding consolidated adjustments. (2) Based on Kuwait CBK Reporting Standards. (3) Kuwait Operating Margins excludes Subdebt cost of KD9.1m. (4) Based on subsidiary local reporting Standards. 13
14 from all the subsidiaries Total Assets (KD mn) Net Loans (KD mn) Customer Deposits (KD mn) 3,273 3,854 1,576 2,054 1,819 2, Kuwait Jordan Algeria Iraq Tunisia FY 11 FY 12 Kuwait Jordan Algeria Iraq Tunisia FY 11 FY 12 Kuwait Jordan Algeria Iraq Tunisia FY 11 FY 12 Revenue (KD mn) Kuwait Jordan Algeria Iraq Tunisia FY 11 FY 12 Operating Profit (KD mn) Kuwait Jordan Algeria Iraq Tunisia FY 11 FY 12 Stable growth in MENA, but risks ahead from jittery global markets & lack of domestic credit growth. Low investment levels in a low interest environment. Burgan Banking Group continue to witness growth in core business. 14
15 and further strengthened by acquisition of BBT Contribution for FY 12 (Actual) (1) Contribution for FY 12 (Pro forma (2) ) (1) 11.1% 15.1% 12.9% 2.5% 4.5% 1.9% 5.9% 6.1% 6.8% 7.0% 15.0% 16.5% 15.4% 1.7% 6.5% 18.2% 24.2% 1.0% 5.0% 4.4% 18.3% 19.9% 10.3% 25.5% 11.1% 15.1% 12.9% 17.7% 8.0% 3.8% 4.2% 0.9% 2.5% 1.9% 4.6% 4.5% 5.9% 19.1% 6.1% 6.8% 1.4% 5.4% 16.9% 7.0% 15.0% 16.5% 15.0% 9.9% 15.4% 23.5% 19.9% 60.8% 60.5% 57.0% 49.4% 50.2% 65.5% 60.8% 60.5% 57.0% 40.7% 46.2% 63.0% Total Assets Customer Loans Customer Deposits Revenue Operating Profit Net Profit^ Total Assets Customer Loans Customer Deposits Revenue Operating Profit Net Profit^ Kuwait Jordan Algeria Iraq Tunisia Turkey Kuwait Jordan Algeria Iraq Tunisia Turkey ^ Net Profit contribution of BB Share; Tunisia Net Profit Contribution NM. (1) Reported contribution excluding consolidated adjustments. (2) Assuming 12 months of Consolidation of BBT in
16 Inorganic Highlights 16
17 BBT: Compelling Business Proposition Tekirdag Izmir 2 1 Mugla Istanbul Kocaeli Bursa Nationwide Network of 61 branches 2 Sakarya Zonguldak Denizli 1 Eskisehir Antalya 6 Ankara 6 Konya Mersin 1 Kayseri 1 Adana Note: Numbers in circles indicate number of branches Samsun 2 Hatay Gaziantep 1 Diyarbakir Coverage Presence in 21 leading industrial and business cities, accounting for ~90% of the Turkish economy 44% of branches located in Istanbul, the country s wealthiest city Modern and rebranded branches with highly scalable IT systems Branch network not operating at full capacity - providing further growth potential KD Million, as on Dec 12 BB, excl Turkey BBT BB + BBT Assets 5, ,977 Strong financial performance Loans Deposits 2,871 3, ,384 3,895 Revenue Net Income
18 resulting in strengthening Business Position Access to Market with High Entry Barriers Opportunity to be part of the growing Turkish banking sector Acquisition of full fledged commercial bank with 61 branches at valuations similar to acquiring a greenfield banking license in a market with high entry barriers Significant trade synergies between Turkey and existing Burgan Bank operations (Kuwait, Jordan, Lebanon, Algeria, Tunisia and Iraq) Opportunity for Burgan Bank to expand its trade funding business Trade Synergy Opportunities Fit with Burgan s Expansion Strategy Strategic fit with operations in a market decoupled from existing operations in oil dependent economies BBT offers the right scale and asset base at the right valuation Burgan Bank s main focus would be to grow the Corporate and SME business in Turkey Related adjacencies to capture the retail business by leveraging on corporate and SME client contacts Cross Selling Opportunities Well Established Banking Platform Established platform offering value added products & services to Corporate, SME, Small Business and Retail clients Scalable - can handle additional flow of business with existing infrastructure & resources at minimal additional expenses Focus on growth in corporate and SME business Achieve operational excellence through integration Implement Burgan Bank s risk framework with appropriate policies, procedures & controls Re-Branded as Burgan Bank, Turkey Future Direction BBT fits with Burgan s regional strategy providing a full fledged and scalable platform that offer upside growth potential, in the right country at the right time 18
19 Capital Adequacy 19
20 Q4'07 Q4'08 Q4'09 Q4'10 Q4'11 Q1'12 Q2'12 Q3'12 Q4'12 Capital Adequacy Trend CAR (FY08 FY 12) 24% 22% 20% 18% 16% 14% 12% 10% 8% 6% 4% 2% 0% 16.6% 13.8% 16.9% Acquired JKB Acquired AGB Acquired BoB Acquired TIB 21.0% Acquisition ET and Issuance of KD 100mn Sub debt 19.6% 18.5% 2,250 2,000 1,750 1,500 1,250 1, Eligible Capital (KD Mn) Historical CAR, Quarterly Tier 1 Cap. Tier 2 Cap. Regulatory Security Optimum Readiness for Growth Actual CAR CAR Walk (FY 11 FY 12) 19.6% (3.5% ) (1.5% ) 2.5% 1.4% 18.5% Pillar II Requirement: 14.1% Regulatory Requirement: 12% FY 11 Impact of BBT Increase in BAU RWAs Additional Sub debt Retained Earnings FY 12 20
21 Performance vs. Peers 21
22 .. Local Peers (FY 12 Vs. FY 11) Net Loans Growth FY 12 vs. FY 11 Deposits Growth FY 12 vs. FY 11 Liquidity Ratio* 104% 87% 20.7% 14.4% 6.2% 50.3% 22.8% 27.5% 39.8% 39.3% 14.1% 18.0% 25.7% 21.3% 23.0% 24.3% 27.3% 28.0% 31.5% (3.8%) (0.3%) (2.0%) (12.5%) (2.5%) (3.0%) NBK ABK GBK CBK Burgan NBK ABK GBK CBK Burgan NBK ABK GBK CBK Burgan Revenue Growth FY 12 vs. FY % 16.4% 19.7% 12.8% 0.6% 0.7% (6.3%) NBK ABK GBK CBK Burgan Net Profit Growth FY 12 vs. FY % 0.9% 0.9% NM (27.2%) (40.3%) NBK ABK GBK CBK Burgan ROTE 26.5% 20.2% 14.5% 6.1% 7.2% (3.2%) NBK ABK GBK CBK Burgan CBK numbers are annualized based on 9M FY 12 reported financials. Loan to Deposits Ratio. ROTE excl. additional provisions. * Liquid assets comprises of Cash & Cash eq., Treasury bills & bonds and Due from Banks & OFIS, 9m 2012 no.s for CBK. Impact of Boubyan acquisition on NBK and BBT Acquisition on Burgan; NBK s P&L numbers have been adjusted for consolidation gains of KD 81.5mn and 58.4% NBK s stake in Boubyan) of KD 6mn (Islamic net profit). 22
23 .. Regional Peers (FY 12 Vs. FY 11) Net Loans Growth FY 12 vs. FY 11 Deposits Growth FY 12 vs. FY 11 Liquidity Ratio* 50.3% 22.8% 28.9% 20.7% 11.3% 16.5% 14.4% 8.2% 9.3% 3.1% 6.2% 27.5% 39.8% 39.3% 34.9% 14.1% 25.7% 7.4% 5.1% 8.9% 5.1% NBK Blom Bank 8.1% 18.0% 21.3% AUB BSF CBQ QNB Audi Burgan 23.0% NBK 33.1% Blom Bank 21.6% 16.5% 15.5% 13.1% 30.2% 31.5% AUB BSF CBQ QNB AUDI Burgan Revenue Growth FY 12 vs. FY 11 Net Profit Growth FY 12 vs. FY 11 ROTE 20.3% 19.7% 9.1% 6.0% 9.9% 4.2% 12.2% 8.2% 16.4% 0.9% 2.6% 8.1% 3.6% 6.8% 11.1% 5.0% 10.0% 26.5% 19.9% 20.2% 17.8% 18.2% 18.1% 14.5% 15.3% 14.1% 0.6% NBK Blom Bank AUB BSF CBQ QNB AUDI Burgan (27.2%) NBK Blom Bank AUB BSF CBQ QNB Audi Burgan NBK Blom Bank AUB BSF CBQ QNB AUDI Burgan Audi Bank Figures are annualized based on 9M FY 12 reported financials expect Deposits and Net Profit are based on FY ROTE excl. additional provisions. * Liquid assets comprises of Cash & Cash eq. Treasury bills & bonds and Due from Banks & OFIS, 9m 2012 no.s for CBK. Impact of Boubyan Acquisition for NBK and ET Acquisition for BB. 23
24 Conclusion 24
25 FY 12: Key Highlights Resilient Business Model in core market despite stagnant economy. with Subsidiaries being profitable & on growth mode. provides further diversified revenue stream through operations in a non-oil economy. Enhance Risk Position improvement. showing considerable Solid Capital Base of 18.5%; Tier 1 Ratio 12.0% & Tier 2 Ratio 6.5%. All leading indicators in place to sustain a solid operating performance 25
26 Thank You 26
27 Appendix 27
28 Share Price Progress Last Twelve Months Share Price Performance vs. Peers Jan-12 Apr-12 Jul-12 Oct-12 Jan-13 NBK CBoK ABK GBK BB Source: Bloomberg. 28
Agenda. Economic Landscape. Financial Performance. Inorganic Highlights. Performance vs. Peers. Conclusion
 1 Disclaimer The information contained in this document has been provided on the basis of current knowledge, assumptions and expectations. In the event that any information is incorrect or any party misrepresented,
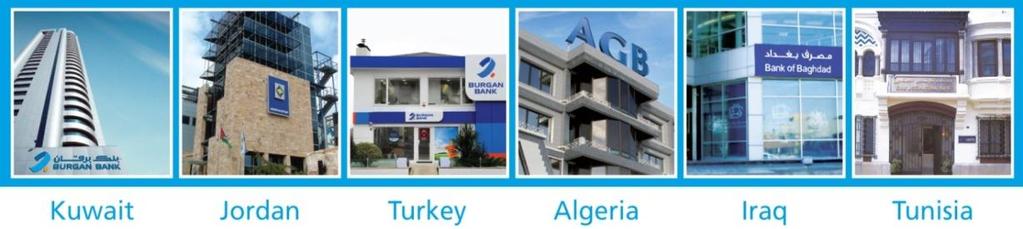
Burgan Bank Group. Investor Presentation. September Burgan Bank Group. Kuwait - Turkey - Algeria - Iraq - Tunisia - Lebanon
 Burgan Bank Group Investor Presentation September 2016 Burgan Bank Group Kuwait - Turkey - Algeria - Iraq - Tunisia - Lebanon AGENDA OPERATING ENVIRONMENT BUSINESS PERFORMANCE SUMMARY 2 OPERATING ENVIRONMENT
Ready to Spring. Investor Presentation. Monday 5th April, 2010
 Ready to Spring Investor Presentation Monday 5th April, 2010 Disclaimer The information contained in this document has been provided on the basis of current knowledge, assumptions and expectations. In
SEM Service Excellence Management. Overview with 2014 Financials
 SEM Service Excellence Management Overview with Financials February 2015 The NBG Group Corporate information The National Bank, with dominant presence in the Greek banking market and strong profile in
Finansbank Overview with 2012 Financial Results
 Finansbank Overview with 2012 Financial Results Investor Relations March 2013 Index NBG Group Finansbank overview Financials Macroeconomic indicators 1 The NBG Group Corporate information National Bank
Finansbank Overview with Q Financial Results. Investor Relations August 2014
 Finansbank Overview with Q2 2014 Financial Results Investor Relations August 2014 Agenda NBG Group Finansbank Overview Financials Macroeconomic Indicators 1 The NBG Group Corporate information The National
Finansbank Overview with Q3 13 Financial Results
 Finansbank Overview with Financial Results Investor Relations November 2013 Index NBG Group Finansbank overview Financials Macroeconomic indicators 1 The NBG Group Corporate information The National Bank,
Shahan Keushgerian Saugata Sarkar, CFA, CAIA
 Burgan Bank Group (BURG) Recommendation ACCUMULATE Risk Rating R-4 Share Price KWd 285 Target Price KWd 335 Implied Upside +19.2% Cheapest Bank in Kuwait; Initiating with an Accumulate Burgan Bank is the
Finansbank Overview with Q1 13 Financial Results
 Finansbank Overview with Financial Results Investor Relations May 2013 Index NBG Group Finansbank overview Financials Macroeconomic indicators 1 The NBG Group Corporate information National Bank of Greece,
Alternatif Bank. International Financial Institutions, June 2018
 Alternatif Bank International Financial Institutions, June 2018 Contents 1. Turkish Macroeconomy and Regulatory Environment 2. Alternatif Bank Overview 3. Ownership 4. Business Strategy 5. Financial Overview
Table of contents. (1) Introduction. (2) The Factoring Industry. (3) Lider Faktoring Business Overview
 Introduction. (2) The Factoring Industry. (3) Lider Faktoring Business Overview") Table of contents (1) Introduction (2) The Factoring Industry (3) Lider Faktoring Business Overview (4) Lider Faktoring Risk Management and Asset Quality (5) Lider Faktoring Financial Overview 1 (1) Introduction
Table of contents (1) Introduction (2) The Factoring Industry (3) Lider Faktoring Business Overview (4) Lider Faktoring Risk Management and Asset Quality (5) Lider Faktoring Financial Overview 1 (1) Introduction
EMPLOYMENT MONITORING BULLETIN
 26.01.2018 ISSUE 68 The Number of Applicants for Unemployment Compensation Decreased by 20 Thousand In One Year In November 2017,the number of applicants for unemployment compensation decreased by 20 thousand
BCS Workshop, Brussels. November 10-11, GfK Türkiye. Ekim 2008
 Tüketicinin Implementing Nabzı Consumer Araştırması Survey Raporu in Turkey Ekim 8 Contents 1 Overview of Methodology & Sampling 2 Consumer Confidence Indicator for Turkey 3 Demographic Implications of
National Bank of Kuwait (NBK)
") National Bank of Kuwait (NBK) Recommendation ACCUMULATE Risk Rating R-3 Share Price KWD748 Target Price KWD856 Implied Upside +14.5% Dominant Franchise with Strong Fundamentals NBK is the most profitable
National Bank of Kuwait (NBK) Recommendation ACCUMULATE Risk Rating R-3 Share Price KWD748 Target Price KWD856 Implied Upside +14.5% Dominant Franchise with Strong Fundamentals NBK is the most profitable
EMPLOYMENT MONITORING BULLETIN
 21.12.2017 ISSUE 67 The Number of SMEs Increased by 101 Thousand in a Year Using the Social Security Institution (SSI) data for September 2017, the 67th issue of TEPAV s Employment Monitoring Bulletin
It takes two to tango: What is the model of the model partnership?
 tepav Economic Policy Research Foundation of Turkey It takes two to tango: What is the model of the model partnership? Güven Sak July 15th, 2011 Istanbul Slide 2 Framework Where is Turkey now? Turkey s
Burgan Bank A.Ş. Turkey (BBT)
") Burgan Bank A.Ş. Turkey (BBT) December 2017 Presentation (BRSA Consolidated) Burgan Bank Group 1 Burgan Kuwait Bank Turkey - Iraq March Algeria 2014 Tunisia 1 Operating Environment Macro Economic Outlook
Burgan Bank A.Ş. Turkey (BBT) December 2017 Presentation (BRSA Consolidated) Burgan Bank Group 1 Burgan Kuwait Bank Turkey - Iraq March Algeria 2014 Tunisia 1 Operating Environment Macro Economic Outlook
EMPLOYMENT MONITORING BULLETIN
 22.02.2018 ISSUE 69 Employment Increased by 972 Thousand in a Year, Decreased 48 Thousand in a Month The number of employees in formal employment increased by 7,2 percent in November 2017 compared to November
Investor Presentation INVESTOR PRESENTATION. 30 JUNE 2018 İŞ LEASİNG June Investor Relations
 1 INVESTOR PRESENTATION 30 JUNE 2018 Leasing Sector in Turkey Leasing Leasing advantages 3 VAT is %1 for various types of machinery Expertise on SMEs, consultancy and know-how support in addition to funding
Gulf Bank Investor Presentation Year- End 2018
 Gulf Bank Investor Presentation Year- End 2018 February 2019 Disclaimer THE INFORMATION SET OUT IN THIS PRESENTATION AND PROVIDED IN THE DISCUSSION SUBSEQUENT THERETO DOES NOT CONSTITUTE AN OFFER OR SOLICITATION
Burgan Bank A.Ş. Turkey (BBT)
") Burgan Bank A.Ş. Turkey (BBT) March 2018 Presentation (BRSA Consolidated) Burgan Bank Group 1 Burgan Kuwait Bank Turkey - Iraq March Algeria 2014 Tunisia 1 Operating Environment Macro Economic Outlook
Burgan Bank A.Ş. Turkey (BBT) March 2018 Presentation (BRSA Consolidated) Burgan Bank Group 1 Burgan Kuwait Bank Turkey - Iraq March Algeria 2014 Tunisia 1 Operating Environment Macro Economic Outlook
REPUBLIC OF TURKEY MINISTRY OF ECONOMY NEW INVESTMENT INCENTIVES PROGRAM
 REPUBLIC OF TURKEY MINISTRY OF ECONOMY NEW INCENTIVES PROGRAM June, 2012 1 The New Investment Incentives Program General Investment Incentive Scheme Regional Investment Incentive Scheme Large Scale Investment
Shahan Keushgerian Saugata Sarkar, CFA, CAIA
 Gulf Bank (GBK) Recommendation OUTPERFORM Risk Rating R-3 Share Price KWd 268 Target Price KWd 325 Implied Upside +21.2% Restructuring Process Has Been a Success; Initiate With Outperform Gulf Bank has
EMPLOYMENT MONITORING BULLETIN
 24.07.2017 ISSUE 62 Jan-13 Apr-13 Jul-13 Oct-13 Jan-14 Apr-14 Jul-14 Oct-14 Jan-15 Apr-15 Jul-15 Oct-15 Jan-16 Apr-16 Jul-16 Oct-16 Jan-17 EMPLOYMENT Methodology Change in the Social Security Institution
Investor Presentation INVESTOR PRESENTATION. 31 MARCH 2018 İŞ LEASİNG March Investor Relations
 1 INVESTOR PRESENTATION 31 MARCH 2018 Leasing Sector in Turkey Leasing Leasing advantages 3 VAT is %1 for various types of machinery Expertise on SMEs, consultancy and know-how support in addition to funding
Burgan Bank A.Ş. Turkey (BBT)
") Burgan Bank A.Ş. Turkey (BBT) September 2017 Presentation (BRSA Consolidated) Burgan Bank Group 1 Burgan Kuwait Bank Turkey - Iraq March Algeria 2014 Tunisia 1 Operating Environment Macro Economic Outlook
Burgan Bank A.Ş. Turkey (BBT) September 2017 Presentation (BRSA Consolidated) Burgan Bank Group 1 Burgan Kuwait Bank Turkey - Iraq March Algeria 2014 Tunisia 1 Operating Environment Macro Economic Outlook
Transformative Power of Private Equity in Turkey
 tepav Economic Policy Research Foundation of Turkey Transformative Power of Private Equity in Turkey Guven Sak, Berlin, Super Returns Conference 27 February 2012 Slide 2 Framework Current economic environment
Investor Presentation. June 2018
 Investor Presentation June 2018 Contents Bank Muscat Introduction Operating environment Bank Muscat business - Overview Financial Performance Annexure Note: The financial information is updated as of 30
Investor Relations Presentation December 2012
 Investor Relations Presentation December 2012 Contents 1. QNB at a Glance 2. QNB Comparative Positioning Qatar and MENA 3. Financial Highlights December 2012 4. Economic Overview 2 QNB at a Glance QNB
Investor Presentation 30 Sept 2017
 Investor Presentation 30 Sept 2017 Leasing Sector in Turkey 3 LEASING VAT is %1 for various types of machinery Sale&lease back has been added to product range in 2013 Expertise on SMEs, consultancy and
Burgan Bank A.Ş. Turkey (BBT)
") Burgan Bank A.Ş. Turkey (BBT) September 2018 Presentation (BRSA Consolidated) Burgan Bank Group 1 Burgan Kuwait Bank Turkey - Iraq March Algeria 2014 Tunisia 1 Operating Environment Macro Economic Outlook
Burgan Bank A.Ş. Turkey (BBT) September 2018 Presentation (BRSA Consolidated) Burgan Bank Group 1 Burgan Kuwait Bank Turkey - Iraq March Algeria 2014 Tunisia 1 Operating Environment Macro Economic Outlook
Investor Presentation 31 Dec 2017
 Investor Presentation 31 Dec 2017 Leasing Sector in Turkey 3 LEASING VAT is %1 for various types of machinery Sale&lease back has been added to product range in 2013 Expertise on SMEs, consultancy and
Investor Presentation INVESTOR PRESENTATION. 30 SEPTEMBER 2018 İŞ LEASİNG September Investor Relations
 1 INVESTOR PRESENTATION 30 SEPTEMBER 2018 Leasing Sector in Turkey Leasing Leasing advantages 3 VAT is %1 for various types of machinery Expertise on SMEs, consultancy and know-how support in addition
PRESENTATION INTERNATIONAL FINANCIAL INSTITUTIONS SEPTEMBER Nov Version
 PRESENTATION INTERNATIONAL FINANCIAL INSTITUTIONS SEPTEMBER 2017 21 Nov. 2017 Version Contents 01 02 03 04 05 06 Section 1 ABank Overview Section 2 Ownership Section 3 Business Strategy Section 4 Financial
Qatar National Bank (QNB)
") Feb-15 Mar-15 Apr-15 May-15 Jun-15 Jul-15 Aug-15 Sep-15 Oct-15 Nov-15 Dec-15 Jan-16 Feb-16 Global Research Investment Update Equity Qatar Banking Sector 15 February, 2016 (QNB) Market Data Bloomberg Code:
Feb-15 Mar-15 Apr-15 May-15 Jun-15 Jul-15 Aug-15 Sep-15 Oct-15 Nov-15 Dec-15 Jan-16 Feb-16 Global Research Investment Update Equity Qatar Banking Sector 15 February, 2016 (QNB) Market Data Bloomberg Code:
Investor Presentation. March 2018
 Investor Presentation March 2018 Contents Bank Muscat Introduction Operating environment Bank Muscat business - Overview Financial Performance Annexure Note: The financial information is updated as of
REPUBLIC OF TURKEY MINISTRY OF ECONOMY THE FRAMEWORK OF NEW INVESTMENT INCENTIVES PROGRAM IN TURKEY
 THE FRAMEWORK OF NEW INVESTMENT INCENTIVES PROGRAM IN TURKEY The new investment incentives program, which will be effective from the 1 st January 2012 comprises 4 different schemes: 1- General 2- Regional
Investor Presentation. Sep 2018
 Investor Presentation Sep 2018 Contents Bank Muscat Introduction Operating environment Bank Muscat business - Overview Financial Performance Annexure Note: The financial information is updated as of 30
REPUBLIC OF TURKEY MINISTRY OF ECONOMY THE FRAMEWORK OF NEW INVESTMENT INCENTIVES PROGRAM IN TURKEY
 THE FRAMEWORK OF NEW INVESTMENT INCENTIVES PROGRAM IN TURKEY The new investment incentives program, which will be effective from the 1 st January 2012 comprises 4 different schemes: 1- General 2- Regional
Şekerbank T.A.Ş. Presentation on the Consolidated Financial Results as of
 Şekerbank T.A.Ş. Presentation on the Consolidated Financial Results as of 30.09.2018 Table of content 1. Şekerbank At a Glance 2 2. Balance Sheet Structure and Asset Quality 8 3. 4. 5. Funding Structure
ABU DHABI COMMERCIAL BANK PJSC REPORTS FIRST QUARTER 2015 NET PROFIT OF AED BN, AN INCREASE OF 13% YEAR ON YEAR, AND 22% QUARTER ON QUARTER
 Abu Dhabi Commercial Bank Sheikh Zayed Street P. O. Box: 939, Abu Dhabi http://www.adcb.com Press Release: Immediate Release ABU DHABI COMMERCIAL BANK PJSC REPORTS FIRST QUARTER 2015 NET PROFIT OF AED
Record first quarter earnings
 Record first quarter earnings DBS Group Holdings 2015 financial results April 27, 2015 Disclaimer: The information contained in this document is intended only for use during the presentation and should
Investor. Subject: Presentation. Department: December 2017
 Investor Subject: Presentation Department: December 2017 Agenda I. bank muscat introduction 4 II. Operating Environment 7 III. bank muscat Business Overview 12 IV. Financial Performance 20 V. Annexure
Earnings Presentation
 Earnings Presentation BRSA Bank-Only 1Q 2017 May 10, 2017 VakıfBank IR App. Available at Jan-16 Feb-16 Mar-16 Apr-16 May-16 Jun-16 Jul-16 Aug-16 Sep-16 Oct-16 Nov-16 Dec-16 Jan-17 Feb-17 Mar-17 Apr-17
Qatar Banking. Qatar Banks - Result Update 3Q11. Global Research Sector - Banking Equities - Qatar December 7, 2011
 Qatar Banking Global Research Sector - Banking Equities - Qatar December 7, 2011 Qatar Banks - Result Update 3Q11 Profitability jumps by 17%YoY and 3% QoQ in 3Q11 Top-line grows on account of volume growth
REPUBLIC OF TURKEY MINISTRY OF ECONOMY INVESTMENT INCENTIVES PROGRAM
 REPUBLIC OF TURKEY MINISTRY OF ECONOMY S PROGRAM August 2017 1 Support Measures Support Measures General Investment Incentive Scheme Regional Investment Incentive Scheme Priority Investment Incentive Scheme
BBVA posts highest quarterly profit in three years: 1.34 billion (+12 percent YoY)
") Press release 04.27.2018 January - March 2018 BBVA posts highest quarterly profit in three years: 1.34 billion (+12 percent YoY) Transformation: Digital sales grew in all regions and accounted for 37 percent
Press release 04.27.2018 January - March 2018 BBVA posts highest quarterly profit in three years: 1.34 billion (+12 percent YoY) Transformation: Digital sales grew in all regions and accounted for 37 percent
Investor Relations Presentation April 2012
 Investor Relations Presentation April 2012 Contents 1. QNB at a Glance 2. Qatar Banking Sector 3. Financial Highlights March 2012 4. Economic Overview 2 QNB at a Glance QNB at a Glance: Overview Overview
Investor Presentation - Second Quarter August 2018 Cairo, Egypt
 Investor Presentation - Second Quarter 2018 1 August 2018 Cairo, Egypt Table of Contents I. Macro Overview Economic Fundamentals Results in Perspective II. Consolidated Results Group Highlights Consolidated
GCC Banking. GCC Banking Sector Quarterly 2Q13. Global Research Sector-Banking September 2013
 213e ROE 3-yr Earnings CAGR GCC Banking Global Research Sector-Banking September 213 GCC Banking Sector Quarterly GCC banks report double-digit YoY growth in profitability, with leading Growth in net interest
3Q16 Results. October, 27 th Carlos Torres Vila Chief Executive Officer
 3Q16 Results October, 27 th 2016 Carlos Torres Vila Chief Executive Officer 2 Disclaimer This document is only provided for information purposes and does not constitute, nor should it be interpreted as,
Earnings Presentation BRSA Bank-Only 1Q2009
 Earnings Presentation BRSA Bank-Only 1Q2009 15 May 2009 1 1Q 2009 Vakifbank Highlights Conservative lending continues; total loan growth 2,5% QoQ. Strong growth in securities book,12% QoQ; TL securities
HSBC GEMs Investor Forum London 3 4 September 2018
 HSBC GEMs Investor Forum 2018 - London 3 4 September 2018 Disclaimer This presentation may contain certain forward-looking statements concerning MLP Care s future performance and should be considered as
Investor Relations Presentation December 2013
 Investor Relations Presentation December 2013 Contents 1. QNB at a Glance 2. QNB Comparative Positioning Qatar and MENA 3. Financial Highlights as at 31 December 2013 4. Economic Overview Notes: These
HSBC Non-deal Roadshow, Paris - London April 2018
 HSBC Non-deal Roadshow, Paris - London 6-9 April 208 Disclaimer This presentation may contain certain forward-looking statements concerning MLP Care s future performance and should be considered as good
EMPLOYMENT MONITORING BULLETIN
 29.09.2017 ISSUE 64 The Number of Companies Decreased Only in Istanbul in a Year In 2017, the 64th issue of TEPAV s Employment Monitoring Bulletin indicates that the total number of companies decreased
TÜRKİYE VAKIFLAR BANKASI T.A.O. Covered Bond Programme (Turkey) Monthly Investor Report: [01/02/2018] to [28/02/2018] Cut-off date: [28/02/2018]
![TÜRKİYE VAKIFLAR BANKASI T.A.O. Covered Bond Programme (Turkey) Monthly Investor Report: [01/02/2018] to [28/02/2018] Cut-off date: [28/02/2018]](/thumbs/89/99811956.jpg "TÜRKİYE VAKIFLAR BANKASI T.A.O. Covered Bond Programme (Turkey) Monthly Investor Report: [01/02/2018] to [28/02/2018] Cut-off date: [28/02/2018]") 1. PROGRAMME OVERVIEW 1.1 Group Group parent company Group consolidated financial information (link) T. Vakıflar Bankası T.A.O. T. Vakıflar Bankası T.A.O. http://www.vakifbank.com.tr/tas-consolidated.aspx?pageid=646
1. PROGRAMME OVERVIEW 1.1 Group Group parent company Group consolidated financial information (link) T. Vakıflar Bankası T.A.O. T. Vakıflar Bankası T.A.O. http://www.vakifbank.com.tr/tas-consolidated.aspx?pageid=646
Bank Handlowy w Warszawie S.A.
 Bank Handlowy w Warszawie S.A. Consolidated financial results for 1Q 2018 May 11 2018 www.citihandlowy.pl Bank Handlowy w Warszawie S.A. 1Q 2018 summary Robust beginning of the year Strong net profit increase:
Investor Presentation Q ahlibank.com.qa
 Investor Presentation Q3 2017 ahlibank.com.qa Overview ABQ Founded in 1983 Shareholding Structure Qatar Foundation (Qatar Investment Authority QIA) 29.41% Listed on the Qatar Exchange with a market cap
Investor. Subject: Presentation. Department: December 2017
 Investor Subject: Presentation Department: December 2017 Agenda I. bank muscat introduction 4 II. Operating Environment 7 III. bank muscat Business Overview 12 IV. Financial Performance 20 V. Annexure
Investor Presentation QI 2016
 Investor Presentation QI 2016 1. Overview 2. Financial Information 3. Business Information 4. Share Information Overview QI 2016 Major Highlights Consistent Annual Income Growth ($M) One of the oldest
Consolidated financial results for 2Q 2017
 Citi Handlowy Strategy and Investor Relations Department Consolidated financial results for 2Q 2017 August 22 nd, 2017 2Q 2017 summary Consistent growth of customer business: Loan volume growth in institutional
Investor Presentation Q ahlibank.com.qa
 Investor Presentation Q1 2018 ahlibank.com.qa Overview ABQ Founded in 1983 Listed on the Qatar Exchange with a market cap of c.qar 6.6 billion 48% owned by Qatar Investment Authority (directly and through
Full-year results 2013
 Full-year results 03 03.03.4 Page Cautionary statement regarding forwardlooking statements This presentation by AG ( the Bank ) includes forward-looking statements that reflect the Bank s intentions, beliefs
EMPLOYMENT MONITORING BULLETIN
 18.08.2017 ISSUE 63 EMPLOYMENT MONITORING Employment Increased by 70 Thousand in a Month, 409 Thousand in a Year Using the Social Security Institution (SSI) data for May 2017, the 63rd issue of TEPAV s
Assessment of 2016 Financial Results Ordinary General Meeting of Shareholders 30 March 2017
 Assessment of 2016 Financial Results Ordinary General Meeting of Shareholders 30 March 2017 RECORD HIGH PROFIT Net Income (TL Million) 3,615 42% 5,148 ROAE 15.4% vs. 12.8% in 2015 TL 300mn free provisions
National Bank of Greece. Acquisition of a Controlling Interest in Finansbank. 3 rd April 2006
 Acquisition of a Controlling Interest in Finansbank 3 rd April 2006 Creating the leading Southeast European banking group Page 2 Transaction Highlights Acquisition of Finansbank Transaction Highlights
BBVA earns 2.65 billion in first half of the year (+15 percent YoY)
") Press release 07.27.2018 January-June 2018 BBVA earns 2.65 billion in first half of the year (+15 percent YoY) Transformation: At the end of June, BBVA s digital customer base stood at 25.1 million (+26
Press release 07.27.2018 January-June 2018 BBVA earns 2.65 billion in first half of the year (+15 percent YoY) Transformation: At the end of June, BBVA s digital customer base stood at 25.1 million (+26
United Overseas Bank Investor Roadshow November 2006
 United Overseas Bank Investor Roadshow November 2006 Disclaimer : This material that follows is a presentation of general background information about the Bank s activities current at the date of the presentation.
Investor Presentation
 Investor Presentation 2018 1. Introduction 2. Financial Overview 3. Business Overview 4. BLOM s Shares 5. Appendix BLOM Bank at a glance 2018 Overview of BLOM Bank BLOM Bank Shareholders BLOM is the most
TÜRKİYE VAKIFLAR BANKASI T.A.O. Covered Bond Programme (Turkey) Monthly Investor Report: [01/10/2016] to [01/11/2016] Cut-off date: [01/11/2016]
![TÜRKİYE VAKIFLAR BANKASI T.A.O. Covered Bond Programme (Turkey) Monthly Investor Report: [01/10/2016] to [01/11/2016] Cut-off date: [01/11/2016]](/thumbs/93/113474320.jpg "TÜRKİYE VAKIFLAR BANKASI T.A.O. Covered Bond Programme (Turkey) Monthly Investor Report: [01/10/2016] to [01/11/2016] Cut-off date: [01/11/2016]") 1. PROGRAMME OVERVIEW 1.1 Group Group parent company Group consolidated financial information (link) T. Vakıflar Bankası T.A.O. T. Vakıflar Bankası T.A.O. http://www.vakifbank.com.tr/tas-consolidated.aspx?pageid=646
1. PROGRAMME OVERVIEW 1.1 Group Group parent company Group consolidated financial information (link) T. Vakıflar Bankası T.A.O. T. Vakıflar Bankası T.A.O. http://www.vakifbank.com.tr/tas-consolidated.aspx?pageid=646
Acquisition of Core Deutsche Bank Polska & DB Securities S.A. 14 December 2017
 Acquisition of Core Deutsche Bank Polska & DB Securities S.A. 14 December 2017 Disclaimer This presentation (the Presentation ) has been prepared by Bank Zachodni WBK S.A. ( ) solely for information purposes
BBVA, a unique growth proposition
 BBVA, a unique growth proposition Erik Schotkamp, Capital & Funding Management Director BBVA Iberian Fixed Income Conference London, June 9th, 2015 1 Disclaimer This document is only provided for information
Wood & Co Annual Conference Prague November 2016
 Wood & Co Annual Conference Prague November 2016 Lokman Hekim o A fast growing private hospital operator in an attractive market o A diversified service provider with extensive footprint in maternity care
National Bank of Greece
 National Bank of Greece Q2.2014 Results August 28 th, 2014 Q2.2014 Results: Highlights National Bank of Greece Results Result Highlights CET1 ratio increases 16.2% post 2.5bn capital increase Group PAT
UAE Banks Improving risk/return profile
 Improving risk/return profile FGB is top pick, Upgrade UNB to BUY BUY ENBD as a Dubai recovery play 3 rd April 2013 Coverage Universe FGB Recommendation BUY Target Price (LC) 16.30 UNB Recommendation BUY
Jun 17 BANK MUSCAT. Ready to face challenges, adequately capitalized, trades at compelling valuations
 Jun 17 BANK MUSCAT Ready to face challenges, adequately capitalized, trades at compelling valuations Bank Muscat Ready to face challenges, adequately capitalized, trades at compelling valuations Closing
Consolidated financial results for 3Q 2017
 Consolidated financial results for 3Q 2017 November 14 th, 2017 www.citihandlowy.pl Bank Handlowy w Warszawie S.A. 3Q 2017 Summary Positive trends continued: Build-up of client assets in Retail Banking
Buy. Morning Call. Bank Al-Falah Limited (BAFL) IFC Capital Injection; EPS Accretive; Revised Earnings, BUY. November 10, 2014
 IFC Capital Injection; EPS Accretive; Revised Earnings, BUY. November 10, 2014") Morning Call November 10, 2014 Bank Al-Falah Limited (BAFL) Banks IFC Capital Injection; EPS Accretive; Revised Earnings, BUY Buy Target Price 38.3 Last Closing Upside 22.3% KSE Code Bloomberg Code Market
Morning Call November 10, 2014 Bank Al-Falah Limited (BAFL) Banks IFC Capital Injection; EPS Accretive; Revised Earnings, BUY Buy Target Price 38.3 Last Closing Upside 22.3% KSE Code Bloomberg Code Market
BBVA earns 4.32 billion in the first nine months
 Press release 10.30.2018 January-September 2018 BBVA earns 4.32 billion in the first nine months Transformation: Digital and mobile customers as well as digital sales continued to grow across all geographies,
MCB Bank Limited. MCB - Expanding its wings. WE Detailed Report
 1 KEY DATA KATS Code MCB Reuters Code MCB.KA Current Price (Rs) 280.71 Year High, Low (Rs) 299, 260.65 Market Cap (Rs' bn) 284 Market Cap (US$ mn) 2,840 Shares Outstanding (mn) 1,012 Free Float (%) 40%
ABU DHABI COMMERCIAL BANK REPORTS SECOND QUARTER 2011 NET PROFIT OF AED 1,335 MN, FIRST HALF 2011 NET PROFIT OF AED 1,918 MN
 Abu Dhabi Commercial Bank Salam Street P. O. Box: 939, Abu Dhabi http://www.adcb.com Press Release: Immediate Release ABU DHABI COMMERCIAL BANK REPORTS SECOND QUARTER 2011 NET PROFIT OF AED 1,335 MN, FIRST
PBT growth slightly ahead of FY guidance. 9th November 2015 EQUITY RESEARCH THE COOPERATIVE BANK 3Q15 RESULTS REVIEW
 PBT growth slightly ahead of FY guidance COOP s PBT increased by 33% y/y to KES 12.2bn, slightly ahead of management s full year guidance of 30%. The beat can be ascribed to a lower base as 9M14 s PBT
ACQUISITION OF FASTMATCH
 ACQUISITION OF FASTMATCH Expanding into a new asset class with the acquisition of a high-growth disruptive player in the FX marketplace 23 May, 2017 KEY HIGHLIGHTS OF THE TRANSACTION Transaction Overview
FULL YEAR 2006 RESULTS FEBRUARY 8, 2006
 FULL YEAR 26 RESULTS FEBRUARY 8, 26 Cautionary Statement Regarding Forward-Looking Information PAGE 2 This presentation may contain projections or other forward looking statements related to EFG Eurobank
QNB Finansbank Q3 17 Earnings Presentation. October 2017
 QNB Finansbank Earnings Presentation October 2017 Banking sector growth continued in thanks to accommodative policy measures Macro Dynamics Banking Sector Dynamics 13 12 11 CBRT Rates Late liquidity O/N
Investor. Subject: Presentation. Department: March 2017
 Investor Subject: Presentation Department: March 2017 Agenda I. bank muscat introduction 4 II. Operating Environment 7 III. bank muscat Business Overview 12 IV. Financial Performance 20 V. Annexure 25
DRAFT. Attica Bank. Q Financial Results. Together we are stronger.
 DRAFT Attica Bank Q3 2018 Financial Results Together we are stronger. www.atticabank.gr 1 Table of Contents MACROECONOMIC REVIEW HIGHLIGHTS FINANCIAL PERFORMANCE ASSET QUALITY FUNDING APPENDIX GLOSSARY
Annual Accounts Annika Falkengren President & CEO
 Annual Accounts 2014 Annika Falkengren President & CEO Unique economic environment Key Interest rates % 2.00 1.80 1.60 1.40 1.20 1.00 0.80 0.60 0.40 0.20 0.00 Jan-14 Sweden Norway Eurozone Feb-14 Mar-14
2015 Second Quarter Results
 2015 Second Quarter Results Madrid, July 31st 2015 2 This document is only provided for information purposes and does not constitute, nor must it be interpreted as, an offer to sell or exchange or acquire,
Investor Presentation QIII 2018
 Investor Presentation QIII 2018 1. Introduction 2. Financial Overview 3. Business Overview 4. BLOM s Shares 5. Appendix BLOM Bank at a glance QIII 2018 Overview of BLOM Bank BLOM Bank Shareholders BLOM
Talanx Strategy Frankfurt, 23 October Torsten Leue, CEO
 Talanx Strategy Frankfurt, 23 October 2018 Torsten Leue, CEO Key messages We commit to an increased RoE of 800 bps above risk-free an annual EPS-growth 5% on average 35% to 45 % payout of IFRS earnings
ACCESS BANK PLC Rights Issue. February 2015
 ACCESS BANK PLC 2015 Rights Issue February 2015 Agenda Overview of Access Bank Rights Issue Rationale 2015 ACCESS BANK PLC 1 Recognised as a leading commercial bank in Nigeria with an extensive distribution
Individual Pension System Progress Report 2013
 Individual Pension System Progress Report 213 Individual Pension System Progress Report 213 besygr@egm.org.tr Electronic version of this document and reference data of selected statistics are available
BANCA TRANSILVANIA. H financial results. August 10 th Clasificare BT: Uz Intern
 BANCA TRANSILVANIA H1 2018 financial results August 10 th 2018 Clasificare BT: Uz Intern Disclaimer The information contained in the present document has not been independently verified and no representation
TMB Bank Plc. Building the Best Transactional Bank. Make THE Difference. Day with Executive Management
 TMB Bank Plc. Building the Best Transactional Bank Day with Executive Management November 1, 215 Make THE Difference AGENDA 3Q15 Financial Performance 9M15 Financial Performance Looking Forward [2] Executive
3Q 2012 Earnings. 14 November 2012 Strong Quarter Underlying Performance on Track 1
 3Q 2012 Earnings Strong Quarter Underlying Performance on Track 14 November 2012 14 November 2012 Strong Quarter Underlying Performance on Track 1 Disclaimer This presentation does not constitute or form
2014 record earnings, broad-based income growth
 record earnings, broad-based growth DBS Group Holdings 4Q financial results February 10, 2015 Disclaimer: The information contained in this document is intended only for use during the presentation and
1Q18 Results April 27 th 2018 / 1. 1Q18 Results. April, 27 th 2018
 April 27 th 2018 / 1 April, 27 th 2018 Disclaimer April 27 th 2018 / 2 This document is only provided for information purposes and does not constitute, nor should it be interpreted as, an offer to sell
Dubai Islamic Bank Group 1 st half 2015 Financial Results H net profit up by 35% to AED 1,801 million
 Press Release: Dubai Islamic Bank Group 1 st half Financial Results H1 net profit up by 35% to AED 1,801 million Dubai, July 29, Dubai Islamic Bank (DFM: DIB), the first Islamic bank in the world and the