Kimberly-Clark Announces Fourth Quarter 2008 Results; Reviews 2009 Business Outlook
|
|
|
- Geraldine Hubbard
- 5 years ago
- Views:
Transcription
1 Kimberly-Clark Announces Fourth Quarter 2008 Results; Reviews 2009 Business Outlook 4Q Net Sales Were $4.6 Billion, a Decrease of Approximately 3 Percent vs. 2007; GAAP-Basis EPS Were $1.01 Compared With $1.07 in 4Q '07 Adjusted EPS Declined 9 Percent to $1.01, Slightly Below Previous Guidance for the Quarter Company Expects Adjusted Earnings Per Share in 2009 Will Be Similar to 2008, in a Range of $4.00 to $4.20, Despite Significant Headwinds from Pension Expense and Currency Effects DALLAS, Jan. 26, 2009-Kimberly-Clark Corporation (NYSE: KMB) today reported that net sales in the fourth quarter of 2008 decreased 3.4 percent to $4.6 billion, as the effect of weaker foreign currency exchange rates more than offset organic sales growth of approximately 5 percent. The growth in organic sales was driven by higher net selling prices, favorable product mix and continued improvement in sales volumes across developing and emerging markets. Overall sales volumes, however, were below prior year levels due primarily to lower shipments of Huggies diapers and Pull-Ups in North America, as well as the company's consumer tissue and K-C Professional products in North America and Europe. Sales volumes for the quarter also trailed planned levels as customer and consumer demand was impacted by deteriorating economic conditions in these geographies. Diluted net income per share for the quarter was $1.01 compared with $1.07 in the prior year. Adjusted earnings were $1.01 per share versus $1.11 per share in the fourth quarter of 2007 and below the company's previous guidance range of $1.02 to $1.07 per share. During the quarter, the company made further progress in improving revenue realization, which contributed to an increase in operating profit margin from recent lows. Nonetheless, operating profit and margin were down compared with the prior year, mainly as a result of higher manufacturing costs, including inflation of about $135 million, and unfavorable currency effects, along with the decline in sales volumes and higher expenses included in other (income) and expense, net. Meanwhile, the company continued to boost marketing investment, increasing spending by more than $25 million compared with the fourth quarter of Overall, currency effects reduced earnings in the fourth quarter of 2008 compared with the prior year by more than 20 cents per share, including approximately 8 cents per share as a result of significant currency losses incurred by the company's equity affiliate, Kimberly-Clark de Mexico. Fourth quarter adjusted earnings per share excludes charges in 2007 for strategic cost reductions to streamline the company's operations and certain incremental implementation costs related to the strategic cost reduction plan. Additional detail on these items and further information about adjusted earnings per share and why the company uses this non-gaap financial measure are provided later in this news release. Chairman and Chief Executive Officer Thomas J. Falk said, "During the fourth quarter, economic weakness impacted our categories more than anticipated, particularly in North America and Europe. We believe some of the effects are temporary, reflecting customer warehouse and consumer pantry inventory reductions; however, consumer trade-down also affected our sales in several categories. We are fine tuning our pricing and promotional plans to ensure we remain competitive, particularly in diapers and training pants in North America. "Reflecting on the year, we made solid progress on a number of fronts while managing through a challenging business environment. Kimberly-Clark teams have delivered solid organic sales growth, above the high end of our long range target, brought innovative new and improved products to market, enhanced the competitive position of our brands, deepened our relationships with key customers and maintained a strong financial position. I am also encouraged that our focus on revenue realization has contributed to positive operating profit margin momentum as we enter 2009." Review of fourth quarter sales by business segment Sales of personal care products decreased 2.5 percent from the fourth quarter of Net selling prices increased 6 percent, product mix improved 1 percent and sales volumes were flat, while currency effects reduced sales by almost 9 percent. Personal care sales in North America declined about 2 percent versus the year-ago quarter, as an improvement in net selling prices of 6 percent was more than offset by a 7 percent drop in sales volumes and unfavorable currency effects of 1 percent. The higher selling prices resulted from increases implemented earlier in 2008 across all categories, net of increased promotional activity primarily for Huggies diapers to match competitive moves. The decrease in sales volumes was primarily attributable to lower shipments of the company's diaper and child care brands, which were down approximately 10 percent overall, as customers adjusted inventory levels, child care category sales slowed and some consumers switched to lower-priced
2 product offerings. Meanwhile, sales volumes for Kotex feminine care and Depend and Poise adult care products experienced a low single-digit decline. In Europe, personal care sales fell approximately 16 percent in the quarter, mainly as a result of a 14 percent impact from weaker currencies. Sales volumes were even with the year-ago quarter, while net selling prices decreased about 2 percent in continued competitive market conditions. Sales volumes of Huggies diapers in the company's four core markets of the U.K., France, Italy and Spain were unchanged compared with the fourth quarter of In developing and emerging markets, personal care sales slipped about 1 percent, as continued strong growth in organic sales was more than offset by negative currency effects of almost 17 percent. Sales volumes increased by more than 5 percent, while net selling prices improved about 8 percent and product mix was better by approximately 3 percent. The growth in organic sales was broad-based, with particular strength in China, Russia, Turkey, Vietnam, Brazil and the Andean region in Latin America. Sales of consumer tissue products declined 2.6 percent in the fourth quarter. Although net selling prices climbed approximately 11 percent and product mix was favorable by 1 percent, overall sales volumes were down 6 percent compared with the prior year and unfavorable currency exchange rates reduced sales by more than 8 percent. In North America, sales of consumer tissue products increased more than 3 percent in the fourth quarter, as an increase in net selling prices of almost 13 percent and improved product mix of about 1 percent were partially offset by a 10 percent decline in sales volumes and currency effects of 1 percent. The improvement in net selling prices reflects price increases implemented across the bathroom tissue, paper towel and facial tissue categories during the course of This focus on improving revenue realization, along with slower category growth and consumer trade-down, particularly in paper towels, contributed to the lower sales volumes. For the quarter, shipments were down more than 10 percent for Viva and Scott paper towels, approximately 7 percent for Cottonelle and Scott bathroom tissue and about 3 percent for Kleenex facial tissue. A portion of the overall volume decline also was due to the company's decision in late 2007 to shed certain low-margin private label business. In Europe, consumer tissue sales fell about 14 percent compared with the fourth quarter of 2007, with weaker foreign currency exchange rates accounting for the entire decline. Sales volumes were down approximately 5 percent, due mainly to lower sales of Andrex and Scottex bathroom tissue and Kleenex facial tissue in response to higher prices and continued softness in category sales, particularly in the U.K. Net selling prices improved 4 percent, primarily reflecting list price increases across multiple markets, and product mix also was better by 1 percent. Consumer tissue sales in developing and emerging markets were lower by about 2 percent, as unfavorable currency effects of approximately 17 percent more than offset robust growth in organic sales. During 2008, the company raised prices in most markets to recover higher raw materials costs and drove improvements in mix with more differentiated, value-added products, strategies that resulted in higher net selling prices of nearly 13 percent and better product mix of 2 percent. Meanwhile, sales volumes were even with the year-ago quarter. Sales of K-C Professional (KCP) & other products went down 8.5 percent from the year-ago quarter. Although net selling prices improved by approximately 5 percent, changes in foreign currency rates decreased sales by more than 7 percent, sales volumes dropped more than 5 percent and product mix was off about 1 percent. Economic weakness and rising unemployment levels in North America and Europe began to affect KCP's categories in the fourth quarter. In North America, sales went down approximately 3 percent. Sales volumes declined more than 8 percent and currency effects were negative by more than 1 percent, partially offset by an improvement in net selling prices of nearly 7 percent. In Europe, KCP's sales fell 15 percent in the fourth quarter, driven by lower sales volumes and unfavorable product mix of 7 percent and about 1 percent, respectively, and a decrease in currency rates averaging 11 percent. These factors were partially offset by a 4 percent benefit from price increases implemented earlier in the year. Across developing and emerging markets, sales were down 8 percent, mainly as a result of adverse currency effects of about 17 percent, partially offset by sales volume gains and higher net selling prices. Sales of health care products increased 0.6 percent in the fourth quarter, with growth in sales volumes of 5 percent mostly offset by unfavorable currency exchange rates and product mix of approximately 3 percent and 1 percent, respectively. The improvement in sales volumes was paced by double-digit growth in exam gloves and medical devices. Overall, sales volumes outside North America grew at a high-single digit rate. Other fourth quarter operating results Operating profit was $623 million in the fourth quarter of 2008, compared with $668 million in Excluding net charges for the company's strategic cost reduction plan in both years and related implementation costs in 2007, adjusted operating profit for the quarter decreased almost 10 percent to $629 million from $696 million in the prior year despite benefits from higher net selling prices and cost savings. As previously mentioned, key factors contributing to the decrease included higher manufacturing costs and currency effects, along with lower sales volumes, increases in strategic marketing and higher expenses included in other (income) and expense, net. Selling and general expenses also were up versus the fourth quarter of 2007, primarily to support growth in developing and emerging markets.
3 Manufacturing costs for the quarter reflected inflation in key cost inputs of more than $135 million compared with the year-ago period, as well as increases in other operating costs, including production curtailments to control inventory levels. Inflation comprised $75 million for raw materials other than fiber, primarily polymer resins and other oil-based materials, approximately $35 million of energy costs, $15 million in fiber costs and about $10 million in distribution costs. Translation losses arising from changes in currency exchange rates reduced fourth quarter operating profit by approximately $60 million in 2008 versus Excluding restructuring-related gains in both years, other (income) and expense, net in the fourth quarter was a net expense of $29 million in 2008 compared with a net expense of $3 million in The increase reflects a higher level of currency transaction losses compared with the prior year, as well as costs incurred in 2008 related to a legal judgment and a debt refinancing, partially offset by favorable settlement of a value-added tax matter in Latin America. Cost savings in the quarter from the company's FORCE (Focused On Reducing Costs Everywhere) program and strategic cost reduction plan totaled $20 million and $14 million, respectively. The company's effective tax rate in the fourth quarter was 22.4 percent in 2008 and 23.9 percent in Excluding the effects of charges for the company's strategic cost reduction plan in both years, as well as related implementation costs, net effects from synthetic fuel partnerships and minority owners' share of tax benefits in 2007, the adjusted effective tax rate for the quarter was 23.2 percent in 2008 compared with 25.0 percent in The decline was due primarily to the timing of tax initiatives which, compared with the company's previous guidance for the quarter, also reduced income taxes by approximately $28 million, or 7 cents per share. The net effect of synthetic fuel partnership activities in the fourth quarter of 2007 was a cost of $6 million. Synthetic fuel produced by the partnerships was eligible for tax credits through the end of 2007, at which time the law giving rise to the tax benefits expired. The partnerships were dissolved during 2008 at no cost to the company. Reconciliations of the above effective tax rate calculations are provided in a separate section of this news release. Kimberly-Clark's share of net income of equity companies in the fourth quarter decreased to $21 million from $43 million in 2007, primarily as a result of lower net income at Kimberly-Clark de Mexico, S.A.B. de C.V. (KCM). Although KCM delivered double-digit organic sales growth and improved its gross profit margin, operating profit and net income were significantly reduced by currency effects, including transaction losses on more than $300 million of U.S. dollar-denominated liabilities, as the Mexican peso weakened by more than 20 percent versus the U.S. dollar. Kimberly-Clark's share of KCM's currency transaction and translation losses in the quarter totaled about $35 million, equivalent to approximately 8 cents per share. Minority owners' share of subsidiaries' net income was $35 million in the fourth quarter of 2008 compared with $51 million in the prior year. The decrease was due mainly to minority owners' share of tax benefits at majority-owned subsidiaries in the yearago quarter of more than $20 million, partially offset by increased earnings at majority-owned subsidiaries in Latin America and the Middle East and higher returns payable on the redeemable preferred securities issued by the company's consolidated financing subsidiary. Update on cost savings programs The company's strategic cost reduction plan was part of a comprehensive, multi-year effort announced in July 2005 to further improve Kimberly-Clark's competitive position and was completed as of the end of Under the plan, manufacturing and administrative operations, primarily in North America and Europe, were streamlined with expected annual savings of at least $350 million by During the fourth quarter, the most significant activities involved consolidating infant and child care operations in North America, improving the cost structure in Health Care, streamlining administrative operations in Europe and the sale of a facility in Asia. Employees at all 23 facilities slated for sale, closure or streamlining as part of the cost reduction plan have been notified about workforce reductions and other actions. Cumulative pretax charges of $880 million (about $610 million after tax) were incurred, at the low end of the company's most recent expectations for total pretax charges of $880 to $900 million ($610 to $620 million after tax). For the full year of 2008, year-over-year pretax savings of nearly $110 million were realized, bringing the cumulative annual total to approximately $335 million since the plan's inception. Including projected year-over-year savings of about $50 million in 2009, total annual savings from the plan are now expected to reach $385 million, well ahead of the above-mentioned savings objective. Regarding the company's ongoing FORCE program, savings of $63 million in 2008 were below planned levels, primarily as a result of higher-than-expected manufacturing costs throughout the year. Combined strategic cost reduction and FORCE savings totaled more than $170 million for the year, somewhat below the company's original target for savings of $200 to $250 million from the two programs. Cash flow and balance sheet Cash provided by operations in the fourth quarter totaled $678 million, down about 1 percent from $685 million in the prior
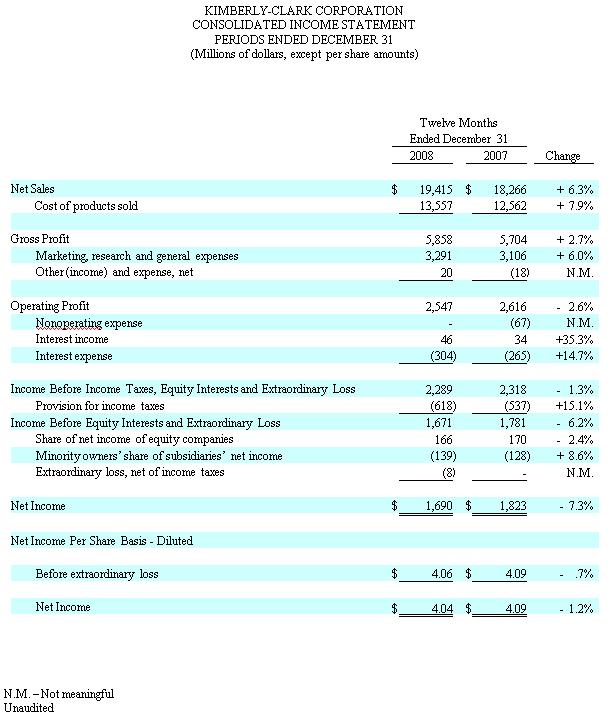
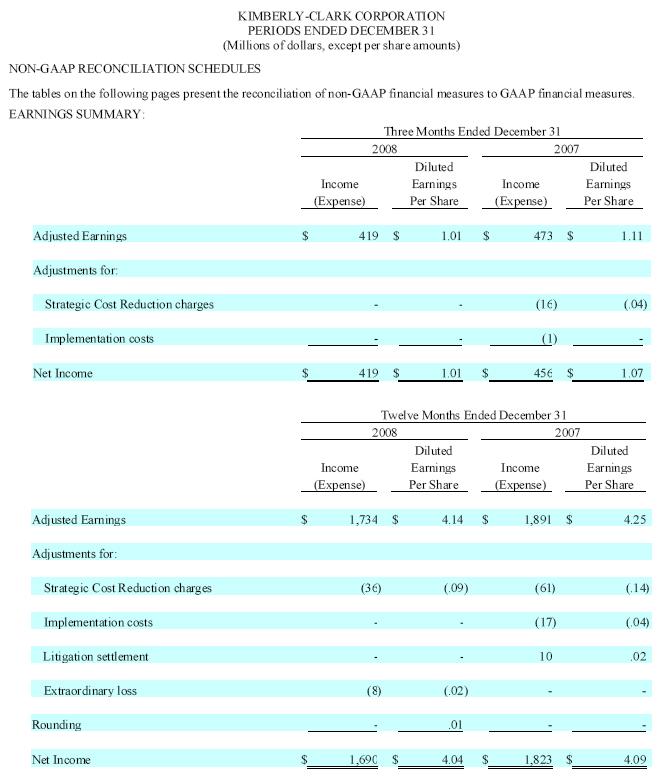
4 year. The decrease was due primarily to lower net income, a reduced level of accrued expenses and a $50 million contribution to the company's U.S. pension plan in 2008, mostly offset by lower tax payments versus the year-ago quarter. Capital spending for the quarter was $253 million in 2008 compared with $213 million in the prior year. For the full year of 2008, capital spending totaled $906 million, consistent with the company's targeted range of $850 to $950 million. During the fourth quarter, the company repurchased approximately 1.3 million shares of its common stock at a cost of $75 million, bringing repurchases for the full year to about 10.0 million shares at a cost of $625 million, in line with the company's updated target of $600 to $650 million. Total debt and redeemable preferred securities was $7.0 billion at December 31, 2008 compared with $7.3 billion at September 30, 2008 and $6.5 billion at the end of Full year results For the year of 2008, sales of $19.4 billion were up 6.3 percent from $18.3 billion in the prior year. Sales volumes increased about 1 percent, net selling prices were higher by more than 4 percent and product mix was favorable by almost 1 percent, resulting in organic sales growth of about 6 percent, while favorable currency effects added less than 1 percent to sales. Full year operating profit of $2,547 million included net charges of about $60 million for strategic cost reductions. Adjusted operating profit was $2,607 million, down approximately 5 percent from $2,734 million in The benefits of top-line growth, along with cost savings of $171 million, were more than offset by inflation in key cost components totaling more than $725 million, an increase in strategic marketing spending of about $95 million and higher levels of selling and administrative expenses, mainly to support growth in developing and emerging markets. For the year, diluted net income per share in 2008 was $4.04 compared with $4.09 in Adjusted earnings per share declined approximately 3 percent to $4.14 in 2008 from $4.25 in Those amounts are adjusted for charges related to strategic cost reductions in both years, related incremental implementation costs and the gain on a litigation settlement in 2007, as well as an extraordinary loss recorded in the second quarter of Outlook The company outlined key planning and guidance assumptions for 2009, as follows: Organic sales growth in the low single digits. Year-over-year net selling prices are expected to be up approximately 2 to 3 percent, while product mix and overall sales volumes should both be flat to up modestly. Volume trends are expected to improve in the second half of the year. Net sales decline of 4 to 5 percent. Currency is expected to reduce sales for the full year by approximately 7 percent. Adjusted operating profit similar to 2008, in a range of plus or minus low single digits, as lower costs are expected to be substantially offset by higher pension expense, currency effects and additional investments in strategic marketing. Deflation in key cost inputs of approximately $300 million. This reflects estimated average market pricing for benchmark northern softwood pulp of approximately $740 per metric ton, oil prices averaging $70 per barrel for the year and natural gas prices in North America in a range of $7 to $8 per mmbtu for the year. Weaker currency exchange rates reduce the potential benefit of forecasted declines in dollar-based input costs for operations outside the U.S. Savings from the company's FORCE program and its strategic cost reduction plan totaling about $150 million. Pension expense of approximately $295 million across all company defined benefit plans, an increase of approximately $200 million from Cash contributions to the plans in 2009, including those required under the U.S. Pension Protection Act of 2005, are expected to total about $530 million versus $130 million in Year-over-year currency translation and transaction losses for consolidated operations of $250 to $325 million due to the weakening of key foreign currencies versus the U.S. dollar. The transaction losses include estimated amounts equivalent to 10 to 20 cents per share related to conversion of local currency cash balances to U.S. dollars at certain operations in Latin America. The exact timing and magnitude of the transaction losses will depend on market conditions. Planned increases in strategic marketing spending will be directed to support new and improved products, continued growth in developing and emerging markets and improve overall brand equity and market share. The adjusted effective tax rate for the year is expected to be in a range of 28 to 30 percent versus 27.3 percent in The year-over-year increase in the tax rate (at the midpoint) is equivalent to approximately 10 cents per share, or more than 2 percentage points of earnings growth. The company's share of net income of equity companies is expected to be somewhat below the 2008 level, as improved operating performance at K-C de Mexico is expected to be more than offset by further weakness in the Mexican peso. Capital investments of $800 to $850 million are planned to support future sales and earnings growth. Spending will
5 approximate 4.5 percent of sales compared with the company's long-term targeted range of 5 to 6 percent of sales. A low single-digit percentage increase in the dividend is anticipated effective April 2009, subject to approval by the Board of Directors. In light of this year's pension funding requirements, the company currently does not expect to repurchase any of its common stock in Share repurchases will be resumed if the company is successful in generating incremental cash flow. The company noted that although commodity costs have fallen dramatically since mid-2008, the related weakness in foreign currencies, along with higher pension expense resulting from last year's negative returns in global equity markets will be a significant drag on the company's 2009 results. The increase in pension expense in 2009 is equivalent to approximately 34 cents per share, or more than 8 percentage points of growth compared with adjusted earnings of $4.14 per share in In addition, projected incremental currency transaction losses could further dampen earnings growth by as much as 5 percentage points. Based on plans in place for the coming year, the company expects to generate sufficient improvement in other aspects of its business operations to substantially offset the negative effects from pension and currencies. As a result, adjusted earnings per share in 2009 are expected to be similar to 2008, in a range of $4.00 to $4.20. Adjusted earnings per share in the first half of the year are likely to be down versus 2008, with improvement expected in the second half of the year. Commenting on the outlook, Falk said, "The collapse of global financial markets has precipitated significant changes in commodity costs and currency rates and resulted in a high level of volatility and uncertainty in the current business environment. Although it has become more challenging to predict our results in the near-term, we will continue to do the right things for the long-term health of our businesses and effectively manage those factors which we can control. In short, we will continue to focus on executing our Global Business Plan strategies. Consistent with this focus and our commitment to deliver on the long-term financial objectives of the Plan, we have decided to discontinue providing earnings guidance for individual quarters within a year. "Our plan for 2009 assumes no improvement in the external environment in the near-term, with gradually improving conditions later in the year. We are encouraged that commodity costs have fallen from their 2008 highs, which should help us to improve profitability over time, and that as of today, our cost assumptions appear to be conservative. Keep in mind, however, that a number of factors could cause consumer demand or net selling prices for our products to change unexpectedly or result in further volatility in currency exchange rates and our input costs. We will carefully monitor economic and competitive conditions and adjust our plans as appropriate to deliver the best possible results. "In this environment, the strength of our marketing and innovation programs is vitally important to ensure our brands provide a great value to consumers. We will continue to invest to build our capabilities in these areas and we will continue to support our growth initiatives and further build brand equity with higher marketing spending. We have no plans to cut back on these key investments. We will be disciplined to strike the right balance between volume growth and profitability. At the same time, we will accelerate cost reductions and drive efficiency in every aspect of our operations to improve our competitive position. We will also continue to focus on maximizing our cash flow and maintaining a strong balance sheet. "We are confident that we will emerge from this challenging period stronger than ever and that we have the right strategies in place to drive sustainable growth and deliver shareholder value over the long-term." Non-GAAP financial measures This press release and the accompanying tables include the following financial measures that have not been calculated in accordance with accounting principles generally accepted in the U.S., or GAAP, and are therefore referred to as non GAAP financial measures. adjusted earnings and earnings per share adjusted operating profit adjusted effective tax rate These non-gaap financial measures exclude certain items that are included in the company's earnings, earnings per share, operating profit and effective tax rate calculated in accordance with GAAP. A detailed explanation of each of the adjustments to the comparable GAAP financial measures is given below. In accordance with the requirements of SEC Regulation G, reconciliations of the non-gaap financial measures to the comparable GAAP financial measures are attached. The company provides these non-gaap financial measures as supplemental information to our GAAP financial measures. Management and the company's Board of Directors use adjusted earnings, adjusted earnings per share and adjusted
6 operating profit to (a) evaluate the company's historical and prospective financial performance and its performance relative to its competitors, (b) allocate resources and (c) measure the operational performance of the company's business units and their managers. Additionally, the Management Development and Compensation Committee of the company's Board of Directors uses these non-gaap financial measures when setting and assessing achievement of incentive compensation goals. These goals are based, in part, on the company's adjusted earnings per share and improvement in the company's adjusted return on invested capital determined by excluding the charges that are used in calculating these non-gaap financial measures. In addition, Kimberly-Clark management believes that investors' understanding of the company's performance is enhanced by including these non-gaap financial measures as a reasonable basis for comparing the company's ongoing results of operations. Many investors are interested in understanding the performance of our businesses by comparing our results from ongoing operations from one period to the next. By providing these non-gaap financial measures, together with reconciliations, we believe we are enhancing investors' understanding of our businesses and our results of operations, as well as assisting investors in evaluating how well the company is executing the material changes to our enterprise contemplated by the strategic cost reduction plan. Also, many financial analysts who follow our company focus on and publish both historical results and future projections based on non GAAP financial measures. We believe that it is in the best interests of our investors for us to provide this information to analysts so that those analysts accurately report the non-gaap financial information. We calculate adjusted earnings, adjusted earnings per share, adjusted operating profit and adjusted effective tax rate by excluding from the comparable GAAP measure (i) charges related to our strategic cost reduction plan for streamlining the company's operations, (ii) certain incremental implementation costs relating to our strategic cost reduction plan, (iii) an after-tax extraordinary loss related to the restructuring of certain contractual arrangements, (iv) the gain on a litigation settlement and (v) the net effect in 2007 of the company's investment in synthetic fuel partnerships and the minority owners' share of tax benefits on the company's effective tax rate. Each of these adjustments and the basis for such adjustments are described below: Strategic cost reduction plan. In July 2005, the company authorized a strategic cost reduction plan aimed at streamlining manufacturing and administrative operations, primarily in North America and Europe. The strategic cost reduction plan commenced in the third quarter of 2005 and was completed as of December 31, At the time we announced the plan, we advised investors that we would report our earnings, earnings per share and operating profit excluding the strategic cost reduction plan charges so that investors could compare our operating results without the plan charges from period to period and could assess our progress in implementing the plan. Management does not consider these charges to be part of our earnings from ongoing operations for purposes of evaluating the performance of its business units and their managers and excludes these charges when making decisions to allocate resources among its business units. Implementation costs. In connection with our strategic cost reduction plan, the company incurred incremental implementation costs related to the transfer of certain administrative processes to third-party providers. These costs were incurred primarily in the first six months of Management excludes these implementation costs from our earnings from ongoing operations for purposes of evaluating the performance of our business units and their managers and excludes these costs when making decisions to allocate resources among its business units. Extraordinary loss. In June 2008, the company restructured contractual arrangements of two financing entities, which resulted in the consolidation of these two entities. As a result of the consolidation, notes receivable and loan obligations held by these entities with aggregate fair values of $600 million and $612 million, respectively, were included in long-term notes receivable and long-term debt on the company's consolidated balance sheet. Because the fair value of the loans exceeded the fair value of the notes receivable, the company recorded an after-tax extraordinary loss of approximately $8 million on its income statement for the period ended June 30, 2008, as required by FIN 46R. Management does not consider this loss to be part of our earnings from ongoing operations for purposes of evaluating the performance of its business units and their managers and excludes this loss when making decisions to allocate resources among its business units. Litigation settlement. In the third quarter of 2007, the company received proceeds from settlement of litigation related to prior years' operations in Latin America. Management does not consider this gain to be part of our earnings from ongoing operations for purposes of evaluating the performance of its business units and their managers and excludes the gain when making decisions to allocate resources among its business units. Adjusted effective tax rate. In the analysis of its effective tax rate, the company excludes the effects of charges for the strategic cost reduction plan, related implementation costs and the litigation settlement gain, as well as net effects in 2007 from the company's investment in synthetic fuel partnerships and the minority owners' share of tax benefits. We believe that adjusting for these items provides improved insight into the tax effects of our ongoing business operations. These non-gaap financial measures are not meant to be considered in isolation or as a substitute for the comparable GAAP measure. There are limitations to these non-gaap financial measures because they are not prepared in accordance with GAAP and may not be comparable to similarly titled measures of other companies due to potential differences in methods of
7 calculation and items being excluded. The company compensates for these limitations by using these non-gaap financial measures as a supplement to the GAAP measures and by providing reconciliations of the non-gaap and comparable GAAP financial measures. The non-gaap financial measures should be read only in conjunction with the company's consolidated financial statements prepared in accordance with GAAP. Conference call A conference call to discuss this news release and other matters of interest to investors and analysts will be held at 9 a.m. (CST) today. The conference call will be simultaneously broadcast over the World Wide Web. Stockholders and others are invited to listen to the live broadcast or a playback, which can be accessed by following the instructions set out in the Investors section of the company's Web site ( About Kimberly-Clark Kimberly-Clark and its well-known global brands are an indispensable part of life for people in more than 150 countries. Every day, 1.3 billion people - nearly a quarter of the world's population - trust K-C brands and the solutions they provide to enhance their health, hygiene and well-being. With brands such as Kleenex, Scott, Huggies, Pull-Ups, Kotex and Depend, Kimberly-Clark holds No. 1 or No. 2 share positions in more than 80 countries. To keep up with the latest K-C news and to learn more about the company's 137-year history of innovation, visit Copies of Kimberly-Clark's Annual Report to Stockholders and its proxy statements and other SEC filings, including Annual Reports on Form 10-K, Quarterly Reports on Form 10-Q and Current Reports on Form 8-K, are made available free of charge on the company's Web site on the same day they are filed with the SEC. To view these filings, visit the Investors section of the company's Web site. Certain matters contained in this news release concerning the business outlook, including economic conditions, anticipated currency rates and exchange risk, cost savings, changes in finished product selling prices, anticipated raw material and energy costs, anticipated costs and benefits related to the strategic cost reduction plan, anticipated financial and operating results, strategies, contingencies and anticipated transactions of the company constitute forward-looking statements and are based upon management's expectations and beliefs concerning future events impacting the company. There can be no assurance that these future events will occur as anticipated or that the company's results will be as estimated. For a description of certain factors that could cause the company's future results to differ materially from those expressed in any such forward-looking statements, see Item 1A of the company's Annual Report on Form 10-K for the year ended December 31, 2007 entitled "Risk Factors."

8
9
10
11

12 KIMBERLY-CLARK CORPORATION PERIODS ENDED DECEMBER 31 Description of Business Segments The Corporation is organized into operating segments based on product groupings. These operating segments have been aggregated into four reportable global business segments: Personal Care; Consumer Tissue; K-C Professional & Other; and Health Care. The reportable segments were determined in accordance with how the Corporation's executive managers develop and execute the Corporation's global strategies to drive growth and profitability of the Corporation's worldwide Personal Care, Consumer Tissue, K-C Professional & Other, and Health Care operations. These strategies include global plans for branding and product positioning, technology, research and development programs, cost reductions including supply chain
13 management, and capacity and capital investments for each of these businesses. Segment management is evaluated on several factors, including operating profit. Segment operating profit excludes other income and (expense), net; income and expense not associated with the business segments; and the costs of corporate decisions related to the Strategic Cost Reductions. Corporate & Other includes the costs related to the Strategic Cost Reductions. The principal sources of revenue in each of our global business segments are described below. The Personal Care segment manufactures and markets disposable diapers, training and youth pants and swimpants; baby wipes; feminine and incontinence care products; and related products. Products in this segment are primarily for household use and are sold under a variety of brand names, including Huggies, Pull-Ups, Little Swimmers, GoodNites, Kotex, Lightdays, Depend, Poise and other brand names. The Consumer Tissue segment manufactures and markets facial and bathroom tissue, paper towels, napkins and related products for household use. Products in this segment are sold under the Kleenex, Scott, Cottonelle, Viva, Andrex, Scottex, Hakle, Page and other brand names. The K-C Professional & Other segment manufactures and markets facial and bathroom tissue, paper towels, napkins, wipers and a range of safety products for the away-from-home marketplace. Products in this segment are sold under the Kimberly- Clark, Kleenex, Scott, WypAll, Kimtech, Kleenguard and Kimcare brand names. The Health Care segment manufactures and markets disposable health care products such as surgical gowns, drapes, infection control products, sterilization wrap, face masks, exam gloves, respiratory products and other disposable medical products. Products in this segment are sold under the Kimberly-Clark, Ballard and other brand names.


14
15

16

17

18
Kimberly-Clark Announces Year-End 2009 Results And 2010 Outlook
 Kimberly-Clark Announces Year-End 2009 Results And 2010 Outlook 4Q Net Sales Increased 8 Percent to $5.0 Billion; EPS of $1.17 Up 16 Percent 4Q Cash Provided By Operations Rose 48 Percent to $1.0 Billion
Kimberly-Clark Announces Year-End 2014 Results And 2015 Outlook
 January 23, 2015 Kimberly-Clark Announces Year-End 2014 Results And 2015 Outlook DALLAS, Jan. 23, 2015 /PRNewswire/ -- Kimberly-Clark Corporation (NYSE: KMB) today reported year-end 2014 results and provided
Kimberly-Clark's Fourth Quarter 2003 Sales Rose Nearly 11 Percent to $3.7 Billion
 Kimberly-Clark's Fourth Quarter 2003 Sales Rose Nearly 11 Percent to $3.7 Billion Diluted EPS Were 91 Cents vs. 72 Cents in 2002; Company Announces Planned Dividend Increase of Nearly 18 Percent and Confirms
Kimberly-Clark Announces Year-End 2017 Results, 2018 Outlook, New Global Restructuring And Multi-Year Cost Savings Target
 January 23, 2018 Kimberly-Clark Announces Year-End 2017 Results, 2018 Outlook, New Global Restructuring And Multi-Year Cost Savings Target DALLAS, Jan. 23, 2018 /PRNewswire/ -- Kimberly-Clark Corporation
Kimberly-Clark Announces Year-End 2018 Results and 2019 Outlook and Introduces K-C Strategy 2022
 Kimberly-Clark Announces Year-End 2018 Results and 2019 Outlook and Introduces K-C Strategy 2022 January 23, 2019 DALLAS, Jan. 23, 2019 /PRNewswire/ -- Kimberly-Clark Corporation (NYSE: KMB) today reported
Kimberly-Clark Reports Fourth Quarter and Full Year 2002 Results in Line with Previous Guidance
 Kimberly-Clark Reports Fourth Quarter and Full Year 2002 Results in Line with Previous Guidance Cash Flow for the Year Sets New Records DALLAS, January 27, 2003 Kimberly-Clark Corporation (NYSE: KMB) today
Sales Jumped 10 Percent on the Strength of Double-Digit Volume Growth; EPS From Operations Grew at Double-Digit Rate for Eighth Consecutive Quarter
 Rising Sales and Operating Margin Boosted Kimberly-Clark's Second Quarter Earnings From Operations to a Record 81 Cents Per Share, an Increase Of 12.5 Percent Compared With 1999 Sales Jumped 10 Percent
Q Results and 2012 Outlook
 Q4 2011 Results and 2012 Outlook January 24, 2012 Essentials for a Better Life Conference Call Reminders Forward-Looking Information Certain matters in this presentation and conference call, including
2013 Results and 2014 Outlook
 Leading the world in essentials for a better life. 2013 Results and 2014 Outlook January 24, 2014 Conference Call Reminders Forward-Looking Information Certain matters in this presentation and conference
2014 Results and 2015 Outlook
 Leading the world in essentials for a better life. 2014 Results and 2015 Outlook January 23, 2015 Conference Call Reminders Forward-Looking Information Certain matters in this presentation and conference
2016 Results and 2017 Outlook
 Leading the World in Essentials for a Better Life 2016 Results and 2017 Outlook January 24, 2017 www.kimberly-clark.com Conference Call Reminders Forward-Looking Information Certain matters in this presentation
2017 Results and 2018 Outlook
 2017 Results and 2018 Outlook January 23, 2018 www.kimberly-clark.com Leading the world in essentials for a better life Conference Call Reminders Forward-Looking Information Certain matters in this presentation
KIMBERLY CLARK CORP FORM 10-Q. (Quarterly Report) Filed 10/21/14 for the Period Ending 09/30/14
 Filed 10/21/14 for the Period Ending 09/30/14") KIMBERLY CLARK CORP FORM 10-Q (Quarterly Report) Filed 10/21/14 for the Period Ending 09/30/14 Address 351 PHELPS DRIVE IRVING, TX, 75038 Telephone 9722811200 CIK 0000055785 Symbol KMB SIC Code 2670 -
KIMBERLY CLARK CORP FORM 10-Q (Quarterly Report) Filed 10/21/14 for the Period Ending 09/30/14 Address 351 PHELPS DRIVE IRVING, TX, 75038 Telephone 9722811200 CIK 0000055785 Symbol KMB SIC Code 2670 -
Q Results and 2017 Outlook
 Q2 2017 Results and 2017 Outlook July 25, 2017 www.kimberly-clark.com Leading the world in essentials for a better life Conference Call Reminders Forward-Looking Information Certain matters in this presentation
2009 Annual Report on Form 10-K
 2009 Annual Report on Form 10-K UNITED STATES SECURITIES AND EXCHANGE COMMISSION WASHINGTON, D.C. 20549 FORM 10-K (Mark One) [X] ANNUAL REPORT PURSUANT TO SECTION 13 OR 15(d) OF THE SECURITIES EXCHANGE
Comprehensive Case. Appendix. Learning O b j e c t i v e s
 Appendix C Comprehensive Case Learning O b j e c t i v e s L01 Explain and illustrate a review of financial statements and their components. (p. C-4) L02 Assess company profitability and creditworthiness.
Q Results and 2017 Outlook
 Q3 2017 Results and 2017 Outlook October 23, 2017 www.kimberly-clark.com Leading the world in essentials for a better life Conference Call Reminders Forward-Looking Information Certain matters in this
Investor Presentation
 Leading the world in essentials for a better life. Investor Presentation Financial Information as of December 31, 2012 Highlights $21+ billion global company founded in 1872 Products used by one-quarter
Sanford C. Bernstein Strategic Decisions Conference
 Sanford C. Bernstein Strategic Decisions Conference June 2, 2011 Essentials for a Better Life Agenda Company Overview and Performance Strategic Review Financial Discipline 2 Headlines Executing well in
Investor Presentation
 Leading the World in Essentials for a Better Life Investor Presentation Financial Information as of December 31, 2014 www.kimberly-clark.com Highlights $20 billion global company founded in 1872 Products
Investor Presentation
 Investor Presentation Financial Information as of December 31, 2017 www.kimberly-clark.com Leading the world in essentials for a better life Highlights $18 billion global company founded in 1872 Products
In 2010, we continued to focus on leading the world in essentials for a better life through innovation and the execution of our Global Business Plan.
 continued focus In 2010, we continued to focus on leading the world in essentials for a better life through innovation and the execution of our Global Business Plan. update from the chairman Thomas J.
Q Results, 2018 Outlook and CEO Transition
 Q3 2018 Results, 2018 Outlook and CEO Transition October 22, 2018 www.kimberly-clark.com Leading the world in essentials for a better life Conference Call Reminders Forward-Looking Information Certain
Investor Presentation
 Investor Presentation Financial Information as of December 31, 2016 www.kimberly-clark.com Leading the world in essentials for a better life Highlights $18 billion global company founded in 1872 Products
Relationships that last a lifetime Kimberly-Clark 2003 Annual Report
 Relationships that last a lifetime Kimberly-Clark 2003 Annual Report About This Report At Kimberly-Clark, we re building brands and relationships that last a lifetime. We are home to some of the most trusted
EQUITY RESEARCH. February 27, 2002 S&P Sector Cons. Staples Industry Household Products. Market Cap. MSN money
 M.A. W M.A. WRIGHT FUND EQUITY RESEARCH Nat Apihunpunyakij Kimberly-Clark Corp. NYSE: KMB Buy apihunpu@rice.edu February 27, 2002 S&P Sector Cons. Staples Industry Household Products MARKET DATA Price
UNITED STATES SECURITIES AND EXCHANGE COMMISSION WASHINGTON, D.C FORM 10-K
 UNITED STATES SECURITIES AND EXCHANGE COMMISSION WASHINGTON, D.C. 20549 FORM 10-K x Annual Report Pursuant to Section 13 or 15(d) of the Securities Exchange Act of 1934 For the fiscal year ended December
FOURTH QUARTER 2015 EARNINGS CALL. February 29, 2016
 FOURTH QUARTER 2015 EARNINGS CALL February 29, 2016 FOURTH QUARTER EARNINGS CALL AGENDA Fourth Quarter Update Robert Abernathy, Chairman and Chief Executive Officer Fourth Quarter Results and 2016 Outlook
FORM 8-K SECURITIES AND EXCHANGE COMMISSION KIMBERLY-CLARK CORPORATION
 FORM 8-K SECURITIES AND EXCHANGE COMMISSION Washington, D.C. 20549 CURRENT REPORT Pursuant to Section 13 or 15(d) of the Securities Exchange Act of 1934 Date of Report: November 30, 1999 (Date of earliest
Fourth Quarter 2014 Earnings Call. March 4, 2015
 March 4, 2015 Conference Call Reminders Forward-Looking Information Certain matters in this presentation and conference call, including our 2015 outlook, expectations and planning assumptions, and any
Sanford C. Bernstein Strategic Decisions Conference
 Sanford C. Bernstein Strategic Decisions Conference May 31, 2012 Essentials for a Better Life A Long and Successful History Celebrating 140 th anniversary in 2012 Company founded before the telephone,
KIMBERLY CLARK CORP FORM 10-K. (Annual Report) Filed 02/08/18 for the Period Ending 12/31/17
 Filed 02/08/18 for the Period Ending 12/31/17") KIMBERLY CLARK CORP FORM 10-K (Annual Report) Filed 02/08/18 for the Period Ending 12/31/17 Address 351 PHELPS DRIVE IRVING, TX, 75038 Telephone 9722811200 CIK 0000055785 Symbol KMB SIC Code 2670 - Converted
KIMBERLY CLARK CORP FORM 10-K (Annual Report) Filed 02/08/18 for the Period Ending 12/31/17 Address 351 PHELPS DRIVE IRVING, TX, 75038 Telephone 9722811200 CIK 0000055785 Symbol KMB SIC Code 2670 - Converted
DOMTAR CORPORATION REPORTS PRELIMINARY FOURTH QUARTER AND FISCAL YEAR 2017 FINANCIAL RESULTS; ANNOUNCES INCREASE TO ITS QUARTERLY DIVIDEND
 234 Kingsley Park Drive Fort Mill, South Carolina 29715 News Release UITICKER SYMBOL INVESTOR RELATIONS MEDIA RELATIONS (NYSE: UFS) (TSX: UFS) Nicholas Estrela Director Investor Relations Tel.: 514-848-5049
GENERAL MILLS REPORTS FOURTH-QUARTER AND FULL-YEAR FISCAL 2018 RESULTS; PROVIDES 2019 OUTLOOK
 News/Information Investor Relations P. O. Box 1113 Minneapolis, MN 55440 FOR IMMEDIATE RELEASE June 27, 2018 Contact: (analysts) Jeff Siemon: 763-764-2301 (media) Bridget Christenson: 763-764-6364 GENERAL
RPM REPORTS FOURTH-QUARTER AND FULL-YEAR RESULTS FOR FISCAL 2017
 RPM REPORTS FOURTH-QUARTER AND FULL-YEAR RESULTS FOR FISCAL 2017 Completed nine acquisitions in fiscal 2017 to enhance growth Lowered headcount and closed unprofitable facilities to reduce cost Fourth-quarter
Newell Rubbermaid Announces First Quarter Results
 Newell Rubbermaid Announces First Quarter Results» Reaffirms Full Year Guidance» Increases Quarterly Dividend 13 percent to $0.17 per share ATLANTA, May 2, 2014 Newell Rubbermaid (NYSE: NWL) today announced
Ontex H1 2017: Very Strong Broad-Based Revenue Growth
 Ontex H1 2017: Very Strong Broad-Based Revenue Growth Reported revenue up 22%: LFL revenue growth in all 5 Divisions and 3 categories Including Ontex Brazil, Q2 revenue confirmed annualized run-rate of
Waste Management Announces Fourth Quarter and Full-Year 2013 Earnings
 Waste Management Announces Fourth Quarter and Full-Year 2013 Earnings February 18, 2014 Company sees strong cash generation in 2013 and expects continued strength in 2014 HOUSTON--(BUSINESS WIRE)--Feb.
Kimberly-Clark de México, S. A. B. de C. V. and Subsidiaries
 Kimberly-Clark de México, S. A. B. de C. V. and Subsidiaries Consolidated Financial Statements for the Years Ended December 31, 2009 and 2008, and Independent Auditors Report Dated February 4, 2010 Independent
Johnson Controls reports fiscal Q3 earnings with strong organic growth and underlying margin expansion
 FOR IMMEDIATE RELEASE CONTACT: Investors: Antonella Franzen (609) 720-4665 Ryan Edelman (609) 720-4545 Media: Fraser Engerman (414) 524-2733 Johnson Controls reports fiscal Q3 earnings with strong organic
The attached Consolidated Income Statements - As Adjusted, contain financial measures that have not been calculated in accordance
 CONSOLIDATED INCOME STATEMENTS - AS ADJUSTED Background Effective as of the end of the day on October 31, 2014, Kimberly-Clark Corporation ("Kimberly-Clark," "we" or "our") completed the distribution to
Newell Rubbermaid Announces Solid Third Quarter Results
 Newell Rubbermaid Announces Solid Third Quarter Results» 2014 and 2015 Full Year Guidance reaffirmed» Next phase of Project Renewal restructuring approved» Intention to sell Endicia online postage business
Regal Beloit Corporation Announces First Quarter 2015 Financial Results
 NEWS RELEASE Regal Beloit Corporation Announces First Quarter Financial Results 5/11/ - Record Sales of $912 Million, an Increase of 14% - Strong Improvement in both Adjusted Operating Profit Margin and
McCORMICK REPORTS DOUBLE DIGIT THIRD QUARTER SALES AND PROFIT GROWTH AND INCREASES 2018 EARNINGS PER SHARE OUTLOOK
 FOR IMMEDIATE RELEASE McCORMICK REPORTS DOUBLE DIGIT THIRD QUARTER SALES AND PROFIT GROWTH AND INCREASES 2018 EARNINGS PER SHARE OUTLOOK HUNT VALLEY, Md., September 27, 2018 - McCormick & Company, Incorporated
Newell Rubbermaid Reports Third Quarter 2011 Results and Reaffirms Full Year 2011 Guidance
 Newell Rubbermaid Reports Third Quarter 2011 Results and Reaffirms Full Year 2011 Guidance» Net Sales Growth of 5.8%; Core Sales Growth of 3.3%» Normalized EPS of $0.45» Announces Project Renewal: A Plan
Ontex Q1 2018: Performance in line with our expectations
 Ontex Q1 2018: Performance in line with our expectations 1.7% LFL revenue growth with positive volumes and price/mix Sequential improvement of margins Progress on our actions in Brazil with full benefits
Clorox Reports Strong 12 Percent EPS Growth for Its Full Fiscal Year, With Solid Q4 Results; Confirms Fiscal 2011 Outlook
 NEWS RELEASE Clorox Reports Strong 12 Percent EPS Growth for Its Full Fiscal Year, With Solid Q4 Results; Confirms Fiscal 2011 Outlook 8/3/2010 OAKLAND, Calif., Aug. 3, 2010 - The Clorox Company (NYSE:
Tupperware Brands Reports First Quarter Results
 Tupperware Brands Corp. 14901 S. Orange Blossom Trail Orlando, FL 32837 Investor Contact: Teresa Burchfield (407) 826-4475 Tupperware Brands Reports First Quarter Results First quarter sales up slightly
McCormick & Company, Inc. 2nd Quarter 2017 Financial Results and Outlook June 29, 2017
 McCormick & Company, Inc. 2nd Quarter 2017 Financial Results and Outlook June 29, 2017 1 The following slides accompany a June 29, 2017 presentation to investment analysts. This information should be read
McCormick & Company, Inc. 4th Quarter 2016 Financial Results and Outlook January 25, 2017
 McCormick & Company, Inc. 4th Quarter 2016 Financial Results and Outlook January 25, 2017 The following slides accompany a January 25, 2017 presentation to investment analysts. This information should
Q Earnings. January 23, 2019
 Q1 2019 Earnings January 23, 2019 Forward-Looking Statements and Non-GAAP Financial Measures Forward-Looking Statements This presentation contains certain forward-looking statements within the meaning
Thank you, good morning everyone and welcome to our fourth quarter 2014 business review.
 Q4 2014 Earnings Call Transcript Inge Thulin & Nicholas Gangestad January 27, 2015 Slide 1, Opening Matt Ginter, Vice President, Investor Relations Thank you, good morning everyone and welcome to our fourth
FRANKLIN ELECTRIC REPORTS 2010 EARNINGS PER SHARE INCREASED 48 PERCENT FROM 2009
 For Immediate Release For Further Information Refer to: John J. Haines 260-824-2900 FRANKLIN ELECTRIC REPORTS 2010 EARNINGS PER SHARE INCREASED 48 PERCENT FROM 2009 Bluffton, Indiana February 28, 2011
Clorox Reports Strong 4% Sales and 20% EPS Growth in Q4; Updates Fiscal Year 2012 Outlook
 NEWS RELEASE Clorox Reports Strong 4% Sales and 20% EPS Growth in Q4; Updates Fiscal Year 2012 Outlook 8/3/2011 OAKLAND, Calif., Aug. 3, 2011 - The Clorox Company (NYSE: CLX) today announced results for
Key results. "We have good momentum in the business with solid sales growth across Walmart U.S., Sam's Club and
 Walmart U.S. Q4 comps grew 2.6% and Walmart U.S. ecommerce sales grew 23%, Walmart U.S. full year comps grew 2.% and Walmart U.S. ecommerce sales grew 44%, Fiscal year GAAP EPS of 3.28; Adjusted EPS2 of
Sysco 2Q16 Earnings Results. February 1, 2016
 Sysco 2Q16 Earnings Results February 1, 2016 Forward-Looking Statements Statements made in this presentation or in our earnings call for the second quarter of fiscal 2016 that look forward in time or that
News Release Tupperware Brands Corp S. Orange Blossom Trail Orlando, FL 32837
 News Release Tupperware Brands Corp. 14901 S. Orange Blossom Trail Orlando, FL 32837 Investor Contact: James Hunt (407) 826-4475 Tupperware Brands Reports Second Quarter 2017 Results Significant Restructuring
June 30 June 30 (in millions of US$, except EPS)
") COMPANY CONTACTS: Jay S. Hennick Chairman & CEO John B. Friedrichsen CFO (416) 960-9500 FOR IMMEDIATE RELEASE Colliers International reports strong results for second quarter Revenues up 13% (15% in local
COMPANY CONTACTS: Jay S. Hennick Chairman & CEO John B. Friedrichsen CFO (416) 960-9500 FOR IMMEDIATE RELEASE Colliers International reports strong results for second quarter Revenues up 13% (15% in local
ALLEGION REPORTS FOURTH-QUARTER, FULL-YEAR 2016 FINANCIAL RESULTS, PROVIDES 2017 OUTLOOK
 ALLEGION REPORTS FOURTH-QUARTER, FULL-YEAR 2016 FINANCIAL RESULTS, PROVIDES 2017 OUTLOOK Fourth-quarter 2016 earnings per share from continuing operations (EPS) of $0.77, compared with 2015 EPS of $0.74;
Reported EPS from continuing operations for the fourth quarter included tax benefits of $243 million, or approximately $0.07 cents per share.
 For Immediate Release Media Relations Contact Greg Rossiter 800-331-0085 Investor Relations Contact Carol Schumacher 479-277-1498 Pre-recorded conference call 800-778-6902 (U.S. and Canada) 585-219-6420
Tenneco Reports Fourth Quarter And Full-Year 2012 Financial Results
 news release Tenneco Reports Fourth Quarter And Full-Year 2012 Financial Results Highest-ever full-year revenue of $7.4 billion Record net income and EPS for Q4 and full year Record fourth quarter cash
GENERAL MILLS REPORTS FISCAL 2019 FIRST-QUARTER RESULTS
 News/Information Investor Relations P. O. Box 1113 Minneapolis, MN 55440 FOR IMMEDIATE RELEASE September 18, 2018 Contact: (analysts) Jeff Siemon: 763-764-2301 (media) Kelsey Roemhildt: 763-764-6364 GENERAL
Fourth Quarter 2016 Earnings Release February 2, 2017
 Fourth Quarter 2016 Earnings Release February 2, 2017 Craig Arnold Forward-looking Statements and Non-GAAP Financial Information This presentation or the comments we make on our call today contain forward-looking
Newell Rubbermaid Raises Full Year Guidance on Strong Second Quarter Results
 Newell Rubbermaid Raises Full Year Guidance on Strong Second Quarter Results Jul 31, 2015 Second Quarter Executive Summary 5.1% Core Sales Growth and Normalized EPS of $0.64 3.9% Net Sales Growth and Reported
more On Aug. 17, 2016, Target provided third quarter 2016 GAAP EPS from continuing operations and Adjusted EPS guidance of $0.75 to $0.95.
 FOR IMMEDIATE RELEASE Contacts: John Hulbert, Investors, (612) 761-6627 Erin Conroy, Media, (612) 761-5928 Target Media Hotline, (612) 696-3400 Target Reports Third Quarter Earnings GAAP EPS from continuing
EMERSON REPORTS FIRST QUARTER 2019 RESULTS AND RAISES FULL YEAR GUIDANCE
 Investor Contact: Tim Reeves (314) 553-2197 Media Contact: Casey Murphy (314) 982-6220 EMERSON REPORTS FIRST QUARTER 2019 RESULTS AND RAISES FULL YEAR GUIDANCE Net sales of $4.1 billion increased 9 percent,
Dave Carlucci Chairman and CEO IMS Health
 Dave Carlucci Chairman and CEO IMS Health 1 March 11, 2009 Safe Harbor Certain statements we make today are forward-looking within the meaning of the US federal securities laws. These statements include,
News Release. Second quarter 2018 Gain on disposal of property, plant & equipment. Pulp & Paper Other operating income $3 $2 $0.03
 234 Kingsley Park Drive Fort Mill, South Carolina 29715 News Release TICKER SYMBOL INVESTOR RELATIONS MEDIA RELATIONS (NYSE: UFS) (TSX: UFS) Nicholas Estrela Director Investor Relations Tel.: 514-848-5049
PPG Industries, Inc. Fourth 2016 Financial Results Earnings Brief January 19, 2017
 PPG Industries, Inc. Fourth 2016 Financial Results Earnings Brief January 19, 2017 Fourth Quarter Financial Highlights PPG fourth quarter net sales from continuing operations of $3.5 billion were down
Q Earnings. October 31, 2018
 Q4 2018 Earnings October 31, 2018 Forward-Looking Statements and Non-GAAP Financial Measures Forward-Looking Statements This presentation contains certain forward-looking statements within the meaning
RPM Reports Fiscal 2019 Second-Quarter Results
 Record second-quarter sales of $1.36 billion improved 3.6% over prior year Second-quarter diluted EPS of $0.37 includes restructuring and other charges, along with adverse impacts from higher raw material
INNOSPEC REPORTS FOURTH QUARTER AND FULL YEAR 2017 FINANCIAL RESULTS
 INNOSPEC REPORTS FOURTH QUARTER AND FULL YEAR 2017 FINANCIAL RESULTS Revenues up 49 percent year over year; Operating up 19 percent Adjusted EBITDA up 52 percent; Adjusted non-gaap EPS up 35 percent Strong
MoneyGram International Delivers Self-Service Growth in Third Quarter 2014 Results
 October 31, 2014 MoneyGram International Delivers Self-Service Growth in Third Quarter 2014 Results Self-service money transfer transactions grew 47 percent Achieved strong U.S. outbound transaction and
News. PPG reports fourth quarter and full-year 2018 financial results
 News PPG Media Contact: Mark Silvey Corporate Communications +1-412-434-3046 silvey@ppg.com PPG Investor Contact: John Bruno Investor Relations +1-412-434-3466 jbruno@ppg.com investor.ppg.com PPG reports
MoneyGram International Reports Fourth Quarter and Full Year 2017 Financial Results
 March 16, 2018 MoneyGram International Reports Fourth Quarter and Full Year 2017 Financial Results DALLAS, March 16, 2018 /PRNewswire/ -- MoneyGram (NASDAQ:MGI) today reported financial results for its
UNITED STATES SECURITIES AND EXCHANGE COMMISSION WASHINGTON, DC FORM 8-K
 UNITED STATES SECURITIES AND EXCHANGE COMMISSION WASHINGTON, DC 20549 FORM 8-K CURRENT REPORT Pursuant to Section 13 or 15(d) of the Securities Exchange Act of 1934 Date of Report (Date of earliest event
Q Earnings. July 26, 2017
 Q3 2017 Earnings July 26, 2017 Forward-Looking Statements and Non-GAAP Measures Forward-Looking Statements This presentation contains certain forward-looking statements within the meaning of the U.S. Private
PPG Fourth Quarter and Full Year 2017 Financial Results
 PPG Fourth Quarter and Full Year 2017 Financial Results Michael H. McGarry, Chairman and Chief Executive Officer Vincent J. Morales, Senior Vice President and Chief Financial Officer John Bruno, Director,
DISCOVERY COMMUNICATIONS REPORTS THIRD QUARTER 2016 RESULTS
 DISCOVERY COMMUNICATIONS REPORTS THIRD QUARTER 2016 RESULTS Third Quarter 2016 Financial Highlights: Revenues of $1,556 million were flat vs. last year (increased 3% excluding currency effects) DCI Net
News Release Tupperware Brands Corp S. Orange Blossom Trail Orlando, FL 32837
 News Release Tupperware Brands Corp. 14901 S. Orange Blossom Trail Orlando, FL 32837 Investor Contact: Lien Nguyen (407) 826-4475 Tupperware Brands Reports Fourth Quarter 2015 Results Declares Regular
For more information, contact: Brad Pogalz (952)
") For more information, contact: Brad Pogalz (952) 887-3753 Donaldson Reports Fiscal 2018 First Quarter Earnings Sales increased 16.6 percent, with Engine up 24.9 percent and Industrial up 1.8 percent Full-year
For more information, contact: Brad Pogalz (952) 887-3753 Donaldson Reports Fiscal 2018 First Quarter Earnings Sales increased 16.6 percent, with Engine up 24.9 percent and Industrial up 1.8 percent Full-year
market share gains in key categories, according to Nielsen and The NPD Group. equipped with the tools to serve customers
 Walmart U.S. Q3 comp sales grew 3.4% and Walmart U.S. ecommerce sales grew 43%, Q3 GAAP EPS of 0.58; Adjusted EPS2 of.08, Walmart now expects FY'9 GAAP EPS of 2.26 to 2.36, Walmart raises guidance for
2016 THIRD-QUARTER EARNINGS REVIEW October 25, 2016
 2016 THIRD-QUARTER EARNINGS REVIEW October 25, 2016 0 THIRD-QUARTER EARNINGS PRESENTATION WHIRLPOOL CORPORATION ADDITIONAL INFORMATION This presentation contains forward-looking statements about Whirlpool
ITT reports 2017 fourth-quarter and full-year results, 2018 guidance
 ITT Inc. 1133 Westchester Ave. White Plains, NY 10604 tel 914 641 2000 Press Release ITT reports 2017 fourth-quarter and full-year results, 2018 guidance 2017 Full-Year Results: Revenue up 8% to $2.6 billion,
McCormick & Company, Inc. 4th Quarter 2018 Financial Results and 2019 Outlook
 McCormick & Company, Inc. 4th Quarter 2018 Financial Results and 2019 Outlook January 24 th 2019 The following slides accompany a January 24 th 2019, earnings release conference call. This information
Target Reports Fourth Quarter and Full-Year 2016 Earnings
 FOR IMMEDIATE RELEASE Contacts: John Hulbert, Investors, (612) 761-6627 Erin Conroy, Media, (612) 761-5928 Target Media Hotline, (612) 696-3400 Target Reports Fourth Quarter and Full-Year Earnings Fourth
Fourth Quarter 2018 Financial Results
 Fourth Quarter 2018 Financial Results Michael H. McGarry, Chairman and Chief Executive Officer Vincent J. Morales, Senior Vice President and Chief Financial Officer John Bruno, Director, Investor Relations
HP Reports Second Quarter 2003 Results
 HP Reports Second Quarter 2003 Results Non-GAAP EPS $0.29, $0.02 Higher Than Analyst Consensus Estimates; GAAP EPS $0.22 Revenue of $18.0 Billion, Up 1% Sequentially Enterprise Systems Grows Sequentially,
McCormick & Company, Inc. 3rd Quarter 2017 Financial Results and Outlook September 28, 2017
 McCormick & Company, Inc. 3rd Quarter 2017 Financial Results and Outlook September 28, 2017 1 The following slides accompany a September 28, 2017 earnings release conference call. This information should
Mondelēz International 2013 Results. February 12, 2014
 Mondelēz International 2013 Results February 12, 2014 1 Forward-looking statements This slide presentation contains a number of forward-looking statements. Words, and variations of words, such as will,
PPG Industries, Inc. Fourth Quarter 2018 Financial Results Earnings Brief January 17, 2019
 PPG Industries, Inc. Fourth Quarter 2018 Financial Results Earnings Brief January 17, 2019 Fourth Quarter Financial Highlights PPG fourth quarter net sales from continuing operations were approximately
TENNECO REPORTS FOURTH QUARTER AND FULL-YEAR 2013 RESULTS
 news release TENNECO REPORTS FOURTH QUARTER AND FULL-YEAR 2013 RESULTS Record-high 4Q and full year revenue Record-high 4Q EBIT and net income 4Q cash flow from operations of $412 million Lake Forest,
FOR IMMEDIATE RELEASE CONTACT: Media: Ben Deutsch (404) Investors: Ann Taylor (404) THE COCA-COLA COMPANY REPORTS
 Investors: Ann Taylor (404) THE COCA-COLA COMPANY REPORTS") Media Relations Department P.O. Box 1734, Atlanta, GA 30301 Telephone (404) 676-2121 FOR IMMEDIATE RELEASE CONTACT: Media: Ben Deutsch (404) 676-2683 Investors: Ann Taylor (404) 676-5383 THE COCA-COLA
Media Relations Department P.O. Box 1734, Atlanta, GA 30301 Telephone (404) 676-2121 FOR IMMEDIATE RELEASE CONTACT: Media: Ben Deutsch (404) 676-2683 Investors: Ann Taylor (404) 676-5383 THE COCA-COLA
PPG Industries, Inc. First 2018 Financial Results Earnings Brief April 19, 2018
 PPG Industries, Inc. First 2018 Financial Results Earnings Brief April 19, 2018 First Quarter Financial Highlights PPG first quarter net sales from continuing operations were approximately $3.8 billion,
PPG Industries, Inc. Fourth 2017 Financial Results Earnings Brief January 18, 2018
 PPG Industries, Inc. Fourth 2017 Financial Results Earnings Brief January 18, 2018 Fourth Quarter Financial Highlights PPG fourth quarter net sales from continuing operations were approximately $3.7 billion,
NU SKIN ENTERPRISES REPORTS RECORD FOURTH-QUARTER AND 2010 RESULTS
 FOR IMMEDIATE RELEASE CONTACTS: Investors Scott Pond, (801) 345-2657, spond@nuskin.com Media Kara Schneck, (801) 345-2116, kschneck@nuskin.com NU SKIN ENTERPRISES REPORTS RECORD FOURTH-QUARTER AND 2010
FOR IMMEDIATE DISTRIBUTION Colin Wheeler February 10, 2011 (303) Investor Relations Dave Dunnewald Leah Ramsey (303) (303)
 Investor Relations Dave Dunnewald Leah Ramsey (303) (303)") CONTACT: News Media FOR IMMEDIATE DISTRIBUTION Colin Wheeler February 10, 2011 (303) 927-2443 Investor Relations Dave Dunnewald Leah Ramsey (303) 927-2334 (303) 927-2397 MOLSON COORS REPORTS HIGHER SALES
CONTACT: News Media FOR IMMEDIATE DISTRIBUTION Colin Wheeler February 10, 2011 (303) 927-2443 Investor Relations Dave Dunnewald Leah Ramsey (303) 927-2334 (303) 927-2397 MOLSON COORS REPORTS HIGHER SALES
PPG Industries, Inc. Third 2016 Financial Results Earnings Brief October 20, 2016
 PPG Industries, Inc. Third 2016 Financial Results Earnings Brief October 20, 2016 Third Quarter 2016 Financial Highlights PPG net sales for the third quarter 2016 were $3.8 billion, up almost 2 percent
Q Earnings Call. April 24, 2013
 Q2 2013 Earnings Call April 24, 2013 Forward-Looking Statements and Non-GAAP Measures Forward-Looking Statements -- This presentation contains certain forward-looking statements within the meaning of the
COACH, INC. REPORTS FISCAL 2016 FIRST QUARTER RESULTS
 COACH, INC. REPORTS FISCAL 2016 FIRST QUARTER RESULTS First Quarter Net Sales Increased 3% Over Prior Year In Constant Currency; Down 1% On A Reported Basis First Quarter Non-GAAP Earnings Per Share was