Seven Months Into a 40% USD Devaluation
|
|
|
- Norah McKinney
- 5 years ago
- Views:
Transcription
1 Seven Months Into a 40% USD Devaluation Montréal July 27, 2017 Mark Steele Quantitative/Technical Analyst BMO Nesbitt Burns Inc. (416) Mark.Steele@bmo.com Tiberiu Stoichita Associate BMO Capital Markets (416) Tiberiu.Stoichita@bmo.com David Cheng Associate BMO Capital Markets (416) David.Cheng@bmo.com Priced Tuesday July 25, 2017 This report was prepared by an analyst(s) employed by BMO Nesbitt Burns Inc., and who is (are) not registered as a research analyst(s) under FINRA rules. For disclosure statements, including the Analyst s Certification, please refer to pages 30 to 33. ~22:25 ET
2 Summary Currency: USD is Falling at a Rate of 10%/Year; Weakness is Broad (3-4) Gold = Yen = US JP 5Y = How Long can the US 5Y Remain Elevated? (5) Commodity Indices Start to Pull Out (6) Base Metals & Bulks = Green on the Screen (7) Signs Energy is Firming Too (8) Bonds Care on Oil Again (9) North American Yields & Curves, Up & Down & All Over Toronto Town! (10) Base Case on Long Term Treasury Yields, And The Risks to Trend (11) Global Yields & Curves (12) ; Inflation Expectations (13); Credit (14) Equity Indices in Local & Loonie Terms (15-16) US & CDN Sector Relative Strength & Price Trends (17-22) US & CDN SubIndustry Relative Strength Trends (23-26) Global Sector Relative Strength Breadth (27-28) Stylish Finishings (29) 2
3 Currency Indices US Dollar Falling at 10%/Year Would Extrapolate to 40% Decline Over the Span of a Full Term (Base Case) Trump Presidency EM is Rising at 8%/Year With Asia Providing This Year s Lift Following LatAm Which Started Bottoming in
 Bloomberg")
4 Major Currency Crosses Universal Strength Means Looking For Weakness in the Denominator The renminbi is a leading indicator for iron ore (BNP Quant) Bloomberg July 26,


5 Gold, Yen & Other Precious Metals Case for Gold Remains Case for Yen Case for Yen Remains Case for Narrowing US JP 5Y Differentials Case for Narrowing US JP 5Y Differentials Remains Potential for Trump Slump 5

6 Commodity Indices Breakout in the LME Basket +ve Reversal in the Rogers Basket Not Yet Seen Same Signaling from the CRB Raw Industrials, Which We Define as the Reflation Trade 6

7 Base Metals & Bulks - Green on the Screen LME Copper Shoots Up 4% on China s Category 7 Scrap Metal Import Prohibition Shanghai Metals Market 7

8 Energy Firming Above Short Term MAs, Which are Themselves Firming Venezuela Watched (CDS Leading Oil is New) 8


9 Bond Market Back to Caring About Oil 9


10 North American Rates & Curves Why the Loonie is the Condo Currency First And Petro Currency Second Flattening Curves Continue to Signal Bond Markets Lacks Fear of Economic Growth 10
11 Continued Base Case for US Long Rates = Negative in 1-8Yrs As We See It, Treasuries Need to See Either The Oil Price to Surge (Pages 8, 9) The FED Switching to a Bank of Canada Style Tighten Up Fillip (Page 10) To Alter the Secular Downtrend, Caused By Central Banks Secular stagnation or financial cycle drag?; by Claudio Borio, BIS March 2017 Core monetary doctrines are wrong. Want higher inflation? Raise rates (The Radical Implications of Stable Quiet Inflation at the Zero Bound by John H. Cochrane) Understanding the Productivity Puzzle by Howard Davies Gradually and Then Suddenly, by Ben Hunt 11
12 Other Global Rates & Curves 12
13 Inflation Expectations Europe Reverses (2 weeks ago), Then US (this week), and Canada too But Europe Fades Back, and Japan Shows No Pulse 13

14 Corporate Credit Risk Sea of Green 14

15 Equity Price Indices in Local Currency Terms 15

16 Equity Price Indices in Soaring Loonie Terms Found that 10% Pullback You Were Looking For 16
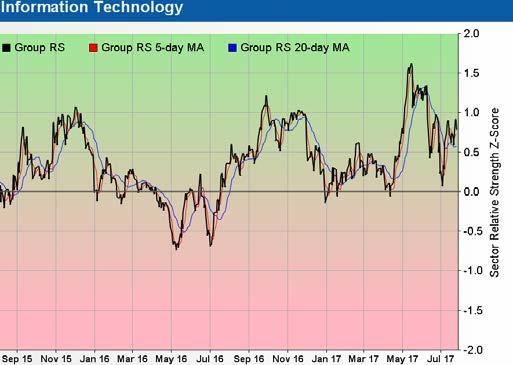
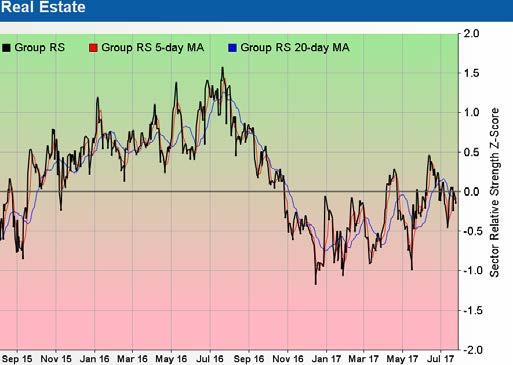
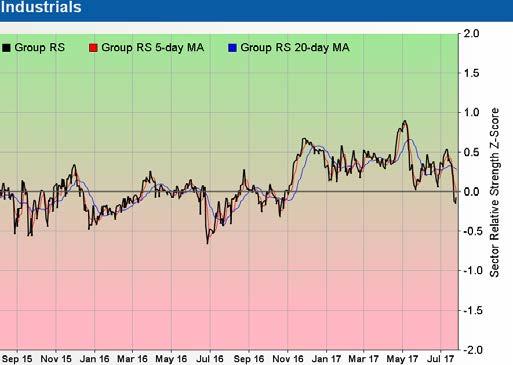
17 Sector Relative Strength Trends 17
18 Sector Price Trends 18
19 Relative Strength: Energy, Materials, Industrials 19
20 Relative Strength: Discretionary, Staples, Health Care 20
21 Relative Strength: Financials, Technology, Telecom 21
22 Relative Strength: Utilities, Real Estate 22

23 Largest 20 US SubIndustry Relative Strength Trends 23
24 Largest 9 US SubIndustries vs S&P

25 Largest 20 Canadian SubIndustry Relative Strength Trends 25
26 Largest 9 Canadian SubIndustries vs S&P/TSX 26


27 Global Relative Strength Breadth Heat Map & Time Series Have Not Seen All Sectors So Compressed in Some Time Sector Positioning Should Be Flattened Out 27


28 Global Relative Strength Breadth Time Series 28

29 Style Growth vs Value Broke Steep Trend & Has Been Churning For Two Months Now Quality is Underperforming / Breaking Lower North American SMID is Breaking Higher 29
30 Disclosures IMPORTANT DISCLOSURES Analyst s Certification I, Mark Steele, hereby certify that the views expressed in this report accurately reflect my personal views about the subject securities or issuers. I also certify that no part of my compensation was, is, or will be, directly or indirectly, related to the specific recommendations or views expressed in this report. Analysts who prepared this report are compensated based upon (among other factors) the overall profitability of BMO Capital Markets and their affiliates, which includes the overall profitability of investment banking services. Compensation for research is based on effectiveness in generating new ideas and in communication of ideas to clients, performance of recommendations, accuracy of earnings estimates, and service to clients. Analysts employed by BMO Nesbitt Burns Inc. and/or BMO Capital Markets Limited are not registered as research analysts with FINRA. These analysts may not be associated persons of BMO Capital Markets Corp. and therefore may not be subject to the FINRA Rule 2241 and 2242 restrictions on communications with a subject company, public appearances and trading securities held by a research analyst account. Company Specific Disclosures For Important Disclosures on the stocks discussed in this report, please go to Distribution of Ratings (June 30, 2017) Rating Category BMO Rating BMOCM US Universe* BMOCM US IB Clients** BMOCM US IB Clients*** BMOCM Universe**** BMOCM IB Clients***** StarMine Universe Buy Outperform 44.9% 21.6% 57.4% 46.8% 57.6% 53.1% Hold Market Perform 51.9% 13.2% 40.6% 50.0% 40.8% 41.6% Sell Underperform 3.2% 10.5% 2.0% 3.2% 1.2% 5.2% * Reflects rating distribution of all companies covered by BMO Capital Markets Corp. equity research analysts. ** Reflects rating distribution of all companies from which BMO Capital Markets Corp. has received compensation for Investment Banking services as percentage within ratings category. *** Reflects rating distribution of all companies from which BMO Capital Markets Corp. has received compensation for Investment Banking services as percentage of Investment Banking clients. **** Reflects rating distribution of all companies covered by BMO Capital Markets equity research analysts. ***** Reflects rating distribution of all companies from which BMO Capital Markets has received compensation for Investment Banking services as percentage of Investment Banking clients. 30
31 Ratings Key (as of October 2016) We use the following ratings system definitions: OP = Outperform - Forecast to outperform the analyst s coverage universe on a total return basis; Mkt = Market Perform - Forecast to perform roughly in line with the analyst s coverage universe on a total return basis; Und = Underperform - Forecast to underperform the analyst s coverage universe on a total return basis; (S) = Speculative investment; Spd = Suspended - Coverage and rating suspended until coverage is reinstated; NR = No Rated - No rating at this time; and R = Restricted - Dissemination of research is currently restricted. BMO Capital Markets seven Top 15 lists guide investors to our best ideas according to different objectives (CDN Large Cap, CDN Small Cap, US Large Cap, US Small Cap, Income, CDN Quant, and US Quant have replaced the Top Pick rating). Prior BMO Capital Markets Rating System (April 2013 October 2016) (January 2010 April 2013) Other Important Disclosures For Important Disclosures on the stocks discussed in this report, please go to or write to Editorial Department, BMO Capital Markets, 3 Times Square, New York, NY or Editorial Department, BMO Capital Markets, 1 First Canadian Place, Toronto, Ontario, M5X 1H3. Dissemination of Research BMO Capital Markets Equity Research is available via our website Institutional clients may also receive our research via Thomson Reuters, Bloomberg, FactSet, and Capital IQ. Research reports and other commentary are required to be simultaneously disseminated internally and externally to our clients. ~ Research distribution and approval times are provided on the cover of each report. Times are approximations as system and distribution processes are not exact and can vary based on the sender and recipients services. Unless otherwise noted, times are Eastern Standard and when two times are provided, the approval time precedes the distribution time. BMO Capital Markets may use proprietary models in the preparation of reports. Material information about such models may be obtained by contacting the research analyst directly. There is no planned frequency of updates to this report. For recommendations disseminated during the preceding 12-month period, please visit: 31
32 General Disclaimer BMO Capital Markets is a trade name used by the BMO Investment Banking Group, which includes the wholesale arm of Bank of Montreal and its subsidiaries BMO Nesbitt Burns Inc., BMO Capital Markets Limited in the U.K. and BMO Capital Markets Corp. in the U.S. BMO Nesbitt Burns Inc., BMO Capital Markets Limited and BMO Capital Markets Corp are affiliates. Bank of Montreal or its subsidiaries ( BMO Financial Group ) has lending arrangements with, or provide other remunerated services to, many issuers covered by BMO Capital Markets. The opinions, estimates and projections contained in this report are those of BMO Capital Markets as of the date of this report and are subject to change without notice. BMO Capital Markets endeavours to ensure that the contents have been compiled or derived from sources that we believe are reliable and contain information and opinions that are accurate and complete. However, BMO Capital Markets makes no representation or warranty, express or implied, in respect thereof, takes no responsibility for any errors and omissions contained herein and accepts no liability whatsoever for any loss arising from any use of, or reliance on, this report or its contents. Information may be available to BMO Capital Markets or its affiliates that is not reflected in this report. The information in this report is not intended to be used as the primary basis of investment decisions, and because of individual client objectives, should not be construed as advice designed to meet the particular investment needs of any investor. This material is for information purposes only and is not an offer to sell or the solicitation of an offer to buy any security. BMO Capital Markets or its affiliates will buy from or sell to customers the securities of issuers mentioned in this report on a principal basis. BMO Capital Markets or its affiliates, officers, directors or employees have a long or short position in many of the securities discussed herein, related securities or in options, futures or other derivative instruments based thereon. The reader should assume that BMO Capital Markets or its affiliates may have a conflict of interest and should not rely solely on this report in evaluating whether or not to buy or sell securities of issuers discussed herein. Additional Matters To Canadian Residents: BMO Nesbitt Burns Inc. furnishes this report to Canadian residents and accepts responsibility for the contents herein subject to the terms set out above. Any Canadian person wishing to effect transactions in any of the securities included in this report should do so through BMO Nesbitt Burns Inc. The following applies if this research was prepared in whole or in part by Alexander Pearce, David Round, Edward Sterck or Brendan Warn: This research is not prepared subject to Canadian disclosure requirements. This research is prepared by BMO Capital Markets Limited and subject to the regulations of the Financial Conduct Authority (FCA) in the United Kingdom. FCA regulations require that a firm providing research disclose its ownership interest in the issuer that is the subject of the research if it and its affiliates own 5% or more of the equity of the issuer. Canadian regulations require that a firm providing research disclose its ownership interest in the issuer that is the subject of the research if it and its affiliates own 1% or more of the equity of the issuer that is the subject of the research. Therefore BMO Capital Markets Limited will disclose its and its affiliates ownership interest in the subject issuer only if such ownership exceeds 5% of the equity of the issuer. To E.U. Residents: In an E.U. Member State this document is issued and distributed by BMO Capital Markets Limited which is authorised and regulated in the UK and operates in the E.U. on a passported basis. This document is only intended for Professional Clients, as defined in Annex II to Markets in Financial Instruments Directive 2004/39/EC ( MiFID ). To U.S. Residents: BMO Capital Markets Corp. furnishes this report to U.S. residents and accepts responsibility for the contents herein, except to the extent that it refers to securities of Bank of Montreal. Any U.S. person wishing to effect transactions in any security discussed herein should do so through BMO Capital Markets Corp. To U.K. Residents: In the UK this document is published by BMO Capital Markets Limited which is authorised and regulated by the Financial Conduct Authority. The contents hereof are intended solely for the use of, and may only be issued or passed on to, (I) persons who have professional experience in matters relating to investments falling within Article 19(5) of the Financial Services and Markets Act 2000 (Financial Promotion) Order 2005 (the "Order") or (II) high net worth entities falling within Article 49(2)(a) to (d) of the Order (all such persons together referred to as "relevant persons"). The contents hereof are not intended for the use of and may not be issued or passed on to retail clients. Unauthorized reproduction, distribution, transmission or publication without the prior written consent of BMO Capital Markets is strictly prohibited. Click here for data vendor disclosures when referenced within a BMO Capital Markets research document. 32
33 ADDITIONAL INFORMATION IS AVAILABLE UPON REQUEST BMO Financial Group (NYSE, TSX: BMO) is an integrated financial services provider offering a range of retail banking, wealth management, and investment and corporate banking products. BMO serves Canadian retail clients through BMO Bank of Montreal and BMO Nesbitt Burns. In the United States, personal and commercial banking clients are served by BMO Harris Bank N.A., (Member FDIC). Investment and corporate banking services are provided in Canada and the US through BMO Capital Markets. BMO Capital Markets is a trade name used by BMO Financial Group for the wholesale banking businesses of Bank of Montreal, BMO Harris Bank N.A, (Member FDIC), BMO Ireland Plc, and Bank of Montreal (China) Co. Ltd. and the institutional broker dealer businesses of BMO Capital Markets Corp. (Member SIPC) in the U.S., BMO Nesbitt Burns Inc. (Member Canadian Investor Protection Fund) in Canada, Europe and Asia, BMO Capital Markets Limited in Europe and Australia and BMO Advisors Private Limited in India. Nesbitt Burns is a registered trademark of BMO Nesbitt Burns Corporation Limited, used under license. BMO Capital Markets is a trademark of Bank of Montreal, used under license. "BMO (M-Bar roundel symbol)" is a registered trademark of Bank of Montreal, used under license. Registered trademark of Bank of Montreal in the United States, Canada and elsewhere. TM Trademark Bank of Montreal COPYRIGHT 2017 BMO CAPITAL MARKETS CORP. 33
Global Macro & North American Equities. Montréal
 Global Macro & North American Equities Montréal September 10, 2014 Mark Steele Quantitative & Technical Analyst (416) 359-4641 mark.steele@bmo.com Priced September 8 Source for all data and graphics herein:
Our Picks % Toronto (TSX) % Dow Jones (US) %
 % Dow Jones (US) %") Recommended List Performance (Jan. 1 2009 - Dec. 31 2009) Our Picks - +75.85% Toronto (TSX) - +30.6% Dow Jones (US) - +18.8% OUR PICKS vs. THE INDEX Financials 39.4% 28% Oil / Gas 36.3% 26% Base Materials
Recommended List Performance (Jan. 1 2009 - Dec. 31 2009) Our Picks - +75.85% Toronto (TSX) - +30.6% Dow Jones (US) - +18.8% OUR PICKS vs. THE INDEX Financials 39.4% 28% Oil / Gas 36.3% 26% Base Materials
Minding the Millennials
 Minding the Millennials November 6, 2015 Sal Guatieri Senior Economist BMO Capital Markets Corp. (416) 359-5295 sal.guatieri@bmo.com Please refer to pages 10 to 12 for Important Disclosures. Echo Boom
MCE Deepwater Development 2015
 MCE Deepwater Development 2015 U.S. Shale Oil Is Pushing Deepwater to the Right March 26, 2015 Daniel Boyd, CFA 212-885-4197 daniel.boyd@bmo.com Refer to pages 14-17 for Important Disclosures, including
Battery Raw Materials The Fundamentals
 Battery Raw Materials The Fundamentals Colin Hamilton Global Commodities Analyst BMO Capital Markets Limited (44) 20 7 664 8172 Colin.Hamilton@bmo.com This report was prepared in part by analysts employed
Breaking Out ECONOMIC RESEARCH. Robert Kavcic, Senior Economist June 8, 2018
 Robert Kavcic, Senior Economist June 8, 2018 Breaking Out Equity markets posted modest gains this week, with little in the way of major market-moving economic data. The S&P 500 rose 1.6% on broad-based
Eyes on the Earnings Season
 Robert Kavcic, Senior Economist July 13, 2018 Eyes on the Earnings Season Equity markets rallied this week ahead of what should be a strong Q2 earnings season. The S&P 500 rose 1.5%, led by technology,
Powell Play ECONOMIC RESEARCH. Robert Kavcic, Senior Economist November 30, Market Performance as of November 30, 2018
 Robert Kavcic, Senior Economist November 30, 2018 Powell Play Equity markets firmed this week, helped by a less hawkish tint to Fed commentary. The Nasdaq added more than 5%, while the S&P 500 jumped 4.8%
Light Sweet Crude O Mine
 Robert Kavcic, Senior Economist May 11, 2018 Light Sweet Crude O Mine Equity markets rallied this week, with little in the way of major market-moving data. The S&P 500 rose 2.4%, with widespread strong
Running Into Resistance
 Robert Kavcic, Senior Economist September 7, 2018 Running Into Resistance Equity markets slumped this week, with the S&P 500 down 1% and the Nasdaq giving up 2.6%, both pulling back from record highs.
Earnings High. meeting did little to suggest anything but the central bank Current. Performance (percent)
") Robert Kavcic, Senior Economist October 19, 2018 Earnings High Equity markets steadied this week, with most indices firming after last week s deep selloff. The S&P 500 was flat, with a definitively defensive
Robert Kavcic, Senior Economist October 19, 2018 Earnings High Equity markets steadied this week, with most indices firming after last week s deep selloff. The S&P 500 was flat, with a definitively defensive
Little Fun in Q1. underperforming. With the first quarter in the bag, here is a look at Current. Performance (percent)
") Robert Kavcic, Senior Economist March 29, 2018 Little Fun in Q1 Equity markets struggled again this week, with ongoing weakness in technology weighing on broader market sentiment. The S&P 500 fell 0.1%,
Robert Kavcic, Senior Economist March 29, 2018 Little Fun in Q1 Equity markets struggled again this week, with ongoing weakness in technology weighing on broader market sentiment. The S&P 500 fell 0.1%,
Cash vs. Clunkers ECONOMIC RESEARCH. Robert Kavcic, Senior Economist December 14, Market Performance as of December 14, 2018
 Robert Kavcic, Senior Economist December 14, 2018 Cash vs. Clunkers Equity markets were mixed this week, with little in the way of major market-moving data or policy action. The S&P 500 fell 1.3%, with
Nerves of Steel ECONOMIC RESEARCH. Robert Kavcic, Senior Economist March 2, Market Performance as of March 2, 2018
 Robert Kavcic, Senior Economist March 2, 2018 Nerves of Steel Equity markets slumped this week on growing risk of a U.S.-led global trade spat. The S&P 500 fell 2.0%, with all sectors in the red, though
Still Stumbling ECONOMIC RESEARCH. Robert Kavcic, Senior Economist November 16, Market Performance as of November 16, 2018
 Robert Kavcic, Senior Economist November 16, 2018 Still Stumbling Equity markets slumped this week as oil prices fell and the reality of cooling global growth continued to sink in. The S&P 500 slipped
Temperature Check ECONOMIC RESEARCH. Robert Kavcic, Senior Economist September 14, Market Performance as of September 14, 2018
 Robert Kavcic, Senior Economist September 14, 2018 Temperature Check Equity markets were mostly higher this week, with the S&P 500 adding 1.2% on the back of gains in telecom, technology and industrials.
The January Effect ECONOMIC RESEARCH. Robert Kavcic, Senior Economist February 2, Market Performance as of February 1, 2019
 Robert Kavcic, Senior Economist February 2, 2019 The January Effect Equity markets rallied this week, stoked by a much more dovish-than-expected shift by the Federal Reserve. The S&P 500 rose 1.6%, while
Further Along the Tightening Path
 Robert Kavcic, Senior Economist June 15, 2018 Further Along the Tightening Path Equity markets were mixed this week alongside a solid run of U.S. economic data, a widely-expected Federal Reserve rate hike
Balance Sheet Normalization Looms
 Robert Kavcic, Senior Economist September 15, 2017 Balance Sheet Normalization Looms Equity markets posted modest gains this week, with hurricane-related distortions starting to creep into the U.S. economic
Equity Rally Stalls. & gas shares, while rate-sensitive Current. utilities managed a modest gain (the Price 1 Week 1 Month 3 Months 1 Year YTD 2018
 Carl Campus, Economist March 8, 2019 Equity Rally Stalls Equity markets were mired in red this week as weak economic data and caution from several central banks amped up global growth concerns, culminating
TSX Bucking the Bearishness
 Robert Kavcic, Senior Economist June 22, 2018 TSX Bucking the Bearishness Equity markets were mixed this week, with escalating trade concerns weighing on risk appetite. The S&P 500 dipped 0.6%, with gains
A Penny and Some Thoughts
 Robert Kavcic, Senior Economist August 12, 2016 A Penny and Some Thoughts Equity markets were mostly higher this week, with the three major U.S. equity indices famously closing at simultaneous record highs
Black Hole Can t Pull Markets Down
 Priscilla Thiagamoorthy, Economic Analyst April 12, 2019 Black Hole Can t Pull Markets Down The unrelenting stock market rally took a slight pause at the start of the week amid heightened trade tensions
Show Me the Money? ECONOMIC RESEARCH. Robert Kavcic, Senior Economist December 7, 2018
 Robert Kavcic, Senior Economist December 7, 2018 Show Me the Money? Equity markets were thumped again this week alongside ongoing U.S.-China trade tensions and signs that global growth is softening. The
The VIX Is In. Performance (percent) Price 1 Week 1 Month 3 Months 1 Year YTD 2017
 Price 1 Week 1 Month 3 Months 1 Year YTD 2017") Robert Kavcic, Senior Economist February 9, 2018 The VIX Is In Equity markets slumped into correction territory this week, with a steep and broad-based selloff continuing across most major indices. The
Robert Kavcic, Senior Economist February 9, 2018 The VIX Is In Equity markets slumped into correction territory this week, with a steep and broad-based selloff continuing across most major indices. The
Red October ECONOMIC RESEARCH. Robert Kavcic, Senior Economist October 26, Market Performance as of October 26, 2018
 Robert Kavcic, Senior Economist October 26, 2018 Red October Stocks extended their slump this week, with the S&P 500 cracking well below its 200-day moving average and entering correction territory. The
Bearing Down on Trade
 Carl Campus, Economist June 29, 2018 Bearing Down on Trade Equity markets couldn t overcome a deep Monday selloff, finishing broadly in the red despite a Friday rally. The late-week surge was most evident
Crude for Thought. crude relentlessly jumped 13% this year alone to extend its highest level Current. Performance (percent)
") Priscilla Thiagamoorthy, Economic Analyst April 20, 2018 Crude for Thought The S&P 500 snapped a three-day winning streak to end the week on a whimper as disappointing earnings by some of the world s largest
Priscilla Thiagamoorthy, Economic Analyst April 20, 2018 Crude for Thought The S&P 500 snapped a three-day winning streak to end the week on a whimper as disappointing earnings by some of the world s largest
Central Banking on Some Relief
 Robert Kavcic, Senior Economist January 4, 2019 Central Banking on Some Relief Equity markets rallied this week on continued signals that North American central banks will lay off their tightening cycles
Not Everyone is Facepalming
 Robert Kavcic, Senior Economist July 27, 2018 Not Everyone is Facepalming Equity markets were mostly higher this week, with the S&P 500 adding 0.6%, backed a firm 4.1% real GDP growth print in the U.S.
Earnings Juiced Buyback Boost?
 Robert Kavcic, Senior Economist October 27, 2017 Earnings Juiced Buyback Boost? Equity markets pushed further into record territory this week, with even the TSX getting into the act. The S&P 500 rose 0.2%
Nasdaq or Bust ECONOMIC RESEARCH. Robert Kavcic, Senior Economist September 21, Market Performance as of September 21, 2018
 Robert Kavcic, Senior Economist September 21, 2018 Nasdaq or Bust Equity markets rallied this week, flying in the face of an escalating trade war between the U.S. and China, while there was little progress
Page 2 of 7 March 2019
 Page 2 of 7 March 2019 Energy and Materials Crude Oil Natural Gas (WTI) (Henry Hub) (AECO) Lumber US$/bbl US$/mmbtu US$/mbf 2006 66.10 6.74 5.76 290 2007 72.36 6.98 6.02 245 2008 99.57 8.86 7.79 215 2009
Bull Market: From Longest to Strongest?
 Robert Kavcic, Senior Economist August 24, 2018 Bull Market: From Longest to Strongest? To much fanfare, the U.S. equity bull market became the longest (but not yet strongest) in post-war history this
Themes of 2018 ECONOMIC RESEARCH. Robert Kavcic, Senior Economist December 21, Market Performance as of December 21, 2018
 Robert Kavcic, Senior Economist December 21, 2018 Themes of 2018 Take 2017 and reverse all the plus-signs voila, 2018. Market performance this year was negative almost across the board, in stark contrast
Peace & Doves ECONOMIC RESEARCH. Carl Campus, Economist April 27, Market Performance as of April 27, 2018
 Carl Campus, Economist April 27, 2018 Peace & Doves War, huh, yeah What is it good for? Absolutely nothing... That was the sentiment on Friday as the leaders from North and South Korea pledged lasting
The Psychology of Investing
 The Psychology of Investing Ryan Nobbs, Investment Advisor BMO Nesbitt Burns Market Historically Far Stronger with Democrat Presidents Average S&P 500 Gains since 1928 Democrat Republican 10,2% 1,1% Adminsitration
BMO Investment Strategy Group Overview
 BMO Investment Strategy Group Overview Brian G. Belski Chief Investment Strategist BMO Capital Markets Corp. (212) 885-4151 (416) 359-5761 brian.belski@bmo.com Refer to pages 22 to 25 for Important Disclosures,
Housing: What the BoC Help Giveth, the BoC Help Taketh Away
 Page 1 Housing: What the BoC Help Giveth, the BoC Help Taketh Away Robert Kavcic, Senior Economist robert.kavcic@bmo.com 416-359-8329 The first impact of the follow-up BoC rate hike might be psychological.
The Importance of Active Portfolio Management Risk Management in an Evolving Market Environment
 Risk Management in an Evolving Market Environment Stéphane Rochon, CFA, Equity Strategist Richard Belley, CFA, Fixed Income Strategist Stock volatility has increased substantially so far in 2018, and understandably,
AM Charts. Job Growth: Two Trends Converge
 A daily snapshot of economic trends and events Job Growth: Two Trends Converge Douglas Porter, CFA, Chief Economist douglas.porter@bmo.com 416-359-4887 The crackling June employment gain in Canada lifted
AM Charts. Debt Burden a Lasting Constraint
 Page 1 Debt Burden a Lasting Constraint Benjamin Reitzes, Canadian Rates & Macro Strategist benjamin.reitzes@bmo.com 416-359-5628 Canada s Q4 national balance sheet accounts release was full of juicy headlines:
Detour Gold (DGC-TSX)
") (DGC-TSX) Stock Rating: Outperform(S) Industry Rating: Market Perform August 1, 213 Research Comment Toronto, Ontario John Hayes, P.Geo. BMO Nesbitt Burns Inc. (416) 39-6189 johnp.hayes@bmo.com Assoc:
(DGC-TSX) Stock Rating: Outperform(S) Industry Rating: Market Perform August 1, 213 Research Comment Toronto, Ontario John Hayes, P.Geo. BMO Nesbitt Burns Inc. (416) 39-6189 johnp.hayes@bmo.com Assoc:
The Importance of Active Portfolio Management
 October 2015 The Importance of Active Portfolio Management Risk Management in an Evolving Market Environment Stéphane Rochon, CFA, Equity Strategist Richard Belley, CFA, Fixed Strategist Few pundits and
Canada/US Steel Trade: Just the Non-Alternative Facts
 A daily snapshot of economic trends and events Canada/US Steel Trade: Just the Non-Alternative Facts Douglas Porter, CFA, Chief Economist douglas.porter@bmo.com 416-359-4887 Canadian and U.S. trade in
Economic outlook: Manitoba in the middle
 Economic outlook: Manitoba in the middle May 17, 2016 Douglas Porter, CFA Chief Economist, BMO Financial Group douglas.porter@bmo.com 416-359-4887 Please refer to the next page for Important Disclosures
Economic outlook Trump: Taxes, Trade & Treasuries
 Economic outlook Trump: Taxes, Trade & Treasuries January 17, 2017 Douglas Porter, CFA Chief Economist, BMO Financial Group douglas.porter@bmo.com 416-359-4887 Please refer to the next page for Important
Equity Strategy. Further Reducing Interest Rate Sensitivity Stéphane Rochon, CFA, Equity Strategist. September 2013
 September 13 Equity Strategy Further Reducing Interest Rate Sensitivity Stéphane Rochon, CFA, Equity Strategist What is your portfolio s interest rate sensitivity? This may not be the most gripping way
Highlights from the 17-April CoT survey of IMM leveraged funds
 Highlights from the 17-April CoT survey of IMM leveraged funds Greg Anderson, CFA, PhD - Global head of FX strategy gregory.anderson@bmo.com +1 212 65 149 April 2, 218 Long-GBP is the most concentrated
Economic outlook: Trade War... and Peace
 Economic outlook: Trade War... and Peace October 2, 218 Douglas Porter, CFA Chief Economist, BMO Financial Group douglas.porter@bmo.com 416-39-4887 Please refer to the next page for Important Disclosures
Highlights from the 10-July CoT survey of IMM leveraged funds
 Highlights from the 1-July CoT survey of IMM leveraged funds Greg Anderson, CFA, PhD - Global head of FX strategy gregory.anderson@bmo.com +1 212 65 149 July 13, 218 Short-NZD the biggest side with short-eur
AM Charts. Markets React to Dovish Rate Hike
 Page 1 Markets React to Dovish Rate Hike Robert Kavcic, Senior Economist robert.kavcic@bmo.com 416-359-8329 Sell the news, as they say (except this time, it was buy the news). Markets reacted to the Federal
A monthly commodity watch December 2018
 A monthly commodity watch December 2018 Steep Crude Decline Delivers Late-Year Hit Economic and geopolitical uncertainties linger into year-end The BMO Capital Markets Commodity Price Index plunged 10.0%
Market Maps. Bob Dickey, Technical Analyst. June 2016
 Market Maps June 2016 Bob Dickey, Technical Analyst RBC Capital Markets, LLC / Portfolio Advisory Group For Important Disclosures, see slides 12 13; priced as of May 31, 2016, unless otherwise noted DJIA
Market Maps. April 2016 Bob Dickey, Technical Analyst. RBC Capital Markets, LLC / Portfolio Advisory Group U.S. Equities.
 RBC Capital Markets, LLC / Portfolio Advisory Group U.S. Equities Image Area Market Maps April 2016 Bob Dickey, Technical Analyst For Important Disclosures, see slides 12 13 Priced as of March 30, 2016,
Fixed Income Strategy
 April 2018 Fixed Income Strategy It Looks Like the 3% Target on the 10-Year Treasury Yield Will Have to Wait Richard Belley, CFA, Fixed Income Strategist After months of relative underperformance, fixed
AM Charts. Canadian Oil Discount Disappears in Double-time
 A daily snapshot of economic trends and events Canadian Oil Discount Disappears in Double-time Douglas Porter, CFA, Chief Economist douglas.porter@bmo.com 416-359-4887 Less than three months ago, the grotesquely
Canadian Equity Strategy
 INVESTMENT STRATEGY I RESEARCH Canadian Equity Strategy The U.S. Election Oct-16 RBC Dominion Securities Inc. Matthew Barasch (Chief Canadian Equity Strategist) (416) 842-7857 matt.barasch@rbccm.com This
VIX to Fall; Stocks to Rise; Small to Outperform
 RBC Capital Markets, LLC October 14, 2014 VIX to Fall; Stocks to Rise; Small to Outperform Market Delivers Above-Average Returns Following Volatility Spikes Investor concerns regarding global growth have
Manulife Financial Corp.
 I N S T I T U T I O N A L E Q U I T Y R E S E A R C H Robert Sedran, CFA 1 (416) 594-7874 Robert.Sedran@cibc.com Koki Akala, CFA 1 (416) 956-3723 Koki.Akala@cibc.com Maurissa Bell, CPA, CA 1 (416) 594-7283
Economic outlook: Trade War... and Peace
 Economic outlook: Trade War... and Peace November 1, 18 Douglas Porter, CFA Chief Economist, BMO Financial Group douglas.porter@bmo.com 16-9-887 Please refer to the next page for Important Disclosures
Market Maps. Bob Dickey, Technical Analyst. April 2017
 Market Maps Bob Dickey, Technical Analyst RBC Capital Markets, LLC / Portfolio Advisory Group For Important Disclosures, see slides 14 15; priced as of March 31, 2017, unless otherwise noted DJIA with
HSBC World Selection Portfolio Quarterly Report Q4 2018
 HSBC World Selection Portfolio Quarterly Report Q4 2018 Date: January 2019 This commentary provides a high-level overview of the recent economic environment and is for information purposes only. It is
United Parcel Service
 January 31, 2017 21:49 ET 21:49 ET~ United Parcel Service UPS-NYSE Rating Market Perform Price: Jan-31 $109.13 Target $115.00 Total Rtn 8% Transportation Fadi Chamoun, CFA Analyst fadi.chamoun@bmo.com
Market Maps. Bob Dickey, Technical Analyst. October 2016
 Market Maps Bob Dickey, Technical Analyst RBC Capital Markets, LLC / Portfolio Advisory Group For Important Disclosures, see slides 12 13; priced as of September 30, 2016, unless otherwise noted DJIA with
Ins and Outs of Exchange-Traded Funds
 Ins and Outs of Exchange-Traded Funds June 25, 2012 Naveed Mohammed, CFA, Mutual Funds Analyst Dennis Fong, Mutual Funds Analyst Tyler Hosie, Associate Introduction Exchange-traded funds have become prevalent
Index Return Monitor. January 11, 2017
 Index Return Monitor January 11, 2017 BRAD BROWN, CFA INVESTMENT STRATEGY GROUP See Legal Disclaimer and Important Disclosure Footnotes at the end of this report for disclosures, including potential conflicts
Rates Scenario. Forecast Summary (averages) Since the last issue of Rates Scenario:
 Since the last issue of Rates Scenario:") An outlook on key interest and foreign exchange rates March 2, 2018 Michael Gregory, CFA, Deputy Chief Economist michael.gregory@bmo.com 416-359-4747 Jennifer Lee, Senior Economist jennifer.lee@bmo.com
An outlook on key interest and foreign exchange rates March 2, 2018 Michael Gregory, CFA, Deputy Chief Economist michael.gregory@bmo.com 416-359-4747 Jennifer Lee, Senior Economist jennifer.lee@bmo.com
Market Maps. Bob Dickey, Technical Strategist, Portfolio Advisory Group. December RBC Capital Markets, LLC / Portfolio Advisory Group
 Market Maps Bob Dickey, Technical Strategist, Portfolio Advisory Group RBC Capital Markets, LLC / Portfolio Advisory Group All values in U.S. dollars and priced as of market close, December 1, 2017, unless
Energy and Mines World Congress: Scotiabank Metals Outlook
 Energy and Mines World Congress: Scotiabank Metals Outlook November 27, 217 Rory Johnston Commodity Economist Scotiabank Economics A Tale of Two Growth Outlooks: World Picks Up Slack of Slowing China 5
FIRST GLANCE COMMENT. Enbridge Inc. (TSX: ENB; 36.69; NYSE: ENB) Q1/07 Results Generally In Line. Sector Perform Average Risk. Impact Neutral.
 Q1/07 Results Generally In Line. Sector Perform Average Risk. Impact Neutral.") 125 WEEKS 17DEC04-01MAY07 Rel. S&P/TSX COMPOSITE INDEX HI-20MAY05 110.97 110.00 HI/LO DIFF -24.90% 100.00 90.00 40.00 38.00 36.00 34.00 32.00 30.00 28.00 7500 6000 4500 3000 1500 2005 D J F M A M J J A
125 WEEKS 17DEC04-01MAY07 Rel. S&P/TSX COMPOSITE INDEX HI-20MAY05 110.97 110.00 HI/LO DIFF -24.90% 100.00 90.00 40.00 38.00 36.00 34.00 32.00 30.00 28.00 7500 6000 4500 3000 1500 2005 D J F M A M J J A
We are Different. So what has changed that caused our strategy to need to be different?
 BMO Nesbitt Burns Our priority in working with our clients is to assist them in achieving the fullness of life and to improve their condition including that of their families, heirs and charitable legacies.
BMO FinTech Sector TACTIC Fund
 BMO FinTech Sector TACTIC Fund Introduction FinTech s Growing Influence on Financial Services What is FinTech? The phrase FinTech, first coined by a New York banker in 1972, refers to the intersection
GLOBAL FX STRATEGY FX SENTIMENT REPORT
 Friday, August 1, 218 CAD Net Short Halved In Past Month; EUR Bears Add To Shorts Data in this report cover up to Tuesday July 7 & were released Friday July 1. This week s positioning adjustments were
Metals Outlook: The Good, The Middling & The Unlucky
 Metals Outlook: The Good, The Middling & The Unlucky November 21, 217 Rory Johnston Commodity Economist Scotiabank Economics A Tale of Two Growth Stories: World Picks Up Slack of Slowing China 5 4 G OECD
Tactical Allocation Customized Thematic Investment Company
 BMO Capital Markets BMO TACTIC Funds Tactical Allocation Customized Thematic Investment Company This offering is made only by prospectus. The prospectus contains important detailed information about the
EQUITY RESEARCH. OSFI releases draft of revisions to B-20 mortgage guidelines. For Required Non-U.S. Analyst and Conflicts Disclosures, see page 3.
 EQUITY RESEARCH July 7, 2017 Canadian Mortgage Industry OSFI releases draft of revisions to B-20 mortgage guidelines RBC Global Equity Team Click here for contributing analysts' contact information OSFI
Larbi Moumni, CFA October 19, 2018
 Jan-13 Jul-13 Jan-14 Jul-14 Jan-15 Jul-15 Jan-16 Jul-16 Jan-17 Jul-17 Jan-18 Jul-18 Weekly Trends Larbi Moumni, CFA October 19, 2018 Chart Pack This week we look at a series of charts to help us take the
Market Briefing: Daily Markets Overview
 Market Briefing: Daily Markets Overview September 25, 218 Dr. Edward Yardeni 516-972-7683 eyardeni@ Joe Abbott 732-497-536 jabbott@ Please visit our sites at www. blog. thinking outside the box Table Of
COMMODITIES CORNER. Gold slips as new U.S. tariffs on China lifts dollar. Synopsis Gold (Play the Range) 2nd Resistance
 2nd Resistance") COMMODITIES CORNER September 18, 2018 Synopsis Gold (Play the Range) US$1,210 US$1,205 US$1,190 US$1,185 Silver (Play the Range) US$14.50 US$14.30 US$14.00 US$13.80 WTI (Play the Range) US$70.20 US$69.20
COMMODITIES CORNER September 18, 2018 Synopsis Gold (Play the Range) US$1,210 US$1,205 US$1,190 US$1,185 Silver (Play the Range) US$14.50 US$14.30 US$14.00 US$13.80 WTI (Play the Range) US$70.20 US$69.20
Eric C. Elbell, CFA, CAIA Area Senior Vice President. Kyongdo Min, CPA, CFA Area Vice President. April 11, 2018
 Eric C. Elbell, CFA, CAIA Area Senior Vice President Kyongdo Min, CPA, CFA Area Vice President April 11, 2018 Agenda We will address three key topics: Headline events that impacted markets during the quarter
CIBC WM INCOME TRUST BENCHMARK INDEX METHODOLOGY
 CIBC WM INCOME TRUST BENCHMARK INDEX METHODOLOGY August 30, 2004 Yin Luo (416) 956-3291 yin.luo@cibc.ca Dawn Jia (416) 594-7136 dawn.jia@cibc.ca CIBC World Markets Inc. (CIBC WM) produces a family of 30
GLOBAL FX STRATEGY FX SENTIMENT REPORT
 Friday, November 3, 218 Aggregate USD Long Climbs To Fresh Multi-Year High Data in this report cover up to Tuesday Oct 2 & were released Friday Oct 5. This week s positioning adjustments were limited to
Technical Analysis: Market Insight
 Technical Analysis: Market Insight October 1987 vs. October 2017 Today (Oct. 19, 2017) marks the 30 th anniversary of Black Monday a global market crash during which the S&P 500 dropped 20% in one day.
U.S. Natural Gas Storage Charts
 U.S. Natural Gas Storage Charts BMO Capital Markets Commodity Products Group November 26, 214 Total U.S. Natural Gas in Storage 5, Total Stocks This Week 3432 4, 3, 2, 1, Reported On: November 26, 214
Q1/15 Quarterly Market Review
 April 7, 2015 Report prepared by: Christopher Lo, CFA Scott Booth, CFA Q1/15 Quarterly Market Review Highlights Canadian & U.S. Fixed Income The North American fixed income markets rallied in Q1/2015,
Special Edition Picture of the Week #2: Assessing Exposure to Brexit and Domestic Opportunities 19% 15% 4% 2% OC AWI DOOR MHK MAS WHR
 EQUITY RESEARCH June 24, 2016 Homebuilders & Building Products RBC Capital Markets, LLC Robert Wetenhall (Analyst) (212) 618-3251 robert.wetenhall@rbccm.com Michael Eisen (Associate) (212) 905-5831 michael.eisen@rbccm.com
GLOBAL FX STRATEGY FX SENTIMENT REPORT
 Monday, November 26, 218 Bears Driving Continued Deterioration In EUR Net As Longs Bail Data in this report cover up to Tuesday Nov 2 & were released Monday Nov 26. This week s speculative positioning
Market Maps. Bob Dickey, Technical Strategist, Portfolio Advisory Group. April RBC Capital Markets, LLC / Portfolio Advisory Group
 Market Maps Bob Dickey, Technical Strategist, Portfolio Advisory Group RBC Capital Markets, LLC / Portfolio Advisory Group All values in U.S. dollars and priced as of March 29, 2018, unless otherwise noted
US Economics. RBC Capital Markets, LLC Jacob Oubina Director, Senior US Economist (212) ; ECONOMICS I RESEARCH
 ; ECONOMICS I RESEARCH") ECONOMICS I RESEARCH US Economics October 2015, LLC Jacob Oubina Director, Senior US Economist (212) 618-7795; jacob.oubina@rbccm.com For Required Conflicts Disclosures, please see the back of this document.
ECONOMICS I RESEARCH US Economics October 2015, LLC Jacob Oubina Director, Senior US Economist (212) 618-7795; jacob.oubina@rbccm.com For Required Conflicts Disclosures, please see the back of this document.
Enbridge Energy Partners, L.P.
 Equity Research Earnings Update April 30, 2007 Stock Rating: Sector Performer Sector Weighting: Market Weight 12-18 mo. Price Target $60.00 EEP-NYSE (4/27/07) $61.19 Key Indices: None 3-5-Yr. EPS Gr. Rate
COMMODITIES CORNER. Gold rises as dollar slips, set for first weekly gain in three. Synopsis
 COMMODITIES CORNER April 12, 2019 Synopsis Gold (Play the Range) US$1,310 US$1,300 US$1,290 US$1,280 Silver (Play the Range) US$15.50 US$15.20 US$14.90 US$14.80 WTI (Play the Range) US$65.50 US$64.50 US$62.50
BTO: Q2/15 Earnings Preview
 B2Gold Corp. (BTO-T: C$1.69), (BTG-N: US$1.31) August 13, 2015 BUY, High Risk Dundee target: C$2.75 BTO: Q2/15 Earnings Preview Joseph Fazzini, CPA, CA, CFA / (647) 428-8248 jfazzini@dundeecapitalmarkets.com
Rates Scenario. Forecast Summary (averages) Since the previous issue of Rates Scenario (on January 10 th ):
 Since the previous issue of Rates Scenario (on January 10 th ):") An outlook on key interest and foreign exchange rates February 7, 2019 Michael Gregory, CFA, Deputy Chief Economist michael.gregory@bmo.com 416-359-4747 Jennifer Lee, Senior Economist jennifer.lee@bmo.com
An outlook on key interest and foreign exchange rates February 7, 2019 Michael Gregory, CFA, Deputy Chief Economist michael.gregory@bmo.com 416-359-4747 Jennifer Lee, Senior Economist jennifer.lee@bmo.com
BMO Junior Gold Index ETF (ZJG) (the ETF )
 (the ETF )") ANNUAL MANAGEMENT REPORT OF FUND PERFORMANCE BMO Junior Gold Index ETF (ZJG) (the ETF ) For the 12-month period ended December 31, 2017 (the Period ) Manager: BMO Asset Management Inc. (the Manager and
ANNUAL MANAGEMENT REPORT OF FUND PERFORMANCE BMO Junior Gold Index ETF (ZJG) (the ETF ) For the 12-month period ended December 31, 2017 (the Period ) Manager: BMO Asset Management Inc. (the Manager and
COMMODITIES CORNER. Gold nudges up amid looming U.S. tariffs on China. Synopsis Gold (Play the Range) 2nd Resistance
 2nd Resistance") COMMODITIES CORNER September 17, 2018 Synopsis Gold (Play the Range) US$1,210 US$1,200 US$1,190 US$1,185 Silver (Play the Range) US$14.50 US$14.30 US$14.00 US$13.80 WTI (Play the Range) US$71.40 US$70.20
COMMODITIES CORNER September 17, 2018 Synopsis Gold (Play the Range) US$1,210 US$1,200 US$1,190 US$1,185 Silver (Play the Range) US$14.50 US$14.30 US$14.00 US$13.80 WTI (Play the Range) US$71.40 US$70.20
GLOBAL FX STRATEGY FX SENTIMENT REPORT
 Monday, December 1, 218 Aggregate USD Long Climbs To Fresh High On EUR, JPY Adjustments Data in this report cover up to Tuesday Dec 4 & were released Monday Dec 1. This week s CFTC report reveals a continued
Major Bulk Commodities: Trends and Outlook
 Major Bulk Commodities: Trends and Outlook June 19, 2013 Christopher LaFemina European Metals and Mining Equity Research US: 212 336 7304 UK: +44 (0)207 029 8131 clafemina@jefferies.com Jefferies LLC Seaborne
MAY 2018 Capital Markets Update
 MAY 2018 Market commentary U.S. ECONOMICS The U.S. added 223,000 jobs to payrolls in May, well above the consensus estimate of 180,000 and the expansion average of around 200,000. Sector job gains were
BTIG Technical Strategy Year-End Chart Book December 2014
 BTIG Technical Strategy Year-End Chart Book December 2014 This year has been one for the technicians - trends and momentum have dominated conversations about the markets, and for good reason. The following