Roger Carr. Chairman. 19 May 2004
|
|
|
- Sabrina Walker
- 5 years ago
- Views:
Transcription
1 Roger Carr Chairman 19 May 2004
2 Karim Naffah Finance Director 19 May 2004
3 Financial Highlights Turnover 823m up 4% EBITDA 197m up 3% Operating profit 140m up 2% Profit before tax 88m down 5% Adjusted EPS* 10.0p up 16% Interim dividend per share 2.85p * Adjusted to exclude exceptional items comparative, proforma figures 3
4 Interim Results - Summary HY 04 HY 03* m m EBITDA % Operating Profit % Interest (52) (44) PBT % Tax (29) (30) Earnings % EPS 10.0p 8.6p % Average no. of shares 591m 734m Note: All numbers are stated pre-exceptional items * Proforma 4
5 Presentational Points to Note FRS 5 Turnover recorded net of coupons and staff discounts Sales comparative reduced by 4m no profit impact Treatment of Easter Straddles period end vs. entirely in H2 last year Like for likes quoted for 32 weeks Reporting to Debt Investors First public reporting Covers securitised estate from 13 November
6 Operating Performance HY 04 HY 03 m m Turnover Pubs & Bars % Restaurants % SCPD % % Operating Profit* Pubs & Bars % Restaurants % SCPD % Note: 2003 turnover restated on the adoption of the Amendment to FRS 5 * Before exceptional items 6
7 Key Operating Statistics* Food sales : up 6% Food mix 29.5% sales : up 0.4% points Outlet staff costs : constant at 24% of sales Retail staff productivity Contribution per staff hour held constant Support cost savings of 5m Net retail operating margin 17% *All figures MAB Retail; 2003 restated for FRS5 7
8 Operating Profit Movement 137m* m* H Trading Support Costs External Costs Easter H *Includes 1m EBIT from SCPD in both years 8
9 Retail Sales Growth 6% + 5.3%* 5% 4% + 3.4%* + 4.4% 3% 2% 1% 0% H H H UNINVESTED SAME OUTLET TOTAL SALES 84% of pubs +10% = 94% of pubs +6% = 100% of pubs Same outlet = uninvested + invested All comparatives restated for the amendment to FRS 5 * 32 weeks 9
10 Like-for-Like Sales H1 04 H2 03 Same Outlet (i.e. Invested + Uninvested) Residential + 6.4% + 3.3% High Street + 3.1% - 0.6% Total + 5.3% + 1.8% Uninvested Residential + 4.4% + 0.8% High Street + 1.3% - 3.0% Total + 3.4% - 0.1% H1 like for likes reflect wks 1-32 to include Easter in both periods. H2 like for likes reflect wks All figures restated for the amendment to FRS 5 10
11 Balancing Sales Growth & Margin H Uninvested LFL Sales + 3.4% Average Selling Price* c.- 3% Movement in Gross Margin (%) Movement in LFL Gross Profit ( ) -ve +ve *Food & Drink 11
12 H Expansionary Capital Locals Residential Pub Restaurants 8m 16m Drinks led Food led 3m 0m High Street City Centre Restaurants Note: UK only and excludes Hollywood Bowl at 2m 12
13 Performance by Segment Locals Residential Pub Restaurants Inc. ROI 16% Inc. ROI 14% Drinks led Food led Inc. ROI 14% Inc. ROI 9% High Street City Centre Restaurants Note: UK only excludes Hollywood Bowl Cumulative 1bn expansionary investment over the last 10 years 13
14 Net Cashflow (a) HY 04 m EBITDA 197 Working capital movement 44 Maintenance Capital Expenditure (48) Expansionary Capital Expenditure (29) Disposals 29 Additional pension contributions (40) Other items 2 Net Operating Cashflow
15 Net Cashflow (b) HY 04 m Net Operating Cashflow 155 Net interest paid (45) Tax paid (9) Normal Dividends Paid (29) Special Dividend (501) Securitisation Costs* (26) Other Items 1 Net cash flow ** (454) * Includes 4m operating exceptionals ** Before 11m of bond repayments 15
16 Financing Closing Net Debt 1.7bn Net Debt : EBITDA* 4.5x Book Gearing** 51% Interest Cover 2.7x Securitisation FCF/Debt Service 2.0x * Based on EBITDA for FY 2003 **Net Debt / (Net Assets + Net Debt) 16
17 Strong Cash Returns 12 months to 10 April 2004 m CROCCE m NOPAT EBIT Depreciation/Amortisation 102 EBITDA 380 Cash Tax (at 22% of EBIT)* (61) (61) Cash Return Average Net Operating Assets 3,450 3,450 Accumulated Depreciation 273 Revaluations (735) 10% (735) 8% Goodwill written off Cash Capital Employed 3,038 2,765 *Unleveraged tax rate (estimated at c. 26% for FY 2004) 17
18 Dividends Interim 2.85p Final 6.65p Total 9.5p Progressive policy to deliver real dividend growth 18
19 Summary Good performance in first half Refinancing successfully completed Emphasis on organic growth is bearing fruit Tougher sales comparatives in second half Focus on cash and high investment returns Progressive dividend policy Commitment to most value creative use of cash 19
20 Tim Clarke Chief Executive 19 May 2004
21 Operational Delivery of Strategy Profitable Sales Growth Focus on best value experience Growing food sales and capturing drinks market share Efficiency gains from growing volumes Strategy on course and building momentum 21
22 Five Key Levers Consumer value proposition Optimal combination of price, volume and mix Cost efficiencies from unit and corporate scale Evolving consumer appeal of brands and formats Proactive estate development Drive earnings growth, cash returns and property appreciation 22
23 Estate Repositioning to Growth Segments Sales = 0.9bn* Sales = 1.5bn Machines 7% Accommodation & Other 2% Food 11% Food 29% 1994 Beer 69% H1 04 MAT Beer 35% Soft Drinks and Wines & Spirits 11% Machines 5% Accommodation & Other 6% Soft Drinks and Wines & Spirits 25% * Managed pub sales Integrated, informal food and drink offers 23
24 Strong Sales Performance 6% 5.8% 5% 4.8% 4.8% 4% 4.0% 3.9% 3% 2.8% 2% 1% 0% Adjusted for FRS 5 First 16 weeks wks First 16 weeks wks First 16 weeks wks Uninvested LFL Same Outlet LFL Total Sales 24
25 Gaining Share Among Managed Pubs MAB % Drink Share of Managed Market* % points *Beer, cider, soft drinks, FABs and spirits ** Period to 1 May 2004 Weeks 10-31** Weeks 25-31** Movement in Volume % Share Movement in Value % Share Source: AC Neilsen Pubtrack 25
26 Focus on Profitable Sales Growth Volume Growth key to driving higher asset productivity Unit scale economies of high take managed houses Average Weekly Takes + 7% to 14.7k per week Regulatory cost inflation exceeding consumer price inflation Volume growth from recruiting customers and increasing frequency Pursuing best combination of volume, price and mix enhancement Total food and drink volumes up 8% Average prices down 3% Profits growth best delivered by cash generative volume growth 26

 Driving value on standard")


27 Draught Beer Premiumisation Consumers trading up to Stella ( 0 to 100k barrels p.a.) Driving value on standard products 14% price reduction, 32% volume increase in Carlsberg Widening Range Introduction of Scot Co beers Good, better, best pricing architecture 27
 from 0% to 10% of wine volume Improving Consumer Choice")
28 Wines Proprietary brands in each main grape variety Own label sourced direct from the growers Silverland (own label) from 0% to 10% of wine volume Improving Consumer Choice 28

29 Soft Drinks Range extensions to meet changing customer tastes Fresh fruit juices available alongside packaged products Offer better value for money Harvester fresh juice servings doubled Product innovation to capture new market trends 29
30 Revenue and Product Yield Management Targeting market growth segments for volume gains Food volumes up 9% Soft drinks volumes up 10% Wines & spirits volumes up 13% Managing product range and pricing for mix margin benefits Beer volumes up 5%, Draught lager volumes up 10% PPL s : volume flat, PPS s : volume down 9% Increasing purchasing power 4% reduction on 60% of COGS re-negotiated To Maximise Gross Profits PPL = Premium Package Lager PPS = Premium Packaged Spirits 30
31 Cost Efficiencies: Staff Productivity Improvements in scheduling and base rosters Minimising hours required to service incremental volumes Kitchen work methods Sales training and product knowledge Trialling incentives link to sales performance 31

32 Residential Areas: 70% of Estate Integrated Food and Drink Offers Same outlet like for likes + 6.4% * Un-invested like for likes + 4.4% * Drinks Volume + 7.0% Drinks Price - 2.0% Food Volume + 9.0% Food Price Flat Growth driven by 5 key brands * 32 weeks 32
33 Residential Areas: Customer Demand Factors Real growth in eating out market Fast growing ancillary sales Wine Soft drinks Coffee Widening competitive gap driving beer market share Estate and brand strategy focused on opportunity 33


34 Pub Restaurants Toby Carvery, Washington Vintage Inns, Cunning Man, Reading Harvester, Barnet 34
35 Pub Restaurants: Evolving the Offers 35


36 Residential Pubs: Conversion Urban Residential Areas White Hart, Nottingham Sizzling Pub Co Mid-Market Suburbs Affluent London Villages Royal Oak, Halesowen Ember Inns Prince of Wales, Notting Hill Metropolitan Professionals 36


37 Residential Pubs: Sales Development 37


38 High Street/City Centre Market: 30% of Estate Circuit Venues Late evening Pubs for office staff, shoppers, tourists. Day time / early evening Central London Same outlet like for likes + 3.1% * Univested like for likes + 1.3% * Drinks volumes +10.0% Drinks prices -6.0% Rebasing price to generate volume gains * 32 weeks 38


39 High Street/City Centre Markets Draught Beer Range in London estate Goose pubs 39
40 Estate Development: Site by Site Approach Development of pipeline Tactical use of maintenance capex to evolve/refurb New build site acquisitions Expansion of Business Franchise model Extract value from non trading property Disposal 40


41 Acquisitions and Conversions Garden Gate, Hampstead Metropolitan Professionals Golden Retriever, Bracknell Vintage Inn 41


42 Evolution through Maintenance Capex Routine annual spend Royal Oak, Halesowen Ember Regular, small investment to maintain fabric of building and offer Brand / format refresh To keep offer current & ensure pub trades to full potential Every 4 7 years, in line with maintenance cycle All within depreciation Snuff Mill, Bristol Harvester 42
43 Business Franchises A partnership to maximise the trading potential of mid-sized pubs 52 properties at end of H1 Franchisee benefit: Accesses managed systems & infrastructure Favourable supply terms MAB benefit: share in trading upside through turnover fee Retain property appreciation Plans for c. 50 more over the next 6 months 43
44 Social and Regulatory Issues Licensing Act and the Guidelines Alcohol Harm Reduction Strategy Smoking in Public Places Gaming Regulation Select Committee Inquiry Well positioned to meet the changes 44
45 Market Growth Trends Consumer expenditure m CAGR (Actual) 1982 to Total (Nominal) 7.4%* Total (Real) 1.8% % 3.8% Eating Out* Beer Wine & Cider Spirits 5.8% Drinking Out 0.2% *including soft drinks Source: Office for National Statistics Lifestyles driving structural acceleration of market growth 45
46 Differentiated Strategy for Growth Quality estate targeting growth segments Integrated food and drink formats Scale advantages enable customer value proposition Power of retail marketing Focus on sustainable sales growth Driving earnings, cash returns and freehold appreciation Operating and financing strategy to reward shareholders 46
47 Questions & Answers 19 May 2004
Roger Carr. Chairman. March
 Roger Carr Chairman March 2003 1 Agenda Introduction Roger Carr (Chairman) Financial Results Karim Naffah (FD) Actions and Priorities Tim Clarke (CEO) Q&A 2 Business Highlights Independent future with
Roger Carr. Chairman. Interim Results 25 May 2006
 Roger Carr Chairman Interim Results 25 May 2006 Karim Naffah Finance Director Interim Results 25 May 2006 Financial Highlights 28 weeks ended 15 April 2006 Growth Revenue 887m 2.7% EBITDA* 207m 4.0% Operating
Acquisition of Whitbread Pub Restaurants. July 2006
 Acquisition of Whitbread Pub Restaurants July 2006 Roger Carr Chairman Tim Clarke Chief Executive Agenda Key features of transaction Financial and strategic rationale Assets acquired Brand conversion plans
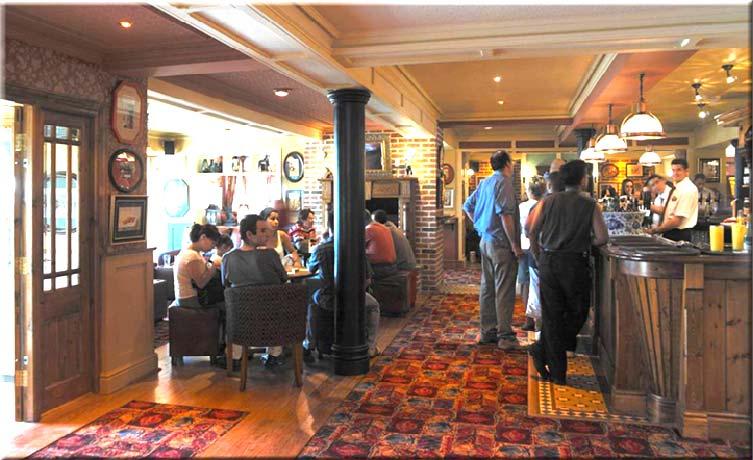
Mitchells & Butlers owns 2,000 high quality managed pubs in prime locations
 Interim Report and Accounts 2004 Mitchells & Butlers Mitchells & Butlers owns 2,000 high quality managed pubs in prime locations Financial highlights Turnover up 4% to 823m EBITDA* up 3% to 197m Operating
Acquisition of Whitbread Pub Restaurants. July 2006
 Acquisition of Whitbread Pub Restaurants July 2006 Agenda Key features of transaction Financial and strategic rationale Assets acquired Brand conversion plans and profits uplifts Management integration
Andrew Vaughan. Group Treasurer
 Andrew Vaughan Group Treasurer Bond Investor Update 27 November 2008 Highlights Gross debt outstanding at year end 2,374m EBITDA (reported) 398m Free cashflow 341m Debt / EBITDA 6.0x EBITDA DSCR* 2.3x
Preliminary Results 2018
 Preliminary Results 2018 Ralph Findlay, Chief Executive Officer Andrew Andrea, Chief Financial Officer Fisherman s Cot, Tiverton Marston s PLC Preliminary results 2018 2 INTRODUCTION 1. Record revenue
Interim Results 2014
 Interim Results 2014 Ralph Findlay Chief Executive Officer Highlights 1. Good trading performance, in line with our expectations Growth in core profits in each trading segment Earnings per share up 10.8%
Interim Results Ralph Findlay, Chief Executive Officer Andrew Andrea, Chief Financial and Corporate Development Officer
 Interim Results 2018 Ralph Findlay, Chief Executive Officer Andrew Andrea, Chief Financial and Corporate Development Officer Ralph Findlay Chief Executive Officer The Leeds Club Marston s PLC Interim Results
Interim Results. 31 March VISIT OUR WEBSITE
 Interim Results 31 March 2007 VISIT OUR WEBSITE www.enterpriseinns.com Financial highlights 6 months to 31 March 2007 Like for like EBITDA up 4.1% to 256m Adjusted earning per share up 15.7% to 18.4 pence
Preliminary Results 2014
 Preliminary Results 2014 Ralph Findlay Chief Executive Officer Andrew Andrea Chief Financial Officer 1 Ralph Findlay Chief Executive Officer Highlights 1. Solid Trading Performance Core PBT growth of 12%
Interim Results 2010
 Interim Results 2010 David Thompson Chairman Highlights 1. H1 performance in line with targets Revenue growth, margins broadly level 2. Good progress in strategy development New-build programme on track
JD WETHERSPOON PLC. Preliminary Results September 2007
 JD WETHERSPOON PLC Preliminary Results 2007 7 September 2007 Highlights Year to 29 July 2007 Reported Excluding 53 Results week last year* Turnover 888.5m +5% +7% Operating profit 91.1m +9% +12% Profit
Full Year Results 2016
 Full Year Results 2016 1 Financial Review 2016 Tim Jones Finance Director 2 Income statement (Pre adjusted items) FY 2016 m FY 2015 m Revenue 2,086 2,101 (0.7%) Operating costs (1,768) (1,773) Operating
- On completion, 500m will have been realised from recent non-core disposals.
 20 August 2010 Mitchells & Butlers plc Disposal of 333 Non-Core Pubs for 373m Mitchells & Butlers announces the proposed disposal of 333 Non-Core Pubs for a cash consideration of 373m to Stonegate Pub
Interim Results March 2007
 Interim Results 2007 2 March 2007 Highlights Six Months to 28 January 2007 Turnover up 8% to 438.4m Operating profit up 17% to 46.3m Profit before tax up 20% to 32.9m Earnings per share up 37% to 14.5p
Preliminary Results 2012
 Preliminary Results 2012 Highlights Resilient performance with growth in all segments Strategy appropriate for continuing economic uncertainty High quality pubs underlined by estate valuation New-build
Financial Review H Tim Jones Finance Director
 Half Year Results 2018 1 Financial Review H1 2018 Tim Jones Finance Director 2 Key messages Continued improvement and outperformance on sales Cost headwinds unchanged, with progress on mitigation Stabilisation
MITCHELLS & BUTLERS PLC. FULL YEAR RESULTS (For the 52 weeks ended 28 September 2013)
") 26 November 2013 MITCHELLS & BUTLERS PLC FULL YEAR RESULTS (For the 52 weeks ended 28 September 2013) A strong financial performance and business transformation on track Statutory results Profit before
26 November 2013 MITCHELLS & BUTLERS PLC FULL YEAR RESULTS (For the 52 weeks ended 28 September 2013) A strong financial performance and business transformation on track Statutory results Profit before
On-premise establishments: how the economic backdrop and new economic policies are affecting the trade of local premises.
 On-premise establishments: how the economic backdrop and new economic policies are affecting the trade of local premises. The UK pub sector: Survival of the Fittest David Thompson Chairman Marston s PLC
Interim Results For 6 months ended 31 Dec February 2018
 Interim Results For 6 months ended 31 Dec 2017 February 2018 Financial highlights 62.5m 55.7m 71.7m 13.7m 10.8m 15.8m 8.8m 11.2m 12.9m 16 17 18 16 17 18 16 17 18 REVENUE 71.7m (H1 FY17: 62.5m) +14.7% YEAR-ON-YEAR
JD WETHERSPOON PLC. Preliminary Results September 2008
 JD WETHERSPOON PLC Preliminary Results 2008 5 September 2008 Highlights Year to 27 July 2008 Revenue up 2.1% to 907.5m (LFL -1.1%) Operating profit down 4.3% to 87.2m Operating margin down 0.6% pts to
MITCHELLS & BUTLERS PLC LEI no JHYNDNB1NS2W10 FULL YEAR RESULTS. (For the 53 weeks ended 30 September 2017)
") MITCHELLS & BUTLERS PLC LEI no. 213800JHYNDNB1NS2W10 23 November 2017 FULL YEAR RESULTS (For the 53 weeks ended 30 September 2017) - Like-for-like sales growth maintained - Consistent sales outperformance
MITCHELLS & BUTLERS PLC LEI no. 213800JHYNDNB1NS2W10 23 November 2017 FULL YEAR RESULTS (For the 53 weeks ended 30 September 2017) - Like-for-like sales growth maintained - Consistent sales outperformance
Mitchells & Butlers Retail Limited
 Report and Financial Statements Registered Number: 24542 DIRECTORS REPORT for the 53 weeks ended 1 October 2005 The directors present their report on the affairs of the Company, together with the financial
JD WETHERSPOON PLC. Preliminary Results September 2009
 JD WETHERSPOON PLC Preliminary Results 2009 11 September 2009 Highlights Year to 26 July 2009 Revenue 955.1m (2008: 907.5m) +5.2% Like-for-like sales +1.2% Operating profit before exceptional items 97.0m
2014 Preliminary Results
 2014 Preliminary Results John Hutson CEO Kirk Davis FD The Port Jackson, Bishop s Stortford Kirk Davis FD 12 September 2014 The Admiral Collingwood, Ilfracombe Financial Summary 52 weeks to 27/07 2014
PRELIMINARY RESULTS 9TH SEPTEMBER John Hutson CEO Ben Whitley FD
 The Booking Office, Waverley Station, Edinburgh The Thomas Waghorn, Chatham PRELIMINARY RESULTS 9TH SEPTEMBER 2016 John Hutson CEO Ben Whitley FD Financial Summary 2016 2015 Var% 2014 2013 2012 2 2011
FULLER, SMITH & TURNER PLC ANNUAL RESULTS FOR THE 52 WEEKS ENDED 26 MARCH 2016
 FULLER, SMITH & TURNER PLC ANNUAL RESULTS FOR THE 52 WEEKS ENDED 26 MARCH 2016 AGENDA HIGHLIGHTS MICHAEL TURNER FINANCIAL REVIEW JAMES DOUGLAS STRATEGY & OPERATIONS REVIEW SIMON EMENY SUMMARY & OUTLOOK
Fuller, Smith & Turner PLC Half Year Results for the 26 weeks ended 27 September 2014
 Fuller, Smith & Turner PLC Half Year Results for the 26 weeks ended 27 September 2014 Michael Turner Chairman Agenda Overview Financial Results Strategic Progress and Operations Prospects Highlights Continued
Interim Results: 31 March
 Interim Results: 31 March 2018 www.eigroupplc.com Introduction Robert Walker Chairman Overview Simon Townsend Chief Executive Officer Highlights Trading performance Pubs Average annualised net income per
Agenda. FY2018 highlights Evolution of key drivers Summary and outlook. Financial performance Property update
 Agenda FY2018 highlights Evolution of key drivers Summary and outlook Financial performance Property update 1 Continued delivery of our growth strategy in fy2018 High quality profitable estate Affordable
Interim results. 30 March 2017
 Interim results 30 March 2017 Highlights Ian Filby Continued Financial Growth and Strong Operational Progress H1 FINANCIALS 493.7m +7.0% 16.7m +3.1% 20m 9.5p per share Gross sales Profit before tax Special
J.D. Wetherspoon Plc. Preliminary Results. 2 September 2005
 J.D. Wetherspoon Plc Preliminary Results 2 September 2005 Highlights -Twelve Months to 24 July 2005 Turnover up 3% to 809.9m Operating profit down 9% to 70.4m Profit before tax down 15% to 46.1m Earnings
FY16 YEAR END RESULTS 5 APRIL 2016
 FY16 YEAR END RESULTS 5 APRIL 2016 DEFINITIONS AND IMPORTANT NOTICE The following definitions apply throughout Trading EBITDA (earnings before interest, tax, depreciation and amortisation): excludes exceptional
Today s agenda. Introduction..Stephen Goodyear. Financial Review... Peter Whitehead. Managed Houses Young s. Patrick Dardis
 Interim Review Today s agenda Introduction..Stephen Goodyear Financial Review.... Peter Whitehead Managed Houses Young s. Patrick Dardis Managed Houses Geronimo.. Rupert Clevely Tenancies... Stephen Goodyear
Alternative performance measures
 Alternative performance measures The performance of the Group is assessed using a number of Alternative Performance Measures (APMs). The Group s results are presented both before and after separately disclosed
J.D. Wetherspoon Plc Interim Announcement. 7 March 2003
 J.D. Wetherspoon Plc Interim Announcement 7 March 2003 Highlights -Six Months to 26 January 2003 Turnover up 23% to 350.6m Profits before tax up 3% to 25.6m Earnings per share up 1% to 7.8p Free cash flow
Mitchells & Butlers Retail Limited
 Report and Financial Statements Registered Number: 24542 DIRECTORS REPORT for the 52 weeks ended 30 September 2006 The directors present their report on the affairs of the Company, together with the financial
Investor Roadshow December 2010
 Investor Roadshow December 2010 1 A Spreading Geography OPERATING TERRITORIES KEY EXPORT MARKETS 2 A Strategy For Growth Market Volume Growth 2-3% Organic Growth Developing Cold-Drink Distribution Innovation
SABMiller plc US annual results presentation Year ended March 31, 2014
 SABMiller plc US annual results presentation Year ended March 31, 2014 Presented by Jamie Wilson, Chief Financial Officer Gary Leibowitz, SVP Internal & Investor Engagement Forward looking statements This
Britvic plc. Preliminary Results 2011
 Britvic plc Preliminary Results 2011 Gerald Corbett Chairman John Gibney Group Finance Director Agenda Financial performance John Gibney Britvic and the market review Paul Moody Group performance +14.6%
J.D. Wetherspoon Plc. Preliminary Announcement. 3 September 2004
 J.D. Wetherspoon Plc Preliminary Announcement 3 September 2004 Highlights -Twelve Months to 25 July 2004 Turnover up 8% to 787.1m Operating profit up 4% to 77.6m Profit before tax down 4% to 54.1m Earnings
Fuller, Smith and Turner PLC Preliminary Results for the 52 weeks ended 29 March 2008
 Fuller, Smith and Turner PLC Preliminary Results for the 52 weeks ended 29 March 2008 Agenda Strategy Corporate Progress Key Financials Fuller s Inns The Fuller s Beer Company Prospects Consistent Strategy
Half year result. 26 August 2016
 2016 Half year result 26 August 2016 Alison Watkins Group Managing Director Martyn Roberts Group Chief Financial Officer Barry O Connell MD Australian Beverages Agenda Group Result Summary Shareholder
FY2018 Half-Year Results. 26 October, 2017
 FY2018 Half-Year Results 26 October, 2017 Disclaimer This presentation has been prepared solely in connection with the financial results of C&C Group plc (the "Company") for the period ended 31 August,
Britvic plc. Interims presentation 2015
 Britvic plc Interims presentation 2015 Gerald Corbett Chairman John Gibney Chief Financial Officer Continued strong earnings growth in challenging trading conditions -0.7% +6.2% +60bps +11.6% 0.4x +9.8%
Financial results & business update. Quarter and year ended 31 December February 2016
 Financial results & business update Quarter and year ended 31 December 2015 11 February 2016 Disclaimer 3 Any remarks that we may make about future expectations, plans and prospects for the company constitute
Full Year Results Bob Ivell Chairman
 Full Year Results 2015 Bob Ivell Chairman Financial Review 2015 Tim Jones Finance Director Income statement (Pre-exceptional items) FY 2015 m FY 2014 m Revenue 2,101 1,970 +6.6% Operating costs (1,773)
Mitchells & Butlers owns 2,000 high-quality managed pubs in prime locations.
 Annual Review and Summary Financial Statement 2003 Mitchells & Butlers owns 2,000 high-quality managed pubs in prime locations. Turnover up 2% to 1,513m EBITDA flat at 374m Operating profit * down 5% to
Domino s Pizza UK & IRL plc. Interim Results for the 26 weeks ended 28 June 2009
 Domino s Pizza UK & IRL plc Interim Results for the 26 weeks ended 28 June 2009 m System sales momentum 210 System sales have doubled since 2005 196.4 190 170.2 170 150 130 110 97.1 114.8 142.5 +24.1%
Investor presentation. September 2018
 Investor presentation September 2018 Forward looking statements Forward-Looking Statements INCLUDED IN THIS PRESENTATION ARE FORWARD-LOOKING MANAGEMENT COMMENTS AND OTHER STATEMENTS THAT REFLECT MANAGEMENT
Interim Results. The White House, Leicester
 Interim Results The White House, Leicester 2013 Kirk Davis FD 15 March 2013 The Six Bells, Lymington Financial Summary 26 weeks to 27/01 H1 2013 H1 2012 Change Revenue 626.4m 569.4m +10.0% Like-for-like
MARSTON S PLC INTERIM RESULTS FOR THE 26 WEEKS ENDED 2 APRIL Profit and cash flow growth from high quality pub and beer business
 MARSTON S PLC INTERIM RESULTS FOR THE 26 WEEKS ENDED 2 APRIL 18 May Profit and cash flow growth from high quality pub and beer business Strong trading performance: - Underlying Group revenue up 11.5% to
Thai Beverage PLC. FY17 Financial Results. (Full Year Ended 30 September 2017) FY17 (Full Year Ended 30 September 2017) Thai Beverage PLC
 FY17 (Full Year Ended 30 September 2017) Thai Beverage PLC") Thai Beverage PLC FY17 Financial Results (Full Year Ended 30 September 2017) FY17 (Full Year Ended 30 September 2017) Thai Beverage PLC 1 Note on Forward Looking Statements The following presentation may
Thai Beverage PLC FY17 Financial Results (Full Year Ended 30 September 2017) FY17 (Full Year Ended 30 September 2017) Thai Beverage PLC 1 Note on Forward Looking Statements The following presentation may
HUHTAMÄKI OYJ INTERIM REPORT. January 1 March 31, 2013
 HUHTAMÄKI OYJ INTERIM REPORT January 1 March 31, 2013 Huhtamäki Oyj, Interim Report January 1 March 31, 2013 Net sales and EBIT increased Net sales growth of 4% led by the foodservice acquisition in Asia
Domino s Pizza UK & IRL plc. Preliminary Results for the 52 weeks ended 30 December 2007
 Domino s Pizza UK & IRL plc Preliminary Results for the 52 weeks ended 30 December 2007 The Team Stephen Hemsley Executive Chairman Chris Moore Chief Executive Officer Lee Ginsberg Chief Financial Officer
INTERIM RESULTS PRESENTATION SIX MONTHS TO 30 JUNE 2018
 INTERIM RESULTS PRESENTATION SIX MONTHS TO 30 JUNE 2018 DISCLAIMER The information contained in this presentation has not been independently verified and this presentation contains various forward-looking
MITCHELLS & BUTLERS PLC LEI no: JHYNDNB1NS2W10 HALF YEAR RESULTS. (For the 28 weeks ended 14 April 2018)
") MITCHELLS & BUTLERS PLC LEI no: 213800JHYNDNB1NS2W10 16 May 2018 HALF YEAR RESULTS (For the 28 weeks ended 14 April 2018) - Sustained like-for-like sales outperformance - Fresh wave of initiatives to further
MITCHELLS & BUTLERS PLC LEI no: 213800JHYNDNB1NS2W10 16 May 2018 HALF YEAR RESULTS (For the 28 weeks ended 14 April 2018) - Sustained like-for-like sales outperformance - Fresh wave of initiatives to further
Preliminary announcement of the results for the financial year ended 30 September Strong results despite difficult market conditions
 Six Continents PLC 6 December 2001 Preliminary announcement of the results for the financial year ended 30 September 2001 Strong results despite difficult market conditions - Turnover* up 6.8 per cent
For personal use only. JB Hi-Fi Limited. HY18 Results Presentation
 JB Hi-Fi Limited HY8 Results Presentation 5 FEBRUARY AUGUST 06 08 PAGE Agenda. Group Performance Overview. JB HI-FI 3. The Good Guys 4. Group Balance Sheet and Cash Flow 5. Outlook Richard Murray Group
FY17 Preliminary results September 2017
 FY17 Preliminary results September 2017 Financial highlights 91.1m 81.1m 105.2m 12.4m 16.3m 11.2m 7.8m 5.6m 15 16 17 15 16 17 2.0m 15 16 17 REVENUE 105.2m (2016: 91.1m) +12% YEAR-ON-YEAR 1 UNDERLYING EBITDA
26 November 2015 MARSTON S PLC PRELIMINARY RESULTS FOR THE 52 WEEKS ENDED 3 OCTOBER 2015
 26 November 2015 MARSTON S PLC PRELIMINARY RESULTS FOR THE 52 WEEKS ENDED 3 OCTOBER 2015 A high quality pub and beer business delivering strong profit and returns growth Strong trading performance: - Underlying
EARNINGS CALL. FISCAL 2018: Q3 RESULTS March 22, 2018
 EARNINGS CALL FISCAL 2018: Q3 RESULTS March 22, 2018 Disclaimer/Non-GAAP Information IMPORTANT NOTICE The following slides are part of a presentation by Darden Restaurants, Inc. (the "Company") and are
SunRice Grower & Shareholder Meetings Mr. Rob Gordon, CEO
 SunRice Grower & Shareholder Meetings Mr. Rob Gordon, CEO June 2017 The situation leading up to 2012 and the subsequent Strategy Portfolio characteristics 2011 The 2012 Strategy 2 This strategy was responsible
SHEPHERD NEAME LIMITED INTERIM REPORT 2014
 BY APPOINTMENT TO: HIS ROYAL HIGHNESS THE PRINCE OF WALES SUPPLIER OF SPECIALIST ORDERS SHEPHERD NEAME LTD FAVERSHAM KENT SHEPHERD NEAME LIMITED INTERIM REPORT 2014 www.shepherdneame.co.uk 1 FINANCIAL
30 November 2017 MARSTON S PLC PRELIMINARY RESULTS FOR THE 52 WEEKS ENDED 30 SEPTEMBER 2017
 30 November 2017 MARSTON S PLC PRELIMINARY RESULTS FOR THE 52 WEEKS ENDED 30 SEPTEMBER 2017 A high quality pub and beer business continuing to deliver growth Revenue and earnings growth Underlying Statutory
Annual Report and Accounts Brands people love
 Annual Report and Accounts 2013 Brands people love Brands people love Contents Company overview IFC Brands people love 01 2013 Financial Highlights 02 Chairman s statement 04 Mitchells & Butlers at a glance
MITCHELLS & BUTLERS PLC LEI no JHYNDNB1NS2W10 FULL YEAR RESULTS. (For the 52 weeks ended 29 September 2018)
") MITCHELLS & BUTLERS PLC LEI no. 213800JHYNDNB1NS2W10 22 November 2018 FULL YEAR RESULTS (For the 52 weeks ended 29 September 2018) - Adjusted operating profit a growth in the second half - Like-for-like
MITCHELLS & BUTLERS PLC LEI no. 213800JHYNDNB1NS2W10 22 November 2018 FULL YEAR RESULTS (For the 52 weeks ended 29 September 2018) - Adjusted operating profit a growth in the second half - Like-for-like
PRELIMINARY RESULTS 15 SEPTEMBER Royal Victoria Pavilion, Ramsgate
 PRELIMINARY RESULTS 15 SEPTEMBER 2017 Royal Victoria Pavilion, Ramsgate Crown Hotel, Biggleswade Financial Summary 2017 2 2016 Var% Var% (Exc wk53) wk53) 2015 2014 2013 2012 2 2011 2010 2009 2008 Revenue
Mitchells & Butlers Retail Limited
 Unaudited Semi-Annual Financial Statements For the 28 weeks ended 15 April 2006 PROFIT AND LOSS ACCOUNT for the 28 weeks ended 15 April 2006 ended ended ended restated* restated* Notes m m m TURNOVER 3
Britvic plc Interim Results 2018
 Britvic plc Interim Results 2018 CEO SIMON LITHERLAND DELIVERING ON OUR STRATEGIC PRIORITIES AND VISION 2 OUR STRATEGY IS DELIVERING CONSISTENT RETURNS FOR SHAREHOLDERS GENERATE PROFITABLE GROWTH IN OUR
THE WOLVERHAMPTON & DUDLEY BREWERIES, PLC PRELIMINARY RESULTS FOR THE 52 WEEKS ENDED 27 SEPTEMBER 2003
 3 December 2003 THE WOLVERHAMPTON & DUDLEY BREWERIES, PLC PRELIMINARY RESULTS FOR THE 52 WEEKS ENDED 27 SEPTEMBER 2003 Record underlying* earnings per share of 68.9p, up 10.1% (basic eps 53.0p, up 5.6%)
H1 16 interim results. 22 September 2015
 H1 16 interim results 22 September 2015 Important notice 2 This presentation may include certain forward-looking statements, beliefs or opinions, including statements with respect to the Company s business,
COLLINS FOODS LIMITED Annual Queensland Conference
 COLLINS FOODS LIMITED Annual Queensland Conference 9 October 2013 COLLINS FOODS LIMITED 0 Today s agenda SECTION 1 Collins Foods Limited SECTION 2 KFC returns to growth SECTION 3 Sizzler in transition
SKYCITY Entertainment Group Limited
 SKYCITY Entertainment Group Limited 1H18 Results Investor Presentation 9 February 2018 Disclaimer All information included in this presentation is provided as at 9 February 2018 This presentation includes
Presented by Alan Clark, Chief Executive Domenic De Lorenzo, Chief Financial Officer
 Presented by Alan Clark, Chief Executive Domenic De Lorenzo, Chief Financial Officer This presentation includes forward-looking statements with respect to certain of SABMiller plc s plans, current goals
JD WETHERSPOON PLC. Preliminary Results September 2012 Kirk Davis FD John Hutson - CEO
 JD WETHERSPOON PLC Preliminary Results 2012 14 September 2012 Kirk Davis FD John Hutson - CEO Highlights Year to 29 July 2012 Excluding Week 53 Revenue 1,197.1m (2011: 1,072.0m) + 11.7% +9.3% Like-for-like
Thai Beverage Public Company Limited
 Thai Beverage Public Company Limited Financial Statements and Dividend Announcement for the Year Ended 30 September 2017. PART I Information Required for Full Year Announcements. 1. (a) ( i ) An income
KINGSPAN 2017 INTERIM RESULTS 18TH AUGUST 2017
 KINGSPAN 2017 INTERIM RESULTS 18TH AUGUST 2017 DISCLAIMER Forward Looking Statements This presentation contains certain forward-looking statements including, without limitation, the Group s financial position,
Thai Beverage Public Company Limited
 Thai Beverage Public Company Limited Financial Statements For The Three-Month Period Ended 31 December 2017. PART I INFORMATION REQUIRED FOR THE THREE-MONTH PERIOD ENDED 31 DECEMBER (Q1) ANNOUNCEMENTS.
Fixed Income Investor Presentation August 2016
 InterContinental O2, London Fixed Income Investor Presentation August 2016 Table of contents 1. Introduction to IHG p3 2. Our Strategy p7 3. Financial Performance p13 DISCLAIMER RECIPIENTS ATTENTION IS
Financial results & business update. Quarter and year ended 31 December February 2017
 Financial results & business update Quarter and year ended 31 December 2016 14 February 2017 Disclaimer 3 Any remarks that we may make about future expectations, plans and prospects for the company constitute
Thai Beverage PLC. FY18 Financial Results. (Full Year ended 30 September 2018) FY18 (Full Year ended 30 September 2018) Thai Beverage PLC
 FY18 (Full Year ended 30 September 2018) Thai Beverage PLC") Thai Beverage PLC FY18 Financial Results (Full Year ended 30 September 2018) FY18 (Full Year ended 30 September 2018) Thai Beverage PLC 1 Note on Forward Looking Statements The following presentation may
Thai Beverage PLC FY18 Financial Results (Full Year ended 30 September 2018) FY18 (Full Year ended 30 September 2018) Thai Beverage PLC 1 Note on Forward Looking Statements The following presentation may
Page Key Financial Highlights Key Drivers of Improved Profitability Strategy Global Sales Revenue Franchisee Sales Revenue 10 Review of the Income
 1 2 Page 3 Key Financial Highlights 4 Key Drivers of Improved Profitability 5 Strategy 8 Global Sales Revenue 9 Franchisee Sales Revenue 10 Review of the Income Statement for the half year ended 31 December
Enterprise Inns plc Preliminary announcement For the financial year ending 30 September 2007
 Enterprise Inns plc Preliminary announcement For the financial year ending 30 September 2007 20 November 2007 Enterprise Inns plc (ETI), the leading specialist operator of leased and tenanted pubs in the
Aegis Group plc Half Year Results. 27 August 2010
 Aegis Group plc 2010 Half Year Results 27 August 2010 Agenda Introduction John Napier, Chairman Aegis Group overview Jerry Buhlmann, CEO Divisional review Aegis Media - Jerry Buhlmann, CEO Synovate Robert
C&C Group plc. Deutsche Bank Conference
 C&C Group plc Deutsche Bank Conference June, 2012 Disclaimer This presentation does not constitute an invitation to underwrite, subscribe for, or otherwise acquire or dispose of any shares or other securities
SABMiller plc. Full year results Twelve months ended 31 March Jamie Wilson, Chief Financial Officer Gary Leibowitz, SVP, Investor Relations
 SABMiller plc Full year results Twelve months ended 31 March 2012 Jamie Wilson, Chief Financial Officer Gary Leibowitz, SVP, Investor Relations 24 May 2012 Forward looking statements This presentation
Thai Beverage PLC. 1Q18 Financial Results. (First Quarter Ended 31 December 2017) 1Q18 (First Quarter Ended 31 December 2017) Thai Beverage PLC
 1Q18 (First Quarter Ended 31 December 2017) Thai Beverage PLC") Thai Beverage PLC 1Q18 Financial Results (First Quarter Ended 31 December 2017) 1Q18 (First Quarter Ended 31 December 2017) Thai Beverage PLC 1 Note on Forward Looking Statements The following presentation
Thai Beverage PLC 1Q18 Financial Results (First Quarter Ended 31 December 2017) 1Q18 (First Quarter Ended 31 December 2017) Thai Beverage PLC 1 Note on Forward Looking Statements The following presentation
INTERIM REPORT AND FINANCIAL STATEMENTS. For the six months ended 30 June 2018
 INTERIM REPORT AND FINANCIAL STATEMENTS For the six months ended 2018 Stock code: FEVR FINANCIAL HIGHLIGHTS REVENUE ( M) ADJUSTED EBITDA 1 ( M) CONTENTS H1 2018 : 104.2m H1 : 71.9m H1 2016 : 40.6m H1 2015
DISTIL BEVERAGES. A breakthrough year. ..delivering maiden profit on owned brands. 7 June 2017 DIS.L
 DISTIL BEVERAGES DIS.L 3.45p Market Cap: 17.2m SHARE PRICE (p) 4 3.5 3 2.5 2 1.5 1 Jun-16 Sep-16 Dec-16 Mar-17 Jun-17 12m high/low Source: LSE Data KEY INFORMATION Enterprise value Index/market 16.2m 1.0p/3.7p
EQUITY NOTE PERFORMANCE OVERVIEW 100,000 90,000 80,000 70,000 60,000. Euro ('000) 50,000 40,000 30,000 20,000 10,000 MARKET TRENDS AND DEVELOPMENTS
 50,000 40,000 30,000 20,000 10,000 MARKET TRENDS AND DEVELOPMENTS") EQUITY NOTE 3 August 2018 COMPANY DATA Sector Ticker ISIN Food and Beverage SFC MV MT0000070103 Last Price ( ) 7.50 Market Cap. ( 000) Net Dividend Yield Price/Earnings Ratio 225,000 1.60% 16x Free-Float
EQUITY NOTE 3 August 2018 COMPANY DATA Sector Ticker ISIN Food and Beverage SFC MV MT0000070103 Last Price ( ) 7.50 Market Cap. ( 000) Net Dividend Yield Price/Earnings Ratio 225,000 1.60% 16x Free-Float
SABMiller plc. Interim results Half year ended 30 September November 2005 also available on website
 SABMiller plc Interim results Half year ended 30 September 2005 10 November 2005 also available on website www.sabmiller.com Forward-looking statements This presentation includes forward-looking statements.
GROWTH A STRONG COMMITMENT
 GROWTH A STRONG COMMITMENT INDEX 1. THE GROUP TODAY INDEX 2. STRATEGY OVERVIEW 3. OUTLOOK 2.1. Strategic Pillars 2.2. Strategic Paths 2 1. THE GROUP TODAY 3 1. THE GROUP TODAY PORTUGAL POLAND Supermarkets
Thai Beverage PLC. 1H18 Financial Results. (First Half Ended 31 March 2018) 1H18 (First Half Ended 31 March 2018) Thai Beverage PLC
 1H18 (First Half Ended 31 March 2018) Thai Beverage PLC") Thai Beverage PLC 1H18 Financial Results (First Half Ended 31 March 2018) 1H18 (First Half Ended 31 March 2018) Thai Beverage PLC 1 Note on Forward Looking Statements The following presentation may contain
Thai Beverage PLC 1H18 Financial Results (First Half Ended 31 March 2018) 1H18 (First Half Ended 31 March 2018) Thai Beverage PLC 1 Note on Forward Looking Statements The following presentation may contain
Carlsberg A/S. Interim results H1 2015
 Carlsberg A/S Interim results H1 2015 Agenda Group highlights Financial results & outlook Operational performance Appendix H1 Group highlights Strong market share improvement in the majority of markets
SKYCITY Entertainment Group Limited. FY16 Full-Year Result Presentation 10 August SKYCITY Entertainment Group Limited
 SKYCITY Entertainment Group Limited FY16 Full-Year Result Presentation 10 August 2016 SKYCITY Entertainment Group Limited Disclaimer All information included in this presentation is provided as at 10 August
JD WETHERSPOON PLC. Interim Results March 2012
 JD WETHERSPOON PLC Interim Results 2012 9 March 2012 Kirk Davis FD Highlights Six Months to 22 January 2012 Revenue 569.4m (2011: 525.4m) +8.4% Like-for-like sales +2.1% Free cash flow per share 27.5p
Foxtons Interim results presentation For the period ended 30 June 2018
 Foxtons Interim results presentation For the period ended 30 June 2018 Important information This presentation includes statements that are, or may be deemed to be, forward-looking statements. These forward-looking
Dine Brands Global, Inc. Investor Presentation March 2019
 Dine Brands Global, Inc. Investor Presentation March 2019 Disclosures Forward-Looking Information: The content contained in this presentation is as of March 5, 2019. The Company assumes no obligation to