Agenda. FY2018 highlights Evolution of key drivers Summary and outlook. Financial performance Property update
|
|
|
- Meagan Paul
- 5 years ago
- Views:
Transcription
1

2


3 Agenda FY2018 highlights Evolution of key drivers Summary and outlook Financial performance Property update 1
4
5 Continued delivery of our growth strategy in fy2018 High quality profitable estate Affordable customer led proposition Effective use of technology enhancing the customer offer Changing perceptions and growing the market Attractive financial model Record revenues and profits Two new centres and nine refurbishments Customer service scores improving across all key measures Special dividend for second year running 2
6

7 Key achievements and milestones Final 4 Bowlplex centres rebranded to Hollywood Bowl 2 AMF centres rebranded to Hollywood Bowl 3 centre refurbishments Hollywood Diner now in all 58 centres Pins on Strings now in 7 centres V2 in production Play for prizes now in 47 centres Revenue from online bookings up 27% VIP lanes in 47 centres Customer service scores improving across all key measures 3
8
9 FY2018 highlights Record revenue and profits All revenue lines in LFL growth Total revenue growth driven through core estate, investments and new centre openings TOTAL REVENUE +5.8% ( 120.5M) LFL SALES GROWTH +1.8% 2 new centres opened with 8 exchanged for openings before the end of FY2022 Over 13 million games bowled with increased total spend per game up from 8.70 to 9.22 GROUP ADJUSTED EBITDA +8.3% ( 36.2M) PROFIT BEFORE TAX +13.4% ( 23.9M) Team member development programme: 103 completed training programmes, 10 promoted to centre manager Free cash flow of 18.3m Earnings per share pence FINAL ORDINARY DIVIDEND 4.23P (+7.1%) SPECIAL DIVIDEND 4.33P (+30.0%) Total cash returned to shareholders since IPO: 29.8m Hollywood Bowl Group plc Investor Presentation FY2018 4
10
11 Financial highlights Revenue ( m): +5.8% Group Adjusted EBITDA ( m): +8.3% FY2015 FY2016 FY2017 FY2018 FY2015 FY2016 FY2017 FY2018 Operating Profit Margin %: +1.2%pts Earnings Per Share (pence): +2.9% 19.5% 20.6% * 15.4% 13.7% 5.27* FY2015 FY2016 FY2017 FY2018 FY2015 FY2016 FY2017 FY2018 Hollywood Bowl Group plc * Adjusted for pre IPO financing and IPO related costs Investor Presentation FY2018 5
12
13 EBITDA growth +8.3% LFL revenue growth of 1.8% Part year effect of new centres pre LFL Continued EBITDA growth from invested centres Effective cost control throughout the year Hollywood Bowl Group plc Investor Presentation FY2018 6
14
15 Income statement ( m) FY2018 FY2017 Movement Revenue % Gross profit % Gross profit% 86.1% 86.5% -0.4%pts Administrative expenses / other income (78.9) (76.4) Operating profit % Operating profit margin % 20.6% 19.5% +1.2%pts Depreciation Amortisation Fixed asset disposal Exceptional items Adjusted EBITDA % Adjusted EBITDA margin % 30.0% 29.3% +0.4%pts Finance expenses (1.0) (1.1) Movement financial instruments 0.1 Profit before tax % Tax expense (5.1) (2.8) Profit after tax % Statutory EPS (pence) % LFL revenue up 1.8% Gross profit % in line with management expectations Operating profit up 12.1% and margin at 20.6% Adjusted EBITDA up 8.3% due to strong revenue growth and effective cost controls Record profit before tax of 23.9m Statutory EPS up 2.9% Profit after tax excluding ATCA % Hollywood Bowl Group plc Investor Presentation FY2018 7
16
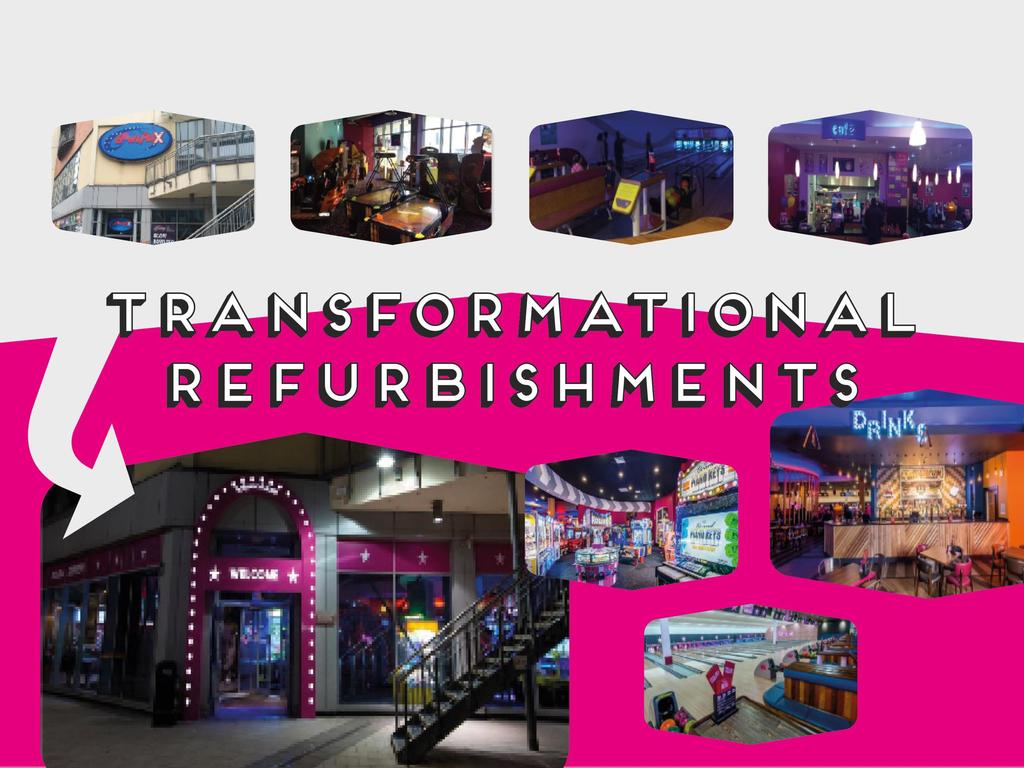
17 Strong cash generation Group adjusted operating cash flow of 24.7m (FY2017: 26.7m) Expansionary capex includes 9 refurbishments / rebrands and net capex of 2 new centres Proposed final dividend of 4.23p per share plus a special dividend of 4.33p per share Total proposed cash return to shareholders of 15.9m in relation to FY2018 (10.59p per share) Hollywood Bowl Group plc Investor Presentation FY2018 8
18

19 Financial outlook 7 10 refurbishments / rebrands to be completed in FY new centres Watford pre Christmas and Lakeside in H2 FY2019 Total expansionary capital expenditure expected to be 5.5m - 6.3m Maintenance capital expenditure expected to be 6.0m - 6.5m Expect to advance rollout of scoring technology in FY2019 at a cost of 2.0m Effective tax rate expected to be 20.4% in FY2019 IFRS 16 adoption will be implemented in FY2020 Hollywood Bowl Group plc Investor Presentation FY2018 9
20
21 Growth strategy Organic growth Investment led growth Constant focus on customer experience Increasing dwell time through customerfocused culture and innovation Increasing spend Improved F&B and amusement offering Leveraging technology to unlock growth Increasing ecommerce sales and yield performance Broadening the appeal to new customers Maximising engagement through targeted marketing Maintaining a high quality, profitable estate Rolling refurbishment programme of 7-10 centres per year Development of new centres and acquisitions Target of 2 new centres per year on average on retail / leisure parks - with landlord contributions Growing market share through customer engagement Refocusing the proposition towards family leisure, improving ancillary product offerings Strategic profit enhancing acquisitions Opportunities that suit the Group s locations and demographic criteria Hollywood Bowl Group plc Investor Presentation FY
22
23 Operational innovation Pins on strings Now in 7 centres Games Per Stop (GPS) 1443 Trial of both Qubica and Brunswick machines V2 of the Qubica machine now in production, will be rolled out to four centres during FY2019 Will be implemented in centres where machines are end of life and new centre openings PINS ON STRINGS ROI 30% Group (FY2017) Group (FY2018) POS* (FY2018) Group scoring Single, stable technical platform for our core product Deliver consistent, high quality customer experience UX and GPS Increased customer engagement through CRM programme Rolling out to the estate over next 2 years SCORING OPEN RATES OVER 80% Hollywood Bowl Group plc Investor Presentation FY
24


25 Operational innovation Food and drink Hollywood Diner rolled out across the estate Cost inflation largely mitigated FOOD SPG +5.4% Drinks menu refreshed and rolled out Duty increases offset protecting margin BAR SPG +7.0% Amusements i-serve lane ordering system rolled out across the estate Amusement enhancements driving continued growth Enhanced commercial terms improving margin AMUSEMENT SPG +8.3% Play for prizes in 47 centres Hollywood Bowl Group plc Investor Presentation FY
26

27 Technology initiatives Digital 1.7m contacts post GDPR Driving up to 20% of revenue in challenging trading conditions Online Revenue % Mix 34% New automated campaigns and customer segmentation ONLINE REVENUE +27% 23% 24% 29% Single central social accounts 20% increase in followers YOY FY2015 FY2016 FY2017 FY2018 Dynamic pricing Digital performance advertising revenues up 37% Price elasticity based on booking lead time and capacity Value drivers now on dynamic pricing model with no negative customer feedback V3 in production, to include larger differential on super peak and off peak time slots MOBILE REVENUE +37% BOWLING SPG +5.3% Hollywood Bowl Group plc Investor Presentation FY


28
29 ROI Capital Spend Investment led growth Refurbishments Rebrands Return on investment of 44.8% LFL revenues continue to outperform at 7.1% up vs non invested estate Game volumes up 1.5% vs non invested estate 6 refurbishments planned in FY2019 Return on investment of 54.9% LFL revenues continue to outperform at 14.9% up vs non invested estate Game volumes up 6.5% vs non invested estate Estate comprises of 50 HWB and 8 AMF centres Plans to rebrand 2 AMF centres in FY % 80% ROI Capital Spend , ,000 70% 60% 500,000 50% 40% 30% 20% 10% 400, , , ,000 0% Hollywood Bowl Group plc Investor Presentation FY
30
31 Investment led growth Hollywood Bowl refurbishment - Cribbs Causeway AMF Bowling rebrand - Peterborough Return on investment of 84.6% on 300k capital All areas of the centre upgraded including Hollywood Diner and bar LFL revenues up 17.9% post investment Game volumes up 15.9% vs non invested estate Rebranded and refurbished to Hollywood Bowl Return on investment of 58.9% on 310k capital Enlarged amusement area as well as combined bar and Hollywood Diner LFL revenues up 14.6% post investment Hollywood Bowl Group plc Investor Presentation FY
32
33 Our people a key enabler for growth Training and development Reward and recognition Over 260k invested in developing our team 86 graduated assistant manager training programme 17 graduated centre manager training programme Senior leadership development programme launched to nurture next generation of senior leaders Sector leading centre manager incentive scheme enhanced Centre managers and assistant managers LTIP scheme Centre manager conference Awards for top performers and USA trip for winners Second SAYE launching in January Hollywood Bowl Group plc Investor Presentation FY

34

35 New centre - Dagenham Secured from landlord having traded as Namco Destination leisure park NET CAPEX 391k Opened October 2017 Play for prizes introduced Trading well and in line with expectations since opening On track to pay back in under 15 months SQ.FT 31k LANES 20 Hollywood Bowl Group plc Investor Presentation FY

36

37 New centre - Yeovil Secured from landlord having traded as one of the few profitable MFA centres NET CAPEX 630k Destination leisure park Opened March 2018 Pins on strings installed Play for prizes introduced Trading well and in line with expectations since opening On track to pay back in under 18 months SQ.FT 23k LANES 18 Hollywood Bowl Group plc Investor Presentation FY
38
39 Strong new centre pipeline Watford FY2019 Key anchor in the new intu extension Alongside Cineworld and Debenhams Intu extension is 400,000 sq. ft., 180m spend Top 20 UK retail destinations 20,000 sq. ft. / 14 lanes Capex requirement 1.7m Lakeside FY2019 Largest bowling centre to open in UK or over 10 years Major anchor of new leisure extension Alongside Nickelodeon indoor theme park 34,000 sq. ft. / 24 lanes Capex requirement 2.2m Liverpool FY2021 Relocation of existing centre to a newly developed leisure/retail park Co-located with large cinema, restaurants and retail units 23,000 sq. ft. / 24 lanes Capex requirement 2.3m Nottingham FY m refurbishment of Broadmarsh 13m annual footfall Rise to 6th highest retail destination in the UK Alongside new cinema 19,500 sq. ft. / 16 lanes Capex requirement 1.7m Southend FY2021/22 New out of town leisure complex Empire cinema (11 screens), restaurants and hotel Strong catchment 22,000 sq. ft. / 20 lanes Capex requirement 1.8m Swindon FY2022 Large out of town leisure/ retail centre Trading with cinema, indoor ski, restaurants and retail Large catchment area with excellent road links 21,000 sq. ft. / 19 lanes Capex requirement 1.9m TARGET AN AVERAGE OF TWO NEW CENTRES PER YEAR Hollywood Bowl Group plc Investor Presentation FY
40

41 Growth in line with medium term strategy York FY2020 New bowling centre secured for FY2020 in a first class location Co-located with cinema in a leisure extension to a retail scheme 28,000 sq.ft. ground floor unit Significant capital contribution and 12 months rent free GROUND FLOOR 24 LANES Also leasing the 18,000 sq.ft. first floor unit for our new indoor leisure concept 3 separate interactive nine hole putting courses We will leverage our customer led operating model, sector leading CRM and wider support infrastructure A product that appeals to the same customer base as bowling An opportunity to occupy a footprint unsuitable for a bowling centre FIRST FLOOR 3X 9 HOLES OVERALL GROSS CAPEX 4.2M Hollywood Bowl Group plc Investor Presentation FY

42

43 Outlook Group continues to perform in line with the Board s expectations for the current year Refurbishment programme driving strong returns and excellent customer feedback Market leader with high quality, well invested estate led by experienced management team Customer focused business leading the revitalisation of the sector Significant market opportunity for future expansion and organic growth Ongoing investment and innovation in the customer proposition and technology enablers Strong new centre pipeline backed by disciplined site selection process Consistent financial performance and returns driven by ongoing capital investment programme Hollywood Bowl Group plc Investor Presentation FY
44


45 Management Stephen Burns - Chief Executive Officer Laurence Keen - Chief Financial Officer Appointment: Stephen joined the Group as Business Development Director in He was promoted to Managing Director in 2012 and became Chief Executive Officer in Skills and experience: Before joining the Group, Stephen worked within the health and fitness industry, holding various roles within Cannons Health and Fitness Limited from He became sales and client retention director in 2007 upon the acquisition of Cannons Health and Fitness Limited by Nuffield Health, and became regional director in In 2011, Stephen was appointed to the operating board of MWB Business Exchange, a public company specialising in serviced offices, meeting and conference rooms, and virtual offices. Top bowling score: 179 Appointment: Laurence joined the Group as Finance Director in Skills and experience: Laurence has a first-class degree in business, mathematics and statistics from the London School of Economics and Political Science. He qualified as a chartered accountant in 2000 and has been an ICAEW Fellow since Previously, Laurence was UK development director for Paddy Power from He has held senior retail and finance roles for Debenhams PLC, Pizza Hut (UK) Limited and Tesco PLC. Top bowling score: 180 Hollywood Bowl Group plc Investor Presentation FY2018
46 Balance sheet ( m) FY2018 FY2017 Non current assets Cash at bank Other current assets Creditors and provisions (30.1) (29.0) Gross debt (28.5) (30.0) Net assets Hollywood Bowl Group plc Investor Presentation FY2018

47
Interim Results for the Six Months Ended 31 March 2018 STRONG REVENUE AND PROFIT GROWTH DELIVERED THROUGH SUCCESSFUL EXECUTION OF STRATEGY
 Half-year Results Released : 23.05.2018 RNS Number : 7801O Hollywood Bowl Group plc 23 May 2018 23 May 2018 Hollywood Bowl Group plc Interim Results for the Six Months Ended 2018 STRONG REVENUE AND PROFIT
STRONG REVENUE AND PROFIT GROWTH DELIVERED THROUGH SUCCESSFUL EXECUTION OF STRATEGY
 11 December Hollywood Bowl Group plc STRONG REVENUE AND PROFIT GROWTH DELIVERED THROUGH SUCCESSFUL EXECUTION OF STRATEGY Hollywood Bowl Group plc ( Hollywood Bowl ), the UK s largest ten-pin bowling operator,
STRONG REVENUE AND PROFIT GROWTH DELIVERED THROUGH SUCCESSFUL EXECUTION OF STRATEGY
 24 May 2017 Hollywood Bowl Group plc STRONG REVENUE AND PROFIT GROWTH DELIVERED THROUGH SUCCESSFUL EXECUTION OF STRATEGY Hollywood Bowl Group plc ( Hollywood Bowl or the Group ), the UK s market leading
Ten Entertainment Group plc Interim Results Presentation 26 weeks to 2 July September 2017
 Ten Entertainment Group plc Interim Results Presentation 26 weeks to 2 July 2017 13 September 2017 Disclaimer The following presentation in relation to Ten Entertainment Group plc and its subsidiaries
Financial Results Presentation. For the period ended 28 June 2017
 Financial Results Presentation For the period ended 28 June 2017 Release: 22 August 2017 Disclaimer You must read the following before continuing This presentation has been prepared by Thame and London
Foxtons Interim results presentation For the period ended 30 June 2018
 Foxtons Interim results presentation For the period ended 30 June 2018 Important information This presentation includes statements that are, or may be deemed to be, forward-looking statements. These forward-looking
Building a better AA Putting Service, Innovation and Data at the heart of the AA
 LEI: 213800DTPE4O5OI17349 This announcement contains inside information Building a better AA Putting Service, Innovation and Data at the heart of the AA The AA is today presenting our new business strategy
Roger Carr. Chairman. March
 Roger Carr Chairman March 2003 1 Agenda Introduction Roger Carr (Chairman) Financial Results Karim Naffah (FD) Actions and Priorities Tim Clarke (CEO) Q&A 2 Business Highlights Independent future with
Interim results 6 months ended 31 July September 2018
 Interim results 6 months ended 31 July 2018 25 September 2018 1 Forward-looking statements This presentation contains certain forward-looking statements with respect to the financial condition, results
Interim results. 30 March 2017
 Interim results 30 March 2017 Highlights Ian Filby Continued Financial Growth and Strong Operational Progress H1 FINANCIALS 493.7m +7.0% 16.7m +3.1% 20m 9.5p per share Gross sales Profit before tax Special
Ardent Leisure Group Morgans QLD Conference October 2014
 Ardent Leisure Group Morgans QLD Conference 2014 9 October 2014 Contents Ardent Leisure Group FY14 Financial Summary, Commentary & Highlights Main Event Entertainment Health Clubs Bowling Theme Parks Marinas
intu properties plc Economic impact report 2017 Contributing
 intu properties plc Economic impact report 2017 Contributing 2 intu properties plc Economic impact report 2017 Contributing 3 Creating value for our communities Our centres are great places for customers
Forward-looking statements
 Forward-looking statements This presentation contains certain forward-looking statements with respect to the financial condition, results of operations, and businesses of Card Factory plc. These statements
Full Year 2016 and Q4 Financial Results. For the year ended 31 December 2016
 Full Year 2016 and Q4 Financial Results For the year ended 31 December 2016 Release: 28 February 2017 Disclaimer You must read the following before continuing This presentation has been prepared by Thame
Foxtons Preliminary results presentation For the year ended December 2018
 Foxtons Preliminary results presentation For the year ended December 2018 Important information This presentation includes statements that are, or may be deemed to be, forward-looking statements. These
Preliminary Results 2012
 Preliminary Results 2012 Highlights Resilient performance with growth in all segments Strategy appropriate for continuing economic uncertainty High quality pubs underlined by estate valuation New-build
nemo2014\presentations\analyst Presentation Jan14\ Nemo Analyst Presentation Master-22nd Jan FINAL.pptx
 Interim Results FY17 24 th November 2016 Forward looking statements Forward-Looking Statements INCLUDED IN THIS PRESENTATION ARE FORWARD-LOOKING MANAGEMENT COMMENTS AND OTHER STATEMENTS THAT REFLECT MANAGEMENT
The Gym Group plc FULL YEAR RESULTS MARCH 2018
 The Gym Group plc FULL YEAR RESULTS MARCH 2018 Forward-Looking Statement Disclaimer This presentation and information communicated verbally to you may contain certain projections and other forward-looking
2017 Quarter 1 Financial Results. For the quarter ended 29 March 2017
 2017 Quarter 1 Financial Results For the quarter ended 29 March 2017 Release: 25 May 2017 Disclaimer You must read the following before continuing This presentation has been prepared by Thame and London
Financial Results Presentation. For the 39 weeks ended 26 September 2018
 Financial Results Presentation For the 39 weeks ended 26 September 2018 Release: 20 November 2018 Disclaimer You must read the following before continuing This presentation has been prepared by Thame and
Interim Results For 6 months ended 31 Dec February 2018
 Interim Results For 6 months ended 31 Dec 2017 February 2018 Financial highlights 62.5m 55.7m 71.7m 13.7m 10.8m 15.8m 8.8m 11.2m 12.9m 16 17 18 16 17 18 16 17 18 REVENUE 71.7m (H1 FY17: 62.5m) +14.7% YEAR-ON-YEAR
Foxtons Interim results presentation For the period ended June 2017
 Foxtons Interim results presentation For the period ended June 2017 Important information This presentation includes statements that are, or may be deemed to be, forward-looking statements. These forward-looking
Carpetright plc. Preliminary Results 25 June 2013
 Carpetright plc Preliminary Results 25 June 2013 1 Agenda Introduction Lord Harris Financial Review Neil Page Group Overview Darren Shapland Questions & Answers 3 Neil Page Group Finance Director 4 Group
The Gym Group plc INTERIM RESULTS AUGUST 2018
 The Gym Group plc INTERIM RESULTS AUGUST 2018 Forward-Looking Statement Disclaimer This presentation and information communicated verbally to you may contain certain projections and other forward-looking
31 March 2018 Audited Preliminary Results. 6 June 2018
 31 March 2018 Audited Preliminary Results 6 June 2018 1 Presentation Team Euan Fraser Chief Executive Officer Stuart McNulty UK Chief Executive Officer John Paton Chief Financial Officer Has led Alpha
Full Year Results 2016
 Full Year Results 2016 1 Financial Review 2016 Tim Jones Finance Director 2 Income statement (Pre adjusted items) FY 2016 m FY 2015 m Revenue 2,086 2,101 (0.7%) Operating costs (1,768) (1,773) Operating
Halfords Group plc. J.P. Morgan London Small/Mid Cap Conference 2017
 Halfords Group plc J.P. Morgan London Small/Mid Cap Conference 2017 Highlights Introduction to Halfords and key markets Page 3 Moving Up A Gear strategy Page 12 Financial Guidance Page 25 FY17 Financial
EXPERIENCING ENTERTAINMENT THE RANK GROUP PLC INTERIM RESULTS FOR THE SIX MONTHS ENDED 31 DECEMBER 2014
 EXPERIENCING ENTERTAINMENT THE RANK GROUP PLC INTERIM RESULTS FOR THE SIX MONTHS ENDED 31 DECEMBER 2014 Clive Jennings finance director 2 FINANCIAL HEADLINES H1 2014/15 H1 2013/14 Gross revenue (1) Operating
Interim Results 26 weeks ended 29 December 2018
 Contents 2 Headlines H1 Review H2 Outlook CEO Review Summary Headlines 3 Financial Performance Trading Overview Strategy Like for Like sales down -4% Five new openings in H1 FY19 are performing well Sixth
FY17 Preliminary results September 2017
 FY17 Preliminary results September 2017 Financial highlights 91.1m 81.1m 105.2m 12.4m 16.3m 11.2m 7.8m 5.6m 15 16 17 15 16 17 2.0m 15 16 17 REVENUE 105.2m (2016: 91.1m) +12% YEAR-ON-YEAR 1 UNDERLYING EBITDA
Preliminary Results 2014
 Preliminary Results 2014 Ralph Findlay Chief Executive Officer Andrew Andrea Chief Financial Officer 1 Ralph Findlay Chief Executive Officer Highlights 1. Solid Trading Performance Core PBT growth of 12%
Financial results & business update. Quarter and year ended 31 December February 2016
 Financial results & business update Quarter and year ended 31 December 2015 11 February 2016 Disclaimer 3 Any remarks that we may make about future expectations, plans and prospects for the company constitute
For personal use only. Ardent Leisure Group
 Ardent Leisure Group 2011 Half Year Results Contents Ardent Leisure Group HY11 commentary and financial summary Theme Parks Marinas Bowling Main Event Entertainment Health Clubs Group financial results
FULL YEAR RESULTS PRESENTATION
 ASX Announcement 26 August 2016 FULL YEAR RESULTS PRESENTATION Attached is the presentation regarding the financial results of The Star Entertainment Group Limited (The Star Entertainment Group) for the
Interim Results 2014
 Interim Results 2014 Ralph Findlay Chief Executive Officer Highlights 1. Good trading performance, in line with our expectations Growth in core profits in each trading segment Earnings per share up 10.8%
Interim Results Ralph Findlay, Chief Executive Officer Andrew Andrea, Chief Financial and Corporate Development Officer
 Interim Results 2018 Ralph Findlay, Chief Executive Officer Andrew Andrea, Chief Financial and Corporate Development Officer Ralph Findlay Chief Executive Officer The Leeds Club Marston s PLC Interim Results
STRONG GROWTH IN REVENUE, PROFIT AND DIVIDEND NEW GROWTH MILESTONES FOR Whitbread PLC results for the financial year to 26 February 2015
 28 April 2015 STRONG GROWTH IN REVENUE, PROFIT AND DIVIDEND NEW GROWTH MILESTONES FOR 2020 Whitbread PLC results for the financial year to 26 February 2015 Financial Highlights 2014/15 2013/14 Change Total
Domino s Pizza UK & IRL plc. Interim Results for the 26 weeks ended 28 June 2009
 Domino s Pizza UK & IRL plc Interim Results for the 26 weeks ended 28 June 2009 m System sales momentum 210 System sales have doubled since 2005 196.4 190 170.2 170 150 130 110 97.1 114.8 142.5 +24.1%
For personal use only. FY16 Results Presentation
 FY16 Results Presentation PAGE 1 Agenda 1. Highlights 2. FY16 Results Trading performance Balance sheet and cash flow Capital management 3. Business Update Our objectives The JB HI-FI model Store portfolio
Q3 Financial Results. For the period ended 28 September 2016
 Q3 Financial Results For the period ended 28 September 2016 Release: 22 November 2016 Disclaimer You must read the following before continuing This presentation has been prepared by Thame and London Limited,
Interim Results 2010
 Interim Results 2010 David Thompson Chairman Highlights 1. H1 performance in line with targets Revenue growth, margins broadly level 2. Good progress in strategy development New-build programme on track
Investor Presentation
 Investor Presentation Results for the year ended 31 December 2017 26 April 2018 Disclaimer Forward-looking statements This presentation may include forward-looking statements. All statements other than
H1 16 interim results. 22 September 2015
 H1 16 interim results 22 September 2015 Important notice 2 This presentation may include certain forward-looking statements, beliefs or opinions, including statements with respect to the Company s business,
Revolution Bars Group plc (LSE: RBG) Interim results for the six months ended 31 December 2016
 Interim results for the six months ended 31 December 2016") 28 February 2017 Revolution Bars Group plc (LSE: RBG) Interim results for the six months ended 31 2016 Revolution Bars Group plc ( the Group ), a leading UK operator of premium bars, trading under the
28 February 2017 Revolution Bars Group plc (LSE: RBG) Interim results for the six months ended 31 2016 Revolution Bars Group plc ( the Group ), a leading UK operator of premium bars, trading under the
The Gym Group plc FULL YEAR RESULTS MARCH 2017
 The Gym Group plc FULL YEAR RESULTS MARCH 2017 Forward-Looking Statement Disclaimer This presentation and information communicated verbally to you may contain certain projections and other forward-looking
Fuller, Smith and Turner PLC Preliminary Results for the 52 weeks ended 29 March 2008
 Fuller, Smith and Turner PLC Preliminary Results for the 52 weeks ended 29 March 2008 Agenda Strategy Corporate Progress Key Financials Fuller s Inns The Fuller s Beer Company Prospects Consistent Strategy
SKYCITY Entertainment Group Limited. FY16 Full-Year Result Presentation 10 August SKYCITY Entertainment Group Limited
 SKYCITY Entertainment Group Limited FY16 Full-Year Result Presentation 10 August 2016 SKYCITY Entertainment Group Limited Disclaimer All information included in this presentation is provided as at 10 August
Kathmandu FY12 Results Presentation
 Kathmandu FY12 Results Presentation Contents Results Overview Key Line Items Country Results Cash Flow, Balance Sheet, Dividend Growth Strategy Update FY13 Outlook Questions 2 Results Overview Results
Preliminary Results 2014/ March 2015
 Preliminary Results 2014/15 19 March 2015 Agenda Highlights Financial & business review Laurence Bain Mark Whiteling Strategy update & outlook Q&A Laurence Bain All 2 Transforming Premier Farnell 1. Strategic
FULLER, SMITH & TURNER PLC ANNUAL RESULTS FOR THE 52 WEEKS ENDED 26 MARCH 2016
 FULLER, SMITH & TURNER PLC ANNUAL RESULTS FOR THE 52 WEEKS ENDED 26 MARCH 2016 AGENDA HIGHLIGHTS MICHAEL TURNER FINANCIAL REVIEW JAMES DOUGLAS STRATEGY & OPERATIONS REVIEW SIMON EMENY SUMMARY & OUTLOOK
Roger Carr. Chairman. 19 May 2004
 Roger Carr Chairman 19 May 2004 Karim Naffah Finance Director 19 May 2004 Financial Highlights Turnover 823m up 4% EBITDA 197m up 3% Operating profit 140m up 2% Profit before tax 88m down 5% Adjusted EPS*
For personal use only
 Ardent Leisure Group 2012 Half Year Results Contents Ardent Leisure Group HY12 financial summary and commentary Main Event Entertainment Health Clubs Marinas Bowling Theme Parks Group financial results
Preliminary Results 52 weeks to 3 February March Sir Ken Morrison CBE Chairman. Bristol - Harcliffe
 Preliminary Results 52 weeks to 3 February 2008 13 March 2008 1 Sir Ken Morrison CBE Chairman Bristol - Harcliffe Agenda 2 Introduction Sir Ken Morrison Financial review & balance sheet Richard Pennycook
Shaver Shop Group Limited 1H FY18 RESULTS INVESTOR PRESENTATION. 23 February 2018
 Shaver Shop Group Limited 1H FY18 RESULTS INVESTOR PRESENTATION 23 February 2018 1 TABLE OF CONTENTS 01 Key business highlights 02 Financial results 03 Key growth drivers 04 Trading update& outlook 05
Half year results 30 September 2017
 Half year results 30 September November Russell Down, Chief Executive Chris Morgan, Group Finance Director Strong first half performance Revenue (excluding disposals) 183.2m 6.9% HY17: 171.4m EBITDA* 33.8m
WH Smith PLC Interim Results April 2018
 Disclaimer This document contains forward-looking statements with respect to the operations, performance and financial condition of WH Smith PLC. By their nature, these statements are subject to risks,
Interim Results. 19 July 2018
 Interim Results 19 July 2018 Mark Lewis Chief Executive Officer Trading in line with expectations, good progress on strategy Trading in line with expectations Helped households save 1.1bn Continued strong
FY 2016 RESULTS PRESENTATION
 MARKET TECH HOLDINGS LIMITED FY 2016 RESULTS PRESENTATION June 2016 INTRODUCTION FY 2016 Financial Review Property Portfolio Asset Management Coworking Digital Assets Looking Ahead Appendix 16 ACRES OF
RESTAURANT BRANDS DELIVERS RECORD PROFIT
 RESTAURANT BRANDS NEW ZEALAND LIMITED 17 April 2018 NZX/ASX RESTAURANT BRANDS DELIVERS RECORD PROFIT $NZm 2018 2017 Change ($) Change (%) Total Group Sales 740.8 497.2 +243.6 +49.0 Group NPAT (reported)
FY18 Preliminary results. September 2018
 FY18 Preliminary results September 2018 Financial Highlights 116.3m 105.2m 16.3m 18.9m 11.2m 12.7m 91.1m 12.4m 5.6m 81.1m 7.8m 4.1m REVENUE 116.3m (2017: 105.2m) +11% YEAR-ON-YEAR UNDERLYING EBITDA 1 18.9m
2017 Half Year Results Presentation 10 August 2017
 2017 Half Year Results Presentation 10 August 2017 Lawrence Hutchings Chief Executive 2 C&R a robust platform for growth Strong asset base and secure income Assets with dominant town-centre locations Focus
Good customer and profit growth with step change in US expansion
 HomeServe plc Preliminary results for the year ended 31 March 2016 Good customer and profit growth with step change in US expansion 2016 2015 Change Revenue 633.2m 584.2m +8% Adjusted EBITDA 122.7m 109.4m
DOUBLE DIGIT REVENUE, UNDERLYING PROFIT AND DIVIDEND GROWTH. Whitbread PLC results for the six months to 27 August 2015 H1 2015/16
 20 October 2015 Financial Highlights DOUBLE DIGIT REVENUE, UNDERLYING PROFIT AND DIVIDEND GROWTH Whitbread PLC results for the six months to 27 August 2015 H1 2015/16 H1 2014/15 Change Total revenue ()
Annual General Meeting
 Annual General Meeting 18 July 2017 www.britishland.com @BritishLandPLC A successful year John Gildersleeve Chairman 2017 Highlights Underlying profits up 7% to 390m (+ 27m) Total sales of 1.5bn 9% ahead
SECURE TRUST BANK PLC 2018 INTERIM RESULTS
 SECURE TRUST BANK PLC 2018 INTERIM RESULTS 8 AUGUST 2018 SECTION 1 INTRODUCTION & BUSINESS REVIEW PAUL LYNAM CHIEF EXECUTIVE OFFICER H1 2018 HIGHLIGHTS Benefits of strategic repositioning quality driving
YEAR END RESULTS 31 MARCH Russell Down, Chief Executive Chris Morgan, Group Finance Director
 YEAR END RESULTS 31 MARCH 2018 Russell Down, Chief Executive Chris Morgan, Group Finance Director Customer service strategy improving performance Revenue (excluding disposals) 371.6m 6.4% FY17: 349.1m
Becoming the best pet care business in the world. Strategic update and interim financial results FY19
 Becoming the best pet care business in the world Strategic update and interim financial results FY19 Interim Results FY19 2 Today s presentation Group strategic update and vet business review Financial
ANNOUNCEMENT OF HALF-YEAR RESULTS
 ANNOUNCEMENT OF HALF-YEAR RESULTS HALF YEAR ENDED 30 SEPTEMBER 2013 14 NOVEMBER 2013 Agenda Overview and current trading Ian Mason Financial performance Simon Boddie Business and strategy update Ian Mason
2015 Half Year Results Presentation 25 November 2014
 05 Half Year Results Presentation 5 November 04 Disclaimer This presentation includes statements that are, or may be deemed to be, forward-looking statements. These forward-looking statements can be identified
Annual Results 52 weeks ended 30 June 2018
 Contents 2 Headlines CEO Review FY18 Review FY19 Outlook Summary Headlines 3 First half finished strongly due to Christmas trading 18 consecutive quarters of like-for-like sales growth came to an end in
HALF YEAR RESULTS PRESENTATION
 ASX Announcement 16 February 2016 HALF YEAR RESULTS PRESENTATION Attached is the presentation regarding the financial results of The Star Entertainment Group Limited (The Star Entertainment Group) for
2017/18 Half Year Results De La Rue plc 21 November 2017
 2017/18 Half Year Results De La Rue plc 21 November 2017 Page 1 Agenda Overview Martin Sutherland Financial performance Jitesh Sodha Strategic update Martin Sutherland Operational review Martin Sutherland
SKYCITY Entertainment Group Limited. SKYCITY Entertainment Group Limited. 1H19 Result Investor Presentation. 13 February 2019
 SKYCITY Entertainment Group Limited 1H19 Result Investor Presentation SKYCITY Entertainment Group Limited 13 February 2019 Important Information Average NZ$ vs. A$ cross-rate for 1H19 = 0.9291 and 1H18
GREGGS TO RESHAPE BUSINESS FOR FUTURE GROWTH
 6 August 2013 INTERIM RESULTS FOR THE 26 WEEKS ENDED 29 JUNE 2013 AND STRATEGY UPDATE Greggs is the leading bakery retailer in the UK, with close to 1,700 shops throughout the country GREGGS TO RESHAPE
Directors Report to Shareholders For the 28 Weeks ended 14 September 2015 (1H 2016)
") Directors Report to Shareholders For the 28 Weeks ended 14 September 2015 (1H 2016) Key Points Total Group Sales ($m) 210.0 185.7 +24.3 +13.1 Group Net Profit after Tax ($m) 13.4 11.5 +1.9 +16.7 Dividend
Directors Report to Shareholders For the 28 Weeks ended 14 September 2015 (1H 2016) Key Points Total Group Sales ($m) 210.0 185.7 +24.3 +13.1 Group Net Profit after Tax ($m) 13.4 11.5 +1.9 +16.7 Dividend
25 October Q Revenues. Gilles Petit, CEO Arnaud Louet, CFO
 Q3 2016 Revenues Gilles Petit, CEO Arnaud Louet, CFO Q3 2016 Revenues FORWARD LOOKING STATEMENTS This presentation contains certain statements that constitute "forward-looking statements", including but
TVL FINANCE PLC Q PERIOD ENDED 29 MARCH 2017 REPORT TO NOTEHOLDERS 261,000, % SENIOR SECURED NOTES DUE 2023
 TVL FINANCE PLC Q1 2017 PERIOD ENDED 29 MARCH 2017 REPORT TO NOTEHOLDERS 261,000,000 8.5% SENIOR SECURED NOTES DUE 2023 165,000,000 SENIOR SECURED FLOATING RATE NOTES DUE 2023 (the Notes ) CONTENTS Highlights
Interim Results FY18 28 th November 2017
 Interim Results FY18 28 th November 2017 Forward looking statements Forward-Looking Statements INCLUDED IN THIS PRESENTATION ARE FORWARD-LOOKING MANAGEMENT COMMENTS AND OTHER STATEMENTS THAT REFLECT MANAGEMENT
Travelodge. Goldman Sachs 2016 EMEA Leveraged Finance Conference
 Travelodge Goldman Sachs 2016 EMEA Leveraged Finance Conference Release: 27 September 2016 Disclaimer You must read the following before continuing This presentation has been prepared by Thame and London
JD WETHERSPOON PLC. Preliminary Results September 2009
 JD WETHERSPOON PLC Preliminary Results 2009 11 September 2009 Highlights Year to 26 July 2009 Revenue 955.1m (2008: 907.5m) +5.2% Like-for-like sales +1.2% Operating profit before exceptional items 97.0m
Interim Report Something for everyone
 Something for everyone Highlights is the UK s leading multi-retailer gift voucher and prepaid gift card business delivering innovative rewards and prepaid products to UK consumers and corporates. B Financial
FY16 YEAR END RESULTS 5 APRIL 2016
 FY16 YEAR END RESULTS 5 APRIL 2016 DEFINITIONS AND IMPORTANT NOTICE The following definitions apply throughout Trading EBITDA (earnings before interest, tax, depreciation and amortisation): excludes exceptional
2017 Full Year. Results Presentation. 21 February 2018
 2017 Full Year Results Presentation 21 February 2018 CAUTIONARY STATEMENT 2017 Full Year Results Slide 2 Full Year Highlights 2017 Full Year Results Presentation 8TH YEAR OF DOUBLE-DIGIT GROWTH 2017 FINANCIAL
The Food Travel Experts.
 The Food Travel Experts www.foodtravelexperts.com Presentation structure 1. Group highlights Kate Swann 2. Financial review Jonathan Davies 3. Business review Kate Swann 4. Q&A All 2 Group highlights Strong
Photo Montage on loop
 Photo Montage on loop Photo Montage on loop 3 Highlights Solid service-led sales performance Market share in Retail motoring and cycling grew overall Confident in long-term growth prospects for cycling
Northgate plc preliminary results for the year ended 30 April 2015 DRIVING PROFITABLE GROWTH
 DRIVING PROFITABLE GROWTH 1 Agenda Financial review Chris Muir Operational review - UK - Spain Bob Contreras Fernando Cogollos Outlook Bob Contreras 2 Financial review Chris Muir 3 Group financial summary
TVL FINANCE PLC FY 2017 PERIOD ENDED 28 JUNE 2017 REPORT TO NOTEHOLDERS 261,000, % SENIOR SECURED NOTES DUE 2023
 TVL FINANCE PLC FY 2017 PERIOD ENDED 28 JUNE 2017 REPORT TO NOTEHOLDERS 261,000,000 8.5% SENIOR SECURED NOTES DUE 2023 165,000,000 SENIOR SECURED FLOATING RATE NOTES DUE 2023 (the Notes ) CONTENTS Highlights
Final results for 52 weeks to 27 December Ralph Topping, Chief Executive Neil Cooper, Group Finance Director
 Final results for 52 weeks to 27 December 2011 Ralph Topping, Chief Executive Neil Cooper, Group Finance Director 1 Agenda Overview Ralph Topping, Chief Executive Financial highlights Neil Cooper, Group
Investor Relations Presentation. Summer 2012
 Investor Relations Presentation Summer 2012 1 Safe Harbor In addition to historical facts or statements of current condition, this presentation contains forward-looking statements within the meaning of
2017 Half-Year Results
 2017 Half-Year Results Martin Earp, CEO Josée Lemoine, CFO 16 August 2017 Financials Pillars of Growth Summary of Performance H1 2017 Sales Revenue $218.2m 1.7% Demographics Deaths 1 2.8% Australia $44.1m
ScS Group plc Interim results for the half year ended 27 January March 2018
 ScS Group plc Interim results for the half year ended 27 January 2018 21 March 2018 Agenda Introduction, objectives and highlights Financial review Review of the period and outlook David Knight Chief Executive
SuperdryPlc. Interim results for the 26 weeks ended 28 October 2017 and peak trading update
 SuperdryPlc Interim results for the 26 weeks ended 28 October 2017 and peak trading update 10 January 2018 Digital drives strong Superdry brand performance Disruptive multi-channel approach delivers 20%
Electrocomponents plc ANNOUNCEMENT OF INTERIM RESULTS
 Electrocomponents plc ANNOUNCEMENT OF INTERIM RESULTS HALF YEAR ENDED 30 SEPTEMBER 2010 12 NOVEMBER 2010 DELIVERING FOR OUR CUSTOMERS Agenda Overview and current trading Ian Mason Financial performance
Contents. Key messages. Integration of Sportingbet plc. H financial summary. Strategic objectives. Financial Results. Operational Review
 Contents Key messages Integration of Sportingbet plc H1-2013 financial summary Strategic objectives Financial Results Operational Review Dividend policy Regulatory outlook 2013 Outlook 2 Key messages Sportingbet
Preliminary Results 2018
 Preliminary Results 2018 Ralph Findlay, Chief Executive Officer Andrew Andrea, Chief Financial Officer Fisherman s Cot, Tiverton Marston s PLC Preliminary results 2018 2 INTRODUCTION 1. Record revenue
Financial results & business update. Quarter ended 30 September October 2016
 Financial results & business update Quarter ended 30 September 2016 19 October 2016 Disclaimer 3 Any remarks that we may make about future expectations, plans and prospects for the company constitute forward-looking
PINEWOOD GROUP PRESENTATION OF Q3 2017/18 RESULTS
 PINEWOOD GROUP PRESENTATION OF Q3 2017/18 RESULTS Important notice This presentation has been prepared by Pinewood Finco plc (the Issuer) and Pinewood Group Limited (the Company and, collectively with
4Q and Full Year 2016 Earnings Presentation. February 8, 2017
 4Q and Full Year 2016 Earnings Presentation February 8, 2017 Cautionary Language Regarding Forward-Looking Statements & Non-GAAP Measures This presentation contains forward-looking statements within the
AMINO TECHNOLOGIES PLC INTERIM RESULTS FOR THE SIX MONTHS ENDED 31 MAY 2014 STRONG OPERATING PROFIT AND CASH GENERATION
 AMINO TECHNOLOGIES PLC INTERIM RESULTS FOR THE SIX MONTHS ENDED 31 MAY 2014 STRONG OPERATING PROFIT AND CASH GENERATION Amino Technologies plc ('Amino' or the 'Company') (LSE: AMO), the Cambridge-based
Group gross transaction value (incl Magasin) +3.2% Like for like sales excl VAT 1.5%
 +3.2% Like for like sales excl VAT 1.5%") 1 Results Highlights Group gross transaction value (incl Magasin) +3.2% Like for like sales excl VAT 1.5% Like for like sales incl VAT Flat Group gross margin % increase Debenhams gross margin (excl Magasin)
1 Results Highlights Group gross transaction value (incl Magasin) +3.2% Like for like sales excl VAT 1.5% Like for like sales incl VAT Flat Group gross margin % increase Debenhams gross margin (excl Magasin)