Forward-looking statements
|
|
|
- Marilynn Heath
- 5 years ago
- Views:
Transcription


1
2 Forward-looking statements This presentation contains certain forward-looking statements with respect to the financial condition, results of operations, and businesses of Card Factory plc. These statements and forecasts involve risk, uncertainty and assumptions because they relate to events and depend upon circumstances that will occur in the future. There are a number of factors that could cause actual results or developments to differ materially from those expressed or implied by these forward-looking statements. These forward-looking statements are made only as at the date of this presentation. Nothing in this presentation should be construed as a profit forecast. Except as required by law, Card Factory plc has no obligation to update the forward-looking statements or to correct any inaccuracies therein. The financial information in this presentation does not contain sufficient detail to allow a full understanding of the results of Card Factory plc. For more detailed information, please see the preliminary results announcement for the year ended 31 January 2018 which can be found at
 Strategic update Karen Hubbard (CEO)")
3 Agenda Introduction Geoff Cooper (Chairman) Key messages Karen Hubbard (CEO) Financial review Kris Lee (CFO) Strategic update Karen Hubbard (CEO) Questions


4 Geoff Cooper - Chairman
5 Karen Hubbard - Chief Executive Officer


6 Key messages Strong sales performance in a tough consumer environment Sustained competitive position in a resilient market FY18 profit impacted by cost headwinds Strong cash generation and robust returns to shareholders 6


7 Kris Lee Chief Financial Officer
8 Financial highlights Performed well in difficult conditions FY18 FY17 Year-on-year change Revenue 422.1m 398.2m 6.0% Card Factory LFLs Store LFLs +2.9% +2.6% +0.6% +0.4% 1. All figures shown on an underlying basis 2. Total FY18 ordinary dividend includes recommended 6.4p final dividend, subject to AGM approval 3. Net debt excludes debt issue costs EBITDA 94.0m 98.5m (4.6)% Margin 22.3% 24.7% (2.4)ppts Profit before tax 80.5m 85.1m (5.5)% Earnings per share 18.9p 19.8p (4.4)% Total ordinary dividend 9.3p 9.1p 2.2% Dividend cover 2.03x 2.18x Special dividend 15.0p/ 51.2m 15.0p/ 51.1m Net debt 161.3m 135.8m Leverage 1.72x 1.38x 8
% Margin 22.5% 25.2% (2.")

9 Divisional performance Strong growth in core business impacted by FX, NLW and Sales mix FY18 FY17 Year-on-year change Revenue 404.3m 380.5m 6.3% EBITDA 91.1m 95.7m (4.8)% Margin 22.5% 25.2% (2.7)ppts Revenue 17.8m 17.7m 0.5% EBITDA 2.9m 2.8m 2.8% Margin 16.4% 16.0% 0.4ppts 1. All figures shown on an underlying basis 2. Card Factory includes both stores and online 3. See Appendix for H1/H2 split by brand 9
10 Impact of FX & NLW headwinds EBITDA growth of 10.2% excluding headwinds EBITDA excluding FX & NLW headwinds - YoY Growth +10.2% (FY17: +3.8%) 10
11 Best-in-class margins Continued focus on low cost business model FY 18 % of revenue FY 17 % of revenue % of revenue Movement Cost of goods sold 138.0m 32.7% 119.7m 30.1% (2.6)ppts Store Wages 74.9m 17.7% 68.9m 17.3% (0.4)ppts Store Property Costs 65.5m 15.5% 64.8m 16.3% 0.8ppts Other Direct expenses 18.6m 4.4% 18.2m 4.5% 0.1ppts Cost of Sales 297.0m 70.3% 271.6m 68.2% (2.1)ppts Operating expenses 31.1m 7.4% 28.1m 7.1% (0.3)ppts EBITDA 94.0m 22.3% 98.5m 24.7% (2.4)ppts All figures shown on an underlying basis 11


12 Sales mix Resilient card sales and success in growing complementary non-card product FY18 Sales Mix 2.3% FY17 Sales Mix 2.4% 44.0% 53.7% 42.3% 55.3% Mix shown for Card Factory stores only 12
13 Capex Low, predictable and well controlled One-off strategic projects FY18 m FY17 m FY18 spend - Lower than the 15m guidance principally in respect of timing of investment in vertical supply chain integration EPOS/BI LED lighting GP personalisation Digital print Capex remains low as a proportion of operating cashflow FY19 guidance - circa 14m including further investment in vertical supply chain integration and PCMS EPOS migration Recurring New Stores Refurbs Relocations Other capex Total CAPEX
14 Strong cash generation Track record of generating significant surplus cash FY18 m FY17 m Operating cash flow before working capital Working capital Corporation tax (17.0) (17.6) Net cash inflow from operating activities Net capital expenditure (13.1) (10.4) Net interest paid (2.6) (2.6) Free cash flow * * Free cash flow represents cash generation potentially available for distribution to shareholders. This excludes movements on borrowings and proceeds from new shares issued. 14
15 Capital policy Remains unchanged Free cash flow Dividends paid (82.9) (81.1) (82.8) Proceeds from new shares issued Net debt movement (25.6) (12.0) (19.4) FY18 m FY17 m FY16 m EBITDA leverage (at year-end) The Group s Capital Policy continues to focus on maintaining a capital structure that is conservative yet efficient in terms of providing returns to shareholders: Our policy is to maintain year-end net debt in the range of 1.0 to 2.0x EBITDA Over the short to medium term, we are targeting year end net debt of 1.7x EBITDA Special dividend for FY19 payable together with the interim dividend, expected to be in the range of 5-10p per ordinary share. 15
16 Dividends Significant returns of surplus cash We continue with our progressive dividend policy Dividend cover range moved from x to x Total cash returns since May 2014 IPO* 268.4m since IPO * Including recommended final dividend of 6.4 pence per share FY18 FY17 FY16 16
17 FY19 guidance Headwinds easing Four pillars of growth LFL sales growth Targeting LFL growth within historic range New store openings Targeting 50 net new UK store openings Business efficiencies Industry-wide cost pressures, in particular FX and NLW reduced from FY18 but not eliminated in FY19 ( 7-8m) although with a large element of mitigation Online Significant LFL growth in CF Online with more modest growth in GP Other Operating margins Limited EBITDA growth, based on delivering management s sales forecast, margin mix assumptions, identified business efficiencies and assuming limited adverse currency movement the post mitigation impact estimated to be in the region of 120bps Capex FY19 capex of c 14m including further investment in vertical supply chain integration Leverage FY19 targeted year-end leverage of c1.7x Special dividend Special dividend for FY19 expected to be in the range of 5-10 pence per ordinary share. 17

18 Financial performance summary Continuing to deliver despite ongoing headwinds Expectation of further returns of surplus cash over the medium term 18

19 Karen Hubbard Chief Executive Officer


20 FY18 pillars Further improvements in quality & range Significant increase in complementary non-card sales Competitive price and quality position maintained 915 stores in the UK 6 trial stores in Republic of Ireland Strong pipeline for FY19 Significant headwinds of 14.6m partially mitigated through various initiatives Ongoing program of mitigation developed and in progress Cardfactory.co.uk grew by 67% Getting Personal is a profitable part of the group 20


21
22 Card market update Future market projections suggest value growth of c1%-2% pa with slight decline in volumes as expected Levels of emotional attachment to card purchasing has remained relatively stable over the longer term Reported digital usage has evolved since 2015 but with no dilution of card usage from digital alternatives Card Factory consistently gained value share (16.1% to 18.2% from ) and volume share (30.3% to 31.7% from ) Card Factory has high usage and awareness with 64% of card buyers having shopped at Card Factory in the last 12 months 50% of all visits to Card Factory were planned and the main reason for the shopping trip 2017 #1 Card Factory (87.7) #2 Home Bargains (86.5) #3 Aldi (85.9) #4 Lidl (85.4) #5 99p store (85.0) #6 Primark (84.1) #7 Farm Foods (83.6) #8 Wilko (82.7) #9 Poundworld (82.6) #10 Poundstretcher (82.5) 22


23 Stronger Perception of Low Price Card Factory positioning Card Factory continues to offer clear blue water on the price and quality proposition versus its competitive set Weighted by volume of singles cards purchased Minimum n=40 Consumer Perceptions of Greeting Cards Value for Money ,2 Average Rating On Scale p Store Poundland Home Bargains B&M Bargains Wilko s Price Supermarkets Post Office M&S Hallmark Clintons WH Smith Paperchase Quality 1 23 Stronger Perception of Quality 1. How would you rate <main retailer> against the following criteria? You said you shopped at <secondary retailer> in last 12 months, how would you rate it against the following criteria? 2. Weighted by volume of single cards purchased; main and secondary retailer ratings combined Source: OC&C Consumer Survey (February 2018), OC&C analysis


24


25 LFL Sales Growth Further focus on card design and range extensions Continued development of complementary Non-card ranges Helping customers celebrate all Life moments Continuing improvement in retail disciplines 25


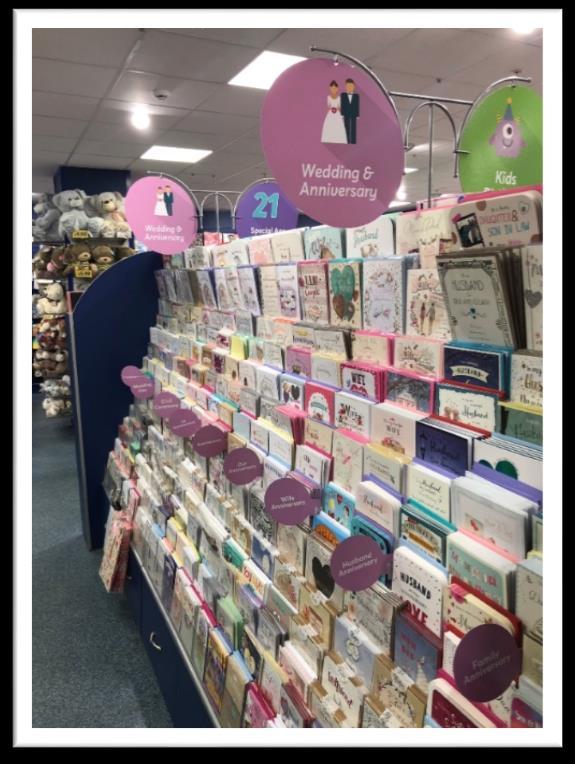
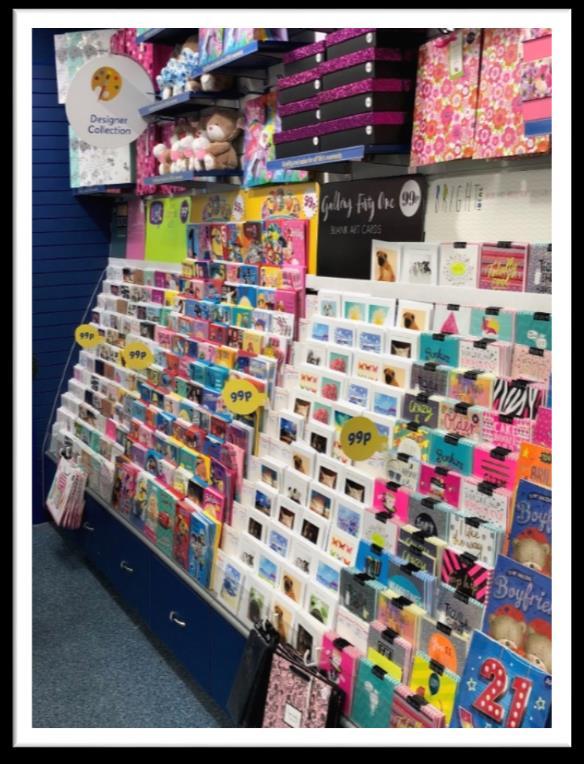

26 Responding to customer insights Navigation to ranges Caption Finders in racks Showcasing newness Retaining Price Indicators 26


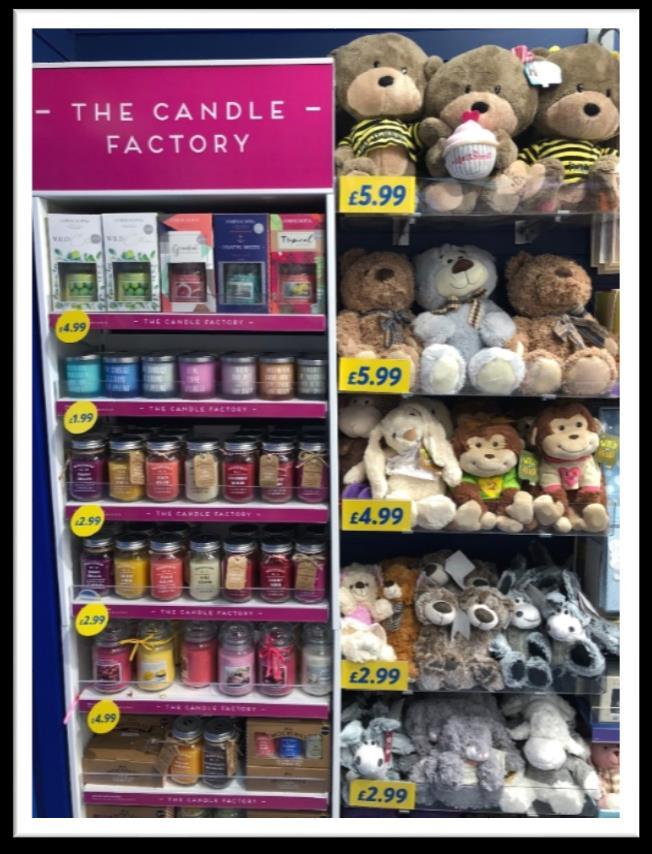

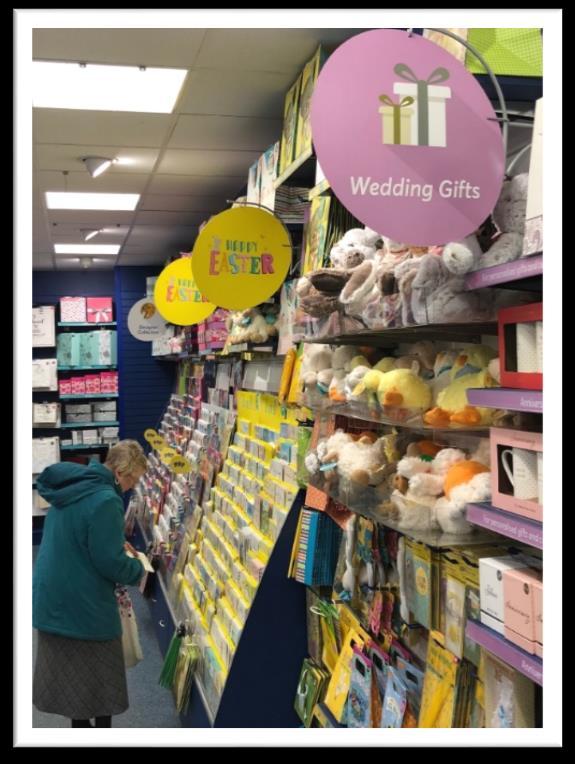
27 New promotional signage 27


28 New store rollout Strong pipeline for FY19 - plan to have circa 50 UK net openings - well established track record of delivery Republic of Ireland trial continues Further opportunities - in additional retail parks - pop up shops - Christmas shops - clearance stores 28
29 Ongoing improvements in product quality to further enhance competitive position Continual unit cost reduction in production Innovation in manufacturing especially in print finishing. Additional automation implemented Raw material prices maintained Driving lean fulfilment in stores through supply chain efficiencies Reduce average stock holding Increase warehouse productivity Reduce cost to serve Improving operational productivity The removal of tasks from stores by simplifying how we operate Significant multi year programme of instore efficiency through removal of non-customer facing tasks making it easier for colleagues Minor capital investments to facilitate Lowering the cost of sales through better buying and sourcing Loss Prevention Continuing to target net rent savings across the property portfolio at the next available break clause or lease renewal Cost efficiency programme 29


30 Online update Strong growth through product ranging Identified cardfactory.co.uk as key growth opportunity Current proposition is evolving Platform and infrastructure investment required


31 Prioritised profitable sales Focus on product innovation, availability and ranging Improving speed and other service elements


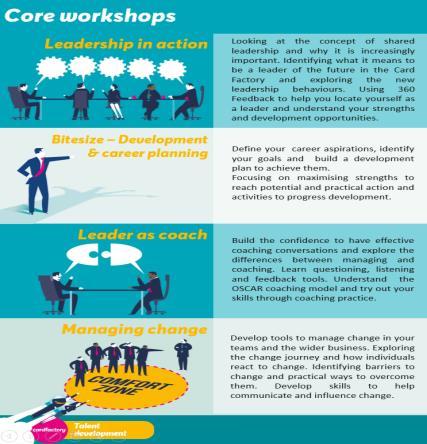


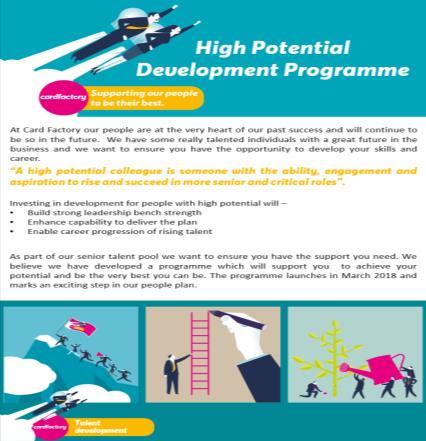

32 Good progress on People Agenda with further activities planned Improved management recruitment and retention Introduction of significant development Programmes Improvement in colleague engagement A balanced business approach 32
33 Outlook Satisfactory start to the year with record seasonal transactions Further progress on strategic initiatives Cost headwinds expected to recede although limited profit growth in FY19 Strong cash generation with returns to shareholders A strong management team in place, building a platform for sustainable growth
34 34


35 35
ppts 25.5% 28.6% (3.1)ppts Revenue 7.3m 6.9m 5.0% 10.5m 10.8m (2.4)% EBITDA 1.0m 1.0m 0.6% 1.9m 1.8m 4.0% Margin 13.3% 13.9% (0.6)ppts 18.6% 17.4% 1.2ppts Consolidated Revenue 179.6m 169.2m 6.")
36 H1/H2 performance by brand FY18(H1) FY17(H1) YoY change FY18(H2) FY17(H2) YoY change Revenue 172.3m 162.3m 6.2% 232.0m 218.2m 6.4% EBITDA 31.8m 33.2m (4.1)% 59.3m 62.5m (5.2)% Margin 18.5% 20.5% (2.0)ppts 25.5% 28.6% (3.1)ppts Revenue 7.3m 6.9m 5.0% 10.5m 10.8m (2.4)% EBITDA 1.0m 1.0m 0.6% 1.9m 1.8m 4.0% Margin 13.3% 13.9% (0.6)ppts 18.6% 17.4% 1.2ppts Consolidated Revenue 179.6m 169.2m 6.1% 242.5m 229.0m +5.9% Consolidated EBITDA 32.8m 34.2m (4.0)% 61.2m 64.3m (5.0)% Margin 18.3% 20.2% (1.9)ppts 25.2% 28.1% (2.9)ppts Notes All figures shown on an underlying basis 36
37 E 2017F 2018F 2019F 2020F 2021F E 2017F 2018F 2019F 2020F 2021F Card market update Future market projections suggest value growth of c1%-2% pa with slight decline in volumes as expected Singles market forecast UK Singles Market Value Forecast, F ( m) Forecast UK Singles Market Volume Forecast, F (Millions of Cards) Forecast 1,550 1,500 1,450 1,400 1,350 1,300 CAGR: + 1.5% CAGR Upside: +2.1% CAGR Base: +1.4% CAGR Downside: +0.6% CAGR: - 0.2% CAGR Upside: -0.3% CAGR Base: -1.0% CAGR Downside: -1.8% 1,250 1,200 1,150 1,100 1, , Source: GCA, Management Data, UK Trade Data, OC&C Consumer Surveys ( ), Kantar, Nielson, OC&C analysis 37
38 Card market update (continued) Levels of emotional attachment to card purchasing has remained relatively stable over the longer term; reported digital use has evolved since 2017 Customer Attitudes and Purchasing Behaviour Attitudes to Card Purchasing by Occasion 1,2 Card Buyers by Usage of Digital Greetings Question: How much do you agree with the following statements? 2. Weighted by volume of single cards purchased 3. If the change is less than 1.54% it is within the bounds of a statistical error Source: OC&C Online Consumer Surveys ( ), OC&C analysis I would always bring a birthday card to a friend s birthday party If I am attending a wedding I will always bring a card I would always give my child a card to take to their friend s birthday I always send Christmas cards to all my friends and family I always send a Valentine card to my significant other I will always send a card to celebrate a friend s achievement (e.g. driving test, graduating...) (% of Total Card Buyers) 100% 100% 31% 51% 18% % 62% 14% % 19% 64% 18% % 16% 78% 6% 2018 Don t Use Digital Greetings Use Digital Greetings But Not As Replacement For Physical Card Replace Physical Card With Digital Alternative 38
39 Card market update (continued) Card Factory has consistently gained value share Singles Greetings Cards Channel Share Evolution, Single greet cards Value % 4.1% 4.4% 4.7% 5.3% 5.9% 26.2% 24.8% 24.2% 22.9% 22.0% 1.4% 12.8% 3.8% 1.6% 1.7% 1.8% 1.9% 10.3% 9.9% 9.6% 9.1% 4.9% 5.3% 5.3% 5.6% Online Specialists Other Paperchase Clinton Cards Discounters Single greet cards Volume % 1.5% 21.9% 20.3% 19.5% 18.4% 17.5% 0.9% 8.0% 5.8% 1.6% 1.7% 2.0% 2.2% 1.1% 1.2% 1.0% 1.1% 6.2% 6.0% 5.8% 5.4% 7.6% 8.4% 8.6% 9.5% Online Specialists Other Paperchase Clinton Cards Discounters 16.1% 16.9% 17.4% 17.9% 18.2% Card Factory 30.3% 31.1% 31.5% 32.1% 31.7% Card Factory 35.7% 37.1% 36.9% 37.2% 37.3% Grocers 31.5% 32.2% 31.8% 32.0% 32.5% Grocers Source: Nielsen, Kantar, Press Releases, OC&C analysis 39
40 Store numbers (FY) New store rollout 921 Acquisitions Store Openings Stores Store numbers (UK & ROI) FY18 FY17 At start of period Net store openings* ROI 6 - At end of period *Includes closures Store Location Type (UK) FY18 Openings Total Stores High Street Stores % Retail Park % Shopping Centre % Shopping Precinct % Factory Outlet & Supermarkets % % 40
Interim results 6 months ended 31 July September 2018
 Interim results 6 months ended 31 July 2018 25 September 2018 1 Forward-looking statements This presentation contains certain forward-looking statements with respect to the financial condition, results
Annual Report and Accounts
 Annual Report and Accounts quality and value for all life s moments Company Overview Welcome to Card Factory is the UK s leading specialist retailer of greeting cards, dressings and gifts. Card Factory
nemo2014\presentations\analyst Presentation Jan14\ Nemo Analyst Presentation Master-22nd Jan FINAL.pptx
 Interim Results FY17 24 th November 2016 Forward looking statements Forward-Looking Statements INCLUDED IN THIS PRESENTATION ARE FORWARD-LOOKING MANAGEMENT COMMENTS AND OTHER STATEMENTS THAT REFLECT MANAGEMENT
Halfords Group plc. J.P. Morgan London Small/Mid Cap Conference 2017
 Halfords Group plc J.P. Morgan London Small/Mid Cap Conference 2017 Highlights Introduction to Halfords and key markets Page 3 Moving Up A Gear strategy Page 12 Financial Guidance Page 25 FY17 Financial
Interim Results For 6 months ended 31 Dec February 2018
 Interim Results For 6 months ended 31 Dec 2017 February 2018 Financial highlights 62.5m 55.7m 71.7m 13.7m 10.8m 15.8m 8.8m 11.2m 12.9m 16 17 18 16 17 18 16 17 18 REVENUE 71.7m (H1 FY17: 62.5m) +14.7% YEAR-ON-YEAR
Interim Results FY18 28 th November 2017
 Interim Results FY18 28 th November 2017 Forward looking statements Forward-Looking Statements INCLUDED IN THIS PRESENTATION ARE FORWARD-LOOKING MANAGEMENT COMMENTS AND OTHER STATEMENTS THAT REFLECT MANAGEMENT
Preliminary Results FY17
 Preliminary Results FY17 25 th May 2017 Forward looking statements Forward-Looking Statements INCLUDED IN THIS PRESENTATION ARE FORWARD-LOOKING MANAGEMENT COMMENTS AND OTHER STATEMENTS THAT REFLECT MANAGEMENT
RESULTS For the year ended 30 September 2011
 RESULTS For the year ended 30 September 2011 AGENDA Highlights Patrick Coveney, CEO Financial Review Alan Williams, CFO Operating Review & Strategy Patrick Coveney, CEO Outlook Patrick Coveney, CEO Q &
FY18 Preliminary results. September 2018
 FY18 Preliminary results September 2018 Financial Highlights 116.3m 105.2m 16.3m 18.9m 11.2m 12.7m 91.1m 12.4m 5.6m 81.1m 7.8m 4.1m REVENUE 116.3m (2017: 105.2m) +11% YEAR-ON-YEAR UNDERLYING EBITDA 1 18.9m
FISCAL YEAR 2017 INTERIM RESULTS FOR 12 WEEKS ENDED 17 JUNE JULY 2016
 FISCAL YEAR 2017 INTERIM RESULTS FOR 12 WEEKS ENDED 17 JUNE 16 27 JULY 2016 Agenda Key Highlights Financial Review Outlook Q&A Presenter: Tarsem Dhaliwal (CFO) First quarter:12 weeks ending 17 June 2016
Ontex Q1 2018: Performance in line with our expectations
 Ontex Q1 2018: Performance in line with our expectations 1.7% LFL revenue growth with positive volumes and price/mix Sequential improvement of margins Progress on our actions in Brazil with full benefits
H FINANCIAL RESULTS. August 30,
 August 30, 2017 1 Disclaimer This presentation contains both historical and forward-looking statements. These forward-looking statements are based on Carrefour management's current views and assumptions.
Full Year Results for the year ended 27 March 2016
 16 June 2016 Full Year Results for the year ended 27 March 2016 Financial Highlights Underlying Results* Sales +9.7% on a constant currency basis Sales +9.3% to 1,214.8 million on an actual currency basis
Preliminary Results 2012
 Preliminary Results 2012 Highlights Resilient performance with growth in all segments Strategy appropriate for continuing economic uncertainty High quality pubs underlined by estate valuation New-build
Britvic plc. Interims presentation 2015
 Britvic plc Interims presentation 2015 Gerald Corbett Chairman John Gibney Chief Financial Officer Continued strong earnings growth in challenging trading conditions -0.7% +6.2% +60bps +11.6% 0.4x +9.8%
Agenda. FY2018 highlights Evolution of key drivers Summary and outlook. Financial performance Property update
 Agenda FY2018 highlights Evolution of key drivers Summary and outlook Financial performance Property update 1 Continued delivery of our growth strategy in fy2018 High quality profitable estate Affordable
Photo Montage on loop
 Photo Montage on loop Photo Montage on loop 3 Highlights Solid service-led sales performance Market share in Retail motoring and cycling grew overall Confident in long-term growth prospects for cycling
2017 Preliminary Results: For the 52 weeks ended 30 December 2017
 2017 Preliminary Results: For the 52 weeks ended 30 December 2017 1 Agenda Highlights Financial performance Strategic progress Current trading & outlook 2 2017: good growth and further strategic progress
PRELIMINARY RESULTS PRESENTATION YEAR ENDED 31 DECEMBER 2017
 PRELIMINARY RESULTS PRESENTATION YEAR ENDED 31 DECEMBER 2017 DISCLAIMER The information contained in this presentation has not been independently verified and this presentation contains various forward-looking
Investor presentation. September 2018
 Investor presentation September 2018 Forward looking statements Forward-Looking Statements INCLUDED IN THIS PRESENTATION ARE FORWARD-LOOKING MANAGEMENT COMMENTS AND OTHER STATEMENTS THAT REFLECT MANAGEMENT
Becoming the best pet care business in the world. Strategic update and interim financial results FY19
 Becoming the best pet care business in the world Strategic update and interim financial results FY19 Interim Results FY19 2 Today s presentation Group strategic update and vet business review Financial
Serving shoppers a little better every day.
 Serving shoppers a little better every day. 3 October 2018 Dave Lewis CEO Alan Stewart CFO Agenda. Half year results Six strategic drivers Creating value for our four key stakeholders 1H results. Group
Preliminary Results. 18 October 2016
 Preliminary Results 18 October 2016 Highlights Mark Cashmore Group Chief Executive Highlights Solid Group performance in line with expectations Total revenue 1,907m +1.7% Adjusted PBT 60.7m +7.4% Adjusted
Carpetright plc. Preliminary Results 25 June 2013
 Carpetright plc Preliminary Results 25 June 2013 1 Agenda Introduction Lord Harris Financial Review Neil Page Group Overview Darren Shapland Questions & Answers 3 Neil Page Group Finance Director 4 Group
INTERIM RESULTS PRESENTATION SIX MONTHS TO 30 JUNE 2018
 INTERIM RESULTS PRESENTATION SIX MONTHS TO 30 JUNE 2018 DISCLAIMER The information contained in this presentation has not been independently verified and this presentation contains various forward-looking
The Food Travel Experts.
 The Food Travel Experts www.foodtravelexperts.com SSP Group plc Annual Results 2016 29 November 2016 Presentation structure 1. Group highlights Kate Swann 2. Financial review Jonathan Davies 3. Business
RESULTS UNDERPINNED BY TIGHT COST MANAGEMENT
 Financial review RESULTS UNDERPINNED BY TIGHT COST MANAGEMENT SEGMENTAL PERFORMANCE The financial statements for the period ended included 53 weeks. In the notes that follow, all comparative income statement
February 21, Fourth Quarter 2018 Results
 February 21, 2019 Fourth Quarter 2018 Results Forward-looking statements This presentation, as well as other statements made by Delphi Technologies PLC (the Company ), contains forward-looking statements
Chief Financial Officer s Report Jonny Mason
 Chief Financial Officer s Report Jonny Mason Financial Resources Generating returns for our stakeholders through effective management of our financial resources. Group revenue in, at 1,135.1m, was up 3.7%
Revolution Bars Group plc (LSE: RBG) Interim results for the six months ended 31 December 2016
 Interim results for the six months ended 31 December 2016") 28 February 2017 Revolution Bars Group plc (LSE: RBG) Interim results for the six months ended 31 2016 Revolution Bars Group plc ( the Group ), a leading UK operator of premium bars, trading under the
28 February 2017 Revolution Bars Group plc (LSE: RBG) Interim results for the six months ended 31 2016 Revolution Bars Group plc ( the Group ), a leading UK operator of premium bars, trading under the
Foxtons Interim results presentation For the period ended June 2017
 Foxtons Interim results presentation For the period ended June 2017 Important information This presentation includes statements that are, or may be deemed to be, forward-looking statements. These forward-looking
Full Year Results Bob Ivell Chairman
 Full Year Results 2015 Bob Ivell Chairman Financial Review 2015 Tim Jones Finance Director Income statement (Pre-exceptional items) FY 2015 m FY 2014 m Revenue 2,101 1,970 +6.6% Operating costs (1,773)
Part 1 Executing our strategy
 Entwurf 19.09.018 15h00 Part 1 Executing our strategy Klaus Rosenfeld Chief Executive Officer Capital Markets Day 018 Berlin Disclaimer This presentation contains forward-looking statements. The words
FY2017 RESULTS PRESENTATION FULL YEAR RESULTS TO 30 JUNE 2017
 FY2017 RESULTS PRESENTATION FULL RESULTS TO 30 JUNE 2017 This presentation has been prepared by rhipe Limited ACN 112 452 436 (RHP). Each Recipient of this presentation is deemed to have agreed to accept
Interim Results for the 26 weeks ended 28 September 2014 STRONG FIRST HALF RESULTS
 27 November 2014 Interim Results for the 26 weeks ended 28 September 2014 STRONG FIRST HALF RESULTS Financial Highlights Underlying Results for the 26 weeks ended 28 September 2014 Total sales +15.0% to
Preliminary Results 52 Weeks to 30 March Merrill Lynch - Auditorium. 7 June 2007
 Preliminary Results 52 Weeks to 30 March 2007 Merrill Lynch - Auditorium 7 June 2007 Nick Wharton Finance Director Financial Highlights Sales 744.0m (2006: 681.7m) Operating profit 93.5m (2006: 89.1m)
31 March 2018 Audited Preliminary Results. 6 June 2018
 31 March 2018 Audited Preliminary Results 6 June 2018 1 Presentation Team Euan Fraser Chief Executive Officer Stuart McNulty UK Chief Executive Officer John Paton Chief Financial Officer Has led Alpha
H1 16 interim results. 22 September 2015
 H1 16 interim results 22 September 2015 Important notice 2 This presentation may include certain forward-looking statements, beliefs or opinions, including statements with respect to the Company s business,
Interim Results for the 26 weeks ended 29 June 2014
 Interim Results for the 26 weeks ended 29 June 2014 1 The Team David Wild Chief Executive Officer Sean Wilkins Chief Financial Officer 2 Highlights of H1 2014 11.3% UK LFL UK on-line accounting for 69.7%
FY17 Preliminary results September 2017
 FY17 Preliminary results September 2017 Financial highlights 91.1m 81.1m 105.2m 12.4m 16.3m 11.2m 7.8m 5.6m 15 16 17 15 16 17 2.0m 15 16 17 REVENUE 105.2m (2016: 91.1m) +12% YEAR-ON-YEAR 1 UNDERLYING EBITDA
2015 Results Presentation. 14 March 2016
 2015 Results Presentation 14 March 2016 Disclaimer and Basis of Preparation Disclaimer The information set out herein may be subject to updating, completion, revision and amendment and such information
Polypipe Group plc Interim Results
 Polypipe Group plc Interim Results 6 months to 30 June 2017 Disclaimer The information contained in this presentation has not been independently verified and this presentation contains various forward-looking
The Food Travel Experts.
 The Food Travel Experts www.foodtravelexperts.com Presentation structure 1. Group highlights Kate Swann 2. Financial review Jonathan Davies 3. Business review Kate Swann 4. Q&A All 2 Group highlights Strong
Full Year Results 2016
 Full Year Results 2016 1 Financial Review 2016 Tim Jones Finance Director 2 Income statement (Pre adjusted items) FY 2016 m FY 2015 m Revenue 2,086 2,101 (0.7%) Operating costs (1,768) (1,773) Operating
FULL YEAR RESULTS PRESENTATION WELL POSITIONED FOR CONTINUED GROWTH. 3 April 2017
 FULL YEAR RESULTS PRESENTATION WELL POSITIONED FOR CONTINUED GROWTH 3 April 2017 AGENDA Introduction and overview John Hornby Financial review David Main Strategic progress and outlook John Hornby Questions
Preliminary Results 2012/13
 Preliminary Results 2012/13 David Tyler Chairman John Rogers Chief Financial Officer Group performance Highlights Underlying results 2012/13 m 2011/12 m Change % Sales (inc VAT) 25,632 24,511 4.6 Sales
INTERIM RESULTS. Interim Results.
 INTERIM RESULTS. RESULTS. 2017 Interim Results. Results. 2017 1 Agenda Chairman s introduction Financial review Operational update Plumbing & Heating transformation Robert Walker Alan Williams John Carter
FY 2017 Results. March 6, 2018
 FY 2017 Results March 6, 2018 Forward looking statements This Presentation may include forward-looking statements. Forward-looking statements are statements regarding or based upon our management s current
FULL YEAR RESULTS 26 TH APRIL 2018
 1 FULL YEAR RESULTS 26 TH APRIL 2018 2 Overview Profit growth in a challenging market Simply Be standout performance Strategic momentum: UK market share gains USA +21% in H2 New partnerships announced
AUSTRALIAN PHARMACEUTICAL INDUSTRIES
 AUSTRALIAN PHARMACEUTICAL INDUSTRIES 2017 FULL YEAR RESULTS PRESENTATION THURSDAY 19 OCTOBER 2017 Important Notice The material in this presentation is of general information about API s activities current
Britvic plc Interim Results 2018
 Britvic plc Interim Results 2018 CEO SIMON LITHERLAND DELIVERING ON OUR STRATEGIC PRIORITIES AND VISION 2 OUR STRATEGY IS DELIVERING CONSISTENT RETURNS FOR SHAREHOLDERS GENERATE PROFITABLE GROWTH IN OUR
Ontex H1 2018: Solid progress against 2018 priorities
 Ontex H1 2018: Solid progress against 2018 priorities Growing share in core markets with our robust portfolio: LFL ex Brazil +2.2% Actions to drive margin improvement coming through: price/mix +1% Execution
WH Smith PLC Preliminary Results October 2018
 Disclaimer This document contains forward-looking statements with respect to the operations, performance and financial condition of WH Smith PLC. By their nature, these statements are subject to risks,
2017 FULL YEAR RESULTS. February 28,
 2017 FULL YEAR RESULTS February 28, 2018 1 Disclaimer This presentation contains both historical and forward-looking statements. These forward-looking statements are based on Carrefour management's current
Presentation of consolidated results. For the 52 weeks ended 30 March 2013
 Presentation of consolidated results For the 52 weeks ended 30 March 2013 1 Agenda Strategic and operational update Financial review Looking forward Jürgen Schreiber CEO Mark Bower Deputy CEO & CFO Jürgen
Investor Presentation November 2011
 Investor Presentation November 2011 For further information contact: aston.swift@intertek.com +44 (0)20 7396 3400 1 Cautionary statement regarding forward-looking statements This presentation contains
Interim results. 30 March 2017
 Interim results 30 March 2017 Highlights Ian Filby Continued Financial Growth and Strong Operational Progress H1 FINANCIALS 493.7m +7.0% 16.7m +3.1% 20m 9.5p per share Gross sales Profit before tax Special
home24 Earnings Presentation Q November 2018
 home24 Earnings Presentation Q3-8 27 November 208 0 Our mission: to be the online destination for Home & Living Huge and uniquely attractive Home & Living market opportunity of EUR 7 billion Leading pure-play
FY16 YEAR END RESULTS 5 APRIL 2016
 FY16 YEAR END RESULTS 5 APRIL 2016 DEFINITIONS AND IMPORTANT NOTICE The following definitions apply throughout Trading EBITDA (earnings before interest, tax, depreciation and amortisation): excludes exceptional
2017 Interim Results: For the 26 weeks ended 1 July 2017
 2017 Interim Results: For the 26 weeks ended 1 July 2017 1 Agenda Highlights Financial performance Operational review Outlook for 2017 2 Good progress in the first half Total sales up 7.3% to 453m (2016:
Half Year results and outlook
 PRESENTATION TO INVESTORS & ANALYSTS Half Year results and outlook David Banfield - Group CEO Jannine Mountford - Group CFO 1 March 2018 For 6 months 1 July 31 December 2017 New Zealand tapware underperforms,
7 October 2015 SERVING BRITAIN S SHOPPERS A LITTLE BETTER EVERY DAY Dave Lewis CEO, Alan Stewart CFO
 7 October 2015 SERVING BRITAIN S SHOPPERS A LITTLE BETTER EVERY DAY Dave Lewis CEO, Alan Stewart CFO Agenda One year on Detailed results Three key priorities Outlook Sales improving UK Asia Europe (4.8)%
25 October Q Revenues. Gilles Petit, CEO Arnaud Louet, CFO
 Q3 2016 Revenues Gilles Petit, CEO Arnaud Louet, CFO Q3 2016 Revenues FORWARD LOOKING STATEMENTS This presentation contains certain statements that constitute "forward-looking statements", including but
Q Interim Management Statement
 Q1 2014 Interim Management Statement Key messages and agenda for today 1 Delivering sustainable profitable growth 2 Delivering further financial improvement 3 Delivering a step change in profitable growth
Q Trading Update. May 4, 2016
 Q1 2016 Trading Update May 4, 2016 Forward looking statements This Presentation may include forward-looking statements. Forward-looking statements are statements regarding or based upon our management
Presentation of results for the fourth quarter and full year 2017
 Presentation of results for the fourth quarter and full year 2017 CEO Pål Wibe CFO Espen Eldal 1 February 2018 Norway s leading discount variety retailer Highlights in the fourth quarter Group revenues
For personal use only. JB Hi-Fi Limited. HY18 Results Presentation
 JB Hi-Fi Limited HY8 Results Presentation 5 FEBRUARY AUGUST 06 08 PAGE Agenda. Group Performance Overview. JB HI-FI 3. The Good Guys 4. Group Balance Sheet and Cash Flow 5. Outlook Richard Murray Group
2013 Full Year Results Presentation 3 March 2014
 2013 Full Year Results Presentation 3 March 2014 Wolfhart Hauser Chief Executive Officer Lloyd Pitchford Chief Financial Officer 1 Lloyd Pitchford Chief Financial Officer Financial Performance 2013 Full
Interim Results 2010
 Interim Results 2010 David Thompson Chairman Highlights 1. H1 performance in line with targets Revenue growth, margins broadly level 2. Good progress in strategy development New-build programme on track
Britvic plc Preliminary Results 2017
 Britvic plc Preliminary Results 2017 CEO SIMON LITHERLAND DELIVERING ON OUR STRATEGIC PRIORITIES AND VISION Britvic plc Preliminary Results 2017 2 2017 ANOTHER YEAR OF STRONG PROGRESS STRONG REVENUE AND
Building a better AA Putting Service, Innovation and Data at the heart of the AA
 LEI: 213800DTPE4O5OI17349 This announcement contains inside information Building a better AA Putting Service, Innovation and Data at the heart of the AA The AA is today presenting our new business strategy
BUILDING A BOLD AND SUSTAINABLE FUTURE
 BUILDING A BOLD AND SUSTAINABLE FUTURE 2018 HALF YEAR RESULTS 7 AUGUST 2018 PRESENTED BY: CHAIRMAN MARTIN LAMB CHIEF EXECUTIVE KEVIN HOSTETLER FINANCE DIRECTOR JONATHAN DAVIS Keeping the World Flowing
GREGGS TO RESHAPE BUSINESS FOR FUTURE GROWTH
 6 August 2013 INTERIM RESULTS FOR THE 26 WEEKS ENDED 29 JUNE 2013 AND STRATEGY UPDATE Greggs is the leading bakery retailer in the UK, with close to 1,700 shops throughout the country GREGGS TO RESHAPE
25 th Annual General Meeting
 25 th Annual General Meeting 27 th October 2017 Page 1 Managing Director s Address Page 2 Workplace Health and Safety Total Injury Frequency Rate (TIFR) Continued focus on providing safe workplace for
HARVEY NASH GROUP PLC. Albert Ellis, CEO Mark Garratt, CFO. results ahead of expectations increased dividend strong platform to accelerate growth
 HARVEY NASH GROUP PLC Albert Ellis, CEO Mark Garratt, CFO results ahead of expectations increased dividend strong platform to accelerate growth HIGHLIGHTS Results ahead of expectations Strong operating
For personal use only. JB Hi-Fi Limited. HY17 Results Presentation
 JB Hi-Fi Limited HY7 Results Presentation 3 5 FEBRUARY AUGUST 06 07 PAGE Agenda. Group Performance Overview. JB HI-FI 3. The Good Guys 4. Stores 5. Group Balance Sheet and Cash Flow 6. Outlook Richard
The Food Travel Experts.
 The Food Travel Experts www.foodtravelexperts.com Presentation structure 1. Group highlights Kate Swann 2. Financial review Jonathan Davies 3. Business review Kate Swann 4. Q&A All 2 Group highlights Good
Mitie Group plc. The UK s leading Facilities Management business. Analyst Presentation H1 18/19 22 November 2018
 Mitie Group plc The UK s leading Facilities Management business Analyst Presentation H1 18/19 22 November 2018 Disclaimer This presentation may contain certain forward-looking statements, beliefs or opinions,
OneVue Holdings Limited (OVH)
") OneVue Holdings Limited (OVH) H1 FY 2018 results presentation 26 February 2018 1 HIGHLIGHTS 2 FINANCIALS 3 OUTLOOK 4 APPENDICES Page 2 1 HIGHLIGHTS . BENEFITTING FROM SECTORAL GROWTH AND STRUCTURAL DISRUPTION
OneVue Holdings Limited (OVH) H1 FY 2018 results presentation 26 February 2018 1 HIGHLIGHTS 2 FINANCIALS 3 OUTLOOK 4 APPENDICES Page 2 1 HIGHLIGHTS . BENEFITTING FROM SECTORAL GROWTH AND STRUCTURAL DISRUPTION
Preliminary Results. 1 March 2016
 Preliminary Results 1 March 2016 1 Matthew Price 1 March 2016 2 Our diversified business traded well and we continued to invest in technology Adjusted 282m 14% Operating EPS (adjusted) Profit 15% 14.5p
Half Year Results for the Six Months to 31 January 2019
 Close Brothers Group plc T +44 (0)20 7655 3100 10 Crown Place E enquiries@closebrothers.com London EC2A 4FT W www.closebrothers.com Registered in England No. 520241 Half Year Results for the Six Months
Debt Investor Call. 11 April Alan Stewart CFO Lynda Heywood Group Treasurer
 Debt Investor Call. 11 April 2018 Alan Stewart CFO Lynda Heywood Group Treasurer FY results. A year of progress +2.3% +28.4% +21.7% 49.9bn 51.0bn 1,280 m 1,644 m 2,279 m 2,773m FY 16/17 FY 17/18 FY 16/17
ELECTROCOMPONENTS Full-year results for the year ended 31 March 2018
 ELECTROCOMPONENTS Full-year results for the year ended 31 March 2018 24 May 2018 SAFE HARBOUR This presentation contains certain statements, statistics and projections that are or may be forward-looking.
Making it happen. 13 June 2017
 Making it happen 13 June 2017 LEGAL NOTICE This presentation has been prepared to inform investors and prospective investors in the secondary markets about the Group and does not constitute an offer of
Half Year Results Presentation. For the six months ended 30 June 2016
 Half Year Results Presentation For the six months ended 30 June 2016 Disclaimer By attending the meeting where this presentation is made, or by reading this document, you agree to be bound by the limitations
Britvic plc. Preliminary Results 2011
 Britvic plc Preliminary Results 2011 Gerald Corbett Chairman John Gibney Group Finance Director Agenda Financial performance John Gibney Britvic and the market review Paul Moody Group performance +14.6%
14 September Interim Results. 26 weeks to 30 July 2017
 14 September 2017 Interim Results 26 weeks to 30 July 2017 Andrew Higginson Chairman 2 David Potts CEO 3 Fix, Rebuild and Grow Fix Stabilise like-for-like Improve capability: People, process and technology
Presentation of consolidated results. For the quarter ended 28 September 2013
 Presentation of consolidated results For the quarter ended 28 September 2013 1 Agenda Strategic and operational update Financial review Looking forward Jürgen Schreiber CEO Mark Bower Deputy CEO & CFO
PRESS ANNOUNCEMENT GAMES WORKSHOP GROUP PLC
 PRESS ANNOUNCEMENT GAMES WORKSHOP GROUP PLC HALF-YEARLY REPORT 15 January 2019 Games Workshop Group PLC ( Games Workshop or the Group ) announces its half-yearly results for the six months to. Highlights:
home24 FY 2018/Q4 Trading Update 13 February 2019
 home24 FY 208/Q4 Trading Update 3 February 209 0 Our mission: to be the online destination for Home & Living Huge and uniquely attractive Home & Living market opportunity of EUR 7 billion Markets characterized
Preliminary Results. 19 May 2015
 Preliminary Results 19 May 2015 Group returns to profit growth plus strong customer growth Adjusted profit before tax 1 ( m) Profit growth combined with significant extra investment in USA Group delivers
0 Preliminary Results December Preliminary Results December March 2011
 0 Preliminary Results December 2010 Preliminary Results December 2010 23 March 2011 Agenda Introduction 2010 Results International business Acquisition of Atomic PR Citigate Grayling Red Huntsworth Health
Q Earnings Conference Call
 Q2 2015 Earnings Conference Call July 29, 2015 Jeff Housenbold, CEO Brian Regan, CFO Safe Harbor Disclaimer This presentation contains "forward-looking" statements within the meaning of Section 27A of
FIRST-HALF 2018 RESULTS 30 JULY 2018
 FIRST-HALF 2018 RESULTS 30 JULY 2018 Disclaimer FORWARD LOOKING STATEMENTS This presentation contains certain statements that constitute "forward-looking statements", including but not limited to statements
14 March Preliminary Results. 53 weeks to 4 February 2018
 14 March 2018 Preliminary Results 53 weeks to 4 February 2018 Andrew Higginson Chairman 2 David Potts CEO 3 Fix, Rebuild and Grow PHASE 3: GROW A broader business creating value PHASE 2: REBUILD Six priorities
WH Smith PLC Interim Results April 2018
 Disclaimer This document contains forward-looking statements with respect to the operations, performance and financial condition of WH Smith PLC. By their nature, these statements are subject to risks,
Half Year Results for the six months ended 27 September 2015
 19 November 2015 Half Year Results for the six months ended 27 September 2015 99p Stores incremental EBITDA of at least 25 million already identified UK & Ireland store target raised by 40% to 1,400 stores
FINAL RESULTS FOR THE YEAR ENDED 29 FEBRUARY April 2016
 FINAL RESULTS FOR THE YEAR ENDED 29 FEBRUARY 2016 26 April 2016 FY16 HIGHLIGHTS Sales up 40% year on year (42% CER) UK up 38%, rest of Europe 25% (35% CER), rest of world up 56% (63% CER) Adjusted EBITDA
SuperdryPlc. Interim results for the 26 weeks ended 28 October 2017 and peak trading update
 SuperdryPlc Interim results for the 26 weeks ended 28 October 2017 and peak trading update 10 January 2018 Digital drives strong Superdry brand performance Disruptive multi-channel approach delivers 20%
FY14. Vita Group (VTG) RESULTS PRESENTATION
 RESULTS PRESENTATION") FY14 Vita Group (VTG) RESULTS PRESENTATION GROUP HIGHLIGHTS Strong sustained performance in competitive markets Execution against strategic objectives Continued earnings growth from optimisation program
FY14 Vita Group (VTG) RESULTS PRESENTATION GROUP HIGHLIGHTS Strong sustained performance in competitive markets Execution against strategic objectives Continued earnings growth from optimisation program