14 March Preliminary Results. 53 weeks to 4 February 2018
|
|
|
- Robert Oliver
- 6 years ago
- Views:
Transcription


1 14 March 2018 Preliminary Results 53 weeks to 4 February 2018
2 Andrew Higginson Chairman 2
3 David Potts CEO 3

4 Fix, Rebuild and Grow PHASE 3: GROW A broader business creating value PHASE 2: REBUILD Six priorities to improve the shopping trip Gain consistency and confidence PHASE 1: FIX Stabilise LFL Improve capability Operate at lower cost 4
5 The last 12 months Group like-for-like sales, ex-fuel, ex-vat Supermarkets like-for-like transactions 2.1% 1.8% 2.9% 3.4% 2.6% 2.5% 2.8% 3.1% 4.3% 4.1% 4.6% 4.6% 3.2% 0.1% 0.7% 1.6% 2.1% 2.0% Q4 Q1 Q2 Q3 Q4 Q1 Q2 Q3 Q4 Q4 Q1 Q2 Q3 Q4 Q1 Q2 Q3 Q4 2015/ / / / / /18 Committed to buying British? +10% Customer satisfaction +12% +7% +3% +2% Jan-18 'Big 3' Competitors Morrisons Jan-15 Jan-16 Jan-17 Jan-18 5


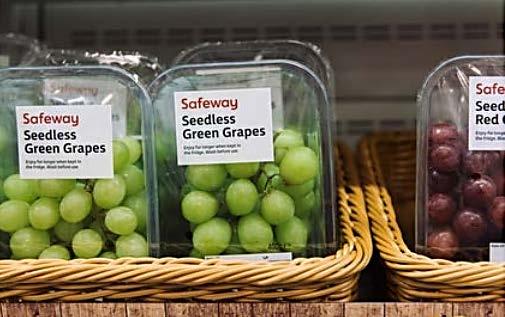
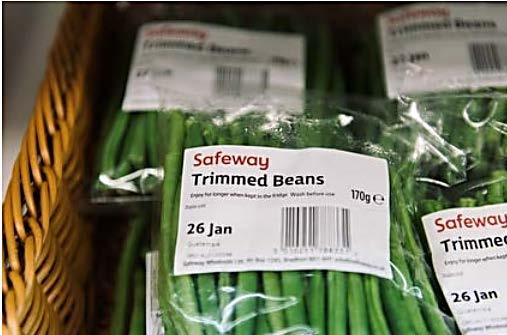

6 The last 12 months - Safeway 6


7 The last 12 months Morrisons Daily Hendon Rontec Morrisons Daily Hendon Rontec Sandpiper, Channel Islands Amazon channels 7


8 The six priorities To be more competitive To serve customers better Find local solutions Develop popular and useful services To simplify and speed up the organisation To make the core supermarkets strong again 8


9 Be more competitive Price Crunch and Way Down Morrisons Makes It Wonky Savers Events and special offers Manufacturing cost, yield, volume & quality Saving customers every penny we can The Morrisons Price List 9


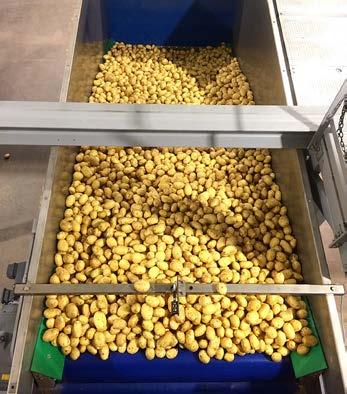


10 Be more competitive Conditioning and storage Loading on to line Washing, grading and sorting Quality control Automated weighing and bagging Robotic picking 10

11 Be more competitive Potato processing plant - Rushden 11


12 Be more competitive New Home & Leisure Nutmeg womenswear The Best 12


13 Serve customers better Customer satisfaction improving More front-line colleagues Store-pick online home delivery Christmas Food to Order sales up 50% Investing in colleague pay and bonus Store-pick online home delivery 13


14 Find local solutions Over 200 new local suppliers and 750 new local products Local sales up 50% in two years More Card data helping target local offer Local solutions driving national benefit Local beer Edinburgh Gin Local produce 14


15 Develop popular and useful services Modernised cafés, 50 new barista bars 30 new Morrisons Daily stores on our forecourts Over 400 Amazon lockers 160 new Doddle pick-up points Around 180 Timpson at Morrisons Barista bar Southend Morrisons Daily St. Ives, Cambridgeshire Opened 8 th March 2018 Doddle kiosk Northampton Timpson at Morrisons Giffnock 15


16 Simplify and speed up Automated ordering In-store administration Distribution Goods not for resale Manufacturing, distribution & Market Street efficiency and yield Digital trials Kiosk express tills Thornbury 16


17 Make core supermarkets strong again 80 more Fresh Looks Completed half the estate Modernising stores Applied Fresh Look learnings Fruit & Veg Florists National benefit Fresh Look Fruit & Veg Market Drayton Fresh Look Flowers Halifax 17
18 Meaningful and sustainable growth Building meaningful and sustainable sales growth Like-for-like New stores Online Wholesale Modest Sustainable St. Ives, Cambridgeshire Abergavenny Birmingham Store-pick New Erith CFC New geographies Amazon McColl s Rontec Sandpiper Safeway 18


19 Meaningful and sustainable growth New store St. Ives, Cambridgeshire Opened 8 th March 2018 Morrisons Daily Utilising car parks McColl s Timpson at Morrisons Parcel pick-up 19
20 Trevor Strain CFO 20
21 Overview 2017/ /17 Ex-fuel sales growth 2.5% * (0.2)% Underlying profit m year-on-year 11.0% 11.6% Return on capital employed 7.7% 7.3% Free cash flow m Lease adjusted net debt: EBITDAR 2.1x 2.5x Ordinary dividend pence Special dividend pence Total dividend pence year-on-year 85.8% 8.6% * On a comparable weeks basis 21

 Sales m 351 305 318 16,317-29 17,262 2016/17 Net new space Like-for-like Fuel 53rd week 2017/18 * Excludes")
22 Sales 2016/ /18 Like-for-like (ex-vat) H1 H2 FY H1 H2 FY Group: Sales ex-fuel % Sales inc-fuel % Supermarkets * Sales ex-fuel % Number of transactions % Items per basket % (3.9) (5.4) (4.6) (6.2) (3.7) (4.9) Sales m , , /17 Net new space Like-for-like Fuel 53rd week 2017/18 * Excludes Morrisons.com sales through Dordon CFC 22
23 Financial summary m 2017/ /17 Revenue 17,262 16,317 Operating profit Net finance costs (80) (145) Share of profit from joint ventures 2 2 Profit before tax % Underlying profit before tax * % Underlying earnings per share * 12.19p 10.86p Net debt 973 1, m Total dividend 10.09p 5.43p 85.8% * Underlying profit before tax and underlying earnings per share exclude impairment and provisions for onerous contracts, profit/loss on disposal and exit of properties and sale of businesses and investments, the impact of pension volatility, and other items that do not relate to the Group s principal activities on an ongoing basis 23
24 Profit m 2017/ /17 Reported operating profit Reported profit before tax Underlying adjustments: (Profit) / loss on disposals (19) (32) Impairment and provision for onerous contracts (6) (6) Pension scheme set-up credit (13) - Costs associated with the repayment of borrowings Net pension income (9) (8) Other 25 2 Underlying operating profit Underlying profit before tax * % * Underlying profit before tax excludes impairment and provisions for onerous contracts, profit/loss on disposal and exit of properties and sale of businesses and investments, the impact of pension volatility, and other items that do not relate to the Group s principal activities on an ongoing basis 24
25 Incremental 75m - 125m profit A further 24m delivered in the year Two-year total 42m: Lower interest Income from popular and useful services Online losses reducing Wholesale 25
26 Cash flow m 2017/ /17 Cash flow from operations ex-onerous payments 926 1,207 Capital expenditure (500) (419) Tax and interest (136) (129) Onerous payments (42) (94) Purchase of own shares (4) (5) Joint venture dividends 8 8 Proceeds and payments to settle share-based incentive schemes 26 - Dividends (129) (118) Costs incurred on repayment of borrowings (17) (42) Cash flow pre-disposals Proceeds from disposals Cash flow post-disposals Other non-cash movements (19) 21 Opening net debt (1,194) (1,746) Closing net debt (973) (1,194) Free cash flow pre-dividend

 292")

27 Cash flow summary m (636) Change in net debt / / / / /18 Net debt: 2,817m 2,340m 1,746m 1,194m 973m 221 m Free cash flow (before capital returns) * m Free cash flow (before capital returns, disposal proceeds, working capital and onerous payments) / / / /18 Cumulative: 785m 1,639m 2,309m 2,659m * Movement in net debt adjusted for dividends paid 2014/ / / /18 27
28 Balance sheet Sustained working capital benefits Lower net debt, reduced to 973m Net debt : EBITDA 1.1x Lease adjusted net debt : EBITDAR 2.1x Strong debt maturity profile ROCE increased to 7.7% from 7.3% Net pension surplus of 594m 28
29 2018/19 guidance Annualised wholesale supply sales by end-2018 > 700m Net new space sales +0.2% Depreciation 440m to 450m Net finance costs Capital expenditure Net debt Underlying tax rate Onerous capital payments c. 65m c. 500m Lower c.24% c. 60m 29
30 Capital allocation framework Invest in maintaining estate and reducing cost Maintain debt ratios to support investment grade rating Invest for profitable growth Pay dividends in line with stated policy Return surplus capital to shareholders 30
31 The Plan Operational levers to enhance returns Capital structure levers to enhance returns Volume growth Margin Asset intensity Optimise assets Capital return Profit growth Dividend yield Optimise total shareholder return on basis of robust balance sheet 31


32 Appendices 32
33 Sales bridge by channel * m ,536 12, /17** Core Online Other 2017/18 * Excluding fuel ** Including Other sales 33
34 Operating profit 2017/ /17 m % m % Revenue 17,262-16,317 - Gross profit Operating profit Impairment and provisions for onerous contracts (6) (0.0) (6) (0.0) Profit on disposals (19) (0.1) (32) (0.2) Pension scheme set-up credit (13) (0.1) - - Other Underlying operating profit * * Underlying operating profit excludes impairment and provisions for onerous contracts, profit/loss on disposal and exit of properties and sale of businesses and investments and other items that do not relate to the Group s principal activities on an ongoing basis 34
35 Underlying earnings per share (EPS) m 2017/ /17 Underlying profit before tax * Underlying tax charge at 23.8% (2016/17: 25.0%) (89) (84) Underlying profit after tax * Weighted average number of shares (m) 2,339 2,327 Underlying EPS * 12.19p 10.86p Total dividend 10.09p 5.43p * Underlying profit and underlying earnings per share exclude impairment and provisions for onerous contracts, profit/loss on disposal and exit of properties and sale of businesses and investments, the impact of pension volatility and other items that do not relate to the Group s principal activities on an ongoing basis 35
36 Finance costs m 2017/ /17 Interest payable (65) (89) Interest capitalised 1 1 Provisions: unwinding of discount (13) (13) Other finance costs (1) (3) Underlying finance costs (78) (104) Other finance income 5 7 Underlying net finance costs (73) (97) Costs associated with repayment of borrowings (16) (56) Net pension income 9 8 Net finance costs (80) (145) 36
37 Balance sheet m 2017/ /17 Fixed assets and investments 1 7,761 7,761 Working capital 2 (2,045) (2,009) Provisions and tax (792) (767) Net pensions asset Net debt (973) (1,194) Net assets 4,545 4,063 Key metrics: Interest cover 3 6.1x 4.6x Net debt : EBITDA 3 1.1x 1.4x Lease adjusted net debt : EBITDAR 3,4 2.1x 2.5x Gearing 21% 29% ROCE 4 7.7% 7.3% 1 Including goodwill and intangibles, property, plant and equipment, investment property, assets held-for-sale, available-for-sale financial assets and investments in joint venture 2 Stock, debtors and creditors < 1 year 3 Excludes profit/loss on disposals, net pension income, impairment and provision for onerous contracts and other items that do not relate to the Group s principal activities on an ongoing basis 4 Lease costs capitalised on a multiplier of 10x 37


38 Return on capital employed (ROCE) * 10.3% 10.4% 10.4% 9.8% 8.2% 7.3% 7.7% 5.6% 5.3% 2009/ / / / / / / / /18 * 2009/10 to 2015/16 are based on a 14x lease multiplier, 2016/17 onwards based on a 10x multiplier 38
39 Funding maturity profile m 1, RCF Sterling bond Euro bond * * Notional value of facilities 39
40 Supplementary financials 4 February January 2017 Number of shareholders 41,444 42,308 Number of shares in issue (m) 2,356 2,336 Dividend 2017/ / /16 Interim ordinary 1.66p 1.58p 1.50p Final ordinary 4.43p 3.85p 3.50p Special 4.00p - - Total 10.09p 5.43p 5.00p Dividend dates Ex dividend 24 May 2018 Record 25 May 2018 Payment 28 June
41 Financial calendar 2018/19 Date Q1 trading statement 10 May 2018 AGM 14 June 2018 Half year end 5 August 2018 Interim results announcement 13 September 2018 Q3 trading statement 6 November 2018 Christmas trading statement 8 January 2019 Financial year end 3 February

42 42
14 September Interim Results. 26 weeks to 30 July 2017
 14 September 2017 Interim Results 26 weeks to 30 July 2017 Andrew Higginson Chairman 2 David Potts CEO 3 Fix, Rebuild and Grow Fix Stabilise like-for-like Improve capability: People, process and technology
News Release. PRELIMINARY RESULTS FOR THE YEAR ENDED 29 JANUARY 2017 A year of strengthening performance
 News Release Release date: 9 March PRELIMINARY RESULTS FOR THE YEAR ENDED 29 JANUARY A year of strengthening performance Financial summary LFL sales ex-fuel/ex-vat up 1.7%, positive in all four quarters
News Release. INTERIM RESULTS FOR THE HALF YEAR TO 31 JULY 2016 Improving the shopping trip for customers
 News Release Release date: 15 September 2016 INTERIM RESULTS FOR THE HALF YEAR TO 31 JULY 2016 Improving the shopping trip for customers Financial summary Q2 LFL sales ex-fuel/ex-vat up 2.0%, the third
Interim Results. News Release. INTERIM RESULTS FOR THE HALF YEAR TO 5 AUGUST 2018 Accelerating growth
 Regulatory Story Go to market news section Morrison(Wm.)Supermarkets PLC - MRW Released 07:00 13-Sep-2018 Interim Results RNS Number : 6188A Morrison(Wm.)Supermarkets PLC 13 September 2018 Release date:
Food maker and shopkeeper. Wm Morrison Supermarkets PLC Annual report & Financial Statements 2015/16
 i Food maker and shopkeeper Wm Morrison Supermarkets PLC Annual report & Financial Statements /16 Strategic report Chairman s statement 2 Our business model 4 Chief Executive s statement 6 Our six priorities
Preliminary Results 2012/13
 Preliminary Results 2012/13 David Tyler Chairman John Rogers Chief Financial Officer Group performance Highlights Underlying results 2012/13 m 2011/12 m Change % Sales (inc VAT) 25,632 24,511 4.6 Sales
Serving shoppers a little better every day.
 Serving shoppers a little better every day. 3 October 2018 Dave Lewis CEO Alan Stewart CFO Agenda. Half year results Six strategic drivers Creating value for our four key stakeholders 1H results. Group
Preliminary Results. and Strategic Business Review. 53 weeks to 4 February March 2007
 Preliminary Results 53 weeks to 4 February 2007 and Strategic Business Review 15 March 2007 Sir Ken Morrison CBE Chairman Reading Agenda 2 Introduction Sir Ken Morrison Key features 2006/7 Marc Bolland
Interim Results 2008/09 26 weeks to 3 August September 2008
 Interim Results 2008/09 26 weeks to 3 August 2008 11 September 2008 Sir Ian Gibson Chairman Richard Pennycook Group Finance Director Financial summary 4 H1 m 08/09 07/08 ** Turnover 7,105 6,259 Operating
Preliminary Results 52 weeks to 3 February March Sir Ken Morrison CBE Chairman. Bristol - Harcliffe
 Preliminary Results 52 weeks to 3 February 2008 13 March 2008 1 Sir Ken Morrison CBE Chairman Bristol - Harcliffe Agenda 2 Introduction Sir Ken Morrison Financial review & balance sheet Richard Pennycook
13 April 2016 Serving Britain's shoppers a little better every day Dave Lewis CEO, Alan Stewart CFO
 13 April 2016 Serving Britain's shoppers a little better every day Dave Lewis CEO, Alan Stewart CFO Agenda Significant progress Detailed results The next step Broad-based improvement Improving like-for-like
Consolidated statement of comprehensive income 52 weeks ended 1 February 2015
 Wm Morrison Supermarkets PLC Annual report and financial statements /15 71 Consolidated statement of comprehensive income 52 weeks ended 1 February Revenue 1.2 16,816 17,680 Cost of sales (16,055) (16,606)
Profit recovery continues.
 Financial review Profit recovery continues. This was a strong performance for Tesco where we delivered results ahead of expectations. Alan Stewart Chief Financial Officer Visit www.tescoplc.com/ar2017
Interim Results FY18 28 th November 2017
 Interim Results FY18 28 th November 2017 Forward looking statements Forward-Looking Statements INCLUDED IN THIS PRESENTATION ARE FORWARD-LOOKING MANAGEMENT COMMENTS AND OTHER STATEMENTS THAT REFLECT MANAGEMENT
McColl s Retail Group plc
 McColl s Retail Group plc Interim Results 26 Weeks to 28 May 2017 Important notice This presentation has been prepared by McColl s Retail Group plc (the Company ) in connection with the publication of
Interim Results 26 weeks ended 29 December 2018
 Contents 2 Headlines H1 Review H2 Outlook CEO Review Summary Headlines 3 Financial Performance Trading Overview Strategy Like for Like sales down -4% Five new openings in H1 FY19 are performing well Sixth
Debt Investor Call. 11 April Alan Stewart CFO Lynda Heywood Group Treasurer
 Debt Investor Call. 11 April 2018 Alan Stewart CFO Lynda Heywood Group Treasurer FY results. A year of progress +2.3% +28.4% +21.7% 49.9bn 51.0bn 1,280 m 1,644 m 2,279 m 2,773m FY 16/17 FY 17/18 FY 16/17
RESULTS For the year ended 30 September 2011
 RESULTS For the year ended 30 September 2011 AGENDA Highlights Patrick Coveney, CEO Financial Review Alan Williams, CFO Operating Review & Strategy Patrick Coveney, CEO Outlook Patrick Coveney, CEO Q &
Becoming the best pet care business in the world. Strategic update and interim financial results FY19
 Becoming the best pet care business in the world Strategic update and interim financial results FY19 Interim Results FY19 2 Today s presentation Group strategic update and vet business review Financial
Debt Investor Update 16/17 Results. 12 April 2017 Alan Stewart CFO Lynda Heywood Group Treasurer
 Debt Investor Update 16/17 Results 12 April 2017 Alan Stewart CFO Lynda Heywood Group Treasurer A year of strong performance +4.3% +30% +9.1% 47.9bn 49.9bn 985m 1,280m 2.1bn 2.3bn FY 15/16 FY 16/17 FY
Interim results 6 months ended 31 July September 2018
 Interim results 6 months ended 31 July 2018 25 September 2018 1 Forward-looking statements This presentation contains certain forward-looking statements with respect to the financial condition, results
McColl s Retail Group plc At the heart of your neighbourhood
 McColl s Retail Group plc At the heart of your neighbourhood Preliminary Results 53 weeks to 30 November 2014 IMPORTANT NOTICE This presentation has been prepared by McColl's Retail Group plc (the "Company")
Interim Results For 6 months ended 31 Dec February 2018
 Interim Results For 6 months ended 31 Dec 2017 February 2018 Financial highlights 62.5m 55.7m 71.7m 13.7m 10.8m 15.8m 8.8m 11.2m 12.9m 16 17 18 16 17 18 16 17 18 REVENUE 71.7m (H1 FY17: 62.5m) +14.7% YEAR-ON-YEAR
Forward-looking statements
 Forward-looking statements This presentation contains certain forward-looking statements with respect to the financial condition, results of operations, and businesses of Card Factory plc. These statements
OCADO GROUP PLC. Half year results for the 26 weeks ended 28 May 2017
 OCADO GROUP PLC Half year results for the 26 weeks ended 28 May 2017 5 July 2017 Ocado delivers further growth in customer numbers, orders and revenues Continued investment in platform for licencing to
FY17 Results. 25 September 2017
 FY17 Results 25 September 2017 Forward Looking Statement This document contains forward looking statements, which reflect management s current views and estimates. The forward looking statements involve
7 October 2015 SERVING BRITAIN S SHOPPERS A LITTLE BETTER EVERY DAY Dave Lewis CEO, Alan Stewart CFO
 7 October 2015 SERVING BRITAIN S SHOPPERS A LITTLE BETTER EVERY DAY Dave Lewis CEO, Alan Stewart CFO Agenda One year on Detailed results Three key priorities Outlook Sales improving UK Asia Europe (4.8)%
PRODUCE INVESTMENTS PLC INTERIM RESULTS for the six months ended 31 December 2017
 22 March 2018 PRODUCE INVESTMENTS PLC INTERIM RESULTS for the six months ended 31 December A strong uplift in Group profitability but a cautious start to the second half Produce Investments plc, (AIM:PIL)
Interim Results. 3 October 2012
 Interim Results 3 October 2012 Philip Clarke Group Chief Executive Decisive actions taken Started journey to improve the shopping trip in the UK Reduced our level of new space growth in the UK, given more
Adjusted earnings per share were 54.1p (2016: 58.8p). Statutory results. Underlying. growth
. Statutory results. Underlying. growth") 34 Pearson plc Annual report and accounts We expect ongoing headwinds in our US higher education courseware business to be offset by improving conditions in our other businesses. Coram Williams Chief Financial
34 Pearson plc Annual report and accounts We expect ongoing headwinds in our US higher education courseware business to be offset by improving conditions in our other businesses. Coram Williams Chief Financial
Interim Results. 17 October 2013
 Interim Results 17 October 2013 Highlights Financial Highlights Total sales 2.2bn, +16.5% Booker like-for-like sales +2.3%, tobacco sales -2.2% and non tobacco sales +5.0% Operating profit (pre 7.0m exceptional
Debt Investor Call. 3 October Alan Stewart CFO Lynda Heywood Group Treasurer
 Debt Investor Call. 3 October 2018 Alan Stewart CFO Lynda Heywood Group Treasurer 1H results. Group performance +12.8% +24.4% (1.4)% 28.3bn 750m 933m 1,139m 1,123m 25.2bn 1H 17/18 1H 18/19 1H 17/18 1H
For personal use only. JB Hi-Fi Limited. HY17 Results Presentation
 JB Hi-Fi Limited HY7 Results Presentation 3 5 FEBRUARY AUGUST 06 07 PAGE Agenda. Group Performance Overview. JB HI-FI 3. The Good Guys 4. Stores 5. Group Balance Sheet and Cash Flow 6. Outlook Richard
2018 Full Year Results 20 November 2018
 2018 Full Year Results 20 November 2018 Disclaimer Certain information included in the following presentation is forward looking and involves risks, assumptions and uncertainties that could cause actual
Continued improvement in customer metrics driving EBIT and NPAT growth
 23 February 2018 HALF-YEAR PROFIT AND DIVIDEND ANNOUNCEMENT FOR THE 27 WEEKS ENDED 31 DECEMBER 2017 Continued improvement in customer metrics driving EBIT and NPAT growth Solid sales improvement across
PRELIMINARY RESULTS PRESENTATION YEAR ENDED 31 DECEMBER 2017
 PRELIMINARY RESULTS PRESENTATION YEAR ENDED 31 DECEMBER 2017 DISCLAIMER The information contained in this presentation has not been independently verified and this presentation contains various forward-looking
CONTINUED STRATEGIC PROGRESS DESPITE SIGNIFICANT H1 HEADWINDS SUPPLY ARRANGEMENTS IN FINAL STAGES OF TRANSITION
 23 July 2018 convenience retailer McColl s Retail Group plc ( McColl s or the Group ) today announces its Interim Results for the 26 week period ended 27 May 2018. CONTINUED STRATEGIC PROGRESS DESPITE
Halfords Group plc. J.P. Morgan London Small/Mid Cap Conference 2017
 Halfords Group plc J.P. Morgan London Small/Mid Cap Conference 2017 Highlights Introduction to Halfords and key markets Page 3 Moving Up A Gear strategy Page 12 Financial Guidance Page 25 FY17 Financial
Notes to the Group Financial Statements
 Notes to the Group Financial Statements 1. Exchange rates The results of operations have been translated into US dollars at the average rates of exchange for the year. In the case of sterling, the translation
Preliminary Results FY17
 Preliminary Results FY17 25 th May 2017 Forward looking statements Forward-Looking Statements INCLUDED IN THIS PRESENTATION ARE FORWARD-LOOKING MANAGEMENT COMMENTS AND OTHER STATEMENTS THAT REFLECT MANAGEMENT
Preliminary Results. 18 October 2016
 Preliminary Results 18 October 2016 Highlights Mark Cashmore Group Chief Executive Highlights Solid Group performance in line with expectations Total revenue 1,907m +1.7% Adjusted PBT 60.7m +7.4% Adjusted
TVL FINANCE PLC PERIOD ENDED 28 MARCH 2018 REPORT TO NOTEHOLDERS 232,000, % SENIOR SECURED NOTES DUE 2023
 TVL FINANCE PLC PERIOD ENDED 28 MARCH 2018 REPORT TO NOTEHOLDERS 232,000,000 8.5% SENIOR SECURED NOTES DUE 2023 195,000,000 SENIOR SECURED FLOATING RATE NOTES DUE 2023 (the Notes ) CONTENTS Highlights
INTERIM RESULTS. Interim Results.
 INTERIM RESULTS. RESULTS. 2017 Interim Results. Results. 2017 1 Agenda Chairman s introduction Financial review Operational update Plumbing & Heating transformation Robert Walker Alan Williams John Carter
9 May Half Year Results
 9 May 2018 2018 Half Year Results Disclaimer Certain information included in the following presentation is forward looking and involves risks, assumptions and uncertainties that could cause actual results
Chief Financial Officer s Report Jonny Mason
 Chief Financial Officer s Report Jonny Mason Financial Resources Generating returns for our stakeholders through effective management of our financial resources. Group revenue in, at 1,135.1m, was up 3.7%
Financial Review. Strategic Report - Performance. Table 1: Performance Metrics
 58 Financial Review Despite the challenge of a mild winter, the Group had a good year with revenue increasing by 6.2%, operating profits increasing 11.5%, adjusted earnings per share increasing by 11.7%,
FIVE YEAR SUMMARY PROFIT OR LOSS. Sales. Earnings/(Loss) before interest and tax (EBIT/LBIT) EBIT/(LBIT) to Sales
 before interest and tax (EBIT/LBIT) EBIT/(LBIT) to Sales") PROFIT OR LOSS Sales 53 WEEKS Australian Food 1 36,370.9 34,798.0 34,880.5 - - Petrol 3 - - 5,632.0 7,065.2 6,793.9 Australian Food Petrol - - 40,512.5 - - Endeavour Drinks Group 1 7,912.9 7,589.3 7,251.2
PROFIT OR LOSS Sales 53 WEEKS Australian Food 1 36,370.9 34,798.0 34,880.5 - - Petrol 3 - - 5,632.0 7,065.2 6,793.9 Australian Food Petrol - - 40,512.5 - - Endeavour Drinks Group 1 7,912.9 7,589.3 7,251.2
FIRST HALF HIGHLIGHTS
 FIRST HALF HIGHLIGHTS Revenue at 54.6m (2006: 54.6m) Pre-exceptional gross margin at 69.9% (2006: 70.9%) Exceptional items cost reduction programme (0.6)m (2006: nil) Pre-exceptional operating profit up
Interim Results Presentation. Six months ended 30 June 2017
 Interim Results Presentation Six months ended 30 June 2017 Highlights Results for six months ended 30 June 2017 2 Solid first half positions Group well for second half > Solid underlying trading performance
For personal use only. JB Hi-Fi Limited. HY18 Results Presentation
 JB Hi-Fi Limited HY8 Results Presentation 5 FEBRUARY AUGUST 06 08 PAGE Agenda. Group Performance Overview. JB HI-FI 3. The Good Guys 4. Group Balance Sheet and Cash Flow 5. Outlook Richard Murray Group
nemo2014\presentations\analyst Presentation Jan14\ Nemo Analyst Presentation Master-22nd Jan FINAL.pptx
 Interim Results FY17 24 th November 2016 Forward looking statements Forward-Looking Statements INCLUDED IN THIS PRESENTATION ARE FORWARD-LOOKING MANAGEMENT COMMENTS AND OTHER STATEMENTS THAT REFLECT MANAGEMENT
TVL FINANCE PLC PERIOD ENDED 27 JUNE 2018 REPORT TO NOTEHOLDERS 232,000, % SENIOR SECURED NOTES DUE 2023
 TVL FINANCE PLC PERIOD ENDED 27 JUNE 2018 REPORT TO NOTEHOLDERS 232,000,000 8.5% SENIOR SECURED NOTES DUE 2023 195,000,000 SENIOR SECURED FLOATING RATE NOTES DUE 2023 (the Notes ) CONTENTS Highlights 2
Preliminary Results 52 Weeks to 30 March Merrill Lynch - Auditorium. 7 June 2007
 Preliminary Results 52 Weeks to 30 March 2007 Merrill Lynch - Auditorium 7 June 2007 Nick Wharton Finance Director Financial Highlights Sales 744.0m (2006: 681.7m) Operating profit 93.5m (2006: 89.1m)
TRAVIS PERKINS PLC RESULTS FOR THE YEAR ENDED 31 DECEMBER 2011
 TRAVIS PERKINS PLC RESULTS FOR THE YEAR ENDED 31 DECEMBER 2011 CONTINUED ROBUST PERFORMANCE ON MARKET SHARE GAINS, MARGINS, EARNINGS AND CASH GENERATION FINANCIAL HIGHLIGHTS DIVIDEND UP 33% Group revenue
VOUGEOT BIDCO PLC QUARTERLY REPORT TO NOTEHOLDERS 300,000, % SENIOR SECURED NOTES DUE 2020
 VOUGEOT BIDCO PLC QUARTERLY REPORT TO NOTEHOLDERS 300,000,000 7.875% SENIOR SECURED NOTES DUE 2020 290,000,000 SENIOR SECURED FLOATING RATE NOTES DUE 2020 (the Notes ) Q4 2013 PERIOD ENDED 28 NOVEMBER
This announcement contains inside information
 This announcement contains inside information OCADO GROUP PLC Ocado, working at pace to capitalise on unprecedented opportunities Interim results for the 3rd June 2018 10 July 2018 Financial and statutory
RESULTS FOR ANNOUNCEMENT TO THE MARKET
 Friday, 21 August 2015 RESULTS FOR ANNOUNCEMENT TO THE MARKET In accordance with the listing rules, please find attached the following documents relating to ERM Power s results for the 12 months ended
Performance review. This section provides detailed information on our financial and non-financial performance over the past year.
 review IN THIS SECTION 29 33 This section provides detailed information on our financial and non-financial performance over the past year. In, you will find sections covering Group performance, Group financial
Moving from turnaround to transformation
 23 August 2017 FINAL PROFIT AND DIVIDEND ANNOUNCEMENT FOR THE 52 WEEKS ENDED 25 JUNE 2017 Solid progress on key priorities: Moving from turnaround to transformation NPAT from continuing operations of $1,422.1
Sir Ian Gibson - Chairman. Introduction
 Sir Ian Gibson - Chairman Introduction Overview Sales growth ahead of the market Underlying profits up 13% Underlying earnings per share up 12% Total dividend up 17% to 9.6p Balance sheet strategy implemented
MCLS. McColl s Retail Group. Preview note. A super market investment. 7 th December 2015
 McColl s Retail Group 7 th December 2015 A super market investment McColl s is the second largest multiple convenience store business in the UK and the largest independent operator of Post Offices. Its
Título Subtítulo 1 ST QUARTER CONSOLIDATED REPORT Non Audited
 Título Subtítulo 1 ST QUARTER CONSOLIDATED REPORT 2012 Non Audited 1 st Quarter 12 Index I Consolidated Management Report Message from the CEO Pedro Soares dos Santos 3 1. Introduction 3 2. Sales Analysis
Annual General Meeting 20 May Local at Heart, Global by Nature
 Annual General Meeting 20 May 2015 Local at Heart, Global by Nature Forward-Looking Statement Any forward-looking statements made in this presentation have been made in good faith based on the information
FIVE YEAR SUMMARY PROFIT OR LOSS. Sales 1. Earnings/(Loss) before interest and tax (EBIT/LBIT) EBIT/(LBIT) to Sales 1 52 WEEKS $M
 before interest and tax (EBIT/LBIT) EBIT/(LBIT) to Sales 1 52 WEEKS $M") PROFIT OR LOSS Sales 1 Australian Food 2 37,379 35,836 34,347 34,446 Petrol 4 5,601 7,035 Australian Food and Petrol 2,4 40,047 Endeavour Drinks Group 2 8,271 7,913 7,589 7,251 Australian Food and Endeavour
PROFIT OR LOSS Sales 1 Australian Food 2 37,379 35,836 34,347 34,446 Petrol 4 5,601 7,035 Australian Food and Petrol 2,4 40,047 Endeavour Drinks Group 2 8,271 7,913 7,589 7,251 Australian Food and Endeavour
METCASH. FY16 Half Year Results - 30 November 2015
 METCASH FY16 Half Year Results - 30 November 2015 GROUP UPDATE IAN MORRICE GROUP CHIEF EXECUTIVE OFFICER Group update positive momentum continues Group revenue up 1.4% to $6.6b MF&G revenue up 0.7%, continued
Ocado, creating future value now
 OCADO GROUP PLC Ocado, creating future value now Preliminary results for the 52 weeks ended 2 December 2018 5 February 2019 Financial and statutory highlights FY 2018 (52 weeks) FY 2017 restated (52 weeks)
ODEON & UCI CINEMAS GROUP Odeon & UCI Finco plc. Financial Results 2014 Q2
 ODEON & UCI CINEMAS GROUP Odeon & UCI Finco plc Financial Results 2014 Q2 Contents Page Summary 3 Operating and Financial Review 4 Outlook 6 Unaudited Condensed Consolidated Financial Statements: Profit
ICAP plc Annual Report 2016 FINANCIAL STATEMENTS. Strategic report. Page number
 FINANCIAL STATEMENTS ICAP plc Annual Report 77 Strategic report Page number Consolidated income statement 78 Consolidated statement of comprehensive income 80 Consolidated and Company balance sheet 81
Interim Results 12 October 2017
 Interim Results 12 October 2017 HIGHLIGHTS Financial Highlights Total sales 2.6bn, +2.5%, non tobacco up +7.5% and tobacco down 9.0% due to changes in legislation Like-for-like sales¹ +2.7%, non tobacco
Fevertree Drinks plc ("Fever-Tree") Preliminary Results
 Preliminary Results") 14 th March 2016 Fevertree Drinks plc ("Fever-Tree") Preliminary Results Fever-Tree, the world's leading supplier of premium carbonated mixers, today announces its Preliminary Results for the year ended
14 th March 2016 Fevertree Drinks plc ("Fever-Tree") Preliminary Results Fever-Tree, the world's leading supplier of premium carbonated mixers, today announces its Preliminary Results for the year ended
GROUP PROFIT AND LOSS ACCOUNT
 GROUP PROFIT AND LOSS ACCOUNT Continuing Continuing activities Goodwill activities before goodwill Amortisation before Operating Unaudited amortisation & operating Audited operating exceptional Total &
Financial Results Presentation. For the 39 weeks ended 26 September 2018
 Financial Results Presentation For the 39 weeks ended 26 September 2018 Release: 20 November 2018 Disclaimer You must read the following before continuing This presentation has been prepared by Thame and
TVL FINANCE PLC PERIOD ENDED 26 SEPTEMBER 2018 REPORT TO NOTEHOLDERS 232,000, % SENIOR SECURED NOTES DUE 2023
 TVL FINANCE PLC PERIOD ENDED 26 SEPTEMBER 2018 REPORT TO NOTEHOLDERS 232,000,000 8.5% SENIOR SECURED NOTES DUE 2023 195,000,000 SENIOR SECURED FLOATING RATE NOTES DUE 2023 (the Notes ) CONTENTS Highlights
TWELVE MONTHS END 31 MARCH 2018 MARCO GOBBETTI
 TWELVE MONTHS END 31 MARCH 2018 MARCO GOBBETTI CHIEF EXECUTIVE OFFICER 1 AGENDA INTRODUCTION FINANCIAL RESULTS GUIDANCE STRATEGIC UPDATE Q&A FY 2018 HIGHLIGHTS Results in line with our expectations Group
GEO re-establishes growth momentum
 NZX and Media Release 28 August 2018 Summary UNAUDITED FINANCIAL RESULTS FOR THE YEAR TO 30 JUNE 2018 GEO re-establishes growth momentum Strong revenue growth re-established from March 2018, with June
Fevertree Drinks plc ( Fever-Tree ) Preliminary Results
 Preliminary Results") 23 rd March 2015 Fevertree Drinks plc ( Fever-Tree ) Preliminary Results Fever-Tree, the world s leading supplier of premium carbonated mixers for alcoholic spirits by retail sales value, today announces
23 rd March 2015 Fevertree Drinks plc ( Fever-Tree ) Preliminary Results Fever-Tree, the world s leading supplier of premium carbonated mixers for alcoholic spirits by retail sales value, today announces
financial summary New Clicks Holdings interim group results for the six months ended 28 February 2007
 contents 1 Financial summary 2 Commentary 4 Consolidated balance sheet 5 Consolidated income statement 6 Consolidated changes in equity statement 8 Consolidated cash flow statement 10 Operational segmental
Group results 2014/15 (on a continuing operations basis) On a continuing operations basis 2014/15
 On a continuing operations basis 2014/15") Financial review The reported year has been both an extremely challenging year for Tesco and a year in which we began a process of considerable change. Against this backdrop we delivered sales of 70bn
Financial review The reported year has been both an extremely challenging year for Tesco and a year in which we began a process of considerable change. Against this backdrop we delivered sales of 70bn
A year of business improvement; transformation on track
 20 August 2018 FINAL PROFIT AND DIVIDEND ANNOUNCEMENT FOR THE 52 WEEKS ENDED 24 JUNE 2018 A year of business improvement; transformation on track Group sales from continuing operations up 3.4% Group EBIT
For personal use only
 DWS Limited 2018 Full Year Results Presentation Contents Introduction Danny Wallis (CEO) / Stuart Whipp (CFO) Results Highlights Full Year Results Capital Management Operations Update Summary and Outlook
This announcement contains inside information OCADO GROUP PLC. Ocado, preparing to take advantage of important new growth opportunities
 This announcement contains inside information OCADO GROUP PLC Ocado, preparing to take advantage of important new growth opportunities Preliminary results for the 53 weeks ended 3 December 2017 6 February
Ten Entertainment Group plc Interim Results Presentation 26 weeks to 2 July September 2017
 Ten Entertainment Group plc Interim Results Presentation 26 weeks to 2 July 2017 13 September 2017 Disclaimer The following presentation in relation to Ten Entertainment Group plc and its subsidiaries
Centrica plc Interim Results. for the period ended 30 June 2017
 Centrica plc Interim Results for the period ended 30 June 2017 Disclaimer This presentation does not constitute an invitation to underwrite, subscribe for, or otherwise acquire or dispose of any Centrica
Half year results 30 September 2017
 Half year results 30 September November Russell Down, Chief Executive Chris Morgan, Group Finance Director Strong first half performance Revenue (excluding disposals) 183.2m 6.9% HY17: 171.4m EBITDA* 33.8m
Half Year Results. for the six months ended 30 November January Chairman Chris Stone CEO Adam Palser CFO Brian Tenner
 Half Year Results for the six months ended 30 November 2017 16 January 2018 Chairman Chris Stone CEO Adam Palser CFO Brian Tenner Agenda Overview and strategy update Financial highlights Financial performance
RESULTS UNDERPINNED BY TIGHT COST MANAGEMENT
 Financial review RESULTS UNDERPINNED BY TIGHT COST MANAGEMENT SEGMENTAL PERFORMANCE The financial statements for the period ended included 53 weeks. In the notes that follow, all comparative income statement
2018 Interim Results 30 August 2018
 2018 Interim Results 30 August 2018 Disclaimer Statements in this presentation with respect to each of Total Produce s and Dole Food Company's ("Dole") business, strategies, projected financial figures,
Income Statement + 3.5% + 6.7% + 7.1% EPS 187.1p 173.3p + 8.0% Ordinary interim dividend 53.0p 50.0p + 6.0% Full Price
 Income Statement m July 2015 July 2014 Total sales 1,907 1,856 Operating profit 362 339 Interest (15) (15) Profit before tax 347 324 Taxation (70) (66) Profit after tax 277 258 + 2.7% + 6.7% + 7.1% EPS
GAINING MOMENTUM, WITH SUCCESSFUL INTEGRATION OF NEW CONVENIENCE STORES AND STRONG SALES GROWTH
 24 July 2017 McColl s Retail Group plc, one of the UK s leading convenience retailers, ( McColl s or the Group ) today announces its Interim Results for the 26 week period ended 28 May 2017. GAINING MOMENTUM,
Half year financial report. January June 2017
 Half year financial report January June 2017 Key figures 4-6/2017 4-6/2016 Change% 1-6/2017 1-6/2016 Change% 1-12/2016 Revenue, MEUR 196.0 192.4 1.9% 352.6 350.6 0.6% 775.8 Like-for-like revenue development,
Wm Morrison Supermarkets plc. Interim Report 2005/06
 Wm Morrison Supermarkets plc Interim Report 2005/06 Financial Highlights Wm Morrison Supermarkets plc Interim results and trading update 25 weeks to 24 July 2005 Commenting on the results, Sir Ken Morrison,
H1 16 interim results. 22 September 2015
 H1 16 interim results 22 September 2015 Important notice 2 This presentation may include certain forward-looking statements, beliefs or opinions, including statements with respect to the Company s business,
Financial Statements
 Financial Statements Financial statements Consolidated income statement Note Trading Acquisition and disposal costs Exceptional items Revenue 1 1,276 1,276 Operating expenses 3 (1,026) (59) (75) (1,160)
HALF YEAR RESULTS for the six months ended 2 January 2010
 HALF YEAR RESULTS for the six months ended 2 January 2010 Legal disclaimer Certain statements included in this presentation contain forward-looking information concerning the Group s strategy, operations,
Thai Beverage Public Company Limited
 Thai Beverage Public Company Limited Financial Statements For The Three-Month Period Ended 31 December 2017. PART I INFORMATION REQUIRED FOR THE THREE-MONTH PERIOD ENDED 31 DECEMBER (Q1) ANNOUNCEMENTS.
Bank and Bondholder presentation
 Bank and Bondholder presentation 19 September 2013 0 Geopost, Enfield Agenda Welcome and strategic overview (David Sleath, CEO) Operational and financial performance (Justin Read, Group Finance Director)
INTERIM RESULTS PRESENTATION SIX MONTHS TO 30 JUNE 2018
 INTERIM RESULTS PRESENTATION SIX MONTHS TO 30 JUNE 2018 DISCLAIMER The information contained in this presentation has not been independently verified and this presentation contains various forward-looking
KCOM Group PLC Interim Results Presentation 2018/ November 2018
 KCOM Group PLC Interim Results Presentation 2018/19 27 November 2018 Business update Graham Sutherland Chief Executive Initial impressions HEY full-fibre investment leads the market, protects cash generation
TVL FINANCE PLC FY 2017 PERIOD ENDED 28 JUNE 2017 REPORT TO NOTEHOLDERS 261,000, % SENIOR SECURED NOTES DUE 2023
 TVL FINANCE PLC FY 2017 PERIOD ENDED 28 JUNE 2017 REPORT TO NOTEHOLDERS 261,000,000 8.5% SENIOR SECURED NOTES DUE 2023 165,000,000 SENIOR SECURED FLOATING RATE NOTES DUE 2023 (the Notes ) CONTENTS Highlights
WH Smith PLC Preliminary Results October 2018
 Disclaimer This document contains forward-looking statements with respect to the operations, performance and financial condition of WH Smith PLC. By their nature, these statements are subject to risks,