financial summary New Clicks Holdings interim group results for the six months ended 28 February 2007
|
|
|
- Tamsyn Skinner
- 5 years ago
- Views:
Transcription


1
2 contents 1 Financial summary 2 Commentary 4 Consolidated balance sheet 5 Consolidated income statement 6 Consolidated changes in equity statement 8 Consolidated cash flow statement 10 Operational segmental balance sheet 12 Operational segmental income statement 14 Trading segmental analysis 16 Definitions 16 Contact details 17 Presentation
3 financial summary 01 Six months to Six months to Year to 28 February 28 February 31 August Income Statement Turnover R Gross profit R Headline earnings R Balance Sheet Ordinary shareholders interest R Interest-bearing loans and borrowings R Total assets R Cash Flow Net cash inflow/(outflow) from operating activities before distributions R ( ) Net interest paid R Capital expenditure R Depreciation and amortisation R Performance Turnover growth % Comparable stores turnover growth % Gross profit growth % Gross profit margin % Operating profit margin % Inventory turn times Return on total assets % Return on shareholders interest % Interest-bearing debt to shareholders interest at period end % Interest-bearing debt, including cash, to shareholders interest at period end % Statistics Number of permanent employees Number of stores company owned franchised Weighted retail trading area company owned m Share Statistics Headline earnings per share undiluted cents diluted cents Distribution per share proposed/paid June/July cents paid December cents 22.0 Distribution cover times Net asset value per share cents Net tangible asset value per share cents Share price closing cents high cents low cents Number of shares in issue (gross) Number of shares in issue (net of treasury shares) Weighted average number of shares in issue (net of treasury shares) Weighted average diluted number of shares in issue (net of treasury shares) Market capitalisation (gross) R Market capitalisation (net of treasury shares) R
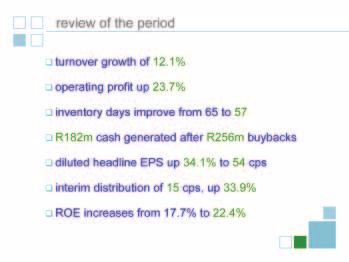
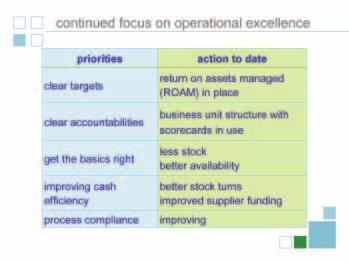
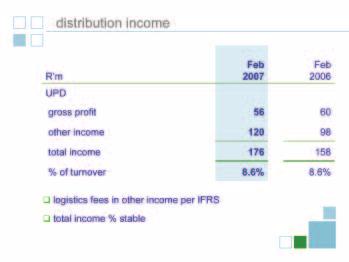
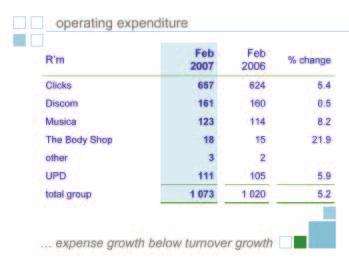
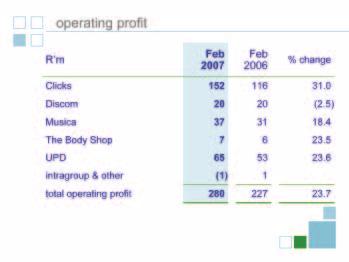
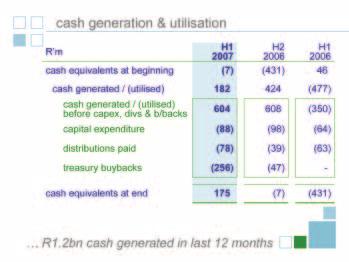
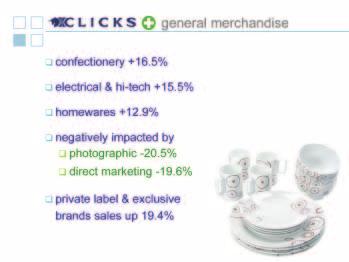
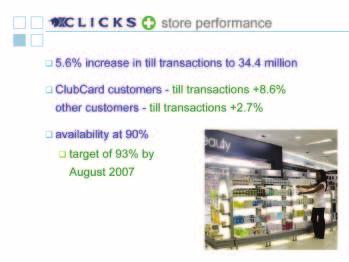
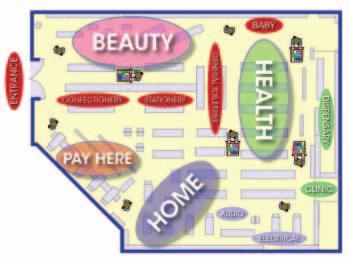
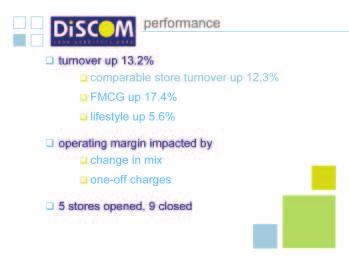
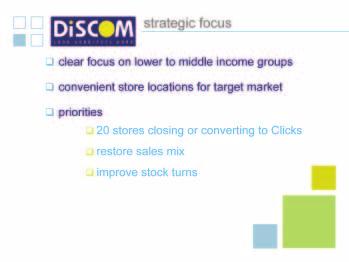
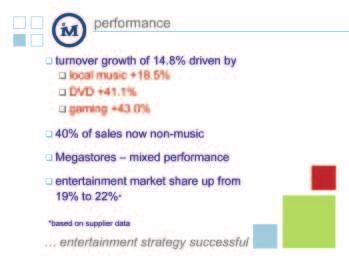
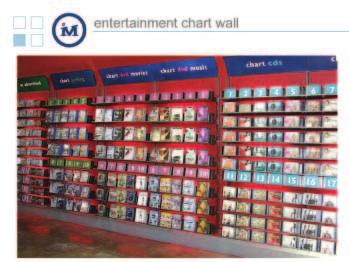
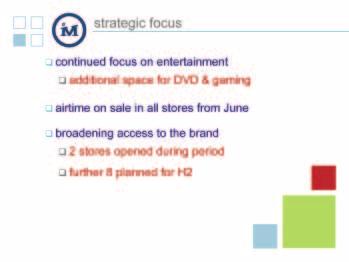
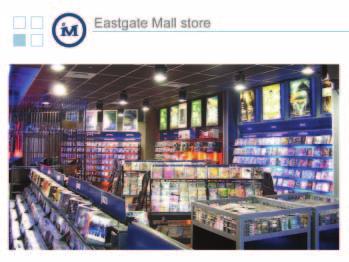
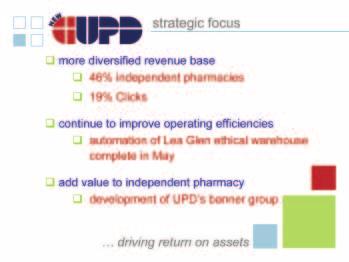
4 commentary 02 Introduction New Clicks has made marked progress over the past six months in its turnaround strategy to achieve sustainable performance, while at the same time investing in the growth of the business to ensure long-term competitiveness and shareholder value creation. The group has produced a much improved operational and financial performance, with progress in certain areas being ahead of the objectives set by the board at the outset of the turnaround programme in early Financial performance Group turnover increased by 12.1% to R5.6 billion, with weighted inflation measured at 1.0% for the period. Turnover for the retail businesses grew 14.2% and by 14.1% on a comparable store basis, against price inflation of 1.2%. UPD increased turnover by 11.3% with inflation at 0.5%. Retail gross margin was impacted by one-off charges and declined by 130 basis points to 26.8%. The underlying trading gross margins, including shrinkage, are stable and management expects the retail margin for the full year to be in line with last year s 27.1%. UPD s total income, which comprises gross profit and other income (largely comprising logistics fees), was maintained at 8.6% of turnover for the period. Operating expenses were well managed and growth was contained at 5.2%, well below the level of turnover growth. As a consequence of both the increased turnover and tight expense control, operating profit increased by 23.7%. Group operating margin increased from 4.5% to 5.0%. Headline earnings increased by 34.4% to R187.5 million. Diluted headline earnings per share increased by 34.1% to 53.9 cents per share, in line with the forecast range provided in the group s trading statement on 12 April The intense focus on working capital management has paid dividends. Inventory levels declined 0.8% over the corresponding period in 2006 and the days cost of sales in inventory improved from 65 to 57 days. The group generated cash from operating activities of R532 million for the period and utilised R256 million to repurchase shares, R88 million for capital expenditure and R78 million for the payment of the 2006 final distribution to shareholders. A total of 22.2 million shares, representing 6.2% of the issued share capital, were repurchased in the market at an average price of R11.52 per share. At 28 February 2007 the group s cash and cash equivalents were R175 million, compared to a deficit of R431 million at the end of the first half of The group has adopted return on assets managed (ROAM) as one of the key performance measurements for its component businesses. ROAM improved from 15.7% in February 2006 to 18.5% in February The group s return on equity (ROE) increased from 17.7% to 22.4%. Trading performance Retail Clicks lifted turnover by 14.1% as the transition of the business to a health and beauty specialist continued, with the core categories of health growing 19.8% and beauty 17.0%. Comparable store growth was 14.7% and inflation for the period was 1.9%. Improved operating efficiencies contributed to a 31.0% growth in operating profit to R152 million. Clicks opened a further 14 pharmacies in the past six months and now has 124 dispensaries nationwide. Discom has continued to refine its focus on the lower income market and increased turnover by 13.2% and by 12.3% on a like-for-like basis. Inflation for the period was 1.0%. The operating margin was impacted by a change in the product mix and certain oneoff charges, which resulted in a 2.5% decline in operating profit to R20 million. Strong DVD, gaming and local music sales lifted Musica s turnover by 14.8%, with same-store growth at 11.7%. The business experienced price deflation of 2.6% for the period. Non-music merchandise contributed 40% of turnover. Operating profit rose 18.4% to R37 million.
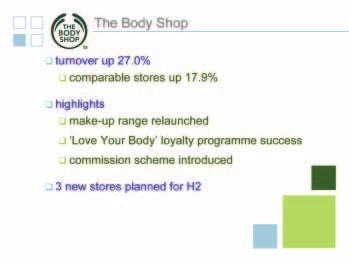
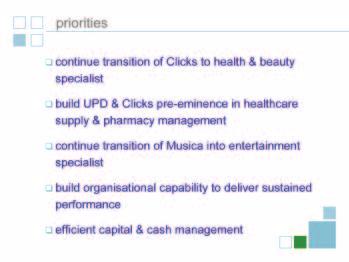
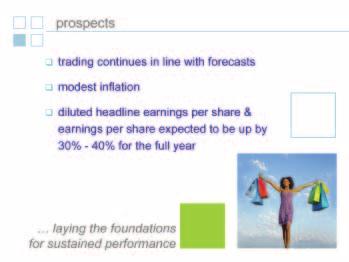
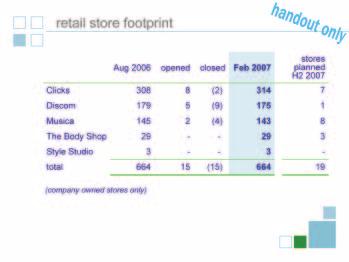
5 03 Turnover up 12.1% Operating profit up 23.7% Diluted headline EPS up 34.1% Return on equity 22.4% The Body Shop increased turnover by 27.0%, driven by the success of the new in-store loyalty programme and the relaunched make-up range. Comparable store sales grew 17.9%. Operating profit for the period increased 23.5% to R7 million. The group continues to capitalise on opportunities to expand its store footprint and opened 15 stores in the first half of the year, with a further 19 planned for the balance of the financial year. Wholesale distribution UPD increased turnover by 11.3%, in line with management s expectations. Expenses were well managed to 5.4% of turnover, which contributed to a 23.6% growth in operating profit to R65 million. In order to further improve operating efficiencies, UPD has invested R45 million in the automation of the ethical warehouse at its head office in Gauteng which will be completed at the end of May. Prospects As the group continues to focus on delivering sustainable performance, management s priorities are to entrench Clicks as a health and beauty specialist, establish leadership in healthcare supply and pharmacy management, and transform Musica into an entertainment specialist. Financial management is being enhanced through tight expense control, increased cash flow generation and by optimising the balance sheet structure to achieve an ROE of 30% in the medium term. Trading since the end of February has been in line with forecasts. Modest levels of price inflation are expected for the remainder of the financial year. Earnings forecast In the absence of any deterioration in trading conditions or any other unforeseen factors, the directors expect the group s diluted headline earnings per share and diluted earnings per share for the year to 31 August 2007 to be between 30% and 40% higher than the last financial year. Shareholders are advised that these forecasts have not been reviewed or reported on by the group s auditors. Distribution The board of directors has approved an interim distribution of 15.0 cents per share (2006: 11.2 cents), comprising a cash dividend of 3.4 cents per share and a distribution out of share premium of 11.6 cents per share in lieu of a dividend (collectively the distribution ). Shareholders are advised of the following salient dates relating to the distribution: Last day to trade cum the distribution Friday, 15 June 2007 Shares trade ex the distribution Monday, 18 June 2007 Record date Friday, 22 June 2007 Payment to shareholders Monday, 25 June 2007 Share certificates may not be dematerialised or rematerialised between Monday, 18 June 2007 and Friday, 22 June 2007, both days inclusive. By order of the Board ALLAN SCOTT Company Secretary 9 May 2007
6 04 consolidated balance sheet As at As at As at 28 February 28 February 31 August R Assets Non-current assets Property, plant and equipment Investment property Intangible assets Goodwill Deferred taxation assets Loans receivable Current assets Inventories Trade and other receivables Income tax receivable Loans receivable Cash and cash equivalents Derivative financial assets Total assets Equity and liabilities Equity Share capital Share premium Share option reserve Treasury shares ( ) ( ) (69 624) Non-distributable reserve Distributable reserve Non-current liabilities Interest-bearing loans and borrowings Employee benefits Deferred tax liabilities Operating lease liability Current liabilities Bank overdraft Trade and other payables Employee benefits Provisions Interest-bearing loans and borrowings Income tax payable Total equity and liabilities
7 consolidated income statement 05 Six months to Six months to Year to 28 February 28 February % 31 August R change 2006 Revenue Turnover % Cost of merchandise sold % Gross profit % Other income % Expenses % Depreciation and amortisation (7.7%) Occupancy costs % Employment costs % Other operating costs % Impairment of property, plant and equipment Loss on disposal of property, plant and equipment Goodwill impairment Operating profit before financing costs % Net financing costs (22 216) (29 956) (25.8%) (57 219) Financial income Financial expense (27 302) (33 724) (68 589) Profit before tax % Income tax expense % Profit for the period % Adjustment for: Impairment of property, plant and equipment Loss on disposal of property, plant and equipment Goodwill impaired Headline earnings % Headline earnings per share (cents) undiluted % 73.1 diluted % 71.0 Earnings per share (cents) undiluted % 71.4 diluted % 69.4 Shares in issue ( 000) (5.5%) Weighted average number of shares ( 000) % Weighted average diluted number of shares ( 000) %
8 06 consolidated changes in equity statement Number of Share Share Share option R 000 shares ( 000) capital premium reserve Balance at 31 August Shares issued in respect of options Share issue expenses written off (125) Total recognised income and expenses for the period Foreign currency translation reserve Share option reserve Profit for the period Distributions to shareholders Balance as at 28 February Shares issued in respect of options Share issue expenses written off (64) Treasury shares cancelled (270) ( ) Treasury shares purchased (5 066) Total recognised income and expenses for the period Foreign currency translation reserve Share option reserve Profit for the period Distributions to shareholders (39 568) Balance at 31 August Shares issued in respect of options Share issue expenses written off (9) Net cost of treasury shares purchased (10 431) Treasury shares purchased (22 226) Take up of share options Total recognised income and expenses for the period Foreign currency translation reserve Share option reserve Profit for the period Distributions to shareholders (53 652) Balance at 28 February NOTES Change in comparatives R78.5 million was reclassified from trade and other payables to inventory. This represented goods in transit paid for in advance. In addition, an amount of R93.5 million was eliminated from both trade and other receivables and trade and other payables, representing intragroup balances not fully eliminated on consolidation. In the 2006 annual financial statements, certain amounts relating to the 2005 balance sheet were reclassified. This has had a consequent impact on the of the 2006 interim cash flow statement. An amount of R17.5 million was reclassified from trade and other payables to non-current employee benefits and R15.7 million was reclassified from trade and other receivables to non-current loans receivable (R15.4 million) and derivative financial assets (R0.3 million).
9 07 Non- Treasury distributable Distributable R 000 shares reserve reserve Total Balance at 31 August 2005 ( ) Shares issued in respect of options Share issue expenses written off (125) Total recognised income and expenses for the period (37) Foreign currency translation reserve (37) (37) Share option reserve Profit for the period Distributions to shareholders (63 533) (63 533) Balance as at 28 February 2006 ( ) Shares issued in respect of options Share issue expenses written off (64) Treasury shares cancelled (43 578) Treasury shares purchased (46 784) (46 784) Total recognised income and expenses for the period Foreign currency translation reserve Share option reserve Profit for the period Distributions to shareholders 778 (38 790) Balance at 31 August 2006 (69 624) Shares issued in respect of options Share issue expenses written off (9) Net cost of treasury shares purchased ( ) (47 525) ( ) Treasury shares purchased ( ) ( ) Take up of share options (47 525) Total recognised income and expenses for the period Foreign currency translation reserve Share option reserve Profit for the period Distributions to shareholders (24 040) (77 692) Balance at 28 February 2007 ( )
10 08 consolidated cash flow statement Six months to Six months to Year to 28 February 28 February 31 August R Cash effects of operating activities Cash generated by operations (refer note 1) Working capital changes (refer note 2) ( ) ( ) Cash generated/(utilised) by operations ( ) Interest received Interest paid (27 302) (33 724) (71 373) Taxation received/(paid) (21 894) (71 301) Cash inflow/(outflow) from operating activities before distributions ( ) Distributions paid to shareholders (77 692) (63 533) ( ) Net cash effects of operating activities ( ) Cash effects of investing activities Investment in property, plant and equipment to maintain and expand operations (88 229) (63 743) ( ) Investment in intangible assets (5 979) Acquisition of additional goodwill (1 254) Proceeds on disposal of property, plant and equipment Decrease in loan receivables Net cash effects of investing activities (70 447) (48 159) ( ) Cash effects of financing activities Proceeds from the issue of share capital Share issue expenses (9) (125) (189) Purchase of treasury shares ( ) (46 784) Proceeds from disposal of treasury shares Interest-bearing loans and borrowings repaid (24 970) (45 724) (97 001) Net cash effects of financing activities ( ) (6 727) (69 391) Net increase/(decrease) in cash and cash equivalents ( ) (53 297) Cash and cash equivalents at beginning of period (6 889) Cash and cash equivalents at end of period ( ) (6 889)
11 09 Six months to Six months to Year to 28 February 28 February 31 August R Notes to the cash flow statement 1. Operating profit before working capital changes Operating profit before financing costs Adjusted for: Depreciation and amortisation Equity-settled share option costs Derivative fair value movement (4 696) (223) (8 323) Goodwill impairment Impairment of property, plant and equipment Disposal of property, plant and equipment Operating lease accrual (942) Unrealised foreign exchange gain (520) (8 580) Working capital changes Decrease/(increase) in inventories (17 751) (32 312) (3 071) Decrease/(increase) in trade and other receivables ( ) ( ) Acquisition of derivative financial instruments (3 965) Increase/(decrease) in trade and other payables ( ) (Decrease)/increase in employee benefits (8 712) (8 963) Increase/(decrease) in provisions (674) ( ) ( )
12 10 operational segmental balance sheet Retail Distribution As at As at As at As at 28 February 28 February 28 February 28 February R Assets Non-current assets (55 384) ( ) Property, plant and equipment Investment property Intangibles Goodwill Deferred taxation assets Intragroup loans ( ) ( ) Loans receivable Current assets Inventories Trade and other receivables Income tax receivables Loans receivable Cash and cash equivalents Derivative financial assets Total segment assets Equity and liabilities Equity Share capital Share premium Share option reserve Treasury shares ( ) ( ) Non-distributable reserve Distributable reserve Non-current liabilities Interest-bearing loans and borrowings Employee benefits Deferred taxation liabilities Operating lease liability Current liabilities Bank overdraft Trade and other payables Employee benefits Provisions Interest-bearing loans and borrowings Income tax payable (4 319) Total segment equity and liabilities
13 11 Intragroup elimination Total As at As at As at As at 28 February 28 February 28 February 28 February R Assets Non-current assets Property, plant and equipment Investment property Intangibles Goodwill Deferred taxation assets Intragroup loans Loans receivable Current assets ( ) (96 428) Inventories (4 595) (2 893) Trade and other receivables ( ) (93 535) Income tax receivables Loans receivable Cash and cash equivalents Derivative financial assets Total segment assets ( ) (96 428) Equity and liabilities Equity (4 595) (2 893) Share capital Share premium Share option reserve Treasury shares ( ) ( ) Non-distributable reserve Distributable reserve (4 595) (2 893) Non-current liabilities Interest-bearing loans and borrowings Employee benefits Deferred taxation liabilities Operating lease liability Current liabilities ( ) (93 535) Bank overdraft Trade and other payables ( ) (93 535) Employee benefits Provisions Interest-bearing loans and borrowings Income tax payable Total segment equity and liabilities ( ) (96 428)
14 12 operational segmental income statement Retail Distribution Six months to Six months to Six months to Six months to 28 February 28 February % 28 February 28 February % R change change Segmental revenue Turnover % % Cost of merchandise sold % % Gross profit % (6.0%) Other income % % Segment expenses % % Depreciation and amortisation (10.2%) % Occupancy costs % % Employment costs % % Other operating costs % (5.4%) Impairment of property, plant and equipment 182 Loss on disposal of property, plant and equipment Segment result % %
15 13 Intragroup elimination Total Six months to Six months to Six months to Six months to 28 February 28 February 28 February 28 February % R change Segmental revenue ( ) ( ) Turnover ( ) ( ) % Cost of merchandise sold ( ) ( ) % Gross profit (1 244) % Other income % Segment expenses % Depreciation and amortisation (7.7%) Occupancy costs % Employment costs % Other operating costs % Impairment of property, plant and equipment 182 Loss on disposal of property, plant and equipment Segment result (1 244) % Net financing costs (22 216) (29 956) (25.8%) Financial income Financial expenses (27 302) (33 724) Profit before taxation % Income tax expense % Profit for the period % Adjustment for: Impairment of property, plant and equipment 129 Loss/(profit) on disposal of property, plant and equipment Goodwill impaired Headline earnings %
16 14 trading segmental analysis For the six months to Total Clicks Discom Musica 28 February 2007 R Balance sheet Property, plant and equipment* Intangibles (capitalised software development) Inventories Other assets Total assets Income statement Turnover Operating profit/(loss) Ratios Increase in turnover % Increase in operating profit % (7.4) (2.5) Operating profit margin % Inventory days Inventory turn Return on assets managed % Number of stores company owned franchised Weighted trading area m Weighted annual sales per m 2 R Number of permanent employees *Property, plant and equipment includes investment property
17 15 The Body Shop Style Studio UPD Group Services Intragroup elimination (4 595) (2 893) ( ) (93 535) ( ) (96 428) ( ) ( ) (1 244) (20.8)
18 16 definitions Comparable stores turnover growth Sales growth expressed as a percentage of growth for stores that have been operating for the full period during the current and previous financial periods. Diluted headline earnings per share Headline earnings divided by the weighted average diluted number of shares in issue for the period. Distribution cover Undiluted headline earnings for the period divided by the distribution per share for the period. Distribution per share Distribution per share is the actual interim cash dividend and capital distribution paid and/or the final cash dividend and capital distribution declared, expressed as cents per share. Gross profit margin Gross profit expressed as a percentage of turnover. Headline earnings Profit for the period adjusted for the after tax effect of goodwill impairment and certain other capital items. Headline earnings per share Headline earnings divided by the weighted average number of shares in issue for the period. Interest-bearing debt to shareholders interest at period end Interest-bearing debt (including bank overdraft) at the end of the period divided by shareholders interest at the end of the period. Inventory days Number of days sales that closing inventory at period end comprises, calculated on a cost basis. Inventory turn Annualised turnover for the period divided by closing inventory at period end. Market capitalisation The market price per share at period end multiplied by the number of shares in issue at period end. Net asset value per share Net assets at period end divided by the number of shares in issue at period end. Net tangible asset value per share Net assets at period end, less intangible assets such as goodwill and trademarks, divided by the number of shares in issue at period end. Operating profit Operating profit before financing costs, as reported in the consolidated income statement, adjusted to exclude goodwill impairment, impairment of property, plant and equipment and profit/loss on disposal of property, plant and equipment. Operating profit margin Operating profit expressed as a percentage of turnover. Return on assets managed (ROAM) Annualised operating profit/loss expressed as a percentage of average property, plant and equipment, inventory, investment properties, intangible assets (excluding goodwill and trademarks) and trade and other receivables for the period. Trade and other receivables are not allocated to retail business units. Return on shareholders interest (ROE) Annualised headline earnings for the period expressed as a percentage of the average ordinary shareholders interest for the period. Return on total assets (ROA) Annualised headline earnings for the period expressed as a percentage of the average total assets for the period. Shareholders interest Ordinary share capital and share premium (reduced by the cost of treasury shares) and other reserves comprising equity. Treasury shares Ordinary shares in Limited acquired by a group company in terms of an approved share repurchase programme or held by the Share Trust. Weighted average number of shares The number of shares in issue, increased by shares issued during the period and reduced by treasury shares purchased or shares cancelled during the year, weighted on a time basis for the period during which they have participated in the income of the group. Weighted average diluted number of shares The weighted average number of shares adjusted for the effects of all dilutive potential ordinary shares. contact details Tier 1 Investor Relations Tel Cell Don Bowden +27 (0) (0) don@tier1ir.co.za Sue Hemp +27 (0) (0) sue@tier1ir.co.za Graeme Lillie +27 (0) (0) graeme@tier1ir.co.za

19 17

20 18
21 19

22 20

23 21
24 22

25 23

26 24
27 25

28 26


29 27

30 28
31 29

32 30

33 31
34 32
35 33
36 34
37 35
38 36
39 37

40 38
41 39

42 40
43 41
44 42
45 43 notes
46 44 notes
47 45 notes
48
INTERIM CONDENSED CONSOLIDATED RESULTS FOR THE SIX MONTHS ENDED 28 FEBRUARY 2018
 INTERIM CONDENSED CONSOLIDATED RESULTS FOR THE SIX MONTHS ENDED 28 FEBRUARY CONTENTS 1 Commentary 2 Consolidated statement of comprehensive income 3 Consolidated statement of financial position 3 Consolidated
Retail health and beauty sales grew by 14.3%, with good volume growth in same stores and market share gains in all product categories.
 CLICKS GROUP LIMITED Registration number: 1996/000645/06 Share code: CLS ISIN: ZAE000134854 CUSIP: 18682W205 INTERIM CONDENSED CONSOLIDATED RESULTS FOR THE SIX MONTHS ENDED 28 FEBRUARY 2018 Group turnover
PRELIMINARY REVIEWED CONDENSED CONSOLIDATED RESULTS FOR THE YEAR ENDED 31 AUGUST 2017
 PRELIMINARY REVIEWED CONDENSED CONSOLIDATED RESULTS FOR THE YEAR ENDED 31 AUGUST CONTENTS 1 Commentary 2 Consolidated statement of comprehensive income Group turnover up 10.9% 3 Consolidated statement
FIVE-YEAR CONSOLIDATED SUMMARY OF PROFITS
 Clicks Group five-year review 2017 FIVE-YEAR CONSOLIDATED SUMMARY OF PROFITS for the year ended 31 August R million Turnover 11.7% 26 809 24 171 22 070 19 150 17 543 Cost of merchandise sold 12.1% (21
CLICKS GROUP LIMITED Registration number: 1996/000645/06 Share code: CLS ISIN: ZAE CUSIP: 18682W205
 CLICKS GROUP LIMITED Registration number: 1996/000645/06 Share code: CLS ISIN: ZAE000134854 CUSIP: 18682W205 INTERIM CONDENSED CONSOLIDATED RESULTS FOR THE SIX MONTHS ENDED 28 FEBRUARY 2017 Group turnover
Summary CONSOLIDATED STATEMENT OF CHANGES IN EQUITY. the foschini group UNAUDITED INTERIM CONDENSED CONSOLIDATED RESULTS
 Summary CONSOLIDATED STATEMENT OF CHANGES IN EQUITY for the years 31 March the foschini group limited UNAUDITED INTERIM CONDENSED CONSOLIDATED RESULTS FOR THE HALF-YEAR ENDED 30 SEPTEMBER 1 Summary CONSOLIDATED
GROUP PROFIT AND LOSS ACCOUNT
 GROUP PROFIT AND LOSS ACCOUNT Continuing Continuing activities Goodwill activities before goodwill Amortisation before Operating Unaudited amortisation & operating Audited operating exceptional Total &
REVIEWED INTERIM CONDENSED CONSOLIDATED RESULTS for the six-months ended 31 August 2017
 Dis-Chem Pharmacies Limited ("Dis-Chem" or "the Company") (Incorporated in the Republic of South Africa) (Registration number 2005/009766/06) Share code: DCP ISIN: ZAE000227831 REVIEWED INTERIM CONDENSED
Transpaco s total comprehensive income grew 0,5% to R66,9 million (June 2012: R66,6 million).
.") Group turnover up 7% Net asset value up 12% Final dividend per share 53,5 cents Introduction Transpaco maintained its consistent performance with good turnover growth and a slight increase in headline
Group turnover up 7% Net asset value up 12% Final dividend per share 53,5 cents Introduction Transpaco maintained its consistent performance with good turnover growth and a slight increase in headline
UNAUDITED INTERIM FINANCIAL RESULTS
 Think Efficient. Realise potential. EFFICIENT GROUP LIMITED Incorporated in the Republic of South Africa (Registration nr: 2006/036947/06) JSE share code: EFG ISIN: ZAE000151841 ( Efficient Group or the
Liberty Holdings Limited
 Liberty Holdings Limited AUDITED PRELIMINARY RESULTS FOR THE YEAR ENDED 31 December 2006 Commentary on results Liberty Holdings Limited (Liberty Holdings) is the holding company of Liberty Group Limited.
Pick n Pay Stores Limited and its subsidiaries. Directors responsibility for the Company and Group annual financial statements
 Directors responsibility for the Company and Group annual financial statements The directors are responsible for the preparation and fair presentation of the Company and Group annual financial statements
PROVISIONAL REVIEWED ANNUAL CONDENSED CONSOLIDATED RESULTS 2018 FOR THE YEAR ENDED 28 FEBRUARY
 PROVISIONAL REVIEWED ANNUAL CONDENSED CONSOLIDATED RESULTS 2018 FOR THE YEAR ENDED 28 FEBRUARY CONTENTS Commentary 1 Condensed consolidated statement of comprehensive income 3 Condensed consolidated statement
Condensed consolidated income statement For the half-year ended June 30, 2009
 Condensed consolidated income statement For the half-year ended June Restated* December Notes Revenue 2 5,142 4,049 9,082 Cost of sales (4,054) (3,214) (7,278) Gross profit 1,088 835 1,804 Other operating
IBC IBC. Annual financial statements for the year ended 31 August 2014
 Annual FINANCIAL STATEMENTS Contents Directors Responsibility Statement 2 Certificate by the Company Secretary 2 Directors Report 3 Audit and Risk Committee Report 4 Independent Auditor s Report 7 Consolidated
Woolworths Holdings Limited (Incorporated in the Republic of South Africa) Registration number 1929/001986/06 Share code: WHL ISIN: ZAE
 Registration number 1929/001986/06 Share code: WHL ISIN: ZAE") Woolworths Holdings Limited (Incorporated in the Republic of South Africa) Registration number 1929/001986/06 Share code: WHL ISIN: ZAE000063863 ("the Group" or "the company") AUDITED GROUP RESULTS FOR
Woolworths Holdings Limited (Incorporated in the Republic of South Africa) Registration number 1929/001986/06 Share code: WHL ISIN: ZAE000063863 ("the Group" or "the company") AUDITED GROUP RESULTS FOR
86 MARKS AND SPENCER GROUP PLC FINANCIAL STATEMENTS CONSOLIDATED INCOME STATEMENT
 86 CONSOLIDATED INCOME STATEMENT Notes Underlying 53 weeks ended 2 April 52 weeks ended 28 March Non-underlying Underlying Non-underlying Revenue 2, 3 10,555.4 10,555.4 10,311.4 10,311.4 Operating profit
INTERIM RESULTS FOR THE SIX MONTHS ENDED 28 FEBRUARY 2015
 INTERIM RESULTS FOR THE SIX MONTHS ENDED 28 FEBRUARY 2015 PRESENTATION OUTLINE Review of the period Financial results Trading performance Outlook Questions CLICKS GROUP INTERIM RESULTS 2015 2 REVIEW OF
ANNUAL RESULTS FOR THE YEAR ENDED 31 AUGUST 2017
 ANNUAL RESULTS FOR THE YEAR ENDED 31 AUGUST 2017 PRESENTATION OUTLINE Review of the year Financial results Trading performance Outlook Questions 2 REVIEW OF THE YEAR DAVID KNEALE REVIEW OF THE YEAR Strong
Overview of consolidated financial statements
 Overview of consolidated financial statements Consolidated balance sheet On 31 December 2015 On 31 December 2014 In EUR millions Assets Cash and balances at central banks 64,943 43,409 Loans and advances
UNAUDITED CONDENSED CONSOLIDATED INTERIM RESULTS FOR THE SIX MONTHS ENDED 31 AUGUST 2018
 Verimark Holdings Limited (Incorporated in the Republic of South Africa) Registration Number: 1998/006957/06 Share Code: VMK ISIN: ZAE000068011 ("Verimark" or "the Group") UNAUDITED CONDENSED CONSOLIDATED
Investec records another resilient performance
 21 May 2009 - Investec Investec records another resilient performance Diversified business model, sound balance sheet and recurring revenue base support profitability in challenging economic conditions
PROVISIONAL REVIEWED ANNUAL CONDENSED CONSOLIDATED RESULTS FOR THE YEAR ENDED 28 FEBRUARY 2018
 Dis-Chem Pharmacies Limited ("Dis-Chem" or "the Company") (Incorporated in the Republic of South Africa) (Registration number 2005/009766/06) Share code: DCP ISIN: ZAE000227831 PROVISIONAL REVIEWED ANNUAL
ASSETS 31 December December 2016
 Condensed Consolidated Interim Balance Sheet as at 31 December 2017 ASSETS 31 December 2017 31 December 2016 Current Assets Cash and Cash Equivalents 7.132 5.159 Financial Investments 736 1.228 Trade Receivables
Headline Earnings Per Share (HEPS), and Earnings Per Share (EPS) increased by 231% to 9.6 cents per share.
, and Earnings Per Share (EPS) increased by 231% to 9.6 cents per share.") HIGHLIGHTS Headline Earnings Per Share (HEPS), and Earnings Per Share (EPS) increased by 231% to 9.6 cents per share. Revenue from continuing operations increased by 12% to R872 million. Net asset value
HIGHLIGHTS Headline Earnings Per Share (HEPS), and Earnings Per Share (EPS) increased by 231% to 9.6 cents per share. Revenue from continuing operations increased by 12% to R872 million. Net asset value
VUE INTERNATIONAL BIDCO PLC
 Registered number: 08514872 UNAUDITED FINANCIAL STATEMENTS FOR THE 3 MONTHS ENDED 28 FEBRUARY INTERIM CONDENSED CONSOLIDATED PROFIT AND LOSS ACCOUNT (unaudited) FOR THE PERIOD ENDED 28 FEBRUARY (1) Restated
UNAUDITED CONDENSED CONSOLIDATED INTERIM RESULTS
 UNAUDITED CONDENSED CONSOLIDATED INTERIM RESULTS FOR THE SIX MONTHS ENDED 31 DECEMBER 2014 RESULTS HIGHLIGHTS REVENUE 257% to R562.4m EBITDA 276% to R87.2m HEPS 118% to 14.4 cents DPS 3.5 cents 01 UNAUDITED
Touchstone Group plc
 Date 14 November Contacts Keith Birch, Managing Director Touchstone Group plc 020 8441 7755 David Bick/Trevor Phillips Holborn 020 7929 5599 Touchstone Group plc Further Profit Growth at Half Year Touchstone
Group UNAUDITED GROUP RESULTS FOR THE PERIOD ENDED 31 MARCH 2018,
 UNAUDITED GROUP RESULTS FOR THE PERIOD ENDED 31 MARCH 2018, SCRIP DISTRIBUTION WITH CASH DIVIDEND ALTERNATIVE, FURTHER CAUTIONARY AND TRADING STATEMENT Group LIFE HEALTHCARE UNAUDITED GROUP RESULTS 2018
CASHBUILD LIMITED (Registration number: 1986/001503/06) (Incorporated in the Republic of South Africa) Listed on the JSE Securities Exchange South
 (Incorporated in the Republic of South Africa) Listed on the JSE Securities Exchange South") CASHBUILD LIMITED (Registration number: 1986/001503/06) (Incorporated in the Republic of South Africa) Listed on the JSE Securities Exchange South Africa JSE Share Code: CSB ISIN: ZAE000028320 Audited
CASHBUILD LIMITED (Registration number: 1986/001503/06) (Incorporated in the Republic of South Africa) Listed on the JSE Securities Exchange South Africa JSE Share Code: CSB ISIN: ZAE000028320 Audited
For personal use only
 Preliminary Financial Report for the Year Ended 30 June 2016 Preliminary Financial Report for the Year Ended 30 June 2016 Current Period: 1 July 2015 30 June 2016 Prior corresponding Period: 1 July 2014
- (1.7) (6.6) Profit attributable to ordinary shareholders Earnings per share 5 Basic 2.3p 2.5p 10.6p Diluted 2.3p 2.5p 10.
 (6.6) Profit attributable to ordinary shareholders Earnings per share 5 Basic 2.3p 2.5p 10.6p Diluted 2.3p 2.5p 10.") Consolidated Profit and Loss Account For the 13 weeks ended 1st May 2005 Notes Revenue 2 196.4 200.3 776.7 Cost of sales (117.5) (119.9) (462.2) Gross profit 78.9 80.4 314.5 Total operating expenses (61.4)
Consolidated Profit and Loss Account For the 13 weeks ended 1st May 2005 Notes Revenue 2 196.4 200.3 776.7 Cost of sales (117.5) (119.9) (462.2) Gross profit 78.9 80.4 314.5 Total operating expenses (61.4)
Michael Harvey. Martin Rosen
 board of directors David Nurek Fatima Abrahams Michael Harvey Fatima Jakoet David Kneale John Bester Bertina Engelbrecht Martin Rosen Keith Warburton David Nurek (59) John Bester (63) Michael Harvey (40)
City Lodge Hotels Limited Registration number: 1986/002864/06 Share code: CLH ISIN: ZAE
 City Lodge Hotels Limited Registration number: 1986/002864/06 Share code: CLH ISIN: ZAE 000117792 Unaudited interim report for the six months ended 31 December 2018 Average group occupancies 58% Normalised
STRENGTH BEYOND THE BAG
 STRENGTH BEYOND THE BAG 30 PPC Ltd Consolidated statement of financial position as at 30 September ASSETS Non-current assets 6 411 4 998 Property, plant and equipment 1 5 522 4 483 Goodwill 2 101 6 Other
PRELIMINARY AUDITED SUMMARISED CONSOLIDATED RESULTS AND CASH DIVIDEND DECLARATION FOR THE YEAR ENDED 30 SEPTEMBER 2018 KEY FEATURES
 RHODES FOOD GROUP HOLDINGS LIMITED (Incorporated in the Republic of South Africa) Registration number: 2012/074392/06 JSE share code: RFG ISIN: ZAE000191979 PRELIMINARY AUDITED SUMMARISED CONSOLIDATED
Consolidated Profit and Loss account for the year ended 31 December 2003
 Consolidated Profit and Loss account for the year ended 31 December Before exceptional items and of intangibles Exceptional Before Exceptional items and exceptional items and items and of intangibles of
HomeChoice International PLC summarised group financial statements for the year ended 31 December 2016 and cash dividend declaration
 HomeChoice International PLC summarised group financial statements for the year ended 31 December and cash dividend declaration HomeChoice International PLC 1 Commentary Group highlights sales up 25.1
Results in accordance with Australian Accounting Standards $ 000. Revenue from operations up 3.1% to 2,894,804
 A.B.N. 39 125 709 953 Appendix 4E Year ended 30 June 2013 (previous corresponding period: 30 June 2012) Results for announcement to the market Results in accordance with Australian Accounting Standards
INTERIM REPORT AND DIVIDEND DECLARATION FOR THE SIX MONTHS ENDED 31 MARCH 2002
 Incorporated in the Republic of South Africa (Registration Number 1939/001730/06) INTERIM REPORT AND DIVIDEND DECLARATION FOR THE SIX MONTHS ENDED 31 MARCH HEADLINE EARNINGS PER SHARE IMPROVE BY 27 % DIVIDENDS
City Lodge Hotels Limited
 Registration number: 1986/002864/06 Share code: CLH ISIN: ZAE 000117792 Reviewed group preliminary results for the year ended 30 June 2017 Average occupancies 63% 2016: 66% Normalised diluted HEPS (3%)
ing
 transforming Annual Accounts 2003 transforming Home Improvement Contents 1 Consolidated profit and loss account 2 Consolidated statement of total recognised gains and losses 2 Note of Group historical
A P P E N D I C E S B U S I N E S S A S U N U S U A L
 BUSINESS AS UNUSUAL A P P E N D I C E S 112 APPENDIX I. FINANCIAL SUMMARY APPENDIX I FINANCIAL SUMMARY CONSOLIDATED BALANCE SHEET FOR 2017 AND 2016 ASSETS 31.12.2017 31.12.2016 Property, plant and equipment
for the year ended 31 August 2015
 Clicks Audited Annual Financial Statements Notes to the annual financial statements for the year ended 31 August 1 Revenue Turnover 22 070 092 19 149 524 Finance income 4 922 5 497 Other income 1 210 082
FIRST HALF HIGHLIGHTS
 FIRST HALF HIGHLIGHTS Revenue at 54.6m (2006: 54.6m) Pre-exceptional gross margin at 69.9% (2006: 70.9%) Exceptional items cost reduction programme (0.6)m (2006: nil) Pre-exceptional operating profit up
Audited Annual financial statements 2015
 Audited Annual financial statements CONTENTS 1 Directors responsibility statement 1 Certificate by the company secretary 2 Directors report 3 Audit and risk committee report 6 Independent auditor s report
Group Income Statement
 MASSMART GROUP ANNUAL FINANCIAL STATEMENTS 2014 Group Income Statement December 2014 December 2013 Rm Notes 52 weeks 53 weeks Revenue 5 78,319.0 72,512.9 Sales 5 78,173.2 72,263.4 Cost of sales (63,610.8)
35 Manchester United PLC Annual Report 2002 Financial statements
 35 Manchester United PLC Annual Report 2002 Contents 36 Consolidated profit and loss account 36 Statement of total recognised gains and losses 37 Consolidated balance sheet 38 balance sheet 39 Consolidated
Audited Group Results for the year ended 30 September 2013 and cash dividend declaration
 Life Healthcare Group Holdings Limited Registration number: 2003/002733/06 Income tax number: 9387/307/15/1 ISIN: ZAE000145892 Share code: LHC Audited Group Results for the year ended 30 September 2013
Notes to the annual financial statements for the year ended 29 February 2012
 Notes to the annual financial statements for the year ended 29 February Except as presented below, the accounting policies and notes to the annual financial statements and consolidated annual financial
Unaudited Condensed Consolidated Interim Results for the six months ended 30 September 2015 and Interim Dividend Declaration
 TRUSTCO GROUP HOLDINGS LIMITED Incorporated in the Republic of Namibia (Registration number 2003/058) NSX Share Code: TUC JSE Share Code: TTO ISIN Number: NA000A0RF067 ("Trustco", or "the group") Unaudited
COMMENTARY. Relative to the pro forma comparable 52-week prior period (refer to note 15).
.") PRELIMINARY REPORT ON THE AUDITED GROUP ANNUAL RESULTS for the 52 weeks ended 1 July 2018 KEY FEATURES COMMENTARY Comparable sale of merchandise # down 0.2% to R17.5 billion Sale of merchandise down 2.9%
PRELIMINARY REPORT ON THE AUDITED GROUP ANNUAL RESULTS for the 52 weeks ended 1 July 2018 KEY FEATURES COMMENTARY Comparable sale of merchandise # down 0.2% to R17.5 billion Sale of merchandise down 2.9%
TFG INTEGRATED ANNUAL REPORT ABOUT THIS REPORT INVESTMENT CASE OUR STRATEGY AND PERFORMANCE OUR PROFILE
 INVESTMENT CASE ABOUT THIS REPORT OUR OUR OPERATING ENVIRONMENT OUR STRATEGY AND PERFORMANCE Summary consolidated statement of financial position 140 Summary consolidated income statement 141 Summary consolidated
Notes to the Annual Financial Statements
 Notes to the Annual Financial Statements 1. Accounting Policies The financial information of the Massmart Group is prepared on the historical cost basis. The financial statements have been prepared in
INSIMBI REFRACTORY AND ALLOY SUPPLIES LIMITED
 INSIMBI REFRACTORY AND ALLOY SUPPLIES LIMITED (Incorporated in the Republic of South Africa) (Registration No: 2002/029821/06) (Income tax reference no: 9078/488/15/3) Share code: ISB ISIN code: ZAE000116828
BLUE LABEL AUDITED RESULTS FOR THE YEAR ENDED 31 MAY
 Audited results for the year ended 31 May 2015 BLUE LABEL AUDITED RESULTS FOR THE YEAR ENDED 31 MAY 2015 30 HIGHLIGHTS Increase in revenue of 14% to R22 billion Increase in gross profit of 22% to R1.64
Dis-Chem Pharmacies Limited ("Dis-Chem" or "the Company") (Incorporated in the Republic of South Africa) (Registration number 2005/009766/06) Share
 (Incorporated in the Republic of South Africa) (Registration number 2005/009766/06) Share") Dis-Chem Pharmacies Limited ("Dis-Chem" or "the Company") (Incorporated in the Republic of South Africa) (Registration number 2005/009766/06) Share code: DCP ISIN: ZAE000227831 Provisional Reviewed Annual
Dis-Chem Pharmacies Limited ("Dis-Chem" or "the Company") (Incorporated in the Republic of South Africa) (Registration number 2005/009766/06) Share code: DCP ISIN: ZAE000227831 Provisional Reviewed Annual
FORMATTING CORRECTION: UNAUDITED INTERIM GROUP RESULTS - 26 WEEKS ENDED 23 DECEMBER 2018 & CASH DIVIDEND DECLARATION
 Woolworths Holdings Limited (Incorporated in the Republic of South Africa) Registration number 1929/001986/06 Share code: WHL Share ISIN: ZAE000063863 Bond code: WHLI ('the Group', 'the Company' or 'WHL')
statements annual financial statements 70 Group salient features 71 Five-year summary of results Annexure a: interest-bearing borrowings
 annual financial statements Annual financial statements 70 Group salient features 71 Five-year summary of results 72 Summary of statistics 73 Definitions 74 Ordinary share ownership 75 Financial review
100 YEARS
 100 YEARS 1918 FINANCIAL RESULTS Revenue up to R6.4 billion (: R3.0 billion) p 115% Gross profit up to R760.1 million (: R536.7 million) p 42% Core headline earnings down to R146.3 million (: R159.0 million)
Regus Group plc Interim Report Six months ended June 2005
 Regus Group plc Interim Report Six months ended June 2005 Financial Highlights (a) 216.0m TURNOVER (2004: 124.9m) 48.7m CENTRE CONTRIBUTION (2004: 17.5m) 22.3m ADJUSTED EBITA (b) (2004: 1.9m LOSS) 37.4m
Fleetwood Corporation Limited. Preliminary Final Report Year ended 30 June 2012
 ABN 69 009 205 261 Preliminary Final Report Results for Announcement to the Market Change Amount $ 000 Revenue from ordinary activities Down 13% to 407,443 Profit from ordinary activities after tax attributable
PRESENTATION OUTLINE. Review of the period Financial results Trading performance Outlook Questions
 PRESENTATION OUTLINE Review of the period Financial results Trading performance Outlook Questions 2 REVIEW OF THE PERIOD DAVID KNEALE REVIEW OF THE PERIOD Strong health & beauty sales performance Increased
FINANCIAL STATEMENTS
 FINANCIAL STATEMENTS Consolidated Income Statement 35 Consolidated Statement of Comprehensive Income 36 Consolidated Statement of Financial Position 37 Consolidated Statement of Changes In Equity 38 Consolidated
WOOLWORTHS HOLDINGS LIMITED
 WOOLWORTHS HOLDINGS LIMITED UNAUDITED INTERIM GROUP RESULTS FOR THE 26 WEEKS ENDED 25 DECEMBER 2017 WOOLWORTHS HOLDINGS LIMITED INTERIM RESULTS 2018 ANALYST PRESENTATION WHL 1 / 2018 WOOLWORTHS HOLDINGS
GAP - Annual Financial Report 2017 Please see attached.
 GAP - Annual Financial Report Please see attached. 0090/00023548/en Annual Financial Report G.A.P. VASSILOPOULOS PUBLIC LTD GAP Attachment: 1. GAP VASSILOPOULOS - Annual Results Regulated Publication Date:
JOHN LAING plc INTERIM REPORT 2002
 JOHN LAING plc INTERIM REPORT 2002 CONTENTS 1 Chairman s Statement 4 Group Profit and Loss Account 5 Group Statement of Total Recognised Gains and Losses 6 Group Balance Sheet 7 Group Cash Flow 8 Notes
CONDENSED PROVISIONAL AUDITED CONSOLIDATED RESULTS FOR THE YEAR ENDED 30 JUNE 2017 AND CASH DIVIDEND DECLARATION
 Comair Limited (Incorporated in the Republic of South Africa) Reg. No. 1967/006783/06 ISIN Code: ZAE000029823 Share Code: COM ( Comair or the Group ) CONDENSED PROVISIONAL AUDITED CONSOLIDATED RESULTS
ASSETS 31 March December 2017
 Condensed Consolidated Interim Balance Sheet as at 31 March 2018 Audited ASSETS 31 March 2018 31 December 2017 Current Assets Cash and Cash Equivalents 7.500 7.132 Financial Investments 198 736 Trade Receivables
Richoux Group plc Interim Report for the period to 13 July 2008
 Richoux Group plc Interim Report for the period to 13 July 2008 Chairman s Review Richoux Group plc Interim Report July 2008 Introduction In line with the sector generally, trading conditions are tougher
CORDLIFE GROUP LIMITED
 PART 1 INFORMATION REQUIRED FOR QUARTERLY (Q1, Q2, Q3), HALF YEAR AND FULL YEAR ANNOUNCEMENTS 1(a)(i) An income statement and statement of comprehensive income (for the group) together with a comparative
Audited preliminary announcement of consolidated financial results for the year ended 28 February 2014 and a cash dividend declaration
 Wilderness Holdings Limited "Wilderness or the Company or the Group Share code: WIL ISIN: BW0000000868 Registration number: 2004/2986 BSE: Primary Listing JSE: Secondary Listing Audited preliminary announcement
HAW PAR CORPORATION LIMITED (Company Registration Number: M) (Incorporated in the Republic of Singapore)
 (Incorporated in the Republic of Singapore)") HAW PAR CORPORATION LIMITED (Company Registration Number: 196900437M) (Incorporated in the Republic of Singapore) Unaudited Second Quarter Financial Results for the Period Ended 30 June 2017 1(a) An income
HAW PAR CORPORATION LIMITED (Company Registration Number: 196900437M) (Incorporated in the Republic of Singapore) Unaudited Second Quarter Financial Results for the Period Ended 30 June 2017 1(a) An income
Group. Revenue 50,033 49, , , Other income including interest income (Note 1a(i)) 321 7,635 (95.8) 3,422 9,611 (64.
) 321 7,635 (95.8) 3,422 9,611 (64.") BONVESTS HOLDINGS LIMITED AND ITS SUBSIDIARIES Company Registration No. 196900282M Unaudited Financial Statements for the Year Ended 30 June 2018 Part I 1(a) INFORMATION REQUIRED FOR ANNOUNCEMENTS OF QUARTERLY
BONVESTS HOLDINGS LIMITED AND ITS SUBSIDIARIES Company Registration No. 196900282M Unaudited Financial Statements for the Year Ended 30 June 2018 Part I 1(a) INFORMATION REQUIRED FOR ANNOUNCEMENTS OF QUARTERLY
INTERIM REPORT FOR THE SIX MONTHS ENDED
 INTERIM REPORT FOR THE SIX MONTHS ENDED 30TH JUNE 2014 Management commentary For the six months ended 2014 Performance Group sales revenue for the first six months of 2014 rose by 7.7% to 12,088,000 (
ZHONGMIN BAIHUI RETAIL GROUP LTD.
 ZHONGMIN BAIHUI RETAIL GROUP LTD. (Company Registration No.: 200411929C) UNAUDITED FINANCIAL STATEMENT FOR THE FOURTH QUARTER AND FINANCIAL YEAR ENDED 31 DECEMBER 2017 PART I INFORMATION REQUIRED FOR ANNOUNCEMENTS
Combined financial statements of the Galenica Santé Group 1. Combined financial statements of the Galenica Santé Group
 Combined financial statements of the Galenica Santé Group 1 Combined financial statements of the Galenica Santé Group 2014-2016 Combined financial statements of the Galenica Santé Group 2 Combined financial
Results in accordance with Australian Accounting Standards $ 000. Revenue from operations up 12.6% to 3,484,404
 A.B.N. 39 125 709 953 Appendix 4E Year ended 30 June 2015 (previous corresponding period: 30 June 2014) Results for announcement to the market Results in accordance with Australian Accounting Standards
Appendix 4D and Interim Financial Report for the half year ended 31 December 2015
 ABN 80 153 199 912 Appendix 4D and Interim Financial Report for the half year ended Lodged with the ASX under Listing Rule 4.2A 1 ABN 80 153 199 912 Half year ended: ( H1 FY2016 ) (Previous corresponding
Consolidated Statement of Profit or Loss
 64 PROGRAMMED ANNUAL REPORT Consolidated Statement of Profit or Loss for the financial year ended 31 March Continuing operations Revenue 5 1,434,224 1,434,923 Other income 6(a) 1,027 1,720 Share of net
JSE LIMITED REVIEWED INTERIM FINANCIAL RESULTS for THE SIX MONTHS ENDED 30 JUNE 2011 and SPECIAL DIVIDEND DECLARATION
 JSE LIMITED REVIEWED INTERIM FINANCIAL RESULTS for THE SIX MONTHS ENDED 30 JUNE 2011 and SPECIAL DIVIDEND DECLARATION contents Diversified revenue 1 Commentary 2 Directors responsibility statement 4 Independent
Truworths International Ltd. 10 year review, ratios,
 Ltd year review, ratios, share statistics and definitions review, ratios, share statistics and definitions Ten-year review growth % 201* Statements of comprehensive income Sale of merchandise 12 17 47
Income Statement. for the financial year ended 31 March 2011
 Income Statement for the financial year ended 31 March Continuing operations Revenue 5 1,220,183 1,141,964 Other income 6 3,776 2,350 Share of net loss of associate accounted for using the equity method
Singapore Myanmar Investco Limited (Company Registration No Z)
") Unaudited Full Year Financial Statements and Dividend Announcement for the Year Ended 31 March 2017 PART I INFORMATION REQUIRED FOR ANNOUNCEMENTS OF QUARTERLY (Q1, Q2 & Q3), HALF- YEAR AND FULL RESULTS
Unaudited Full Year Financial Statements and Dividend Announcement for the Year Ended 31 March 2017 PART I INFORMATION REQUIRED FOR ANNOUNCEMENTS OF QUARTERLY (Q1, Q2 & Q3), HALF- YEAR AND FULL RESULTS
The Warehouse Group Limited Interim Financial Statements. For the 26 weeks ended 28 January 2018
 The Warehouse Group Limited Interim Financial Statements For the 26 weeks ended 28 January 2018 Consolidated Income Statement 26 Weeks 26 Weeks 52 Weeks Ended Ended Ended Note Continuing operations Retail
REVIEWED PRELIMINARY CONDENSED CONSOLIDATED FINANCIAL STATEMENTS
 REVIEWED PRELIMINARY CONDENSED CONSOLIDATED FINANCIAL STATEMENTS FOR THE YEAR ENDED 31 MARCH 2018 SALIENT FEATURES +21,4% GROUP RETAIL TURNOVER Group retail turnover up 21,4% (constant currency +23,0%)
Results in accordance with Australian Accounting Standards $ 000. Revenue from operations down 7.5% to 3,344,135
 A.B.N. 39 125 709 953 Appendix 4E Year ended 30 June 2017 (previous corresponding period: 30 June 2016) Results for announcement to the market Results in accordance with Australian Accounting Standards
REVIEWED PROVISIONAL CONDENSED FINANCIAL RESULTS FOR THE YEAR ENDED 28 FEBRUARY 2011
 Taste Holdings Limited (Incorporated in the Republic of South Africa) (Registration number 2000/002239/06) JSE code: TAS ISIN: ZAE000081162 ("Taste" or "the company" or "the group") REVIEWED PROVISIONAL
VUE INTERNATIONAL BIDCO PLC
 Registered number: 08514872 VUE INTERNATIONAL BIDCO PLC UNAUDITED FINANCIAL STATEMENTS FOR THE 6 MONTHS ENDED 31 MAY INTERIM CONDENSED CONSOLIDATED PROFIT AND LOSS ACCOUNT (unaudited) FOR THE PERIOD ENDED
For personal use only
 BRONSON GROUP LIMITED (ABN 60 006 569 124) APPENDIX 4E PRELIMINARY FINAL REPORT YEAR ENDED 30 JUNE 2015 RESULTS FOR ANNOUNCEMENT TO THE MARKET Key Information Year Ended Year Ended % Change 30 June 2015
Consolidated Statement of Profit or Loss Year ended 31 December 2016
 Consolidated Statement of Profit or Loss REVENUE 5 6,664,785 5,886,845 Cost of sales (3,935,465) (3,655,753) Gross profit 2,729,320 2,231,092 Other income and gains 5 359,903 362,928 Selling and distribution
SUMMARISED AUDITED CONSOLIDATED RESULTS FOR THE YEAR ENDED 28 FEBRUARY 2018 AND DIVIDEND DECLARATION NUMBER 7
 NVEST FINANCIAL HOLDINGS LIMITED AND ITS SUBSIDIARIES (Incorporated in the Republic of South Africa) (Registration number 2008/015990/06) ( NVest, the Group or the Company ) ISIN Code: ZAE000199865 JSE
Investec Bank Limited
 Investec Bank Limited 2017 Reviewed preliminary condensed consolidated financial results for the year ended 31 March 2017 Consolidated income statement For the year to 31 March Reviewed Audited Interest
2.9% 16.8% 22.9% 31.7% 40.1%
 Results for the 52 weeks ended 30 December 2018 PERFORMANCE SUMMARY Like-on-like 52-week basis* Massmart, with total sales of R90.9 billion, comprises four Divisions operating in 436 stores, in 13 sub-saharan
Report of the Auditors
 69 Report of the Auditors TO THE SHAREHOLDERS OF THE WHARF (HOLDINGS) LIMITED (INCORPORATED IN HONG KONG WITH LIMITED LIABILITY) We have audited the accounts on pages 70 to 117 which have been prepared
STATEMENT OF RESPONSIBILITY BY THE BOARD
 AUDITED CONSOLIDATED FINANCIAL STATEMENTS FOR THE YEAR ENDED 30 JUNE 2 STATEMENT OF RESPONSIBILITY BY THE BOARD for the year ended 30 June The directors are responsible for the preparation, integrity and
ASSETS 30 September December 2017
 Condensed Consolidated Interim Balance Sheet as at Not Reviewed Audited ASSETS 31 December 2017 Current Assets Cash and Cash Equivalents 16.343 7.132 Financial Investments - 736 Trade Receivables -Trade
SUNNINGDALE TECH LTD Company Regn Co. : R
 SUNNINGDALE TECH LTD Company Regn Co. : 199508621R Financial Statement Announcement for the Year Ended 31 December 2018 PART I - INFORMATION REQUIRED FOR ANNOUNCEMENTS OF QUARTERLY (Q1,Q2 & Q3), HALF-YEAR
KCE Electronics Public Company Limited and its subsidiaries
 Statements of financial position Consolidated financial Separate financial 31 December 31 December 31 December 31 December Assets Note 2014 2013 2014 2013 Current assets Cash and cash equivalents 7 463,016,990
Love the game. Financial Report
 Love the game Financial Report Contents 1 Income statement 2 Balance sheet 3 Cash flow statement 4 Statement of changes in equity 5 Note 1 Significant accounting policies and corporate information 12 Note