SECOND QUARTER 2018 PRESENTATION AUGUST 15
|
|
|
- Donna Foster
- 5 years ago
- Views:
Transcription


1 SECOND QUARTER 2018 PRESENTATION AUGUST 15
 Relative market share is ~2.")

2 SALES AND ADJ. EBITA MARGIN TROAX IN BRIEF FINANCIAL DEVELOPMENT, OVERVIEW Troax is the global market leader of indoor perimeters protection ( mesh panel solutions ) Relative market share is ~2.5x larger than #2 player Local presence in 36 countries Troax had a sales CAGR of 16,5% and an organic sales CAGR of 11,6% Strong position in the value chain and low supplier and customer dependency 160,0 140,0 120,0 100,0 80,0 60,0 40,0 20,0 0,0 25,0% 22,0% 20,2% 21,6% 20,0% 18,0% 17,9% 152,1 115,8 14,7% 103,7 15,0% 10,2% 91,2 10,0% 70,1 60,8 71,7 5,0% 0,0% Approx. 36% of total employees work within sales Sales MEUR EBITA Margin PRODUCT OFFERING Machine guarding SALES BY REGION (2017) SALES BY END-MARKET (2017) Warehouse partitioning Property protection
3 Dividend policy Capital structure Profitability Sales growth FINANCIAL TARGETS Financial targets Actuals 2018 YTD Troax objective is to exceed the growth in the Company s current markets through organic growth, as well as selective acquisitions >Market growth Sales growth Organic: 6% M&A: 0% Currency -3% Troax target is to have an operating margin in excess of 20% 20% Adjusted EBITA margin 18,1% Net debt in relation to EBITDA, excluding temporary deviations, shall not exceed 2.5 times. <2,5x Net debt to EBITDA 1,8x Troax target is to pay approximately 50 percent of its net profit in dividends. The dividend proposal shall take into account Troax long-term development potential, it s financial position and its investment needs. 50% Pay-out ratio NA
4 SUMMARY Q Positive trend from previous quarters continued. Growth in order intake of 10 per cent, excluding currency changes. - Improvement in all regions, including UK. - Lower demand from automotive sector compared to Q Sales increased 5 per cent, excluding currency changes. - All regions increased excluding new markets. Several new important orders received. Manufacturing of Troax products in Chicago, under implementation. The group is investing to increase the manufacturing capacity in Hillerstorp, Sweden. This is due to the good volume development in recent years. Slightly lower EBIT result and margin Q compared to LY. Higher Net result. Earnings per share was 0,28 (0,19) EUR. Positive development in all regions. Implementation of Folding Guard according to plan, but slightly delayed. Turbulent quarter in the USA related to steel price increases because of import duties.

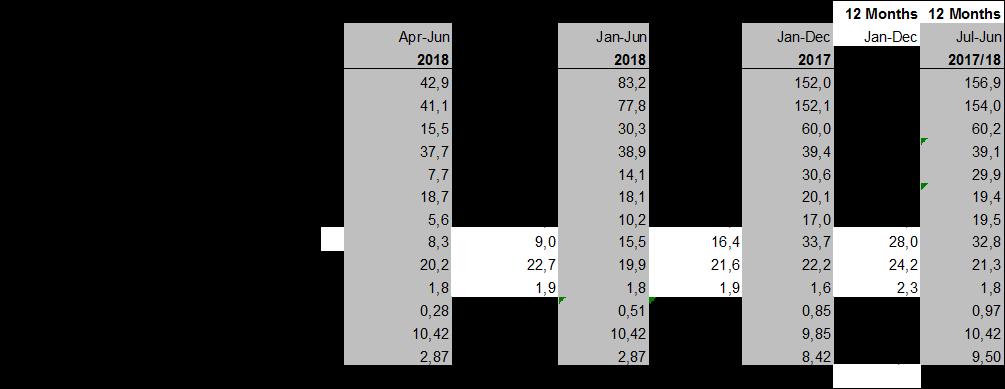
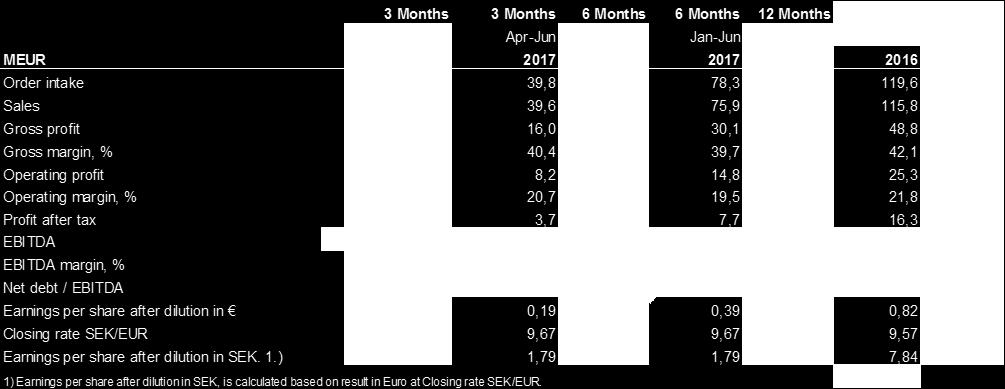
5 FINANCIAL HIGHLIGHTS, GROUP
6 REGIONAL DEVELOPMENT ORDER INTAKE AND SALES 3 Months 3 Months 6 Months 6 Months 12 Months 12 Months 12 Months Order intake Apr-Jun Apr-Jun Jan-Jun Jan-Jun Jan-Dec Jan-Dec Jul-Jun MEUR Diff Diff Diff 2017/2018 Continental Europe 22,2 21,0 6% 44,4 39,9 11% 77,5 65,5 18% 82,0 Nordic region 7,3 6,8 7% 14,0 13,3 5% 26,0 22,8 14% 26,7 United Kingdom 5,4 3,8 42% 9,7 8,3 17% 17,0 18,0-6% 18,4 North America 6,7 6,0 12% 13,3 12,5 6% 25,0 5,7 339% 25,8 New Markets 2,3 2,2 5% 4,2 4,3-2% 8,3 7,6 9% 8,2 Total excl Currency and Acq. 43,9 39,8 10% 85,6 78,3 9% 153,8 119,6 29% 161,1 Currency effect -1,0 0,0-3% -2,4 0,0-3% -1,8 0,0-2% -4,2 Order intake acquisitions 0,0 0,0 0% 0,0 0,0 0,0 0,0 0% 0,0 Total Order intake 42,9 39,8 8% 83,2 78,3 6% 152,0 119,6 27% 156,9 3 Months 3 Months 6 Months 6 Months 12 Months 12 Months 12 Months Total Sales Apr-Jun Apr-Jun Jan-Jun Jan-Jun Jan-Dec Jan-Dec Jul-Jun MEUR Diff Diff Diff 2017/2018 Continental Europe 21,4 20,4 5% 41,7 38,6 8% 77,1 63,3 19% 80,2 Nordic region 6,7 6,5 3% 12,8 12,3 4% 25,9 22,4 16% 26,4 United Kingdom 4,9 4,1 20% 8,9 8,2 9% 17,1 17,6-3% 17,8 North America 6,2 6,0 3% 12,5 12,6-1% 25,0 5,2 381% 24,9 New Markets 2,5 2,6-4% 4,2 4,2 0% 8,8 7,3 21% 8,8 Total excl Currency and Acq. 41,7 39,6 5% 80,1 75,9 6% 153,9 115,8 33% 158,1 Currency effect -1,0 0,0-3% -2,3 0,0-3% -1,8 0,0-2% -4,1 Sales acquisitions / IFRS 15 adjustment 0,4 0,0 1% 0,0 0,0 0,0 0,0 0% -0,4 Total Sales 41,1 39,6 4% 77,8 75,9 3% 152,1 115,8 31% 153,6 * Note that we report organic growth excluding currency effect. ** All figures from 2017 and 2018 includes Folding Guard.

7 FOLDING GUARD INC. A leading US manufacturer of wire partitions and security solutions. Strong player in the central parts of the US. Folding Guard has as per end of Q2 127 employees. Head office and manufacturing facilities in Chicago. Troax distribution has been moved to FG facilities. Net sales in 2017 amounted to about 19 MEUR. Good distribution network, will give volume opportunities for Troax Group. The two brands will be maintained. Integration so far, is working in a good way. Will though take slightly longer time to get the sales synergies we aim for. The new organisation is starting to get formed.

8 CONCLUSION The good development continues also in the second quarter of 2018, even if market demand has levelled out. Good capacity utilization and volumes continue to drive profitability. Extra costs in the manufacturing units due to excess volume demand. Continued good and stable cash flow. Lower financial costs, due to refinancing in Folding Guard implementation according to plan, albeit slightly delayed. Troax will start manufacturing Troax products in the US during Q Capacity increase in Sweden under implementation.
9 MAKING YOUR WORLD SAFE. BUSINESS CONCEPT To develop innovative safety solutions that protect people, property and processes. MISSION VISION Troax should be the No. 1 choice of innovative safety solutions, the worldleading supplier of mesh panels and have a global presence in all major channels. Troax is dedicated to exceeding its customers expectations within all areas. Troax s mission is to develop innovative safety solutions that protect people, property and processes.
THIRD QUARTER 2018 PRESENTATION NOVEMBER 8
 THIRD QUARTER 2018 PRESENTATION NOVEMBER 8 SALES AND ADJ. EBITA MARGIN TROAX IN BRIEF FINANCIAL DEVELOPMENT, 2011-2017 OVERVIEW Troax is the global market leader of indoor perimeters protection ( mesh
FIRST QUARTER 2018 PRESENTATION MAY 2
 FIRST QUARTER 2018 PRESENTATION MAY 2 SALES AND ADJ. EBITA MARGIN TROAX IN BRIEF FINANCIAL DEVELOPMENT, 2011-2017 OVERVIEW Troax is the global market leader of indoor perimeters protection ( mesh panel
Fourth quarter 2017 Presentation February 12
 Fourth quarter 2017 Presentation February 12 Overview Troax is the global market leader of indoor perimeters protection ( mesh panel solutions ) Relative market share is ~2.5x larger than #2 player Local
First quarter 2017 Presentation May 10, 2017
 First quarter 2017 Presentation May 10, 2017 Overview Troax is the global market leader of indoor perimeters protection ( mesh panel solutions ) Relative market share is ~2.5x larger than #2 player Local
Troax Group AB (publ) Hillerstorp 15th of August, 2018
 Hillerstorp 15th of August, 2018") Troax Group AB (publ) Hillerstorp 15th of August, 2018 INTERIM REPORT JANUARY - JUNE 2018 APRIL - JUNE Order intake increased by 8 per cent to 42,9 (39,8) MEUR. Adjusted for currency the increase was 10
Troax Group AB (publ) Hillerstorp 15th of August, 2018 INTERIM REPORT JANUARY - JUNE 2018 APRIL - JUNE Order intake increased by 8 per cent to 42,9 (39,8) MEUR. Adjusted for currency the increase was 10
Order intake increased by 31 per cent to 78,3 (59,6) MEUR. Adjusted for acquisition and
 MEUR. Adjusted for acquisition and") Interim report Q2 2017 January - June Troax Group AB (publ) Hillerstorp 16th August, 2017 INTERIM REPORT 2017 APRIL JUNE 2017 Order intake increased by 30 per cent to 39,8 (30,5) MEUR. Adjusted for acquisition
Interim report Q2 2017 January - June Troax Group AB (publ) Hillerstorp 16th August, 2017 INTERIM REPORT 2017 APRIL JUNE 2017 Order intake increased by 30 per cent to 39,8 (30,5) MEUR. Adjusted for acquisition
Year-end report 2017 January - December YEAR-END REPORT 2017 OCTOBER DECEMBER 2017 JANUARY DECEMBER 2017
 Year-end report 2017 January - December Troax Group AB (publ) Hillerstorp 12th of February, 2018 YEAR-END REPORT 2017 OCTOBER DECEMBER 2017 Order intake increased by 17 per cent to 38,4 (32,8) MEUR. Adjusted
Troax Group AB (publ) Hillerstorp 8th of November, 2018
 Hillerstorp 8th of November, 2018") Troax Group AB (publ) Hillerstorp 8th of November, 2018 INTERIM REPORT JANUARY - SEPTEMBER 2018 JULY - SEPTEMBER Order intake increased by 14 per cent to 40,1 (35,3) MEUR. Adjusted for currency the increase
Troax Group AB (publ) Hillerstorp 8th of November, 2018 INTERIM REPORT JANUARY - SEPTEMBER 2018 JULY - SEPTEMBER Order intake increased by 14 per cent to 40,1 (35,3) MEUR. Adjusted for currency the increase
Troax Group AB (publ) Hillerstorp 13th of February, 2019
 Hillerstorp 13th of February, 2019") Troax Group AB (publ) Hillerstorp 13th of February, 2019 INTERIM REPORT JANUARY - DECEMBER 2018 OCTOBER - DECEMBER Order intake increased by 9 per cent to 41,7 (38,4) MEUR. Adjusted for currency the increase
Troax Group AB (publ) Hillerstorp 13th of February, 2019 INTERIM REPORT JANUARY - DECEMBER 2018 OCTOBER - DECEMBER Order intake increased by 9 per cent to 41,7 (38,4) MEUR. Adjusted for currency the increase
Year-end Report 2016 January - December YEAR-END REPORT 2016 OCTOBER DECEMBER 2016 JANUARY DECEMBER 2016 TROAX GROUP FIGURES
 Year-end Report 2016 January - December Troax Group AB (publ) Hillerstorp 14th February, 2017 YEAR-END REPORT 2016 OCTOBER DECEMBER 2016 Order intake increased by 21 per cent, or 26 per cent adjusted for
INTERIM REPORT JANUARY - SEPTEMBER 2017
 Interim report Q3 2017 January - September Troax Group AB (publ) Hillerstorp 6th of November, 2017 INTERIM REPORT JANUARY - SEPTEMBER 2017 JULY SEPTEMBER 2017 Order intake increased by 30 per cent to 35,3
Q presentation. 19 November 2015
 Q3 2015 presentation 19 November 2015 1 Today s presenters Axel Hjärne Chief Executive Officer Gert Sköld Chief Financial Officer 2 Eltel in brief Q3 2015 business performance Q3 2015 financials Market
SIX MONTHS REPORT, JAN JUN 2018
 SIX MONTHS REPORT, JAN JUN 2018 TELEPHONE/AUDIO CONFERENCE 11 JULY 2018, AT 11.00 CET TOMMY ANDERSSON, PRESIDENT AND CEO HELENA WENNERSTRÖM, EVP AND CFO DIRECT LINK AUDIOCAST: HTTPS://TV.STREAMFABRIKEN.COM/BULTEN
FULL YEAR REPORT, 2017 TELEPHONE/AUDIO CONFERENCE 8 FEBRUARY 2018, AT CET TOMMY ANDERSSON, PRESIDENT AND CEO HELENA WENNERSTRÖM, EVP AND CFO
 TELEPHONE/AUDIO CONFERENCE 8 FEBRUARY 2018, AT 15.30 CET TOMMY ANDERSSON, PRESIDENT AND CEO HELENA WENNERSTRÖM, EVP AND CFO DIRECT LINK AUDIOCAST: HTTPS://TV.STREAMFABRIKEN.COM/BULTEN Q4 2017 TELECONFERENCE:
Interim Jan June/ 2005 results briefing
 Interim Jan June/ 2005 results briefing Helsinki, 4 August 2005 Market and business review Financial results Outlook Jan Lång, President and CEO Jyri Luomakoski, CFO and Deputy CEO Jan Lång Questions Interim
Makes it easier to be professional
 Makes it easier to be professional Handelsbanken Nordic Mid/small Cap Seminar June 8, 2017 President and CEO Johan Nilsson 2 2 Introduction One-Stop-Shop multi channel offering for professionals Branches
BE Group Year-end report 2006
 BE Group Year-end report 2006 Håkan Jeppsson, CEO Torbjörn Clementz, CFO BE Group in Brief A leading supplier independent steel service company. Broad range of steel, stainless steel and aluminium products.
Valmet focus on profitability improvement
 Valmet focus on profitability improvement SEB Nordic Seminar 2015, Copenhagen Pasi Laine, President and CEO Agenda Valmet Roadshow 1 2 3 4 Valmet overview Financial targets Q3/2014 in brief Conclusions
A leading European learning and media company
 A leading European learning and media company Markus Holm, CFO & COO SEB Nordic Seminar 2019 SANOMA AS AN INVESTMENT: A leading European learning and media company Growing dividends Strong and balanced
SIX MONTHS REPORT, JAN JUN 2017
 SIX MONTHS REPORT, JAN JUN 2017 TELEPHONE/AUDIO CONFERENCE 12 JULY 2017, AT 11.00 CET TOMMY ANDERSSON, PRESIDENT AND CEO HELENA WENNERSTRÖM, EVP AND CFO DIRECT LINK AUDIOCAST: HTTPS://TV.STREAMFABRIKEN.COM/BULTEN
IS ABOUT BEING ONE STEP TROAX GROUP AB ANNUAL REPORT 2017 AHEAD«
 » SAFETY IS ABOUT BEING ONE STEP TROAX GROUP AB ANNUAL REPORT 2017 AHEAD« There are dangers to people, property, and processes in the world. But there is no need to worry because we always strive to make
MARTELA. Half year financial report 1-6/2016 August 9th, 2016
 MARTELA Half year financial report 1-6/ August 9th, 1 WORKPLACE SPECIALIST Martela is one of the Nordic leaders specializing in user centric working and learning environments. We offer our customers a
NKT Holding. Interim Report Q Audiocast presentation 8 November 2012 at 10:00 am CET
 NKT Holding Interim Report Q3 2012 Audiocast presentation 8 November 2012 at 10:00 am CET Agenda Page Page 2 2 NKT Group Highlights Q3 2012 Financial results Q3 2012 Companies NKT Cables Nilfisk-Advance
Q1 January 1 31 March May 2016
 Q1 January 1 31 March 2016 19 May 2016 Humana at a glance Humana highlights Clear focus on full responsibility 1 Leading Nordic care company founded in 2001 with four strong business areas Focus on full
ENIRO Q1 REPORT Johan Lindgren, CEO Mattias Lundqvist, CFO Cecilia Lannebo, Head of IR
 ENIRO Q1 REPORT 2012-04-25 Johan Lindgren, CEO Mattias Lundqvist, CFO Cecilia Lannebo, Head of IR FINANCIAL HIGHLIGHTS, Q1 2012 Revenues SEK 959 M (966), a decline of 0,7% (-24). Organically revenues declined
NOBINA AB Investor presentation, Interim report March 2018 May 2018
 1 NOBINA AB Investor presentation, Interim report March 2018 May 2018 FINANCIAL OVERVIEW ¹ NET SALES EBIT EBT CASH FLOW 2,361 (2,205) 104 (95) 72 (58) -74 (-60) FINANCIAL HIGHLIGHTS Net sales grew 7.1%
SIX MONTHS REPORT, JANUARY JUNE 2014
 SIX MONTHS REPORT, JANUARY JUNE 2014 TELEPHONE CONFERENCE 11 JULY, 2014 TOMMY ANDERSSON, PRESIDENT AND CEO TO PARTICIPATE, PLEASE CALL 5 MINUTES BEFORE THE OPENING OF THE CONFERENCE CALL TO SWEDEN +46
Interim report. January June Mattias Björk, CFO. Mårten Andersson, CEO. 17 August 2018
 Q2 Interim report January June Mårten Andersson, CEO Mattias Björk, CFO 17 August Financial development in Q2 Net sales SEK 1,428m (872) EBITA SEK 86m (99) 1600 1400 1200 1000 800 600 400 200 0 160 140
lindab we simplify construction Lindab Group Q Anders Berg, President and CEO Kristian Ackeby, CFO We simplify construction
 Lindab Group Q2 2017 Anders Berg, President and CEO Kristian Ackeby, CFO We simplify construction Agenda Summary and overview Financials Highlights Outlook Summary and Q&A 2 Summary and overview 3 Continued
RECORD SALES, EBITA AND CASH FLOW ACCELERATED ORGANIC GROWTH TO 19 %
 RECORD SALES, EBITA AND CASH FLOW ACCELERATED ORGANIC GROWTH TO 19 % Bygghemma Group First AB (publ) 1 Today s presenters Mikael Olander President and CEO Martin Edblad CFO Bygghemma Group since 2012 CEO
Strategic update. Jyri Luomakoski President and CEO, Uponor Corporation 11 December 2013
 Strategic update Jyri Luomakoski President and CEO, Uponor Corporation 11 December 2013 Presentation outline Markets Strategy Long-term financial targets In summary Appendices 2 Markets Building and construction
Ramirent a progressive rental solutions group
 Ramirent a progressive rental solutions group SEB Enskilda Nordic Seminar, 9 January 2013, Copenhagen Magnus Rosén, President and CEO, Ramirent Plc Helsinki centre, Finland 1 Contents Company in brief
Key Principles Leading the Zumtobel Group as a Global Player in Professional Lighting
 Key Principles Leading the Zumtobel Group as a Global Player in Professional Lighting Introduction of the new CEO of Zumtobel Group, Ulrich Schumacher November 2013 1 AGENDA Personal introduction Positioning
Glaston Capital Markets Day /11/2018 GLASTON CMD 2018
 Glaston Capital Markets Day 2018 9.11.2018 Financials in a nutshell CFO, Päivi Lindqvist 2 Annual net sales 2012-2018 125 100 115,6 42,7 122,2 34,4 124,5 123,4 32,5 19,2 107,1 17,0 109,7 15,6 103,0 10,8
Q MÅRTEN ANDERSSON, CEO MATTIAS BJÖRK, CFO AUGUST 17, 2017
 Q2 2017 MÅRTEN ANDERSSON, CEO MATTIAS BJÖRK, CFO AUGUST 17, 2017 FINANCIAL DEVELOPMENT IN Q2 2017. Net sales SEK 872m (927) EBITA SEK 99m (117) Operating cash flow SEK 89m (132) Q2 2 A WEAK QUARTER WITH
XML Publisher Balance Sheet Vision Operations (USA) Feb-02
 Feb-02") Page:1 Apr-01 May-01 Jun-01 Jul-01 ASSETS Current Assets Cash and Short Term Investments 15,862,304 51,998,607 9,198,226 Accounts Receivable - Net of Allowance 2,560,786
Page:1 Apr-01 May-01 Jun-01 Jul-01 ASSETS Current Assets Cash and Short Term Investments 15,862,304 51,998,607 9,198,226 Accounts Receivable - Net of Allowance 2,560,786
FINANCIAL REPORT January June 2018
 FINANCIAL REPORT January June Strategy We are constantly working according to our established strategy, in order to meet the company s objectives and financial targets. The strategy is based on the following
Cembrit Group Q Unaudited interim report
 Cembrit Group Q4 2017 Unaudited interim report 2017 main events COMMENTARY Strong demand across both markets and product categories resulted in revenue growth of 7.9% YoY 2017 EBITDA showed solid underlying
Interim report for the third quarter, 2005
 int e r i m re p o r t 2 5 Interim report for the third quarter, 25 THE LINDAB GROUP REVENUES DURING THE QUARTER INCREASED BY 13 PERCENT OPERATING PROFIT (EBITA), EXCLUDING ONE-TIME ITEMS INCREASED BY
Acquisition of Fortbet Romanian Entities (Bet Active Concept S.R.L., Bet Zone S.R.L., Public Slots S.R.L., and Slot Arena S.R.L.)
") Acquisition of Fortbet Romanian Entities (Bet Active Concept S.R.L., Bet Zone S.R.L., Public Slots S.R.L., and Slot Arena S.R.L.) Presentation for EGM fortunagroup.eu Amsterdam; June 6th, 2017 Agenda 1.
Acquisition of Fortbet Romanian Entities (Bet Active Concept S.R.L., Bet Zone S.R.L., Public Slots S.R.L., and Slot Arena S.R.L.) Presentation for EGM fortunagroup.eu Amsterdam; June 6th, 2017 Agenda 1.
Performance in January-June August 2010
 Performance in January-June 2010 12 August 2010 Jyri Luomakoski President and CEO Uponor Corporation Summary of Q2/2010 Financial turmoil after Q1 rocked the stabilising development in the market-place
Vattenfall Capital Markets Day 2009
 Vattenfall Capital Markets Day 2009 Presentation by: Dag Andresen First Senior Executive Vice President Group CFO Amsterdam, 23 September 2009 Contents Financial targets and outcome Nuon acquisition Actions
Interim report. January September Mårten Andersson, CEO Mattias Björk, CFO 6 November 2018
 Q3 Interim report January September Mårten Andersson, CEO Mattias Björk, CFO 6 November Financial development in Q3 Net sales SEK 1,470m (1 224) EBITA SEK 123m (96) 1600 1400 1200 1000 800 600 400 200
Q presentation. 10 May Nordic market leader in chicken products
 Q1 2016 presentation 10 May 2016 Nordic market leader in chicken products 0 Summary of Q1 2016 Strong growth in net sales, particularly in chilled products Continued strong performance in Sweden Substantial
RECORD-BREAKING FOURTH QUARTER SALES AND EBITA AS MARKET CONDITIONS RETURN TO NORMAL
 RECORD-BREAKING FOURTH QUARTER SALES AND EBITA AS MARKET CONDITIONS RETURN TO NORMAL Bygghemma Group First AB (publ) 1 Today s presenters Mikael Olander President and CEO Martin Edblad CFO Bygghemma Group
Interim Report January March 2003
 Interim Report January March 2003 23 April 2003 January-March Jan.-Dec. April-March Key figures 2003 2002 2002 2002/03 Net sales, SEK m 2,346 2,404 9,594 9,536 Operating income before depreciation, SEK
Improved margin and cash flow in Q1 2013
 2013-06-04 BofA Merrill Lynch Global Telecom & Media conference June 4, 2013 Per-Arne Blomquist President and CEO 1 Improved margin and cash flow in Q1 2013 Revenue growth impacted by reduced mobile interconnect
2012 Interim Results - Presentation ZURICH, 23 AUGUST 2012
 2012 Interim Results - Presentation ZURICH, 23 AUGUST 2012 Agenda - Highlights - Financials - Outlook 2 Strong position in Asia leads to improved operating results for HY 2012 Turnover +26.7% Negative
Six good reasons for choosing DNB in the new banking environment
 Six good reasons for choosing DNB in the new banking environment Bank of America Merrill Lynch, 18th Annual Banking & Insurance CEO Conference 2013 24 September, London Rune Bjerke, CEO of DNB 1 Reason
equal to a 19 % (20) operating margin Order intake was SEK 336 m (328), corresponding to an increase of 3 %
 operating margin Order intake was SEK 336 m (328), corresponding to an increase of 3 %") Second quarter Net sales for the second quarter reached SEK 329 m (299), corresponding to an increase of 10 % Operating profit reached SEK 63 m (59) equal to a 19 % (20) operating margin Order intake was
Second quarter Net sales for the second quarter reached SEK 329 m (299), corresponding to an increase of 10 % Operating profit reached SEK 63 m (59) equal to a 19 % (20) operating margin Order intake was
Q Interim Report. October 25, 2018 Panu Routila, President & CEO Teo Ottola, CFO
 Q3 2018 Interim Report October 25, 2018 Panu Routila, President & CEO Teo Ottola, CFO 2 Agenda 1. Group highlights 2. Business Area Service 3. Business Area Industrial Equipment 4. Business Area Port Solutions
Investor presentation, Interim report June 2018 August 2018 NOBINA AB. Nobina investor presentation, Q2 2018/19
 1 Investor presentation, Interim report June 2018 August 2018 NOBINA AB SECOND QUARTER WITH SOLID PERFORMANCE NET SALES EBIT EBT CASH FLOW SEK Millions 2,235 (2,169) SEK Millions 117 (106) SEK Millions
Strong earnings growth, successful refinancing and additional acquisition
 Interim report for the period 1 January 30 September 2017 All amounts in the report relate to the Group and are stated in SEK thousands unless otherwise indicated. Figures in brackets refer to the corresponding
Interim report January-September 2018 Published on October 25, 2018
 Interim report January-September 2018 Published on October 25, 2018 Third quarter 2018 Increased sales and higher result Sales increased 17 per cent to 3,443 (2,936). Operating profit increased 12 per
INTERIM REPORT Q2-2011
 INTERIM REPORT Q2-2011 Live presentation 23 August 2011 at 11:00 am NKT Holding A/S / IR presentation / Interim Report 2, 2011 1 Agenda Highlights Q2 Financial results Q2 2011 Companies - NKT Cables -
Managing cash in society.
 interim report January June 2012 Managing cash in society. Continued margin improvement January June 2012 Revenue during the period amounted to MSEK 5,720 MSEK (5,210). Real growth amounted to 6 percent
Q3 results Bengt Andersson Bernt Ingman
 Q3 results 2006 October 19, 2006 Bengt Andersson Bernt Ingman President and CEO CFO Sales and Earnings Third quarter First nine months 1) SEKm 2006 % of sales 2005 Adj. Change % change 2) 2006 2005 Change
Q2 April June August 2016
 Q2 April June 216 19 August 216 Underlying market and current trends Business area Market outlook per segment Individual & Family Underlying market growth and demand continuously strong in I&F segments
EVRY ASA Q PRESENTATION CEO BJÖRN IVROTH CFO HENRIK SCHIBLER
 1 EVRY ASA Q3 2018 PRESENTATION CEO BJÖRN IVROTH CFO HENRIK SCHIBLER Agenda Group highlights Business update Financial highlights Business area performance Concluding remarks Q&A 2 Group highlights Q3
P R E S S R E L E A S E
 P R E S S R E L E A S E from ASSA ABLOY AB (publ) 2 November 2004 No. 12/04 ASSA ABLOY: CONTINUED STRONG ORGANIC GROWTH IN THE THIRD QUARTER Sales in the third quarter increased organically by 6% to SEK
Interim Report January March 2018
 Interim Report January March 2018 Loomis Interim Report January March 2018 2 January March 2018 Revenue SEK 4,486 million (4,279). Real growth 8 percent (3) and organic growth 3 percent (3). Operating
Munksjö Oyj Interim report January-June Stockholm, 23 July 2014 Jan Åström, President and CEO
 Munksjö Oyj Interim report January-June 2014 Stockholm, 23 July 2014 Jan Åström, President and CEO 1 Synergy benefits and integration 2 Key financials for Q2/14 and H1/14 3 Business Area performance 4
Q3 Report 2017 Conference call. 8 November 2017 Asbjørn Eskild, President and CEO Stephan Révay, CFO
 Q3 Report 2017 Conference call 8 November 2017 Asbjørn Eskild, President and CEO Stephan Révay, CFO Highlights Q3 2017 Continued strong organic growth +7.1% Favourable Macro trends Internal growth initiatives
Half-year report January-June 2018 Published on July 18, 2018
 Half-year report January-June 2018 Published on July 18, 2018 Second quarter 2018 Increased sales and higher result Sales increased 7 per cent to 3,461 MSEK (3,230). Operating profit increased 9 per cent
Lindab Group presentation Q2 2010
 lindab group presentation Lindab Group presentation Q2 2010 David Brodetsky, CEO Nils-Johan Andersson, CFO Agenda Highlights Group Business Areas Strategy Trends and outlook Q & A 2 Lindab Group Highlights
Sales and results of operations Group
 Sales and results of operations Group Progress in the quarter Assets under management increased by SEK 25 Bn, up 18% Both fixed and variable earnings increased The increase in operating profit is driven
Q2 Presentation August 23 rd 2018
 Q2 Presentation August 23 rd 2018 PRESENTERS Michael Holmberg CEO Andreas Kovacs CFO 2 3 RAKETECH S MISSION To guide and inspire people to informed decisions. RAKETECH S VISION To always be the first choice
Q Martin Ödman CEO
 Q3 Martin Ödman CEO Proact Summit tember/october More than 1 000 participants Very good feedback from the customers many leads Increased interest from the customers with regards to Proact s own tracks
ENIRO Q3 REPORT Johan Lindgren, CEO Mattias Lundqvist, CFO Cecilia Lannebo, Head of IR
 ENIRO Q3 REPORT 2012-10-25 Johan Lindgren, CEO Mattias Lundqvist, CFO Cecilia Lannebo, Head of IR CEO INTRODUCTION & SUMMARY A digital media company with 74 percent of revenues being digital the transformation
Viking Assistance Group AS. Quarterly Report 2Q17 April June 2017
 Viking Assistance Group AS Quarterly Report 2Q17 April June 2017 SECOND QUARTER 2017 SUMMARY Group revenues of MNOK 186.2 : 12 percent YoY growth Group EBITDA of MNOK 21.4 : 14 percent YoY growth Solid
Huhtamaki roadshow presentation. Investor Relations Q1 2009
 Huhtamaki roadshow presentation Investor Relations 2009 Huhtamaki in brief A leading manufacturer of consumer and specialty packaging with head office in Espoo, Finland Net sales EUR 2.3 billion in 65
Q3 FY18 Noteholder Presentation 29 TH AUGUST 2018
 Q3 FY18 Noteholder Presentation 29 TH AUGUST 2018 The Presenting Team David Flochel Gabriel Pirona CEO CFO Agenda 01 SELECTA TODAY 02 TRADING UPDATE 03 FINANCIAL RESULTS 04 APPENDIX 01 Selecta Today 01
SCHMOLZ + BICKENBACH Q Results Investors & Analysts Conference Call Lucerne, August 11, 2017
 SCHMOLZ + BICKENBACH Q2 2017 Results Investors & Analysts Conference Call Lucerne, August 11, 2017 Disclaimer Forward-looking statements This presentation contains forward-looking statements about developments,
Interim Report January June 2018
 Interim Report January e APRIL JUNE > Net sales increased by 11 per cent to SEK 415.8 million (376.1). In USD terms, net sales increased by 14 per cent. > Order intake increased by 11 per cent to SEK 409.6
Investment Ideas in Denmark
 Investment Ideas in Denmark Presented by Poul Møller, CEO 1 December 2005, London Vision and Business Focus Vision We will with increasing profitability develop the company to be among leading providers
Q PRESENTATION. 26 th October Leif Gustafsson, CEO Aku Rumpunen, CFO
 Q3 218 PRESENTATION 26 th October 218 Leif Gustafsson, CEO Aku Rumpunen, CFO Q3 218 Highlights Organic sales growth of 6.3% was supported by both business divisions Comparable EBITA improved by 3.5% to
interim report 2/2013 Consolidated Financial Statements Consolidated Income Statement 4 Consolidated Balance Sheet 5
 interim report 2/2013 Consolidated Financial Statements Consolidated Income Statement 4 Consolidated Balance Sheet 5 Consolidated Cash Flow Statement 6 Consolidated Statement of Changes in Shareholders
RESULT JANUARY-JUNE 2006, August 8th. Mr. Kim Gran, President and CEO
 RESULT JANUARY-JUNE 2006, August 8th Mr. Kim Gran, President and CEO 1 CONTENTS Result H1 2006 Page Key figures 3 Operating profit per quarter 4 Market situation 5 Nokian Tyres H1 2006 6 Net sales by product
Continued favourable organic growth
 Continued favourable organic growth (Figures in brackets refer to the corresponding period in 2006.) Sales for kitchen company Nobia rose by 6 per cent during the third quarter to SEK 3,861 million (3,631).
Interim Report for First Quarter 2015
 Interim Report for First Quarter First quarter The quarter began with weak order intake, which gradually improved. Order intake was 10 percent lower than in the strong first quarter of Sales volumes were
Lindab Group presentation Q3 2010
 lindab group presentation Lindab Group presentation Q3 2010 David Brodetsky, CEO Nils-Johan Andersson, CFO Agenda Highlights Group Business Areas Strategy Trends and outlook Q & A 2 Lindab Group Highlights
hms networks Fourth quarter Yearly Y E A R - E N D R E P O R T JANUARY - DECEMBER
 hms networks Y E A R - E N D R E P O R T 2 0 1 6 JANUARY - DECEMBER Yearly Net sales for the full year increased by 36 % reaching SEK 952 m (702), corresponding to a 34 % increase in local currencies.
NKT. Annual Report 2010 Live presentation 1 March 2011 at 11:00 am. NKT Holding A/S / IR presentation / Annual Report
 NKT Annual Report 2010 Live presentation 1 March 2011 at 11:00 am NKT Holding A/S / IR presentation / Annual Report 2010 1 Agenda NKT Group 2010 in headlines Expectations 2011 Financial results 2010 NKT
Year end report Jan Dec February, 2019
 Year end report Jan Dec 2018 6 February, 2019 2 3 Who is Henrik Hjalmarsson? Born: 1976 Previous positions: SVP Inwido Sweden-Norway (2017-2019), CEO Findus Nordic (2016-2017), CEO Findus Sweden and Denmark
Amounts in million SEK (except percentageand operational figures) Q Q YTD 2018 YTD 2017 FY 2017
 Q Q YTD 2018 YTD 2017 FY 2017") Report Q3 l 2018 HIGHLIGHTS BEWiSynbra reported net sales of SEK 1,160.2 million for Q318, up from SEK 459.7 million for Q317, an increase of 152 per cent of which 133 percentage points (pp) was explained
Report Q3 l 2018 HIGHLIGHTS BEWiSynbra reported net sales of SEK 1,160.2 million for Q318, up from SEK 459.7 million for Q317, an increase of 152 per cent of which 133 percentage points (pp) was explained
Q3 Report October 25, 2017
 Q3 Report 2017 October 25, 2017 CEO s comments A weak operating profit, 49 MSEK (91). Different trends across the business. Organic sales growth: APAC +9% EMEA -5% Americas +/- 0 Overall the sales contracted
CONSTI GROUP PLC INTERIM REPORT 1 JANUARY 30 SEPTEMBER 2017
 CONSTI GROUP PLC INTERIM REPORT 1 JANUARY 30 SEPTEMBER 2017 Interim CEO Esa Korkeela Building renovation specialist www.consti.fi Contents Highlights and Group performance Cash flow and financial position
Gunnebo Group Q July 2018
 Gunnebo Group Q2 2018 19 July 2018 CEO Comments Divestment of business in France, Belgium and Luxemburg Focus on key product areas new report segment structure + organisation New financial targets We are
Interim Report January March 2017
 First Quarter - 2017 Interim Report January March 2017 Order intake was MSEK 1,314.0 (1,142.0), which is an overall growth of.1% adjusted to 4.7% for acquisitions of MSEK 118.0. The overall year to date
INTERIM REPORT JANUARY MARCH President and CEO Håkan Buskhe 25 April, 2013
 INTERIM REPORT JANUARY MARCH 2013 President and CEO Håkan Buskhe 25 April, 2013 JANUARY - MARCH IN BRIEF 2013 2013 Sweden International 2013 %-Change 2012 bookings 18,865 372 4,000 backlog 47,059 32 35,657
First three quarters and Q3 results 2018
 First three quarters and Q3 results 2018 Peter Nilsson, CEO Cathrin Nylander, CFO 19 October, 2018 Financial highlights Q3: Strong order growth, including oil and gas Orders Received 25% growth MNOK 669
Year-End Report. Net sales, MSEK 1,776 1,677 6,088 6,052 EBITDA excl. non-recurring items, MSEK
 Year-End Report 2016 Q4 IN BRIEF Oct - Dec Oct - Dec Jan - Dec Jan - Dec Net sales, MSEK 1,776 1,677 6,088 6,052 EBITDA excl. non-recurring items, MSEK 203 181 561 505 EBITDA margin excl. non-recurring
Q22018 GUNNEBO. Gunnebo To Focus on Main Products. Comments by Gunnebo s President & CEO
 GUNNEBO Q22018 Gunnebo To Focus on Main Products Comments by Gunnebo s President & CEO We have made a strategic review of the product portfolio of Gunnebo and decided to focus on three core areas going
163,28,22 230,203,96 191,191,191 0,51,153 26,173, ,219, ,64, ,160,98
 1 Legal Disclaimer Information in this presentation may involve guidance, expectations, beliefs, plans, intentions or strategies regarding the future. These forward-looking statements involve risks and
WA WallVision AB (publ), corp. no Interim report January 1, 2016 September 30, 2016 THIRD QUARTER: ORGANIC GROWTH IN CORE MARKETS
, corp. no Interim report January 1, 2016 September 30, 2016 THIRD QUARTER: ORGANIC GROWTH IN CORE MARKETS") All figures pertain to the Group unless otherwise stated. Comparisons in the interim report refer to the corresponding period in the 2015 fiscal year, unless otherwise stated. THIRD QUARTER: ORGANIC GROWTH
All figures pertain to the Group unless otherwise stated. Comparisons in the interim report refer to the corresponding period in the 2015 fiscal year, unless otherwise stated. THIRD QUARTER: ORGANIC GROWTH
Net sales, MSEK 1,632 1,776 5,991 6,088 EBITDA excl. items affecting comparability (IAC), MSEK
, MSEK") Q4 2017 2017 2016 2017 2016 Q4 IN BRIEF Q4 Q4 YTD YTD Net sales, MSEK 1,632 1,776 5,991 6,088 EBITDA excl. items affecting comparability (IAC), MSEK 163 203 486 561 EBITDA margin excl. items affecting
Q4 2017 2017 2016 2017 2016 Q4 IN BRIEF Q4 Q4 YTD YTD Net sales, MSEK 1,632 1,776 5,991 6,088 EBITDA excl. items affecting comparability (IAC), MSEK 163 203 486 561 EBITDA margin excl. items affecting
2018 First-quarter results
 2018 First-quarter results April 25, 2018 Forward looking statements It should be noted that certain statements herein which are not historical facts, including, without limitation, those regarding expectations
MADE TO TRADE. Goldman Sachs 18 th Annual Global Retailing Conference. Dr Eckhard Cordes, CEO 8 September 2011 METRO AG 2011
 MADE TO TRADE. Goldman Sachs 18 th Annual Global Retailing Conference Dr Eckhard Cordes, CEO 8 September 2011 METRO AG 2011 Disclaimer and Notes To the extent that statements in this presentation do not
Interim Jan-March 2007 results briefing Helsinki 26 April Jan Lång President and CEO
 Interim Jan-March 2007 results briefing Helsinki 26 April 2007 Jan Lång President and CEO Q1/2007: Positive market environment in Europe, decline in U.S. continues Lively demand for Uponor solutions Strong
Positive development for all business areas
 Nolato AB three-month interim report 2012, page 1 of 14 Nolato AB (publ) three-month interim report 2012 Positive development for all business areas First quarter of 2012 in brief Sales increased by 10%