B Y D E S I G N FELCOR LODGING TRUST 2013 ANNUAL REPORT
|
|
|
- Philip Dorsey
- 5 years ago
- Views:
Transcription
1 B Y D E S I G N FELCOR LODGING TRUST 2013 ANNUAL REPORT


2
3 Last year, we committed to delivering on our strategic objectives. We said we would sell non-strategic hotels, continue to pay down debt to further strengthen our balance sheet, achieve desired returns on our acquired and recently redeveloped hotels and provide a steady dividend to you, our stockholders. To do that, every business decision we made was designed to deliver on those commitments. This deliberate approach is paying off. We achieved greater financial flexibility and an improved portfolio, which will help ensure our success this year and in the future. FelCor s business is stronger than ever out-performing the industry and delivering superior stockholder value. 1. The Fairmont Copley Plaza Boston, MA 2. The Mills House Wyndham Grand Hotel Charleston, SC 3. Embassy Suites Myrtle Beach-Oceanfront Resort, SC 4. Marriott San Francisco-Union Square, CA 5. Royalton New York, NY 6. Morgans New York, NY 7. Embassy Suites Napa Valley, CA 8. Renaissance Vinoy St. Petersburg Resort & Golf Club, FL 9. Renaissance Esmeralda Indian Wells Resort & Spa, CA
4 Knickerbocker Hotel New York, NY to our stockholders: FelCor had a great year in We reinstated a quarterly common dividend, a critical milestone of our strategic plan. Our comparable core hotels realized revenue per available room (RevPAR) growth of more than 8%, led by an 11% increase at our acquired and recently redeveloped hotels. Adjusted funds from operations (AFFO) increased 70% to $0.39 per share. Our total interest expense declined $23 million, or 18%, as we continued to strengthen our balance sheet. We sold five non-strategic hotels for $103 million (with two more already sold this year for $41 million) and used the proceeds to repay debt. Finally, we made steady progress toward completing the Knickerbocker redevelopment. This hotel, which will open early this fall, will be the crown jewel of our portfolio generating growing EBITDA and long-term value for FelCor. During 2014, we will be focused on completing our plan and fulfilling our commitment: sell the remaining nonstrategic hotels and use proceeds to repay debt; open and position the Knickerbocker for success; and continue operational improvement and achievement of desired returns at our acquired and recently redeveloped hotels. Our commitment to you is rooted in our culture and our values. Our success depends on a team of hard-working and devoted colleagues. Their commitment to FelCor and to one another is why FelCor is a Top 100 Workplace in Dallas-Fort Worth. $ 103 M ASSET SALE S IN 2013 of NON-STRATEGIC HOTELS SOLD FELCOR LODGING TRUST ANNUAL REPORT

5
6
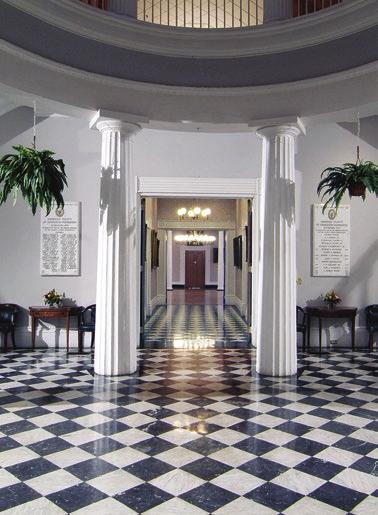
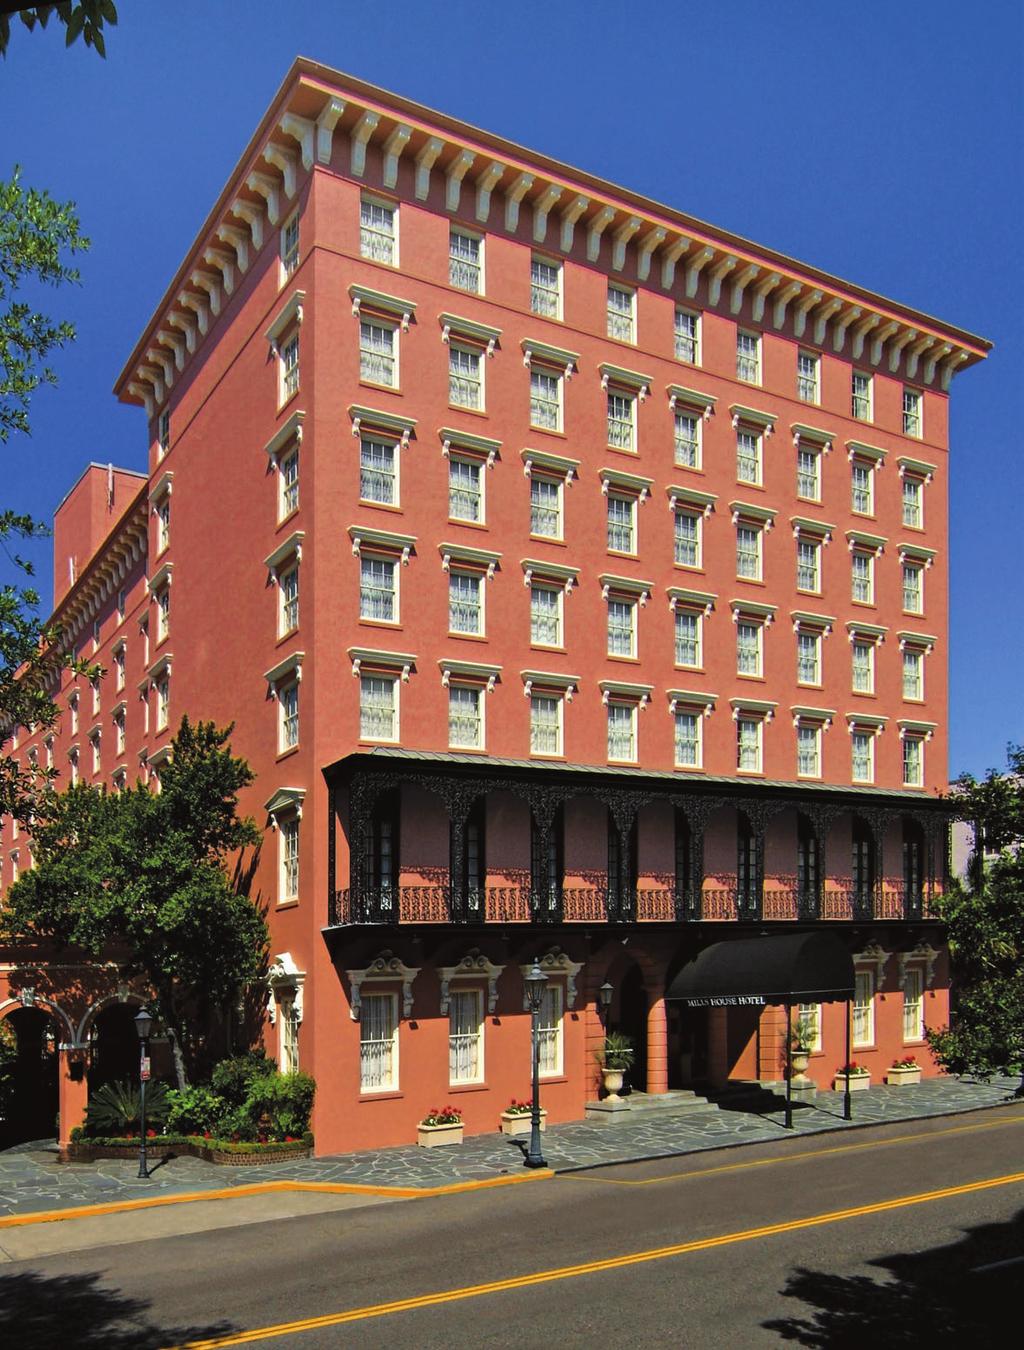
7 The Mills House Wyndham Grand Charleston, SC the mills house WYNDHAM GRAND C HARLESTON, SC The Mills House is an iconic hotel located in Charleston s über charming historic downtown. We converted this hotel, along with seven others, from Holiday Inn to Wyndham brands and management in 2013, as part of a 10-year agreement with Wyndham Hotel Group. As a Wyndham Grand, the property underwent an $8 million renovation to reposition it from midscale to luxury, which illustrates our strategy to maximize real estate value and, thereby, increase stockholder value. S ELLING NON-STRATEGIC HOTELS Our progress toward transforming the portfolio remains a source of pride. Selling non-strategic hotels improves our portfolio s overall quality and geographic diversity, and enhances our return on invested capital. During 2013, we sold five hotels for $103 million and agreed to sell two more hotels for $41 million (which we subsequently sold in 2014). As of today, we have 19 nonstrategic hotels remaining to sell. Ten of the hotels are owned in a joint venture with one of our brand-managers. We are working diligently to unwind that joint venture, as a consequence of which we would own five of those hotels outright (our joint venture partner would own the other five). Upon completion, we would then have 14 hotels remaining to sell, most of which we expect to sell during Our 39 core hotels are located in markets with high barriers-to-entry that are expected to enjoy high EBITDA and RevPAR growth. Our comparable core hotels generated RevPAR of $127 in 2013, compared to $84 for the non-strategic hotels, while Hotel EBITDA in 2013 at our comparable core hotels increased 13%, compared to 6% for the non-strategic hotels. STRENGTHENING OUR BALANCE SHEET Our increasingly strong balance sheet lives at the core of our strategy. It provides us with the flexibility we need to grow, compete, and to thrive through economic cycles. We will continue to focus on improving our balance sheet by selling non-strategic hotels and using the net proceeds to repay debt. We will repay nearly $400 million of debt, including all of our 2014 maturities, as well as other high-cost secured debt. After repaying that debt, we will have restructured our balance sheet with no near-term maturities and an average debt maturity of Furthermore, we expect to achieve an average borrowing cost of roughly 5.9% (the lowest in FelCor s history), compared to 6.3% today, with roughly 90% of the debt bearing a fixed interest rate. Additionally, as EBITDA stabilizes (primarily at our acquired and recently redeveloped hotels), we will reach our target leverage (debt to adjusted EBITDA) of 5.0x. In addition, we expect interest coverage (adjusted EBITDA to interest expense) will improve significantly to above 3.0x. FELCOR LODGING TRUST ANNUAL REPORT
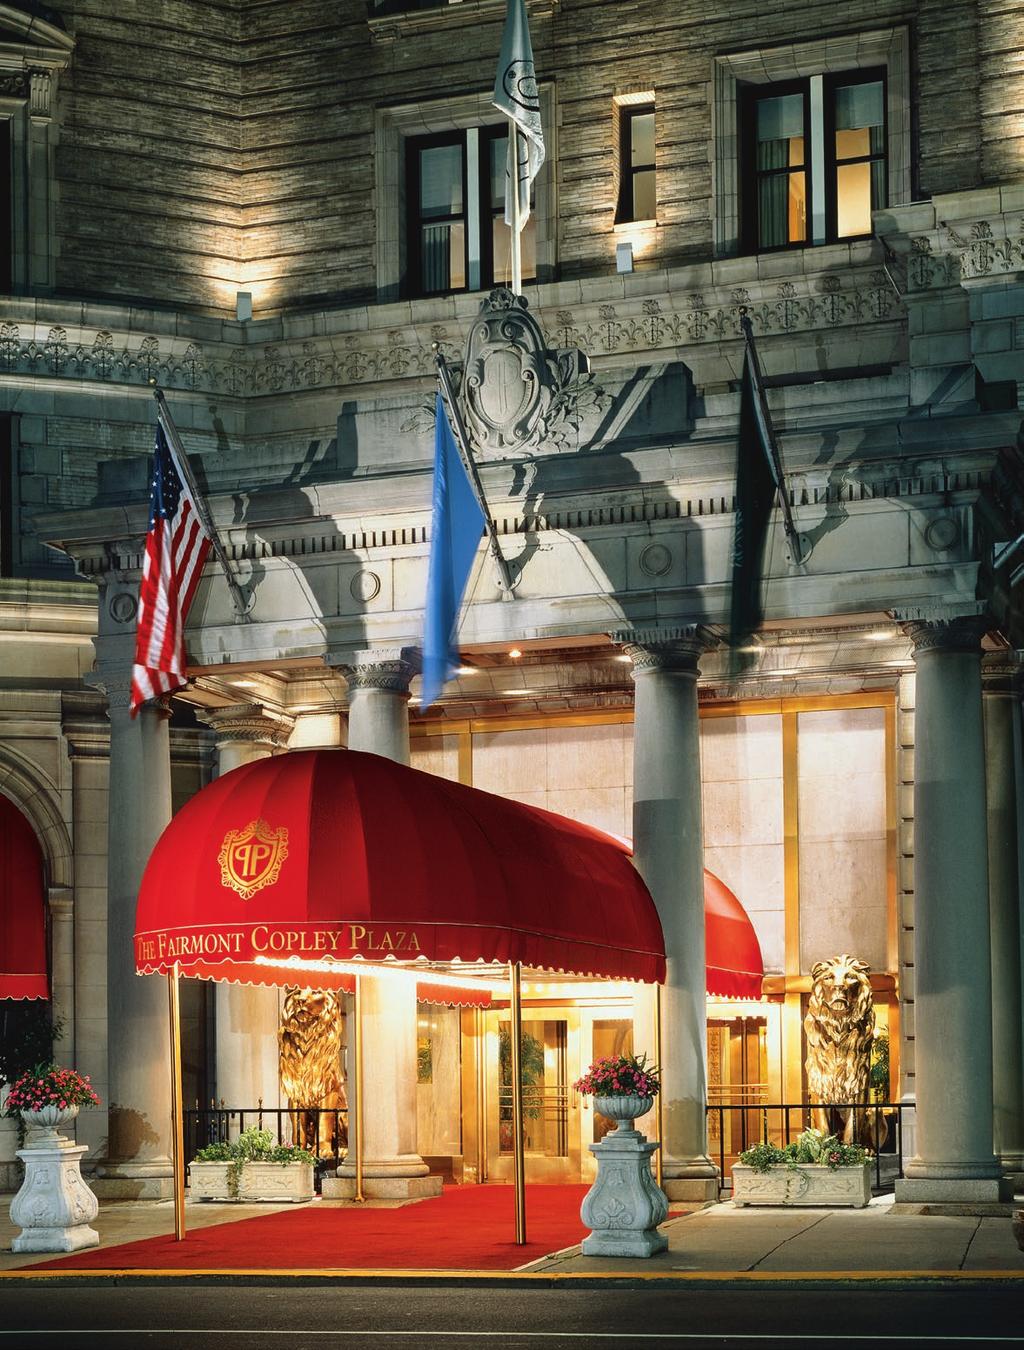
8 The Fairmont Copley Plaza Boston, MA OPERATIONS Lodging industry fundamentals remain strong, and the industry continues to enjoy a favorable imbalance between demand and supply growth. RevPAR in the United States increased 5.4% during 2013, driven by occupancy and average rate growth of 1.5% and 3.9%, respectively. The outlook for supply growth remains favorable, as new construction of hotels in the U.S. has fallen nearly 60% since 2007 and remains near historical lows. As demand growth outpaces new supply, average occupancy will increase, providing further opportunity to increase average rates. PKF, a leading lodging consultant, expects RevPAR in the U.S. to grow 6.6% during 2014 and 7.5% during FelCor s operating results exceeded our expectations during 2013, with RevPAR increasing 7.1% at our comparable hotels. Our portfolio again outperformed the industry, reflecting our strategically-located, high-quality portfolio. Our comparable core hotels performed even better with RevPAR growth of more than 8%, led by an 11% increase at our acquired and recently redeveloped hotels. As occupancy continues recovering from recession-era lows, our portfolio occupancy has nearly reached prior-peak levels, and our hotels are taking advantage of the favorable supply/demand imbalance by capturing more premium guests, such as corporate transient, which comprise almost 50% of our room nights. As our properties replace discount business with premium customers, average rates increase. To maximize return on this opportunity, we work daily with the operators to ensure our hotels achieve the optimal customer mix and take advantage of the strong demand in the market A $65.00 revpar 2008A $ A $ A $ Core $ Core is for comparable core hotels. FELCOR LODGING TRUST ANNUAL REPORT
9
10
11 Morgans New York, NY Morgans N EW YORK, NY Morgans, the original boutique hotel, is located in the heart of midtown Manhattan, one of New York s most dynamic and desirable neighborhoods. When we purchased the hotel in 2011, we recognized an opportunity to improve operations significantly and maximize real estate value. Since then, FelCor has added three guest rooms and built new fitness and restaurant/bar facilities (completed in 2013) and implemented revenue and customer mix strategies to increase average rate. These efforts illustrate how we use capital to improve our properties performance and, thereby, increase stockholder value. REDEVELOPMENT PROJECTS During 2013, our acquired and recently redeveloped hotels continued to perform very well, as Hotel EBITDA grew an average of 28%. EBITDA at the Fairmont Copley Plaza in Boston (which was redeveloped in 2012) grew an outstanding 83% in We also completed the redevelopment at Morgans last year, adding three guest rooms, a new fitness facility, a library and a new restaurant and lounge. We expect EBITDA growth at Morgans, over the next few years, to mirror the other redeveloped hotels, as it benefits from our capital investment and intense asset management practices. In March 2013, we converted eight former Holiday Inn hotels. Our properties in Boston, Houston, New Orleans, Philadelphia, Pittsburgh, San Diego and Santa Monica were rebranded to Wyndham Hotels, and The Mills House in Charleston became a Wyndham Grand hotel. Wyndham Worldwide Corporation is providing a $100 million guaranty through 2023, ensuring a minimum annual NOI for the eight hotels and protecting approximately 20% of our EBITDA from cyclical and economic fluctuations, in addition to ensuring returns on investment that are superior to the hotels historical performance. While these hotels experienced disruption from the change in management and brand last year, they should produce RevPAR growth well above the portfolio average this year, as the disruption subsides. The iconic Knickerbocker hotel in Manhattan will reopen early this fall as a four-plus star hotel. Located at Broadway and 42nd Street, the Knickerbocker enjoys an incomparable address for both business and leisure travelers. As FelCor s flagship, the hotel will feature 330-guestrooms averaging more than 420 square feet and several food and beverage outlets, including a rooftop sky bar and lounge directly overlooking Times Square. The hotel s executive team is in place and fully engaged to ensure a successful and strong opening. Earlier this year, we finalized an agreement with Charlie Palmer, one of the nation s most recognized master chefs, to manage the food and beverage operations. Mr. Palmer s Michelinstarred Aureole is located across 42nd Street from the hotel and offers coordinated sales and marketing opportunities. FELCOR LODGING TRUST ANNUAL REPORT
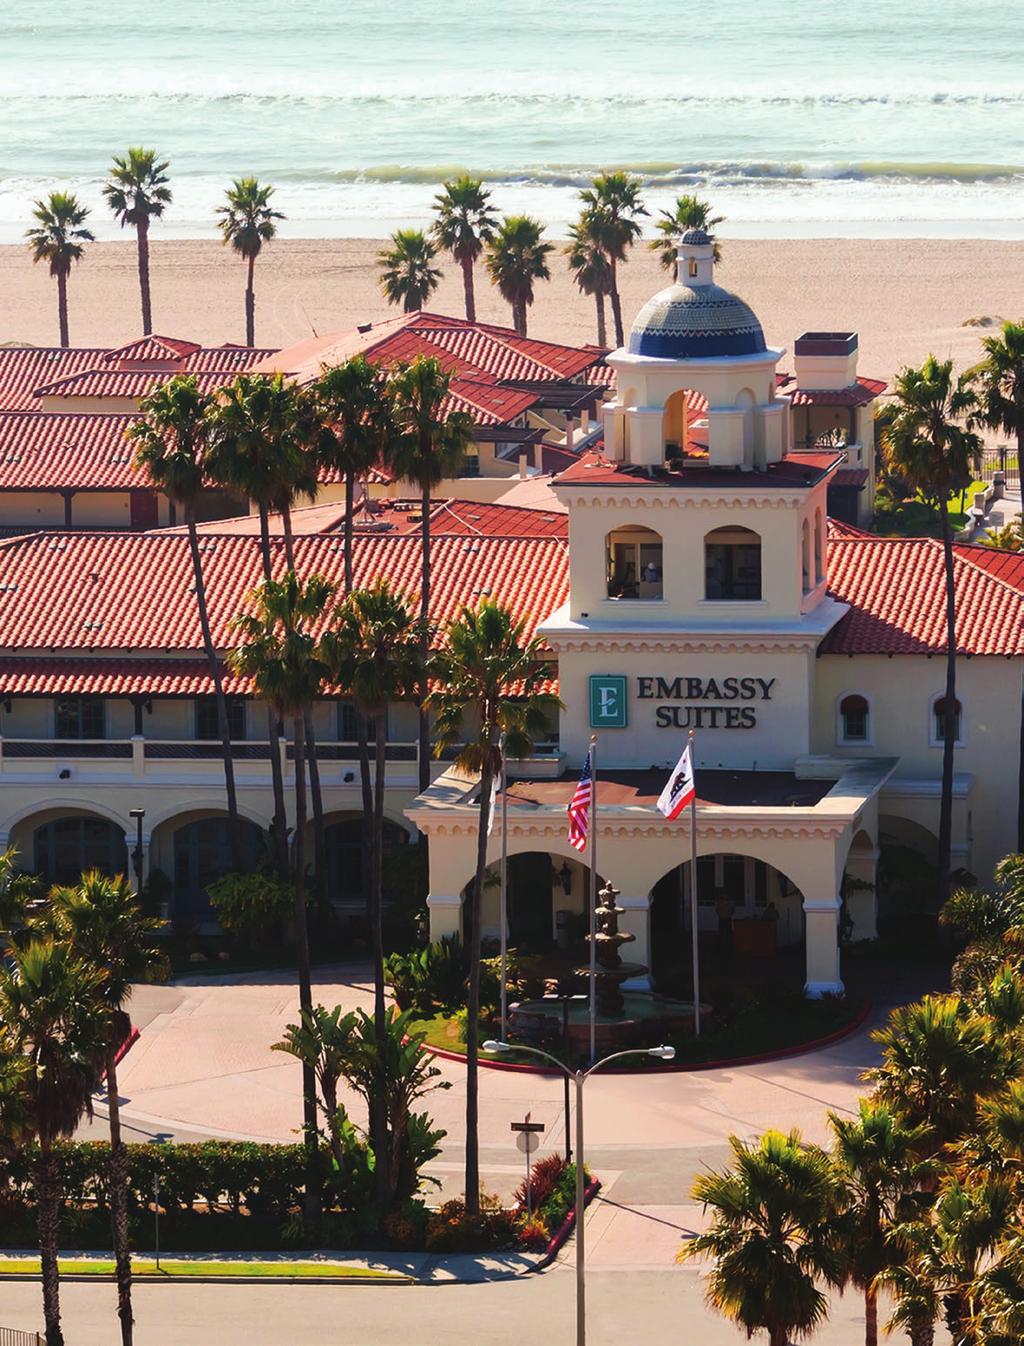
12 Embassy Suites Mandalay Beach Hotel & Resort, CA OUR COMMITMENT You are invested in a first-class real estate company with a strong and flexible balance sheet and a high-quality, diverse portfolio that outperforms the industry and its peers. Over the foreseeable future, our EBITDA and FFO will continue to grow significantly, as the Knickerbocker opens and stabilizes, our other acquired and recently redeveloped hotels benefit from capital investments, and our remaining portfolio capitalizes on the strong industry fundamentals. As EBITDA grows and we repay debt with asset sale proceeds, our balance sheet will be even stronger, with low leverage, ample liquidity and significant free cash flow generation. as opportunities that further improve our balance sheet. We will create additional balance sheet capacity for these opportunities by continually selling lower growth hotels. We will deploy that capital prudently and diligently and in ways that provide the best return for stockholders whether that entails acquisitions in our target markets, further lowering our cost of capital or executing one or more of the several redevelopment projects that are currently in the approval and entitlement stage. These investments yield strong returns, which will provide FelCor with outstanding long-term growth. This is our commitment to you. 16% 25% revenues 8% Urban Resort 51% Airport Suburban Percentage of total revenues, pro forma for Knickerbocker (as stabilized) This year marks the end of one chapter in our transformation. The next chapter is entirely about building on that great foundation to deliver superior results and build long-term stockholder value. We will maintain a flexible and enduring balance sheet that has a low cost of capital and strong liquidity, which will ensure our ability to weather future economic downturns and to profit from them thereby building stockholder value throughout the cycle. We will proactively seek the best opportunities that will further improve our portfolio quality and growth rates, as well Sincerely, Richard A. Smith President & CEO Tom Corcoran Chairman of the Board FELCOR LODGING TRUST ANNUAL REPORT
13
14 OUR PORTFOLIO OF CHOICE PROPERTIES EAST MASSACHUSETTS Fairmont Copley Plaza Boston Embassy Suites Boston/Marlborough Wyndham Boston-Beacon Hill NEW JERSEY Embassy Suites Secaucus-Meadowlands NEW YORK The Knickerbocker Morgans New York Royalton New York PENNSYLVANIA Sheraton Society Hill Philadelphia VERMONT Sheraton Burlington Hotel & Conference Center SOUTH ALABAMA Embassy Suites Birmingham FLORIDA Embassy Suites Deerfield Beach Resort & Spa Embassy Suites Fort Lauderdale-17th Street Embassy Suites Miami-International Airport DoubleTree Suites by Hilton Walt Disney World Resort Wyndham New Orleans-French Quarter TENNESSEE Holiday Inn Nashville-Opryland-Airport (Briley Parkway) TEXAS DoubleTree Suites by Hilton Austin Embassy Suites Dallas-Love Field Wyndham Hotel & Suites Houston-Medical Center WEST ARIZONA Embassy Suites Phoenix-Biltmore Embassy Suites San Francisco-Airport/South San Francisco Holiday Inn San Francisco-Fisherman s Wharf Marriott San Francisco-Union Square Embassy Suites Milpitas Wyndham Santa Monica-At the Pier MIDWEST MINNESOTA Embassy Suites Minneapolis-Airport DoubleTree Suites by Hilton Charlotte-SouthPark Embassy Suites Chicago-Lombard/Oak Brook Westin Dallas-Park Central DoubleTree Suites by Hilton Doheny Beach-Dana Point Embassy Suites Indianapolis-North Embassy Suites Kansas City-Plaza Embassy Suites Kansas City/Overland Park Holiday Inn Orlando-International Airport Embassy Suites Parsippany Wyndham Philadelphia-Historic District Wyndham Pittsburgh-University Center SOUTH CAROLINA The Mills House Wyndham Grand Hotel Charleston Embassy Suites Myrtle Beach-Oceanfront Resort Hilton Myrtle Beach Resort Embassy Suites Orlando-International Drive South/Convention Renaissance Vinoy St. Petersburg Resort & Golf Club Holiday Inn Orlando-International Airport GEORGIA Embassy Suites Atlanta-Buckhead LOUISIANA Holiday Inn Chateau LeMoyne New Orleans-French Quarter CALIFORNIA Renaissance Esmeralda Indian Wells Resort & Spa Embassy Suites Los Angeles-International Airport/South Embassy Suites Mandalay Beach-Hotel & Resort Embassy Suites Napa Valley Wyndham San Diego-Bayside Embassy Suites San Francisco-Airport/ Waterfront H o t e l s identified for sale Embassy Suites Atlanta-Perimeter Center Sheraton Gateway Atlanta-Airport Embassy Suites Austin-Central Embassy Suites Baltimore-at BWI Airport Embassy Suites Charlotte Embassy Suites Raleigh-Crabtree Embassy Suites San Antonio-International Airport Embassy Suites San Antonio-NW I-10 Embassy Suites San Rafael-Marin County Holiday Inn Toronto-Yorkdale FELCOR LODGING TRUST ANNUAL REPORT
15 FELCOR LODGING TRUST 2013 FINANCIAL INFORMATION TABLE OF CONTENTS Selected Financial Data 2 Management s Discussion and Analysis of Financial Conditions and Results of Operations 4 Quantitative and Qualitative Disclosures about Market Risk 22 Management s Report on Internal Control over Financial Reporting 23 Report of Independent Registered Public Accounting Firm 24 Consolidated Balance Sheets 26 Consolidated Statements of Operations 27 Consolidated Statements of Comprehensive Loss 28 Consolidated Statements of Equity 29 Consolidated Statements of Cash Flows 32 Notes to Consolidated Financial Statements 33 Performance Graph and Common Stock Information 59
16
17 Selected Financial Data The following tables set forth selected financial data derived from our audited consolidated financial statements and the related notes. This data should be read in conjunction with Management s Discussion and Analysis of Financial Condition and Results of Operations, and our audited consolidated financial statements and the related notes. SELECTED FINANCIAL DATA (in millions, except per share data) Year Ended December 31, Statement of Operations Data: (a) Total revenues $ 893 $ 862 $ 808 $ 730 $ 683 Loss from continuing operations (b) (84) (187) (134) (100) (89) Diluted earnings per share: Loss from continuing operations $ (0.95) $ (1.81) $ (1.46) $ (1.70) $ (2.01) Other Data: Cash distributions declared per common share (c) $ 0.02 $ $ $ $ Adjusted FFO per share (d) $ 0.39 $ 0.23 $ 0.14 $ (0.09) $ 0.39 Adjusted EBITDA (d) Cash flows provided by operating activities Balance Sheet Data (at end of period): Total assets $ 2,144 $ 2,202 $ 2,403 $ 2,359 $ 2,626 Total debt, net of discount 1,663 1,631 1,596 1,548 1,773 FelCor s redeemable noncontrolling interests in FelCor LP, at redemption value (a) (b) Hotels that we no longer own are included in discontinued operations. We include the following amounts in loss from continuing operations (in millions): Year Ended December 31, Impairment loss $ (24) $ $ (4) $ (41) $ Impairment loss on unconsolidated hotels (2) Hurricane loss (1) Debt extinguishment (72) (28) 45 (2) Conversion expenses (1) (31) Pre-opening expenses (2) Severance expenses (3) (1) 2
18 (c) Our Board of Directors reinstated a quarterly common dividend in October 2013 in recognition of our ongoing and successful portfolio repositioning and balance sheet restructuring, as well as our positive funds available for distribution ( FAD ) during At that time, we declared a $0.02 per share fourth quarter common stock dividend, which was paid in January. Future quarterly dividends will be based on estimates of FAD, reinvestment opportunities within our portfolio and taxable income, among other things. (d) We include a more detailed description and computation of Adjusted FFO per share and Adjusted EBITDA in Non-GAAP Financial Measures, which is found in Management s Discussion and Analysis of Financial Condition and Results of Operations. 3
19 Management s Discussion and Analysis of Financial Condition and Results of Operations Strong demand and tepid supply growth has created a favorable dynamic to improve average daily rate, or ADR, driving 2013 growth in revenue per available room, or RevPAR. In 2013, our RevPAR improved 3.8%, compared to the prior year, and ADR grew 3.4%, while occupancy increased 30 basis points as we continued to remix our customer base in favor of higher-rated segments. The RevPAR for our 51 comparable hotels (our Consolidated Hotels excluding the Wyndham portfolio) increased 7.1% in 2013 compared to the same period last year. Sustained ADR growth has allowed our hotels to improve Hotel EBITDA margins (up 99 basis points, compared to the prior year). We have made continued progress toward achieving our strategic objectives: Since December 2010, we have sold 25 hotels (including 5 hotels sold in 2013 and one sold in January 2014), for total gross proceeds of $549 million (our pro rata share was $504 million). The eight Wyndham hotels were successfully rebranded from Holiday Inn to Wyndham on March 1, RevPAR for the Wyndham portfolio declined 14.6% in 2013 compared to the same period last year, which reflects the impact of transitioning brands and management companies, particularly related renovations. Revenues at these hotels should improve meaningfully as transition-related disruption subsides. As previously disclosed, Wyndham Worldwide Corporation has provided a 10-year $100 million performance guaranty (which can be extended for an additional five years), including an annual performance guaranty of up to $21.5 million, that ensures minimum annual NOI for the eight hotels through the term of the management agreements. Our Board of Directors reinstated a quarterly common dividend in October 2013 in recognition of our ongoing and successful portfolio repositioning and balance sheet restructuring, as well as our positive funds available for distribution ( FAD ) during At that time, we declared a $0.02 per share fourth quarter common stock dividend, which was paid in January. Future quarterly dividends will be based on estimates of FAD, reinvestment opportunities within our portfolio and taxable income, among other things. In 2013, we spent $101.4 million on capital expenditures, primarily for renovation and redevelopment of our hotels. During this time, we redeveloped Morgans by adding three new guest rooms, building a brand new fitness facility, relocating the lounge and reconcepting the food and beverage areas. We also completed significant renovations at four of our Wyndham properties. Of the remaining four Wyndham properties, two were recently renovated in 2012, and the remaining two will be renovated in We have spent $65.3 million (excluding the initial acquisition costs and capitalized interest) through December 31, 2013 to redevelop the 4+ star Knickerbocker Hotel, located in the heart of Times Square in Manhattan. Our total project cost is expected to be $240 million (net of historic tax credits), which is within 5% of our original estimate. We expect the hotel to open in early fall, as winter weather delays have slightly disrupted the schedule. The hotel s executive team is in place and fully engaged in the sales and marketing efforts to ensure a successful and strong opening. In early 2014, we finalized an agreement with one of the nation s most recognized Master Chefs, Charlie Palmer, to manage the food and beverage operations. Mr. Palmer s flagship restaurant, the Michelin-starred Aureole, is located adjacent to the hotel, which will create sales and marketing synergies. Our Knickerbocker Hotel venture raised $45 million through the sale of 3.5% preferred equity under the EB-5 immigrant investor program. The venture received $40 million in proceeds in February 2014, and the remaining $5 million will be received as investors visas are approved by the government. We are using our 95% share of the proceeds to repay borrowings under our line of credit. 4
20 Financial Comparison (Hotel EBITDA and Loss from continuing operations, in millions) Year Ended December 31, % Change % Change RevPAR (a) $ $ % $ % Hotel EBITDA (a)(b) % % Hotel EBITDA margin (a)(b) 25.8% 24.8 % 4.0 % 24.3 % 2.0 % Loss from continuing operations (c) (84) (187) 55.3 % (134) (40.2)% (a) (b) (c) All years presented are for our 59 same-store Consolidated Hotels. Hotel EBITDA and Hotel EBITDA margin are non-gaap financial measures. A discussion of the use, limitations and importance of these non-gaap financial measures and detailed reconciliations to the most comparable GAAP measure are found below in Non-GAAP Financial Measures. We included the following amounts in loss from continuing operations (in millions): Year Ended December 31, Impairment loss (24) (4) Hurricane loss (1) Debt extinguishment (72) (28) Conversion expenses (1) (31) Pre-opening expenses (2) Severance expenses (3) (1) 5
21 Results of Operations Comparison of the Years Ended December 31, 2013 and 2012 For the year ended December 31, 2013, we recorded a $65.8 million net loss compared to a $129.4 million net loss in Our 2013 net loss included $28.8 million of impairment charges (including $4.4 million in discontinued operations), offset by a $19.4 million net gain on sale of hotels included in discontinued operations (primarily from the sale of five hotels). Our 2012 net loss included $31.2 million of conversion costs related to re-branding and re-positioning eight hotels, a $75.1 million loss from the extinguishment of debt (including $2.8 million in discontinued operations), $1.3 million in hurricane-related charges (including $478,000 in discontinued operations), and $1.3 million of impairment charges included in discontinued operations. These 2012 charges were partially offset by a $54.5 million net gain on sale of hotels included in discontinued operations. In 2013: Total revenue was $893.4 million, 3.6% more than The increase was driven by 3.8% same-store RevPAR growth, reflecting a 3.4% increase in ADR and a 30 basis point increase in occupancy. Hotel departmental expenses increased $11.0 million. As a percentage of total revenue, hotel departmental expenses decreased slightly from 36.7% in 2012 to 36.6% in Other property-related costs increased $6.2 million. As a percentage of total revenue, other propertyrelated costs decreased from 26.9% in 2012 to 26.7% in This improvement primarily reflects revenue increases driven by ADR, rather than occupancy. Management and franchise fees decreased $4.1 million. As a percentage of total revenue, these costs decreased from 4.6% in 2012 to 4.0% in We converted eight hotels to Wyndham brands and management on March 1, Wyndham earns lower management fees than the prior management company. In addition, Wyndham s guaranty of a minimum level of net operating income reduced Wyndham s management fees in These arrangements with Wyndham more than offset increases in fees resulting from higher revenue. Taxes, insurance and lease expense increased $4.0 million and increased slightly as a percentage of total revenue from 10.7% in 2012 to 10.8% in The increase in expense reflects higher percentage lease expense (computed as a percentage of hotel revenues in excess of base rent; as revenue increases, percentage rent increases at a faster rate than other expenses), higher property taxes (in 2012 we achieved significant reductions after appeals), and higher general liability insurance (due to a more favorable claims experience in 2012). Corporate expenses increased $868,000 and remained relatively flat as a percentage of total revenue compared to This increase primarily reflects additional fixed and variable stock compensation expense associated with our incentive compensation awards. Depreciation and amortization expense increased $3.2 million, primarily reflecting additional depreciation after investing $101.4 million in our hotels in 2013 and $121.5 million in Impairment loss. For the year ended December 31, 2013, we recorded $24.4 million of impairment charges for two hotels included in continuing operations after we reduced their estimated hold periods. No impairment charges were included in continuing operations for
22 Conversion expenses. We classified expenses related to converting eight Holiday Inn hotels to Wyndham brands and management as conversion expense in 2013 and The expenses incurred in 2012 include $30.7 million of termination fees related to terminating the management agreements with IHG. Other expenses increased $4.1 million compared to 2012, primarily related to severance costs for certain employees and pre-opening costs for the Knickerbocker Hotel, which were partially offset by nonrecurring hurricane-related charges incurred in Net interest expense decreased $17.8 million, primarily reflecting our lower average interest rate. Lower interest rates in 2013 were partially offset by an increase in average debt for the year, as well as less capitalized interest attributable to renovation and redevelopment projects. Debt extinguishment. For the year ended December 31, 2013, we had no debt extinguishment charges in continuing operations, while continuing operations for 2012 included $72.4 million in debt extinguishment charges. These charges included $17.4 million of prepayment penalties and the write-off of deferred loan costs recorded when we repaid $315.1 million of loans secured by properties in continuing operations. In addition, when we redeemed $258.0 million of our 10% senior notes, we recognized a $55.0 million debt extinguishment charge for prepayment penalties, as well as a pro rata portion of the original issue discount and deferred loan costs. Discontinued operations include the results of operations for one hotel designated as held for sale at December 31, 2013, five hotels sold in 2013, and ten hotels sold in Discontinued operations in 2013 included a $19.4 million net gain on sale (primarily related to the sale of five hotels), offset by a $4.4 million impairment charge for one hotel sold in 2013 and one hotel designated as held for sale at December 31, Discontinued operations in 2012 included a $54.5 million net gain on the sale of hotels, offset by $2.8 million in debt extinguishment charges and a $1.3 million impairment charge. Comparison of the Years Ended December 31, 2012 and 2011 For the year ended December 31, 2012, we recorded a $129.4 million net loss compared to a $130.9 million net loss in Our 2012 net loss included $31.2 million of conversion costs related to rebranding and re-positioning eight hotels, a $75.1 million loss from the extinguishment of debt (including $2.8 million in discontinued operations), $1.3 million in hurricane-related charges (including $478,000 in discontinued operations), and $1.3 million of impairment charges included in discontinued operations. These losses are partially offset by $54.5 million of net gains from hotel dispositions included in discontinued operations. Our 2011 net loss included $13.2 million of impairment charges (including $8.9 million in discontinued operations) and $24.3 million of net losses from debt extinguishment ($27.6 million in continuing operations offset by a $3.3 million gain on debt extinguishment in discontinued operations), partially offset by $4.7 million of net gains from hotel dispositions included in discontinued operations. In 2012: Total revenue was $862.1 million, 6.6% more than This increase was primarily driven by a 5.3% increase in same-store RevPAR reflecting a 6.1% increase in ADR (partially offset by a 51 basis point decrease in occupancy), as well as $11.5 million in incremental revenue from Royalton and Morgans, acquired in May Several of our core hotels were under significant renovation or redevelopment during
23 Hotel departmental expenses increased $18.8 million (including $6.8 million of incremental hotel departmental expenses at Royalton and Morgans). As a percentage of total revenue, hotel departmental expenses decreased slightly from 36.8% in 2011 to 36.7% in Margin improvement from ADR was offset, in part, by decreasing food and beverage margins. Other property-related costs increased $11.0 million due to a combination of higher costs (such as marketing programs) and $3.5 million of incremental other property-related costs at Royalton and Morgans. As a percentage of total revenue, other property-related costs decreased from 27.3% to 26.9% compared to This improvement primarily reflects revenue increases driven by ADR as opposed to occupancy. Management and franchise fees increased $2.4 million compared to 2011, primarily reflecting higher revenues (which serve as the basis for determining such fees). As a percentage of total revenue, these costs remained essentially unchanged from the same period in Taxes, insurance and lease expense increased $9.0 million (including $999,000 of incremental taxes, insurance, and lease expenses at Royalton and Morgans) and increased as a percentage of total revenue from 10.3% to 10.7% compared to The higher percentage of revenue reflects more favorable liability claims in 2011 in addition to lower estimated Canadian taxes in Corporate expenses decreased $3.0 million (decreasing as a percentage of total revenue from 3.6% to 3.0%), which reflects: (i) lower restricted stock amortization in 2012, as a significant amount of restricted stock vested in 2011, and (ii) lower payroll tax withholding with respect to restricted cash awards, which were lower in 2012 than in We recognize payroll tax withholding on these awards as an expense when awarded rather than amortizing that expense over the three-year vesting periods (as is the case with the remainder of the awards). Depreciation and amortization expense increased $5.9 million compared to 2011, including $1.3 million of incremental depreciation expense related to Royalton and Morgans. The remainder of the increase primarily reflects depreciation associated with hotel capital expenditures of $89.0 million in 2011 and $121.5 million in Impairment loss. In 2012, no impairment charges were included in continuing operations, while 2011 continuing operations included a $4.3 million charge for one hotel. That charge was based on a revised estimated fair value obtained through the marketing process that was lower than the net book value for that hotel. Conversion expenses. In the fourth quarter of 2012, we decided to convert eight Holiday Inn hotels to the Wyndham brand and management effective March 1, The expenses incurred related to converting these hotels were classified as conversion expenses in our statements of operations and include $30.7 million of IHG termination fees for the year ended December 31, Other expenses increased $609,000 compared to 2011 because of 2012 hurricane-related charges and other expenses, partially offset by lower acquisition costs. Net interest expense decreased $4.5 million compared to 2011, which primarily reflects increased capitalized interest related to the Knickerbocker Hotel development partially offset by an increase in our average effective interest rate. 8
24 Debt extinguishment charges in continuing operatons during the year ended December 31, 2012 were $72.4 million. These charges include $17.4 million of prepayment penalties and the write-off of deferred loan costs primarily related to repaying $315.1 million in mortgage debt secured by properties in continuing operations. In addition, we redeemed $258.0 million of our 10% senior notes and recognized a $55.0 million debt extinguishment charge related to prepayment penalties, as well as a pro rata portion of the original issue discount and deferred loan costs. During the year ended December 31, 2011, we redeemed $144.0 million of our 10% senior notes and recognized a $27.4 million debt extinguishment charge related to prepayment penalties, and the write-off of a pro rata portion of the original issue discount and deferred loan costs. Discontinued operations include the results of operations for one hotel designated as held for sale at December 31, 2013, five hotels sold in 2013, ten hotels sold in 2012, and eight hotels sold in Discontinued operations in 2012 included a $54.5 million net gain on the sale of hotels, offset by $2.8 million in debt extinguishment charges and a $1.3 million impairment charge. Discontinued operations in 2011 reflects a $4.7 million net gain on the sale of hotels, $3.3 million in net gains from debt extinguishment and $8.9 million in impairment charges. Non-GAAP Financial Measures We refer in this Annual Report to certain non-gaap financial measures. These measures, including FFO, Adjusted FFO, EBITDA, Adjusted EBITDA, Hotel EBITDA and Hotel EBITDA margin, are measures of our financial performance that are not calculated and presented in accordance with generally accepted accounting principles, or GAAP. The following tables reconcile these non-gaap measures to FelCor s most comparable GAAP financial measure. Immediately following the reconciliations, we include a discussion of why we believe these measures are useful supplemental measures of our performance and of the limitations upon such measures. 9
25 The following tables detail our computation of FFO and Adjusted FFO (in thousands, except for per share data): Reconciliation of Net Loss to FFO and Adjusted FFO (in thousands, except per share data) Year Ended December 31, Dollars Shares Per Share Amount Dollars Shares Per Share Amount Dollars Shares Net loss $ (65,783) $ (129,414) $ (130,895) 10 Per Share Amount Noncontrolling interests 4,279 1,407 1,041 Preferred dividends (38,713) (38,713) (38,713) Numerator for basic and diluted loss attributable to common stockholders (100,217) 123,818 $ (0.81) (166,720) 123,634 $ (1.35) (168,567) 117,068 $ (1.44) Depreciation and amortization 119, , , Depreciation, discontinued operations and unconsolidated entities 15, , , Gain on involuntary conversion, net of noncontrolling interests in other partnerships (37) (295) Loss (gain) on involuntary conversion, discontinued operations, net of noncontrolling interests in other partnerships (59) 15 Impairment loss, net of noncontrolling interests in other partnerships 20, , Impairment loss, discontinued operations 4, , , Gain on sale of hotels, net of noncontrolling interests in other partnerships (18,590) (0.15) (54,459) (0.44) (4,714) (0.04) Noncontrolling interests in FelCor LP (497) 619 (0.01) (842) 628 (689) 499 (0.01) Conversion of unvested restricted stock 547 FFO 40, , (80,086) 124,262 (0.64) (9,632) 117,567 (0.08) Acquisition costs , Hurricane loss Hurricane loss, discontinued operations and unconsolidated entities 482 Debt extinguishment, including discontinued operations 75, , Conversion expenses 1, , Variable stock compensation Severance costs 3, Abandoned projects 219 Pre-opening costs, net of noncontrolling interests 2, Conversion of unvested restricted stock Adjusted FFO $ 48, ,984 $ 0.39 $ 28, ,273 $ 0.23 $ 16, ,742 $ 0.14
26 Reconciliation of Net Loss to FFO and Adjusted FFO (in thousands, except per share data) Year Ended December 31, Dollars Shares Per Share Amount Dollars Shares Net loss $ (225,837) $ (109,091) Per Share Amount Noncontrolling interests 2, Preferred dividends (38,713) (38,713) Numerator for basic and diluted loss attributable to common stockholders (261,754) 80,611 $ (3.25) (146,835) 63,114 $ (2.33) Depreciation and amortization 108, , Depreciation, discontinued operations and unconsolidated entities 54, , Impairment loss 41, Impairment loss, discontinued operations and unconsolidated entities 131, , Gain on sale of hotels (910) (0.01) Gain on sale of unconsolidated entities (21,103) (0.26) Noncontrolling interests in FelCor LP (881) 294 (0.01) (672) 296 (0.02) Conversion of unvested restricted stock FFO 51,464 81, ,748 63, Acquisition costs Debt extinguishment, including discontinued operations (59,465) (0.73) 1, Conversion expenses Severance costs Lease termination costs Conversion of unvested restricted stock (505) Adjusted FFO $ (7,552) 80,905 $ (0.09) $ 24,997 63,741 $
27 The following table details our computation of EBITDA and Adjusted EBITDA: Reconciliation of Net Loss to EBITDA and Adjusted EBITDA (in thousands) Year Ended December 31, Net loss $ (65,783) $ (129,414) $ (130,895) $ (225,837) $ (109,091) Depreciation and amortization 119, , , , ,015 Depreciation, discontinued operations and unconsolidated entities 15,996 24,216 40,870 54,000 58,634 Interest expense 103, , , ,145 87,675 Interest expense, discontinued operations and unconsolidated entities 3,496 8,586 14,272 22,364 22,386 Noncontrolling interests in other partnerships 3, , EBITDA 180, , ,375 87, ,916 Impairment loss, net of noncontrolling interests in other partnerships 20,382 4,315 41,214 Impairment loss, discontinued operations and unconsolidated entities 4,354 1,335 8, ,762 5,516 Hurricane loss 792 Hurricane loss, discontinued operations and unconsolidated entities 482 Debt extinguishment, including discontinued operations 75,117 24,381 (59,465) 1,721 Acquisition costs , Amortization of fixed stock and directors compensation 5,570 5,003 7,170 7,445 5,165 Severance costs 3, Lease termination costs 469 Abandoned projects 219 Conversion expenses 1,134 31, Variable stock compensation 963 Pre-opening costs, net of noncontrolling interests 2, Gain on sale of hotels, net of noncontrolling interests in other partnerships (18,590) (54,459) (4,714) (910) Gain on involuntary conversion, net of noncontrolling interests in other partnerships (37) (295) Loss (gain) on involuntary conversion, discontinued operations, net of noncontrolling interests in other partnerships (59) 15 Gain on sale of unconsolidated entities (21,103) Adjusted EBITDA $ 200,302 $ 202,796 $ 202,661 $ 188,115 $ 178,936 12
28 The following tables for our 59 same-store Consolidated Hotels detail our computation of Hotel EBITDA, Hotel EBITDA margin, same-store operating revenue and expenses, and includes the reconciliation of samestore operating revenue and same-store operating expense to total revenue, total operating expenses and operating income for the years presented. Hotel EBITDA and Hotel EBITDA Margin (dollars in thousands) Year Ended December 31, Same-store operating revenue: Room $ 692,016 $ 667,708 $ 632,317 Food and beverage 151, , ,129 Other operating departments 46,757 48,271 49,550 Same-store operating revenue (a) 890, , ,996 Same-store operating expense: Room 184, , ,362 Food and beverage 120, , ,538 Other operating departments 21,954 21,682 22,748 Other property related costs 238, , ,438 Management and franchise fees 35,735 39,785 37,719 Taxes, insurance and lease expense 59,563 58,080 52,455 Same-store operating expense (a) 660, , ,260 Hotel EBITDA $ 229,512 $ 213,048 $ 198,736 Hotel EBITDA Margin 25.8 % 24.8% 24.3% Reconciliation of Same-store Operating Revenue and Same-store Operating Expense to Total Revenue, Total Operating Expenses and Operating Income (dollars in thousands) Year Ended December 31, Same-store operating revenue (a) $ 890,006 $ 858,941 $ 816,996 Other revenue 3,430 3,185 2,949 Revenue from acquired hotels (11,455) Total revenue 893, , ,490 Same-store operating expense (a) 660, , ,260 Consolidated hotel lease expense (b) 44,087 41,342 38,759 Unconsolidated taxes, insurance and lease expense (7,456) (7,256) (6,987) Corporate expenses 26,996 26,128 29,080 Depreciation and amortization 119, , ,498 Impairment loss 24,441 4,315 Expenses from acquired hotels (11,290) Conversion expenses 1,134 31,197 Other expenses 8,749 4,626 4,017 Total operating expenses 878, , ,652 Operating income $ 15,367 $ 3,812 $ 21,838 (a) (b) For same-store metrics, we have included the two hotels acquired in May 2011 as if they were acquired at the beginning of Consolidated hotel lease expense represents the percentage lease expense of our 51% owned operating lessees. The offsetting percentage lease revenue is included in equity in income from unconsolidated entities. 13
29 Substantially all of our non-current assets consist of real estate. Historical cost accounting for real estate assets implicitly assumes that the value of real estate assets diminishes predictably over time. Since real estate values instead have historically risen or fallen with market conditions, most industry investors consider supplemental measures of performance, which are not measures of operating performance under GAAP, to be helpful in evaluating a real estate company s operations. These supplemental measures are not measures of operating performance under GAAP. However, we consider these non-gaap measures to be supplemental measures of a hotel REIT s performance and should be considered along with, but not as an alternative to, net income (loss) attributable to FelCor as a measure of our operating performance. FFO and EBITDA The National Association of Real Estate Investment Trusts ( NAREIT ) defines FFO as net income or loss attributable to parent (computed in accordance with GAAP), excluding gains or losses from sales of property, plus depreciation, amortization and impairment losses. FFO for unconsolidated partnerships and joint ventures are calculated on the same basis. We compute FFO in accordance with standards established by NAREIT. This may not be comparable to FFO reported by other REITs that do not define the term in accordance with the current NAREIT definition or that interpret the current NAREIT definition differently than we do. EBITDA is a commonly used measure of performance in many industries. We define EBITDA as net income or loss attributable to parent (computed in accordance with GAAP) plus interest expenses, income taxes, depreciation and amortization, and after adjustments for unconsolidated partnerships and joint ventures. Adjustments for unconsolidated partnerships and joint ventures are calculated to reflect EBITDA on the same basis. Adjustments to FFO and EBITDA We adjust FFO and EBITDA when evaluating our performance because management believes that the exclusion of certain additional items provides useful supplemental information to investors regarding our ongoing operating performance and that the presentation of Adjusted FFO, and Adjusted EBITDA when combined with GAAP net income attributable to FelCor, EBITDA and FFO, is beneficial to an investor s better understanding of our operating performance. Gains and losses related to extinguishment of debt and interest rate swaps - We exclude gains and losses related to extinguishment of debt and interest rate swaps from FFO and EBITDA because we believe that it is not indicative of ongoing operating performance of our hotel assets. This also represents an acceleration of interest expense or a reduction of interest expense, and interest expense is excluded from EBITDA. Cumulative effect of a change in accounting principle - Infrequently, the Financial Accounting Standards Board promulgates new accounting standards that require the consolidated statements of operations to reflect the cumulative effect of a change in accounting principle. We exclude these one-time adjustments in computing Adjusted FFO and Adjusted EBITDA because they do not reflect our actual performance for that period. Other transaction costs - From time to time, we periodically incur costs that are not indicative of ongoing operating performance. Such costs include, but are not limited to, conversions costs, acquisition costs, pre-opening costs and severance costs. We exclude these costs from the calculation of Adjusted FFO and Adjusted EBITDA. Variable stock compensation - We exclude the cost associated with our variable stock compensation. This cost is subject to volatility related to the price and dividends of our common stock that does not necessarily correspond to our operating performance. 14
30 In addition, to derive Adjusted EBITDA, we exclude gains or losses on the sale of depreciable assets and impairment losses because including them in EBITDA is inconsistent with reporting the ongoing performance of our remaining assets. Additionally, the gain or loss on sale of depreciable assets and impairment losses represents either accelerated depreciation or excess depreciation in previous periods, and depreciation is excluded from EBITDA. We also exclude the amortization of our fixed stock compensation. While this amortization is included in corporate expenses and is not separately stated on our statements of operations, excluding this amortization is consistent with the EBITDA definition. Hotel EBITDA and Hotel EBITDA Margin Hotel EBITDA and Hotel EBITDA margin are commonly used measures of performance in the hotel industry and give investors a more complete understanding of the operating results over which our individual hotels and brand/managers have direct control. We believe that Hotel EBITDA and Hotel EBITDA margin are useful to investors by providing greater transparency with respect to two significant measures that we use in our financial and operational decision-making. Additionally, using these measures facilitates comparisons with other hotel REITs and hotel owners. We present Hotel EBITDA and Hotel EBITDA margin in a manner consistent with Adjusted EBITDA, however, we also eliminate all revenues and expenses from continuing operations not directly associated with hotel operations, including other income and corporate-level and other expenses. We eliminate these additional items because we believe property-level results provide investors with supplemental information into the ongoing operational performance of our hotels and the effectiveness of management on a property-level basis. We also eliminate consolidated percentage rent paid to unconsolidated entities, which is effectively eliminated by noncontrolling interests and equity in income from unconsolidated subsidiaries, and include the cost of unconsolidated taxes, insurance and lease expense, to reflect the entire operating costs applicable to our Consolidated Hotels. Hotel EBITDA and Hotel EBITDA margins are presented on a same-store basis. Use and Limitations of Non-GAAP Measures Our management and Board of Directors use FFO, Adjusted FFO, EBITDA, Adjusted EBITDA, Hotel EBITDA and Hotel EBITDA margin to evaluate the performance of our hotels and to facilitate comparisons between us and other lodging REITs, hotel owners who are not REITs and other capital intensive companies. We use Hotel EBITDA and Hotel EBITDA margin in evaluating hotel-level performance and the operating efficiency of our hotel managers. The use of these non-gaap financial measures has certain limitations. These non-gaap financial measures as presented by us, may not be comparable to non-gaap financial measures as calculated by other real estate companies. These measures do not reflect certain expenses or expenditures that we incurred and will incur, such as depreciation, interest and capital expenditures. Management compensates for these limitations by separately considering the impact of these excluded items to the extent they are material to operating decisions or assessments of our operating performance. Our reconciliations to the most comparable GAAP financial measures, and our consolidated statements of operations and cash flows, include interest expense, capital expenditures, and other excluded items, all of which should be considered when evaluating our performance, as well as the usefulness of our non-gaap financial measures. These non-gaap financial measures are used in addition to and in conjunction with results presented in accordance with GAAP. They should not be considered as alternatives to operating profit, cash flow from operations, or any other operating performance measure prescribed by GAAP. These non-gaap financial measures reflect additional ways of viewing our operations that we believe, when viewed with our GAAP results and the reconciliations to the corresponding GAAP financial measures, provide a more complete understanding of factors and trends affecting our business than could be obtained absent this disclosure. Management strongly encourages investors to review our financial information in its entirety and not to rely on a single financial measure. 15
OUR VISION. FelCor 1.0 UNFOLDING. FelCor 3.0. FelCor 2.0. FelCor Lodging Trust Incorporated 2014 Annual Report
 OUR VISION FelCor 1.0 UNFOLDING FelCor 3.0 FelCor Lodging Trust Incorporated 2014 Annual Report FelCor 2.0 2014 We are pleased to report that FelCor had an exceptional year in 2014. We fulfilled our commitment
building on success f e l c o r l o d g i n g t r u s t i n c o r P o r A t e d A n n u A l r e P o r t
 building ON success felcor lodging trust INCORPORATED 2015 annual report Our mission is to provide investors with superior returns on their capital by offering increased earnings, asset value and dividend
ARRIVED FelCor Lodging Trust Incorporated 2007 Annual Report
 We ve ARRIVED FelCor Lodging Trust Incorporated 2007 Annual Report WELCOME. We ve arrived. It s a powerful feeling when goals are accomplished. After a year of hard work completing renovations, progressing
Strategically Positioned
 fig. 1 Strategically Positioned felcor lodging trust incorporated 2008 Annual Report fig. 2 The San Francisco Marriott Union Square Gensler led the transformation of the building s exterior and was the
A N E W P E R S P E C T I V E
 F e l C o r L o d g i n g Tr u s t I n c o r p o r a t e d Annual Report 2 0 0 6 A N E W P E R S P E C T I V E Embassy Suites Hotel San Francisco-Airport/Burlingame, California T O O U R S H A R E H O
SUNSTONE HOTEL INVESTORS REPORTS RESULTS FOR FIRST QUARTER 2016
 For Additional Information: Bryan Giglia (949) 382-3036 SUNSTONE HOTEL INVESTORS REPORTS RESULTS FOR FIRST QUARTER 2016 ALISO VIEJO, CA May 2, 2016 (the Company or Sunstone ) (NYSE: SHO) today announced
SUNSTONE HOTEL INVESTORS REPORTS RESULTS FOR THIRD QUARTER 2016
 For Additional Information: Bryan Giglia (949) 382-3036 SUNSTONE HOTEL INVESTORS REPORTS RESULTS FOR THIRD QUARTER 2016 ALISO VIEJO, CA November 1, 2016 (the Company or Sunstone ) (NYSE: SHO) today announced
SUNSTONE HOTEL INVESTORS REPORTS RESULTS FOR SECOND QUARTER 2016
 For Additional Information: Bryan Giglia Sunstone Hotel Investors, Inc. (949) 382-3036 SUNSTONE HOTEL INVESTORS REPORTS RESULTS FOR SECOND QUARTER 2016 ALISO VIEJO, CA August 8, 2016 Sunstone Hotel Investors,
DIAMONDROCK HOSPITALITY COMPANY REPORTS THIRD QUARTER 2014 RESULTS AND RAISES FULL YEAR GUIDANCE
 COMPANY CONTACT Sean Mahoney (240) 744-1150 FOR IMMEDIATE RELEASE Tuesday, November 4, 2014 DIAMONDROCK HOSPITALITY COMPANY REPORTS THIRD QUARTER 2014 RESULTS AND RAISES FULL YEAR GUIDANCE Pro Forma RevPAR
Supplemental Financial Information
 Supplemental Financial Information For the quarter ended June 30, 2017 Table of Contents Supplemental Financial Information CORPORATE PROFILE, FINANCIAL DISCLOSURES, AND SAFE HARBOR 3 About Sunstone 4
SUNSTONE HOTEL INVESTORS REPORTS RESULTS FOR SECOND QUARTER 2015
 For Additional Information: Bryan Giglia Sunstone Hotel Investors, Inc. (949) 382-3036 SUNSTONE HOTEL INVESTORS REPORTS RESULTS FOR SECOND QUARTER 2015 ALISO VIEJO, CA August 6, 2015 Sunstone Hotel Investors,
SUNSTONE HOTEL INVESTORS REPORTS RESULTS FOR FOURTH QUARTER AND FULL YEAR 2017
 For Additional Information: Bryan Giglia Sunstone Hotel Investors, Inc. (949) 382-3036 SUNSTONE HOTEL INVESTORS REPORTS RESULTS FOR FOURTH QUARTER AND FULL YEAR 2017 ALISO VIEJO, CA February 12, 2018 Sunstone
Supplemental Financial Information
 Supplemental Financial Information For the quarter ended September 30, 2018 Table of Contents Supplemental Financial Information CORPORATE PROFILE, FINANCIAL DISCLOSURES, AND SAFE HARBOR 3 About Sunstone
Supplemental Financial Information
 Supplemental Financial Information For the quarter ended September 30, 2017 Table of Contents Supplemental Financial Information CORPORATE PROFILE, FINANCIAL DISCLOSURES, AND SAFE HARBOR 4 About Sunstone
SUNSTONE HOTEL INVESTORS REPORTS RESULTS FOR FIRST QUARTER 2018
 For Additional Information: Bryan Giglia Sunstone Hotel Investors, Inc. (949) 382-3036 SUNSTONE HOTEL INVESTORS REPORTS RESULTS FOR FIRST QUARTER 2018 ALISO VIEJO, CA May 7, 2018 Sunstone Hotel Investors,
Supplemental Financial Information
 Supplemental Financial Information For the quarter ended June 30, 2018 Table of Contents Supplemental Financial Information CORPORATE PROFILE, FINANCIAL DISCLOSURES, AND SAFE HARBOR 3 About Sunstone 4
SUNSTONE HOTEL INVESTORS REPORTS RESULTS FOR FOURTH QUARTER AND FULL YEAR 2009
 For Additional Information: Bryan Giglia Senior Vice President Corporate Finance (949) 369-4236 SUNSTONE HOTEL INVESTORS REPORTS RESULTS FOR FOURTH QUARTER AND FULL YEAR 2009 Drives strong margin performance
SUNSTONE HOTEL INVESTORS REPORTS RESULTS FOR THIRD QUARTER 2015
 For Additional Information: Bryan Giglia Sunstone Hotel Investors, Inc. (949) 382-3036 SUNSTONE HOTEL INVESTORS REPORTS RESULTS FOR THIRD QUARTER 2015 ALISO VIEJO, CA October 29, 2015 Sunstone Hotel Investors,
Fourth Quarter and Year End 2017 Supplemental Data DECEMBER 31, 2017
 Fourth Quarter and Year End 2017 Supplemental Data DECEMBER 31, 2017 Waldorf Astoria Orlando Park Hotels & Resorts at NYSE Hilton Hawaiian Village Waikiki Beach Resort About Park and Safe Harbor Disclosure
SUNSTONE HOTEL INVESTORS REPORTS RESULTS FOR THIRD QUARTER 2018
 For Additional Information: Bryan Giglia Sunstone Hotel Investors, Inc. (949) 382-3036 Aaron Reyes Sunstone Hotel Investors, Inc. (949) 382-3018 SUNSTONE HOTEL INVESTORS REPORTS RESULTS FOR THIRD QUARTER
SUNSTONE HOTEL INVESTORS REPORTS RESULTS FOR FOURTH QUARTER AND FULL YEAR 2018
 For Additional Information: Bryan Giglia (949) 382-3036 Aaron Reyes (949) 382-3018 SUNSTONE HOTEL INVESTORS REPORTS RESULTS FOR FOURTH QUARTER AND FULL YEAR 2018 IRVINE, CA February 12, 2019 (the Company
SUNSTONE HOTEL INVESTORS REPORTS RESULTS FOR THIRD QUARTER 2017
 For Additional Information: Bryan Giglia Sunstone Hotel Investors, Inc. (949) 382-3036 SUNSTONE HOTEL INVESTORS REPORTS RESULTS FOR THIRD QUARTER 2017 ALISO VIEJO, CA October 30, 2017 Sunstone Hotel Investors,
COMPANY CONTACT. Sean Mahoney (240) FOR IMMEDIATE RELEASE
 FOR IMMEDIATE RELEASE") COMPANY CONTACT Sean Mahoney (240) 744-1150 FOR IMMEDIATE RELEASE DIAMONDROCK ACQUIRES L AUBERGE DE SEDONA AND ORCHARDS INN SEDONA FOR $97 MILLION Iconic Assets with Asset Management Upside in Attractive,
COMPANY CONTACT Sean Mahoney (240) 744-1150 FOR IMMEDIATE RELEASE DIAMONDROCK ACQUIRES L AUBERGE DE SEDONA AND ORCHARDS INN SEDONA FOR $97 MILLION Iconic Assets with Asset Management Upside in Attractive,
2017 Portfolio Enhancements
 2017 Portfolio Enhancements October 2017 Hyatt Regency Scottsdale Resort & Spa at Gainey Ranch Scottsdale, AZ Royal Palms Resort & Spa Phoenix, AZ The Ritz-Carlton Pentagon City Arlington, VA Hyatt Regency
S U N S T O N E H O T E L I N V E S T O R S, I N C. Company Presentation. March 2013
 Company Presentation March 2013 Forward-Looking Statements This presentation contains forward-looking statements that have been made pursuant to the provisions of the Private Securities Litigation Reform
DIAMONDROCK HOSPITALITY COMPANY REPORTS FOURTH QUARTER AND FULL YEAR 2011 RESULTS
 COMPANY CONTACT Chris King (240) 744-1150 FOR IMMEDIATE RELEASE WEDNESDAY, FEBRUARY 29, 2012 DIAMONDROCK HOSPITALITY COMPANY REPORTS FOURTH QUARTER AND FULL YEAR 2011 RESULTS BETHESDA, Maryland, Wednesday,
Park Hotels & Resorts Inc. Reports Third Quarter 2017 Results
 Investor Contact 1600 Tysons Boulevard, Suite 1000 Ian Weissman McLean, VA 22102 + 1 703 584 7441 www.pkhotelsandresorts.com Park Hotels & Resorts Inc. Reports Third Quarter 2017 Results MCLEAN, VA (November
Park Hotels & Resorts Inc. Reports Fourth Quarter and Full Year 2017 Results
 Investor Contact 1600 Tysons Boulevard, Suite 1000 Ian Weissman McLean, VA 22102 + 1 703 584 7441 www.pkhotelsandresorts.com Park Hotels & Resorts Inc. Reports Fourth Quarter and Full Year 2017 Results
HOST HOTELS & RESORTS, INC. REPORTS RESULTS FOR THE FIRST QUARTER 2015 AND ANNOUNCES SHARE REPURCHASE PROGRAM
 Exhibit 99.1 Gregory J. Larson Chief Financial Officer 240.744.5120 Gee Lingberg Vice President 240.744.5275 NEWS RELEASE REPORTS RESULTS FOR THE FIRST QUARTER 2015 AND ANNOUNCES SHARE REPURCHASE PROGRAM
LASALLE HOTEL PROPERTIES REPORTS FIRST QUARTER 2017 RESULTS Strengthens Balance Sheet with $274 Million of Asset Sales Year-to-Date
 News Release LASALLE HOTEL PROPERTIES REPORTS FIRST QUARTER 2017 RESULTS Strengthens Balance Sheet with $274 Million of Asset Sales Year-to-Date BETHESDA, MD, April 19, 2017 -- LaSalle Hotel Properties
LASALLE HOTEL PROPERTIES REPORTS SECOND QUARTER 2015 RESULTS
 7550 Wisconsin Avenue, 10 th Floor, Bethesda, MD 20814 PH 301.941.1500, FX 301.941.1553 www.lasallehotels.com News Release LASALLE HOTEL PROPERTIES REPORTS SECOND QUARTER 2015 RESULTS Expands Hotel EBITDA
COREPOINT LODGING REPORTS FOURTH QUARTER 2018 RESULTS
 FOR IMMEDIATE RELEASE COREPOINT LODGING REPORTS FOURTH QUARTER RESULTS IRVING, Texas March 21, 2019 CorePoint Lodging Inc. (NYSE: CPLG) ( CorePoint or the Company ), a pure play selectservice hotel owner
Park Hotels & Resorts Inc. Reports First Quarter 2018 Results
 Investor Contact 1775 Tysons Boulevard, 7th Floor Ian Weissman Tysons, VA 22102 + 1 571 302 5591 www.pkhotelsandresorts.com Park Hotels & Resorts Inc. Reports First Quarter 2018 Results TYSONS, VA (May
HOST HOTELS & RESORTS, INC. REPORTS RESULTS FOR THE THIRD QUARTER 2018
 Michael D. Bluhm, Chief Financial Officer 240.744.5110 Bret D.S. McLeod, Senior Vice President 240.744.5216 Gee Lingberg, Vice President 240.744.5275 NEWS RELEASE HOST HOTELS & RESORTS, INC. REPORTS RESULTS
LASALLE HOTEL PROPERTIES REPORTS THIRD QUARTER 2017 RESULTS
 News Release LASALLE HOTEL PROPERTIES REPORTS THIRD QUARTER 2017 RESULTS BETHESDA, MD, October 19, 2017 -- LaSalle Hotel Properties (NYSE: LHO) today announced results for the quarter ended September 30,
SUNSTONE HOTEL INVESTORS, INC. Company Presentation. September 2011
 Company Presentation September 2011 Forward-Looking Statements This presentation contains forward-looking statements that have been made pursuant to the provisions of the Private Securities Litigation
INVESTOR PRESENTATION Executive Summary August 2016
 INVESTOR PRESENTATION Executive Summary August 2016 Forward Looking Statements and non-gaap Measures This investor presentation, and the related discussion, contains forward-looking statements. These include
LASALLE HOTEL PROPERTIES REPORTS FIRST QUARTER 2018 RESULTS
 LASALLE HOTEL PROPERTIES REPORTS FIRST QUARTER 218 RESULTS News Release First Quarter Results Meaningfully Exceeded LaSalle s Expectations; EBITDA Outperformed Outlook by Approximately 6 Million or 15%
ASHFORD TRUST REPORTS FOURTH QUARTER AND YEAR END 2014 RESULTS
 NEWS RELEASE Contact: Deric Eubanks Elise Chittick Scott Eckstein Chief Financial Officer Investor Relations Financial Relations Board (972) 490-9600 (972) 778-9487 (212) 827-3766 ASHFORD TRUST REPORTS
Sotherly Hotels Inc. Reports Financial Results for the Second Quarter Ended June 30, 2016
 Sotherly Hotels Inc. Reports Financial Results for the Second Quarter Ended June 30, 2016 Company Release August 9, 2016 9:00 AM EST WILLIAMSBURG, Va., Aug. 09, 2016 (GLOBE NEWSWIRE) -- Sotherly Hotels
Park Hotels & Resorts Inc. (Exact name of Registrant as Specified in Its Charter)
") UNITED STATES SECURITIES AND EXCHANGE COMMISSION WASHINGTON, D.C. 20549 FORM 8-K CURRENT REPORT Pursuant to Section 13 or 15(d) of the Securities Exchange Act of 1934 Date of Report (Date of earliest event
UNITED STATES SECURITIES AND EXCHANGE COMMISSION WASHINGTON, D.C. 20549 FORM 8-K CURRENT REPORT Pursuant to Section 13 or 15(d) of the Securities Exchange Act of 1934 Date of Report (Date of earliest event
COMPANY CONTACT Mark Brugger (240) FOR IMMEDIATE RELEASE
 FOR IMMEDIATE RELEASE") COMPANY CONTACT Mark Brugger (240) 744-1150 FOR IMMEDIATE RELEASE DIAMONDROCK ACQUIRES THE HOTEL PALOMAR IN PHOENIX, AZ Premier Hotel with Prime Location in Downtown CityScape Development Updates 2018
COMPANY CONTACT Mark Brugger (240) 744-1150 FOR IMMEDIATE RELEASE DIAMONDROCK ACQUIRES THE HOTEL PALOMAR IN PHOENIX, AZ Premier Hotel with Prime Location in Downtown CityScape Development Updates 2018
Company Presentation June 2016
 Company Presentation June 2016 Safe Harbor In keeping with the SEC's "Safe Harbor" guidelines, certain statements made during this presentation could be considered forward-looking and subject to certain
HOST HOTELS & RESORTS, INC. REPORTS SOLID RESULTS FOR 2016, ANNOUNCES SHARE REPURCHASE PROGRAM AND THE ACQUISITION OF THE DON CESAR
 Gregory J. Larson, Chief Financial Officer 240.744.5120 Bret D.S. McLeod, Senior Vice President 240.744.5216 Gee Lingberg, Vice President 240.744.5275 NEWS RELEASE HOST HOTELS & RESORTS, INC. REPORTS SOLID
Condor Hospitality Trust Reports 2015 Third Quarter Results
 Suite 200 1800 West Pasewalk Avenue Norfolk, NE 68701 (402) 371-2520 (402) 371-4229 Fax www.condorhospitality.com For Immediate Release Condor Hospitality Trust Reports 2015 Third Quarter Results 4.7%
HIT REIT Quarterly Investor Presentation April 26, American Realty Capital Hospitality Trust, Inc.
 HIT REIT Quarterly Investor Presentation April 26, 2018 American Realty Capital Hospitality Trust, Inc. Risk Factors Risk Factors Investing in our common stock involves a degree of risk. See the section
Park Hotels & Resorts Inc. (Exact name of Registrant as Specified in Its Charter)
") UNITED STATES SECURITIES AND EXCHANGE COMMISSION WASHINGTON, D.C. 20549 FORM 8-K CURRENT REPORT Pursuant to Section 13 or 15(d) of the Securities Exchange Act of 1934 Date of Report (Date of earliest event
UNITED STATES SECURITIES AND EXCHANGE COMMISSION WASHINGTON, D.C. 20549 FORM 8-K CURRENT REPORT Pursuant to Section 13 or 15(d) of the Securities Exchange Act of 1934 Date of Report (Date of earliest event
Park Hotels & Resorts Inc. (Exact name of registrant as specified in its charter)
") UNITED STATES SECURITIES AND EXCHANGE COMMISSION Washington, D.C. 20549 FORM 10-Q (Mark One) QUARTERLY REPORT PURSUANT TO SECTION 13 OR 15(d) OF THE SECURITIES EXCHANGE ACT OF 1934 For the quarterly period
UNITED STATES SECURITIES AND EXCHANGE COMMISSION Washington, D.C. 20549 FORM 10-Q (Mark One) QUARTERLY REPORT PURSUANT TO SECTION 13 OR 15(d) OF THE SECURITIES EXCHANGE ACT OF 1934 For the quarterly period
ASHFORD TRUST REPORTS SECOND QUARTER 2014 RESULTS
 NEWS RELEASE Contact: Deric Eubanks Elise Chittick Scott Eckstein Chief Financial Officer Investor Relations Financial Relations Board (972) 490-9600 (972) 778-9487 (212) 827-3766 ASHFORD TRUST REPORTS
ASHFORD PRIME REPORTS FOURTH QUARTER AND YEAR END 2014 RESULTS
 NEWS RELEASE Contact: Deric Eubanks Elise Chittick Scott Eckstein Chief Financial Officer Investor Relations Financial Relations Board (972) 490-9600 (972) 778-9487 (212) 827-3766 ASHFORD PRIME REPORTS
LASALLE HOTEL PROPERTIES REPORTS FOURTH QUARTER 2017 RESULTS Key West is Open for Business
 News Release LASALLE HOTEL PROPERTIES REPORTS FOURTH QUARTER 2017 RESULTS Key West is Open for Business BETHESDA, MD, February 20, 2018 -- LaSalle Hotel Properties (NYSE: LHO) today announced results for
istar Annual Report 2016
 istar Annual Report 2016 Annual Report 2016 2016 was a year of tangible progress for istar. The company set out to grow its earnings, capture unrecognized value and build a foundation for improved shareholder
STARWOOD REPORTS THIRD QUARTER 2002 RESULTS
 CONTACT: David Matheson (914) 640-5204 FOR IMMEDIATE RELEASE October 24, 2002 STARWOOD REPORTS THIRD QUARTER 2002 RESULTS WHITE PLAINS, NY, October 24, 2002 Starwood Hotels & Resorts Worldwide, Inc. (NYSE:
FELCOR LODGING TRUST INCORPORATED
 Filed pursuant to Rule 424(b)(5) Registration No. 333-198108 The information in this preliminary prospectus supplement is not complete and may be changed. This prospectus supplement and the accompanying
LASALLE HOTEL PROPERTIES REPORTS THIRD QUARTER 2018 RESULTS. Special Meeting to Approve Merger with Pebblebrook Scheduled for November 27, 2018
 News Release LASALLE HOTEL PROPERTIES REPORTS THIRD QUARTER 218 RESULTS Special Meeting to Approve Merger with Pebblebrook Scheduled for November 27, 218 Merger with Pebblebrook Expected to Close on November
Hospitality Investors Trust 4/26/18 Investor Presentation Script
 Hospitality Investors Trust 4/26/18 Investor Presentation Script Opening Remarks Good afternoon, everyone, and good morning to those joining from the West Coast. This is Jon Mehlman, President & CEO of
ASHFORD TRUST REPORTS FIRST QUARTER 2018 RESULTS
 NEWS RELEASE Contact: Deric Eubanks Jordan Jennings Joe Calabrese Chief Financial Officer Investor Relations Financial Relations Board (972) 490-9600 (972) 778-9487 (212) 827-3772 ASHFORD TRUST REPORTS
Supplemental Information
 Supplemental Information Third Quarter 2014 Andros Isles - Daytona Beach, FL Landmark Apartment Trust s ("Landmark") Unaudited Reconciliation Tables and Supplemental Disclosure presented herein speaks
ASHFORD TRUST REPORTS THIRD QUARTER 2018 RESULTS
 NEWS RELEASE Contact: Deric Eubanks Jordan Jennings Joe Calabrese Chief Financial Officer Investor Relations Financial Relations Board (972) 490-9600 (972) 778-9487 (212) 827-3772 ASHFORD TRUST REPORTS
NEWS RELEASE 3 HIGHLIGHTS 6
 TABLE OF CONTENTS NEWS RELEASE 3 HIGHLIGHTS 6 FINANCIAL INFORMATION Consolidated Balance Sheets 7 Consolidated Statements of Comprehensive Income 8 Funds from Operations and Adjusted Funds from Operations
ASHFORD TRUST REPORTS FOURTH QUARTER AND YEAR END 2018 RESULTS
 NEWS RELEASE Contact: Deric Eubanks Jordan Jennings Joe Calabrese Chief Financial Officer Investor Relations Financial Relations Board (972) 490-9600 (972) 778-9487 (212) 827-3772 ASHFORD TRUST REPORTS
STARWOOD REPORTS FOURTH QUARTER 2014 RESULTS AND DECLARES FIRST QUARTER DIVIDEND OF $0.375 PER SHARE
 Investor Contact Stephen Pettibone 203-351-3500 Media Contact KC Kavanagh 866-478-2777 One StarPoint Stamford, CT 06902 United States STARWOOD REPORTS FOURTH QUARTER 2014 RESULTS AND DECLARES FIRST QUARTER
TAUBMAN CENTERS, INC. ISSUES FOURTH QUARTER AND FULL YEAR 2017 RESULTS AND INTRODUCES 2018 GUIDANCE
 Taubman Centers, Inc. 200 East Long Lake Road Suite 300 Bloomfield Hills, Michigan 48304-2324 T 248.258.6800 www.taubman.com ISSUES FOURTH QUARTER AND FULL YEAR 2017 RESULTS AND INTRODUCES 2018 GUIDANCE
BRAEMAR HOTELS & RESORTS REPORTS FOURTH QUARTER AND YEAR END 2018 RESULTS
 NEWS RELEASE Contact: Deric Eubanks Jordan Jennings Joseph Calabrese Chief Financial Officer Investor Relations Financial Relations Board (972) 490-9600 (972) 778-9487 (212) 827-3772 BRAEMAR HOTELS & RESORTS
STARWOOD REPORTS RECORD SECOND QUARTER 2005 RESULTS. WHITE PLAINS, NY, July 26, 2005 Starwood Hotels & Resorts Worldwide, Inc.
 CONTACT: Alisa Rosenberg (914) 640-5214 FOR IMMEDIATE RELEASE July 26, 2005 STARWOOD REPORTS RECORD SECOND QUARTER 2005 RESULTS WHITE PLAINS, NY, July 26, 2005 Starwood Hotels & Resorts Worldwide, Inc.
STARWOOD REPORTS FOURTH QUARTER 2011 RESULTS
 CONTACT: Jason Koval (203) 351-3500 FOR IMMEDIATE RELEASE February 2, 2012 STARWOOD REPORTS FOURTH QUARTER 2011 RESULTS STAMFORD, CT, February 2, 2012 Starwood Hotels & Resorts Worldwide, Inc. (NYSE: HOT)
Hotel Valuation and Transaction Trends For the U.S. Lodging Industry
 Hotel Valuation and Transaction Trends For the U.S. Lodging Industry Stephen Rushmore, CHA, MAI, FRICS President and Founder HVS International 372 Willis Avenue Mineola, NY 11501 516-248-8828 ext. 204
EARNINGS SUPPLEMENT. February Q4
 EARNINGS SUPPLEMENT February 2019 2018 Q4 Legal Disclaimers Forward Looking Statements and Risk Factors. All of the information presented herein is available from public sources, including our and our
CoreSite Reports First-Quarter 2018 Financial Results Reflecting Revenue Growth of 12.8% Year over Year
 CoreSite Reports First-Quarter 2018 Financial Results Reflecting Revenue Growth of 12.8% Year over Year DENVER, CO April 26, 2018 CoreSite Realty Corporation (NYSE:COR), a premier provider of secure, reliable,
INVESTOR PRESENTATION JUNE 2016
 INVESTOR PRESENTATION JUNE 2016 Disclaimer This presentation contains forward-looking statements within the meaning of Section 27A of the Securities Act of 1933, as amended, and Section 21E of the Securities
Prologis Reports Fourth Quarter and Full Year 2017 Earnings Results
 News Release Archive Prologis Reports Fourth Quarter and Full Year 2017 Earnings Results SAN FRANCISCO, Jan. 23, 2018 /PRNewswire/ -- Prologis, Inc. (NYSE: PLD), the global leader in logistics real estate,
Q Investor Presentation Script. Opening Remarks
 Q3 2018 Investor Presentation Script Opening Remarks Good afternoon, everyone, and good morning to those joining from the West Coast. We trust you have had a relaxing and enjoyable weekend with your respective
Interstate Hotels & Resorts 2002 Annual Report
 Interstate Hotels & Resorts 2002 Annual Report Interstate Hotels & Resorts, Inc. Chairman s Letter Paul W. Whetsell Chairman and Chief Executive Officer Interstate Hotels & Resorts Interstate Hotels &
CHATHAM LODGING TRUST COMPANY PRESENTATION
 CHATHAM LODGING TRUST COMPANY PRESENTATION November 2018 Safe Harbor Disclosure We make forward-looking statements in this presentation that are subject to risks and uncertainties. These forward-looking
HYATT REPORTS SECOND QUARTER 2010 RESULTS
 CONTACT Investors: Atish Shah Hyatt Hotels Corporation 312-780-5427 atish.shah@hyatt.com Media: Farley Kern Hyatt Hotels Corporation 312-780-5506 farley.kern@hyatt.com FOR IMMEDIATE RELEASE HYATT REPORTS
Hospitality Properties Trust Investor Presentation September 2017
 Sonesta ES Suites Princeton, Princeton, NJ Operator: Sonesta International Hotels Corp. Guest Rooms: 124 Investor Presentation September 2017 Disclaimer. THIS PRESENTATION CONTAINS STATEMENTS THAT CONSTITUTE
UNITED STATES SECURITIES AND EXCHANGE COMMISSION WASHINGTON, D.C FORM 8-K CURRENT REPORT. PURSUANT TO SECTION 13 OR 15(d) OF THE
 OF THE") UNITED STATES SECURITIES AND EXCHANGE COMMISSION WASHINGTON, D.C. 20549 FORM 8-K CURRENT REPORT PURSUANT TO SECTION 13 OR 15(d) OF THE SECURITIES EXCHANGE ACT OF 1934 Date of report (Date of earliest event
UNITED STATES SECURITIES AND EXCHANGE COMMISSION WASHINGTON, D.C. 20549 FORM 8-K CURRENT REPORT PURSUANT TO SECTION 13 OR 15(d) OF THE SECURITIES EXCHANGE ACT OF 1934 Date of report (Date of earliest event
MARRIOTT INTERNATIONAL SECOND QUARTER 2018 EARNINGS CONFERENCE CALL
 MARRIOTT INTERNATIONAL SECOND QUARTER 2018 EARNINGS CONFERENCE CALL FORWARD-LOOKING STATEMENTS NOTE ON FORWARD-LOOKING STATEMENTS: This document contains forward-looking statements within the meaning of
STARWOOD REPORTS SECOND QUARTER 2011 RESULTS
 CONTACT: Jason Koval (914) 640-4429 FOR IMMEDIATE RELEASE July 28, 2011 STARWOOD REPORTS SECOND QUARTER 2011 RESULTS WHITE PLAINS, NY, July 28, 2011 Starwood Hotels & Resorts Worldwide, Inc. (NYSE: HOT)
Prologis Reports Third Quarter 2018 Earnings Results
 Press Releases Prologis Reports Third Quarter 2018 Earnings Results Oct 16, 2018 SAN FRANCISCO, Oct. 16, 2018 /PRNewswire/ -- Prologis, Inc. (NYSE: PLD), the global leader in logistics real estate, today
SUPPLEMENTAL INFORMATION MARCH 31, Page. Page. Renewal Analysis Quarterly Comparison..12 Renewal Analysis by Region.13. Highlights...
 SUPPLEMENTAL INFORMATION MARCH 31, 2012 Page Highlights...1 Statement of Operations..2 Statement of Funds from Operations..3 Balance Sheet..4 Ratios...5 Portfolio Profile...6 Building Type by Region.7-8
OMEGA HEALTHCARE INVESTORS, INC. FUNDS FROM OPERATIONS Unaudited (In thousands, except per share amounts)
") FUNDS FROM OPERATIONS (In thousands, except per share amounts) Net income available to common stockholders. $ 14,641 Elimination of non-cash items included in net income: Depreciation and amortization...
FUNDS FROM OPERATIONS (In thousands, except per share amounts) Net income available to common stockholders. $ 14,641 Elimination of non-cash items included in net income: Depreciation and amortization...
Extended Stay America Announces Fourth Quarter And Full Year 2017 Results
 Extended Stay America Announces Fourth Quarter And Full Year 2017 Results February 27, 2018 - Net Income of $40.2 million and $172.2 million in the Fourth Quarter and Full Year, Respectively - Adjusted
Company Presentation December 2011
 Company Presentation December 2011 Stifel Nicolaus had no involvement in the preparation of this presentation and, accordingly, makes no representation or warranty as to the accuracy or completeness of
Discussion and Reconciliation of Non- GAAP Financial Measures March 31, 2017
 Discussion and Reconciliation of Non- GAAP Financial Measures (Unaudited) Definitions Adjusted Fixed Charge Coverage Adjusted EBITDA (defined below) divided by Fixed Charges (defined below). Adjusted Fixed
Supplemental Financial Information Package Q February 14, 2018
 Supplemental Financial Information Package Q4 2017 February 14, 2018 Information is as of December 31, 2017, except as otherwise noted. It should not be assumed that investments made in the future will
FOR IMMEDIATE RELEASE
 FOR IMMEDIATE RELEASE STRATEGIC STORAGE TRUST, INC. REPORTS THIRD QUARTER 2013 RESULTS - SAME-STORE REVENUES INCREASED 9.4% - SAME-STORE NOI INCREASED 16.1% LADERA RANCH, CA November 15, 2013 Strategic
Sovran Self Storage Reports Second Quarter Results, Adjusted FFO per Share Increases 14.9%, Guidance Raised
 July 30, 2014 Sovran Self Srage Reports Second Quarter Results, Adjusted FFO per Share Increases 14.9%, Guidance Raised BUFFALO, N.Y.--(BUSINESS WIRE)-- Sovran Self Srage, Inc. (NYSE:SSS), a self srage
Raymond James & Wells Fargo Gaylord National Investor Tour
 Raymond James & Wells Fargo Gaylord National Investor Tour May 2018 Forward-looking statements This presentation contains forward-looking statements of Ryman Hospitality Properties, Inc. (the Company )
2002 Financial Highlights
 2002 Financial Highlights (in thousands, except per share amounts, ratios and operating data) 2002 2001 2000 OPERATING RESULTS Total Revenues $ 440,380 $ 436,658 $ 436,574 O T H E R D A T A EBITDA (a)
EARNINGS SUPPLEMENT. November Q3
 EARNINGS SUPPLEMENT November 2018 2018 Q3 Legal Disclaimers Forward Looking Statements and Risk Factors. All of the information presented herein is available from public sources, including our and our
TAUBMAN CENTERS, INC. ISSUES SOLID FIRST QUARTER RESULTS
 Taubman Centers, Inc. 200 East Long Lake Road Suite 300 Bloomfield Hills, Michigan 48304-2324 T 248.258.6800 www.taubman.com ISSUES SOLID FIRST QUARTER RESULTS - Mall Tenant Sales Per Square Foot Up 1.2
Hilton Reports Second Quarter Results, Raises Full Year Outlook
 Investor Contact 7930 Jones Branch Drive Jill Slattery McLean, VA 22102 +1 703 883 6043 ir.hilton.com Media Contact Nigel Glennie +1 703 883 5262 Hilton Reports Second Quarter Results, Raises Full Year
Third Quarter Table of Contents. Company Profile 3. Highlights of the Third Quarter 2014 and Subsequent Events 4
 Table of Contents Company Profile 3 Highlights of the Third Quarter 2014 and Subsequent Events 4 Normalized Funds From Operations and Adjusted Funds From Operations Guidance 5 Consolidated Statements of
Prologis Reports Third Quarter 2015 Earnings Results
 The Core FFO and earnings guidance described above excludes any potential future gains (losses) recognized from real estate transactions. In reconciling from net earnings to Core FFO, Prologis makes certain
RECONCILIATION OF NON-GAAP FINANCIAL MEASURES
 RECONCILIATION OF NON-GAAP FINANCIAL MEASURES Supertel reports its financial results in accordance with generally accepted accounting principles (GAAP). In the course of presentations, management may from
Hilton Reports First Quarter Results, Raises Full Year Outlook
 Investor Contact 7930 Jones Branch Drive Jill Slattery McLean, VA 22102 +1 703 883 6043 ir.hilton.com Media Contact Aaron Radelet +1 703 883 5804 Hilton Reports First Quarter Results, Raises Full Year
ASHFORD TRUST REPORTS FIRST QUARTER 2017 RESULTS
 NEWS RELEASE Contact: Deric Eubanks Jordan Jennings Joe Calabrese Chief Financial Officer Investor Relations Financial Relations Board (972) 490-9600 (972) 778-9487 (212) 827-3772 ASHFORD TRUST REPORTS
AMERICAN HOTEL INCOME PROPERTIES REIT LP MANAGEMENT S DISCUSSION AND ANALYSIS OF RESULTS OF OPERATIONS AND FINANCIAL CONDITION
 AMERICAN HOTEL INCOME PROPERTIES REIT LP MANAGEMENT S DISCUSSION AND ANALYSIS OF RESULTS OF OPERATIONS AND FINANCIAL CONDITION For the three months and year 2017 (Expressed in U.S. Dollars) Dated: March
OMEGA HEALTHCARE INVESTORS, INC. FUNDS FROM OPERATIONS Unaudited (In thousands, except per share amounts)
") OMEGA HEALTHCARE INVESTORS, INC. FUNDS FROM OPERATIONS (In thousands, except per share amounts) Net income... $ 68,157 Add back loss from real estate dispositions... 622 Sub-total... $ 68,779 Elimination
OMEGA HEALTHCARE INVESTORS, INC. FUNDS FROM OPERATIONS (In thousands, except per share amounts) Net income... $ 68,157 Add back loss from real estate dispositions... 622 Sub-total... $ 68,779 Elimination