A N E W P E R S P E C T I V E
|
|
|
- Shavonne Howard
- 5 years ago
- Views:
Transcription

1 F e l C o r L o d g i n g Tr u s t I n c o r p o r a t e d Annual Report A N E W P E R S P E C T I V E Embassy Suites Hotel San Francisco-Airport/Burlingame, California


2
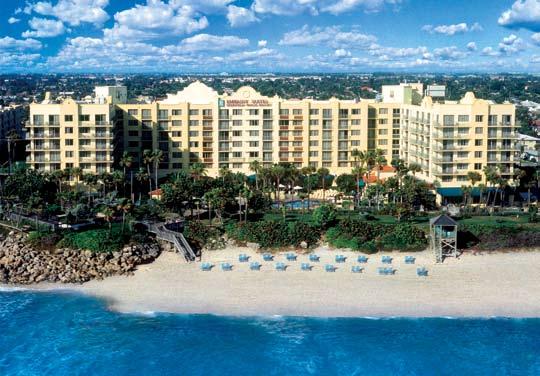
3 T O O U R S H A R E H O L D E R S Sheraton Premiere at Tysons Corner Vienna, Virginia; Embassy Suites Hotel Deerfield Beach Resort, Florida; Doubletree Guest Suites Doheny Beach, California AT the end of 2005, we announced a plan to reposition FelCor. This plan created a smaller, but stronger company with a better balance sheet. Our new approach also gave us a platform to take advantage of internal growth opportunities and positioned the company for future external growth. As we began 2006, our goal was to continue the transformation of the company, and we accomplished all of our objectives. We have now sold 37 of the 45 non-strategic hotels and completed our $400 million debt reduction goal. T H I N G S A R E L O O K I N G G O O D. It was a great year for FelCor, and the benefits of the repositioning plan were evident in our strong operating results, as earnings have increased significantly. We surpassed our original expectations in every category, we are ahead of schedule on both asset sales and debt reduction, and we increased the dividend twice during We are now embarking on the next phase of our strategic plan. We have developed an internal growth program that gives us a unique opportunity to grow shareholder value relative to our peers. This plan began in 2005, when we instituted a comprehensive review of the portfolio to assess the performance and condition of every hotel. We also looked to identify the opportunities that existed in order to maximize the use of our real estate. These findings are the basis of an internal growth plan consisting of three components: renovation; redevelopment; and a new asset management approach. We expect high returns from these initiatives, and the initial results are very positive. F e l C o r Lodging Trust 0 1

4 F O C U S E D O N T H E D E T A I L S The capital being spent on guest impact areas, totaling over $300 million or three quarters of the The focus for this company in total dollars being spent, will 2007 will be the following three allow us to increase average rates things: execute the renovations THE first component of the plan is renovating every hotel. This comprehensive effort includes guest rooms and baths, corridors, public areas, meeting space and exteriors. We are spending almost $20,000 per room, or $430 million, to fully renovate our entire portfolio. The guest room renovations include such things as new case goods, ergonomic chairs and work desks, flat panel TVs, soft goods, and updated guest baths with new fixtures, tile and counters Annual Report and occupancy. Returns on the guest impact expenditures are expected to be approximately 12%. During 2006, we completed renovations at eight hotels, started renovations at 20 additional hotels, which will be completed in the first quarter of 2007, and began work on several others. During 2007, we plan to complete renovations at 64 hotels. At the end of 2007, we will have completely renovated 87% of our hotels, with the balance of renovations to be completed during the first half of with the quality we expect; continue to mitigate displacement throughout the year; and work to achieve the returns we expect post-renovation. This means scheduling renovations during the slowest time of year, working with our operators to maximize rate to offset the loss in occupancy and aggressively controlling labor costs. In addition, we are working with the operators to take advantage of the renovated hotels upon completion of the work. We have experienced excellent results to date, as the hotels that completed major renovations in 2006 were completed on time and within budget and are meeting our return expectations. Holiday Inn Mills House Charleston, South Carolina

5
6
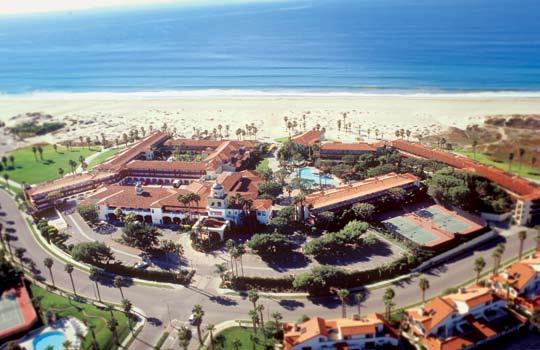
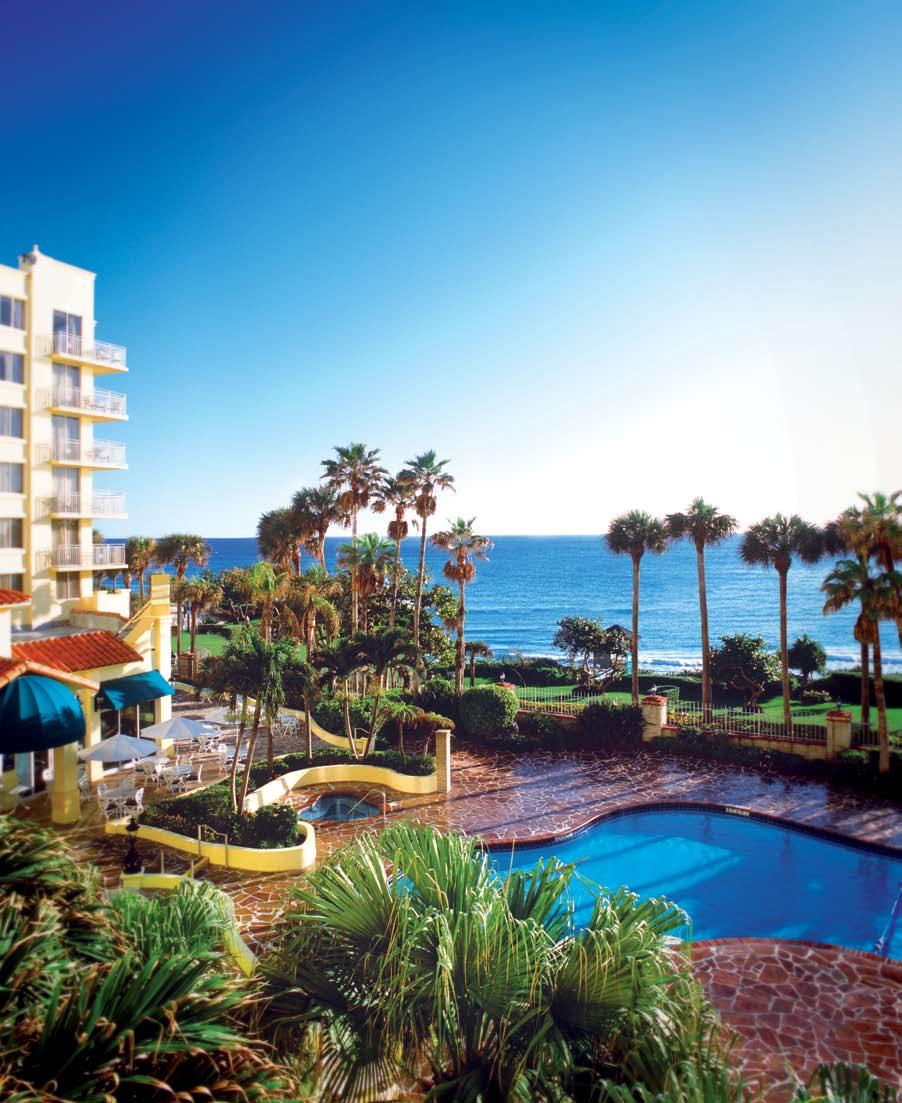
7 S E E K I N G N E W O P P O R T U N I T I E S These projects, commencing over the next three years, include adding meeting space, guest rooms and/or spas. We also will THE second piece of continue to take advantage of the plan consists of projects condominium development Doheny Beach; a new convention where we have the opportu- opportunities in Myrtle Beach center adjacent to our Hilton in nity to add value by maximiz- and at other locations and are Myrtle Beach; a spa and fitness ing the use of our real estate. evaluating additional value-add facility in Deerfield Beach; and The total investment in these enhancements to existing space. the repositioning and rebranding redevelopment projects is We have already begun work on of our hotel in San Francisco- Embassy Suites Hotel Mandalay Beach Resort & Conference Center, California; Embassy Suites Hotel Deerfield Beach Resort, Florida $150 million, and we expect to generate average returns of approximately 18%. four projects: meeting space in Union Square to an upper upscale brand. This type of hotel and its location, in a major urban market, illustrates our investment strategy going forward. F e l C o r Lodging Trust 0 5
8
9 A D I F F E R E N T P O I N T O F V I E W to entry. We will also look to acquire properties that further THE final piece of our improve the overall quality of internal growth plan represents the portfolio. We will do this by a change in our approach to acquiring upper upscale hotels in asset management. We wanted major urban markets and key our asset managers to work more closely with our brandoperators including the general managers and sales staff, where they could add value in helping to remix the business at our hotels with the goal of This allows our asset managers to develop a better understanding of their hotels and markets and the demand generators. Our brandoperator partners have embraced this new approach and believe it adds tremendous value. resort destinations. From a value perspective, any acquisition must meet strict criteria, including a minimum internal rate of return, increasing our overall return on invested capital and creating long-term shareholder value. increasing average rates and operating margins. In order to accomplish this, we reduced the average number of hotels per The final phase of our strategic plan will be external growth. As we move forward, we will use our borrowing capacity to take asset manager by more than advantage of acquisition oppor- Embassy Suites Hotel Deerfield Beach Resort, Florida half to 14 and aligned the asset managers by region. tunities. However, as we look to acquire hotels, we will be extremely disciplined. Strategically, our goal is to further diversify our portfolio and add hotels in markets with high barriers F e l C o r Lodging Trust 0 7


10 A V I S I O N T O L E A D L O O K I N G A H E A D We are excited about the Bob s operational experience and changes we have made and our W E completed the Tom s development experience new perspective. We look for- transition to our new roles, will be valuable as we execute ward to completing the sale of which was very successful, and our strategic plan, and we are the remaining non-strategic finalized the senior management team with the addition of Troy Pentecost, Jonathan Yellen and Rob Carl. We have also made some exciting changes to the Board. Don McNamara, Dick Jacobson and Mike Rose departed after many years of service. We thank them for their service and wish them well in retirement. We welcomed Bob Cotter in 2006, and added Tom Hendrick to the Board in February of this year Annual Report enthusiastic about working with our new Board. We also want to thank everyone on the FelCor team. They are the ones who have helped the Company achieve its strong results with their continued efforts. We are also proud of their continued efforts in the community with JDRF and other charities. hotels and executing our internal growth plan which will produce significant earnings growth. The lodging industry fundamentals remain strong and we are well positioned to achieve even greater success in the years to come. Sincerely, R i c h a r d A. S m i t h President and CEO To m C o r c o r a n Chairman of the Board Sheraton Premiere at Tysons Corner Vienna, Virginia

11


12 Sheraton Suites Galleria Atlanta, Georgia; Embassy Suites Hotel Piscataway, New Jersey; Sheraton Gateway Atlanta- Airport, Georgia; Doubletree Guest Suites Doheny Beach, California; Holiday Inn San Diego-On the Bay, California; Embassy Suites Hotel Deerfield Beach Resort, Florida

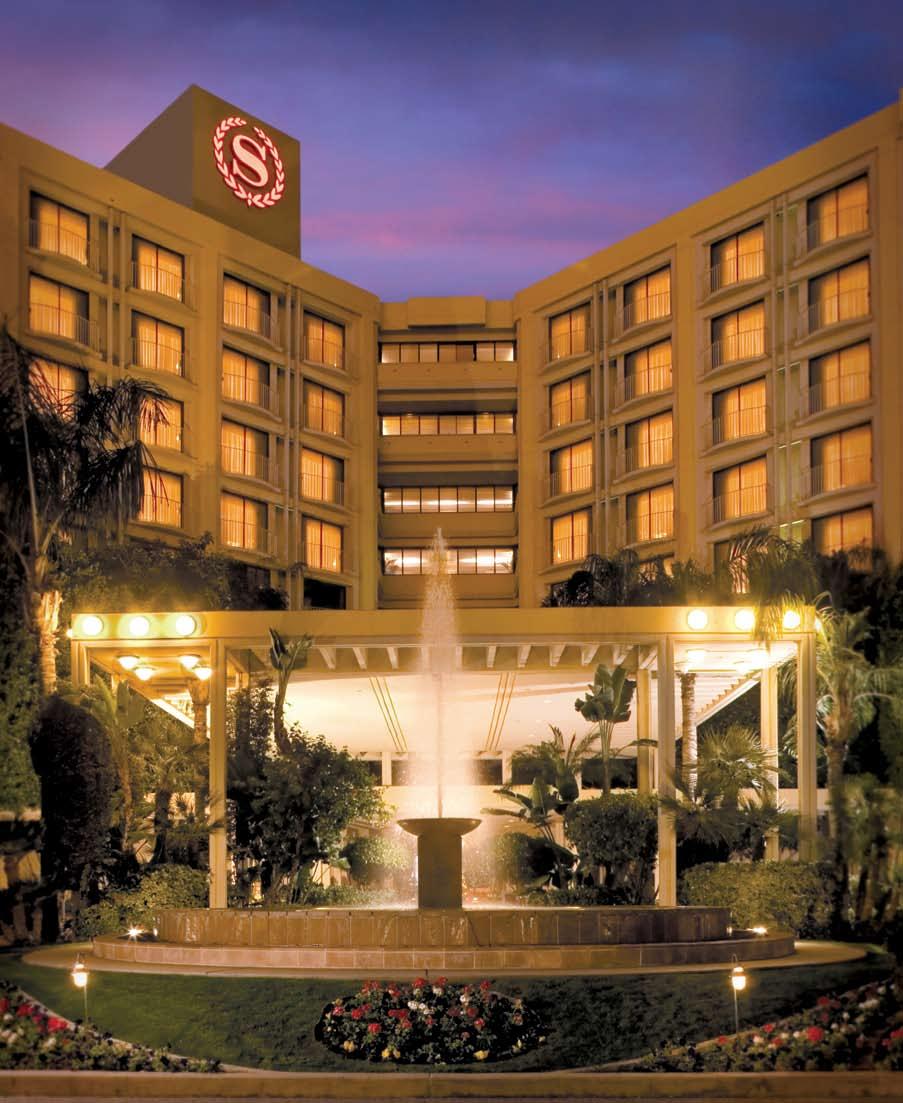
13 Sheraton Crescent Hotel Phoenix, Arizona
14

15 Embassy Suites Hotel Mandalay Beach Resort & Conference Center, California Sheraton Crescent Hotel Phoenix, Arizona F e l C o r Lodging Trust 1 3


16 Holiday Inn Mills House Charleston, South Carolina; Embassy Suites Hotel Napa Valley, California

17 Westin Dallas-Park Central, Texas


18 Embassy Suites Hotel Ft. Lauderdale, Florida; Sheraton Suites Galleria Atlanta, Georgia Annual Report
19 T A B L E O F C O N T E N T S Selected Financial Data 18 Management s Discussion and Analysis of Financial Condition and Results of Operations 20 Management s Report on Internal Control over Financial Reporting 42 Report of Independent Registered Public Accounting Firm 43 Consolidated Balance Sheets 45 Consolidated Statements of Operations 46 Consolidated Statements of Comprehensive Income (Loss) 47 Consolidated Statements of Stockholders Equity 48 Consolidated Statements of Cash Flows 49 Notes to Consolidated Financial Statements 50 F e l C o r Lodging Trust 1 7
20 S E L E C T E D F I N A N C I A L D A T A The following tables set forth selected financial data for us for the years ended December 31, 2006, 2005, 2004, 2003, and 2002 that has been derived from our audited financial statements and the notes thereto. This data should be read in conjunction with Management s Discussion and Analysis of Financial Condition and Results of Operations, and the consolidated financial statements and notes thereto, appearing elsewhere in this 2006 annual report to stockholders. Year Ended December 31, (in thousands, except per share data) S t a t e m e n t o f O p e r a t i o n s D a t a : (1) Total revenues $ 991,038 $ 914,655 $ 842,612 $ 786,883 $ 815,366 Income (loss) from continuing operations (2) 8,565 (16,916) (78,376) (73,564) (55,331) D i l u t e d e a r n i n g s p e r s h a r e : Net loss from continuing operations applicable to common stockholders $ (0.50) $ (1.06) $ (1.92) $ (1.71) $ (1.51) O t h e r D a t a : Cash distributions declared per common share (3) $ 0.80 $ 0.15 $ $ $ 0.60 Funds From Operations (4) 93,451 (191,139) (30,608) (207,462) (60,018) EBITDA (4) 300,460 12, ,950 (532) 150,024 Cash flows provided by operating activities 147, ,482 33,281 52, ,037 B a l a n c e S h e e t D a t a ( a t e n d o f p e r i o d ) : Total assets $ 2,583,249 $ 2,920,263 $ 3,318,191 $ 3,590,893 $ 3,780,363 Total debt, net of discount 1,369,153 1,675,280 1,767,122 2,037,355 1,877,134 (1) All years prior to 2006 have been adjusted to reflect those hotels disposed in 2006 or prior periods as discontinued operations. (2) Included in income (loss) from continuing operations are the following amounts: Year Ended December 31, (in thousands) Charge-off of deferred debt costs $ (3,562) $ (1,448) $ (6,960) $ (2,834) $ (3,222) Loss on early extinguishment of debt (12,471) (4,037) (44,216) Abandoned projects (33) (265) (1,663) Gain on swap termination 1,715 1,005 Gain (loss) on sale of assets (92) (3) Commencing with the fourth quarter 2005, we reinstituted a common dividend. We had declared a quarterly common dividend on our common stock from our inception through 2002, but as a result of the uncertain geopolitical environment and soft business climate, together with the decline in Hotel EBITDA margins resulting from continued declines in our portfolio s average daily rate, our board of directors suspended the payment of dividends on our common stock in 2003 and We have, however, continued to pay the full accrued dividends on our outstanding preferred stock. (4) A more detailed description and computation of FFO and EBITDA is contained in the Non-GAAP Financial Measures section of Management s Discussion and Analysis of Financial Condition and Results of Operations Annual Report
21 ( C o n t i n u e d ) S E L E C T E D F I N A N C I A L D A T A Consistent with SEC guidance, FFO has not been adjusted for the following amounts included in net income (loss): Year Ended December 31, (in thousands) Impairment loss $ (16,474) $ (266,751) $ (38,289) $ (245,509) $ (157,505) Minority interest share of impairment loss 927 8,976 1,770 Charge-off of deferred debt costs (3,624) (2,659) (6,960) (2,834) (3,222) Gain (loss) on early extinguishment of debt (13,848) (8,641) (44,216) 1,611 Gain (loss) on swap termination 1,715 1,005 Asset disposition costs (1,300) (4,900) Abandoned projects (112) (265) (1,663) Issuance costs of redeemed preferred stock (6,522) Consistent with SEC guidance, EBITDA has not been adjusted for the following amounts included in net income (loss): Year Ended December 31, (in thousands) Impairment loss, discontinued operations $ (16,474) $ (266,751) $ (38,289) $ (245,509) $ (157,505) Minority interest share of impairment loss 927 8,976 1,770 Charge-off of deferred debt costs (3,624) (2,659) (6,960) (2,834) (3,222) Gain (loss) on early extinguishment of debt (13,848) (8,641) (44,216) 1,611 Gain on swap termination 1,715 1,005 Asset disposition costs (1,300) (4,900) Abandoned projects (112) (265) (1,663) Gain on sale of hotels, net of tax 40,650 12,124 19,422 2,668 5,861 F e l C o r Lodging Trust 19
22 M D & A M A N A G E M E N T S D I S C U S S I O N A N D A N A L Y S I S O F F I N A N C I A L C O N D I T I O N A N D R E S U L T S O F O P E R A T I O N S for the Years Ended December 31, 2006, 2005, and 2004 G e n e r a l We completed 2006 with a 7.8% increase in our hotel revenue per available room, or RevPAR, compared to This was the third year of RevPAR increases following a three-year decline in RevPAR. The fundamentals of the lodging industry appear to be strong, as evidenced by the national trend of increased RevPAR and increases in average daily room rates, or ADR, which is responsible for the increase in RevPAR in the current year. The increase in ADR was also a major factor in a 182 basis point increase in our Hotel Earnings Before Interest, Taxes, Depreciation and Amortization margin, or Hotel EBITDA margin, for our hotels in continuing operations. Hotel EBITDA margin is a commonly used non-gaap measure described in more detail and reconciled to GAAP measures in the Non-GAAP Financial Measures section of this Management s Discussion and Analysis of Financial Condition. We completed amendments to our management agreements with InterContinental Hotels Group PLC, or IHG, in January This enabled us to start the process of selling 42 non-strategic hotels, of which 30 were operated under management agreements with IHG. These non-strategic hotels were generally located in slower growth markets with low barriers to entry and required capital investments not meeting our return criteria. During 2006, we sold 31 of these non-strategic hotels, leaving 11 non-strategic hotels, which we expect to sell in early The 31 hotels sold in 2006 provided gross proceeds of $514 million, which were used to pay down debt of approximately $356 million and invested in capital improvements at many of our core hotels. In 2006, we embarked on a three-year capital improvement program, affecting our entire core portfolio, designed to enhance our competitive position. During 2006, we spent $179 million on capital expenditures, of this, approximately $48 million related to capital items committed in 2005 and $131 million related to our three-year capital improvement program. We expect to spend approximately $225 million in 2007 and, at the completion of this renovation program in 2008, we will have made major capital investments aggregating approximately $430 million. As a result of the strong economy and the related impact on the travel and lodging industries, and our lower secured debt levels, Standard & Poor s raised its ratings on our senior unsecured debt twice in 2006 from B- to B and from B to B+, and in 2006 Moody s Investor Services raised our debt ratings from B1 to Ba3. As a result of the Moody s upgrade in April 2006, the interest rate applicable to $300 million of our senior unsecured debt maturing in 2011 decreased from 9.0% to 8.5%, reducing our annualized interest expense by $1.5 million. During 2006, we paid down debt of approximately $356 million, refinanced another $465 million of debt and reduced interest rates by 0.5% on $300 million of senior debt. The combined effect of these actions will result in reducing our annual interest expense by $38 million and lowering our weighted average cost of debt by 55 basis points. In December 2005, we resumed paying a common dividend with a $0.15 per share dividend, which was also paid in the first quarter of For the second and third quarters of 2006, our Board of Directors increased the dividend to $0.20 per share, and in the fourth quarter it was increased once again to $0.25 per share Annual Report
23 ( C o n t i n u e d ) M D & A F i n a n c i a l C o m p a r i s o n Year Ended December 31, (in thousands, except RevPAR, Hotel EBITDA margin and percentage change) % Change % Change RevPAR $ $ % $ % Hotel EBITDA (1) 292, , % 223, % Hotel EBITDA margin (1) 29.5% 27.7% 6.5% 26.6% 4.1% Loss from continuing operations applicable to common shareholders (2) (30,148) (62,846) 52.0% (113,506) 44.6% Funds From Operations ( FFO ) (1) (3) 93,451 (191,139) 148.9% (30,608) (524.5)% Earnings Before Interest, Taxes, Depreciation and Amortization ( EBITDA ) (1) (4) 300,460 12,475 2,308.5% 184,950 (93.3)% (1) Included in the Financial Comparison are non-gaap financial measures, including Hotel EBITDA, Hotel EBITDA margin, FFO and EBITDA. Further discussion and a detailed reconciliation of these non-gaap financial measures to our financial statements are found elsewhere in this Management s Discussion and Analysis of Financial Condition and Results of Operations. (2) Included in loss from continuing operations applicable to common shareholders are the following amounts: Year Ended December 31, (in thousands) Loss on early extinguishment of debt $ (12,471) $ (4,037) $ (44,216) Charge-off of deferred debt costs (3,562) (1,448) (6,960) Abandoned projects (33) (265) Gain on swap termination 1,715 1,005 Gain (loss) on sale of assets (92) 469 (3) Consistent with SEC guidance on non-gaap financial measures, FFO has not been adjusted for the following amounts included in net income (loss) Per Share per Share per Share Dollars Amount Dollars Amount Dollars Amount (in thousands, except per share amounts) Impairment loss, discontinued operations $ (16,474) $ (0.26) $ (266,751) $ (4.29) $ (38,289) $ (0.62) Minority interest share of impairment loss , Charge-off of deferred debt costs (3,624) (0.06) (2,659) (0.04) (6,960) (0.10) Loss on early extinguishment of debt (13,848) (0.22) (8,641) (0.14) (44,216) (0.71) Asset disposition costs (1,300) (0.02) (4,900) (0.08) Abandoned projects (112) (265) Gain on swap termination 1, , Issuance costs of redeemed preferred stock (6,522) (0.10) F e l C o r Lodging Trust 21
24 ( C o n t i n u e d ) M D & A (4) Consistent with SEC guidance on non-gaap financial measures, EBITDA has not been adjusted for the following amounts included in net income (loss). Year Ended December 31, (in thousands) Impairment loss, discontinued operations $ (16,474) $ (266,751) $ (38,289) Minority interest share of impairment loss 927 8,976 Charge-off of deferred debt costs (3,624) (2,659) (6,960) Gain on early extinguishment of debt (13,848) (8,641) (44,216) Gain on swap termination 1,715 1,005 Asset disposition costs (1,300) (4,900) Abandoned projects (112) (265) Gain on sale of hotels, net of tax 40,650 12,124 19,422 R e v PA R a n d H o t e l O p e r a t i n g M a r g i n In 2006, we had our third consecutive year-over-year increase in RevPAR. For the year, RevPAR increased 7.8% from $84.86 to $ The increase in RevPAR was made up of an 8.5% increase in ADR while occupancy dropped 0.7% to 72.6%. We attribute the increase in RevPAR to a nationwide lodging industry recovery, improved hotel performance following major capital projects completed in 2005 and 2006 and a concerted effort to change our customer mix to higher ADR business. We expect RevPAR to continue increasing in 2007 and that improvements in ADR will continue to drive RevPAR growth. Increases in ADR generally result in increases in Hotel EBITDA margins. We have seen a firming of Hotel EBITDA margin at our hotels, which improved from 27.7% in 2005 to 29.5% in 2006, and we expect to see further improvement in 2007 as ADR continues to be a significant factor in RevPAR improvement. We are focused on working with our brand managers to control the expense growth that typically occurs during a lodging industry recovery, improve our Hotel EBITDA margins and manage renovation displacement to minimize their impact on Hotel EBITDA margins. R e f i n e d I n v e s t m e n t S t r a t e g y By amending our agreements with IHG we were able to sell certain non-strategic hotels and use the proceeds to reduce debt and invest in high return-on-investment capital projects at our remaining core hotels. We plan on spending approximately $430 million on hotel capital improvements from 2006 through As we focus on improving our core portfolio through renovation and repositioning, we believe our portfolio will be positioned to have above average growth. Any future acquisition efforts will focus on higher quality hotels in markets with significant barriers to entry, such as central business districts and resort locations. Hotel brand and market segment will be secondary concerns when we are considering investment opportunities. R e s u l t s o f O p e r a t i o n s C o m p a r i s o n o f t h e Ye a r s E n d e d D e c e m b e r 3 1, a n d For the year ended December 31, 2006, we recorded net income applicable to common stockholders of $12.3 million, compared to a net loss of $297.5 million in We had income from continuing operations of $8.6 million compared to a prior year loss from continuing operations of $16.9 million. A significant item impacting the current year income from continuing operations was an aggregate of $14.3 million of charges related to the early retirement of debt. Contributing to the 2005 loss from continuing operations were $6.5 million in losses from hurricanes, $5.5 million of charges related to the early retirement of debt and $266.8 million of impairment charges, recorded under the provisions of SFAS Annual Report
25 ( C o n t i n u e d ) M D & A Total revenue from continuing operations increased $76.4 million, or 8.4%, compared to the prior year. The increase in revenue is principally attributed to a 7.8% increase in RevPAR compared to The increase in RevPAR resulted from increases in ADR net of a slight drop in occupancy and represents industry RevPAR increases in most of our major markets. The lodging industry nationwide continues to experience increased demand, but there have been only limited increases in room supply leading to strong improvements in RevPAR in many markets. Our increase in ADR was higher than the overall industry average partly because of our concentrated efforts to change the mix of our business to higher ADR business. Increased ADR typically improves Hotel EBITDA margin because the hotels are receiving more revenue for each guest. In 2006, our Hotel EBITDA margin improved 182 basis points over 2005 largely because of the increased ADR. Total operating expenses increased by $58.4 million but decreased as a percentage of total revenue from 88.9% to 87.9%. Hotel departmental expenses, which consist of rooms expense, food and beverage expense, and other operating departments, increased $16.3 million compared to 2005, but decreased as a percentage of total revenue from 33.2% to 32.3%, largely from improvements in labor costs as a percentage of total revenue. Hotel departmental expenses are directly related to the number of hotel guests and should continue to improve as a percentage of total revenue as rates increase. Other property operating costs, which consist of general and administrative costs, marketing costs, repairs and maintenance, utilities expense, and other costs, increased $14.7 million compared to 2005, but decreased as a percentage of total revenue from 27.9% to 27.3%. All of the other property operating costs remained constant or decreased as a percent of total revenue compared to Management and franchise fees increased $6.0 million compared to 2005 and increased slightly as a percentage of total revenue, from 4.9% to 5.2%. The increase as a percentage of total revenue is related to additional incentive fees earned by our management companies. Taxes, insurance and lease expense increased $7.2 million compared to 2005 but decreased slightly as a percentage of total revenue from 11.5% to 11.3%. We had increases as a percentage of total revenue in percentage lease expense and property insurance, but this was more than offset by decreases as a percentage of total revenue in general liability insurance and property tax expense. Percentage lease expense is computed as a percentage of hotel revenues in excess of a base rent. Therefore, as revenues increase, percentage rent expense increases at a faster rate. Property insurance reflects the nationwide trend of increases in rates related to catastrophic coverage. Corporate expenses increased by $4.3 million compared to 2005 and increased slightly as a percentage of total revenue. The increase in corporate expenses is attributed to severance costs related to several executives that left the company in 2005 and additional asset management positions related to our modified asset management approach. Depreciation expense increased by $10.1 million compared to The increase in depreciation expense reflects the large capital expenditures spent in 2005 and Net interest expense decreased by $10.8 million in 2006 compared to The principal reason for the reduction in interest expense is attributed to reduction in average debt outstanding during 2006 of $256.7 million, a 26 basis point decrease in our weighted average interest rate and a $3.0 million increase in capitalized interest. During 2006, we refinanced $415 million of senior notes and $138.9 million of mortgage debt at lower interest rates. As the result of strong economy, its impact on the travel and lodging industry and our lower secured debt levels, Standard & Poor s and Moody s Investor Services upgraded their ratings on our senior debt, resulting in a 50 basis point decrease in the interest rate on $300 million of our senior debt. The increase in capitalized interest is related to the expanded capital renovation program at our hotels and the construction loan on our Royale Palms Condominium development in Myrtle Beach, South Carolina, which we expect to repay in the second quarter of The early retirement of debt in 2006 resulted in net debt extinguishment costs of $15.6 million, of which $1.3 was recorded in discontinued operations. In 2005, we recorded $11.3 million in debt extinguishment costs, of which $5.8 million was recorded in discontinued operations. F e l C o r Lodging Trust 23
26 ( C o n t i n u e d ) M D & A Equity in income from unconsolidated entities was $11.5 million in 2006 compared to $10.2 million in Net income from unconsolidated entities owning hotels increased in 2006 principally related to improvements in RevPAR. Minority interest decreased by $1.8 million compared to 2005, principally resulting from reduction in losses attributed to minority interest holders from improved operations. Discontinued operations provided net income of $42.5 million in 2006 compared to a loss of $234.7 million in Included in discontinued operations at December 31, 2006, are the operating income or loss, direct interest costs and gains on sale related to the 31 hotels sold in 2006, 19 hotels disposed in 2005 and the 11 hotels considered held for sale at December 31, Gains on sale aggregating $43.2 million were included in the 2006 income from discontinued operations. Impairment charges recorded under the provisions of SFAS 144 aggregating $266.8 million are included in the loss from discontinued operations in C o m p a r i s o n o f t h e Ye a r s E n d e d D e c e m b e r 3 1, a n d For the year ended December 31, 2005, we recorded a loss applicable to common stockholders of $297.5 million, compared to a loss of $135.2 million in We had a loss from continuing operations of $16.9 million in 2005 compared to a 2004 loss of $78.4 million. Contributing to 2005 loss from continuing operations were $5.5 million of charges related to the early retirement of debt and $6.5 million in losses from hurricanes. Total revenue from continuing operations increased $72.1 million, or 8.5%, compared to the prior year. The increase in revenue is principally attributed to a 11.0% increase in RevPAR compared to The increase in RevPAR came from increases in both ADR and occupancy and represents increases in all of our top markets. The lodging industry nationwide continued to experience increased demand in 2005, but there were only limited increases in room supply leading to strong improvements in RevPAR in most markets. In 2005, 57% of our increased RevPAR was attributed to increases in ADR. Increased ADR typically improves Hotel EBITDA margin because the hotels are receiving more revenue for each guest. For 2005, our Hotel EBITDA margin improved 113 basis points over Total operating expenses increased by $57.0 million but decreased as a percentage of total revenue from 89.7% to 88.9%. Hotel departmental expenses, which consist of rooms expense, food and beverage expense, and other operating departments, increased $12.8 million compared to 2004, but decreased as a percentage of total revenue from 34.6% to 33.2%. These costs are directly related to the number of hotel guests and should improve as a percentage of total revenue as rates increase. Other property operating costs, which consist of general and administrative costs, marketing costs, repairs and maintenance, utilities expense, and other costs, increased $20.4 million compared to 2004, and remained constant as a percentage of total revenue at 27.9%. The only component of these costs that increased as a percentage of total revenue was utility expenses, while the other costs remained constant or decreased as a percent of total revenue. Management and franchise fees increased $2.6 million compared to 2004 and remained essentially the same as a percentage of total revenue. Taxes, insurance and lease expense increased $12.6 million and increased as a percentage of total revenue from 10.9% to 11.5%. The increase as a percentage of total revenue was from property tax expense, percentage lease expense and general liability insurance. Property tax expenses increased in 2005 largely because of credits for prior year tax appeals that were recorded in Percentage lease expense is computed as a percentage of hotel revenues in excess of a base rent. Therefore, as revenues increase, percentage rent expense increases at a faster rate. General liability insurance reflects the nationwide trend of increases in rates Annual Report
27 ( C o n t i n u e d ) M D & A Corporate expenses increased by $2.0 million compared to 2004 and remained essentially flat as a percentage of total revenue. Depreciation expense increased by $6.3 million compared to The increase in depreciation expense reflects the large capital expenditures spent in 2004 and Net interest expense decreased by $14.5 million in 2005 compared to The principal reason for the reduction in interest expense is attributed to reduction in average debt outstanding during Our average outstanding debt decreased by $178 million in 2005 compared to During 2004 we retired $775 million of senior notes and issued $524 million of senior notes and mortgage debt. In 2005, we further reduced our outstanding debt by $92 million. In 2005, we incurred hurricane losses of $6.4 million compared to hurricane losses of $2.1 million incurred in The hurricane losses for both years represent our insurance deductibles and our best estimates of direct expenses related to these losses During 2005, we incurred net charges of $11.3 million related to the early retirement of debt (of which $5.8 million was recorded in discontinued operations) compared to $50.2 million in The early extinguishment of debt charges in 2005 related principally to secured debt that was retired on hotels that we have designated as non-strategic. The 2004 early retirement related principally to the early retirement of senior notes paying 10% interest. Equity in income from unconsolidated entities was $10.2 million in 2005 compared to $17.1 million in Included in 2004 was an $11 million gain related to the sale of a residential condominium development in Myrtle Beach, South Carolina. Net income from unconsolidated ventures owning hotels increased in 2005 principally related to improvements in RevPAR. Discontinued operations provided net loss of $234.7 million in 2005 compared to a loss of $21.8 million in Included in discontinued operations are the results of operations of the 19 hotels disposed in In 2005, we recorded impairment charges, under the provisions of SFAS 144, of $266.8 million, all of which has been included in discontinued operations. The 2005 charges primarily related to our decision to designate as non-strategic and sell an additional 28 hotels, in connection with the negotiation of the amendment to our IHG management agreements. We also recorded impairment charges with respect to 11 hotels previously designated as non-strategic principally because of revised estimates of fair value. Preferred dividends increased by $4.3 million in 2005 compared to The principal reasons for this increase are attributed to the issuance of $160 million of Series A preferred stock in 2004 and the first full year of dividends in In accordance with the Emerging Issues Task Force Topic D-42, The Effect on the Calculation of Earnings per Share for the Redemption or Induced Conversion of Preferred Stock, we have subtracted $6.5 million of the issuance costs of our redeemed Series B preferred stock from net income to determine net loss applicable to common stockholders for the calculation of net loss per share. N o n - G A A P F i n a n c i a l M e a s u r e s We refer in this 2006 annual report to stockholders to certain non-gaap financial measures. These measures, including FFO, EBITDA, Hotel EBITDA and Hotel EBITDA margin, are measures of our financial performance that are not calculated and presented in accordance with generally accepted accounting principles, or GAAP. The following tables reconcile each of these non-gaap measures to the most comparable GAAP financial measure. Immediately following the reconciliations, we include a discussion of why we believe these measures are useful supplemental measures of our performance and of the limitations upon such measures. F e l C o r Lodging Trust 25
28 ( C o n t i n u e d ) M D & A The following tables detail our computation of FFO: R e c o n c i l i a t i o n o f N e t I n c o m e ( L o s s ) t o F F O Year Ended December 31, (in thousands, except per share data) per Share P per Share P per Share Dollars Shares Amount Dollars Shares Amount Dollars Shares Amount N e t i n c o m e ( l o s s ) $ 51,045 $ (251,615) $ (100,127) Issuance costs of redeemed preferred stock (6,522) Preferred dividends (38,713) (39,408) (35,130) Net income (loss) applicable to common stockholders 12,332 60,734 $ 0.20 (297,545) 59,436 $ (5.01) (135,257) 59,045 $ (2.29) Depreciation from continuing operations 94, , , Depreciation from unconsolidated entities and discontinued operations 26, , , Gain on sale of hotels, net of income tax (40,650) (0.67) (12,124) (0.20) (19,422) (0.33) Minority interest in FelCor LP 279 1,864 (0.04) (13,677) 2,778 (0.08) (6,681) 2,939 (0.08) Conversion of options and unvested restricted stock 327 F F O $ 93,451 62,925 $ 1.49 $ (191,139) 62,214 $ (3.07) $ (30,608) 61,984 $ (0.49) Year Ended December 31, (in thousands, except per share data) P per Share P per Share Dollars Shares Amount Dollars Shares Amount N e t l o s s $ (310,144) $ (178,581) Issuance costs of redeemed preferred stock Preferred dividends (26,908) (26,292) Net loss applicable to common stockholders (337,052) 58,657 $ (5.75) (204,873) 54,173 $ (3.78) Depreciation from continuing operations 76, , Depreciation from unconsolidated entities and discontinued operations 73, , Gain on sale of hotels (2,668) (0.05) (5,861) (0.11) Minority interest in FelCor LP (17,777) 3,188 (0.11) (13,717) 7,564 (0.11) F F O $ (207,462) 61,845 $ (3.35) $ (60,018) 61,737 $ (0.97) Annual Report
29 ( C o n t i n u e d ) M D & A Consistent with SEC guidance on non-gaap financial measures, FFO has not been adjusted for the following amounts included in net income (loss): Year Ended December 31, (in thousands, except for per share amounts) Per Share per Share per Share per Share per Share Dollars Amount Dollars Amount Dollars Amount Dollars Amount Dollars Amount Impairment loss $ (16,474) $ (0.26) $ (266,751) $ (4.29) $ (38,289) $ (0.62) $ (245,509) $ (3.97) $ (157,505) $ (2.55) Minority interest share of impairment loss , , Charge-off of deferred debt costs (3,624) (0.06) (2,659) (0.04) (6,960) (0.10) (2,834) (0.05) (3,222) (0.05) Gain (loss) on early extinguishment of debt (13,848) (0.22) (8,641) (0.14) (44,216) (0.71) 1, Gain from swap termination 1, , Abandoned projects (112) (265) (1,663) (0.03) Asset disposition costs (1,300) (0.02) (4,900) (0.08) Issuance costs of redeemed preferred stock (6,522) (0.10) The following table details our computation of EBITDA: R e c o n c i l i a t i o n o f N e t I n c o m e ( L o s s ) t o E B I T D A Year Ended December 31, (in thousands) N e t i n c o m e ( l o s s ) $ 51,045 $ (251,615) $ (100,127) $ (310,144) $ (178,581) Depreciation from continuing operations 94,579 84,448 78,116 76,288 81,381 Depreciation from unconsolidated entities and discontinued operations 26,911 47,759 52,636 73,747 83,052 Interest expense 114, , , , ,942 Interest expense from unconsolidated entities and discontinued operations 7,657 16,949 19,189 18,817 19,859 Amortization expense 5,080 2,904 2,945 2,210 2,088 Minority interest in FelCor LP 279 (13,677) (6,681) (17,777) (13,717) E B I T D A $ 300,460 $ 12,475 $ 184,950 $ (532) $ 150,024 F e l C o r Lodging Trust 27
30 ( C o n t i n u e d ) M D & A Consistent with SEC guidance on non-gaap financial measures, EBITDA has not been adjusted for the following amounts included in net income (loss): (in thousands) Year Ended December 31, Impairment loss $ (16,474) $ (266,751) $ (38,289) $ (245,509) $ (157,505) Minority interest share of impairment loss 927 8,976 1,770 Charge-off of deferred debt costs (3,624) (2,659) (6,960) (2,834) (3,222) Gain (loss) on early extinguishment of debt (13,848) (8,641) (44,216) 1,611 Gain (loss) from swap termination 1,715 1,005 Asset disposition costs (1,300) (4,900) Abandoned projects (112) (265) (1,663) Gain on sale of hotels, net of income tax 40,650 12,124 19,422 2,668 5,861 H o t e l E B I T D A a n d H o t e l E B I T D A M a r g i n (dollars in thousands) Year Ended December 31, C o n t i n u i n g O p e r a t i o n s Total revenue $ 991,038 $ 914,655 $ 842,612 Retail space rental and other revenue (79) (1,506) (2,196) Hotel revenue 990, , ,416 Hotel operating expenses (698,540) (660,339) (617,229) Hotel EBITDA $ 292,419 $ 252,810 $ 223,187 Hotel EBITDA margin (1) 29.5% 27.7% 26.6% (1) Hotel EBITDA as a percentage of hotel revenue Annual Report
31 ( C o n t i n u e d ) M D & A H o t e l O p e r a t i n g E x p e n s e C o m p o s i t i o n (in thousands) Year Ended December 31, C o n t i n u i n g O p e r a t i o n s Hotel departmental expenses: Room $ 199,283 $ 187,872 $ 178,146 Food and beverage 97,012 93,136 90,715 Other operating departments 23,436 22,446 21,758 Other property related costs: Administrative and general 87,451 82,607 76,898 Marketing and advertising 81,113 76,151 71,099 Repairs and maintenance 52,710 50,011 46,063 Energy 49,027 46,857 41,144 Taxes, insurance and lease expense 57,271 56,044 48,742 Total other property related costs 647, , ,565 Management and franchise fees 51,237 45,215 42,664 Hotel operating expenses $ 698,540 $ 660,339 $ 617,229 Reconciliation of total operating expense to hotel operating expense: Total operating expenses $ 871,241 $ 812,885 $ 755,892 Unconsolidated taxes, insurance and lease expense 6,273 5,881 5,900 Consolidated hotel lease expense (61,054) (54,689) (49,414) Abandoned projects (33) (265) Corporate expenses (23,308) (19,025) (17,033) Depreciation (94,579) (84,448) (78,116) Hotel operating expenses $ 698,540 $ 660,339 $ 617,229 R e c o n c i l i a t i o n o f N e t I n c o m e ( L o s s ) t o H o t e l E B I T D A Year Ended December 31, (in thousands) Net income (loss) $ 51,045 $ (251,615) $ (100,127) Discontinued operations (42,480) 234,699 21,751 Equity in income from unconsolidated entities (11,537) (10,169) (17,121) Minority interests (2,508) (4,310) (6,223) Consolidated hotel lease expense 61,054 54,689 49,414 Unconsolidated taxes, insurance and lease expense (6,273) (5,881) (5,900) Interest expense, net 110, , ,144 Hurricane loss 6,481 2,125 Loss on early extinguishment of debt 12,471 4,037 44,216 Charge-off of deferred financing costs 3,562 1,448 6,960 Gain on swap termination (1,715) (1,005) Corporate expenses 23,308 19,025 17,033 Depreciation 94,579 84,448 78,116 Retail space rental and other revenue (79) (1,506) (2,196) Abandoned projects Gain on sale of assets 92 (469) Hotel EBITDA $ 292,419 $ 252,810 $ 223,187 F e l C o r Lodging Trust 29
32 ( C o n t i n u e d ) M D & A R e c o n c i l i a t i o n o f R a t i o o f O p e r a t i n g I n c o m e t o T o t a l R e v e n u e s t o H o t e l E B I T D A M a r g i n Year Ended December 31, Ratio of operating income to total revenues 12.1% 11.1% 10.3% Retail space rental and other revenue (0.2) (0.3) Unconsolidated taxes, insurance and lease expense (0.7) (0.5) (0.6) Consolidated lease expense Corporate expenses Depreciation Hotel EBITDA margin 29.5% 27.7% 26.6% Substantially all of our non-current assets consist of real estate. Historical cost accounting for real estate assets implicitly assumes that the value of real estate assets diminish predictably over time. Since real estate values instead have historically risen or fallen with market conditions, most industry investors consider supplemental measures of performance, which are not measures of operating performance under GAAP, to be helpful in evaluating a real estate company s operations. These supplemental measures, including FFO, EBITDA, Hotel EBITDA and Hotel EBITDA margin, are not measures of operating performance under GAAP. However, we consider these non-gaap measures to be supplemental measures of a REIT s performance and should be considered along with, but not as an alternative to, net income as a measure of our operating performance. F F O a n d E B I T D A The White Paper on Funds From Operations approved by the Board of Governors of the National Association of Real Estate Investment Trusts, or NAREIT, defines FFO as net income or loss (computed in accordance with GAAP), excluding gains or losses from sales of property, plus depreciation and amortization, and after adjustments for unconsolidated partnerships and joint ventures. Adjustments for unconsolidated partnerships and joint ventures are calculated to reflect FFO on the same basis. We compute FFO in accordance with standards established by NAREIT. This may not be comparable to FFO reported by other REITs that do not define the term in accordance with the current NAREIT definition, or that interpret the current NAREIT definition differently than we do. EBITDA is a commonly used measure of performance in many industries. We define EBITDA as net income or loss (computed in accordance with GAAP) plus interest expenses, income taxes, depreciation and amortization, and after adjustments for unconsolidated partnerships and joint ventures. Adjustments for unconsolidated partnerships and joint ventures are calculated to reflect EBITDA on the same basis. H o t e l E B I T D A a n d H o t e l E B I T D A M a r g i n Hotel EBITDA and Hotel EBITDA margin are commonly used measures of performance in the hotel industry and give investors a more complete understanding of the operating results over which our individual hotels and operating managers have direct control. We believe that Hotel EBITDA and Hotel EBITDA margin is useful to investors by providing greater transparency with respect to two significant measures used by us in our financial and operational decision-making. Additionally, using these measures facilitates comparisons with other hotel REITs and hotel owners. We present Hotel EBITDA and Hotel EBITDA margin by eliminating corporate-level expenses, depreciation and expenses related to our capital structure. We eliminate corporate-level costs and expenses because we believe property-level results provide investors with supplemental information into the ongoing operational performance of our hotels and the effectiveness of management in running our business on a property-level basis. We eliminate depreciation and Annual Report
33 ( C o n t i n u e d ) M D & A amortization because, even though depreciation and amortization are property-level expenses, we do not believe that these non-cash expenses, which are based on historical cost accounting for real estate assets, and implicitly assume that the value of real estate assets diminishes predictably over time, accurately reflect an adjustment in the value of our assets. To enhance the comparability of our hotel-level operating results with other hotel REITs and hotel owners, we are now disclosing Hotel EBITDA and Hotel EBITDA margin rather than the hotel operating profit and hotel operating margin previously disclosed. The purpose of the change is to remove any distortion created by unconsolidated entities and to reflect hotel-level operations as if they were fully consolidated. To reflect this, we eliminate consolidated percentage rent paid to unconsolidated entities, which is effectively eliminated by minority interest expense and equity in income from unconsolidated subsidiaries, and include the cost of unconsolidated taxes, insurance and lease expense, to reflect the entire operating costs applicable to our hotels. U s e a n d L i m i t a t i o n s o f N o n - G A A P M e a s u r e s Our management and Board of Directors use FFO, EBITDA, Hotel EBITDA and Hotel EBITDA margin to evaluate the performance of our hotels and to facilitate comparisons between us and other lodging REITs, hotel owners who are not REITs and other capital intensive companies. We use Hotel EBITDA and Hotel EBITDA margin in evaluating hotel-level performance and the operating efficiency of our hotel managers. The use of these non-gaap financial measures has certain limitations. FFO, EBITDA, Hotel EBITDA and Hotel EBITDA margin, as presented by us, may not be comparable to FFO, EBITDA, Hotel EBITDA and Hotel EBITDA margin as calculated by other real estate companies. These measures do not reflect certain expenses that we incurred and will incur, such as depreciation, interest and capital expenditures. Management compensates for these limitations by separately considering the impact of these excluded items to the extent they are material to operating decisions or assessments of our operating performance. Our reconciliations to the most comparable GAAP financial measures, and our consolidated statements of operations and cash flows, include interest expense, capital expenditures, and other excluded items, all of which should be considered when evaluating our performance, as well as the usefulness of our non-gaap financial measures. These non-gaap financial measures are used in addition to and in conjunction with results presented in accordance with GAAP. They should not be considered as alternatives to operating profit, cash flow from operations, or any other operating performance measure prescribed by GAAP. Neither should FFO, FFO per share or EBITDA be considered as measures of our liquidity or indicative of funds available for our cash needs, including our ability to make cash distributions or service our debt. FFO per share does not measure, and should not be used as a measure of, amounts that accrue directly to the benefit of stockholders. FFO, EBITDA, Hotel EBITDA and Hotel EBITDA margin reflect additional ways of viewing our operations that we believe, when viewed with our GAAP results and the reconciliations to the corresponding GAAP financial measures, provide a more complete understanding of factors and trends affecting our business than could be obtained absent this disclosure. Management strongly encourages investors to review our financial information in its entirety and not to rely on a single financial measure. L i q u i d i t y a n d C a p i t a l R e s o u r c e s Our principal source of cash to meet our cash requirements, including distributions to stockholders and repayments of indebtedness, has historically been hotel operations. In 2006, net cash flow provided by operating activities, consisting primarily of hotel operations, was $147.7 million. However, in 2006 we sold 31 non-strategic hotels generating net proceeds of $496.8 million. The proceeds from the hotel sales were used to repay debt and pay for capital renovations at our remaining core hotels. At December 31, 2006, we had cash on hand of $124.2 million, including approximately $39.7 million held under management agreements to meet minimum working capital requirements. F e l C o r Lodging Trust 31
34 ( C o n t i n u e d ) M D & A For 2006, we declared and paid common dividends aggregating $0.80 per share. Our board of directors will determine the amount of future common and preferred dividends for each quarter, based upon the actual operating results for that quarter, economic conditions, other operating trends, our financial condition and capital requirements, as well as the minimum REIT distribution requirements. We have committed to spend approximately $430 million over a three year period, commencing in 2006, to renovate our core hotels. We have used, to date, and expect to use proceeds from non-strategic hotel sales to fund these renovations and pay down debt. The sale of 31 hotels in 2006, generated net proceeds of $496.8 million, and our remaining 11 non-strategic hotels are expected to provide gross proceeds of approximately $185 to $190 million in Through February 25, 2007, we sold two of the non-strategic hotels for gross proceeds of $42.7 million, and had three additional hotels under hard contract for sale. In 2006, we experienced significant displacement from hotel renovation that reduced revenues and Hotel EBITDA margins. We expect that the effect of ongoing renovation displacement for 2007 will be even more significant. In 2005, we started construction on the 184 unit Royale Palms condominium development in Myrtle Beach, South Carolina. This project is more than 98% pre-sold and is expected to be completed in the second quarter of We currently expect to earn net income of approximately $18 million at the completion of the project. We expect the sale of these condominiums will create an effective bridge for our earnings in a year when renovation displacement will negatively impact our results. We currently expect that our cash flow provided by operating activities for 2007 will be approximately $175 to $182 million. This cash flow forecast assumes that RevPAR increases by between 6.5% and 7.5% and Hotel EBITDA margin increases of approximately 30 basis points. Our current operating plan contemplates that we will make aggregate common dividend payments of approximately $47 million, preferred dividend payments of $39 million and $71 million in normal principal payments (including the $59 million construction loan for Royale Palms), leaving surplus cash flow (before capital expenditures, additional debt reduction, sale of hotels or sale of Royale Palms condominiums) of approximately $76 to $83 million. In 2007, we plan to spend approximately $225 million for capital expenditures, which will be funded with proceeds from the sale of non-strategic hotels and from cash. During the first quarter of 2006, our hotels in New Orleans and surrounding markets, such as Atlanta, Baton Rouge, Houston, San Antonio, and Dallas, benefited from the increase in demand for hotel rooms, resulting from the displacement of New Orleans residents and the influx of relief and construction workers following Hurricane Katrina. In the second quarter of 2006, the initial relief work was completed in New Orleans, and there was an exodus of first responders from the area. The shift away from relief workers and temporary housing to ongoing construction workers has dramatically reduced the demand in New Orleans; however, the surrounding markets continued to benefit from a strong demand for convention and group business that was moved from New Orleans, through the second quarter. In the third quarter of 2006, we began to see the temporary hurricane demand from surrounding markets subside, and in the fourth quarter of 2006, substantially no temporary hurricane demand remained. We expect to continue to have relatively weak performance from New Orleans in 2007 and until convention and tourism return to pre-hurricane levels. Events, including terrorist attacks, natural disasters, U.S. military involvement in the Middle East and the bankruptcy of several major corporations, had an adverse impact on the capital markets in prior years. Events, or circumstances of similar magnitude or impact, could adversely affect the availability and cost of our capital. In addition, any slowdown of the overall economy and of the lodging industry could adversely affect our operating cash flow and the availability and cost of capital for our business. We are subject to increases in hotel operating expenses, including wage and benefit costs, repair and maintenance expenses, utilities and insurance expenses, that can fluctuate disproportionately to revenues. Operating expenses are difficult to predict and control, which can produce volatility in our operating results. Our Hotel EBITDA margins from continuing operations increased in 2005 and However, if our hotel RevPAR decreases and/or Hotel EBITDA margins shrink, our operations, earnings and/or cash flow could suffer a material adverse effect Annual Report
35 ( C o n t i n u e d ) M D & A D e b t During 2006, we paid down debt of approximately $356 million, refinanced another $465 million of debt and reduced interest rates by 0.5% on $300 million of senior debt. The combined effect of these actions will result in reducing our annual interest expense by $38 million and lowering our weighted average cost of debt by 55 basis points. Line of Credit Our $125 million line of credit contains certain restrictive covenants, including a leverage ratio, fixed charge coverage ratio, unencumbered leverage ratio and a maximum payout ratio. The interest on our line can range from 175 to 225 basis points over LIBOR, based on our leverage ratio as defined in our line of credit agreement. In addition to financial covenants, our line of credit includes certain other affirmative and negative covenants, including restrictions on our ability to create or acquire whollyowned subsidiaries; restrictions on the operation/ownership of our hotels; limitations on our ability to lease property or guarantee leases of other persons; limitations on our ability to make restricted payments (such as distributions on common and preferred stock, share repurchases and certain investments); limitations on our ability to merge or consolidate with other persons, to issue stock of our subsidiaries and to sell all or substantially all of our assets; restrictions on our ability to make investments in condominium developments; limitations on our ability to change the nature of our business; limitations on our ability to modify certain instruments, to create liens, to enter into transactions with affiliates; and limitations on our ability to enter into joint ventures. At the date of this filing, we were in compliance with all of these covenants. If operating results fall significantly below our current expectations, we may not be able to meet some or all of these covenants in which case we may be unable to borrow under our line of credit. The breach of any of the covenants and limitations under our line of credit could result in the acceleration of amounts outstanding. Our failure to satisfy any accelerated recourse indebtedness, if in the amount of $10 million or more, could result in the acceleration of our other unsecured recourse indebtedness. We may not be able to refinance or repay our debt in full under those circumstances. Our other borrowings contain affirmative and negative covenants that are generally equal to or less restrictive than our line of credit. Payment of amounts due under our line of credit is guaranteed by us and certain of our subsidiaries who also guarantee payment of our senior debt and payment is secured by a pledge of our limited partnership interest in FelCor LP. At December 31, 2006 we had no borrowings under our line of credit. Our interest rate on our line of credit has decreased from LIBOR plus 2.25% to LIBOR plus 1.75% during 2006 based on our leverage ratio as defined in our line of credit agreement. Construction Loan In 2005, we started construction on the 184 unit Royale Palms condominium development in Myrtle Beach, South Carolina. This project is more than 98% pre-sold and is expected to be completed with the condominiums substantially all closed in the second quarter of In conjunction with this development, we entered into a $69.8 million recourse construction loan facility. Through December 31, 2006, we had spent $70.7 million on this project and had drawn $58.6 million on the construction loan. On July 1, 2006, the interest on this construction loan was reduced from LIBOR plus 2.25% to LIBOR plus 2.0% under the terms of the original loan agreement. Mortgage Debt At December 31, 2006, we had aggregate mortgage indebtedness, excluding our construction loan, of approximately $855.2 million that was secured by 44 of our consolidated hotels with an aggregate book value of approximately $1.0 billion. Our hotel mortgage debt is recourse solely to the specific assets securing the debt, except in the case of fraud, misapplication of funds and other customary recourse carve-out provisions. Loans secured by two hotels provide for lock-box arrangements under certain circumstances. With respect to these loans, we are permitted to retain 115% of budgeted hotel operating expenses, but the remaining revenues would become subject to a lock-box arrangement if a specified debt service coverage ratio is not met. These hotels currently exceed the minimum debt service coverage ratio, however, under the terms of the loan agreement, the lock-box provisions remain in place until the loan is repaid. None of these hotels have ever fallen below the debt service coverage ratio. F e l C o r Lodging Trust 33
36 ( C o n t i n u e d ) M D & A Our hotel mortgage debt is non-recourse to us and contains provisions allowing for the substitution of collateral upon satisfaction of certain conditions. Most of our mortgage debt is prepayable, subject to various prepayment, yield maintenance or defeasance obligations. Senior Notes As a result of the strong economy, its impact on the travel and lodging industries, and our lower secured debt levels, Standard & Poor s raised its ratings on our senior debt twice in 2006, from B- to B in January 2006 and then to B+ in October 2006 and Moody s Investor Service raised its ratings from B1 to Ba3. As a result of the Moody s upgrade, effective April 3, 2006, the interest rate applicable to $300 million of our senior debt maturing in 2011 decreased from 9.0% to 8.5%, reducing annualized interest expense by $1.5 million. If the credit rating on our senior debt is downgraded by Moody s to B1 and Standard & Poor s rating remains below BB-, the interest rate on this debt will again increase to 9%. Our publicly-traded senior notes require that we satisfy total leverage, secured leverage and interest coverage tests in order to: incur additional indebtedness except to refinance maturing debt with replacement debt, as defined under our indentures; pay dividends in excess of the minimum dividend required to meet the REIT qualification test; repurchase capital stock; or merge. As of the date of this filing, we have satisfied all such tests. Under the terms of certain of our indentures, we are prohibited from repurchasing any of our capital stock, whether common or preferred, subject to certain exceptions, so long as our debt-to-ebitda ratio, as defined in the indentures, exceeds 4.85 to 1. Debt, as defined in the indentures, approximates our consolidated debt. EBITDA is defined in the indentures as consolidated GAAP net income, adjusted for minority interest in FelCor LP, actual cash distributions by unconsolidated entities, gains or losses from asset sales, dividends on preferred stock and extraordinary gains and losses (as defined at the date of the indentures), plus interest expense, income taxes, depreciation expense, amortization expense and other non-cash items. Although our current debt-to-editda ratio is below 4.85 to 1, a decline in our EBITDA, as a result of asset sales, adverse economic developments or an increase in our debt, could make us subject to this limitation. In addition, if we were unable to continue to satisfy the incurrence test under the indentures governing our senior unsecured notes, we may be prohibited from, among other things, incurring any additional indebtedness, except under certain specific exceptions, or paying dividends on our preferred or common stock, except to the extent necessary to satisfy the REIT qualification requirement that we distribute currently at least 90% of our taxable income. We currently anticipate that we will meet our financial covenant and incurrence tests based on current RevPAR expectations. For 2007, we currently anticipate that our full year 2007 portfolio RevPAR will be approximately 6.5% to 7.5% above the prior year. During 2006, our pro rata share of capital expenditures for our consolidated and unconsolidated hotels was $178.9 million Annual Report
37 ( C o n t i n u e d ) M D & A The following table details our debt outstanding at December 31, 2006 and 2005: (in thousands) Balance Outstanding Encumbered Interest Rate at maturity December 31, hotels December 31, 2006 Date Promissory note $ $ 650 Line of credit (a) none L January 2009 Senior term notes 123,358 Senior term notes none 8.50 June , ,660 Term loan 225,000 Senior term notes 290,000 Senior term notes none L December ,000 Total line of credit and senior debt (d) , ,668 Mortgage debt (b) 12 hotels L November ,000 Mortgage debt 8 hotels 6.56 July , ,282 Mortgage debt 117,913 Mortgage debt 7 hotels 7.32 March , ,455 Mortgage debt 41,912 Mortgage debt 8 hotels 8.70 May , ,604 Mortgage debt 6 hotels 8.73 May , ,374 Mortgage debt 1 hotel L August ,500 15,500 Mortgage debt 1 hotel 5.81 July ,861 10,457 Other 1 hotel 9.17 August ,452 5,204 Construction loan (c) L October ,597 8,911 Total mortgage debt (d) 44 hotels , ,612 Total (d) 7.62% $ 1,369,153 $ 1,675,280 (a) We have a borrowing capacity of $125 million on our line of credit. The interest on this line can range from 175 to 225 basis points over LIBOR based on our leverage ratio as defined in our line of credit agreement. (b) This debt has three, one-year extension options. (c) We have a recourse construction loan facility for the development of a 184-unit condominium project in Myrtle Beach, South Carolina. The interest on this facility is being capitalized as part of the cost of the project. We have pre sold approximately 98% of these condominiums and expect to start repaying the construction loan as the units sales are finalized, beginning in the second quarter of (d) Interest rates are calculated based on the weighted average outstanding debt at December 31, C o n t r a c t u a l O b l i g a t i o n s We have obligations and commitments to make certain future payments under debt agreements and various contracts. The following schedule details these obligations at December 31, 2006: (in thousands) Less Than After Total 1 Year 1-3 Years 4-5 Years 5 Years Debt (a) $ 1,744,715 $ 173,360 $ 592,046 $ 879,377 $ 99,932 Operating leases 170,407 22,449 28,747 25,096 94,115 Purchase obligations 152, ,160 Total contractual obligations $ 2,067,282 $ 347,969 $ 620,793 $ 904,473 $ 194,047 (a) Our long-term debt consists of both secured and unsecured debt and includes both principal and interest. Interest expense for variable rate debt was calculated using the interest rate at December 31, F e l C o r Lodging Trust 35
38 ( C o n t i n u e d ) M D & A O f f - B a l a n c e S h e e t A r r a n g e m e n t s At December 31, 2006, we had unconsolidated 50% investments in ventures that own an aggregate of 19 hotels (referred to as hotel joint ventures), and we had unconsolidated 50% investments in ventures that operate four of those 19 hotels (referred to as operating joint ventures). We own 100% of the lessees operating two hotels owned by the hotel joint ventures, approximately 51% of the lessees operating 13 hotels owned by the hotel joint ventures and one hotel joint venture is operated without a lease. We also owned a 50% interest in entities that provide condominium management services and develop condominiums in Myrtle Beach, South Carolina. None of our directors, officers or employees owns any interest in any of these joint ventures or entities. The hotel joint ventures had $197.5 million of non-recourse mortgage debt relating to the 19 hotel, of which our prorata portion was $98.7 million. This debt is not reflected as a liability on our consolidated balance sheet. Our liabilities with regard to non-recourse debt and the liabilities of our subsidiaries that are members or partners in joint ventures are generally limited to the guarantee of the borrowing entity s obligations to pay for the lender s losses caused by misconduct, fraud or misappropriation of funds by the venture and other typical exceptions from the non-recourse provisions in the mortgages, such as for environmental liabilities. We have recorded equity in income (loss) of unconsolidated entities of $11.5 million; $10.2 million; and $17.1 million (including a gain of $11 million related to the development and sale of condominiums) for the years ended December 31, 2006, 2005 and 2004, respectively, and received distributions of $9.3 million (of which $3.6 million was provided from operations), of $7.6 million (of which $1.1 million was provided from operations), and $22.8 million (of which $11.9 million was provided by operations) for the years 2006, 2005 and 2004, respectively. The principal source of income for our hotel joint ventures is percentage lease revenue from the operating lessees. We own 51% of the operating lessees for 13 of the hotel joint ventures. Capital expenditures on the hotels owned by our hotel joint ventures are generally paid from their capital reserve account, which is funded from the income from operations of these ventures. However, if a venture has insufficient cash flow to meet operating expenses or make necessary capital improvements, the venture may make a capital call upon the venture members or partners to fund such necessary improvements. It is possible that, in the event of a capital call, the other joint venture member or partner may be unwilling or unable to make the necessary capital contributions. Under such circumstances, we may elect to make the other party s contribution as a loan to the venture or as an additional capital contribution by us. Under certain circumstances, a capital contribution by us may increase our equity investment to greater than 50% and may require that we consolidate the venture, including all of its assets and liabilities, into our consolidated financial statements. With respect to those ventures that are partnerships, the hotels owned by these ventures could perform below expectations and result in the insolvency of the ventures and the acceleration of their debts, unless the members or partners provide additional capital. In some ventures, the members or partners may be required to make additional capital contributions or have their interest in the venture be reduced or offset for the benefit of any party making the required investment on their behalf. We may be faced with the choice of losing our investment in a venture or investing additional capital under circumstances that do not assure a return on that investment. I n f l a t i o n Operators of hotels, in general, possess the ability to adjust room rates daily to reflect the effects of inflation. Competitive pressures may, however, require us to reduce room rates in the near term and may limit our ability to raise room rates in the future. We are also subject to the risk that inflation will cause increases in hotel operating expenses disproportionately to revenues Annual Report
39 ( C o n t i n u e d ) M D & A S e a s o n a l i t y The lodging business is seasonal in nature. Generally, hotel revenues are greater in the second and third calendar quarters than in the first and fourth calendar quarters, although this may not be true for hotels in major tourist destinations. Revenues for hotels in tourist areas generally are substantially greater during tourist season than other times of the year. Seasonal variations in revenue at our hotels can be expected to cause quarterly fluctuations in our revenues. Quarterly earnings also may be adversely affected by events beyond our control, such as extreme weather conditions, economic factors and other considerations affecting travel. To the extent that cash flow from operations is insufficient during any quarter, due to temporary or seasonal fluctuations in revenues, we may utilize cash on hand or borrowings to satisfy our obligations or make distributions to our equity holders. C r i t i c a l A c c o u n t i n g P o l i c i e s a n d E s t i m a t e s Our discussion and analysis of our financial condition and results of operations is based upon our consolidated financial statements, which have been prepared in accordance with GAAP. The preparation of these financial statements requires us to make estimates and judgments that affect the reported amounts of assets, liabilities, revenues and expenses, and related disclosure of contingent assets and liabilities. On an on-going basis, we evaluate our estimates, including those related to bad debts, the carrying value of investments in hotels, litigation, and other contingencies. We base our estimates on historical experience and on various other assumptions that are believed to be reasonable under the circumstances, the results of which form the basis for making judgments about the carrying values of assets and liabilities that are not readily apparent from other sources. Actual results may differ from these estimates under different assumptions or conditions. We believe the following critical accounting policies affect the most significant judgments and estimates used in the preparation of our consolidated financial statements. We are required by GAAP to record an impairment charge when we believe that an investment in one or more of our hotels held for investment has been impaired, such that future undiscounted cash flows would not recover the book basis, or net book value, of the investment. We test for impairment when certain events occur, including one or more of the following: projected cash flows are significantly less than recent historical cash flows; significant changes in legal factors or actions by a regulator that could affect the value of our hotels; events that could cause changes or uncertainty in travel patterns; and a current expectation that, more likely than not, a hotel will be sold or otherwise disposed of significantly before the end of its previously estimated useful life. Over the past three years we identified 36 non-strategic hotels that we expected to sell significantly before the end of their previously estimated useful life. The shorter probable holding periods related to our decision to sell these hotels was the primary factor that led to impairment charges on these hotels. As these hotels are sold, we may recognize additional losses or gains on sale. In the evaluation of impairment of our hotels, and in establishing impairment charges, we made many assumptions and estimates on a hotel by hotel basis, which included the following: Annual cash flow growth rates for revenues and expenses; Holding periods; Expected remaining useful lives of assets; Estimates in fair values taking into consideration future cash flows, capitalization rates, discount rates and comparable selling prices; and Future capital expenditures. F e l C o r Lodging Trust 37
40 ( C o n t i n u e d ) M D & A Changes in these estimates, future adverse changes in market conditions or poor operating results of underlying hotels could result in losses or an inability to recover the carrying value of the hotels that may not be reflected in the hotel s carrying value, thereby requiring impairment charges in the future. At December 31, 2006, all hotels on which we have recorded impairment charges have been sold or are classified as held for sale at that date. At December 31, 2006, we had 11 hotels that were classified as held for sale and were carried at the lower of historical net book value or fair value less costs to sell. We made estimates of fair values of these hotels based on pending contracts, offers received, cash flows, capitalization rates and comparable selling prices. We also made estimates of selling costs based on commission rates and other selling costs expected to be incurred. We make estimates with respect to contingent liabilities for losses covered by insurance in accordance with Financial Accounting Standard 5, Accounting for Contingencies. We record liabilities for self insured losses under our insurance programs when it becomes probable that an asset has been impaired or a liability has been incurred at the date of our financial statements and the amount of the loss can be reasonably estimated. We are self-insured for the first $250,000, per occurrence, of our general liability claims with regard to 67 of our hotels. We review the adequacy of our reserves for our self-insured claims on a regular basis. Our reserves are intended to cover the estimated ultimate uninsured liability for losses with respect to reported and unreported claims incurred at the end of each accounting period. These reserves represent estimates at a given date, generally utilizing projections based on claims, historical settlement of claims and estimates of future costs to settle claims. Estimates are also required since there may be delays in reporting. Because establishment of insurance reserves is an inherently uncertain process involving estimates, currently established reserves may not be sufficient. If our insurance reserves of $4.3 million, at December 31, 2006, for general liability losses are insufficient, we will record an additional expense in future periods. Property and catastrophic losses are event-driven losses and, as such, until a loss occurs and the amount of loss can be reasonably estimated, no liability is recorded. We had recorded no contingent liabilities with regard to property or catastrophic losses at December 31, Our Taxable REIT Subsidiaries, or TRSs, have cumulative potential future tax deductions totaling $343.3 million. The net deferred income tax asset associated with these potential future tax deductions was $130.5 million. We have recorded a valuation allowance equal to 100% of our $130.5 million deferred tax asset related to our TRSs, because of the uncertainty of realizing the benefit of the deferred tax asset. SFAS 109, Accounting for Income Taxes, establishes financial accounting and reporting standards for the effect of income taxes. The objectives of accounting for income taxes are to recognize the amount of taxes payable or refundable for the current year and deferred tax liabilities and assets for the future tax consequences of events that have been recognized in an entity s financial statements or tax returns. In accordance with SFAS 109, we have considered future taxable income and ongoing prudent and feasible tax planning strategies in assessing the need for a valuation allowance. In the event we were to determine that we would be able to realize all or a portion of our deferred tax assets in the future, an adjustment to the deferred tax asset would increase operating income in the period such determination was made. R e c e n t A c c o u n t i n g A n n o u n c e m e n t s In July 2006, the FASB issued FASB Interpretation Number 48, Accounting for Uncertainty in Income Taxes, an Interpretation of FASB Statement No. 109 ( FIN 48 ). FIN 48 prescribes a recognition threshold and measurement attribute for the financial statement recognition and measurement of a tax position taken in a tax return. The Company must determine whether it is more-likely-thannot that a tax position will be sustained upon examination, including resolution of any related appeals or litigation processes, based on the technical merits of the position. Once it is determined that a position meets the more-likely-than-not recognition threshold, the position is measured to determine the amount of benefit to recognize in the financial statements. FIN 48 applies to all tax positions Annual Report
41 ( C o n t i n u e d ) M D & A related to income taxes subject to FASB Statement No. 109, Accounting for Income Taxes. The interpretation clearly scopes out income tax positions related to FASB Statement No. 5, Accounting for Contingencies. We will adopt the provisions of this statement beginning in the first quarter of We do not expect the cumulative effect of applying the provisions of FIN 48, if any, to be material. In September 2006, the FASB issued Statement No. 157, Fair Value Measurements ( SFAS No. 157 ). SFAS No. 157 provides guidance for using fair value to measure assets and liabilities. This statement clarifies the principle that fair value should be based on the assumptions that market participants would use when pricing the asset or liability. SFAS No. 157 establishes a fair value hierarchy, giving the highest priority to quoted prices in active markets and the lowest priority to unobservable data. SFAS No. 157 applies whenever other standards require assets or liabilities to be measured at fair value. This statement is effective in fiscal years beginning after November 15, We believe that the adoption of this standard on January 1, 2008 will not have a material effect on our consolidated financial statements. D i s c l o s u r e R e g a r d i n g F o r w a r d L o o k i n g S t a t e m e n t s This 2006 annual report to stockholders includes forward-looking statements that involve a number of risks and uncertainties. Forward-looking statements can be identified by the use of forward-looking terminology, such as believes, expects, anticipates, may, will, should, seeks, or other variations of these terms (including their use in the negative), or by discussions of strategies, plans or intentions. A number of factors could cause actual results to differ materially from those anticipated by these forward-looking statements. Among these factors are: general economic and lodging industry conditions, including the anticipated continuation of economic growth, the realization of anticipated job growth, the impact of the United States military involvement in the Middle East and elsewhere, future acts of terrorism, the threat or outbreak of a pandemic disease affecting the travel industry, the impact on the travel industry of high fuel costs and increased security precautions, and the impact that the bankruptcy of additional major air carriers may have on our revenues and receivables; our overall debt levels and our ability to obtain new financing and service debt; our inability to retain earnings; our liquidity and capital expenditures; our growth strategy and acquisition activities; our inability to sell the hotels being marketed for sale at anticipated prices; and competitive conditions in the lodging industry. Certain of these risks and uncertainties are described in greater detail under Risk Factors in Item 1A of our Annual Report on Form 10-K, or in our other filings with the Securities and Exchange Commission. In addition, these forward-looking statements are necessarily dependent upon assumptions and estimates that may prove to be incorrect. Accordingly, while we believe that the plans, intentions and expectations reflected in these forward-looking statements are reasonable, we cannot assure you that these plans, intentions or expectations will be achieved. The forward-looking statements included in this report, and all subsequent written and oral forward-looking statements attributable to us or persons acting on our behalf, are expressly qualified in their entirety by the risk factors and cautionary statements discussed in our filings under the Securities Act of 1933 and the Securities Exchange Act of We undertake no obligation to update any forward-looking statements to reflect future events or circumstances. F e l C o r Lodging Trust 39
42 ( C o n t i n u e d ) M D & A The prospective financial information, related to hotel sale proceeds and guidance, included in this 2006 annual report to stockholders has been prepared by, and is the responsibility of, our management. PricewaterhouseCoopers LLP has neither examined nor compiled the accompanying prospective financial information and, accordingly, PricewaterhouseCoopers LLP does not express an opinion or any other form of assurance with respect thereto. The PricewaterhouseCoopers LLP report included in this 2006 annual report to stockholders relates to our historical financial information. It does not extend to the prospective financial information and should not be read to do so. Q u a n t i t a t i v e a n d Q u a l i t a t i v e D i s c l o s u r e s A b o u t M a r k e t R i s k At December 31, 2006, approximately 61% of our consolidated debt had fixed interest rates. In some cases, market rates of interest are below the rates we are obligated to pay on our fixed-rate debt. The following tables provide information about our financial instruments that are sensitive to changes in interest rates, including interest rate swaps and debt obligations. For debt obligations, the tables present scheduled maturities and weighted average interest rates, by maturity dates. For interest rate swaps, the tables present the notional amount and weighted average interest rate, by contractual maturity date. The fair value of our fixed rate debt indicates the estimated principal amount of debt having the same debt service requirements that could have been borrowed at the date presented, at then current market interest rates. The fair value of our fixed to variable interest rate swaps indicates the estimated amount that would have been received or paid by us had the swaps been terminated at the date presented. E x p e c t e d M a t u r i t y D a t e at December 31, 2006 (dollars in thousands) Fair Thereafter Total value L i a b i l i t i e s Fixed rate: Debt $ 12,739 $ 13,733 $ 142,240 $ 274,535 $ 303,030 $ 84,868 $ 831,145 $ 887,575 Average interest rate 7.98% 7.98% 7.26% 8.70% 8.49% 6.53% 8.13% Floating rate: Debt 58, , , , ,097 Average interest rate (a) 7.32% 6.14% 7.10% 6.65% Total debt $ 71,336 $ 279,233 $ 142,240 $ 274,535 $ 518,030 $ 84,868 $ 1,370,242 Average interest rate 7.44% 6.23% 7.26% 8.70% 7.91% 6.53% 7.55% Net discount (1,089) Total debt $ 1,369,153 (a) The average floating rate of interest represents the implied forward rates in the yield curve at December 31, Annual Report
43 ( C o n t i n u e d ) M D & A E x p e c t e d M a t u r i t y D a t e at December 31, 2005 (dollars in thousands) Thereafter Total Fair Value L i a b i l i t i e s Fixed rate: Debt $ 13,726 $ 149,737 $ 15,695 $ 176,560 $ 281,843 $ 382,727 $ 1,020,288 $ 987,451 Average interest rate 7.95% 7.68% 7.96% 7.37% 8.70% 8.47% 8.21% Floating rate: Debt 342,913 24, , , ,974 Average interest rate (a) 6.09% 6.66% 8.47% 7.16% Total debt $ 356,639 $ 149,737 $ 40,106 $ 176,560 $ 281,843 $ 673,377 $ 1,678,262 Average interest rate 6.16% 7.68% 7.17% 7.37% 8.70% 8.47% 7.80% Net discount (2,982) Total debt $ 1,675,280 I n t e r e s t r a t e s w a p s ( f l o a t i n g t o f i x e d ) ( b ) Notional amount 100, , ,222 Pay rate 7.80% 7.80% Receive rate (a) The average floating rate of interest represents the implied forward rates in the yield curve at December 31, (b) The interest rate swaps in effect during 2005 increased our interest expense by a net $0.3 million during The interest rate swaps in effect at December 31, 2005, mature in 2007 but are matched with debt maturing in Swap contracts, such as described above, contain a credit risk, in that the counterparties may be unable to fulfill the terms of the agreement. We minimize that risk by evaluating the creditworthiness of our counterparties, who are limited to major banks and financial institutions, and we do not anticipate nonperformance by the counterparties. F e l C o r Lodging Trust 41
44 M A N A G E M E N T S R E P O R T o n I n t e r n a l C o n t r o l o v e r F i n a n c i a l R e p o r t i n g Our management is responsible for establishing and maintaining adequate internal control over financial reporting. A company s internal control over financial reporting is a process designed to provide reasonable assurance regarding the reliability of financial reporting and the preparation of financial statements for external purposes in accordance with generally accepted accounting principles. Our management assessed the effectiveness of our internal control over financial reporting as of December 31, In making this assessment, management used the criteria set forth by the Committee of Sponsoring Organizations of the Treadway Commission (COSO) in Internal Control-Integrated Framework. Based on our assessment, we have concluded that, as of December 31, 2006, our internal control over financial reporting is effective, based on those criteria. Our management s assessment of the effectiveness of our internal control over financial reporting as of December 31, 2006, has been audited by PricewaterhouseCoopers LLP, an independent registered public accounting firm as stated in their report, which appears on page 43 of this 2006 annual report to stockholders Annual Report
45 r e p o r t o f I N D E P E N D E N T R E G I S T E R E D P U B L I C A C C O U N T I N G F I R M T o t h e B o a r d o f D i r e c t o r s a n d S t o c k h o l d e r s o f F e l C o r L o d g i n g T r u s t I n c o r p o r a t e d : We have completed integrated audits of FelCor Lodging Trust Incorporated s consolidated financial statements and of its internal control over financial reporting as of December 31, 2006, in accordance with the standards of the Public Company Accounting Oversight Board (United States). Our opinions, based on our audits, are presented below. C o n s o l i d a t e d f i n a n c i a l s t a t e m e n t s In our opinion, the consolidated balance sheets and related consolidated statements of operations, comprehensive income (loss), stockholders equity and cash flows present fairly, in all material respects, the financial position of FelCor Lodging Trust Incorporated and its subsidiaries, or the Company, at December 31, 2006 and 2005, and the results of their operations and their cash flows for each of the three years in the period ended December 31, 2006 in conformity with accounting principles generally accepted in the United States of America. These financial statements are the responsibility of the Company s management. Our responsibility is to express an opinion on these financial statements based on our audits. We conducted our audits of these statements in accordance with the standards of the Public Company Accounting Oversight Board (United States). Those standards require that we plan and perform the audit to obtain reasonable assurance about whether the financial statements are free of material misstatement. An audit of financial statements includes examining, on a test basis, evidence supporting the amounts and disclosures in the financial statements, assessing the accounting principles used and significant estimates made by management, and evaluating the overall financial statement presentation. We believe that our audits provide a reasonable basis for our opinion. I n t e r n a l c o n t r o l o v e r f i n a n c i a l r e p o r t i n g Also, in our opinion, management s assessment, included in Management s Report on Internal Control Over Financial Reporting appearing on page 42, that the Company maintained effective internal control over financial reporting as of December 31, 2006 based on criteria established in Internal Control Integrated Framework issued by the Committee of Sponsoring Organizations of the Treadway Commission (COSO), is fairly stated, in all material respects, based on those criteria. Furthermore, in our opinion, the Company maintained, in all material respects, effective internal control over financial reporting as of December 31, 2006, based on criteria established in Internal Control Integrated Framework issued by the COSO. The Company s management is responsible for maintaining effective internal control over financial reporting and for its assessment of the effectiveness of internal control over financial reporting. Our responsibility is to express opinions on management s assessment and on the effectiveness of the Company s internal control over financial reporting based on our audit. We conducted our audit of internal control over financial reporting in accordance with the standards of the Public Company Accounting Oversight Board (United States). Those standards require that we plan and perform the audit to obtain reasonable assurance about whether effective internal control over financial reporting was maintained in all material respects. An audit of internal control over financial reporting includes obtaining an understanding of internal control over financial reporting, evaluating management s assessment, testing and evaluating the design and operating effectiveness of internal control, and performing such other procedures as we consider necessary in the circumstances. We believe that our audit provides a reasonable basis for our opinions. F e l C o r Lodging Trust 43
46 A company s internal control over financial reporting is a process designed to provide reasonable assurance regarding the reliability of financial reporting and the preparation of financial statements for external purposes in accordance with generally accepted accounting principles. A company s internal control over financial reporting includes those policies and procedures that (i) pertain to the maintenance of records that, in reasonable detail, accurately and fairly reflect the transactions and dispositions of the assets of the company; (ii) provide reasonable assurance that transactions are recorded as necessary to permit preparation of financial statements in accordance with generally accepted accounting principles, and that receipts and expenditures of the company are being made only in accordance with authorizations of management and directors of the company; and (iii) provide reasonable assurance regarding prevention or timely detection of unauthorized acquisition, use, or disposition of the company s assets that could have a material effect on the financial statements. Because of its inherent limitations, internal control over financial reporting may not prevent or detect misstatements. Also, projections of any evaluation of effectiveness to future periods are subject to the risk that controls may become inadequate because of changes in conditions, or that the degree of compliance with the policies or procedures may deteriorate. P r i c e w a t e r h o u s e C o o p e r s L L P Dallas, Texas March 1, Annual Report
47 C O N S O L I D A T E D B A L A N C E S H E E T S (in thousands) A S S E T S December 31, Investment in hotels, net of accumulated depreciation of $612,286 in 2006 and $1,019,123 in 2005 $ 2,044,285 $ 2,584,379 Investment in unconsolidated entities 111, ,262 Hotels held for sale 133,801 Cash and cash equivalents 124,179 94,564 Restricted cash 22,753 18,298 Accounts receivable, net of allowance for doubtful accounts of $962 in 2006 and $2,203 in ,395 54,815 Deferred expenses, net of accumulated amortization of $8,841 in 2006 and $12,150 in ,480 12,423 Condominium development project 70,661 16,051 Other assets 32,979 30,471 Total assets $ 2,583,249 $ 2,920,263 L I A B I L I T I E S A N D S T O C K H O L D E R S E Q U I T Y Debt, net of discount of $1,089 in 2006 and $2,982 in 2005 $ 1,369,153 $ 1,675,280 Distributions payable 24,078 8,596 Accrued expenses and other liabilities 139, ,187 Total liabilities 1,532,508 1,823,063 Commitments and contingencies Minority interest in FelCor LP 1,355 and 2,763 units issued and outstanding at December 31, 2006 and 2005, respectively 11,638 25,393 Minority interest in other partnerships 28,172 40,014 Stockholders equity: Preferred stock, $.01 par value, 20,000 shares authorized: Series A Cumulative Convertible Preferred Stock, 12,880 shares, liquidation value of $322,011 issued and outstanding at December 31, 2006 and December 31, , ,362 Series C Cumulative Redeemable Preferred Stock, 68 shares, liquidation value of $169,950 issued and outstanding at December 31, , ,412 Common stock, $.01 par value, 200,000 shares authorized and 69,438 and 69,440 shares issued, including shares in treasury, at December 31, 2006 and 2005, respectively Additional paid-in capital 2,066,694 2,081,869 Accumulated other comprehensive income 15,839 19,602 Accumulated deficit (1,409,790) (1,372,720) Less: Common stock in treasury, at cost, of 7,386 and 9,231 shares at December 31, 2006 and 2005, respectively (141,280) (176,426) Total stockholders equity 1,010,931 1,031,793 Total liabilities and stockholders equity $ 2,583,249 $ 2,920,263 The accompanying notes are an integral part of these consolidated financial statements. F e l C o r Lodging Trust 45
48 C O N S O L I D A T E D s t a t e m e n t s o f O P E R A T I O N S (in thousands, except per share data) For the Years Ended December 31, Revenues: Hotel operating revenue $ 990,959 $ 913,149 $ 840,416 Retail space rental and other revenue 79 1,506 2,196 Total revenues 991, , ,612 Expenses: Hotel departmental expenses 319, , ,619 Other property operating costs 270, , ,204 Management and franchise fees 51,237 45,215 42,664 Taxes, insurance and lease expense 112, ,852 92,256 Abandoned projects Corporate expenses 23,308 19,025 17,033 Depreciation 94,579 84,448 78,116 Total operating expenses 871, , ,892 Operating income 119, ,770 86,720 Interest expense, net 110, , ,144 Hurricane loss 6,481 2,125 Charge-off of deferred financing costs 3,562 1,448 6,960 Loss on early extinguishment of debt 12,471 4,037 44,216 Gain on swap termination (1,715) (1,005) Loss before equity in income of unconsolidated entities, minority interests and gain on sale of assets (5,388) (31,864) (101,720) Equity in income from unconsolidated entities 11,537 10,169 17,121 Gain (loss) on sale of assets (92) 469 Minority interests 2,508 4,310 6,223 Income (loss) from continuing operations 8,565 (16,916) (78,376) Discontinued operations 42,480 (234,699) (21,751) Net income (loss) 51,045 (251,615) (100,127) Preferred dividends (38,713) (39,408) (35,130) Issuance costs of redeemed preferred stock (6,522) Net income (loss) applicable to common stockholders $ 12,332 $ (297,545) $ (135,257) Income (loss) per common share data: Basic and diluted: Loss from continuing operations $ (0.50) $ (1.06) $ (1.92) Net income (loss) $ 0.20 $ (5.01) $ (2.29) Weighted average common shares outstanding 60,734 59,436 59,045 Cash dividends declared on common stock $ 0.80 $ 0.15 $ The accompanying notes are an integral part of these consolidated financial statements Annual Report
49 C O N S O L I D A T E D s t a t e m e n t s o f C O M P R E H E N S I V E I N C O M E ( L O S S ) (in thousands) For the Years Ended December 31, Net income (loss) $ 51,045 $ (251,615) $ (100,127) Unrealized holding gains (loss) from interest rate swaps (507) 2, Realized gain from interest rate swaps (1,715) Foreign currency translation adjustment (1,541) 1,748 6,155 Comprehensive income (loss) $ 47,282 $ (247,793) $ (93,825) The accompanying notes are an integral part of these consolidated financial statements. F e l C o r Lodging Trust 47
50 C O N S O L I D A T E D s t a t e m e n t s o f S T O C K H O L D E R S E Q U I T Y (in thousands) Preferred Stock Common Stock Accumulated Other Total Number Number Additional Comprehensive Accumulated Treasury Stockholders of Shares Amount of Shares Amount Paid-In Capital Income Deficit Stock Equity Bal ance at December 31, ,048 $ 318,907 69,429 $ 694 $ 2,095,356 $ 9,478 $ (930,886) $ (197,277) $ 1,296,272 Foreign exchange translation 6,155 6,155 Issuance of Series A preferred stock 6, ,850 (3,850) 156,000 Issuance of stock awards 7 (9,067) 9, Amortization of stock awards 3,179 3,179 Unrealized gain on hedging transaction Conversion of operating partnership units into common shares (1,999) 4,692 2,693 Allocation from minority units 1,109 1,109 Forfeitures of stock awards 461 (461) Dividends declared: $1.95 per Series A preferred share (19,884) (19,884) $2.25 per Series B depositary preferred share (15,246) (15,246) Net loss (100,127) (100,127) Bal ance at December 31, , ,757 69, ,085,189 15,780 (1,066,143) (183,954) 1,330,323 Foreign exchange translation 1,748 1,748 Issuance of Series C preferred stock ,412 (5,492) 163,920 Retirement of Series B preferred stock (68) (169,395) 6,522 (6,522) (169,395) Issuance of stock awards 4 (7,285) 7,022 (263) Amortization of stock awards 3,265 3,265 Unrealized gain on hedging transaction 2,074 2,074 Conversion of operating partnership units into common shares (118) Allocation from minority units (212) (212) Dividends declared: $0.15 per common share (9,032) (9,032) $1.95 per Series A preferred share (25,117) (25,117) $1.125 per Series B depositary preferred share (5,432) (5,432) $1.63 per Series C depositary preferred share (8,859) (8,859) Net loss (251,615) (251,615) Bal ance at December 31, , ,774 69, ,081,869 19,602 (1,372,720) (176,426) 1,031,793 Foreign exchange translation (1,541) (1,541) Issuance of stock awards 19 (6,371) 6, Exercise of stock options (482) 2,670 2,188 Amortization of stock awards 5,169 5,169 Forfeiture of stock awards 579 (866) (287) Repurchase of common shares (818) (818) Common stock exchanged for treasury shares (21) (357) 357 Unrealized loss on hedging transaction (507) (507) Realized gain on hedging transaction (1,715) (1,715) Conversion of operating partnership units into common shares (26,870) 26,870 Allocation from minority units 13,157 13,157 Dividends declared: $0.80 per common share (49,402) (49,402) $1.95 per Series A preferred share (25,117) (25,117) $2.00 per Series C depositary preferred share (13,596) (13,596) Net income 51,045 51,045 Bal ance at December 31, ,948 $ 478,774 69,438 $ 694 $ 2,066,694 $ 15,839 $ (1,409,790) $ (141,280) $ 1,010,931 The accompanying notes are an integral part of these consolidated financial statements Annual Report
51 C O N S O L I D A T E D s t a t e m e n t s o f C A S H F L O W S For the Years Ended December 31, (in thousands) Cash flows from operating activities: Net income (loss) $ 51,045 $ (251,615) $ (100,127) Adjustments to reconcile net income (loss) to net cash provided by operating activities: Depreciation 110, , ,653 Gain on sale of assets (48,802) (12,522) (20,589) Amortization of deferred financing fees 3,351 3,399 4,161 Accretion amortization of debt 1,105 1, Amortization of unearned officers and directors compensation 5,080 2,904 2,945 Equity in income from unconsolidated entities (11,537) (10,169) (17,121) Distributions of income from unconsolidated entities 3,632 1,062 11,932 Charge-off of deferred financing costs 3,643 2,659 6,960 Loss on early extinguishment of debt 13,701 8,641 44,216 Impairment loss hotels 16, ,751 38,289 Minority interests (789) (23,295) (7,375) Changes in assets and liabilities: Accounts receivable 12,571 (6,178) (2,213) Restricted cash-operations (2,687) (6,941) (23,467) Other assets (9,076) (6,057) (957) Accrued expenses and other liabilities (285) 19,141 (26,536) Net cash flow provided by operating activities 147, ,482 33,281 Cash flows provided by (used in) investing activities: Acquisition of hotels (27,759) Improvements and additions to hotels (168,525) (111,664) (95,599) Additions to condominium project (51,200) (11,546) Acquisition of joint venture (1,197) Cash from consolidation of venture 3,204 Proceeds from asset dispositions 346,332 73, ,686 Proceeds received from property damage insurance 7,535 3,131 Decrease in restricted cash-investing 1,008 10,804 8,155 Cash distributions from unconsolidated entities 5,700 6,578 10,899 Capital contributions to unconsolidated entities (250) (1,350) Net cash flow provided by (used in) investing activities 140,600 (28,538) 48,382 Cash flows provided by (used in) financing activities: Proceeds from borrowings 540, , ,802 Repayment of borrowings (716,006) (292,990) (838,891) Payment of debt issuance costs (3,985) (659) (5,517) Decrease in restricted cash-financing 2,825 4,401 Net proceeds from sale of preferred stock 164, ,990 Redemption of preferred stock (169,395) Exercise of stock options 2,188 Distributions paid to other partnerships minority holders (13,167) (4,000) Contribution from minority interest holders 2,519 2,200 3,247 Distributions paid to FelCor LP limited partners (878) (414) Distributions paid to preferred stockholders (38,713) (39,905) (34,757) Distributions paid to common stockholders (33,951) (9,032) Net cash flow used in financing activities (258,674) (107,736) (197,126) Effect of exchange rate changes on cash (11) 46 2,888 Net change in cash and cash equivalents 29,615 (24,746) (112,575) Cash and cash equivalents at beginning of periods 94, , ,885 Cash and cash equivalents at end of periods $ 124,179 $ 94,564 $ 119,310 Supplemental cash flow information Interest paid $ 118,502 $ 132,091 $ 162,324 The accompanying notes are an integral part of these consolidated financial statements. F e l C o r Lodging Trust 49
52 N O T E S N O T E S T O C O N S O L I D A T E D F I N A N C I A L S T A T E M E N T S 1. O r g a n i z a t i o n In 1994, FelCor Lodging Trust Incorporated, or FelCor, went public as a real estate investment trust, or REIT, with six hotels and a market capitalization of $120 million. At December 31, 2006, we held ownership interests in 99 hotels and were the owner of the largest number of Embassy Suites Hotels and independently owned Doubletree-branded hotels in North America. FelCor is the sole general partner of, and the owner of an approximately 98% limited partnership interest in, FelCor Lodging Limited Partnership, or FelCor LP. All of our operations are conducted solely through FelCor LP, or its subsidiaries. At December 31, 2006, we owned a 100% real estate interest in 72 hotels, a 90% or greater interest in entities owning five hotels, a 75% interest in an entity owning one hotel, a 60% interest in an entity owning two hotels, and 50% interests in unconsolidated entities owning 19 hotels. As a result of our ownership interests in the operating lessees of 94 of these hotels, we reflect their operating revenues and expenses in our consolidated statements of operations. The operations of 83 of these consolidated hotels were included in continuing operations at December 31, 2006, and 11 hotels were held for sale and included in discontinued operations. The operating revenues and expenses of the remaining five hotels were reported on the equity method, four hotels were operated by 50% owned lessees and one hotel, in which we had a 50% ownership interest, was operated without a lease. At December 31, 2006, we had an aggregate of 63,407,199 shares and unit outstanding, consisting of 62,052,183 shares of FelCor common stock and 1,355,016 units of FelCor LP limited partnership interest not owned by FelCor. The following table reflects the distribution, by brand, of the 83 hotels included in our consolidated hotel continuing operations at December 31, 2006: Brand hotels Rooms Embassy Suites Hotels 47 12,130 Holiday Inn-branded 17 6,301 Starwood-branded 9 3,217 Doubletree-branded 7 1,471 Hilton-branded Other brands Total hotels 83 The hotels shown in the above table are located in the United States (23 states) and Canada (two hotels), with concentrations in California (14 hotels), Florida (13 hotels) and Texas (11 hotels). Approximately 48% of our hotel room revenues were generated from hotels in these three states during At December 31, 2006, of the 83 consolidated hotels included in continuing operations, (i) subsidiaries of Hilton Hotels Corporation, or Hilton, managed 54, (ii) subsidiaries of InterContinental Hotels Group, or IHG, managed 18, (iii) subsidiaries of Starwood Hotels & Resorts Worldwide Inc., or Starwood, managed nine, and (iv) independent management companies managed two. Certain reclassifications have been made to prior period financial information to conform to the current period s presentation with no effect to previously reported net loss or stockholders equity Annual Report
53 ( C o n t i n u e d ) N O T E S 2. S u m m a r y o f S i g n i f i c a n t A c c o u n t i n g P o l i c i e s Principles of Consolidation Our accompanying consolidated financial statements include the assets, liabilities, revenues and expenses of all majority-owned subsidiaries. Intercompany transactions and balances are eliminated in consolidation. Investments in unconsolidated entities (consisting entirely of 50 percent owned ventures) are accounted for by the equity method. Use of Estimates The preparation of the financial statements in conformity with accounting principles generally accepted in the United States of America, requires that management make estimates and assumptions that affect the amounts reported in the financial statements and accompanying notes. Actual results could differ from those estimates. Investment in Hotels Our hotels are stated at cost and are depreciated using the straight-line method over estimated useful lives of 40 years for buildings, 15 to 20 years for improvements and three to seven years for furniture, fixtures, and equipment. We periodically review the carrying value of each of our hotels to determine if circumstances exist indicating an impairment in the carrying value of the investment in the hotel or modification of depreciation periods. If facts or circumstances support the possibility of impairment of a hotel, we prepare a projection of the undiscounted future cash flows, without interest charges, over the shorter of the hotel s estimated useful life or the expected hold period, and determine if the investment in such hotel is recoverable based on the undiscounted future cash flows. If impairment is indicated, we make an adjustment to reduce carrying value of the hotel to its then fair value. We use recent operating results and current market information to arrive at our estimates of fair value. Maintenance and repairs are expensed and major renewals and improvements are capitalized. Upon the sale or disposition of a fixed asset, the asset and related accumulated depreciation are removed from our accounts and the related gain or loss is included in operations. Acquisition of Hotels Our hotel acquisitions consist almost exclusively of land, building, furniture, fixtures and equipment, and inventory. We allocate the purchase price among these asset classes based upon their respective values determined in accordance with Statement of Financial Accounting Standards, or SFAS, 141, Business Combinations. When we acquire properties, we acquire them for use. The only intangible assets typically acquired consist of miscellaneous operating agreements all of which are of short duration and at market rates. We do not generally acquire any significant in-place leases or other intangible assets (e.g., management agreements, franchise agreements or trademarks) when we acquire hotels. In conjunction with the acquisition of a hotel, we typically enter into new franchise and management agreements with the selected brand owner and manager. Investment in Unconsolidated Entities We own a 50% interest in various real estate ventures in which the partners or members jointly make all material decisions concerning the business affairs and operations. Additionally, we also own a preferred equity interest in one of these real estate ventures. Because we do not control these entities, we carry our investment in unconsolidated entities at cost, plus our equity in net earnings or losses, less distributions received since the date of acquisition and any adjustment for impairment. Our equity in net earnings or losses is adjusted for the straight-line depreciation, over the lower of 40 years or the remaining life of the venture, of the difference between our cost and our proportionate share of the underlying net assets at the date of acquisition. We periodically review our investment in unconsolidated entities for other than temporary declines in fair value. Any decline that is not expected to be recovered in the next 12 months is considered other than temporary and an impairment is recorded as a reduction in the carrying value of the investment. Estimated fair values are based on our projections of cash flows and market capitalization rates. Hotels Held for Sale We consider each individual hotel to be an identifiable component of our business. In accordance with SFAS 144, Accounting for the Impairment or Disposal of Long-Lived Assets, we do not consider hotels as held for sale until it is probable that the sale will be completed within one year. Once a hotel is held for sale the operations related to the hotel are included in discontinued operations. In the last three years we have disposed of 68 non-strategic hotels. We had 11 remaining non-strategic F e l C o r Lodging Trust 51
54 ( C o n t i n u e d ) N O T E S hotels at December 31, 2006, that we intend to sell within the next twelve months. Based on our recent experience in the hospitality real estate market and the current contract and offer activity on these 11 non-strategic hotels, we consider it probable that they will be sold prior to December 31, As such, these hotels have been classified as held for sale as of December 31, We do not depreciate hotel assets that are classified as held for sale. Upon designating a hotel as held for sale, and quarterly thereafter, we review the carrying value of the hotel and, as appropriate, adjust its carrying value to the lesser of depreciated cost or fair value, less cost to sell, in accordance with SFAS 144. Any adjustment in the carrying value of a hotel classified as held for sale is reflected in discontinued operations. We include in discontinued operations the operating results of hotels classified as held for sale or that have been sold. Cash and Cash Equivalents All highly liquid investments with a maturity of three months or less when purchased are considered to be cash equivalents. We place cash deposits at major banks. Our bank account balances may exceed the Federal Depository Insurance Limits of $100,000; however, management believes the credit risk related to these deposits is minimal. Restricted Cash Restricted cash includes reserves for capital expenditures, real estate taxes, and insurance, as well as cash collateral deposits for mortgage debt agreement provisions and capital expenditure obligations on sold hotels. Deferred Expenses Deferred expenses, consisting primarily of loan costs, are recorded at cost. Amortization is computed using a method that approximates the interest method over the maturity of the related debt. Other Assets Other assets consist primarily of hotel operating inventories, prepaid expenses and deposits. Revenue Recognitions Approximately 99.7% to 100.0% of our revenue is comprised of hotel operating revenues, such as room revenue, food and beverage revenue, and revenue from other hotel operating departments (such as telephone, parking and business centers). These revenues are recorded net of any sales or occupancy taxes collected from our guests. All rebates or discounts are recorded, when allowed, as a reduction in revenue, and there are no material contingent obligations with respect to rebates or discounts offered by us. All revenues are recorded on an accrual basis, as earned. Appropriate allowances are made for doubtful accounts and are recorded as a bad debt expense. The remaining 0.1% to 0.3% of our revenue is from retail space rental revenue and other sources. We do not have any time-share arrangements and do not sponsor any frequent guest programs for which we would have any contingent liability. We participate in frequent guest programs sponsored by the brand owners of our hotels and we expense the charges associated with those programs (typically consisting of a percentage of the total guest charges incurred by a participating guest), as incurred. When a guest redeems accumulated frequent guest points at one of our hotels, the hotel bills the sponsor for the services provided in redemption of such points and records revenue in the amount of the charges billed to the sponsor. Associated with the frequent guest programs, we have no loss contingencies or ongoing obligation beyond what is paid to the brand owner at the time of the guest s stay. We recognize revenue from the sale of condominium units using the completed contract method. Foreign Currency Translations Results of operations for our Canadian hotels are maintained in Canadian dollars and translated using the average exchange rates during the period. Assets and liabilities are translated to U.S. dollars using the exchange rate in effect at the balance sheet date. Resulting translation adjustments are reflected in accumulated other comprehensive income and were $15.8 million and $17.4 million as of December 31, 2006 and 2005, respectively. Capitalized Costs We capitalize interest and certain other costs, such as property taxes, land leases, and property insurance and employee costs relating to hotels undergoing major renovations and redevelopments. Such costs capitalized in 2006, 2005, and 2004, were $10.6 million, $8.4 million and $5.6 million, respectively Annual Report
55 ( C o n t i n u e d ) N O T E S Net Income (Loss) Per Common Shares We compute basic earnings per share by dividing net income (loss) available to common stockholders by the weighted average number of common shares outstanding. We compute diluted earnings per share by dividing net income (loss) available to common stockholders by the weighted average number of common shares and equivalents outstanding. Common stock equivalents represent shares issuable upon exercise of stock options and unvested officers restricted stock grants. For all years presented, our Series A Cumulative Preferred Stock, or Series A preferred stock, if converted to common shares, would be antidilutive; accordingly we do not assume conversion of the Series A preferred stock in the computation of diluted earnings per share. Stock Compensations In December 2004, the Financial Accounting Standards Board, or FASB, issued SFAS No. 123(R), Share-Based Payment. This statement replaces SFAS No. 123, Accounting for Stock-Based Compensation and supersedes APB No. 25, Accounting for Stock Issued to Employees. SFAS No. 123(R) requires companies to apply a fair-value-based measurement method in accounting for share-based payment transactions with employees and to record compensation cost for (i) all stock awards granted after the required date of adoption and to (ii) awards modified, repurchased, or cancelled after that date. In addition, we are required to record compensation expense for the unvested portion of previously granted awards that remain outstanding at the date of adoption as such previous awards continue to vest. We adopted SFAS No. 123(R) on January 1, 2006 using the modified prospective application. The adoption of this standard did not have a material impact on our consolidated financial statements. Prior to January 1, 2006, we applied Accounting Principles Board Opinion 25, or APB 25, and related interpretations in accounting for our stock based compensation plans for stock based compensation issued prior to January 1, Had the compensation cost for these stock-based compensation plans been determined in accordance with SFAS No. 123 our net loss from continuing operations and net loss from continuing operations per common share for the years ended December 31, 2005 and 2004, would approximate the pro forma amounts below. (in thousands, except per share data) Loss from continuing operations, as reported $ (16,916) $ (78,376) Add stock based compensation included in the net loss, as reported 2,904 2,945 Less stock based compensation expense that would have been included in the determination of net loss if the fair value method had been applied to all awards (2,914) (3,001) Loss from continuing operations, pro forma $ (16,926) $ (78,432) Basic and diluted net loss from continuing operations per common share: As reported $ (1.06) $ (1.92) Pro forma $ (1.06) $ (1.92) The effects of applying SFAS 123 in this pro forma disclosure are not indicative of future amounts. Derivatives We record derivatives in accordance with SFAS 133, Accounting for Derivative Instruments and Hedging Activities, as amended by SFAS 138, Accounting for Certain Derivative Instruments and Certain Hedging Activities. SFAS 133, as amended, establishes accounting and reporting standards for derivative instruments. Specifically, SFAS 133 requires an entity to recognize all derivatives as either assets or liabilities on the balance sheet and to measure those instruments at fair value. Additionally, the fair value adjustments will affect either stockholders equity or net income, depending on whether the derivative instrument qualifies as a hedge for accounting purposes and the nature of the hedging activity. Segment Information SFAS 131, Disclosures about Segments of an Enterprise and Related Information, requires the disclosure of selected information about operating segments. Based on the guidance provided in the standard, we have determined that our business is conducted in one operating segment. F e l C o r Lodging Trust 53
56 ( C o n t i n u e d ) N O T E S Distributions and Dividends We and FelCor LP resumed paying a common dividend with the fourth quarter 2005 payment of $0.15 per share. In 2006, we declared common dividends of $0.80 per share. Additionally, we have paid regular quarterly dividends on our preferred stock in accordance with our preferred stock dividend requirements. Our ability to make distributions is dependent on our receipt of quarterly distributions from FelCor LP, and FelCor LP s ability to make distributions is dependent upon the results of operations of our hotels. Minority Interests Minority interests in FelCor LP and other consolidated subsidiaries represent the proportionate share of the equity in FelCor LP and other consolidated subsidiaries not owned by us. We allocate income and loss to minority interest based on the weighted average percentage ownership throughout the year. Income Taxes We have elected to be treated as a REIT under Sections 856 to 860 of the Internal Revenue Code. We generally lease our hotels to wholly-owned taxable REIT subsidiaries, or TRSs, that are subject to federal and state income taxes. Through these lessees we record room revenue, food and beverage revenue and other revenue related to the operations of our hotels. We account for income taxes in accordance with the provisions of SFAS 109. Under SFAS 109, we account for income taxes using the asset and liability method under which deferred tax assets and liabilities are recognized for the future tax consequences attributable to differences between the financial statement carrying amounts of existing assets and liabilities and their respective tax bases. 3. I n v e s t m e n t i n H o t e l s Investment in hotels at December 31, 2006 and 2005 consisted of the following: (in thousands) Building and improvements $ 2,058,563 $ 2,710,465 Furniture, fixtures and equipment 308, ,330 Land 203, ,074 Construction in progress 85,379 34,633 2,656,571 3,603,502 Accumulated depreciation (612,286) (1,019,123) $ 2,044,285 $ 2,584,379 In 2006, we wrote off fully depreciated furniture, fixtures and equipment aggregating $264.6 million. Discussions of hotel dispositions are included in our Discontinued Operations footnote. We invested $169 million and $112 million in additions and improvements to our consolidated hotels during the years ended December 31, 2006 and 2005, respectively. 4. I m p a i r m e n t C h a r g e s Our hotels are comprised of operations and cash flows that can clearly be distinguished, operationally and for financial reporting purposes, from the remainder of our operations. Accordingly, we consider our hotels to be components as defined by SFAS 144 for purposes of determining impairment charges and reporting discontinued operations. A hotel held for investment is tested for impairment whenever changes in circumstances indicate its carrying value may not be recoverable. The test is conducted using the undiscounted cash flows for the shorter of the estimated remaining holding periods or Annual Report
57 ( C o n t i n u e d ) N O T E S the useful life of the hotel. When testing for recoverability of hotels held for investment, we use projected cash flows over the expected hold period. Those hotels held for investment that fail the impairment test described in SFAS 144 were written down to their then current estimated fair value, before any selling expenses. These hotels continue to be depreciated over their remaining useful lives. Hotels held for sale are tested for impairment each reporting period and are recorded at the lower of their carrying amounts or fair value less costs to sell. These hotels are not depreciated after they have been designated as held for sale. When determining fair value for purposes of determining impairment we use a combination of historical and projected cash flows and other available market information, such as recent sales prices for similar assets in specific markets. The cash flows used for determining fair values are discounted using a reasonable capitalization rate, or as earlier noted based on the local market conditions using recent sales of similar assets. In some cases we are able to establish fair value based on credible offers received from prospective buyers. In 2006, we recorded impairment charges of $16.5 million under the provisions of SFAS 144. Of the 2006 charges, $9.3 million were related to our decision to designate seven additional hotels held for investment as non-strategic, $5.9 million related to a change in fair value estimates of held for investment hotels previously designated as non-strategic, and $1.3 million related to charges necessary to record two non- strategic hotels as of December 31, 2006 as held for sale at the lower of their carrying amount or fair value less costs to sell. In February 2007, we sold two non-strategic hotels for gross proceeds of $42.7 million. In 2005, we recorded impairment charges, under the provisions of SFAS 144, of $266.8 million, all of which was included in discontinued operations at December 31, The 2005 charges primarily related to our decision to designate as non-strategic and sell 28 additional hotels, in connection with the negotiation of the amendment to our IHG management agreements. Under the management agreements entered into with IHG in 2001 and amended in 2004, we were obligated to reinvest the net proceeds from the sale of IHG-managed hotels in other IHG-managed hotels or pay substantial liquidated damages to IHG. This potential exposure to liquidated damages made it impractical to sell IHG-managed hotels. In January 2006, we executed an agreement modifying our management agreements covering our hotels managed by IHG. This agreement eliminated any potential liquidated damages or reinvestment requirement with respect to hotels previously sold, certain IHG-managed hotels identified for sale and one Crowne Plaza hotel to be converted to another brand. We also recorded impairment charges with respect to 11 hotels previously designated as non-strategic principally because of revised estimates of fair value resulting from changes in the market and sales offers. In January 2006, we sold eight non-strategic hotels for gross proceeds of approximately $160 million. In 2004, we recorded impairment charges, under the provisions of SFAS 144, of $38.3 million, all of which was included in discontinued operations at December 31, The 2004 charges were related to 17 hotels. With respect to one hotel, we entered into an agreement that would permit the option holder to purchase the hotel for substantially less than its carrying value. The remaining hotels had revised estimates of fair value or reduced estimated holding periods. We may be subject to additional impairment charges in the event that operating results of individual hotels are materially different from our forecasts, the economy and lodging industry weaken, or if we shorten our contemplated holding period for certain of our hotels. Of the 51 hotels on which we recorded impairment in 2006, 2005 and 2004, 45 have been sold. 5. D i s c o n t i n u e d O p e r a t i o n s The results of operations of the 31 hotels disposed of in 2006, 19 hotels disposed of in 2005 and 18 hotels disposed of in 2004, and 11 hotels held for sale at December 31, 2006 are presented in discontinued operations for the periods presented. F e l C o r Lodging Trust 55
58 ( C o n t i n u e d ) N O T E S Results of operations for the 79 hotels included in discontinued operations are as follows: (in thousands) Year Ended December 31, Hotel operating revenue $ 204,494 $ 343,492 $ 418,271 Operating expenses (200,958) (593,211) (448,297) Operating income (loss) 3,536 (249,719) (30,026) Direct interest costs, net (1,206) (10,203) (13,466) Loss on the early extinguishment of debt (1,311) (5,815) Gain on sale, net of tax 43,180 12,053 20,589 Minority interest (1,719) 18,985 1,152 Income (loss) from discontinued operations $ 42,480 $ (234,699) $ (21,751) Impairment losses of $16.5 million, $266.8 million and $38.3 million are included in the operating expenses from discontinued operations for the years ending December 31, 2006, 2005 and 2004, respectively. In 2006, we sold 31 hotels for gross proceeds of $514.4 million for a net gain of $43.2 million, which is net of approximately $5.7 million in taxes related to the sale of these hotels. In 2005, we sold 11 hotels for gross proceeds of $79.2 million. Additionally, in 2005 we relinquished title to the non-recourse mortgage holder of eight limited service hotels, owned by a consolidated joint venture, in exchange for the extinguishment of $49.2 million of debt. Associated with these eight hotels we recorded $1.3 million of asset disposition costs and $3.3 million gain on early extinguishment of debt. In 2004, we sold 17 hotels for gross proceeds of $157.0 million. We also transferred our interest in a hotel that we leased to the lessor in In conjunction with the termination of this lease we paid the lessor $5 million, which was recorded as asset disposition costs. 6. I n v e s t m e n t i n U n c o n s o l i d a t e d E n t i t i e s We owned 50% interests in joint venture entities that owned 19 hotels at December 31, 2006 and December 31, We also owned a 50% interest in entities that own real estate in Myrtle Beach, South Carolina, provide condominium management services, and lease four hotels. We account for our investments in these unconsolidated entities under the equity method. We do not have any majority-owned subsidiaries that are not consolidated in our financial statements. We make adjustments to our equity in income from unconsolidated entities related to the difference between our basis in investment in unconsolidated entities compared to the historical basis of the assets recorded by the joint ventures Annual Report
59 ( C o n t i n u e d ) N O T E S Summarized combined financial information for 100% of these unconsolidated entities is as follows: (in thousands) December 31, Balance sheet information: Investment in hotels, net of accumulated depreciation $ 260,628 $ 259,645 Total assets $ 297,712 $ 295,065 Debt $ 197,462 $ 203,880 Total liabilities $ 203,659 $ 211,174 Equity $ 94,053 $ 83,891 Debt of our unconsolidated entities at December 31, 2006, consisted entirely of non-recourse mortgage debt. Summarized combined statement of operations information for 100% of our unconsolidated entities is as follows: (in thousands) Total revenues $ 83,766 $ 75,396 $ 67,902 Net income $ 26,764 $ 21,801 $ 33,746 (a) Net income attributable to FelCor $ 13,382 $ 11,348 $ 18,483 Preferred return Depreciation of cost in excess of book value (1,845) (1,695) (1,878) Equity in income from unconsolidated entities $ 11,537 $ 10,169 $ 17,121 (a) Includes $17.5 million from the gain on the sale of residential condominium development in Myrtle Beach, South Carolina, which was realized in Our share of the gain was $8.8 million. We also recorded additional gains of $1.9 million in our equity in income from unconsolidated entities to reflect the differences between our historical basis in the assets sold and the basis recorded by the condominium joint venture. A summary of the components of our investment in unconsolidated entities as of December 31, 2006 and 2005 are as follows: (in thousands) Hotel investments $ 48,641 $ 43,117 Cost in excess of book value of hotel investments 61,253 63,098 Land and condominium investments 3,513 4,270 Hotel lessee investments (1,691) (1,223) $ 111,716 $ 109,262 A summary of the components of our equity in income of unconsolidated entities for the years ended December 31, 2006, 2005, and 2004, are as follows: (in thousands) Hotel investments $ 12,090 $ 10,691 $ 17,673 Hotel lessee operations (553) (522) (552) Equity in income from unconsolidated entities $ 11,537 $ 10,169 $ 17,121 In 2005, we acquired, for $1.2 million, an additional 25% interest in a joint venture owning a single hotel, bringing our interest in this previously unconsolidated venture to 75%. This venture has been included in our consolidated financial statements from the date of acquisition of the remaining interest. F e l C o r Lodging Trust 57
60 ( C o n t i n u e d ) N O T E S 7. D e b t Debt at December 31, 2006 and 2005 consisted of the following: (in thousands) Balance Outstanding Encumbered Interest Rate at maturity December 31, hotels December 31, 2006 Date Promissory note $ $ 650 Line of credit (a) none L January 2009 Senior term notes 123,358 Senior term notes none 8.50 June , ,660 Term loan 225,000 Senior term notes 290,000 Senior term notes none L December ,000 Total line of credit and senior debt (d) , ,668 Mortgage debt (b) 12 hotels L November ,000 Mortgage debt 8 hotels 6.56 July , ,282 Mortgage debt 117,913 Mortgage debt 7 hotels 7.32 March , ,455 Mortgage debt 41,912 Mortgage debt 8 hotels 8.70 May , ,604 Mortgage debt 6 hotels 8.73 May , ,374 Mortgage debt 1 hotel L August ,500 15,500 Mortgage debt 1 hotel 5.81 July ,86 10,457 Other 1 hotel 9.17 August ,452 5,204 Construction loan (c) L October ,597 8,911 Total mortgage debt (d) 44 hotels , ,612 Total (d) 7.62% $ 1,369,153 $ 1,675,280 (a) We have a borrowing capacity of $125 million on our line of credit. The interest on this line can range from 175 to 225 basis points over LIBOR based on our leverage ratio as defined in our line of credit agreement. (b) This debt has three, one-year extension options. (c) We have a recourse construction loan facility for the development of a 184-unit condominium project in Myrtle Beach, South Carolina. The interest on this facility is being capitalized as part of the cost of the project. We have pre sold approximately 98% of these condominiums and expect to start repaying the construction loan as the unit sales are finalized, beginning in the second quarter of (d) Interest rates are calculated based on the weighted average outstanding debt at December 31, We reported interest income of $4.1 million, $4.1 million and $2.8 million for the years ended December 31, 2006, 2005 and 2004, respectively. We capitalized interest of $4.9 million, $1.9 million and $1.5 million, for the years ended December 31, 2006, 2005 and 2004, respectively. In October 2006, FelCor LP sold $215 million of senior floating rate notes in a private offering to qualified institutional buyers. These notes bear interest at LIBOR plus 1.875% and mature in In addition, payment of amounts due under these notes is guaranteed by us and certain of our subsidiaries who also guarantee payment of our line of credit and other senior debt (other than mortgage debt) and payment of these notes is secured by a pledge of limited partnership interest in FelCor Lodging LP. In November 2006, we also completed a $250 million non-recourse mortgage facility secured by 12 hotels at LIBOR plus 0.93% maturing in two years with three one year extensions at our option Annual Report
61 ( C o n t i n u e d ) N O T E S During the fourth quarter of 2006, we redeemed all of our outstanding $290 million senior floating rate notes due 2011 and all of our outstanding $125 million 7 5 /8% senior notes due In addition, we repaid $137 million of outstanding debt secured by mortgages on certain of our hotels. Proceeds from our October 2006 senior note offering and November 2006 mortgage debt facility, together with cash proceeds from hotel sales were used to fund the redemption of senior notes and the repayment of the mortgage debt. In connection with the repayment of our $290 million senior floating rate notes, we unwound the floating to fixed interest rate swaps associated with these notes. Termination of these interest rate swaps resulted in gain of approximately $1.7 million, which was recorded in the fourth quarter The early retirement of certain indebtedness in 2006, resulted in net charges related to debt extinguishment of approximately $15.6 million. As a result of the foregoing refinancing transactions, our annual interest expense will be reduced by approximately $5 million, our weighted average cost of debt will be reduced by approximately 50 basis points and our next significant debt maturity will not be until During 2006, we retired approximately $355.8 million of aggregate debt with proceeds of hotel sales, new debt and cash and we borrowed $49.7 million on our Royale Palms condominium development construction loan. In connection with the early debt retirement, we recorded $17.3 million of expense during In the fourth quarter of 2005, we retired $258 million of mortgage debt related to 25 hotels and entered into a $225 million unsecured term loan. In connection with the early retirement of $258 million of mortgage debt we recorded $15 million expense in the fourth quarter of On June 9, 2004, we redeemed all $175 million in principal amount of our outstanding 7.375% senior notes due The redemption price was $1,018 per $1,000 of the principal amount, plus accrued interest. With the retirement of this debt, we recorded a loss on redemption of $3.2 million and wrote off $0.3 million of debt issue costs. We also recorded a $1 million gain on the unwinding of the interest rate swaps tied to this debt. During 2004, we purchased all $600 million of our 9.5% senior notes due 2008 (which bore interest at 10% as a result of the 2003 downgrade of the credit ratings on our senior notes) through tender offers, redemptions and by purchases in the open market, at an average price of $1, per $1,000 in principal amount. With the retirement of this debt, we recorded a loss on early extinguishment of debt of $41 million of which $38.2 million related to the premium paid in excess of par and $2.8 million related to the charge off of unamortized discount. We also wrote off debt issue costs of $6.5 million. In 2004, we also elected to terminate our then existing line of credit and wrote off debt issue costs of $0.2 million. At December 31, 2006, we had aggregate mortgage indebtedness, of approximately $855.2 million that was secured by 44 of our consolidated hotels with an aggregate book value of approximately $1.0 billion and a $58.6 million construction loan related to our Royale Palms condominium development. Our hotel mortgage debt is recourse solely to the specific assets securing the debt, except in the case of fraud, misapplication of funds and other customary recourse carve-out provisions. Loans secured by two hotels provide for lock-box arrangements under certain circumstances. With respect to these loans, we are permitted to retain 115% of budgeted hotel operating expenses, but the remaining revenues would become subject to a lock-box arrangement if a specified debt service coverage ratio is not met. These hotels currently exceed the minimum debt service coverage ratio, however, under the terms of the loan agreement, the lock-box provisions remain in place until the loan is repaid. Neither of these hotels has ever fallen below the debt service coverage ratio. Our hotel mortgage debt is non-recourse to us and contains provisions allowing for the substitution of collateral upon satisfaction of certain conditions. Most of our mortgage debt is prepayable, subject to various prepayment, yield maintenance or defeasance obligations. F e l C o r Lodging Trust 59
62 ( C o n t i n u e d ) N O T E S Our $125 million line of credit contains certain restrictive covenants, including a leverage ratio, fixed charge coverage ratio, unencumbered leverage ratio and a maximum payout ratio. The interest on our line can range from 175 to 225 basis points over LIBOR, based on our leverage ratio as defined in our line of credit agreement. In addition to financial covenants, our line of credit includes certain other affirmative and negative covenants, including restrictions on our ability to create or acquire wholly-owned subsidiaries; restrictions on the operation/ownership of our hotels; limitations on our ability to lease property or guarantee leases of other persons; limitations on our ability to make restricted payments (such as distributions on common and preferred stock, share repurchases and certain investments); limitations on our ability to merge or consolidate with other persons, to issue stock of our subsidiaries and to sell all or substantially all of our assets; restrictions on our ability to make investments in condominium developments; limitations on our ability to change the nature of our business; limitations on our ability to modify certain instruments, to create liens, to enter into transactions with affiliates; and limitations on our ability to enter into joint ventures. At the date of this filing, we were in compliance with all of these covenants. If operating results fall significantly below our current expectations, we may not be able to meet some or all of these covenants in which case we may be unable to borrow under our line of credit. The breach of any of the covenants and limitations under our line of credit could result in the acceleration of amounts outstanding. Our failure to satisfy any accelerated recourse indebtedness, if in the amount of $10 million or more, could result in the acceleration of our other unsecured recourse indebtedness. We may not be able to refinance or repay our debt in full under those circumstances. Our other borrowings contain affirmative and negative covenants that are generally equal to or less restrictive than our line of credit. Payment of amounts due under our line of credit is guaranteed by us and certain of our subsidiaries who also guarantee payment of our senior debt and payment is secured by a pledge of our limited partnership interest in FelCor LP. At December 31, 2006, we had no borrowings under our line of credit. Our interest rate on our line of credit has decreased from LIBOR plus 2.25% to LIBOR plus 1.75% during 2006 based on our leverage ratio as defined in our line of credit agreement. Future scheduled principal payments on debt obligations at December 31, 2006, are as follows: Year (in thousands) 2007 $ 71, ,233 (a) , , , and thereafter 84,868 1,370,242 Discount accretion over term (1,089) $1,369,153 (a) Includes $250 million of mortgage debt that has three, one-year extension options. 8. D e r i v a t i v e s On the date we enter into a derivative contract, we designate the derivative as a hedge to the exposure to changes in the fair value of a recognized asset or liability or a firm commitment (referred to as a fair value hedge), or the exposure to variable cash flows of a forecasted transaction (referred to as a cash flow hedge). For a fair value hedge, the gain or loss is recognized in earnings in the period of change, together with the offsetting loss or gain on the hedged item attributable to the risk being hedged. The effect of that accounting is to reflect in earnings the extent to which the hedge is not effective in achieving offsetting changes in fair value. For a Annual Report
63 ( C o n t i n u e d ) N O T E S cash flow hedge, the effective portion of the derivative s gain or loss is initially reported as a component of other comprehensive income (outside earnings) and subsequently reclassified into earnings when the forecasted transaction affects earnings. The ineffective portion of the gain or loss is reported in earnings immediately. At December 31, 2006, we did not have any outstanding hedges. We formally document all relationships between hedging instruments and hedged items, as well as our risk-management objective and strategy, relating to our various hedge transactions. This process includes linking all derivatives to specific assets and liabilities on the balance sheet or specific firm commitments. We also formally assess (both at the hedge s inception and on an ongoing basis) whether the derivatives that are used in hedging transactions have been highly effective in offsetting changes in the cash flows or fair values of hedged items and whether those derivatives may be expected to remain highly effective in future periods. When we determine that a derivative is not (or has ceased to be) highly effective as a hedge, we will discontinue hedge accounting, prospectively. In the normal course of business, we are exposed to the effect of interest rate changes. We limit these risks by following established risk management policies and procedures including the use of derivatives. It is our objective to use interest rate hedges to manage our fixed and floating interest rate position and not to engage in speculation on interest rates. We manage interest rate risk based on the varying circumstances of anticipated borrowings, and existing floating and fixed rate debt. We will generally seek to pursue interest rate risk mitigation strategies that will result in the least amount of reported earnings volatility under generally accepted accounting principles, while still meeting strategic economic objectives and maintaining adequate liquidity and flexibility. Instruments that meet these hedging criteria are formally designated as hedges at the inception of the derivative contract. During 2006, we terminated three interest rate swaps with aggregate notional amount of $100 million, maturing in December These interest rate swaps were designated as cash flow hedges, and were marked to market through other comprehensive income. The unrealized net gain on these interest rate swap agreements was approximately $1.7 million when terminated. Upon termination this gain was realized and reclassified from accumulated other comprehensive income to earnings. The interest rate received on these interest rate swaps was 4.25% plus LIBOR and the interest rate paid was 7.80%. These swaps were 100% effective through this termination date. In June 2004, we unwound six interest rate swap agreements, designated as fair value hedges, with an aggregate notional amount of $175 million that were matched with the $175 million in senior unsecured notes due 2004 that we redeemed. A $1 million gain was recorded, offsetting the loss on the redemption of the debt. Also during June 2004, five additional swaps with an aggregate amount of $125 million that were matched to the $125 million senior unsecured notes due 2007 were unwound at a cost of $2.3 million. The $2.3 million was applied to the principal balance of these notes and will be amortized to interest expense over the remaining life of the debt. During July 2004, four interest rate swap agreements with a notional value of $100 million, that were matched to mortgage debt maturing in November 2007, were unwound at a cost of $1.3 million. To determine the fair values of our derivative instruments, we use a variety of methods and assumptions that are based on market conditions and risks existing at each balance sheet date. All methods of assessing fair value result in a general approximation of value, and such value may never actually be realized. The amounts paid or received by us under the terms of the interest rate swap agreements are accrued as interest rates change, and we recognize them as an adjustment to interest expense, which will have a corresponding effect on our future cash flows. Our interest rate swaps reduced interest expense by $1.2 million and $4.1 million during the years ended December 31, 2006 and 2004, respectively, and increased interest expense by $0.3 million during the year ended December 31, To fulfill requirements under certain loans, we purchased interest rate caps with aggregate notional amounts of $337.3 million and $225.7 million as of December 31, 2006 and December 31, 2005, respectively. We also sold interest rate caps on a portion of these notional amounts with identical terms that had aggregate notional amounts of $225.7 million at December 31, The purchased F e l C o r Lodging Trust 61
64 ( C o n t i n u e d ) N O T E S interest rate cap agreements as of December 31, 2006 and the purchased and sold interest rate cap agreements at December 31, 2005 were not designated as hedges. The fair value of both the purchased and sold interest rate caps were insignificant at both December 31, 2006 and 2005 and resulted in no significant net earnings impact. 9. F a i r V a l u e o f F i n a n c i a l I n s t r u m e n t s SFAS 107 requires disclosures about the fair value of all financial instruments, whether or not recognized for financial statement purposes. Disclosures about fair value of financial instruments are based on pertinent information available to management as of December 31, Considerable judgment is necessary to interpret market data and develop estimated fair value. Accordingly, the estimates presented herein are not necessarily indicative of the amounts that we could realize on disposition of the financial instruments. The use of different market assumptions and/or estimation methodologies may have a material effect on the estimated fair value amounts. Our estimates of the fair value of (i) accounts receivable, accounts payable and accrued expenses approximate carrying value due to the relatively short maturity of these instruments; (ii) debt is based upon effective borrowing rates for issuance of debt with similar terms and remaining maturities; and (iii) our interest rate swaps and the hedged debt are recorded at estimates of fair value, which are based on the amount that we estimate we would currently receive upon termination of these instruments at current market rates and with reasonable assumptions about relevant future market conditions. The estimated fair value of our debt was $1.4 billion at December 31, I n c o m e T a x e s We have elected to be taxed as a REIT under the Internal Revenue Code. To qualify as a REIT, we must meet a number of organizational and operational requirements, including a requirement that we distribute at least 90% of our taxable income to our stockholders. We currently intend to adhere to these requirements and maintain our REIT status. As a REIT, we generally will not be subject to corporate level federal income taxes on net income we distribute to our stockholders. If we fail to qualify as a REIT in any taxable year, we will be subject to federal income taxes at regular corporate rates (including any applicable alternative minimum tax) and may not qualify as a REIT for four subsequent taxable years. Even if we qualify for taxation as a REIT, we may be subject to certain state and local taxes on our income and property and to federal income and excise taxes on our undistributed taxable income. In addition, taxable income from non-reit activities managed through taxable REIT subsidiaries, or TRSs, is subject to federal, state and local taxes. We generally lease our hotels to wholly-owned TRSs that are subject to federal and state income taxes. In 2005 and 2004, we also contributed certain hotels to our wholly-owned TRSs. We account for income taxes in accordance with the provisions of SFAS 109, Accounting for Income Taxes. Under SFAS 109, we account for income taxes using the asset and liability method, under which deferred tax assets and liabilities are recognized for the future tax consequences attributable to differences between the financial statement carrying amounts of existing assets and liabilities and their respective tax bases Annual Report
65 ( C o n t i n u e d ) N O T E S R e c o n c i l i a t i o n b e t w e e n T R S s G A A P n e t l o s s a n d t a x a b l e l o s s : The following table reconciles the TRS GAAP net loss to taxable loss for the years ended December 31, 2006, 2005, and 2004: (in thousands) GAAP net income (loss) $ 51,045 $ (251,615) $ (100,127) GAAP net loss (income) from REIT operations (54,894) (37,237) 35,168 GAAP net loss of taxable subsidiaries (3,849) (288,852) (64,959) Impairment loss not deductible for tax 7, ,605 8,509 Tax gain (loss) in excess of book gains on sale of hotels 116,308 (39,842) (51,576) Depreciation and amortization (a) (3,379) (1,910) (4,948) Employee benefits not deductible for tax (1,537) 1,708 1,040 Other book/tax differences (1,653) 4,779 (3,216) Tax gain (loss) of taxable subsidiaries $ 113,096 $ (92,512) $ (115,150) (a) The changes in book/tax differences in depreciation and amortization principally result from book and tax basis differences, differences in depreciable lives and accelerated depreciation methods. S u m m a r y o f T R S s n e t d e f e r r e d t a x a s s e t : At December 31, 2006 and 2005, our TRS had a deferred tax asset, prior to any valuation allowance, primarily comprised of the following: (in thousands) Accumulated net operating losses of our TRS $ 119,850 $ 162,827 Tax property basis in excess of book 1,128 Accrued employee benefits not deductible for tax 9,111 9,695 Bad debt allowance not deductible for tax Gross deferred tax assets 130, ,359 Valuation allowance (130,456) (133,138) Deferred tax asset after valuation allowance 40,221 Gross deferred tax liability book property basis in excess of tax (40,221) Net deferred tax asset $ $ We have provided a valuation allowance against our deferred tax asset at December 31, 2006 and 2005, that results in no net deferred tax asset at December 31, 2006 and 2005 due to the uncertainty of realization (because of historical operating losses). Accordingly, no provision or benefit for income taxes is reflected in the accompanying Consolidated Statements of Operations. At December 31, 2006, the TRS had net operating loss carryforwards for federal income tax purposes of $315.4 million, which are available to offset future taxable income, if any, through F e l C o r Lodging Trust 63
66 ( C o n t i n u e d ) N O T E S R e c o n c i l i a t i o n b e t w e e n R E I T G A A P n e t l o s s a n d t a x a b l e i n c o m e l o s s : The following table reconciles REIT GAAP net income (loss) to taxable income (loss) for the years ended December 31, 2006, 2005 and 2004: (in thousands) GAAP net income (loss) from REIT operations $ 54,894 $ 37,237 $ (35,168) Book/tax differences, net: Depreciation and amortization (a) (2,995) 4,797 2,386 Minority interests (19,869) (24,204) (2,724) Tax loss in excess of book gains on sale of hotels 9,268 (21,547) (10,893) Impairment loss not deductible for tax (445) 35,146 29,779 Other (1,444) 4,045 1,314 Taxable income (loss) subject to distribution requirement (b) $ 39,409 $ 35,474 $ (15,306) (a) Book/tax differences in depreciation and amortization principally result from differences in depreciable lives and accelerated depreciation methods. (b) The dividend distribution requirement is 90%. If we sell any asset acquired from Bristol Hotel Company, or Bristol, within 10 years after our merger with Bristol in 1998, and we recognize a taxable gain on the sale, we will be taxed at the highest corporate rate on an amount equal to the lesser of the amount of gain that we recognize at the time of the sale, or the amount of gain that we would have recognized if we had sold the asset at the time of the Bristol merger for its then fair market value. Many of the hotels sold in our disposition program were originally acquired at the time of the Bristol merger. In 2006, we recorded $0.9 million of built in gain tax with respect to the sale of one hotel, but have been able to avoid any other substantial built in gain tax on these sales by offsetting built in losses or other tax planning strategies. We believe that we will be able to avoid any additional substantial built in gain tax on future sales through offsetting built in losses, like kind exchanges and other tax planning strategies Annual Report
67 ( C o n t i n u e d ) N O T E S C h a r a c t e r i z a t i o n o f d i s t r i b u t i o n s : For income tax purposes, distributions paid consist of ordinary income, capital gains, return of capital or a combination thereof. For the years ended December 31, 2006, 2005 and 2004, distributions paid per share were characterized as follows: Amount % Amount % Amount % C o m m o n S t o c k Ordinary income $ $ $ Return of capital $ $ $ P r e f e r r e d S t o c k S e r i e s A Ordinary income $ $ $ Return of capital $ $ $ P r e f e r r e d S t o c k S e r i e s B Ordinary income $ $ $ Return of capital $ $ $ P r e f e r r e d S t o c k S e r i e s C Ordinary income $ $ $ Return of capital $ $ $ 11. C a p i t a l S t o c k At December 31, 2006, we had $600 million of common stock, preferred stock, debt securities, and/or common stock warrants available for offerings under a shelf registration statement previously declared effective. P r e f e r r e d S t o c k Our board of directors is authorized to provide for the issuance of up to 20 million shares of preferred stock in one or more series, to establish the number of shares in each series, to fix the designation, powers, preferences and rights of each such series, and the qualifications, limitations or restrictions thereof. In 1996, we issued 6.1 million shares of our Series A preferred stock at $25 per share. In April 2004, we completed the sale of 4.6 million additional shares of our Series A preferred stock. The shares were sold at a price of $23.79 per share, which included accrued dividends of $0.51 per share through April 5, 2004, resulting in net proceeds of $104 million. In August 2004, we completed the sale of an additional 2.3 million shares of our Series A preferred stock. The shares were sold at a price of $23.22 per share, which included accrued dividends of $0.28 per share through August 22, 2004, resulting in net proceeds of $52 million. Our Series A preferred stock bears an annual cumulative dividend payable in arrears equal to the greater of $1.95 per share or the cash distributions declared or paid for the corresponding period on the number of shares of common stock into which the Series A preferred stock is then convertible. Each share of the Series A preferred stock is convertible at the stockholder s option to shares of common stock, subject to certain adjustments. During 2000, holders of 69,400 shares of Series A preferred stock converted their shares to 53,798 common shares, which were issued from treasury shares. In 1998, we issued 5.75 million depositary shares, representing 57,500 shares of our 9% Series B preferred stock at $25 per depositary share. In 2002, we issued 1,025,800 additional depositary shares, representing 10,258 shares of our Series B preferred stock at F e l C o r Lodging Trust 65
68 ( C o n t i n u e d ) N O T E S $24.37 per depositary share to yield 9.4%. In 2005, we redeemed all of the outstanding Series B preferred stock. The redemption of the Series B preferred shares resulted in a reduction in income available to common shareholders of $6.5 million representing the original issuance cost of the Series B preferred shares redeemed. On April 8, 2005, we completed the issuance of 5.4 million depositary shares of our 8% Series C Cumulative Redeemable preferred stock, or Series C preferred stock, and an additional 1.4 million depositary shares on August 30, 2005, each representing 1/100 of a share of our Series C preferred stock with gross proceeds of $135 million and $34.4 million, respectively. The gross proceeds were used to redeem all of our 9% Series B preferred stock. We may call the Series C preferred stock and the corresponding depositary shares at $25 per depositary share. These shares have no stated maturity, sinking fund or mandatory redemption, and are not convertible into any of our other securities. The Series C preferred stock has a liquidation preference of $2,500 per share (equivalent to $25 per depositary share) and is entitled to annual cumulative dividends at the rate of 8% of the liquidation preference (equivalent to $2.00 annually per depositary share). Accrued dividends payable on our common stock, Series A and Series C preferred stock aggregating $24.1 million at December 31, 2006, were paid in January F e l C o r L P U n i t s We are the sole general partner of FelCor LP and are obligated to contribute the net proceeds from any issuance of our equity securities to FelCor LP in exchange for units of partnership interest, or Units, corresponding in number and terms to the equity securities issued by us. Units of limited partner interest may also be issued by FelCor LP to third parties in exchange for cash or property, and Units so issued to third parties are redeemable at the option of the holders thereof for a like number of shares of our common stock or, at our option, for the cash equivalent thereof. During 2006, 2005 and 2004, 1,407,524 Units, 25,595 Units and 245,398 Units, respectively, were exchanged for a like number of common shares issued from treasury stock. 12. h O T E L O p e r a t i n g R e v e n u e, D e p a r t m e n t a l E x p e n s e s, A N D O t h e r P r o p e r t y O p e r a t i n g C o s t s Hotel operating revenue from continuing operations was comprised of the following: (in thousands) Year Ended December 31, Room revenue $ 809,466 $ 742,882 $ 677,169 Food and beverage revenue 129, , ,829 Other operating departments 52,293 48,431 46,418 Total hotel operating revenues $ 990,959 $ 913,149 $ 840,416 Approximately 99.7% to 100.0% of our revenue in 2006, 2005 and 2004 was comprised of hotel operating revenues, which includes room revenue, food and beverage revenue, and revenue from other operating departments (such as telephone, parking and business centers). These revenues are recorded net of any sales or occupancy taxes collected from our guests. All rebates or discounts are recorded, when allowed, as a reduction in revenue, and there are no material contingent obligations with respect to rebates or discounts offered by us. All revenues are recorded on an accrual basis, as earned. Appropriate allowances are made for doubtful accounts and are recorded as a bad debt expense. The remainder of our revenue was from retail space rental revenue and other sources. During 2004, we recorded $1 million of other revenue that we received in development fees from the successful completion of a condominium project Annual Report
69 ( C o n t i n u e d ) N O T E S We do not have any time-share arrangements and do not sponsor any guest frequency programs for which we would have any contingent liability. We participate in guest frequency programs sponsored by the brand owners of our hotels, and we expense the charges associated with those programs (typically consisting of a percentage of the total guest charges incurred by a participating guest), as incurred. When a guest redeems accumulated guest frequency points at one of our hotels, the hotel bills the sponsor for the services provided in redemption of such points and records revenue in the amount of the charges billed to the sponsor. Associated with the guest frequency programs, we have no loss contingencies or ongoing obligation beyond what is paid to the brand owner at the time of the guest s stay. Hotel departmental expenses from continuing operations were comprised of the following: (in thousands) Year Ended December 31, Room $ 199,283 $ 187,872 $ 178,146 Food and beverage 97,012 93,136 90,715 Other operating departments 23,436 22,446 21,758 Total hotel departmental expenses $ 319,731 $ 303,454 $ 290,619 Other property operating costs from continuing operations were comprised of the following: (in thousands) Year Ended December 31, Hotel general and administrative expense $ 87,451 $ 82,607 $ 76,898 Marketing 81,113 76,151 71,099 Repair and maintenance 52,710 50,011 46,063 Utilities 49,027 46,857 41,144 Total other property operating costs $ 270,301 $ 255,626 $ 235,204 Included in hotel departmental expenses and other property operating costs were hotel compensation and benefit expenses of $281.7 million, $273.5 million and $259.6 million for the year ended December 31, 2006, 2005 and 2004, respectively. 13. T a x e s, I n s u r a n c e a n d L e a s e E x p e n s e Taxes, insurance and lease expense from continuing operations were comprised of the following: (in thousands) Year Ended December 31, Operating lease expense (a) $ 69,221 $ 62,176 $ 56,716 Real estate and other taxes 32,790 32,175 26,998 Property, general liability insurance and other 10,041 10,501 8,542 Total taxes, insurance and lease expense $ 112,052 $ 104,852 $ 92,256 (a) Includes hotel lease expense of $61.1 million, $54.7 million and $49.4 million, respectively, associated with 13 hotels in 2006 and 2005 and 14 hotels in 2004 owned by unconsolidated entities and leased to our consolidated lessees. Included in lease expense is $36.1 million, $28.4 million and $21.9 million in percentage rent for the year ended December 31, 2006, 2005 and 2004, respectively. F e l C o r Lodging Trust 67
70 ( C o n t i n u e d ) N O T E S 14. L a n d L e a s e s a n d H o t e l R e n t We lease land occupied by certain hotels from third parties under various operating leases that expire through Certain land leases contain contingent rent features based on gross revenue at the respective hotels. In addition, we recognize rent expense for 14 hotels that are owned by unconsolidated entities and are leased to our consolidated lessees. These leases expire through 2015 and require the payment of base rents and contingent rent based on revenues at the respective hotels. Future minimum lease payments under our land lease obligations and hotel leases at December 31, 2006, were as follows: Year (in thousands) 2007 $ 22, , , , , and thereafter 94,115 $ 170, E a r n i n g s P e r S h a r e The following table sets forth the computation of basic and diluted earnings (loss) per share for the years ended December 31, 2006, 2005 and 2004: (in thousands, except per share data) Numerator: Income (loss) from continuing operations $ 8,565 $ (16,916) $ (78,376) Less: Preferred dividends (38,713) (39,408) (35,130) Issuance costs of redeemed preferred stock (6,522) Loss from continuing operations and applicable to common stockholders (30,148) (62,846) (113,506) Discontinued operations 42,480 (234,699) (21,751) Net income (loss) applicable to common stockholders $ 12,332 $ (297,545) $ (135,257) Denominator: Denominator for basic and diluted earnings (loss) per share 60,734 59,436 59,045 Earnings (loss) per share data: Basic: Income (loss) from continuing operations $ (0.50) $ (1.06) $ (1.92) Discontinued operations $ 0.70 $ (3.95) $ (0.37) Net income (loss) $ 0.20 $ (5.01) $ (2.29) Diluted: Income (loss) from continuing operations $ (0.50) $ (1.06) $ (1.92) Discontinued operations $ 0.70 $ (3.95) $ (0.37) Net income (loss) $ 0.20 $ (5.01) $ (2.29) Annual Report
71 ( C o n t i n u e d ) N O T E S Securities that could potentially dilute basic earnings per share in the future that were not included in computation of diluted earnings per share, because they would have been antidilutive for the periods presented, are as follows: (unaudited, in thousands) Restricted shares granted but not vested Series A convertible preferred shares 9,985 9,985 9,985 Series A preferred dividends that would be excluded from net income (loss) applicable to common stockholders, if the Series A preferred shares were dilutive, were $25.1 million for both 2006 and 2005, and $19.9 million in C o m m i t m e n t s, C o n t i n g e n c i e s a n d R e l a t e d P a r t y T r a n s a c t i o n s We shared the executive offices and certain employees with FelCor, Inc. (controlled by Thomas J. Corcoran, Jr., Chairman of the Board of Directors), and it paid its share of the costs thereof, including an allocated portion of the rent, compensation of certain personnel, office supplies, telephones, and depreciation of office furniture, fixtures, and equipment. Any such allocation of shared expenses must be approved by a majority of our independent directors. FelCor, Inc. had a 10% ownership interest in one hotel and limited other investments. FelCor, Inc. paid approximately $50,000 for shared office costs in 2006, 2005 and In an effort to keep our cost of insurance within reasonable limits, we have only purchased terrorism insurance for those hotels that are secured by mortgage debt, as required by our lenders. Our terrorism insurance has per occurrence and aggregate limits of $50 million. We have established a self-insured retention of $250,000 per occurrence for general liability insurance with regard to 67 of our hotels; the remainder of our hotels participate in general liability programs of our managers, with no deductible. Because of our general liability deductible for the 67 hotels, we maintain reserves to cover the estimated ultimate uninsured liability for losses with respect to reported and unreported claims incurred as of the end of each accounting period. At December 31, 2006 and 2005, our reserve for this self-insured portion of general liability claims was $4.3 million and $5.6 million, respectively. Our property program has a $100,000 all risk deductible, a deductible of 5% of insured value for named windstorm and California quake. Should uninsured or not fully insured losses be substantial, they could have a material adverse impact on our operating results and cash flows. There is no litigation pending or known to be threatened against us or affecting any of our hotels, other than claims arising in the ordinary course of business or which are not considered to be material. Furthermore, most of these claims are substantially covered by insurance. We do not believe that any claims known to us, individually or in the aggregate, will have a material adverse effect on us. Our hotels are operated under various management agreements that call for base management fees, which range from 2% to 7% of hotel room revenue and generally have an incentive provision related to the hotel s profitability. In addition, the management agreements generally require us to invest approximately 3% to 5% of revenues in capital maintenance. The management agreements have terms from 5 to 20 years and generally have renewal options. With the exception of 35 hotels whose rights to use a brand name are contained in the management agreement governing their operations, each of our hotels operates under a franchise or license agreement. Typically, our franchise or license agreements provide for a royalty fee of 4% of room revenues to be paid to the franchisor. In the event we breach one of our Embassy Suites Hotels franchise license agreements, in addition to losing the right to use the Embassy Suites Hotels name for the operation of the applicable hotel, we may be liable, under certain circumstances, for liquidated damages equal to the fees paid to the franchisor with respect to that hotel during the three preceding years. As a part of the amendment to the IHG management agreements, we have agreed to spend, by June 30, 2007, approximately $50.6 million with regard to special capital plans on 11 hotels. We have agreed to spend an additional $17.2 million on capital plans by F e l C o r Lodging Trust 69
72 ( C o n t i n u e d ) N O T E S June 30, 2008, on four hotels, and $5.5 million on capital plans for two hotels that are then to be substantially redeveloped by December 31, S u p p l e m e n t a l C a s h F l o w D i s c l o s u r e Accrued dividends payable on our common stock, Series A and Series C preferred stock aggregating $24.1 million and $8.6 million at December 31, 2006 and 2005 were paid in January of the following year. We allocated $26.9 million and $0.1 million of minority interest to additional paid in capital due to the exchange of 1,407,524 units and 25,595 units for common stock in 2006 and 2005, respectively. Depreciation expense is comprised of the following: For the Year Ended December 31, (in thousands) Depreciation from continuing operations $ 94,579 $ 84,448 $ 78,116 Depreciation from discontinued operations 15,69 38,087 44,537 Total depreciation expense $ 110,274 $ 122,535 $ 122,653 In 2006, we sold 31 hotels for gross proceeds of $514 million. These proceeds were used to pay down debt of approximately $356 million ($150 million of which related to sales proceeds paid directly from purchaser to our lender at closing) and invested in capital improvements at many of our core hotels. In 2006, we borrowed $215 million of debt, that was paid directly to a lender, repaying $215 million of debt. For the year ended December 31, 2006, repayment of borrowings consisted of early retirement of debt of $687.2 million and normal recurring principal payments of $15.9 million. For the year ended December 31, 2005, repayment of borrowings of $293.0 million consisted of early retirement of secured debt of $262.0 million and $31.0 million of normal recurring principal payments. For the year ended December 31, 2004, repayment of borrowings of $838.9 million consisted of $775.0 million in early retirement of senior notes, $18.9 million of normal recurring principal payments, $41.3 million of premium paid in excess of par on the retirement of the senior notes and $3.7 million to retire interest rate swaps. 18. S t o c k B a s e d C o m p e n s a t i o n P l a n s We sponsor four restricted stock and stock option plans, or the FelCor Plans. In addition, upon completion of the merger with Bristol in 1998, we assumed two stock option plans previously sponsored by Bristol, or the Bristol Plans. We were initially obligated to issue up to 1,237,309 shares of our common stock pursuant to the Bristol Plans. No additional options may be awarded under the Bristol Plans. The FelCor Plans and the Bristol Plans are referred to collectively as the Plans. We are authorized to issue 4,700,000 shares of common stock under the FelCor Plans pursuant to awards granted in the form of incentive stock options, non-qualified stock options, and restricted stock. All options have 10-year contractual terms and vest either over five equal annual installments (20% per year), beginning in the year following the date of grant or 100% at the end of a four-year vesting term. Stock grants vest either over five equal annual installments or over a four year schedule including time based vesting and performance based vesting. Under the FelCor Plans, there were 797,114 shares remaining available for grant at December 31, There were options covering 53,704 shares outstanding under the Bristol Plans at December 31, These options are fully vested Annual Report
73 ( C o n t i n u e d ) N O T E S S t o c k O p t i o n s A summary of the status of our non-qualified stock options under the Plans as of December 31, 2006, 2005 and 2004, and the changes during these years are presented in the following tables: No. Weighted No. Weighted No. Weighted Shares of Average Shares of Average Shares of Average underlying Exercise Underlying Exercise Underlying Exercise Options Prices Options Prices Options Prices Outstanding at beginning of the year 1,465,257 $ ,478,760 $ ,911,544 $ Forfeited (726,891) $ (13,503) $ (432,784) $ Exercised (140,000) $ Outstanding at end of year 598,366 $ ,465,257 $ ,478,760 $ Exercisable at end of year 598,366 $ ,455,257 $ ,333,760 $ Options Exercisable and Outstanding Number Outstanding weighted Average weighted Average Range of Exercise Prices at 12/31/06 remaining Life Exercise Price $15.62 to $ , $ $24.18 to $ , $ $15.62 to $ , $ The fair value of each stock option granted is estimated on the date of grant using the Black-Scholes option pricing model with the following weighted average assumptions for 2001 and 2000 when options were granted: dividend yield of 12.44% to 11.28%; risk free interest rates are different for each grant and range from 4.33% to 6.58%; the expected lives of options were six years; and volatility of 21.04% for 2001 grants and 18.22% for 2000 grants. The weighted average fair value of options granted during 2001, was $0.85 per share. We have issued no stock options since R e s t r i c t e d S t o c k A summary of the status of our restricted stock grants as of December 31, 2006, 2005, and 2004, and the changes during these years are presented below: Weighted Weighted Weighted Average Average Average No. Fair Market No. Fair Market No. Fair Market Options Value at Grant Options Value at Grant Options Value at Grant Outstanding at beginning of the year 1,549,206 $ ,187,606 $ ,431 $ Granted (a) : With immediate vesting (b) 28,500 $ ,300 $ ,500 $ With 4-year pro rata vesting 293,800 $ ,300 $ ,040 $ Vesting within 12 months of grant 50,000 $ With 5-year pro rata vesting 60,000 $ ,000 $ ,000 $ Forfeited (51,377) $ (25,365) $ Outstanding at end of year 1,880,129 $ ,549,206 $ ,187,606 $ Vested at end of year 1,108,866 $ ,738 $ ,151 $ (a) All shares granted are issued out of treasury except for 19,200, 5,200 and 6,300 of the restricted shares issued to directors during the years ended December 31, 2006, 2005 and 2004, respectively. (b) Shares awarded to directors. F e l C o r Lodging Trust 71
74 ( C o n t i n u e d ) N O T E S The unearned compensation cost of granted but unvested restricted stock as of December 31, 2006 was $8.4 million. The weighted average period over which this cost is to be amortized is approximately three years. 19. E m p l o y e e B e n e f i t s We offer a 401(k) plan and health insurance benefits to our employees. Our matching contribution to our 401(k) plan aggregated $0.9 million for 2006, $0.7 million for 2005, and $0.6 million for The cost of health insurance benefits were $1.2 million during 2006, $0.7 million during 2005 and $0.6 million during The employees at our hotels are employees of the respective management companies. Under the management agreements, we reimburse the management companies for the compensation and benefits related to the employees who work at our hotels. We are not, however, the sponsors of their employee benefit plans and have no obligation to fund these plans. 20. S e g m e n t I n f o r m a t i o n SFAS 131, Disclosures about Segments of an Enterprise and Related Information, requires the disclosure of selected information about operating segments. Based on the guidance provided in the standard, we have determined that our business is conducted in one operating segment because of the similar economic characteristics of our hotels. The following table sets forth revenues for continuing operations, and investment in hotel assets represented by, the following geographical areas as of and for the years ended December 31, 2006, 2005 and 2004: revenue investment in Hotel Assets (in thousands) California $ 195,056 $ 178,688 $ 161,594 $ 413,899 $ 517,250 $ 546,762 Texas 110,384 98,870 91, , , ,933 Florida 150, , , , , ,468 Georgia 58,745 54,993 50, , , ,010 Other states 447, , , ,352 1,072,222 1,197,952 Canada 29,433 26,777 24,780 50,074 52,158 47,641 Total $ 991,038 $ 914,655 $ 842,612 $ 2,044,285 $ 2,584,379 $ 2,955, R e c e n t l y I s s u e d S t a t e m e n t s o f F i n a n c i a l A c c o u n t i n g S t a n d a r d s In July 2006, the FASB issued FASB Interpretation Number 48, Accounting for Uncertainty in Income Taxes, an Interpretation of FASB Statement No. 109 ( FIN 48 ). FIN 48 prescribes a recognition threshold and measurement attribute for the financial statement recognition and measurement of a tax position taken in a tax return. The Company must determine whether it is more-likely-than-not that a tax position will be sustained upon examination, including resolution of any related appeals or litigation processes, based on the technical merits of the position. Once it is determined that a position meets the more-likely-than-not recognition threshold, the position is measured to determine the amount of benefit to recognize in the financial statements. FIN 48 applies to all tax positions related to income taxes subject to FASB Statement No. 109, Accounting for Income Taxes. The interpretation clearly scopes out income tax positions related to FASB Statement No. 5, Accounting for Contingencies. We will adopt the provisions of this statement beginning in the first quarter of We do not expect the cumulative effect of applying the provisions of FIN 48, if any, to be material. In September 2006, the FASB issued Statement No. 157, Fair Value Measurements ( SFAS No. 157 ). SFAS No. 157 provides guidance for using fair value to measure assets and liabilities. This statement clarifies the principle that fair value should be based on the assumptions that market participants would use when pricing the asset or liability. SFAS No. 157 establishes a fair value hierarchy, giving the highest Annual Report
75 ( C o n t i n u e d ) N O T E S priority to quoted prices in active markets and the lowest priority to unobservable data. SFAS No. 157 applies whenever other standards require assets or liabilities to be measured at fair value. This statement is effective in fiscal years beginning after November 15, We believe that the adoption of this standard on January 1, 2008 will not have a material effect on our consolidated financial statements. 22. Q u a r t e r l y O p e r a t i n g R e s u l t s ( u n a u d i t e d ) Our unaudited consolidated quarterly operating data for the years ended December 31, 2006 and 2005, follows (in thousands, except per share data). In the opinion of management, all adjustments (consisting of normal recurring accruals) necessary for a fair presentation of quarterly results have been reflected in the data. It is also management s opinion, however, that quarterly operating data for hotel enterprises are not indicative of results to be achieved in succeeding quarters or years. In order to obtain a more accurate indication of performance, there should be a review of operating results, changes in stockholders equity and cash flows for a period of several years First Quarter Second Quarter Third Quarter Fourth Quarter (in thousands, except per share data) Total revenues $ 251,407 $ 259,265 $ 247,464 $ 232,902 Net income (loss) from continuing operations $ 6,859 $ 12,478 $ 4,272 $ (15,044) Discontinued operations $ 2,993 $ (2,333) $ 15,790 $ 26,030 Net income $ 9,852 $ 10,145 $ 20,062 $ 10,986 Net income (loss) applicable to common stockholders $ 174 $ 467 $ 10,396 $ 1,295 Comprehensive income $ 9,560 $ 12,305 $ 19,266 $ 6,151 Basic and diluted per common share data: Net income (loss) from continuing operations $ (0.05) $ 0.05 $ (0.10) $ (0.40) Discontinued operations $ 0.05 $ (0.04) $ 0.27 $ 0.42 Net income $ $ 0.01 $ 0.17 $ 0.02 Basic weighted average common shares outstanding 59,660 60,355 61,148 61,268 Diluted weighted average common shares outstanding 59,660 60,626 61,148 61, First Quarter Second Quarter Third Quarter Fourth Quarter (in thousands, except per share data) Total revenues $ 216,900 $ 240,777 $ 234,323 $ 222,655 Net income (loss) from continuing operations $ (4,284) $ 6,208 $ (797) $ (18,043) Discontinued operations $ (3,730) $ 4,143 $ 12,055 $ (247,167) Net income (loss) (a) $ (8,014) $ 10,351 $ 11,258 $ (265,210) Net loss applicable to common stockholders $ (18,105) $ (4,656) $ 105 $ (274,889) Comprehensive income (loss) $ (6,631) $ 8,722 $ 15,169 $ (265,053) Basic and diluted per common share data: Net loss from continuing operations $ (0.24) $ (0.15) $ (0.20) $ (0.47) Discontinued operations $ (0.06) $ 0.07 $ 0.20 $ (4.15) Net loss $ (0.30) $ (0.08) $ $ (4.62) Basic weighted average common shares outstanding 59,416 59,404 59,442 59,453 Diluted weighted average common shares outstanding 59,416 59,404 59,442 59,453 (a) The fourth quarter net loss in 2005 includes an impairment charge of $263 million. In accordance with SFAS 144, amounts previously reported in continuing operations have been reclassified to discontinued operations upon sale of hotels or the designation of hotels as held for sale in subsequent periods. F e l C o r Lodging Trust 73
76 S T O C K I N F O R M A T I O N ( C o n t i n u e d ) M D & A Bloomberg Hotel REIT Index S&P 500 FelCor Lodging Trust m d & a ( C o n t i n u e d ) December 31, S&P FelCor Lodging Trust Bloomberg Hotel REIT Index C O M M O N S T O C K P R I C E Q u a r t e r H i g h L o w First $22.10 $16.78 Second $22.89 $19.70 Third $22.95 $18.73 Fourth $22.80 $ Q u a r t e r H i g h L o w First $14.99 $12.20 Second $14.75 $11.78 Third $16.40 $14.20 Fourth $17.59 $13.27 P R E F E R R E D S T O C K P R I C E S E R I E S A Q u a r t e r H i g h L o w First $25.39 $23.54 Second $25.20 $23.90 Third $24.99 $23.93 Fourth $25.50 $ Q u a r t e r H i g h L o w First $25.41 $24.40 Second $24.90 $23.72 Third $24.70 $23.75 Fourth $24.68 $23.53 P R E F E R R E D S T O C K P R I C E S E R I E S C Q u a r t e r H i g h L o w First $25.20 $23.72 Second $25.10 $23.95 Third $25.15 $24.15 Fourth $25.67 $ Q u a r t e r H i g h L o w Second $24.68 $23.15 Third $25.20 $23.90 Fourth $25.10 $ F2e 0l 0C 6 o r Annual 2 0Report 0 6
77 P O R T F O L I O F E L C O R L O D G I N G T R U S T I N C O R P O R A T E D ( C o n t i n u e d ) M D & A A L A B A M A B i r m i n g h a m Embassy Suites Birmingham A R I Z O N A P h o e n i x Embassy Suites Phoenix- Biltmore Embassy Suites Tempe Sheraton Crescent Hotel Phoenix C A L I F O R N I A Da n a P o i n t Doubletree Guest Suites Doheny Beach L o s A n g e l e s Embassy Suites Anaheim-Disneyland Area Embassy Suites El Segundo- International Airport South M i l p i ta s Embassy Suites Milpitas-Silicon Valley N a pa Embassy Suites Napa Valley O x n a r d Embassy Suites Mandalay Beach Resort & Conference Center S a n D i e g o Holiday Inn San Diego-On the Bay S a n F r a n c i s c o Crowne Plaza San Francisco-Union Square Embassy Suites San Francisco-Airport/Burlingame Embassy Suites San Francisco Airport/South San Francisco Holiday Inn San Francisco-Fisherman s Wharf S a n R a fa e l Embassy Suites San Rafael- Marin County Conference Center S a n ta Ba r b a r a Holiday Inn Santa Barbara-Goleta S a n ta M o n i c a Holiday Inn Santa Monica-Beach at the Pier D E L A W A R E Wi l m i n g t o n Doubletree Wilmington F L O R I D A B o c a R at o n Embassy Suites Boca Raton C o c oa Be ac h Holiday Inn Cocoa Beach-Oceanfront D e e r f i e l d Be ac h Embassy Suites Deerfield Beach Resort/Boca Raton F t. L au d e r da l e Embassy Suites Ft. Lauderdale-17th Street Sheraton Suites Ft. Lauderdale-Cypress Creek Jac k s o n v i l l e Embassy Suites Jacksonville-Baymeadows M i a m i Embassy Suites Miami-International Airport O r l a n d o Doubletree Guest Suites Walt Disney World Resort Embassy Suites Orlando-International Drive- Convention Center Embassy Suites Orlando/ Altamonte Springs Holiday Inn Orlando - International Drive-Resort Holiday Inn Select Orlando-Airport Ta m pa Doubletree Guest Suites Tampa Bay G E O R G I A At l a n ta Embassy Suites Atlanta-Airport Embassy Suites Atlanta-Buckhead Embassy Suites Atlanta-Perimeter Center Sheraton Gateway Atlanta-Airport Sheraton Suites Atlanta-Galleria I L L I N O I S C h i c a g o Embassy Suites Chicago-Lombard/Oak Brook Embassy Suites Chicago-Northshore/Deerfield Sheraton Gateway Suites Chicago-O Hare Airport I N D I A N A I n d i a n a p o l i s Embassy Suites Indianapolis-North K A N S A S K a n s a s C i t y Embassy Suites Kansas City/ Overland Park K E N T U C K Y L e x i n g t o n Hilton Suites Lexington Green L O U I S I A N A Bat on Rouge Embassy Suites Baton Rouge Ne w O r l e a n s Embassy Suites New Orleans Holiday Inn New Orleans-Chateau LeMoyne- French Quarter Holiday Inn New Orleans-French Quarter M A R Y L A N D Ba lt i m o r e Embassy Suites Baltimore-BWI Airport M A S S A C H U S E T T S B o s t o n Embassy Suites Boston/ Marlborough Holiday Inn Select Boston-Beacon Hill M I N N E S O T A B l o o m i n g t o n Embassy Suites Bloomington M i n n e a p o l i s Embassy Suites Minneapolis-Airport St. Pau l Embassy Suites St. Paul-Downtown M I S S O U R I K a n s a s C i t y Embassy Suites Kansas City-Plaza N E W J E R S E Y Pa r s i p pa n y Embassy Suites Parsippany P i s c ataway Embassy Suites Piscataway-Somerset S e c au c u s Embassy Suites Secaucus-Meadowlands N O R T H C A R O L I N A C h a r l o t t e Doubletree Guest Suites Charlotte-SouthPark Embassy Suites Charlotte R a l e i g h Doubletree Guest Suites Raleigh/Durham Embassy Suites Raleigh-Crabtree P E N N S Y L V A N I A P h i l a d e l p h i a Holiday Inn Philadelphia-Historic District Sheraton Philadelphia-Society Hill P i t t s b u r g h Holiday Inn Select Pittsburgh- University Center (Oakland) S O U T H C A R O L I N A C h a r l e s t o n Holiday Inn Charleston- Mills House (Historic Downtown) My r t l e Be ac h Embassy Suites Myrtle Beach-Kingston Plantation Hilton Myrtle Beach Resort T E N N E S S E E N a s h v i l l e Embassy Suites Nashville-Airport-Opryland Area Holiday Inn Select Nashville-Opryland-Airport (Briley Parkway) T E X A S Au s t i n Doubletree Guest Suites Austin Embassy Suites Austin-North C o r p u s C h r i s t i Embassy Suites Corpus Christi Da l l a s Embassy Suites Dallas- DFW International Airport South Embassy Suites Dallas-Love Field Embassy Suites Dallas-Market Center Westin Dallas-Park Central H o u s t o n Holiday Inn Hotel & Suites Houston-Medical Center S a n A n t o n i o Embassy Suites San Antonio-International Airport Embassy Suites San Antonio-Northwest/I-10 Holiday Inn Select San Antonio-International Airport V E R M O N T B u r l i n g t o n Sheraton Burlington Hotel & Conference Center Burlington V I R G I N I A Vi e n n a Sheraton Premiere at Tysons Corner Vienna C A N A D A To r o n t o Holiday Inn Toronto-Yorkdale Holiday Inn Select Toronto-Airport R e s e r v a t i o n s : Doubletree Guest Suites & Hotels TREE Embassy Suites Hotels EMBASSY Hilton HILTONS Sheraton Westin F e l C o r WESTIN1 Crowne Plaza CROWNE Holiday Inn HOLIDAY F e l C o r 2 0F 0e 6F l ec lo Cr o Lodging r 2 0Trust
78 C O R P O R A T E A N D S H A R E H O L D E R I N F O R M A T I O N FelCor Lodging Trust Incorporated, a real estate investment trust, is the nation s largest owner of upscale, all-suite hotels. FelCor s portfolio is comprised of 83 consolidated core hotels, located in 23 states and Canada. FelCor s portfolio includes 65 upper upscale hotels, and FelCor is the largest owner of Embassy Suites Hotels and Doubletree Guest Suites hotels. FelCor s hotels are flagged under global brands such as Embassy Suites Hotels, Doubletree, Hilton, and Holiday Inn. FelCor has a current market capitalization of approximately $3.4 billion. At December 31, 2006, we had an aggregate of 62,052,183 shares of common stock and 1,355,016 FelCor LP limited partnership units outstanding. FelCor s CEO/CFO certifications were filed on March 1, 2007, as required by Sections 302 and 906 of the Sarbanes-Oxley Act, as exhibits to our annual Report on Form 10-K for the year ended December 31, In addition, FelCor s CEO s certification for fiscal year 2006 of FelCor s compliance with the NYSE s corporate governance standards was submitted to the NYSE timely and without qualification. Additional information can be found on the Company s Web site at C O R P O R A T E H E A D Q U A R T E R S FelCor Lodging Trust Incorporated 545 E. John Carpenter Freeway, Suite 1300 Irving, Texas Phone Fax Web site: information@felcor.com F O R M K A copy of FelCor s Annual Report on Form 10-K filed with the Securities and Exchange Commission will be furnished, without charge, to any shareholder of the Company upon request to: I n v e s t o r R e l at i o n s FelCor Lodging Trust Incorporated 545 E. John Carpenter Freeway, Suite 1300 Irving, Texas Phone A copy of FelCor s Annual Report on Form 10-K also is available on the Company s Web site, S H A R E H O L D E R S O F R E C O R D FelCor Lodging Trust Incorporated had approximately 263 common shareholders of record as of March 7, R E G I S T R A R & T R A N S F E R A G E N T ComputerShare LLC Providence, RI I N D E P E N D E N T P U B L I C A C C O U N T I N G F I R M PricewaterhouseCoopers LLP Dallas, TX N E W Y O R K S T O C K E X C H A N G E S Y M B O L S Common: FCH Preferred A: FCHPRA Preferred C: FCHPRC B O A R D O F D I R E C T O R S Thomas J. Corcoran, Jr. Chairman of the Board Melinda J. Bush, C.h.a Chairman and Chief Executive Officer HRW Holdings, LLC Robert F. Cotter President Kerzner International Limited Richard S. Ellwood Private Investor Thomas C. Hendrick Executive Vice President Acquisitions and Development Kor Group David C. Kloeppel Executive Vice President Chief Financial Officer Gaylord Entertainment Company Charles A. Ledsinger, Jr. Vice Chairman and Chief Executive Officer Choice Hotels International, Inc. Robert H. Lutz President Lutz Investments, LLP Robert A. Mathewson President RGC, Inc. Richard A. Smith President Chief Executive Officer S E N I O R M a n a g e m e n t Richard A. Smith President Chief Executive Officer Michael A. Denicola Executive Vice President Chief Investment Officer Troy A. Pentecost Executive Vice President Director of Asset Management Andrew J. Welch Executive Vice President Chief Financial Officer and Treasurer Jonathan H. Yellen Executive Vice President General Counsel and Secretary Robert P. Carl Senior Vice President Director of Design and Construction Lester C. Johnson Senior Vice President Chief Accounting Officer O F F I C E R S Jack Marraccini Senior Vice President Engineering Larry J. Mundy Senior Vice President Deputy General Counsel Eric Nylen Senior Vice President Development Marsha L. Bonner Vice President Risk Management Kenneth Callihan Vice President Engineering Kenneth R. Cunningham Vice President Design and Construction Joel M. Eastman Vice President Associate General Counsel Debra Feldman Vice President Capital Transactions Michelle K. Hayes Vice President Asset Management Michael C. Hughes Vice President Finance Michael L. Hunter Vice President Property Taxes Daniel A. Jorns Vice President Asset Management Melissa Kendrick Vice President Project Management David W. Mcgivney Vice President Income Tax Daniel M. Miller Vice President Capital Transactions Charles N. Nye Vice President Associate General Counsel Colleen C. Quinn Vice President Asset Management Stephen A. Schafer Vice President Strategic Planning and Investor Relations Frank J. Solano Vice President Asset Management Jeffrey D. Symes Vice President Controller Tim Van Allen Vice President Asset Management 76 F e l C o r
79


80 Fe l C o r L o d g i n g Tr u s t I n c o r p o r at e d E. J o h n C a r p e n t e r Fr e e w a y, S u i t e Irving, Texas 75062
ARRIVED FelCor Lodging Trust Incorporated 2007 Annual Report
 We ve ARRIVED FelCor Lodging Trust Incorporated 2007 Annual Report WELCOME. We ve arrived. It s a powerful feeling when goals are accomplished. After a year of hard work completing renovations, progressing
SUNSTONE HOTEL INVESTORS REPORTS RESULTS FOR FIRST QUARTER 2016
 For Additional Information: Bryan Giglia (949) 382-3036 SUNSTONE HOTEL INVESTORS REPORTS RESULTS FOR FIRST QUARTER 2016 ALISO VIEJO, CA May 2, 2016 (the Company or Sunstone ) (NYSE: SHO) today announced
SUNSTONE HOTEL INVESTORS REPORTS RESULTS FOR THIRD QUARTER 2016
 For Additional Information: Bryan Giglia (949) 382-3036 SUNSTONE HOTEL INVESTORS REPORTS RESULTS FOR THIRD QUARTER 2016 ALISO VIEJO, CA November 1, 2016 (the Company or Sunstone ) (NYSE: SHO) today announced
SUNSTONE HOTEL INVESTORS REPORTS RESULTS FOR SECOND QUARTER 2015
 For Additional Information: Bryan Giglia Sunstone Hotel Investors, Inc. (949) 382-3036 SUNSTONE HOTEL INVESTORS REPORTS RESULTS FOR SECOND QUARTER 2015 ALISO VIEJO, CA August 6, 2015 Sunstone Hotel Investors,
SUNSTONE HOTEL INVESTORS REPORTS RESULTS FOR SECOND QUARTER 2016
 For Additional Information: Bryan Giglia Sunstone Hotel Investors, Inc. (949) 382-3036 SUNSTONE HOTEL INVESTORS REPORTS RESULTS FOR SECOND QUARTER 2016 ALISO VIEJO, CA August 8, 2016 Sunstone Hotel Investors,
Supplemental Financial Information
 Supplemental Financial Information For the quarter ended June 30, 2017 Table of Contents Supplemental Financial Information CORPORATE PROFILE, FINANCIAL DISCLOSURES, AND SAFE HARBOR 3 About Sunstone 4
Strategically Positioned
 fig. 1 Strategically Positioned felcor lodging trust incorporated 2008 Annual Report fig. 2 The San Francisco Marriott Union Square Gensler led the transformation of the building s exterior and was the
Supplemental Financial Information
 Supplemental Financial Information For the quarter ended September 30, 2017 Table of Contents Supplemental Financial Information CORPORATE PROFILE, FINANCIAL DISCLOSURES, AND SAFE HARBOR 4 About Sunstone
OUR VISION. FelCor 1.0 UNFOLDING. FelCor 3.0. FelCor 2.0. FelCor Lodging Trust Incorporated 2014 Annual Report
 OUR VISION FelCor 1.0 UNFOLDING FelCor 3.0 FelCor Lodging Trust Incorporated 2014 Annual Report FelCor 2.0 2014 We are pleased to report that FelCor had an exceptional year in 2014. We fulfilled our commitment
LASALLE HOTEL PROPERTIES REPORTS SECOND QUARTER 2015 RESULTS
 7550 Wisconsin Avenue, 10 th Floor, Bethesda, MD 20814 PH 301.941.1500, FX 301.941.1553 www.lasallehotels.com News Release LASALLE HOTEL PROPERTIES REPORTS SECOND QUARTER 2015 RESULTS Expands Hotel EBITDA
SUNSTONE HOTEL INVESTORS REPORTS RESULTS FOR THIRD QUARTER 2015
 For Additional Information: Bryan Giglia Sunstone Hotel Investors, Inc. (949) 382-3036 SUNSTONE HOTEL INVESTORS REPORTS RESULTS FOR THIRD QUARTER 2015 ALISO VIEJO, CA October 29, 2015 Sunstone Hotel Investors,
building on success f e l c o r l o d g i n g t r u s t i n c o r P o r A t e d A n n u A l r e P o r t
 building ON success felcor lodging trust INCORPORATED 2015 annual report Our mission is to provide investors with superior returns on their capital by offering increased earnings, asset value and dividend
Supplemental Financial Information
 Supplemental Financial Information For the quarter ended September 30, 2018 Table of Contents Supplemental Financial Information CORPORATE PROFILE, FINANCIAL DISCLOSURES, AND SAFE HARBOR 3 About Sunstone
Supplemental Financial Information
 Supplemental Financial Information For the quarter ended June 30, 2018 Table of Contents Supplemental Financial Information CORPORATE PROFILE, FINANCIAL DISCLOSURES, AND SAFE HARBOR 3 About Sunstone 4
DIAMONDROCK HOSPITALITY COMPANY REPORTS THIRD QUARTER 2014 RESULTS AND RAISES FULL YEAR GUIDANCE
 COMPANY CONTACT Sean Mahoney (240) 744-1150 FOR IMMEDIATE RELEASE Tuesday, November 4, 2014 DIAMONDROCK HOSPITALITY COMPANY REPORTS THIRD QUARTER 2014 RESULTS AND RAISES FULL YEAR GUIDANCE Pro Forma RevPAR
LASALLE HOTEL PROPERTIES REPORTS FIRST QUARTER 2017 RESULTS Strengthens Balance Sheet with $274 Million of Asset Sales Year-to-Date
 News Release LASALLE HOTEL PROPERTIES REPORTS FIRST QUARTER 2017 RESULTS Strengthens Balance Sheet with $274 Million of Asset Sales Year-to-Date BETHESDA, MD, April 19, 2017 -- LaSalle Hotel Properties
SUNSTONE HOTEL INVESTORS REPORTS RESULTS FOR FOURTH QUARTER AND FULL YEAR 2009
 For Additional Information: Bryan Giglia Senior Vice President Corporate Finance (949) 369-4236 SUNSTONE HOTEL INVESTORS REPORTS RESULTS FOR FOURTH QUARTER AND FULL YEAR 2009 Drives strong margin performance
LASALLE HOTEL PROPERTIES REPORTS THIRD QUARTER 2017 RESULTS
 News Release LASALLE HOTEL PROPERTIES REPORTS THIRD QUARTER 2017 RESULTS BETHESDA, MD, October 19, 2017 -- LaSalle Hotel Properties (NYSE: LHO) today announced results for the quarter ended September 30,
B Y D E S I G N FELCOR LODGING TRUST 2013 ANNUAL REPORT
 B Y D E S I G N FELCOR LODGING TRUST 2013 ANNUAL REPORT 1 2 3 4 5 6 7 8 9 Last year, we committed to delivering on our strategic objectives. We said we would sell non-strategic hotels, continue to pay
SUNSTONE HOTEL INVESTORS REPORTS RESULTS FOR FIRST QUARTER 2018
 For Additional Information: Bryan Giglia Sunstone Hotel Investors, Inc. (949) 382-3036 SUNSTONE HOTEL INVESTORS REPORTS RESULTS FOR FIRST QUARTER 2018 ALISO VIEJO, CA May 7, 2018 Sunstone Hotel Investors,
SUNSTONE HOTEL INVESTORS REPORTS RESULTS FOR FOURTH QUARTER AND FULL YEAR 2018
 For Additional Information: Bryan Giglia (949) 382-3036 Aaron Reyes (949) 382-3018 SUNSTONE HOTEL INVESTORS REPORTS RESULTS FOR FOURTH QUARTER AND FULL YEAR 2018 IRVINE, CA February 12, 2019 (the Company
Sotherly Hotels Inc. Reports Financial Results for the Second Quarter Ended June 30, 2016
 Sotherly Hotels Inc. Reports Financial Results for the Second Quarter Ended June 30, 2016 Company Release August 9, 2016 9:00 AM EST WILLIAMSBURG, Va., Aug. 09, 2016 (GLOBE NEWSWIRE) -- Sotherly Hotels
SUNSTONE HOTEL INVESTORS REPORTS RESULTS FOR FOURTH QUARTER AND FULL YEAR 2017
 For Additional Information: Bryan Giglia Sunstone Hotel Investors, Inc. (949) 382-3036 SUNSTONE HOTEL INVESTORS REPORTS RESULTS FOR FOURTH QUARTER AND FULL YEAR 2017 ALISO VIEJO, CA February 12, 2018 Sunstone
SUNSTONE HOTEL INVESTORS REPORTS RESULTS FOR THIRD QUARTER 2018
 For Additional Information: Bryan Giglia Sunstone Hotel Investors, Inc. (949) 382-3036 Aaron Reyes Sunstone Hotel Investors, Inc. (949) 382-3018 SUNSTONE HOTEL INVESTORS REPORTS RESULTS FOR THIRD QUARTER
Park Hotels & Resorts Inc. Reports Fourth Quarter and Full Year 2017 Results
 Investor Contact 1600 Tysons Boulevard, Suite 1000 Ian Weissman McLean, VA 22102 + 1 703 584 7441 www.pkhotelsandresorts.com Park Hotels & Resorts Inc. Reports Fourth Quarter and Full Year 2017 Results
SUNSTONE HOTEL INVESTORS REPORTS RESULTS FOR THIRD QUARTER 2017
 For Additional Information: Bryan Giglia Sunstone Hotel Investors, Inc. (949) 382-3036 SUNSTONE HOTEL INVESTORS REPORTS RESULTS FOR THIRD QUARTER 2017 ALISO VIEJO, CA October 30, 2017 Sunstone Hotel Investors,
DIAMONDROCK HOSPITALITY COMPANY REPORTS FOURTH QUARTER AND FULL YEAR 2011 RESULTS
 COMPANY CONTACT Chris King (240) 744-1150 FOR IMMEDIATE RELEASE WEDNESDAY, FEBRUARY 29, 2012 DIAMONDROCK HOSPITALITY COMPANY REPORTS FOURTH QUARTER AND FULL YEAR 2011 RESULTS BETHESDA, Maryland, Wednesday,
COMPANY CONTACT. Sean Mahoney (240) FOR IMMEDIATE RELEASE
 FOR IMMEDIATE RELEASE") COMPANY CONTACT Sean Mahoney (240) 744-1150 FOR IMMEDIATE RELEASE DIAMONDROCK ACQUIRES L AUBERGE DE SEDONA AND ORCHARDS INN SEDONA FOR $97 MILLION Iconic Assets with Asset Management Upside in Attractive,
COMPANY CONTACT Sean Mahoney (240) 744-1150 FOR IMMEDIATE RELEASE DIAMONDROCK ACQUIRES L AUBERGE DE SEDONA AND ORCHARDS INN SEDONA FOR $97 MILLION Iconic Assets with Asset Management Upside in Attractive,
COREPOINT LODGING REPORTS FOURTH QUARTER 2018 RESULTS
 FOR IMMEDIATE RELEASE COREPOINT LODGING REPORTS FOURTH QUARTER RESULTS IRVING, Texas March 21, 2019 CorePoint Lodging Inc. (NYSE: CPLG) ( CorePoint or the Company ), a pure play selectservice hotel owner
Park Hotels & Resorts Inc. Reports Third Quarter 2017 Results
 Investor Contact 1600 Tysons Boulevard, Suite 1000 Ian Weissman McLean, VA 22102 + 1 703 584 7441 www.pkhotelsandresorts.com Park Hotels & Resorts Inc. Reports Third Quarter 2017 Results MCLEAN, VA (November
HOST HOTELS & RESORTS, INC. REPORTS SOLID RESULTS FOR 2016, ANNOUNCES SHARE REPURCHASE PROGRAM AND THE ACQUISITION OF THE DON CESAR
 Gregory J. Larson, Chief Financial Officer 240.744.5120 Bret D.S. McLeod, Senior Vice President 240.744.5216 Gee Lingberg, Vice President 240.744.5275 NEWS RELEASE HOST HOTELS & RESORTS, INC. REPORTS SOLID
Fourth Quarter and Year End 2017 Supplemental Data DECEMBER 31, 2017
 Fourth Quarter and Year End 2017 Supplemental Data DECEMBER 31, 2017 Waldorf Astoria Orlando Park Hotels & Resorts at NYSE Hilton Hawaiian Village Waikiki Beach Resort About Park and Safe Harbor Disclosure
OMEGA HEALTHCARE INVESTORS, INC. FUNDS FROM OPERATIONS Unaudited (In thousands, except per share amounts)
") FUNDS FROM OPERATIONS (In thousands, except per share amounts) Net income available to common stockholders. $ 17,550 Add back loss from real estate dispositions.. 24 Sub-total... $ 17,574 Elimination of
FUNDS FROM OPERATIONS (In thousands, except per share amounts) Net income available to common stockholders. $ 17,550 Add back loss from real estate dispositions.. 24 Sub-total... $ 17,574 Elimination of
COMPANY CONTACT Mark Brugger (240) FOR IMMEDIATE RELEASE
 FOR IMMEDIATE RELEASE") COMPANY CONTACT Mark Brugger (240) 744-1150 FOR IMMEDIATE RELEASE DIAMONDROCK ACQUIRES THE HOTEL PALOMAR IN PHOENIX, AZ Premier Hotel with Prime Location in Downtown CityScape Development Updates 2018
COMPANY CONTACT Mark Brugger (240) 744-1150 FOR IMMEDIATE RELEASE DIAMONDROCK ACQUIRES THE HOTEL PALOMAR IN PHOENIX, AZ Premier Hotel with Prime Location in Downtown CityScape Development Updates 2018
Condor Hospitality Trust Reports 2015 Third Quarter Results
 Suite 200 1800 West Pasewalk Avenue Norfolk, NE 68701 (402) 371-2520 (402) 371-4229 Fax www.condorhospitality.com For Immediate Release Condor Hospitality Trust Reports 2015 Third Quarter Results 4.7%
Park Hotels & Resorts Inc. Reports First Quarter 2018 Results
 Investor Contact 1775 Tysons Boulevard, 7th Floor Ian Weissman Tysons, VA 22102 + 1 571 302 5591 www.pkhotelsandresorts.com Park Hotels & Resorts Inc. Reports First Quarter 2018 Results TYSONS, VA (May
LASALLE HOTEL PROPERTIES REPORTS FIRST QUARTER 2018 RESULTS
 LASALLE HOTEL PROPERTIES REPORTS FIRST QUARTER 218 RESULTS News Release First Quarter Results Meaningfully Exceeded LaSalle s Expectations; EBITDA Outperformed Outlook by Approximately 6 Million or 15%
Park Hotels & Resorts Inc. (Exact name of Registrant as Specified in Its Charter)
") UNITED STATES SECURITIES AND EXCHANGE COMMISSION WASHINGTON, D.C. 20549 FORM 8-K CURRENT REPORT Pursuant to Section 13 or 15(d) of the Securities Exchange Act of 1934 Date of Report (Date of earliest event
UNITED STATES SECURITIES AND EXCHANGE COMMISSION WASHINGTON, D.C. 20549 FORM 8-K CURRENT REPORT Pursuant to Section 13 or 15(d) of the Securities Exchange Act of 1934 Date of Report (Date of earliest event
Extended Stay America Announces Fourth Quarter And Full Year 2017 Results
 Extended Stay America Announces Fourth Quarter And Full Year 2017 Results February 27, 2018 - Net Income of $40.2 million and $172.2 million in the Fourth Quarter and Full Year, Respectively - Adjusted
LASALLE HOTEL PROPERTIES REPORTS THIRD QUARTER 2018 RESULTS. Special Meeting to Approve Merger with Pebblebrook Scheduled for November 27, 2018
 News Release LASALLE HOTEL PROPERTIES REPORTS THIRD QUARTER 218 RESULTS Special Meeting to Approve Merger with Pebblebrook Scheduled for November 27, 218 Merger with Pebblebrook Expected to Close on November
SIMON PROPERTY GROUP EARNINGS RELEASE & SUPPLEMENTAL INFORMATION UNAUDITED THIRD QUARTER OCT
 SIMON PROPERTY GROUP EARNINGS RELEASE & SUPPLEMENTAL INFORMATION UNAUDITED THIRD QUARTER 2015 15OCT201518425424 TABLE OF CONTENTS EARNINGS RELEASE AND SUPPLEMENTAL INFORMATION FOR THE QUARTER ENDED SEPTEMBER
OMEGA HEALTHCARE INVESTORS, INC. FUNDS FROM OPERATIONS Unaudited (In thousands, except per share amounts)
") FUNDS FROM OPERATIONS (In thousands, except per share amounts) Net income available to common stockholders. $ 14,753 Deduct gain from real estate dispositions.. (477) Sub-total... $ 14,276 Elimination
FUNDS FROM OPERATIONS (In thousands, except per share amounts) Net income available to common stockholders. $ 14,753 Deduct gain from real estate dispositions.. (477) Sub-total... $ 14,276 Elimination
HOST HOTELS & RESORTS, INC. REPORTS RESULTS FOR THE FIRST QUARTER 2015 AND ANNOUNCES SHARE REPURCHASE PROGRAM
 Exhibit 99.1 Gregory J. Larson Chief Financial Officer 240.744.5120 Gee Lingberg Vice President 240.744.5275 NEWS RELEASE REPORTS RESULTS FOR THE FIRST QUARTER 2015 AND ANNOUNCES SHARE REPURCHASE PROGRAM
UNITED STATES SECURITIES AND EXCHANGE COMMISSION WASHINGTON, D.C FORM 8-K CURRENT REPORT. PURSUANT TO SECTION 13 OR 15(d) OF THE
 OF THE") UNITED STATES SECURITIES AND EXCHANGE COMMISSION WASHINGTON, D.C. 20549 FORM 8-K CURRENT REPORT PURSUANT TO SECTION 13 OR 15(d) OF THE SECURITIES EXCHANGE ACT OF 1934 Date of report (Date of earliest event
UNITED STATES SECURITIES AND EXCHANGE COMMISSION WASHINGTON, D.C. 20549 FORM 8-K CURRENT REPORT PURSUANT TO SECTION 13 OR 15(d) OF THE SECURITIES EXCHANGE ACT OF 1934 Date of report (Date of earliest event
American Realty Capital Hospitality Trust, Inc. 3Q 2016 REPORT SHAREHOLDER COMMUNICATION - NOT FOR USE AS SALES MATERIAL. Homewood Suites Chicago, IL
 3Q 2016 Homewood Suites Chicago, IL Georgia Tech Hotel & Conference Center Atlanta, GA Hyatt Place Baltimore BWI Airport Linthicum Heights, MD Courtyard by Marriott Providence, RI Hyatt Place Albuquerque
HOST HOTELS & RESORTS, INC. REPORTS RESULTS FOR THE THIRD QUARTER 2018
 Michael D. Bluhm, Chief Financial Officer 240.744.5110 Bret D.S. McLeod, Senior Vice President 240.744.5216 Gee Lingberg, Vice President 240.744.5275 NEWS RELEASE HOST HOTELS & RESORTS, INC. REPORTS RESULTS
OMEGA HEALTHCARE INVESTORS, INC. FUNDS FROM OPERATIONS Unaudited (In thousands, except per share amounts)
") FUNDS FROM OPERATIONS (In thousands, except per share amounts) Net income available to common stockholders... $ 17,806 Elimination of non-cash items included in net income: Depreciation and amortization...
FUNDS FROM OPERATIONS (In thousands, except per share amounts) Net income available to common stockholders... $ 17,806 Elimination of non-cash items included in net income: Depreciation and amortization...
STARWOOD REPORTS THIRD QUARTER 2002 RESULTS
 CONTACT: David Matheson (914) 640-5204 FOR IMMEDIATE RELEASE October 24, 2002 STARWOOD REPORTS THIRD QUARTER 2002 RESULTS WHITE PLAINS, NY, October 24, 2002 Starwood Hotels & Resorts Worldwide, Inc. (NYSE:
RECONCILIATION OF NON-GAAP FINANCIAL MEASURES
 RECONCILIATION OF NON-GAAP FINANCIAL MEASURES Supertel reports its financial results in accordance with generally accepted accounting principles (GAAP). In the course of presentations, management may from
ASHFORD PRIME REPORTS FOURTH QUARTER AND YEAR END 2014 RESULTS
 NEWS RELEASE Contact: Deric Eubanks Elise Chittick Scott Eckstein Chief Financial Officer Investor Relations Financial Relations Board (972) 490-9600 (972) 778-9487 (212) 827-3766 ASHFORD PRIME REPORTS
SUNSTONE HOTEL INVESTORS, INC. Company Presentation. September 2011
 Company Presentation September 2011 Forward-Looking Statements This presentation contains forward-looking statements that have been made pursuant to the provisions of the Private Securities Litigation
American Realty Capital Hospitality Trust, Inc. 2Q 2016 REPORT SHAREHOLDER COMMUNICATION - NOT FOR USE AS SALES MATERIAL. Homewood Suites Chicago, IL
 2Q 2016 Homewood Suites Chicago, IL Georgia Tech Hotel & Conference Center Atlanta, GA Courtyard Athens Athens, GA Courtyard by Marriott Providence, RI Courtyard Gainesville Gainesville, GA American Realty
2002 Financial Highlights
 2002 Financial Highlights (in thousands, except per share amounts, ratios and operating data) 2002 2001 2000 OPERATING RESULTS Total Revenues $ 440,380 $ 436,658 $ 436,574 O T H E R D A T A EBITDA (a)
istar Annual Report 2016
 istar Annual Report 2016 Annual Report 2016 2016 was a year of tangible progress for istar. The company set out to grow its earnings, capture unrecognized value and build a foundation for improved shareholder
2017 Portfolio Enhancements
 2017 Portfolio Enhancements October 2017 Hyatt Regency Scottsdale Resort & Spa at Gainey Ranch Scottsdale, AZ Royal Palms Resort & Spa Phoenix, AZ The Ritz-Carlton Pentagon City Arlington, VA Hyatt Regency
STARWOOD REPORTS FOURTH QUARTER 2011 RESULTS
 CONTACT: Jason Koval (203) 351-3500 FOR IMMEDIATE RELEASE February 2, 2012 STARWOOD REPORTS FOURTH QUARTER 2011 RESULTS STAMFORD, CT, February 2, 2012 Starwood Hotels & Resorts Worldwide, Inc. (NYSE: HOT)
ASHFORD TRUST REPORTS FIRST QUARTER 2018 RESULTS
 NEWS RELEASE Contact: Deric Eubanks Jordan Jennings Joe Calabrese Chief Financial Officer Investor Relations Financial Relations Board (972) 490-9600 (972) 778-9487 (212) 827-3772 ASHFORD TRUST REPORTS
Sovran Self Storage Reports Second Quarter Results, Adjusted FFO per Share Increases 14.9%, Guidance Raised
 July 30, 2014 Sovran Self Srage Reports Second Quarter Results, Adjusted FFO per Share Increases 14.9%, Guidance Raised BUFFALO, N.Y.--(BUSINESS WIRE)-- Sovran Self Srage, Inc. (NYSE:SSS), a self srage
STARWOOD REPORTS THIRD QUARTER 2010 RESULTS
 CONTACT: Jason Koval (914) 640-4429 FOR IMMEDIATE RELEASE October 28, 2010 STARWOOD REPORTS THIRD QUARTER 2010 RESULTS WHITE PLAINS, NY, October 28, 2010 Starwood Hotels & Resorts Worldwide, Inc. (NYSE:
STARWOOD REPORTS SECOND QUARTER 2013 RESULTS
 Investor Contact Stephen Pettibone 203-351-3500 Media Contact KC Kavanagh 866-478-2777 One StarPoint Stamford, CT 06902 United States STARWOOD REPORTS SECOND QUARTER 2013 RESULTS STAMFORD, Conn. (July
Park Hotels & Resorts Inc. (Exact name of Registrant as Specified in Its Charter)
") UNITED STATES SECURITIES AND EXCHANGE COMMISSION WASHINGTON, D.C. 20549 FORM 8-K CURRENT REPORT Pursuant to Section 13 or 15(d) of the Securities Exchange Act of 1934 Date of Report (Date of earliest event
UNITED STATES SECURITIES AND EXCHANGE COMMISSION WASHINGTON, D.C. 20549 FORM 8-K CURRENT REPORT Pursuant to Section 13 or 15(d) of the Securities Exchange Act of 1934 Date of Report (Date of earliest event
INVESTOR PRESENTATION Executive Summary August 2016
 INVESTOR PRESENTATION Executive Summary August 2016 Forward Looking Statements and non-gaap Measures This investor presentation, and the related discussion, contains forward-looking statements. These include
Park Hotels & Resorts Inc. (Exact name of registrant as specified in its charter)
") UNITED STATES SECURITIES AND EXCHANGE COMMISSION Washington, D.C. 20549 FORM 10-Q (Mark One) QUARTERLY REPORT PURSUANT TO SECTION 13 OR 15(d) OF THE SECURITIES EXCHANGE ACT OF 1934 For the quarterly period
UNITED STATES SECURITIES AND EXCHANGE COMMISSION Washington, D.C. 20549 FORM 10-Q (Mark One) QUARTERLY REPORT PURSUANT TO SECTION 13 OR 15(d) OF THE SECURITIES EXCHANGE ACT OF 1934 For the quarterly period
FOR IMMEDIATE RELEASE
 FOR IMMEDIATE RELEASE STRATEGIC STORAGE TRUST, INC. REPORTS THIRD QUARTER 2013 RESULTS - SAME-STORE REVENUES INCREASED 9.4% - SAME-STORE NOI INCREASED 16.1% LADERA RANCH, CA November 15, 2013 Strategic
Clipper Realty Inc. SUPPLEMENTAL DATA. Fourth Quarter 2018
 Clipper Realty Inc. SUPPLEMENTAL DATA Fourth Quarter 2018 1 Clipper Realty Inc. Announces Fourth Quarter and Full-Year 2018 Results Reports Record Annual Revenues, Record Annual Income from Operations
LASALLE HOTEL PROPERTIES REPORTS FOURTH QUARTER 2017 RESULTS Key West is Open for Business
 News Release LASALLE HOTEL PROPERTIES REPORTS FOURTH QUARTER 2017 RESULTS Key West is Open for Business BETHESDA, MD, February 20, 2018 -- LaSalle Hotel Properties (NYSE: LHO) today announced results for
HIT REIT Quarterly Investor Presentation April 26, American Realty Capital Hospitality Trust, Inc.
 HIT REIT Quarterly Investor Presentation April 26, 2018 American Realty Capital Hospitality Trust, Inc. Risk Factors Risk Factors Investing in our common stock involves a degree of risk. See the section
OMEGA HEALTHCARE INVESTORS, INC. FUNDS FROM OPERATIONS Unaudited (In thousands, except per share amounts)
") FUNDS FROM OPERATIONS (In thousands, except per share amounts) Net income available to common stockholders. $ 15,565 Deduct gain from real estate dispositions.. (9) Sub-total... $ 15,556 Elimination of
FUNDS FROM OPERATIONS (In thousands, except per share amounts) Net income available to common stockholders. $ 15,565 Deduct gain from real estate dispositions.. (9) Sub-total... $ 15,556 Elimination of
GGP REPORTS SECOND QUARTER 2016 RESULTS AND RAISES DIVIDEND 11%
 GGP REPORTS SECOND QUARTER 2016 RESULTS AND RAISES DIVIDEND 11% Chicago, Illinois, August 1, 2016 - General Growth Properties, Inc. (the Company or GGP ) (NYSE: GGP) today reported results for the three
SIMON PROPERTY GROUP EARNINGS RELEASE & SUPPLEMENTAL INFORMATION UNAUDITED FOURTH QUARTER JAN
 SIMON PROPERTY GROUP EARNINGS RELEASE & SUPPLEMENTAL INFORMATION UNAUDITED FOURTH QUARTER 2015 21JAN201601070563 TABLE OF CONTENTS EARNINGS RELEASE AND SUPPLEMENTAL INFORMATION FOR THE QUARTER ENDED DECEMBER
ASHFORD REPORTS FOURTH QUARTER 2015 RESULTS
 NEWS RELEASE Contact: Deric Eubanks Jordan Jennings Stacy Feit Chief Financial Officer Investor Relations Financial Relations Board (972) 490-9600 (972) 778-9487 (213) 486-6549 ASHFORD REPORTS FOURTH QUARTER
View printer-friendly version << Back
 1 of 8 22/04/2014 15:17 Print Page Close Window Press Release View printer-friendly version
OMEGA HEALTHCARE INVESTORS, INC. FUNDS FROM OPERATIONS Unaudited (In thousands, except per share amounts)
") FUNDS FROM OPERATIONS (In thousands, except per share amounts) Net income available to common stockholders... $ 55,829 Deduct gain from real estate dispositions... (2,883) Sub-total... $ 52,946 Elimination
FUNDS FROM OPERATIONS (In thousands, except per share amounts) Net income available to common stockholders... $ 55,829 Deduct gain from real estate dispositions... (2,883) Sub-total... $ 52,946 Elimination
PS Business Parks, Inc. Reports Results for the Quarter Ended December 31, 2016 and Increases Quarterly Common Dividend by 13.3% to $0.
 News Release PS Business Parks, Inc. 701 Western Avenue Glendale, CA 91201-2349 psbusinessparks.com For Release: Immediately Date: February 21, 2017 Contact: Edward A. Stokx (818) 244-8080, Ext. 1649 PS
Hospitality Properties Trust Investor Presentation September 2017
 Sonesta ES Suites Princeton, Princeton, NJ Operator: Sonesta International Hotels Corp. Guest Rooms: 124 Investor Presentation September 2017 Disclaimer. THIS PRESENTATION CONTAINS STATEMENTS THAT CONSTITUTE
STARWOOD REPORTS SECOND QUARTER 2012 RESULTS
 Investor Contact Stephen Pettibone 203-351-3500 Media Contact KC Kavanagh 866-478-2777 One StarPoint Stamford, CT 06902 United States STARWOOD REPORTS SECOND QUARTER 2012 RESULTS STAMFORD, Conn. (July
STARWOOD REPORTS THIRD QUARTER 2011 RESULTS
 CONTACT: Jason Koval (914) 640-4429 FOR IMMEDIATE RELEASE October 27, 2011 STARWOOD REPORTS THIRD QUARTER 2011 RESULTS WHITE PLAINS, NY, October 27, 2011 Starwood Hotels & Resorts Worldwide, Inc. (NYSE:
STARWOOD REPORTS FOURTH QUARTER 2014 RESULTS AND DECLARES FIRST QUARTER DIVIDEND OF $0.375 PER SHARE
 Investor Contact Stephen Pettibone 203-351-3500 Media Contact KC Kavanagh 866-478-2777 One StarPoint Stamford, CT 06902 United States STARWOOD REPORTS FOURTH QUARTER 2014 RESULTS AND DECLARES FIRST QUARTER
Simon Property Group Reports Fourth Quarter and Full Year Results, Announces All-Cash Quarterly Dividend and Provides 2010 Guidance
 1 sur 13 05/02/2010 15:04 Simon Property Group Reports Fourth Quarter and Full Year Results, Announces All-Cash Quarterly Dividend and Provides 2010 Guidance INDIANAPOLIS, Feb 05, 2010 /PRNewswire via
OMEGA HEALTHCARE INVESTORS, INC. FUNDS FROM OPERATIONS Unaudited (In thousands, except per share amounts)
") FUNDS FROM OPERATIONS (In thousands, except per share amounts) Net income available to common stockholders. $ 14,641 Elimination of non-cash items included in net income: Depreciation and amortization...
FUNDS FROM OPERATIONS (In thousands, except per share amounts) Net income available to common stockholders. $ 14,641 Elimination of non-cash items included in net income: Depreciation and amortization...
ASHFORD TRUST REPORTS FOURTH QUARTER AND YEAR END 2014 RESULTS
 NEWS RELEASE Contact: Deric Eubanks Elise Chittick Scott Eckstein Chief Financial Officer Investor Relations Financial Relations Board (972) 490-9600 (972) 778-9487 (212) 827-3766 ASHFORD TRUST REPORTS
RLH Corporation Reports Fourth Quarter 2017 Results
 RLH Corporation Reports Fourth Quarter 2017 Results March 28, 2018 DENVER, March 28, 2018 (GLOBE NEWSWIRE) -- Red Lion Hotels Corporation (the Company ) (NYSE:RLH), a growing hospitality company doing
ASHFORD TRUST REPORTS THIRD QUARTER 2018 RESULTS
 NEWS RELEASE Contact: Deric Eubanks Jordan Jennings Joe Calabrese Chief Financial Officer Investor Relations Financial Relations Board (972) 490-9600 (972) 778-9487 (212) 827-3772 ASHFORD TRUST REPORTS
Starwood Waypoint Residential Trust ( SWAY )
") Fourth Quarter 2014 Supplemental Operating & Financial Data Starwood Waypoint Residential Trust ( SWAY ) acquires, renovates, leases, maintains and manages single family homes. We also invest in non-performing
Fourth Quarter 2014 Supplemental Operating & Financial Data Starwood Waypoint Residential Trust ( SWAY ) acquires, renovates, leases, maintains and manages single family homes. We also invest in non-performing
Chateau on the Lake Resort and Convention Center. Branson, Missouri. Embassy Suites Montgomery Hotel and Conference Center. Montgomery, Alabama
 J O H N Q. H A M M O N S H O T E L S, I N C. 2 0 0 3 A n n u a l R e p o r t Chateau on the Lake Resort and Convention Center Branson, Missouri Embassy Suites Montgomery Hotel and Conference Center Montgomery,
STARWOOD REPORTS RECORD SECOND QUARTER 2005 RESULTS. WHITE PLAINS, NY, July 26, 2005 Starwood Hotels & Resorts Worldwide, Inc.
 CONTACT: Alisa Rosenberg (914) 640-5214 FOR IMMEDIATE RELEASE July 26, 2005 STARWOOD REPORTS RECORD SECOND QUARTER 2005 RESULTS WHITE PLAINS, NY, July 26, 2005 Starwood Hotels & Resorts Worldwide, Inc.
OMEGA HEALTHCARE INVESTORS, INC. FUNDS FROM OPERATIONS Unaudited (In thousands, except per share amounts)
") OMEGA HEALTHCARE INVESTORS, INC. FUNDS FROM OPERATIONS (In thousands, except per share amounts) Net income... $ 68,157 Add back loss from real estate dispositions... 622 Sub-total... $ 68,779 Elimination
OMEGA HEALTHCARE INVESTORS, INC. FUNDS FROM OPERATIONS (In thousands, except per share amounts) Net income... $ 68,157 Add back loss from real estate dispositions... 622 Sub-total... $ 68,779 Elimination
Results for the Quarter
 Simon Property Group Reports Second Quarter Results And Announces Quarterly Dividend INDIANAPOLIS, July 29, 2013 /PRNewswire-FirstCall/ -- Simon Property Group, Inc. (NYSE:SPG) today reported results for
First Quarter 2017 Earnings Release and Supplemental Financial Information
 First Quarter 2017 Earnings Release and Supplemental Financial Information View from Harbor Steps Seattle, WA Investor Relations Contact: Mr. Marty McKenna InvestorRelations@eqr.com (312) 474-1300 Two
News Release. PS Business Parks, Inc. 701 Western Avenue Glendale, CA
 News Release PS Business Parks, Inc. 701 Western Avenue Glendale, CA 91201-2349 www.psbusinessparks.com For Release: Immediately Date: February 25, 2008 Contact: Edward A. Stokx (818) 244-8080, Ext. 1649
S U N S T O N E H O T E L I N V E S T O R S, I N C. Company Presentation. March 2013
 Company Presentation March 2013 Forward-Looking Statements This presentation contains forward-looking statements that have been made pursuant to the provisions of the Private Securities Litigation Reform
Annual Report istar Financial
 Annual Report 2014 istar Financial At istar, we seek the white space beyond commodity capital. After 20 years in the business, we ve had success, learned from our challenges and remain resilient, opportunistic
GGP REPORTS FOURTH QUARTER 2017 RESULTS AND DECLARES FIRST QUARTER DIVIDEND
 GGP REPORTS FOURTH QUARTER 2017 RESULTS AND DECLARES FIRST QUARTER DIVIDEND Chicago, Illinois, February 7, 2018 - GGP Inc. (the Company or GGP ) (NYSE: GGP) today reported results for the three and twelve
STARWOOD REPORTS SECOND QUARTER 2001 EPS OF $0.55
 CONTACT: Dan Gibson (914) 640-8175 FOR IMMEDIATE RELEASE July 26, 2001 STARWOOD REPORTS SECOND QUARTER 2001 EPS OF $0.55 WHITE PLAINS, NY, JULY 26, 2001 Starwood Hotels & Resorts Worldwide, Inc. (NYSE:
MANAGEMENT S DISCUSSION AND ANALYSIS FOR THE THREE MONTHS AND YEAR ENDED DECEMBER 31, 2011
 MANAGEMENT S DISCUSSION AND ANALYSIS FOR THE THREE MONTHS AND YEAR ENDED DECEMBER 31, 2011 As at March 14, 2012 Introduction The following management s discussion and analysis ( MD&A ) is a discussion
Extended Stay America Announces Fourth Quarter and Full Year 2016 Results
 Extended Stay America Announces Fourth Quarter and Full Year 2016 Results March 1, 2017 - Net Income of $30.1 million and $163.4 million in the Fourth Quarter and Full Year, Respectively - Comparable Hotel
SIMON PROPERTY GROUP EARNINGS RELEASE & SUPPLEMENTAL INFORMATION UNAUDITED FIRST QUARTER Q 2014 SUPPLEMENTAL 18APR
 SIMON PROPERTY GROUP EARNINGS RELEASE & SUPPLEMENTAL INFORMATION UNAUDITED FIRST QUARTER 2014 1Q 2014 SUPPLEMENTAL 18APR201417435902 TABLE OF CONTENTS EARNINGS RELEASE AND SUPPLEMENTAL INFORMATION FOR
Interstate Hotels & Resorts 2002 Annual Report
 Interstate Hotels & Resorts 2002 Annual Report Interstate Hotels & Resorts, Inc. Chairman s Letter Paul W. Whetsell Chairman and Chief Executive Officer Interstate Hotels & Resorts Interstate Hotels &
HYATT REPORTS SECOND QUARTER 2010 RESULTS
 CONTACT Investors: Atish Shah Hyatt Hotels Corporation 312-780-5427 atish.shah@hyatt.com Media: Farley Kern Hyatt Hotels Corporation 312-780-5506 farley.kern@hyatt.com FOR IMMEDIATE RELEASE HYATT REPORTS
Media Contact: Damon Elder (949) FOR IMMEDIATE RELEASE
 FOR IMMEDIATE RELEASE") Media Contact: Damon Elder delder@ahinvestors.com (949) 270-9207 FOR IMMEDIATE RELEASE Griffin- American Healthcare REIT II Reports Fourth Quarter and Year End 2012 Results Portfolio triples in size to
Media Contact: Damon Elder delder@ahinvestors.com (949) 270-9207 FOR IMMEDIATE RELEASE Griffin- American Healthcare REIT II Reports Fourth Quarter and Year End 2012 Results Portfolio triples in size to