ARRIVED FelCor Lodging Trust Incorporated 2007 Annual Report
|
|
|
- Linda Kennedy
- 6 years ago
- Views:
Transcription

1 We ve ARRIVED FelCor Lodging Trust Incorporated 2007 Annual Report
2 WELCOME. We ve arrived. It s a powerful feeling when goals are accomplished. After a year of hard work completing renovations, progressing with redevelopment projects and lowering debt, we are reaping the rewards. During 2007, our same-store Funds From Operations ( FFO ) grew 25 percent compared to the prior year, and we increased the common stock dividend not once, but twice. Thanks to the dedicated efforts of our team, we made incredible progress during 2007: Disposed of our remaining non-strategic hotels, exceeding expectations for both proceeds and timing Finished our $400 million debt reduction program, which significantly lowered leverage Completed renovations at 75 of our 83 hotels through March 2008 Began work on several redevelopment projects, three of which will be finished during the first part of 2008 Completed our fourth condominium project at our resort in Myrtle Beach Improved our line of credit with an extended maturity date, increased availability and a lower interest rate Acquired two upper-upscale, resort hotels, marking our first major acquisition in almost ten years Over the course of 2008, we expect to complete all remaining renovations and continue to pursue our remaining redevelopment projects. As a result of these initiatives, we expect our RevPAR (Revenue Per Available Room) to increase well above the industry average in 2008, and we anticipate exceptional growth over the next few years. We ve arrived at a new destination and this is only the beginning. We have made great strides, and by seeking opportunities to further enhance the quality of our portfolio and improve operations through asset management, we will go much further.
3

4

5 INSIDE our newly renovated PORTFOLIO
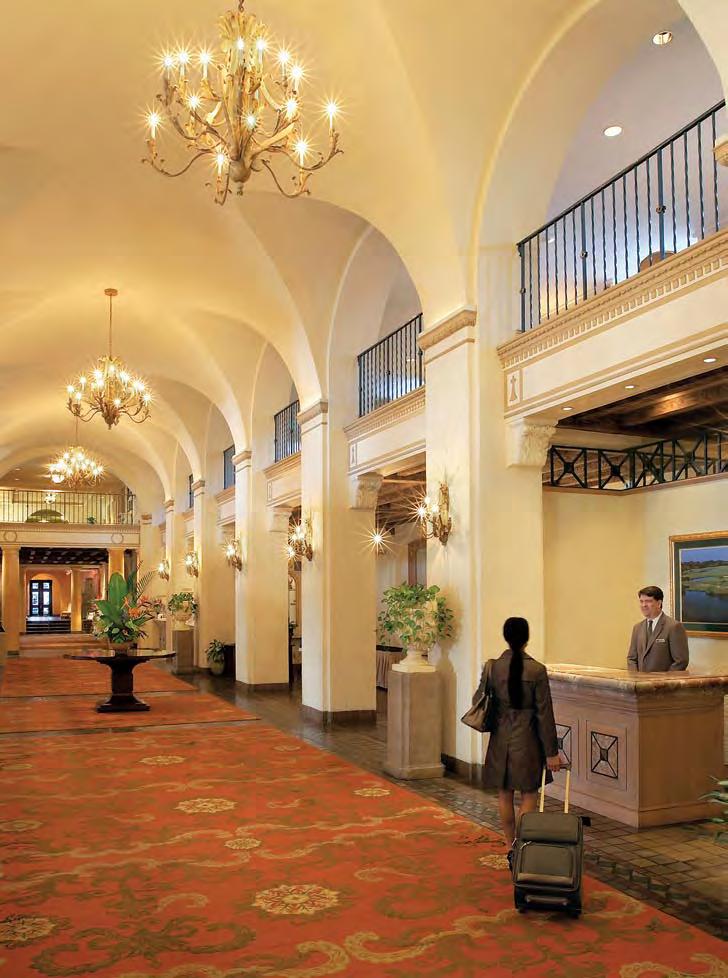
6 4 Comprehensive Upgrades O ur renovation program spans all 83 of our properties, and most of our work is done. We are over the hump and back to a typical renovation schedule. Through March 2008, we finished renovations at 75 hotels and work on the remaining hotels was underway and will be complete by the end of We are very pleased with the quality of the finished product and the results. We are spending almost $450 million on our renovation program to improve the quality of all our hotels. The level of renovation work we undertook in 2007 was unprecedented, and the vast majority of projects were finished on time and within budget. Despite a few unforeseen issues that caused a change in scope, we remained within $15 million of our original aggregate budget. Typical improvements touch every area of a hotel, including guest rooms and baths, corridors, meeting space, public areas, restaurants, lobbies and exteriors. Almost 70 percent of expenditures focus on guest impact items (such as updated bathrooms and new furniture in guest rooms), allowing us to increase average daily rate ( ADR ), which translates into higher RevPAR growth. Items such as mechanical systems, infrastructure and roofing comprise the remaining portion of the money being spent. We expect to earn a return of 12 percent on the guest impact portion of invested capital through increases in RevPAR and growth in market share. For our hotels where renovations have been finished, aggregate RevPAR growth has met our targets and we expect this performance to continue in For 2007, RevPAR for our eight hotels where renovations had been completed by December 2006 increased almost 18 percent, compared to In the fourth quarter of 2007, RevPAR at our 49 hotels where renovations had been finished for at least a full quarter grew nearly 14 percent, compared to the prior year period. During 2007, 68 of our hotels were undergoing some form of renovation. As a result, our portfolio experienced significant disruption, as approximately 450,000 room nights (more than 5.5 percent of our total) were out of service. This disruption negatively affected our RevPAR growth in For 2008, we expect to have significantly fewer room nights (less than one percent of our total) out of service. As disruption subsides and we earn returns from these investments, we believe our RevPAR growth will be significantly higher than the industry average in It s been a journey of transformation and with our improved portfolio, we re ready to take the next steps. 07 Annual Report

, which translates into higher RevPAR growth.")
7 5 A typical renovation touches every area of a hotel, including guest rooms and baths, corridors, meeting space, public areas, restaurants, lobbies and exteriors. Almost 70 percent of these improvements focus on guest impact items, allowing us to increase average daily rate ( ADR ), which translates into higher RevPAR growth. 07 Annual Report

8 revitalized by redevelopment

9
.")

10 8 As an example of one of our redevelopment projects, we maximized the use of excess land at our resort in Myrtle Beach (above). A 35,000-square-foot convention center, which is adjacent to our resort, opened in January Additionally, we recently completed the construction of the Royale Palms condominium tower next to our property. 07 Annual Report
11 9 Discovering Opportunities W e ve revealed hidden potential at many of our properties, and are making excellent progress on our redevelopment projects. By adding guest rooms and meeting space, building spas, rebranding hotels and seeking out other opportunities, we can enhance the profitability of our hotels. We have already announced or completed four such projects: A 35,000-square-foot convention center built adjacent to our Hilton Myrtle Beach Resort, opened in January 2008; Spa addition at our Embassy Suites Hotel Deerfield Beach Resort, opened in February 2008 Additional meeting space at our Doubletree Guest Suites Doheny Beach will be finished in April 2008 Redevelopment and rebranding of our San Francisco Union Square hotel to a Marriott, by early 2009 We are currently in various stages of planning and entitlement on our remaining projects. As part of our asset management approach, we are also searching for other value-added enhancements, such as new restaurant concepts and maximizing the use of public areas. For example, we recently opened a Ruth s Chris Steak House at our Embassy Suites Hotel in Atlanta-Buckhead and are converting unused space to meeting rooms at our Embassy Suites Hotel in Ft. Lauderdale. We have been successful in maximizing the use of our land at our resort complex in Myrtle Beach. In April 2007, we completed the construction of the Royale Palms condominium tower, located next to our resort in Myrtle Beach. We recognized a gain of approximately $19 million from the sale of those condominiums, which exceeded our expectations by $1 million. We are also implementing green practices, including water conservation, improved energy efficiency and waste reduction. These are environmentally friendly and also reduce operating costs. We are currently installing energy-efficient lighting throughout our entire portfolio, which typically generates a payback on our investment in less than one year. Our green efforts have also been recognized by multiple agencies. For example, the Florida Department of Environmental Protection certified all of our hotels in Orlando and the Renaissance Vinoy Resort in Tampa as Florida Green Lodges. We ve expanded avenues for internal growth, and we will continue to explore new ways to enhance our hotels. 07 Annual Report
12

13 Reaching new heights with an UPPER-UPSCALE focus
14 12 On the Horizon In December 2007, we purchased two hotels: the Renaissance Esmeralda Resort & Spa in Indian Wells, California and the Renaissance Vinoy Resort & Golf Club in St. Petersburg, Florida. These properties embody our strategy of owning upper-upscale hotels in markets with high barriers to entry. These are our first Renaissance-branded properties, and prior to these acquisitions, we had only one Marriott-managed hotel. We also will use our core competencies to further enhance the EBITDA growth and return on investment at these hotels through various redevelopment opportunities. It s time to embark on the next phase of our journey. What s on the horizon? It is important for us to stay on course and continue to execute our strategic plan, which is to continue to enhance the quality of our portfolio and seek opportunities to further diversify our portfolio by market, customer and brand, with the goal of enhancing our future EBITDA growth and improving our return on invested capital. Given current market conditions and uncertain near-term economic growth, we are committed to preserving our capital so that we can take advantage of opportunities at the appropriate time. Should demand growth moderate, we are well-positioned to weather a downturn. The renovation of our hotels, and the contingency plans that are in place, give our hotels the tools they need to perform well. Our balance sheet is flexible and we have sufficient capacity under our line of credit. Going forward, we will evaluate future asset sales and the appropriate use of those proceeds. We will also continue to be very disciplined in our approach to future acquisitions. We are looking forward to completing our initiatives and are excited about The people of FelCor have worked tremendously hard over the past year. Their commitment to FelCor and our community is limitless; our team is a source of great pride for both of us. Without their commitment, FelCor would be a vastly different place less exciting, fun and rewarding. We ve arrived. And we re right where we want to be. 07 Annual Report
 and the")

15 13 The upper-upscale properties we recently purchased, the Renaissance Esmeralda (pictured above) and the Renaissance Vinoy, represent the type of high-quality assets we will seek to acquire in the future. 07 Annual Report


16 14 Rick Smith President and CEO Tom Corcoran Chairman of the Board 07 Annual Report
17 15 Performance Summary Adjusted FFO per share Common dividend per share Hotel EBITDA per room (IN THOUSANDS) Actual RevPAR and ADR Adjusted FFO per share and Hotel EBITDA per room are non-gaap financial measures. A detailed reconciliation and further discussion of these measures are contained in the Non-GAAP Financial Measures section of Management s Discussion and Analysis of Financial Condition and Results of Operations in this 2007 annual report to stockholders. Hotel EBITDA per room, RevPAR and ADR are shown as historically reported. 07 Annual Report
18 16 FelCor Lodging Trust Incorporated Portfolio ALABAMA birmingham Embassy Suites Birmingham ARIZONA phoenix Embassy Suites Phoenix-Biltmore Embassy Suites Tempe Sheraton Crescent Hotel Phoenix CALIFORNIA anaheim Embassy Suites Anaheim-Disneyland Area dana point Doubletree Guest Suites Doheny Beach indian wells Renaissance Esmeralda Resort & Spa los angeles Embassy Suites El Segundo- International Airport South milpitas Embassy Suites Milpitas-Silicon Valley napa Embassy Suites Napa Valley oxnard Embassy Suites Mandalay Beach Resort & Conference Center san diego Holiday Inn San Diego-On the Bay san francisco Hotel 480-Union Square Embassy Suites San Francisco-Airport/Burlingame Embassy Suites San Francisco Airport/South San Francisco Holiday Inn San Francisco-Fisherman s Wharf san rafael Embassy Suites San Rafael- Marin County Conference Center santa barbara Holiday Inn Santa Barbara-Goleta santa monica Holiday Inn Santa Monica-Beach at the Pier DELAWARE wilmington Doubletree Wilmington FLORIDA boca raton Embassy Suites Boca Raton cocoa beach Holiday Inn Cocoa Beach-Oceanfront deerfield beach Embassy Suites Deerfield Beach-Resort & Spa ft. lauderdale Embassy Suites Ft. Lauderdale-17 th Street Sheraton Suites Ft. Lauderdale-Cypress Creek jacksonville Embassy Suites Jacksonville-Bay Meadows miami Embassy Suites Miami-International Airport orlando Doubletree Guest Suites Walt Disney World Resort Embassy Suites Orlando-International Drive South/Convention Embassy Suites Orlando-North Holiday Inn Orlando- International Drive Resort Holiday Inn Select Orlando- International Airport st. petersburg Renaissance Vinoy Resort & Golf Club tampa Doubletree Guest Suites Tampa Bay GEORGIA atlanta Embassy Suites Atlanta-Airport Embassy Suites Atlanta-Buckhead Embassy Suites Atlanta-Perimeter Center Sheraton Gateway Atlanta-Airport Sheraton Suites Atlanta-Galleria ILLINOIS chicago Embassy Suites Chicago-Lombard/Oak Brook Embassy Suites Chicago-North Shore/Deerfield Sheraton Gateway Suites Chicago-O Hare Airport INDIANA indianapolis Embassy Suites Indianapolis-North KANSAS kansas city Embassy Suites Kansas City/ Overland Park KENTUCKY lexington Hilton Suites Lexington Green LOUISIANA baton rouge Embassy Suites Baton Rouge new orleans Embassy Suites New Orleans Holiday Inn New Orleans- Chateau LeMoyne French Quarter Holiday Inn New Orleans-French Quarter MARYLAND baltimore Embassy Suites Baltimore at BWI Airport MASSACHUSETTS boston Embassy Suites Boston/Marlborough Holiday Inn Select Boston-Beacon Hill MINNESOTA minneapolis Embassy Suites Bloomington Embassy Suites Minneapolis-Airport st. paul Embassy Suites St. Paul-Downtown MISSOURI kansas city Embassy Suites Kansas City-Plaza NEW JERSEY parsippany Embassy Suites Parsippany piscataway Embassy Suites Piscataway-Somerset secaucus Embassy Suites Secaucus-Meadowlands NORTH CAROLINA charlotte Doubletree Guest Suites Charlotte-SouthPark Embassy Suites Charlotte raleigh Doubletree Guest Suites Raleigh/Durham Embassy Suites Raleigh-Crabtree PENNSYLVANIA philadelphia Holiday Inn Philadelphia-Historic District Sheraton Philadelphia-Society Hill pittsburgh Holiday Inn Select Pittsburgh at University Center (Oakland) SOUTH CAROLINA charleston Holiday Inn Charleston- Mills House (Historic Downtown) myrtle beach Embassy Suites Myrtle Beach-Oceanfront Resort Hilton Myrtle Beach Resort TENNESSEE nashville Embassy Suites Nashville-Airport-Opryland Area Holiday Inn Select Nashville-Opryland-Airport (Briley Parkway) TEXAS austin Doubletree Guest Suites Austin Embassy Suites Austin-Central corpus christi Embassy Suites Corpus Christi dallas Embassy Suites Dallas- DFW International Airport South Embassy Suites Dallas-Love Field Embassy Suites Dallas-Market Center Westin Dallas-Park Central houston Holiday Inn Hotel & Suites Houston-Medical Center san antonio Embassy Suites San Antonio-International Airport Embassy Suites San Antonio-Northwest/I-10 Holiday Inn Select San Antonio-International Airport VERMONT burlington Sheraton Burlington Hotel & Conference Center VIRGINIA vienna Sheraton Premiere at Tysons Corner CANADA toronto Holiday Inn Toronto-Yorkdale Holiday Inn Select Toronto-Airport reservations: Doubletree Guest Suites & Hotels TREE Embassy Suites Hotels EMBASSY Hilton HILTONS Renaissance Marriott Sheraton Westin WESTIN1 Holiday Inn HOLIDAY Hotel Annual Report
19 Table of Contents SELECTED FINANCIAL DATA 2 MANAGEMENT S DISCUSSION AND ANALYSIS OF FINANCIAL CONDITION AND RESULTS OF OPERATIONS 4 QUANTITATIVE AND QUALITATIVE DISCLOSURES ABOUT MARKET RISKS 25 MANAGEMENT S REPORT ON INTERNAL CONTROL OVER FINANCIAL REPORTING 27 REPORT OF INDEPENDENT REGISTERED PUBLIC ACCOUNTING FIRM 28 CONSOLIDATED BALANCE SHEETS 29 CONSOLIDATED STATEMENTS OF OPERATIONS 30 CONSOLIDATED STATEMENTS OF COMPREHENSIVE INCOME (LOSS) 31 CONSOLIDATED STATEMENTS OF STOCKHOLDERS EQUITY 32 CONSOLIDATED STATEMENTS OF CASH FLOWS 33 NOTES TO CONSOLIDATED FINANCIAL STATEMENTS 34 STOCK INFORMATION 58
20 Selected Financial Data The following tables set forth selected financial data for us for the years ended December 31, 2007, 2006, 2005, 2004 and 2003, that has been derived from our audited financial statements and the notes thereto. This data should be read in conjunction with Management's Discussion and Analysis of Financial Condition and Results of Operations, and the consolidated financial statements and notes thereto, appearing elsewhere in this 2007 annual report to stockholders. SELECTED FINANCIAL DATA (in thousands, except per share data) Year Ended December 31, Statement of Operations Data: (1) Total revenues...$ 1,021,884 $ 991,038 $ 914,655 $ 842,612 $ 786,883 Income (loss) from continuing operations (2)... 55,693 8,565 (16,916 ) (78,376 ) (73,564 ) Diluted earnings per share: Net income (loss) from continuing operations applicable to common stockholders...$ 0.27 $ (0.50 ) $ (1.06 ) $ (1.92 ) $ (1.71 ) Other Data: Cash distributions declared per common share (3)...$ 1.20 $ 0.80 $ 0.15 $ - $ - Funds From Operations (4) ,919 93,451 (191,139 ) (30,608 ) (207,462 ) EBITDA (4) , ,460 12, ,950 (532 ) Cash flows provided by operating activities , , ,482 33,281 52,914 Balance Sheet Data (at end of period): Total assets...$ 2,683,835 $ 2,583,249 $ 2,920,263 $ 3,318,191 $ 3,590,893 Total debt, net of discount... 1,475,607 1,369,153 1,675,280 1,767,122 2,037,355 (1) All years presented have been adjusted to reflect sold hotels as discontinued operations. (2) Included in income (loss) from continuing operations are the following amounts (in thousands): Year Ended December 31, Charge-off of deferred debt costs...$ - $ (3,562 ) $ (1,448 ) $ (6,960 ) $ (2,834 ) Loss on early extinguishment of debt... - (12,471 ) (4,037 ) (44,216 ) - Abandoned projects... (22 ) (33 ) (265 ) - - Gain on swap termination ,715-1,005 - Gain (loss) on sale of assets... - (92 ) Gain on sale of condominiums... 18, (3) Commencing with the fourth quarter 2005, we reinstituted a common dividend. We had declared a quarterly common dividend on our common stock from our inception through 2002, but as a result of the uncertain geopolitical environment and soft business climate, together with the decline in Hotel EBITDA margins resulting from continued declines in our portfolio s average daily rate, our board of directors suspended the payment of dividends on our common stock in 2003 and We have, however, continued to pay the full accrued dividends on our outstanding preferred stock. (4) A more detailed description and computation of FFO and EBITDA is contained in the Non-GAAP Financial Measures section of Management s Discussion and Analysis of Financial Condition and Results of Operations. 2
21 Consistent with SEC guidance, FFO has not been adjusted for the following amounts included in net income (loss) (in thousands): Year Ended December 31, Impairment loss, net of minority interests... $ - $ (15,547 ) $ (257,775 ) $ (38,289 ) $ (243,739 ) Charges related to debt extinguishment, net of minority interests... (811 ) (17,472 ) (11,300 ) (51,176 ) (1,223 ) Gain on swap termination ,715-1,005 - Conversion costs... (491 ) Asset disposition costs (1,300 ) (4,900 ) - Abandoned projects... (22 ) (112 ) (265 ) - - Issuance costs of redeemed preferred stock (6,522 ) - - Consistent with SEC guidance, EBITDA has not been adjusted for the following amounts included in net income (loss) (in thousands): Year Ended December 31, Impairment loss, net of minority interests... $ - $ (15,547 ) $ (257,775 ) $ (38,289 ) $ (243,739 ) Charges related to debt extinguishment, net of minority interests... (811 ) (17,472 ) (11,300 ) (51,176 ) (1,223 ) Gain on swap termination ,715-1,005 - Asset disposition costs (1,300 ) (4,900 ) - Abandoned projects... (22 ) (112 ) (265 ) - - Gain on sale of hotels, net of income tax and minority interests... 27,330 40,650 12,124 19,422 2,668 Gain on sale of hotels in unconsolidated entities... 10,
22 Management s Discussion and Analysis of Financial Condition and Results of Operations General In 2006, we embarked on a $440 million renovation program at our 83 hotels (excluding the two hotels acquired in December 2007), designed to improve the quality, returns on investment and competitive position of these hotels. Through December 31, 2007, we completed renovations at 61 of these hotels (53 of which were completed in 2007). We currently expect to complete renovations at 13 additional hotels by March 31, 2008, and we expect to complete the remaining renovations by year-end In 2007, 68 of these hotels were undergoing some form of renovation taking rooms out of service and creating disruption at these hotels. Despite renovation related disruptions in 2007, we experienced 3.3% growth in revenue per available room, or RevPAR, compared to We had completed renovations in 49 hotels by the end of the third quarter RevPAR in the fourth quarter 2007 at those hotels increased 13.9% compared to the same period in prior year, indicating positive impact on RevPAR from these renovations. We believe that our renovated hotels will continue to perform better than the industry average and expect out hotel RevPAR growth to accelerate significantly in In 2007, we sold 11 consolidated hotels thereby completing the disposition of non-strategic hotels that we originally identified in Through the course of this disposition program, we sold 45 consolidated hotels for aggregate gross proceeds of $720 million and used the proceeds to pay-down debt and fund our renovation program. In December 2007, we acquired two upper-upscale resort hotels, the Renaissance Esmeralda Resort & Spa in Indian Wells, California and the Renaissance Vinoy Resort & Golf Club in St. Petersburg, Florida for a total purchase price of $225 million. These acquisitions are consistent with our stated strategy to continue to improve the overall quality and diversity of our hotel portfolio. The hotels meet our criteria of acquiring upperupscale hotels and resorts in markets with high barriers to entry and also allow us to enhance our return on investment through various redevelopment opportunities. In 2007, we completed construction of our 184-unit Royale Palms condominium project in Myrtle Beach, South Carolina. Through December 31, 2007, we have sold 179 units and recognized an aggregate gain of $18.6 million. The majority of these condominiums have entered our rental pool, thereby providing additional ongoing income. At December 31, 2007, we had five remaining condominium units to sell. In 2007, we began the process of rebranding our San Francisco Union Square property as a Marriott hotel. The related renovation will include guest rooms, public areas and building exterior and should be completed by early Marriott took over management of the hotel in December 2007 and is operating this hotel as Hotel 480 Union Square during the renovation period. For 2007, we declared common dividends totaling $1.20 per share. We increased our quarterly dividend twice during 2007, from $0.25 per share to $0.30 per share in the second quarter and then to $0.35 per share for the fourth quarter. 4
23 Financial Comparison (in thousands, except RevPAR, Hotel EBITDA margin and percentage change) Year Ended December 31, % Change % Change RevPAR...$ $ % $ % Hotel EBITDA (1) , , % 252, % Hotel EBITDA margin (1) % 29.5 % (2.4 ) % 27.7 % 6.5 % Income (loss) from continuing operations applicable to common shareholders (2)... 16,980 (30,148 ) % (62,846 ) 52.0 % Funds From Operations ( FFO ) (1)(3) ,919 93, % (191,139 ) % Earnings Before Interest, Taxes, Depreciation and Amortization ( EBITDA ) (1)(4) , , % 12,475 2,308.5 % (1) Included in the Financial Comparison are non-gaap financial measures, including Hotel EBITDA, Hotel EBITDA margin, FFO and EBITDA. Further discussion and a detailed reconciliation of these non-gaap financial measures to our financial statements are found elsewhere in this Management s Discussion and Analysis of Financial Condition and Results of Operations. (2) Included in income (loss) from continuing operations applicable to common shareholders are the following amounts (in thousands): Year Ended December 31, Loss on early extinguishment of debt... $ - $ (12,471 ) $ (4,037 ) Charge-off of deferred debt costs... - (3,562 ) (1,448 ) Abandoned projects... (22 ) (33 ) (265 ) Gain on swap termination ,715 - Gain (loss) on sale of assets... - (92 ) 469 Gain on sale of condominiums... 18, (3) Consistent with SEC guidance on non-gaap financial measures, FFO has not been adjusted for the following amounts included in net income (loss) (in thousands, except per share amounts). Year Ended December 31, Impairment loss, net of minority interests... $ - $ (15,547 ) $ (257,775 ) Charges related to debt extinguishment, net of minority interests... (811 ) (17,472 ) (11,300 ) Gain on swap termination ,715 - Conversion costs... (491 ) - - Asset disposition costs (1,300 ) Abandoned projects... (22 ) (112 ) (265 ) Issuance costs of redeemed preferred stock (6,522 ) 5
24 (4) Consistent with SEC guidance on non-gaap financial measures, EBITDA has not been adjusted for the following amounts included in net income (loss) (in thousands). Year Ended December 31, Impairment loss, net of minority interests... $ - $ (15,547 ) $ (257,775 ) Charges related to debt extinguishment, net of minority interests... (811 ) (17,472 ) (11,300 ) Gain on swap termination ,715 - Asset disposition costs (1,300 ) Abandoned projects... (22 ) (112 ) (265 ) Gain on sale of hotels, net of income tax and minority interests... 27,330 40,650 12,124 Gain on sale of hotels in unconsolidated entities... 10, RevPAR and Hotel Operating Margin In 2007, we had our fourth consecutive year-over-year increase in RevPAR. For the year, RevPAR increased 3.3% from $91.45 to $ The increase in RevPAR was made up of a 6.5% increase in ADR while occupancy dropped 3.0% to 70.4%. We attribute the increase in RevPAR to a strong lodging industry, improved hotel performance following completion of renovation projects in 2006 and 2007 and a concerted effort to change our customer mix to higher ADR business. We expect RevPAR to continue increasing in 2008 and that improvements in both ADR and occupancy will drive RevPAR growth. Increases in ADR generally result in increases in Hotel EBITDA margins. Hotel EBITDA margin at our hotels improved from 27.7% in 2005 to 29.5% in 2006, but 2007 renovation-related disruptions were responsible for reduced RevPAR and caused a 68 basis point decline in our Hotel EBITDA margin to 28.8%, compared to We expect to see improvement in 2008 as ADR continues to be a significant factor in RevPAR improvement and renovation-related disruption decreases. We are focused on working with our brand managers to control expense growth, improve our Hotel EBITDA margins and manage renovation displacement to minimize the impact on Hotel EBITDA margins. Results of Operations Comparison of the Years Ended December 31, 2007 and 2006 For the year ended December 31, 2007, we recorded net income applicable to common stockholders of $50.3 million, compared $12.3 million in We had income from continuing operations of $55.7 million compared to a prior year income from continuing operations of $8.6 million. In 2007, income from continuing operations included an $18.6 million gain from the sale of condominium units at our Royale Palms condominium project in Myrtle Beach, South Carolina. Income from continuing operations in 2006 included an aggregate of $14.3 million of charges related to early retirement of debt. Total revenue from continuing operations increased $30.8 million, or 3.1%, compared to the prior year. The increase in revenue is principally attributed to a 3.3% increase in RevPAR. The increase in RevPAR resulted from a 6.5% increase in ADR, net of a 3.0% drop in occupancy, and represents both industry RevPAR increases in many of our major markets and improvements in our renovated hotels RevPAR. Going into 2008, the lodging industry is generally expecting an increase in both ADR and occupancy. Because our portfolio is largely newly-renovated, we expect to outperform the general market in RevPAR increases. Renovation-related disruption had an adverse effect on our ADR, occupancy and Hotel EBITDA margin in Our Hotel EBITDA margin decreased by 68 basis points compared to
25 For 2007, total operating expenses increased by $42.5 million and increased as a percentage of total revenue from 87.9% to 89.4% compared to Hotel departmental expenses, which consist of rooms expense, food and beverage expense, and other operating departments, increased $9.7 million compared to 2006, and decreased slightly as a percentage of total revenue from 32.3% to 32.2%. Other property operating costs, which consist of general and administrative costs, marketing costs, repairs and maintenance, utilities expense, and other costs, increased by $4.9 million compared to 2006, but decreased as a percentage of total revenue from 27.3% to 26.9%. All of the other property operating costs remained constant or decreased as a percent of total revenue compared to 2006 except for repair and maintenance cost, which increased slightly as a percent of total revenue from 5.3% to 5.4%. Management and franchise fees increased by $2.3 million compared to 2006 but remained constant at 5.2% of total revenue. Taxes, insurance and lease expense increased by $9.2 million compared to 2006 and increased slightly from 11.3% to 11.9% of total revenue. We had increases as a percentage of total revenue in property insurance. Increased property insurance premiums reflect the nationwide trend of increased rates related to catastrophic coverage, but we are currently seeing a softening of property insurance costs. Corporate expenses decreased by $2.6 million compared to 2006 and decreased 32 basis points as a percentage of total revenue. The decrease in corporate expenses is principally attributed to 2006 expenses related to severance costs from executives who left the company in 2006 and a reduction in corporate bonus paid in Depreciation expense increased by $16.2 million compared to 2006, which reflects the significant capital expenditures spent in connection with our renovation program in 2006 and Net interest expense decreased by $18.4 million in 2007 compared to The principal reason for the reduction in interest expense is attributed to reduction in average debt outstanding from $1.4 billion in 2006 to $1.3 billion in 2007 and a 55 basis point decrease in our weighted average interest rate. During 2006, we refinanced $415 million of our senior notes and $138.9 million of our mortgage debt at lower interest rates, and we recognized a full year benefit from this in The early retirement of debt in 2006 resulted in net debt extinguishment costs of $15.6 million, of which $1.3 million was recorded in discontinued operations. The early retirement of debt in 2007 resulted in debt extinguishment costs of $0.9 million, all of which was recorded in discontinued operations. Equity in income from unconsolidated entities was $20.4 million in 2007 compared to $11.5 million in That increase reflects improved RevPAR and a $10.8 million net gain from the sale of two unconsolidated hotels in In 2007, we completed construction of our 184-unit Royale Palms condominium project in Myrtle Beach, South Carolina. Through December 31, 2007, we sold 179 of the units and recognized a gain of $18.6 million. Discontinued operations provided net income of $33.3 million in 2007 compared to $42.5 million in Included in discontinued operations at December 31, 2007 and 2006, are the operating income or loss, direct interest costs and gains on sale related to the 11 hotels sold in 2007 and 31 hotels sold in Gains on sale aggregating $28.0 million and $43.2 million were included in 2007 and 2006 income from discontinued operations, respectively. 7
26 Comparison of the Years Ended December 31, 2006 and 2005 For the year ended December 31, 2006, we recorded net income applicable to common stockholders of $12.3 million, compared to a net loss of $297.5 million in We had income from continuing operations of $8.6 million compared to a prior year loss from continuing operations of $16.9 million. A significant item impacting the current year income from continuing operations was an aggregate of $14.3 million of charges related to the early retirement of debt. Contributing to the 2005 loss from continuing operations were $6.5 million in losses from hurricanes and $5.5 million of charges related to the early retirement of debt. Total revenue from continuing operations increased $76.4 million, or 8.4%, compared to the prior year. The increase in revenue is principally attributed to a 7.8% increase in RevPAR compared to The increase in RevPAR resulted from increases in ADR net of a slight drop in occupancy and represents industry RevPAR increases in most of our major markets. The lodging industry nationwide continues to experience increased demand, but there have been only limited increases in room supply leading to strong improvements in RevPAR in many markets. Our increase in ADR was higher than the overall industry average partly because of our concentrated efforts to change the mix of our business to higher ADR business. Increased ADR typically improves Hotel EBITDA margin because the hotels are receiving more revenue for each guest. In 2006, our Hotel EBITDA margin improved 182 basis points over 2005 largely because of the increased ADR. Total operating expenses increased by $58.4 million but decreased as a percentage of total revenue from 88.9% to 87.9%. Hotel departmental expenses, which consist of rooms expense, food and beverage expense, and other operating departments, increased $16.3 million compared to 2005, but decreased as a percentage of total revenue from 33.2% to 32.3%, largely from improvements in labor costs as a percentage of total revenue. Hotel departmental expenses are directly related to the number of hotel guests and should continue to improve as a percentage of total revenue as rates increase. Other property operating costs, which consist of general and administrative costs, marketing costs, repairs and maintenance, utilities expense, and other costs, increased $14.7 million compared to 2005, but decreased as a percentage of total revenue from 27.9% to 27.3%. All of the other property operating costs remained constant or decreased as a percent of total revenue compared to Management and franchise fees increased $6.0 million compared to 2005 and increased slightly as a percentage of total revenue, from 4.9% to 5.2%. The increase as a percentage of total revenue is related to additional incentive fees earned by our management companies. Taxes, insurance and lease expense increased $7.2 million compared to 2005 but decreased slightly as a percentage of total revenue from 11.5% to 11.3%. We had increases as a percentage of total revenue in percentage lease expense and property insurance, but this was more than offset by decreases as a percentage of total revenue in general liability insurance and property tax expense. Percentage lease expense is computed as a percentage of hotel revenues in excess of a base rent. As revenues increase, percentage rent expense increases at a faster rate. Property insurance reflects the nationwide trend of increases in rates related to catastrophic coverage. Corporate expenses increased by $4.3 million compared to 2005 and increased slightly as a percentage of total revenue. The increase in corporate expenses is attributed to severance costs related to several executives that left the company in 2006 and additional asset management positions related to our modified asset management approach. Depreciation expense increased by $10.1 million compared to The increase in depreciation expense reflects the large capital expenditures spent in 2005 and
27 Net interest expense decreased by $10.8 million in 2006 compared to The principal reason for the reduction in interest expense is attributed to reduction in average debt outstanding during 2006 of $256.7 million, a 26 basis point decrease in our weighted average interest rate and a $3.0 million increase in capitalized interest. During 2006, we refinanced $415 million of senior notes and $138.9 million of mortgage debt at lower interest rates. As the result of the strong economy, its impact on the travel and lodging industry and our lower secured debt levels, Standard & Poor s and Moody s Investor Services upgraded their ratings on our senior debt, resulting in a 50 basis point decrease in the interest rate on $300 million of our senior debt. The increase in capitalized interest is related to the expanded capital renovation program at our hotels and the construction loan on our Royale Palms Condominium development in Myrtle Beach, South Carolina, which we repaid in the second quarter of The early retirement of debt in 2006 resulted in net debt extinguishment costs of $15.6 million, of which $1.3 million was recorded in discontinued operations. In 2005, we recorded $11.3 million in debt extinguishment costs, of which $5.8 million was recorded in discontinued operations. Equity in income from unconsolidated entities was $11.5 million in 2006 compared to $10.2 million in Net income from unconsolidated entities owning hotels increased in 2006 principally related to improvements in RevPAR. Minority interest decreased by $1.8 million compared to 2005, principally resulting from reduction in losses attributed to minority interest holders from improved operations. Discontinued operations provided net income of $42.5 million in 2006 compared to a loss of $234.7 million in Included in discontinued operations at December 31, 2006, are the operating income or loss, direct interest costs and gains on sale related to the 31 hotels sold in 2006, 19 hotels disposed in 2005 and the 11 hotels considered held for sale at December 31, Gains on sale aggregating $43.2 million were included in the 2006 income from discontinued operations. Impairment charges recorded under the provisions of SFAS 144 aggregating $266.8 million are included in the loss from discontinued operations in Non-GAAP Financial Measures We refer in this 2007 annual report to stockholders to certain non-gaap financial measures. These measures, including FFO, Adjusted FFO, EBITDA, Hotel EBITDA, Hotel EBITDA as reported historically and Hotel EBITDA margin, are measures of our financial performance that are not calculated and presented in accordance with generally accepted accounting principles, or GAAP. The following tables reconcile each of these non-gaap measures to the most comparable GAAP financial measure. Immediately following the reconciliations, we include a discussion of why we believe these measures are useful supplemental measures of our performance and of the limitations upon such measures. 9
28 The following tables detail our computation of FFO and Adjusted FFO (in thousands, except for per share data): Reconciliation of Net Income (Loss) to FFO and Adjusted FFO (in thousands, except per share data) Year Ended December 31, Per Share Amount Dollars Shares Per Share Amount Dollars Shares Per Share Amount Dollars Shares Net income (loss)...$ 89,039 $ 51,045 $ (251,615) Preferred dividends... (38,713) (38,713 ) (39,408) Issuance costs of redeemed preferred stock (6,522) Net income (loss) applicable to common stockholders... 50,326 61,897 $ ,332 60,734 $ 0.20 (297,545) 59,436 $ (5.01) Depreciation, continuing operations , , , Depreciation, unconsolidated entities and discontinued operations... 12, , , Gain on sale of hotels, net of income tax and minority interests... (27,330) - (0.44) (40,650 ) - (0.67) (12,124) - (0.20) Gain on sale of hotels in unconsolidated entities... (10,993) - (0.18) Minority interest in FelCor LP.. 1,094 1,354 (0.03) 279 1,864 (0.04) (13,677) 2,778 (0.08) Conversion of options and unvested restricted stock FFO ,919 63, ,451 62, (191,139) 62,214 (3.07) Impairment loss, net of minority interest , , Abandoned projects Charges related to debt extinguishment, net of minority interest , , Gain on swap termination (1,715 ) - (0.03) Conversion costs (a) Asset disposition costs , Issuance costs of redeemed preferred stock , Conversion of options and unvested restricted stock (0.01) Adjusted FFO...$ 137,243 63,251 $ 2.17 $ 124,867 62,925 $ 1.98 $ 86,023 62,861 $ 1.37 (a) These costs relate to the conversion of our Hotel 480 Union Square in San Francisco to a Marriott. The conversion is expected to be complete by early
29 Reconciliation of Net Income (Loss) to FFO and Adjusted FFO (in thousands, except per share data) Year Ended December 31, Per Share Shares Amount Dollars Shares Per Share Amount Dollars Net loss...$ (100,127) $ (310,144 ) Preferred dividends... (35,130) (26,908 ) Net loss applicable to common stockholders... (135,257) 59,045 $ (2.29) (337,052 ) 58,657 $ (5.75) Depreciation, continuing operations... 78, , Depreciation, unconsolidated entities and discontinued operations... 52, , Gain on sale of hotels... (19,422) - (0.33) (2,668 ) - (0.05) Minority interest in FelCor LP... (6,681) 2,939 (0.08) (17,777 ) 3,188 (0.11) FFO... (30,608) 61,984 (0.49) (207,462 ) 61,845 (3.35) Impairment loss, net of minority interest... 38, , Charges related to debt extinguishment, net of minority interest... 51, , Gain on swap termination... (1,005) - (0.02) Asset disposition costs... 4, Conversion of options and unvested restricted stock Adjusted FFO...$ 62,752 62,343 $ 1.01 $ 37,500 62,148 $ 0.60 The following table details our computation of EBITDA (in thousands): Reconciliation of Net Income (Loss) to EBITDA (in thousands) Year Ended December 31, Net income (loss)...$ 89,039 $ 51,045 $ (251,615 ) $ (100,127 ) $ (310,144 ) Depreciation, continuing operations ,751 94,579 84,448 78,116 76,288 Depreciation, unconsolidated entities and discontinued operations... 12,071 26,911 47,759 52,636 73,747 Interest expense... 98, , , , ,327 Interest expense, unconsolidated entities and discontinued operations... 5,987 7,657 16,949 19,189 18,817 Amortization expense... 4,255 5,080 2,904 2,945 2,210 Minority interest in FelCor LP... 1, (13,677 ) (6,681 ) (17,777 ) EBITDA...$ 322,126 $ 300,460 $ 12,475 $ 184,950 $ (532 ) 11
30 Consistent with SEC guidance on non-gaap financial measures, EBITDA has not been adjusted for the following amounts included in net income (loss) (in thousands): Year Ended December 31, Impairment loss, net of minority interests... $ - $ (15,547 ) $ (257,775 ) $ (38,289 ) $ (243,739 ) Charges related to debt extinguishment, net of minority interests... (811) (17,472 ) (11,300 ) (51,176 ) (1,223 ) Gain on swap termination ,715-1,005 - Asset disposition costs (1,300 ) (4,900 ) - Abandoned projects... (22 ) (112 ) (265 ) - - Gain on sale of hotels, net of income tax and minority interests... 27,330 40,650 12,124 19,422 2,668 Gain on sale of hotels in unconsolidated entities... 10, Hotel EBITDA and Hotel EBITDA Margin (dollars in thousands) Year Ended December 31, Continuing Operations Total revenue...$ 1,021,884 $ 991,038 $ 914,655 Retail space rental and other revenue... (3,089 ) (79 ) (1,506 ) Hotel revenue... 1,018, , ,149 Hotel operating expenses... (725,082 ) (698,540 ) (660,339 ) Hotel EBITDA...$ 293,713 $ 292,419 $ 252,810 Hotel EBITDA margin (1) % 29.5 % 27.7 % (1) Hotel EBITDA as a percentage of hotel revenue. 12
31 Hotel Operating Expense Composition (dollars in thousands) Year Ended December 31, Continuing Operations Hotel departmental expenses: Room...$ 204,426 $ 199,283 $ 187,872 Food and beverage ,086 97,012 93,136 Other operating departments... 20,924 23,436 22,446 Other property related costs: Administrative and general... 86,884 87,451 82,607 Marketing and advertising... 84,286 81,113 76,151 Repairs and maintenance... 55,045 52,710 50,011 Energy... 49,002 49,027 46,857 Taxes, insurance and lease expense... 66,921 57,271 56,044 Total departmental and other property related costs , , ,124 Management and franchise fees... 53,508 51,237 45,215 Hotel operating expenses...$ 725,082 $ 698,540 $ 660,339 Reconciliation of total operating expenses to hotel operating expenses: Total operating expenses...$ 913,714 $ 871,241 $ 812,885 Unconsolidated taxes, insurance and lease expense... 7,314 6,273 5,881 Consolidated hotel lease expense... (61,652 ) (61,054 ) (54,689 ) Abandoned projects... (22 ) (33 ) (265 ) Corporate expenses... (20,718 ) (23,308 ) (19,025 ) Depreciation... (110,751 ) (94,579 ) (84,448 ) Other expenses... (2,803 ) - - Hotel operating expenses...$ 725,082 $ 698,540 $ 660,339 Reconciliation of Net Income (Loss) to Hotel EBITDA (in thousands) Year Ended December 31, Net income (loss)...$ 89,039 $ 51,045 $ (251,615 ) Discontinued operations... (33,346 ) (42,480 ) 234,699 Equity in income from unconsolidated entities... (20,357 ) (11,537 ) (10,169 ) Minority interests... (1,033 ) (2,508 ) (4,310 ) Consolidated hotel lease expense... 61,652 61,054 54,689 Unconsolidated taxes, insurance and lease expense... (7,314 ) (6,273 ) (5,881 ) Interest expense, net... 92, , ,668 Hurricane loss ,481 Loss on early extinguishment of debt ,471 4,037 Charge-off of deferred financing costs ,562 1,448 Gain on swap termination... - (1,715 ) - Corporate expenses... 20,718 23,308 19,025 Depreciation ,751 94,579 84,448 Retail space rental and other revenue... (3,089 ) (79 ) (1,506 ) Other expenses... 2, Abandoned projects Gain on sale of condominiums... (18,622 ) - - (Gain) loss on sale of assets (469 ) Hotel EBITDA...$ 293,713 $ 292,419 $ 252,810 13
32 Reconciliation of Ratio of Operating Income to Total Revenues to Hotel EBITDA Margin Year Ended December 31, Ratio of operating income to total revenues % 12.1 % 11.1 % Retail space rental and other revenue... (0.3 ) - (0.2 ) Unconsolidated taxes, insurance and lease expense... (0.7 ) (0.6 ) (0.5 ) Consolidated lease expense Other expenses Corporate expenses Depreciation Hotel EBITDA margin % 29.5 % 27.7 % Reconciliation of Net Income (Loss) to Hotel EBITDA as Reported Historically (a) (in thousands) Year Ended December 31, Net income (loss)...$ 89,039 $ 51,045 $ (251,615 ) Discontinued operations... (33,346 ) (42,480 ) 11,291 Equity in income from unconsolidated entities... (20,357 ) (11,537 ) (10,169 ) Minority interests... (1,033 ) (2,508 ) (23,813 ) Consolidated hotel lease expense... 61,652 61,054 57,004 Unconsolidated taxes, insurance and lease expense... (7,314 ) (6,273 ) (5,673 ) Interest expense, net... 92, , ,954 Impairment loss ,091 Hurricane loss ,481 Charges related to debt extinguishment ,033 14,580 Gain on swap termination... - (1,715 ) - Corporate expenses... 20,718 23,308 19,025 Depreciation ,751 94, ,323 Other expenses... 2, Abandoned projects Loss (gain) on sale of other assets (733 ) Gain on sale of condominiums... (18,622 ) - - Other revenue... (3,089 ) (79 ) (2,049 ) Hotel EBITDA...$ 293,713 $ 292,419 $ 305,380 Number of hotels Number of rooms... 24,081 24,081 36,132 (a) For this presentation, we have used the historically reported Hotel EBITDA at the end of the periods reported. This reflects hotels reported in continuing operations at the end of the historical periods presented and does not reclassify hotels subsequently sold as discontinued operations. To further aid the reader, we have presented the number of hotels that were included in continuing operations and Hotel EBITDA at the end of the historical periods presented. 14
33 Reconciliation of Net Income (Loss) to Hotel EBITDA as Reported Historically (a) (in thousands) Year Ended December 31, Net loss... $ (100,127 ) $ (310,144 ) Discontinued operations... (11,183 ) 13,196 Equity in income from unconsolidated entities... (17,120 ) (2,370 ) Minority interests... (7,928 ) (19,908 ) Consolidated hotel lease expense... 51,261 47,460 Unconsolidated taxes, insurance and lease expense... (6,045 ) (7,141 ) Interest expense, net , ,313 Hurricane loss... 2,125 - Loss on early extinguishment of debt... 44,216 (331 ) Impairment loss... 33, ,584 Charge-off of deferred financing costs... 6,960 2,834 Gain on swap termination... (1,005 ) - Corporate expenses... 17,094 14,266 Depreciation , ,883 Gain on sale of assets... (1,167 ) (284 ) Other revenue... (2,721 ) (1,022 ) Hotel EBITDA... $ 276,597 $ 261,336 Number of hotels Number of rooms... 39,980 44,292 (a) For this presentation, we have used the historically reported Hotel EBITDA at the end of the periods reported. This reflects hotels reported in continuing operations at the end of the historical periods presented and does not reclassify hotels subsequently sold as discontinued operations. To further aid the reader, we have presented the number of hotels that were included in continuing operations and Hotel EBITDA at the end of the historical periods presented. Substantially all of our non-current assets consist of real estate. Historical cost accounting for real estate assets implicitly assumes that the value of real estate assets diminish predictably over time. Since real estate values instead have historically risen or fallen with market conditions, most industry investors consider supplemental measures of performance, which are not measures of operating performance under GAAP, to be helpful in evaluating a real estate company s operations. These supplemental measures, including FFO, Adjusted FFO, EBITDA, Hotel EBITDA, Hotel EBITDA as presented historically and Hotel EBITDA margin, are not measures of operating performance under GAAP. However, we consider these non-gaap measures to be supplemental measures of a REIT s performance and should be considered along with, but not as an alternative to, net income as a measure of our operating performance. FFO and EBITDA The White Paper on Funds From Operations approved by the Board of Governors of the National Association of Real Estate Investment Trusts, or NAREIT, defines FFO as net income or loss (computed in accordance with GAAP), excluding gains or losses from sales of property, plus depreciation and amortization, and after adjustments for unconsolidated partnerships and joint ventures. Adjustments for unconsolidated partnerships and joint ventures are calculated to reflect FFO on the same basis. We compute FFO in accordance with standards established by NAREIT. This may not be comparable to FFO reported by other REITs that do not define the term in accordance with the current NAREIT definition, or that interpret the current NAREIT definition differently than we do. 15
A N E W P E R S P E C T I V E
 F e l C o r L o d g i n g Tr u s t I n c o r p o r a t e d Annual Report 2 0 0 6 A N E W P E R S P E C T I V E Embassy Suites Hotel San Francisco-Airport/Burlingame, California T O O U R S H A R E H O
Strategically Positioned
 fig. 1 Strategically Positioned felcor lodging trust incorporated 2008 Annual Report fig. 2 The San Francisco Marriott Union Square Gensler led the transformation of the building s exterior and was the
OUR VISION. FelCor 1.0 UNFOLDING. FelCor 3.0. FelCor 2.0. FelCor Lodging Trust Incorporated 2014 Annual Report
 OUR VISION FelCor 1.0 UNFOLDING FelCor 3.0 FelCor Lodging Trust Incorporated 2014 Annual Report FelCor 2.0 2014 We are pleased to report that FelCor had an exceptional year in 2014. We fulfilled our commitment
B Y D E S I G N FELCOR LODGING TRUST 2013 ANNUAL REPORT
 B Y D E S I G N FELCOR LODGING TRUST 2013 ANNUAL REPORT 1 2 3 4 5 6 7 8 9 Last year, we committed to delivering on our strategic objectives. We said we would sell non-strategic hotels, continue to pay
building on success f e l c o r l o d g i n g t r u s t i n c o r P o r A t e d A n n u A l r e P o r t
 building ON success felcor lodging trust INCORPORATED 2015 annual report Our mission is to provide investors with superior returns on their capital by offering increased earnings, asset value and dividend
DIAMONDROCK HOSPITALITY COMPANY REPORTS THIRD QUARTER 2014 RESULTS AND RAISES FULL YEAR GUIDANCE
 COMPANY CONTACT Sean Mahoney (240) 744-1150 FOR IMMEDIATE RELEASE Tuesday, November 4, 2014 DIAMONDROCK HOSPITALITY COMPANY REPORTS THIRD QUARTER 2014 RESULTS AND RAISES FULL YEAR GUIDANCE Pro Forma RevPAR
SUNSTONE HOTEL INVESTORS REPORTS RESULTS FOR FOURTH QUARTER AND FULL YEAR 2009
 For Additional Information: Bryan Giglia Senior Vice President Corporate Finance (949) 369-4236 SUNSTONE HOTEL INVESTORS REPORTS RESULTS FOR FOURTH QUARTER AND FULL YEAR 2009 Drives strong margin performance
SUNSTONE HOTEL INVESTORS REPORTS RESULTS FOR FIRST QUARTER 2016
 For Additional Information: Bryan Giglia (949) 382-3036 SUNSTONE HOTEL INVESTORS REPORTS RESULTS FOR FIRST QUARTER 2016 ALISO VIEJO, CA May 2, 2016 (the Company or Sunstone ) (NYSE: SHO) today announced
Fourth Quarter and Year End 2017 Supplemental Data DECEMBER 31, 2017
 Fourth Quarter and Year End 2017 Supplemental Data DECEMBER 31, 2017 Waldorf Astoria Orlando Park Hotels & Resorts at NYSE Hilton Hawaiian Village Waikiki Beach Resort About Park and Safe Harbor Disclosure
SUNSTONE HOTEL INVESTORS REPORTS RESULTS FOR THIRD QUARTER 2016
 For Additional Information: Bryan Giglia (949) 382-3036 SUNSTONE HOTEL INVESTORS REPORTS RESULTS FOR THIRD QUARTER 2016 ALISO VIEJO, CA November 1, 2016 (the Company or Sunstone ) (NYSE: SHO) today announced
SUNSTONE HOTEL INVESTORS REPORTS RESULTS FOR FOURTH QUARTER AND FULL YEAR 2017
 For Additional Information: Bryan Giglia Sunstone Hotel Investors, Inc. (949) 382-3036 SUNSTONE HOTEL INVESTORS REPORTS RESULTS FOR FOURTH QUARTER AND FULL YEAR 2017 ALISO VIEJO, CA February 12, 2018 Sunstone
SUNSTONE HOTEL INVESTORS REPORTS RESULTS FOR FIRST QUARTER 2018
 For Additional Information: Bryan Giglia Sunstone Hotel Investors, Inc. (949) 382-3036 SUNSTONE HOTEL INVESTORS REPORTS RESULTS FOR FIRST QUARTER 2018 ALISO VIEJO, CA May 7, 2018 Sunstone Hotel Investors,
Park Hotels & Resorts Inc. Reports Fourth Quarter and Full Year 2017 Results
 Investor Contact 1600 Tysons Boulevard, Suite 1000 Ian Weissman McLean, VA 22102 + 1 703 584 7441 www.pkhotelsandresorts.com Park Hotels & Resorts Inc. Reports Fourth Quarter and Full Year 2017 Results
LASALLE HOTEL PROPERTIES REPORTS SECOND QUARTER 2015 RESULTS
 7550 Wisconsin Avenue, 10 th Floor, Bethesda, MD 20814 PH 301.941.1500, FX 301.941.1553 www.lasallehotels.com News Release LASALLE HOTEL PROPERTIES REPORTS SECOND QUARTER 2015 RESULTS Expands Hotel EBITDA
SUNSTONE HOTEL INVESTORS REPORTS RESULTS FOR SECOND QUARTER 2015
 For Additional Information: Bryan Giglia Sunstone Hotel Investors, Inc. (949) 382-3036 SUNSTONE HOTEL INVESTORS REPORTS RESULTS FOR SECOND QUARTER 2015 ALISO VIEJO, CA August 6, 2015 Sunstone Hotel Investors,
DIAMONDROCK HOSPITALITY COMPANY REPORTS FOURTH QUARTER AND FULL YEAR 2011 RESULTS
 COMPANY CONTACT Chris King (240) 744-1150 FOR IMMEDIATE RELEASE WEDNESDAY, FEBRUARY 29, 2012 DIAMONDROCK HOSPITALITY COMPANY REPORTS FOURTH QUARTER AND FULL YEAR 2011 RESULTS BETHESDA, Maryland, Wednesday,
SUNSTONE HOTEL INVESTORS REPORTS RESULTS FOR FOURTH QUARTER AND FULL YEAR 2018
 For Additional Information: Bryan Giglia (949) 382-3036 Aaron Reyes (949) 382-3018 SUNSTONE HOTEL INVESTORS REPORTS RESULTS FOR FOURTH QUARTER AND FULL YEAR 2018 IRVINE, CA February 12, 2019 (the Company
SUNSTONE HOTEL INVESTORS REPORTS RESULTS FOR SECOND QUARTER 2016
 For Additional Information: Bryan Giglia Sunstone Hotel Investors, Inc. (949) 382-3036 SUNSTONE HOTEL INVESTORS REPORTS RESULTS FOR SECOND QUARTER 2016 ALISO VIEJO, CA August 8, 2016 Sunstone Hotel Investors,
Supplemental Financial Information
 Supplemental Financial Information For the quarter ended September 30, 2018 Table of Contents Supplemental Financial Information CORPORATE PROFILE, FINANCIAL DISCLOSURES, AND SAFE HARBOR 3 About Sunstone
LASALLE HOTEL PROPERTIES REPORTS FIRST QUARTER 2017 RESULTS Strengthens Balance Sheet with $274 Million of Asset Sales Year-to-Date
 News Release LASALLE HOTEL PROPERTIES REPORTS FIRST QUARTER 2017 RESULTS Strengthens Balance Sheet with $274 Million of Asset Sales Year-to-Date BETHESDA, MD, April 19, 2017 -- LaSalle Hotel Properties
SUNSTONE HOTEL INVESTORS REPORTS RESULTS FOR THIRD QUARTER 2015
 For Additional Information: Bryan Giglia Sunstone Hotel Investors, Inc. (949) 382-3036 SUNSTONE HOTEL INVESTORS REPORTS RESULTS FOR THIRD QUARTER 2015 ALISO VIEJO, CA October 29, 2015 Sunstone Hotel Investors,
Supplemental Financial Information
 Supplemental Financial Information For the quarter ended June 30, 2018 Table of Contents Supplemental Financial Information CORPORATE PROFILE, FINANCIAL DISCLOSURES, AND SAFE HARBOR 3 About Sunstone 4
Park Hotels & Resorts Inc. Reports First Quarter 2018 Results
 Investor Contact 1775 Tysons Boulevard, 7th Floor Ian Weissman Tysons, VA 22102 + 1 571 302 5591 www.pkhotelsandresorts.com Park Hotels & Resorts Inc. Reports First Quarter 2018 Results TYSONS, VA (May
HOST HOTELS & RESORTS, INC. REPORTS RESULTS FOR THE THIRD QUARTER 2018
 Michael D. Bluhm, Chief Financial Officer 240.744.5110 Bret D.S. McLeod, Senior Vice President 240.744.5216 Gee Lingberg, Vice President 240.744.5275 NEWS RELEASE HOST HOTELS & RESORTS, INC. REPORTS RESULTS
ASHFORD TRUST REPORTS FIRST QUARTER 2018 RESULTS
 NEWS RELEASE Contact: Deric Eubanks Jordan Jennings Joe Calabrese Chief Financial Officer Investor Relations Financial Relations Board (972) 490-9600 (972) 778-9487 (212) 827-3772 ASHFORD TRUST REPORTS
S U N S T O N E H O T E L I N V E S T O R S, I N C. Company Presentation. March 2013
 Company Presentation March 2013 Forward-Looking Statements This presentation contains forward-looking statements that have been made pursuant to the provisions of the Private Securities Litigation Reform
SUNSTONE HOTEL INVESTORS, INC. Company Presentation. September 2011
 Company Presentation September 2011 Forward-Looking Statements This presentation contains forward-looking statements that have been made pursuant to the provisions of the Private Securities Litigation
Supplemental Financial Information
 Supplemental Financial Information For the quarter ended September 30, 2017 Table of Contents Supplemental Financial Information CORPORATE PROFILE, FINANCIAL DISCLOSURES, AND SAFE HARBOR 4 About Sunstone
LASALLE HOTEL PROPERTIES REPORTS THIRD QUARTER 2017 RESULTS
 News Release LASALLE HOTEL PROPERTIES REPORTS THIRD QUARTER 2017 RESULTS BETHESDA, MD, October 19, 2017 -- LaSalle Hotel Properties (NYSE: LHO) today announced results for the quarter ended September 30,
Park Hotels & Resorts Inc. Reports Third Quarter 2017 Results
 Investor Contact 1600 Tysons Boulevard, Suite 1000 Ian Weissman McLean, VA 22102 + 1 703 584 7441 www.pkhotelsandresorts.com Park Hotels & Resorts Inc. Reports Third Quarter 2017 Results MCLEAN, VA (November
Supplemental Information
 Supplemental Information Third Quarter 2014 Andros Isles - Daytona Beach, FL Landmark Apartment Trust s ("Landmark") Unaudited Reconciliation Tables and Supplemental Disclosure presented herein speaks
Supplemental Financial Information
 Supplemental Financial Information For the quarter ended June 30, 2017 Table of Contents Supplemental Financial Information CORPORATE PROFILE, FINANCIAL DISCLOSURES, AND SAFE HARBOR 3 About Sunstone 4
ASHFORD TRUST REPORTS THIRD QUARTER 2018 RESULTS
 NEWS RELEASE Contact: Deric Eubanks Jordan Jennings Joe Calabrese Chief Financial Officer Investor Relations Financial Relations Board (972) 490-9600 (972) 778-9487 (212) 827-3772 ASHFORD TRUST REPORTS
HOST HOTELS & RESORTS, INC. REPORTS RESULTS FOR THE FIRST QUARTER 2015 AND ANNOUNCES SHARE REPURCHASE PROGRAM
 Exhibit 99.1 Gregory J. Larson Chief Financial Officer 240.744.5120 Gee Lingberg Vice President 240.744.5275 NEWS RELEASE REPORTS RESULTS FOR THE FIRST QUARTER 2015 AND ANNOUNCES SHARE REPURCHASE PROGRAM
SUNSTONE HOTEL INVESTORS REPORTS RESULTS FOR THIRD QUARTER 2017
 For Additional Information: Bryan Giglia Sunstone Hotel Investors, Inc. (949) 382-3036 SUNSTONE HOTEL INVESTORS REPORTS RESULTS FOR THIRD QUARTER 2017 ALISO VIEJO, CA October 30, 2017 Sunstone Hotel Investors,
2014 U.S. Census (2015) Median African-American Household Income Rank, Memphis Included. Household Median Income Ranking, African American Population
 Median African-American Household Income Rank, Memphis Included. Household Median Income Ranking, African American Population") 2015 2015 Rankings Report Prepared by Elena Delavega, PhD, MSW Department of Social Work Benjamin L. Hooks Institute for Social Change University of Memphis 2014 U.S. Census (2015) - Rank, Memphis Included
2015 2015 Rankings Report Prepared by Elena Delavega, PhD, MSW Department of Social Work Benjamin L. Hooks Institute for Social Change University of Memphis 2014 U.S. Census (2015) - Rank, Memphis Included
ASHFORD TRUST REPORTS FOURTH QUARTER AND YEAR END 2014 RESULTS
 NEWS RELEASE Contact: Deric Eubanks Elise Chittick Scott Eckstein Chief Financial Officer Investor Relations Financial Relations Board (972) 490-9600 (972) 778-9487 (212) 827-3766 ASHFORD TRUST REPORTS
2017 Portfolio Enhancements
 2017 Portfolio Enhancements October 2017 Hyatt Regency Scottsdale Resort & Spa at Gainey Ranch Scottsdale, AZ Royal Palms Resort & Spa Phoenix, AZ The Ritz-Carlton Pentagon City Arlington, VA Hyatt Regency
SUNSTONE HOTEL INVESTORS REPORTS RESULTS FOR THIRD QUARTER 2018
 For Additional Information: Bryan Giglia Sunstone Hotel Investors, Inc. (949) 382-3036 Aaron Reyes Sunstone Hotel Investors, Inc. (949) 382-3018 SUNSTONE HOTEL INVESTORS REPORTS RESULTS FOR THIRD QUARTER
ASHFORD TRUST REPORTS FIRST QUARTER 2017 RESULTS
 NEWS RELEASE Contact: Deric Eubanks Jordan Jennings Joe Calabrese Chief Financial Officer Investor Relations Financial Relations Board (972) 490-9600 (972) 778-9487 (212) 827-3772 ASHFORD TRUST REPORTS
Sotherly Hotels Inc. Reports Financial Results for the Second Quarter Ended June 30, 2016
 Sotherly Hotels Inc. Reports Financial Results for the Second Quarter Ended June 30, 2016 Company Release August 9, 2016 9:00 AM EST WILLIAMSBURG, Va., Aug. 09, 2016 (GLOBE NEWSWIRE) -- Sotherly Hotels
HOST HOTELS & RESORTS, INC. REPORTS SOLID RESULTS FOR 2016, ANNOUNCES SHARE REPURCHASE PROGRAM AND THE ACQUISITION OF THE DON CESAR
 Gregory J. Larson, Chief Financial Officer 240.744.5120 Bret D.S. McLeod, Senior Vice President 240.744.5216 Gee Lingberg, Vice President 240.744.5275 NEWS RELEASE HOST HOTELS & RESORTS, INC. REPORTS SOLID
Park Hotels & Resorts Inc. (Exact name of Registrant as Specified in Its Charter)
") UNITED STATES SECURITIES AND EXCHANGE COMMISSION WASHINGTON, D.C. 20549 FORM 8-K CURRENT REPORT Pursuant to Section 13 or 15(d) of the Securities Exchange Act of 1934 Date of Report (Date of earliest event
UNITED STATES SECURITIES AND EXCHANGE COMMISSION WASHINGTON, D.C. 20549 FORM 8-K CURRENT REPORT Pursuant to Section 13 or 15(d) of the Securities Exchange Act of 1934 Date of Report (Date of earliest event
Condor Hospitality Trust Reports 2015 Third Quarter Results
 Suite 200 1800 West Pasewalk Avenue Norfolk, NE 68701 (402) 371-2520 (402) 371-4229 Fax www.condorhospitality.com For Immediate Release Condor Hospitality Trust Reports 2015 Third Quarter Results 4.7%
Park Hotels & Resorts Inc. (Exact name of registrant as specified in its charter)
") UNITED STATES SECURITIES AND EXCHANGE COMMISSION Washington, D.C. 20549 FORM 10-Q (Mark One) QUARTERLY REPORT PURSUANT TO SECTION 13 OR 15(d) OF THE SECURITIES EXCHANGE ACT OF 1934 For the quarterly period
UNITED STATES SECURITIES AND EXCHANGE COMMISSION Washington, D.C. 20549 FORM 10-Q (Mark One) QUARTERLY REPORT PURSUANT TO SECTION 13 OR 15(d) OF THE SECURITIES EXCHANGE ACT OF 1934 For the quarterly period
COMPANY CONTACT. Sean Mahoney (240) FOR IMMEDIATE RELEASE
 FOR IMMEDIATE RELEASE") COMPANY CONTACT Sean Mahoney (240) 744-1150 FOR IMMEDIATE RELEASE DIAMONDROCK ACQUIRES L AUBERGE DE SEDONA AND ORCHARDS INN SEDONA FOR $97 MILLION Iconic Assets with Asset Management Upside in Attractive,
COMPANY CONTACT Sean Mahoney (240) 744-1150 FOR IMMEDIATE RELEASE DIAMONDROCK ACQUIRES L AUBERGE DE SEDONA AND ORCHARDS INN SEDONA FOR $97 MILLION Iconic Assets with Asset Management Upside in Attractive,
ASHFORD TRUST REPORTS FOURTH QUARTER AND YEAR END 2018 RESULTS
 NEWS RELEASE Contact: Deric Eubanks Jordan Jennings Joe Calabrese Chief Financial Officer Investor Relations Financial Relations Board (972) 490-9600 (972) 778-9487 (212) 827-3772 ASHFORD TRUST REPORTS
Park Hotels & Resorts Inc. (Exact name of Registrant as Specified in Its Charter)
") UNITED STATES SECURITIES AND EXCHANGE COMMISSION WASHINGTON, D.C. 20549 FORM 8-K CURRENT REPORT Pursuant to Section 13 or 15(d) of the Securities Exchange Act of 1934 Date of Report (Date of earliest event
UNITED STATES SECURITIES AND EXCHANGE COMMISSION WASHINGTON, D.C. 20549 FORM 8-K CURRENT REPORT Pursuant to Section 13 or 15(d) of the Securities Exchange Act of 1934 Date of Report (Date of earliest event
ASHFORD PRIME REPORTS FOURTH QUARTER AND YEAR END 2014 RESULTS
 NEWS RELEASE Contact: Deric Eubanks Elise Chittick Scott Eckstein Chief Financial Officer Investor Relations Financial Relations Board (972) 490-9600 (972) 778-9487 (212) 827-3766 ASHFORD PRIME REPORTS
SUPPLEMENTAL INFORMATION MARCH 31, Page. Page. Renewal Analysis Quarterly Comparison..12 Renewal Analysis by Region.13. Highlights...
 SUPPLEMENTAL INFORMATION MARCH 31, 2012 Page Highlights...1 Statement of Operations..2 Statement of Funds from Operations..3 Balance Sheet..4 Ratios...5 Portfolio Profile...6 Building Type by Region.7-8
ASHFORD TRUST REPORTS SECOND QUARTER 2014 RESULTS
 NEWS RELEASE Contact: Deric Eubanks Elise Chittick Scott Eckstein Chief Financial Officer Investor Relations Financial Relations Board (972) 490-9600 (972) 778-9487 (212) 827-3766 ASHFORD TRUST REPORTS
View printer-friendly version << Back
 1 of 8 22/04/2014 15:17 Print Page Close Window Press Release View printer-friendly version
Company Presentation June 2016
 Company Presentation June 2016 Safe Harbor In keeping with the SEC's "Safe Harbor" guidelines, certain statements made during this presentation could be considered forward-looking and subject to certain
2002 Financial Highlights
 2002 Financial Highlights (in thousands, except per share amounts, ratios and operating data) 2002 2001 2000 OPERATING RESULTS Total Revenues $ 440,380 $ 436,658 $ 436,574 O T H E R D A T A EBITDA (a)
STARWOOD REPORTS RECORD SECOND QUARTER 2005 RESULTS. WHITE PLAINS, NY, July 26, 2005 Starwood Hotels & Resorts Worldwide, Inc.
 CONTACT: Alisa Rosenberg (914) 640-5214 FOR IMMEDIATE RELEASE July 26, 2005 STARWOOD REPORTS RECORD SECOND QUARTER 2005 RESULTS WHITE PLAINS, NY, July 26, 2005 Starwood Hotels & Resorts Worldwide, Inc.
ZipRealty, Inc. Supplemental Data Reclassification of Consolidated Statement of Operations
 Reclassification of Consolidated Statement of Operations Effective January 1, 2007, for income statement presentation purposes, we have reclassified sales support and marketing expenses from general and
Hotel Valuation and Transaction Trends For the U.S. Lodging Industry
 Hotel Valuation and Transaction Trends For the U.S. Lodging Industry Stephen Rushmore, CHA, MAI, FRICS President and Founder HVS International 372 Willis Avenue Mineola, NY 11501 516-248-8828 ext. 204
LIBERTY PROPERTY TRUST LIBERTY PROPERTY LIMITED PARTNERSHIP
 UNITED STATES SECURITIES AND EXCHANGE COMMISSION Washington, D.C. 20549 FORM 10-Q (Mark One) x QUARTERLY REPORT PURSUANT TO SECTION 13 OR 15(d) OF THE SECURITIES EXCHANGE ACT OF 1934 For the quarterly
LASALLE HOTEL PROPERTIES REPORTS FIRST QUARTER 2018 RESULTS
 LASALLE HOTEL PROPERTIES REPORTS FIRST QUARTER 218 RESULTS News Release First Quarter Results Meaningfully Exceeded LaSalle s Expectations; EBITDA Outperformed Outlook by Approximately 6 Million or 15%
Sovran Self Storage Reports Second Quarter Results, Adjusted FFO per Share Increases 14.9%, Guidance Raised
 July 30, 2014 Sovran Self Srage Reports Second Quarter Results, Adjusted FFO per Share Increases 14.9%, Guidance Raised BUFFALO, N.Y.--(BUSINESS WIRE)-- Sovran Self Srage, Inc. (NYSE:SSS), a self srage
Hospitality Properties Trust Investor Presentation September 2017
 Sonesta ES Suites Princeton, Princeton, NJ Operator: Sonesta International Hotels Corp. Guest Rooms: 124 Investor Presentation September 2017 Disclaimer. THIS PRESENTATION CONTAINS STATEMENTS THAT CONSTITUTE
SIMON PROPERTY GROUP EARNINGS RELEASE & SUPPLEMENTAL INFORMATION UNAUDITED THIRD QUARTER OCT
 SIMON PROPERTY GROUP EARNINGS RELEASE & SUPPLEMENTAL INFORMATION UNAUDITED THIRD QUARTER 2015 15OCT201518425424 TABLE OF CONTENTS EARNINGS RELEASE AND SUPPLEMENTAL INFORMATION FOR THE QUARTER ENDED SEPTEMBER
COREPOINT LODGING REPORTS FOURTH QUARTER 2018 RESULTS
 FOR IMMEDIATE RELEASE COREPOINT LODGING REPORTS FOURTH QUARTER RESULTS IRVING, Texas March 21, 2019 CorePoint Lodging Inc. (NYSE: CPLG) ( CorePoint or the Company ), a pure play selectservice hotel owner
UNITED STATES SECURITIES AND EXCHANGE COMMISSION WASHINGTON, D.C FORM 8-K CURRENT REPORT. PURSUANT TO SECTION 13 OR 15(d) OF THE
 OF THE") UNITED STATES SECURITIES AND EXCHANGE COMMISSION WASHINGTON, D.C. 20549 FORM 8-K CURRENT REPORT PURSUANT TO SECTION 13 OR 15(d) OF THE SECURITIES EXCHANGE ACT OF 1934 Date of report (Date of earliest event
UNITED STATES SECURITIES AND EXCHANGE COMMISSION WASHINGTON, D.C. 20549 FORM 8-K CURRENT REPORT PURSUANT TO SECTION 13 OR 15(d) OF THE SECURITIES EXCHANGE ACT OF 1934 Date of report (Date of earliest event
LASALLE HOTEL PROPERTIES REPORTS FOURTH QUARTER 2017 RESULTS Key West is Open for Business
 News Release LASALLE HOTEL PROPERTIES REPORTS FOURTH QUARTER 2017 RESULTS Key West is Open for Business BETHESDA, MD, February 20, 2018 -- LaSalle Hotel Properties (NYSE: LHO) today announced results for
FOR IMMEDIATE RELEASE
 FOR IMMEDIATE RELEASE STRATEGIC STORAGE TRUST, INC. REPORTS THIRD QUARTER 2013 RESULTS - SAME-STORE REVENUES INCREASED 9.4% - SAME-STORE NOI INCREASED 16.1% LADERA RANCH, CA November 15, 2013 Strategic
STARWOOD REPORTS THIRD QUARTER 2002 RESULTS
 CONTACT: David Matheson (914) 640-5204 FOR IMMEDIATE RELEASE October 24, 2002 STARWOOD REPORTS THIRD QUARTER 2002 RESULTS WHITE PLAINS, NY, October 24, 2002 Starwood Hotels & Resorts Worldwide, Inc. (NYSE:
LASALLE HOTEL PROPERTIES REPORTS THIRD QUARTER 2018 RESULTS. Special Meeting to Approve Merger with Pebblebrook Scheduled for November 27, 2018
 News Release LASALLE HOTEL PROPERTIES REPORTS THIRD QUARTER 218 RESULTS Special Meeting to Approve Merger with Pebblebrook Scheduled for November 27, 218 Merger with Pebblebrook Expected to Close on November
American Jobs Act - Preventing Teacher Layoffs Estimated Jobs Impact by State
 American Jobs Act - Preventing Teacher Layoffs Estimated Jobs Impact by Funds Allocated Estimate of Jobs Supported for 1 School Year Alabama $ 451,477,775 7,000 Alaska $ 70,483,533 900 Arizona $ 625,502,087
Extended Stay America Announces Fourth Quarter And Full Year 2017 Results
 Extended Stay America Announces Fourth Quarter And Full Year 2017 Results February 27, 2018 - Net Income of $40.2 million and $172.2 million in the Fourth Quarter and Full Year, Respectively - Adjusted
COMPANY CONTACT Mark Brugger (240) FOR IMMEDIATE RELEASE
 FOR IMMEDIATE RELEASE") COMPANY CONTACT Mark Brugger (240) 744-1150 FOR IMMEDIATE RELEASE DIAMONDROCK ACQUIRES THE HOTEL PALOMAR IN PHOENIX, AZ Premier Hotel with Prime Location in Downtown CityScape Development Updates 2018
COMPANY CONTACT Mark Brugger (240) 744-1150 FOR IMMEDIATE RELEASE DIAMONDROCK ACQUIRES THE HOTEL PALOMAR IN PHOENIX, AZ Premier Hotel with Prime Location in Downtown CityScape Development Updates 2018
Company Profile 3. Highlights of the Second Quarter 2014 and Subsequent Events 4
 Second Quarter 2014 Table of Contents Company Profile 3 Highlights of the Second Quarter 2014 and Subsequent Events 4 Normalized Funds From Operations and Adjusted Funds From Operations Guidance 5 Consolidated
Results for the Quarter
 Simon Property Group Reports Second Quarter Results And Announces Quarterly Dividend INDIANAPOLIS, July 29, 2013 /PRNewswire-FirstCall/ -- Simon Property Group, Inc. (NYSE:SPG) today reported results for
Commercial Real Estate Lending Patterns and Distressed Residential Mortgage Markets
 Commercial Real Estate Lending Patterns and Distressed Residential Mortgage Markets Donald R. Cavan 1 This article discusses residential mortgage distress which continues to in uence not only the parties
Schedule 5 - Summarized Information for Unconsolidated Real Estate Venture 18
 Table of Contents Page 1 Earnings Release 7 Consolidated Statements of Operations 8 Consolidated Balance Sheets 9 Schedule 1 - Funds From Operations and Core Funds From Operations 11 Schedule 2 - Other
AGREE REALTY CORPORATION REPORTS SECOND QUARTER 2017 RESULTS INVESTED $139 MILLION ACROSS ITS THREE EXTERNAL GROWTH PLATFORMS
 70 E. Long Lake Rd. Bloomfield Hills, MI 48304 www.agreerealty.com FOR IMMEDIATE RELEASE AGREE REALTY CORPORATION REPORTS SECOND QUARTER 2017 RESULTS INVESTED $139 MILLION ACROSS ITS THREE EXTERNAL GROWTH
FIRST QUARTER Supplemental Financial Data. Supplemental Financial Data
 FIRST QUARTER Supplemental Financial Data Supplemental Financial Data Table of Contents Company Profile 3 Highlights of the and AFFO Guidance 4 Consolidated Statements of Operations 5 Reconciliation of
EQUITY RESIDENTIAL REPORTS 2003 RESULTS
 NEWS RELEASE CONTACT: Marty McKenna FOR IMMEDIATE RELEASE (312) 928-1901 FEBRUARY 4, 2004 EQUITY RESIDENTIAL REPORTS 2003 RESULTS CHICAGO, IL FEBRUARY 4, 2004 - Equity Residential (NYSE: EQR) today reported
Park Hotels & Resorts Inc. (Exact name of Registrant as specified in its Charter)
") UNITED STATES SECURITIES AND EXCHANGE COMMISSION Washington, D.C. 20549 FORM 10-K (Mark One) ANNUAL REPORT PURSUANT TO SECTION 13 OR 15(d) OF THE SECURITIES EXCHANGE ACT OF 1934 For the fiscal year ended
UNITED STATES SECURITIES AND EXCHANGE COMMISSION Washington, D.C. 20549 FORM 10-K (Mark One) ANNUAL REPORT PURSUANT TO SECTION 13 OR 15(d) OF THE SECURITIES EXCHANGE ACT OF 1934 For the fiscal year ended
HIT REIT Quarterly Investor Presentation April 26, American Realty Capital Hospitality Trust, Inc.
 HIT REIT Quarterly Investor Presentation April 26, 2018 American Realty Capital Hospitality Trust, Inc. Risk Factors Risk Factors Investing in our common stock involves a degree of risk. See the section
Starwood Waypoint Residential Trust ( SWAY )
") Fourth Quarter 2014 Supplemental Operating & Financial Data Starwood Waypoint Residential Trust ( SWAY ) acquires, renovates, leases, maintains and manages single family homes. We also invest in non-performing
Fourth Quarter 2014 Supplemental Operating & Financial Data Starwood Waypoint Residential Trust ( SWAY ) acquires, renovates, leases, maintains and manages single family homes. We also invest in non-performing
Hospitality Investors Trust 4/26/18 Investor Presentation Script
 Hospitality Investors Trust 4/26/18 Investor Presentation Script Opening Remarks Good afternoon, everyone, and good morning to those joining from the West Coast. This is Jon Mehlman, President & CEO of
istar Annual Report 2016
 istar Annual Report 2016 Annual Report 2016 2016 was a year of tangible progress for istar. The company set out to grow its earnings, capture unrecognized value and build a foundation for improved shareholder
ASHFORD REPORTS FOURTH QUARTER 2015 RESULTS
 NEWS RELEASE Contact: Deric Eubanks Jordan Jennings Stacy Feit Chief Financial Officer Investor Relations Financial Relations Board (972) 490-9600 (972) 778-9487 (213) 486-6549 ASHFORD REPORTS FOURTH QUARTER
Highlands Spin-Off & Student Housing Transaction Webcast. January 18, 2016
 Highlands Spin-Off & Student Housing Transaction Webcast January 18, 2016 Disclaimer Forward-Looking Statements in this presentation, which are not historical facts, are forward-looking statements within
Third Quarter Table of Contents. Company Profile 3. Highlights of the Third Quarter 2014 and Subsequent Events 4
 Table of Contents Company Profile 3 Highlights of the Third Quarter 2014 and Subsequent Events 4 Normalized Funds From Operations and Adjusted Funds From Operations Guidance 5 Consolidated Statements of
 Page 1 of 12 Simon Property Group Reports Third Quarter Results and Announces Increase In Dividend INDIANAPOLIS, Oct. 25, 2011 /PRNewswire via COMTEX/ -- Simon Property Group, Inc. (the "Company" or "Simon")
CHATHAM LODGING TRUST COMPANY PRESENTATION
 CHATHAM LODGING TRUST COMPANY PRESENTATION November 2018 Safe Harbor Disclosure We make forward-looking statements in this presentation that are subject to risks and uncertainties. These forward-looking
AGREE REALTY CORPORATION REPORTS FIRST QUARTER 2018 RESULTS
 70 E. Long Lake Rd. Bloomfield Hills, MI 48304 www.agreerealty.com FOR IMMEDIATE RELEASE AGREE REALTY CORPORATION REPORTS FIRST QUARTER 2018 RESULTS Bloomfield Hills, MI, April 23, 2018 -- Agree Realty
AGREE REALTY CORPORATION REPORTS THIRD QUARTER 2017 RESULTS INCREASES 2017 ACQUISITION GUIDANCE TO $300 MILLION TO $325 MILLION
 70 E. Long Lake Rd. Bloomfield Hills, MI 48304 www.agreerealty.com FOR IMMEDIATE RELEASE AGREE REALTY CORPORATION REPORTS THIRD QUARTER 2017 RESULTS INCREASES 2017 ACQUISITION GUIDANCE TO $300 MILLION
NEWS RELEASE 3 HIGHLIGHTS 6
 TABLE OF CONTENTS NEWS RELEASE 3 HIGHLIGHTS 6 FINANCIAL INFORMATION Consolidated Balance Sheets 7 Consolidated Statements of Comprehensive Income 8 Funds from Operations and Adjusted Funds from Operations
LIBERTY PROPERTY TRUST LIBERTY PROPERTY LIMITED PARTNERSHIP (Exact name of registrants as specified in their governing documents)
") UNITED STATES SECURITIES AND EXCHANGE COMMISSION Washington, D.C. 20549 FORM 10-Q (Mark One) x QUARTERLY REPORT PURSUANT TO SECTION 13 OR 15(d) OF THE SECURITIES EXCHANGE ACT OF 1934 For the quarterly
UNITED STATES SECURITIES AND EXCHANGE COMMISSION Washington, D.C. 20549 FORM 10-Q (Mark One) x QUARTERLY REPORT PURSUANT TO SECTION 13 OR 15(d) OF THE SECURITIES EXCHANGE ACT OF 1934 For the quarterly
A CLOSER LOOK AT ASHFORD.
 A CLOSER LOOK AT ASHFORD. ANNUAL REPORT 2003 2003 THE PREMIER CAPITAL PROVIDER TO THE HOSPITALITY INDUSTRY TM Direct Hotel Investments Mezzanine Loans First Mortgages CURRENT PORTFOLIO (as of March 31,
INVESTOR PRESENTATION Executive Summary August 2016
 INVESTOR PRESENTATION Executive Summary August 2016 Forward Looking Statements and non-gaap Measures This investor presentation, and the related discussion, contains forward-looking statements. These include
Chateau on the Lake Resort and Convention Center. Branson, Missouri. Embassy Suites Montgomery Hotel and Conference Center. Montgomery, Alabama
 J O H N Q. H A M M O N S H O T E L S, I N C. 2 0 0 3 A n n u a l R e p o r t Chateau on the Lake Resort and Convention Center Branson, Missouri Embassy Suites Montgomery Hotel and Conference Center Montgomery,
Company Presentation December 2011
 Company Presentation December 2011 Stifel Nicolaus had no involvement in the preparation of this presentation and, accordingly, makes no representation or warranty as to the accuracy or completeness of
AGREE REALTY CORPORATION REPORTS FIRST QUARTER 2017 RESULTS
 70 E. Long Lake Rd. Bloomfield Hills, MI 48304 www.agreerealty.com FOR IMMEDIATE RELEASE AGREE REALTY CORPORATION REPORTS FIRST QUARTER 2017 RESULTS Bloomfield Hills, MI, April 24, 2017 -- Agree Realty
Dear Fellow Shareholder:
 2 0 0 9 A n n u a l R e p o r t Dear Fellow Shareholder: Last year at this time we noted that the hotel industry was going through severe demand shocks not seen since the months immediately after 9/11.
MORGUARD NORTH AMERICAN RESIDENTIAL REIT
 MORGUARD NORTH AMERICAN RESIDENTIAL REIT FOURTH QUARTER RESULTS 2017 MANAGEMENT S DISCUSSION AND ANALYSIS AND CONSOLIDATED FINANCIAL STATEMENTS 4 MANAGEMENT S DISCUSSION AND ANALYSIS OF RESULTS OF OPERATIONS
Simon Property Group Reports Fourth Quarter and Full Year Results, Announces All-Cash Quarterly Dividend and Provides 2010 Guidance
 1 sur 13 05/02/2010 15:04 Simon Property Group Reports Fourth Quarter and Full Year Results, Announces All-Cash Quarterly Dividend and Provides 2010 Guidance INDIANAPOLIS, Feb 05, 2010 /PRNewswire via