annual financial results for the 12 months ended 31 August 2017
|
|
|
- Katherine Hall
- 5 years ago
- Views:
Transcription


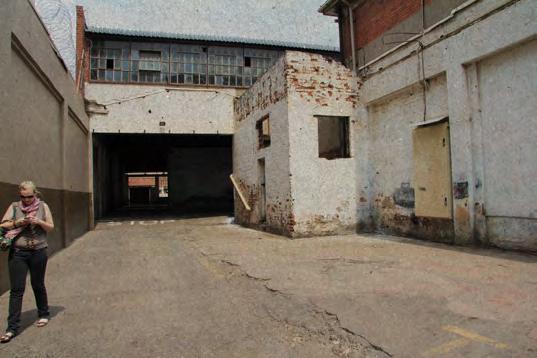
1 Octodec Head Office Sharon s Place One On Mutual 012 Steyn s Place Creating value beyond financial return annual financial results for the 12 months ended 31 August 2017

2 agenda 1 about us 03 2 overview for the period 06 3 our portfolio performance 10 4 our results Tshwane, Church Square 5 outlook 44 6 questions and answers 48 7 contact details 49 8 appendices Pretoria, Church Square 2

3 2017 One on Mutual completed 1 about us 2014 One on Mutual site preparation 3
4 the Octodec story Listed on the JSE in 1990: REIT status on 1 September 2013 Provided shareholders with an annual compounded return over a five and 10-year period of 12.8% and 9.4% respectively 315 properties (including joint ventures) in portfolio Properties managed by City Property Administration (Pty) Ltd New five-year management contract under negotiation Separate sub-committee formed comprising of non-executive directors Over 40 years property management experience Solid track record of managing residential, retail, office and industrial property 2017 Kerk Street, Johannesburg 1911 Anstey s Building 4


5 the Octodec story our strategy The strategy remains the same Focus on Tshwane and Johannesburg CBDs Continually improving the quality of our portfolio Focus on growing our residential portfolio Continue to focus on the low to mid income LSM 2017 Kerk Street, Johannesburg 1911 Anstey s Building 5


6 2overview for the period 2016 Tshwane, Church Square 1920s Pretoria, Church Square 6


7 overview for the period Dividends of cents per share, for the twelve month period ending 31 August 2017, a 0.8% increase compared to the prior period of cents per share Total property assets value at R12.8 billion, up by R474.2 million NAV up by 0.7% to R29.33 per share Context Residential increasingly competitive Tough economic, political and operating environment Rising costs (finance, utility and assessment rates and operating costs) Council service delivery issues Difficult construction environment Progress Property fundamentals sound Strategic greenfield developments to uplift key Tshwane CBD node Entrance to new market outside the CBD Successful trial of more upmarket offering with One on Mutual trading above expectations Profitable recycling of non-core assets Improved balance sheet Prudent capital management 7

8 overview of Tshwane CBD One on Mutual Sharon s Place Midtown Concentration of investments Increased urbanisation New developments improving node New Tshwane House New Tshwane House GLA of m 2 Housing in excess of staff Sustaining city life: TWO decades of building a city bears fruit Octodec properties Octodec properties developments 8

9 overview of Johannesburg CBD Urban renewal gaining momentum Increasing private sector investment Higher demand for property Local council support Sustaining city life: TWO decades of building a city bears fruit Octodec properties 9

10 29% Residential 8% Industrial 22.2% Offices 4.2% Parking 26.6% High street shops 10% Shopping centres 3our portfolio performance 10
 22.2 (FY16: 19.")
11 portfolio analysis: rental income 31 August 2017 Rental income (%) by geographical location Rental income (%) by sector 40% 35% 30% 25% 20% 15% 10% 5% 0% 2.3 Centurion 4.4 Silverton and surrounding areas 4.8 Tshwane Arcadia 7.3 Hatfield 12.1 Johannesburg and surrounding areas 14.7 Tshwane Other 21.5 Johannesburg CBD 32.9 Tshwane CBD 26.6 (FY16: 28.9) 22.2 (FY16: 19.6) 10.0 (FY16: 9.8) 29.0 (FY16: 29.5) 8.0 (FY16: 8.0) 4.2 (FY16: 4.2) Residential Retail: shops Offices Retail: shopping centres Industrial Parking 11
12 portfolio analysis: GLA 31 August 2017 GLA (%) by geographical location 40% 35% 30% 25% 20% 15% 10% 5% 0% 3.8 Waverley, Gezina, Moot 4.2 Hatfield 4.6 Tshwane, Arcadia 5.9 Tshwane West 7.0 Silverton and surrounding areas 9.1 Tshwane Other 9.1 Johannesburg and surrounding areas 24.9 Johannesburg CBD 31.4 Tshwane CBD GLA (%) by sector 25.3 (FY16: 25.9) 29.3 (FY16: 29.4) 23.7 (FY16: 22.0) 5.5 (FY16: 5.4) 16.2 (FY16: 17.3) Residential Retail: shops Offices Retail: shopping centres Industrial 12
13 residential Portfolio sectors: Rental income (%) Number of properties Number of residential units Johannesburg Tshwane % 66% % 62% Gross lettable area (GLA) m m 2 Rental income R415 million R407 million Growth in rental income year-onyear (like-for-like) 2.5% 5.6% Total vacancies at year end (% of GLA) 12.3% 4.0% Core vacancies (% of GLA) 7.2% 3.6% 29% Rental income Average monthly rentals: R3 400 R3 900 for a bachelor unit (average size 27 m 2 ) R4 100 R4 600 for a one-bedroom unit (average size 43 m 2 ) R5 400 R5 900 for a two-bedroom unit (average size 63 m 2 ) * Like-for-like rental income growth, after taking into account occupancy levels, reversions and escalations for the twelve-month period, assuming no major development activity 2.5% * Growth in rental income 13

14 residential (continued) Portfolio sectors: Rental income (%) Tenant profile analysis, for applications during the year Employed by government 27% of occupants Students 27% of occupants Churn at 45% per annum Average gross salary per application of R Gross salary above R % of occupants Strong demand for residential units Vacancies higher due to: Total vacancies include 400 units at Sharon s Place under development Increased competition in Hatfield and Johannesburg CBD Slower take-up by students impact mainly in Hatfield Affordability a concern in the tough economic environment Bad debts write-offs below 1% reflect strong collection and credit management Ongoing innovation such as roll-out of fibre installation and wifi Response to tough operating environment zero deposit for selective buildings 2.5% * Growth in rental income 29% Rental income 14
 512 310 m 2 523 635 m 2 Rental income R523 million R533 million Growth in rental income year-onyear (like-for-like)*")
15 retail overview - combined Portfolio sectors: Rental income (%) * Like-for-like rental income growth, after taking into account occupancy levels, reversions and escalations for the twelve-month period, assuming no major development activity Gross lettable area (GLA) m m 2 Rental income R523 million R533 million Growth in rental income year-onyear (like-for-like)* Total vacancies at year end (% of GLA) 5.9% 5.5% 9.3% 8.5% Core vacancies (% of GLA) 8.0% 8.5% 36.6% Rental income 5.9% * Growth in rental income 15
16 retail: high street shops Portfolio sectors: Rental income (%) Gross lettable area (GLA) m m 2 Rental income R380 Million R398 Million Rental income growth (like-for-like)* 5.7% 5.4% Total vacancies (% of GLA) 10.3% 9.1% Core vacancies (% of GLA) 8.8% 9.1% High street shops make up 82% of our retail portfolio by GLA and provide 73% of our retail portfolio rental income 69.4% of our high street shops are in Tshwane 30.6% are in Johannesburg Strong demand in well located CBD retail node CBD retail offers more growth opportunities than traditional shopping centres Retailers are demanding larger tenant installations Lower cost structures (common area, security, cleaning) * Like-for-like rental income growth, after taking into account occupancy levels, reversions and escalations for the twelve-month period, assuming no major development activity 26.6% Rental income 5.7% * Growth in rental income 16

17 retail: high street shops (continued) Portfolio sectors: Rental income (%) Top 10 retailers by rentable area Top 10 retailers by rental FY17 Lessee GLA (m 2 ) Lessee Rental (R 000) Shoprite Checkers Shoprite Checkers Pepkor Pepkor Edcon Edcon Bidvest Bidvest Standard Bank Foschini Retail Group Mr Price Group Nedbank Foschini Retail Group Standard Bank AutoZone Mr Price Group Nedbank KFC Cambridge Food FNB Total Total % Rental income 5.7% Growth in rental income 17
18 retail: shopping centres Portfolio sectors: Rental income (%) Gross lettable area (GLA) m m 2 Rental income R143 Million R135 Million Rental income growth (like-for-like) 6.4% 4.7% Total and core vacancies (% of GLA) 4.6% 5.4% We have six high-quality neighbourhood / convenience shopping centres: Johannesburg: Killarney Mall and the Woodmead Value Mart Tshwane: Elardus Park, Waverley Plaza, Gezina City and Blaauw Village (50% held JV) 10% Rental income 6.4% Growth in rental income 18

19 retail: shopping centres (continued) Portfolio sectors: Rental income (%) Elardus Park Shopping Centre Increase in vacancies to 12% In need of an upgrade Woodmead Value Mart No vacancies Rental growth of 10% Killarney Mall Occupancy levels stable Increase in trading density by 5% and net property income Focus on improving tenant mix Waverley Plaza and Gezina No vacancies 10% Rental income 6.4% Growth in rental income 19
20 offices Portfolio sectors: Rental income (%) Let to government (% of total rental income from offices) % 35.7% Other (% of total rental income from offices) 57.8% 64.3% Gross lettable area (GLA) m m 2 Percentage of office space in development / mothballed (opportunities to sell, develop or enter into partnerships) 18.2% 19.4% Rental income R317 Million R269 Million Growth in rental income year-on-year (likefor-like) 8.4% 5.2% Total vacancies at year-end (% of GLA) 33.8% 34.7% Core vacancies at year-end (% of GLA) 15.6% 15.3% * Like-for-like rental income growth, after taking into account occupancy levels, reversions and escalations for the twelve-month period, assuming no major development activity 8.4% * Growth in rental income 22.2% Rental income 20
 Midtown R17.")
21 offices (continued) Portfolio sectors: Rental income (%) Offices comprise of Government office space Corporates Smaller units occupied by SME s, occupancy levels stable Upgrading of offices Wits Technikon R16.1m (let effective 1 March 2017) Midtown R17.3m (first phase of renovation) Strong like-for-like growth mainly due to new government lease for m 2 included in results for 12 months (effective 1 March 2016) 22.2% Rental income 8.4% * Growth in rental income 21
22 industrial Portfolio sectors: Rental income (%) GLA in Tshwane m m 2 GLA in Johannesburg m m 2 Total GLA m m 2 Rental Income R115 million R110 million Growth in core rental income year-onyear (like-for-like) Total and core vacancies at year-end (% of GLA) 5.8% 3.3% 12.3% 10.8% * Like-for-like rental income growth, after taking into account occupancy levels, reversions and escalations for the twelve-month period, assuming no major development activity 8% Rental income 5.8% * Growth in rental income 22
 improved occupancy and rentals achieved Our competitive advantage Lower cost of occupation in desirable areas 8% Rental income 5.")
23 industrial (continued) Portfolio sectors: Rental income (%) Successful redevelopment of properties demand for upgraded properties Achieving higher rentals after upgrades Upgrade largely tenant driven The Tannery Industrial Park (R12m) improved occupancy and rentals achieved Our competitive advantage Lower cost of occupation in desirable areas 8% Rental income 5.8% * Growth in rental income 23
* 4.6% 7.")
24 parking Portfolio sectors: Rental income (%) Average monthly residential rentals (per bay) Average monthly commercial rentals (per bay) R380 R650 R360 R600 Rental income R61 million R58 million Growth in core rental income yearon-year (like-for-like)* 4.6% 7.2% Focused strategy to increase the number of parking bays in the CBD, due to high demand Strong demand from government and residential tenants 4.2% Rental income Greater focus on increasing revenue through improved efficiencies * Like-for-like rental income growth, after taking into account occupancy levels, reversions and escalations for the twelve-month period, assuming no major development activity 4.6% Growth in rental income * 24
25 vacancies by sector as at 31 August 2017 % of gross lettable area (by sector) 40.0% 35.0% 30.0% 25.0% 20.0% 15.0% 10.0% 5.0% 0.0% Total vacancies Core vacancies Total Residential Industrial Retail: Shopping centres High street shops Offices Note: Total vacancies include mothballed properties held for development which offer significant redevelopment, partnership or disposal opportunities. The value of these vacancies will be realised over time. Core vacancies exclude lettable area of properties that are mothballed. 25
 Core vacancies increased mainly in the residential sector (mainly Hatfield and other strong student nodes) Residential total vacancies include 20 195 m 2 relating to Sharon s Place, One on Mutual")
26 vacancies Total vacancies in our portfolio as at 31 August 2017 were at 17.7% of our total GLA (2016: 15.6% of our total GLA) Core vacancies were at 10.7% of total GLA (31 August 2016: 9.8%) Core vacancies increased mainly in the residential sector (mainly Hatfield and other strong student nodes) Residential total vacancies include m 2 relating to Sharon s Place, One on Mutual and The Manhattan Mothballed office vacancies of m 2 for future redevelopment, partnerships or disposal opportunities 26
27 lease expiry profile Residential (12 months and less) Gross lettable area m² GLA (%) Monthly contractual rent R 000 Rental income (%) Monthly commercial to 28 February to 28 February to 29 February to 28 February Thereafter Vacancies Total

28 lease expiry profile Octodec s portfolio features a mix of short- to long-term leases with the majority of short-term leases providing for a monthly agreement at expiry, which is typical of the residential market and leases with small to medium sized enterprises Government leases concluded for three-year term on average Residential leases short term leases (12 month contracts providing for a month to month arrangement on expiry) Majority of leases for non-national tenants concluded for 1- to 10-year term National tenants leases concluded for 3- to 10-year term 28
29 recent sales In line with our strategy to dispose of non-core assets, the following properties were sold and transferred during the period under review Total Profit / (loss) Transfer date / consideration on disposal expected Property Location R million R million transfer date Frederika Street Gezina, Tshwane Feb Karkap Gezina, Tshwane Feb Munt Street Waltloo, Tshwane Feb Raschers Johannesburg CBD Nov Paulefko Tshwane CBD Oct Blagil Hatfield, Tshwane 2.1 (0.1) 26 Nov High Court Building and Somerset House Johannesburg CBD 14.5 (0.1) 26 Nov 2016 Fine Art House and Fine Art Court Johannesburg CBD May Valhof Valhalla, Tshwane 9.0 (0.1) May Total Exit yield % The profit on the disposal consideration of R77.8 million amounted to R3.7 million, a premium of 4.8% above revalued book value at 31 August A further 35 non-core properties with a carrying value of R284.3 million have been recommended for disposal by the board. The average carrying value of these properties is R8.1 million. The proceeds from property sales will be used to repay debt, as well as fund the development pipeline. 29
30 capital expenditure greater than R50 million Management recognises the need to improve hurdle rates of returns and has taken a more cautious approach to development roll-outs going forward Property Location Details The Manhattan One on Mutual Sharon s Place Pretoria Midtown Sunninghill, Johannesburg Tshwane CBD Tshwane CBD Tshwane CBD 50% undivided share in residential development 180 units and parking Upmarket residential development of 142 units, m 2 retail and 204 parking bays 400 residential units, 5 660m 2 retail and 289 parking bays Upgrade of 7 133m² office block with 944m² retail and 90 parking bays Total development cost R million Completion date Fully let yield % Loss after interest FY2017 R million 80.9 December February Early residential July retail st phase complete 2 nd phase subject to securing lease Total The impact of the let-up affects results negatively. The loss after interest for the 2017 financial year was at R13.4 million or equivalent to 2.5% of distributable income The construction of the residential development Reinsurance House is in the planning phase, which is situated in the Johannesburg CBD. The total development costs is expected to be R90 million This development will only commence if an acceptable yield is achieved at least 8.5% per annum 30
 Offices: 443m 2 (not let) Parking bays: 204 One on Mutual Currently over 90% residential")
31 One on Mutual The project was designed to be a more upmarket mixed-use development, attracting midincome tenants working in Tshwane CBD Development cost of: R155m Residential units: 142 Retail: 1 746m 2 (mostly let Pick n Pay and Mugg & Bean) Offices: 443m 2 (not let) Parking bays: 204 One on Mutual Currently over 90% residential occupancy 31

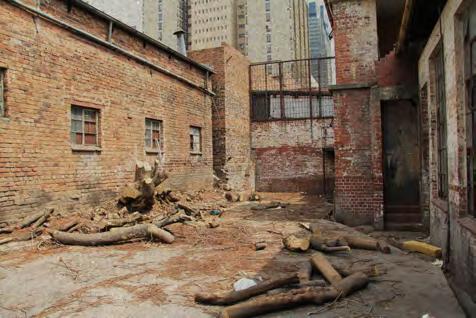
32 sharon s place Tshwane CBD mixed use development Development cost of: R356m Residential units: 400 Retail: 5 660m² Parking bays: Centre Forum 2016 Sharon s Place construction Retail completed in July 2017 Retail leasing progressing well and is almost 100% let with anchor tenants including Shoprite and Clicks Completion of the 400 residential units delayed further, expected completion in early Sharon s Place 32


33 2017 Tshwane, Golden Mile 4our results 1902 Market Place, Pretoria 33
34 achievements Distribution growth per share of 0.8% to cents per share for the twelve month period Like-for-like growth in rental income of 5.3% Net property expense to rental income ratio increased to 30.9% (31 August 2016: 29.6%) Arrears and doubtful debt provisions remain at acceptable levels despite a challenging operating environment Bad debts and movements in doubtful debt provisions as a percentage of rental income 0.9% (31 August 2016: 0.8%) Tenant arrears at 3.9% of gross revenue (3.6% at 31 August 2016) Balance sheet strengthened Loan to value ratio of 37.1% (31 August 2016: 38.3%) Proceeds of R263 million from dividend reinvestment programme Proceeds from disposal of properties of R77 million Rental income Like for like growth 5.3% Distribution growth of 0.8% 34
 commercial")
 in JHB CBD Rental income Like for like growth 5.")
35 achievements (continued) 0.7% increase in net asset value (NAV) to R29.33 per share Interest rate risk reduced 82.1% hedged through interest rate swap contracts Successful refinance of Domestic Medium Term Note Programme (DMTN) commercial paper notes Four major projects under construction during the period with two successfully completed Some major renovations to existing properties recently completed (Wits Technikon) in JHB CBD Rental income Like for like growth 5.3% Distribution growth of 0.8% 35
 Higher interest rates (all-in weighted average cost of funding at 9.")
36 challenges Tough economic and operating environment Like-for-like growth in rental income of 5.3%, under pressure Rise in costs (finance cost, utilities, assessment rates and repairs and maintenance) Higher interest rates (all-in weighted average cost of funding at 9.2% at 31 August 2017) Core vacancies in portfolio (excludes properties held for redevelopment) at 10.7% (31 August 2016: 9.8%) Dilutionary impact in the short term on distribution growth due to: Let-up phase of new residential developments Major upgrades to properties Properties acquired with vacancies, for redevelopment Council service delivery challenges New development impact 36
37 distributable earnings simplified income statement R 000 % Change Reviewed 31 August 2017 Audited 31 August 2016 Revenue earned on contractual basis 5.4% Like-for-like growth in rental income of 5.3% Operating costs 6.7% ( ) ( ) Increased cost pressures Net rental income from properties 4.2% Administrative costs 9.6% (77 813) (71 005) Increased corporate costs Operating profit 3.8% Interest income Loan advanced to JV partners Share of income from Joint Ventures equity accounted JVs Distributable profit before finance costs Finance costs 3.5% ( ) ( ) Increase in interest rates Shareholder distributable earnings 5.0% Number of shares in issue (000) Dividend per share (cents) % growth in distribution Note: Shareholders will be entitled to elect to reinvest the cash dividend in return for shares
38 condensed consolidated statement of financial position R'000 Reviewed 31 August 2017 Audited 31 August 2016 ASSETS Non-current assets Investment properties properties properties 2017 Plant and equipment Straight-line rental income accrual Tenant installation and lease costs Other financial assets Derivative financial instruments Investment in joint ventures equity accounted JVs - 50% held Current assets Receivables Cash and cash equivalents Non-current assets held for sale Properties recommended for sale at 31 August EQUITY AND LIABILITIES Equity Stated capital Non-distributable reserves Retained earnings Non-current liabilities Interest-bearing borrowings Derivative financial instruments Deferred taxation Current liabilities Interest-bearing borrowings Commercial paper notes, short term bank finance Non-interest bearing borrowings Derivative financial instruments Shares in issue ('000) Net asset value (NAV) per share (cents) Loan to investment value (LTV) ratio (%) 37.1% 38.3% 38
39 cash flow for the year ended 31 August 2017 R' ( ) ( ) ( ) Balance end of year Increase in interest bearing borrowings Acquisition and improvements to investment property Disposal of investment property Issue of new shares Dividend paid Net finance costs Cash generated from operations Balance 1 September
40 capital management funding at 31 August 2017 Prudent management of debt LTV at 37.1% (target maximum of 40%) Interest rate hedging maintain at levels of at least 80% Proactively address expiries of loans and swaps in the 2018 FY Debt capital market issuance R m of total borrowings (currently at 23.1%) Continue to pay down debt through sales of non-core properties Unutilised banking facilities of R625.9 million R 000 Interest rate Total borrowings Banks % DMTN programme % TOTAL BORROWINGS % Cost of swaps 0.2% TOTAL BORROWINGS % Loan to value 37.1% Weighted average cost of borrowings all-in cost, including swaps 9.2% Interest rate hedging percentage of borrowings 82.1% Weighted average term of fixed rate loans/swaps 1.6 years Weighted average term of debt 1.4 years 40

41 funding as at 31 August August 2017 Standard Bank R925m 31 August 2016 Standard Bank R1 025m DMTN programme commercial paper R1 116m DMTN programme commercial paper R755m Nedbank R2 785m Nedbank R2 999m 41
42 interest bearing debt expiry profile as at 31 August 2017 Expiry profile per financial year (Rm and %) Rm % % % 525 Secured loans Corporate paper 6.0% 31 Aug Aug Aug Aug Debt maturing in the next 12 months: Short term borrowings are commercial paper (DMTN programme) of R958m and bank secured loans of R615m To date, R239m of the commercial paper notes have been successfully refinanced for a 12-month term at an all-in cost of 130 bps above JIBAR Debt maturing after 31 August 2017 Higher cost of interest anticipated 42
43 interest rate hedges expiry profile Expiry profile per financial year (Rm and %) Rm % Aug Aug % Aug % Aug 2021 Fixed rate loans R412 million Swaps total of R3.550 billion Average weighted expiry 1.6 years At 31 August 2017, interest rates in respect of 82.1% of borrowings hedged R1.250 billion of swap contracts commenced effective from 3 January 2017 Weighted term 3.6 years All-in weighted cost of 8.11% 43

44 central original site 5outlook central 44
45 outlook Continued lack of business and consumer confidence Increasing competition CBD Johannesburg and Hatfield (residential) Strong operational focus to continue Well-positioned to continue to take advantage of opportunities in the CBDs CBD retail continues to generate strong demand from National and independent tenants Strong demand for affordable and secure, quality residential accommodation Residential developments to significantly uplift the Tshwane CBD node where we have a strategic concentration of assets One on Mutual letting well above expectation Sharon s Place will be ready for occupation in early

46 outlook (continued) Continue to unlock value future development opportunities under discussion Exploring new product offering (Nano units) Consideration of residential opportunities outside of Gauteng - ongoing Project returns will be improved, hurdle yield required of above 8.5% Disposal of non-core or non-performing properties will remain a focus area Forecast Impact on distributions during let-up phase Current forecast growth in distributable income per share No growth for 2018 FY Positive growth in 2019 FY 46
 Proven track record hands-on approach delivering steady returns Well-positioned to continue to unlock")
47 investment case Strategy to remain the same and diversify geographically Sustainable model urban renewal and middle-class growth Well-balanced portfolio with significant synergies across sectors in the CBDs Strong development pipeline unlock value of current portfolio (new and redevelopments) Proven track record hands-on approach delivering steady returns Well-positioned to continue to unlock value and navigate the challenging economic environment Steady and sustainable value creation 47


48 2016 Kerk Street Building, Johannesburg 1936 Anstey s Building after modernisation The building before redevelopment questions and answers 48


49 Jeffrey Wapnick Anthony Stein 7contact us Managing Director Tel: Financial Director Tel:


50 8appendices 2017 One on Mutual completed 2015 One on Mutual under construction 50

51 corporate structure 39% Wapnick family & directors 38% Institutional investors 23% Other Top 5 Beneficial institutional shareholders 5.2% Old Mutual Group 4.9% Stanlib 4.8% Government Employees Pension Fund 3.8% Nedbank Group 2.3% Eskom Pension & Provident Fund 51

52 our strategy Offer innovative property investment opportunities that create and deliver long-term sustainable returns by: Building a diversified portfolio in the Tshwane and Johannesburg CBDs and surrounding areas with an exposure to residential, office, retail and industrial sectors Actively promoting urban renewal in the Tshwane and Johannesburg CBDs 1899 Palace of Justice, Pretoria Increase the profitability of our existing portfolio by: Continually improving the quality of our portfolio Enhancing our tenant profile Developing well-located properties 2016 Tshwane (previously Pretoria) 52

53 our strategy (continued) Increase the profitability of our existing portfolio by: Concentration of properties in Tshwane and Johannesburg CBDs, which makes it easier to manage and extract value from our portfolio Pursuing acquisitions that offer strategic value and sustainable yield-enhancing opportunities Focusing on growing our residential portfolio in the medium term Recycling capital from low growth, poor quality assets to high growth, high quality assets Enhancing returns through effective mix of debt and equity to optimise capital structure Management of interest and liquidity risk 1880 Church Street South, Pretoria 2016 Tshwane (previously Pretoria) 53
54 top 10 properties Account for 25.0% of the Octodec investment property portfolio by value Property Location Sector Size (m 2 ) The Fields Hatfield, Tshwane Mixed use Killarney Mall Killarney, Johannesburg Shopping centre Centre Walk Tshwane CBD Mixed use Woodmead Value Mart Woodmead, Johannesburg Shopping centre Kempton Place Kempton Park Mixed use Sharon s Place Tshwane CBD Mixed use Louis Pasteur Medical Tshwane CBD Mixed use Nedbank Plaza Arcadia, Tshwane Mixed use Steyn s Place Tshwane CBD Mixed use Jeff s Place Tshwane CBD Residential
< Bosman St. > Sophie de Bruyn St CBD. Jeff Masemola St. creating value beyond financial return
 M3 >1 Steve Biko Rd M5 < Johannes Ramokhoase St Helen Joseph St Schoeman St Steve Biko Rd M6 M22 R101 Church Square < Pretorius St Thabo Sehume St M11 < Bosman St Paul Kruger St M4 M18 > Sophie de Bruyn
Unaudited Interim results
 Unaudited Interim results 2018 creating value beyond financial return creating value beyond fi nancial return Octodec Investments Limited (Octodec or the group or the company) is listed on the JSE Limited
properties CEO Andile Mazwai Director: Retail Director: Head of Human Resources Director: Marketing
 properties people ANNUAL FINANCIAL RESULTS values 12 MONTHS ENDED 31 AUGUST 2017 Forest Hill City - Centurion - Gauteng EXECUTIVE COMMITTEE CEO Andile Mazwai CFO Marelise de Lange Director: Facilities
SUMMARISED CONSOLIDATED RESULTS For the year ended 30 June 2016 STRATEGIC & OPERATIONAL OVERVIEW. Canal Walk (Cape Town, Western Cape)
") SUMMARISED CONSOLIDATED RESULTS For the year ended 30 June 2016 STRATEGIC & OPERATIONAL OVERVIEW Canal Walk (Cape Town, Western Cape) 1 STRATEGY & OVERVIEW South African REIT Focused on emerging markets
SUMMARISED CONSOLIDATED RESULTS For the year ended 30 June 2016 STRATEGIC & OPERATIONAL OVERVIEW Canal Walk (Cape Town, Western Cape) 1 STRATEGY & OVERVIEW South African REIT Focused on emerging markets
ANNUAL RESULTS FOR THE YEAR ENDED 31 AUGUST Presentation overview
 ANNUAL RESULTS Presentation overview Rebosis highlights Sisa Ngebulana New Frontier results Mike Riley Ascension results Kameel Keshav Rebosis results Sisa Ngebulana 02 1 Key Rebosis Highlights Distribution
OCTODEC INVESTMENTS (PTY) LTD
 LTD") ANNUAL REPORT 2007 Profile Octodec Investments Limited ( Octodec ) is a property loan stock company listed on the JSE Limited ( JSE ) under Financials Real Estate with a market capitalisation of R1,6 billion.
ANNUAL REPORT 2007 Profile Octodec Investments Limited ( Octodec ) is a property loan stock company listed on the JSE Limited ( JSE ) under Financials Real Estate with a market capitalisation of R1,6 billion.
INTERIM FINANCIAL RESULTS
 INTERIM FINANCIAL RESULTS Six months ended 31 December 2009 AGENDA Introduction & Highlights Financial Review Operational Overview Acquisitions, Developments and Disposals Growthpoint Properties Australia
AUDITED SUMMARISED CONSOLIDATED RESULTS AND CASH DIVIDEND DECLARATION FOR THE YEAR ENDED 30 JUNE 2018
 2018 AUDITED SUMMARISED CONSOLIDATED RESULTS AND CASH DIVIDEND DECLARATION FOR THE YEAR ENDED 30 JUNE 2018 HIGHLIGHTS Top performing SA REIT with 17.9% annualised total return to shareholders for the
Unaudited condensed consolidated interim results. for the six months ended 28 February 2018
 Unaudited condensed consolidated interim results for the six months ended 28 February 2018 Highlights Post-period acquisitions R1.42 billion (yield in excess of 11%) Post-period capital raise of R790 million
Interim Results 31 March 2018
 Interim Results 31 March 2018 Green shoots Green shoots starting to show Portfolio surprised on the upside Letting vacant space but with greater incentives Benefits in 2019 Remains tough environment 2
2018 Integrated report. creating value beyond financial return
 Integrated report creating value beyond financial return Limpopo North West 66.2 % of our portfolio is in Tshwane Gauteng Tshwane Mogale City Randfontein Ekurhuleni Johannesburg Mpumalanga Merafong City
Photographs of Equites property portfolio and management can be accessed here. Alternatively, please contact Investorsense at the details below.
 11 October 2018 EQUITES DISTINCTIVE LOGISTICS PORTFOLIO CONTINUES TO SHINE Photographs of Equites property portfolio and management can be accessed here. Alternatively, please contact Investorsense at
REVIEWED PROVISIONAL CONDENSED CONSOLIDATED FINANCIAL RESULTS REVIEWED PROVISIONAL CONDENSED CONSOLIDATED FINANCIAL RESULTS
 REVIEWED PROVISIONAL CONDENSED CONSOLIDATED FINANCIAL RESULTS FOR THE YEAR ENDED 31 AUGUST 2018 REVIEWED PROVISIONAL CONDENSED CONSOLIDATED FINANCIAL RESULTS HIGHLIGHTS Property portfolio increase to R8.6
Our conversation GROUP OVERVIEW AND STRATEGY PORTFOLIO OVERVIEW CAPITAL STRUCTURE AND DEBT. Section DMTN PROGRAMME UPDATE
 STRATEGY AND KEY OUTCOMES PROPERTY ASSET PLATFORM FINANCIAL REVIEW WRAP UP Our conversation Section 01 GROUP OVERVIEW AND STRATEGY Section 02 Section 03 Section 04 GROUP OVERVIEW AND STRATEGY Section 01
REBOSIS PROPERTY FUND
 REBOSIS PROPERTY FUND 31 July 2012 JSE SHOWCASE 1 REBOSIS SNAPSHOT KEY SNAPSHOT Listing date 17 May 2011 JSE classification JSE code Real Estate Holdings & Development REB (ZAE000156147) Linked units in
INTERIM RESULTS PRESENTATION FOR THE SIX MONTHS ENDED 30 JUNE 2017
 INTERIM RESULTS PRESENTATION FOR THE SIX MONTHS ENDED 30 JUNE 2017 2 AGENDA SECTION PRESENTER INVESTMENT CASE 1 AMELIA BEATTIE FINANCIAL RESULTS 2 JOSÉ SNYDERS OPERATIONAL OVERVIEW 3 AMELIA BEATTIE LOOKING
SCA PROPERTY GROUP ANNOUNCES FIRST HALF FY19 RESULTS
 MEDIA ANNOUNCEMENT 4 February 2019 SCA PROPERTY GROUP ANNOUNCES FIRST HALF FY19 RESULTS SCA Property Group (ASX: SCP) ( SCP or the Group ) is pleased to announce its results for the six months ended 31
UNAUDITED CONDENSED CONSOLIDATED INTERIM RESULTS. to R194.2 million. to cents per share. to cents per share
 DISTRIBUTABLE EARNINGS 9,5% to R194.2 million COMBINED DIVIDENDS PER SHARE 6,3% A-SHARE DIVIDEND 5% to 50.64892 cents per share B-SHARE DIVIDEND 7,9% to 41.83993 cents per share INTEREST RATE HEDGING IN
URBAN RENEWAL OC T ODEC
 URBAN RENEWAL INTEGRATED REPORT IS A REAL ESTATE INVESTMENT TRUST (REIT) CONTENTS R P2 HIGHLIGHTS P48 TOP 10 PROPERTIES BY VALUE P40 PORTFOLIO About this report 1 Highlights 2 Group at a glance 4 Who we
CONDENSED UNAUDITED CONSOLIDATED FINANCIAL STATEMENTS FOR THE SIX MONTHS ENDED 30 SEPTEMBER 2016
 LODESTONE REIT LIMITED Incorporated in the Republic of South Africa Reg no 2010/017830/06 JSE share code LDO ISIN ZAE000197935 ( Lodestone or the Company ) CONDENSED UNAUDITED CONSOLIDATED FINANCIAL STATEMENTS
Property Fund Limited. Reviewed condensed consolidated interim results Financial results. Investec Property Fund Limited
 Property Fund Limited condensed consolidated interim results Financial results Investec Property Fund Limited Key highlights for the period 5.4% increase in normalised DPS year-on-year INTERIM DISTRIBUTION
Interim Results Presentation. 30 November 2016
 Interim Results Presentation 30 November 2016 Presentation Outline 1. Tower Strategy 2. Financial Highlights 3. Operational Highlights 4. Tower at a Glance 5. Management Team 6. Financial Results 7. Borrowings
ASX/Media Announcement
 ASX/Media Announcement 13 February 2018 Propertylink delivers a strong HY18 result, well positioned to deliver FY18 guidance Propertylink Group (ASX:PLG) today announces strong financial and operational
Unaudited Condensed Interim Financial Results. for the six months ended 31 December and Dividend Declaration
 Condensed Interim Financial Results for the six months 31 December 2018 and Dividend Declaration Contents 2 Financial Highlights 3 Operational Highlights 4 Strategic Positioning and Business Model 5 Commentary
Notice of Annual General Meeting
 7 th Annual General Meeting 18 July 2017 Important Notice This presentation shall be read in conjunction with Mapletree Industrial Trust s ( MIT ) financial statements for the financial year ended 31 March
For personal use only
 ASX / MEDIA ANNOUNCEMENT 9 February 2015 SCA PROPERTY GROUP ANNOUNCES FIRST HALF FY15 RESULTS SCA Property Group (ASX: SCP) ( SCP or the Group ) announces its results for the six months ended 31 December
M A R K E T U P D A T E AUGUST. Baywest Mall, Port Elizabeth, Eastern Cape
 M A R K E T U P D A T E AUGUST 2018 Baywest Mall, Port Elizabeth, Eastern Cape Investment community feedback Disposal programme Cross currency swap New Frontier strategy and risk Cash flow disparity Earnings
SCA PROPERTY GROUP. 12 December Kwinana Marketplace, WA
 SCA PROPERTY GROUP 12 December 2017 Kwinana Marketplace, WA SCP HISTORY SCP was created by Woolworths Limited and listed on the ASX in December 2012 to act as a landlord for a number of its shopping centres
Property for. people
 Property for people We re not landlords. We re people. www.redefine.co.za 1 GROUP RESULTS for the year ended 31 August 2013 Property for people AGENDA OVERVIEW AND STRATEGY PROPERTY PORTFOLIO FINANCIAL
FINANCIAL RESULTS For First Quarter ended 31 March 2015
 FINANCIAL RESULTS For First Quarter ended 31 March 2015 AGENDA Q1 Highlights Financial Performance Portfolio Performance AEI Updates Looking Ahead Unit Performance 2 Q1 HIGHLIGHTS Q1 HIGHLIGHTS FINANCIAL
Kempen conference. Amsterdam 30 May 2013
 Kempen conference Amsterdam 30 May 2013 Company snapshot Description Dutch REIT: NSI is a real estate asset management company and qualifies as fiscal investment institution under Dutch law (REIT) Full
SGX - DBS Vickers - REITAS SREITS Corporate Day Investor Presentation
 SGX - DBS Vickers - REITAS SREITS Corporate Day Investor Presentation 27 Feb 1 Mar 2018 Important Notice This presentation shall be read in conjunction with OUE Commercial REIT s Financial Results announcement
MAS REAL ESTATE INC. Results presentation. New Waverley, Edinburgh, UK. Year ended 30 June 2016
 MAS REAL ESTATE INC Results presentation Year ended 30 June 2016 New Waverley, Edinburgh, UK 1 TABLE OF CONTENTS i. Company profile ii. iii. iv. Strategic update Recurring and potential EPS Highlights
PROPERTY FUND. Unaudited condensed consolidated interim results for the six months ended 31 August 2018
 PROPERTY FUND Unaudited condensed consolidated interim results for the six months 31 August Performance Interim distribution of 39.40 cents per share Renewed and concluded 62 035m 2 of leases Loan to value
UNAUDITED RESULTS for the six months ended 28 February 2017 INVESTMENT HIGHLIGHTS
 REBOSIS PROPERTY FUND LIMITED ( Rebosis or the company or the group ) Registration number 2010/003468/06 (Approved as a REIT by the JSE) JSE share code: REA - ISIN: ZAE000240552 JSE share code: REB - ISIN:
Contents Weighted Lease Average Expiry (WALE)... 3 Accretive Acquisition... 4 Rights Issue... 4 DPU... 4 NAV... 4 RNAV... 5 Gearing...
... 3 Accretive Acquisition... 4 Rights Issue... 4 DPU... 4 NAV... 4 RNAV... 5 Gearing...") 1 Contents Weighted Lease Average Expiry (WALE)... 3 Accretive Acquisition... 4 Rights Issue... 4 DPU... 4 NAV... 4 RNAV... 5 Gearing... 5 Capitalization Rate (aka Property Yield)... 5 AEI... 5 2 Weighted
1 Contents Weighted Lease Average Expiry (WALE)... 3 Accretive Acquisition... 4 Rights Issue... 4 DPU... 4 NAV... 4 RNAV... 5 Gearing... 5 Capitalization Rate (aka Property Yield)... 5 AEI... 5 2 Weighted
Citi-REITAS-SGX C-Suite Singapore REITs and Sponsors Forum
 Citi-REITAS-SGX C-Suite Singapore REITs and Sponsors Forum 23 August 2018 Important Notice This presentation shall be read in conjunction with OUE Commercial REIT s Financial Results announcement for 2Q
Presentation DNB Oslo, September 20, 2018
 Presentation DNB Oslo, September 20, 2018 Norwegian Property commercial property Prime long term focus Prime commercial properties in attractive locations Oslo CBD West Oslo Nydalen Focus going forward
Table of Contents. Management s Discussion and Analysis 1. Condensed Consolidated Financial Statements 39
 Q3 2018 Table of Contents Management s Discussion and Analysis 1 Condensed Consolidated Financial Statements 39 Notes to the Condensed Consolidated Financial Statements 43 Corporate Information IBC Management
Tour of Tower Cape Properties
 www.towerpropertyfund.co.za Tour of Tower Cape Properties Contents www.towerpropertyfund.co.za Tower Strategy Financial Highlights Operational Highlights Tower at a Glance Management Team Borrowings Valuations
AIMS AMP Capital Industrial REIT announces DPU of 2.50 cents in 1Q FY2019
 AIMS AMP CAPITAL INDUSTRIAL REIT MANAGEMENT LIMITED As Manager of AIMS AMP Capital Industrial REIT One George Street, #23-03 Singapore 049145 Media Release AIMS AMP Capital Industrial REIT announces DPU
Fortune Real Estate Investment Trust Financial Statements For the financial period from 1 January 2011 to 30 June 2011
 Fortune Real Estate Investment Trust Financial Statements For the financial period from 1 January 2011 to 30 June 2011 These figures have not been audited but have been reviewed by our auditors. Fortune
Condensed consolidated interim results for the six months ended 31 December 2016 PROPERTY INVESTMENT EXCELLENCE
 Condensed consolidated interim results PROPERTY INVESTMENT EXCELLENCE HIGHLIGHTS Dividend up 16,6% Acquired Skopje City Mall, Skopje, Macedonia Sale of Willowbridge South R460 million Developments of R260
CAPITAMALLS MALAYSIA TRUST (CMMT)
") CAPITAMALLS MALAYSIA TRUST (CMMT) Malaysia s Largest Pure-Play Shopping Mall REIT Asian Investment Conference & Exhibition, Singapore AICE 23 2011 July *23 July 2011 2011* Disclaimer The information in
CAPITAMALLS MALAYSIA TRUST (CMMT) Malaysia s Largest Pure-Play Shopping Mall REIT Asian Investment Conference & Exhibition, Singapore AICE 23 2011 July *23 July 2011 2011* Disclaimer The information in
OUE C-REIT s FY2015 Distribution 22.2% Higher YoY, 4Q 2015 DPU Exceeded Circular Forecast by 20.4%
 PRESS RELEASE For Immediate Release OUE C-REIT s FY2015 Distribution 22.2% Higher YoY, 4Q 2015 DPU Exceeded Circular Forecast by 20.4% Key Highlights: 4Q 2015 distribution per unit ( DPU ) exceeded Circular
The Directors of Keppel REIT Management Limited, as manager of Keppel REIT, are pleased to announce the
 MEDIA RELEASE Unaudited Results of Keppel REIT for the Quarter Ended 31 March 2013 15 April 2013 The Directors of Keppel REIT Management Limited, as manager of Keppel REIT, are pleased to announce the
SA Corporate June 2018 Interim Results Presentation
 SA Corporate June 2018 Interim Results Presentation September 2018 INDUSTRIAL RETAIL OFFICE RESIDENTIAL REST OF AFRICA Agenda Highlights Rory Mackey Financial Performance Antoinette Basson Portfolio Review
Financial Results for 3 rd Quarter 2016
 Financial Results for 3 rd Quarter 2016 1 November 2016 Important Notice This presentation shall be read in conjunction with OUE Commercial REIT s Financial Results announcement for 3Q 2016 dated 1 November
The Directors of Keppel REIT Management Limited, as Manager of Keppel REIT, are pleased to announce
 MEDIA RELEASE Unaudited Results of Keppel REIT for the First Quarter Ended 31 March 2016 14 April 2016 The Directors of Keppel REIT Management Limited, as Manager of Keppel REIT, are pleased to announce
Investor Presentation for Tokyo Non-Deal Roadshow. 25 August 2016
 Investor Presentation for Tokyo Non-Deal Roadshow 25 August 2016 Important Notice This presentation shall be read in conjunction with OUE Commercial REIT s Financial Results announcement for 1Q 2016 dated
Macquarie ASEAN Conference. 26 Aug 2014
 Macquarie ASEAN Conference 26 Aug 2014 Important Notice Standard Chartered Securities (Singapore) Pte. Limited, CIMB Bank Berhad, Singapore Branch and Oversea-Chinese Banking Corporation Limited were the
September Abuja City Report. Nigeria
 September 2016 Abuja City Report Nigeria Abuja City Report September 2016 Market Overview 2016 GDP forecast 0.2% Central Bank lending rate 16.9% Inflation 16.5% Losing number one position to South Africa
Fortune Real Estate Investment Trust Financial Statements For the financial period from 1 January 2015 to 30 June 2015
 Fortune Real Estate Investment Trust Financial Statements For the financial period from 1 January 2015 to 30 June 2015 These figures have not been audited but have been reviewed by our auditors. Fortune
RESULTS PRESENTATION FOR THE YEAR ENDED 31 MARCH
 2018 RESULTS PRESENTATION FOR THE YEAR ENDED 31 MARCH 2018 OVERVIEW The year in review 2018 HIGHLIGHTS 7 INCOME PRODUCING PROPERTIES 2% VACANCY RATE 3% DIVIDEND GROWTH 7% ANNUAL RENTAL ESCALATION ACHIEVED
ACQUISITION OF VARIOUS PROPERTIES AND PRIVATE PLACEMENT
 ANNUITY PROPERTIES LIMITED (Incorporated in the Republic of South Africa) (Registration Number 2011/145994/06) Share code: ANP ISIN: ZAE000165643 ( Annuity or the Company ) ACQUISITION OF VARIOUS PROPERTIES
A r t i s R e a l E s t a t e I n v e s t m e n t T r u s t Q3-1 8 I n v e s t o r P r e s e n t a t i o n N o v e m b e r 1,
 1 A r t i s R e a l E s t a t e I n v e s t m e n t T r u s t Q3-1 8 I n v e s t o r P r e s e n t a t i o n N o v e m b e r 1, 2 0 1 8 Forward-Looking Information 2 This presentation contains forward-looking
STARHILL GLOBAL REAL ESTATE INVESTMENT TRUST FINANCIAL STATEMENTS ANNOUNCEMENT FOR THE THIRD QUARTER ENDED 31 MARCH 2018
 STARHILL GLOBAL REAL ESTATE INVESTMENT TRUST FINANCIAL STATEMENTS ANNOUNCEMENT FOR THE THIRD QUARTER ENDED 31 MARCH 2018 TABLE OF CONTENT DESCRIPTION PAGE SUMMARY OF STARHILL GLOBAL REIT S RESULTS 3 DISTRIBUTION
FINANCIAL Results HIGHLIGHTS 6,9% (YEAR ON YEAR) m 2. R12,3 billion CONDENSED CONSOLIDATED NET ASSET VALUE GROWTH OF TOTAL PORTFOLIO GLA OF
 m 2. R12,3 billion CONDENSED CONSOLIDATED NET ASSET VALUE GROWTH OF TOTAL PORTFOLIO GLA OF") ACCELERATE PROPERTY FUND LIMITED (Incorporated in the Republic of South Africa) (Registration No 2005/015057/06) JSE code: APF ISIN code: ZAE000185815 (REIT status approved) ( Accelerate or the company
ACCELERATE PROPERTY FUND LIMITED (Incorporated in the Republic of South Africa) (Registration No 2005/015057/06) JSE code: APF ISIN code: ZAE000185815 (REIT status approved) ( Accelerate or the company
Quarterly Statement A S O F
 Quarterly Statement AS OF KEY FACTS Q3 / 2017 T 1 Key facts RESULTS OF OPERATIONS Q3 2017 Q3 2016 + / % / bp 01.01. 01.01. 30.09.2016 Rental income million 134.7 131.9 2.1 398.4 381.3 4.5 Net rental and
TABLE OF CONTENTS Page - INTRODUCTION 2 - SUMMARY OF KEPPEL REIT RESULTS 2. 1(a)(i) STATEMENT OF TOTAL RETURN AND DISTRIBUTION STATEMENT 3
(i) STATEMENT OF TOTAL RETURN AND DISTRIBUTION STATEMENT 3") KEPPEL REIT FULL YEAR 2018 FINANCIAL STATEMENTS ANNOUNCEMENT UNAUDITED RESULTS FOR THE YEAR ENDED 31 DECEMBER 2018 TABLE OF CONTENTS Page - INTRODUCTION 2 - SUMMARY OF KEPPEL REIT RESULTS 2 1(a)(i) STATEMENT
KEPPEL REIT FULL YEAR 2018 FINANCIAL STATEMENTS ANNOUNCEMENT UNAUDITED RESULTS FOR THE YEAR ENDED 31 DECEMBER 2018 TABLE OF CONTENTS Page - INTRODUCTION 2 - SUMMARY OF KEPPEL REIT RESULTS 2 1(a)(i) STATEMENT
DREAM GLOBAL ANNOUNCES SECOND QUARTER RESULTS AND HIGH QUALITY ACQUISITIONS
 DREAM GLOBAL ANNOUNCES SECOND QUARTER RESULTS AND HIGH QUALITY ACQUISITIONS TORONTO, AUGUST 7, 2018 DREAM GLOBAL REIT (TSX:DRG.UN, FRA:DRG) (or Dream Global, the Trust or we ) today reported its financial
REITs Symposium May 2018
 REITs Symposium 2018 19 May 2018 Important Notice This presentation shall be read in conjunction with OUE Commercial REIT s Financial Results announcement for 1Q 2018 dated 10 May 2018. This presentation
SCA Property Group. For personal use only. Investor update. Merimbula (Tura Beach), NSW
, NSW") SCA Property Group Investor update Merimbula (Tura Beach), NSW 28 February 2013 Delivering on objectives set out in PDS Successful formation of SCA Property Group: New units transferred to Woolworths shareholders
SCA Property Group Investor update Merimbula (Tura Beach), NSW 28 February 2013 Delivering on objectives set out in PDS Successful formation of SCA Property Group: New units transferred to Woolworths shareholders
UNAUDITED CONDENSED CONSOLIDATED INTERIM FINANCIAL STATEMENTS FOR THE SIX MONTHS ENDED 30 NOVEMBER 2017
 HERIOT REIT LIMITED (Incorporated in the Republic of South Africa) (Registration number 2017/167697/06) JSE share code HET ISIN ZAE000246740 (Approved as a REIT by JSE) ("Heriot" or "the Company" or "the
Financial Results for 4 th Quarter 2017 and Year Ended 31 December 2017
 Financial Results for 4 th Quarter 2017 and Year Ended 31 December 2017 31 January 2018 Important Notice This presentation shall be read in conjunction with OUE Commercial REIT s Financial Results announcement
PROVISIONAL REVIEWED CONDENSED CONSOLIDATED RESULTS for the year ended 31 August 2017
 REBOSIS PROPERTY FUND LIMITED ("Rebosis" or the "company" or the "group") Registration number 2010/003468/06 (Approved as a REIT by the JSE) JSE share code: REA - ISIN: ZAE000240552 JSE share code: REB
2016 FINANCIAL YEAR RESULTS PRESENTATION
 2016 FINANCIAL YEAR RESULTS PRESENTATION 22 August 2016 www.industriareit.com.au ASX CODE: IDR Agenda 01 Highlights and Investment Proposition 02 Financial results 03 Portfolio performance 04 Capital management
Investor Presentation for Citi ASEAN Investor Conference. 12 June 2014
 Investor Presentation for Citi ASEAN Investor Conference 2 June 204 Important Notice Standard Chartered Securities (Singapore) Pte. Limited, CIMB Bank Berhad, Singapore Branch and Oversea-Chinese Banking
Interest Rates, Cap Rates, and the Real Estate Cycle
 Interest Rates, Cap Rates, and the Real Estate Cycle Stephen Hester, Chief Executive We are real estate investors and create value by actively managing, financing and developing prime commercial property
Q Dream Industrial REIT
 Q2 2017 Dream Industrial REIT Table of contents Management s discussion and analysis 1 Condensed consolidated financial statements 38 Notes to the condensed consolidated financial statements 42 Corporate
MAPLETREE LOGISTICS TRUST S QUARTERLY DISTRIBUTION PER UNIT RISES 10% YEAR-ON-YEAR
 For Immediate Release MAPLETREE LOGISTICS TRUST S QUARTERLY DISTRIBUTION PER UNIT RISES 10% YEAR-ON-YEAR Highlights: Distribution Per Unit ( DPU ) of 1.70 cents for the 3 months ended 31 March 2012 Portfolio
Investor Presentation August 2017
 Investor Presentation August 2017 Important Notice This presentation shall be read in conjunction with Mapletree Industrial Trust s ( MIT ) financial results for First Quarter Financial Year 2017/2018
PROPERTY FUND. Reviewed provisional condensed consolidated results for the year ended 28 February 2018
 PROPERTY FUND Reviewed provisional condensed consolidated results for the year ended 28 February 2018 Highlights Full year distribution of 97.24 cents per share Third consecutive year reduction in gearing
HIGHLIGHTS 8,2% R12,6 billion m 2 92,1% CONDENSED CONSOLIDATED. INTERIM FINANCIAL Results NET ASSET VALUE GROWTH OF
 ACCELERATE PROPERTY FUND LIMITED (Incorporated in the Republic of South Africa) (Registration No 2005/015057/06) JSE code: APF ISIN code: ZAE000185815 (REIT status approved) ( Accelerate or the company
For personal use only
 NATIONAL STORAGE REIT JP MORGAN AUSTRALIAN REIT FORUM ASIA MARCH 2017 IMPORTANT NOTE & DISCLAIMER This presentation has been prepared by National Storage REIT ( NSR ) comprising National and may involve
Abacus Funds Management
 Abacus Funds Management FY10 First Half Review May 2010 Introduction After a very challenging year during 2009, I am pleased to be writing to you in early 2010 with positive signs emerging of improved
Investor presentation 9M 2012 results
 Investor presentation 9M 2012 results Key results: stabilising in Q3 Direct result p/s: 3.05 (-17.6% yoy) Q3: + 0.01 vs Q2 Revaluation portfolio: -4.75% Q3: -0.25% NAV p/s: 63.72 (-12.9% yoy) Q3: +0.4%
85,47 cents. 965 cents. 993,89 cents 5,3% R2,21 billion 79,6% 82,5% R184 million 25,3% 10,6%
 CONDENSED CONSOLIDATED FINANCIAL STATEMENTS for the year ended 30 June 2014 Distribution per share 85,47 cents from 77,25 cents up by 10,6% up by 25,3% Investment property income R271,8 million from R216,9
AIMS AMP CAPITAL INDUSTRIAL REIT
 AIMS AMP CAPITAL INDUSTRIAL REIT FY2019: First Quarter Financial Results Ended 30 June 2018 Results Presentation 26 July 2018 1 Important notice Disclaimer This Presentation is focused on comparing actual
Development Securities PLC. Interim results for six months ended 31st August 2012 Further results of strategy secured
 Development Securities PLC Interim results for six months ended 31st August 2012 Further results of strategy secured Contents Slide number Overview and highlights 3-9 Interim results 10-14 Portfolio and
AIMS AMP CAPITAL INDUSTRIAL REIT
 AIMS AMP CAPITAL INDUSTRIAL REIT FY2018: Fourth Quarter Financial Results Ended 31 March 2018 Results Presentation 25 April 2018 1 Important notice Disclaimer This Presentation is focused on comparing
Summarised Unaudited Results. for the six months ended 30 June 2017
 Summarised Unaudited Results for the six months ended 30 June 2017 Contents Highlights Commentary 1 Statement of financial position 4 Statement of comprehensive income 5 Statement of changes in participatory
TABLE OF CONTENTS Item No. Description Page No. - Introduction 3. 1(a) Statements of Total Return & Distribution Statements 4-9
 Statements of Total Return & Distribution Statements 4-9") CAPITALAND MALL TRUST 2017 FULL YEAR UNAUDITED FINANCIAL STATEMENT AND DISTRIBUTION ANNOUNCEMENT TABLE OF CONTENTS Item No. Description Page No. - Summary of CMT Results 2 - Introduction 3 1(a) Statements
CAPITALAND MALL TRUST 2017 FULL YEAR UNAUDITED FINANCIAL STATEMENT AND DISTRIBUTION ANNOUNCEMENT TABLE OF CONTENTS Item No. Description Page No. - Summary of CMT Results 2 - Introduction 3 1(a) Statements
Management s Prepared Remarks Fourth Quarter 2016 Conference Call February 8, 2017
 Management s Prepared Remarks Fourth Quarter 2016 Conference Call February 8, 2017 Brendan Maiorana Senior Vice President, Finance and Investor Relations If any of you have not received yesterday s earnings
MEDIA RELEASE. Unaudited Results of Keppel REIT for the First Quarter Ended 31 March April 2015
 MEDIA RELEASE Unaudited Results of Keppel REIT for the First Quarter Ended 31 March 2015 13 April 2015 The Directors of Keppel REIT Management Limited, as Manager of Keppel REIT, are pleased to announce
INTEGRATED ANNUAL REPORT
 INTEGRATED ANNUAL REPORT 2017 ABOUT OUR REPORT FAIRVEST PROPERTY HOLDINGS LIMITED and its subsidiaries 1 JULY 2016 30 JUNE 2017 INTEGRATED AND FINANCIAL REPORTING BOUNDARY FORWARD LOOKING STATEMENTS Certain
2009 Half-Year Results. 3 August 2009
 2009 Half-Year Results 3 August 2009 John Nelson, Chairman 2 Agenda Introduction John Richards Financial Results Simon Melliss France Christophe Clamageran UK David Atkins Summary and Conclusion John Richards
FINANCIAL REPORT FOR THE TWENTY-FOURTH FISCAL PERIOD ENDED JULY 31, 2018
 For Translation Purposes Only FINANCIAL REPORT FOR THE TWENTY-FOURTH FISCAL PERIOD ENDED JULY 31, 2018 September 13, 2018 Name of issuer : Mori Hills REIT Investment Corporation Stock exchange listing
3Q2010 Financial Results. 20 October 2010
 3Q2010 Financial Results 20 October 2010 important notice The value of units in CIT ( Units ) and the income derived from them may fall as well as rise. Units are not investments, liabilities or obligations
ATTERBURY ACQUISITIONS (ATTACQ)
") 1 October 2013 ATTERBURY ACQUISITIONS (ATTACQ) HIGH QUALITY PROPERTY FUND TO LIST ON 14 OCTOBER 2013 Indicative listing price R15.00 Company update; Peter Armitage One of SA s most successful property
1 October 2013 ATTERBURY ACQUISITIONS (ATTACQ) HIGH QUALITY PROPERTY FUND TO LIST ON 14 OCTOBER 2013 Indicative listing price R15.00 Company update; Peter Armitage One of SA s most successful property
Investor Presentation March 2016
 Investor Presentation March 2016 Important Notice This presentation shall be read in conjunction with Mapletree Industrial Trust s ( MIT ) financial results for Third Quarter Financial Year 2015/2016 in
Annual General Meeting. 28 April 2010
 CapitaCommercial Trust Annual General Meeting Presentation 28 April 2010 Important Notice The past performance of CCT is not indicative of the future performance of CCT. Similarly, the past performance
Keppel REIT. Second Quarter and First Half 2017 Financial Results. 18 July 2017
 Keppel REIT Second Quarter and First Half 2017 Financial Results 18 July 2017 Outline Key Highlights for 1H 2017 3 Financial Performance & Capital Management 6 Portfolio Performance 10 Market Updates 14
Bank of Queensland Full year results 31 August Bank of Queensland Limited ABN AFSL No
 Bank of Queensland Full year results 31 August 2013 Bank of Queensland Limited ABN 32 009 656 740. AFSL No 244616. Agenda Result overview Stuart Grimshaw Managing Director and CEO Financial detail Anthony
Investor Presentation November 2018
 Investor Presentation November 2018 FORWARD LOOKING STATEMENTS Certain statements contained in this document constitute forward-looking information within the meaning of securities laws. Forward-looking
Investor Presentation September 2016
 Investor Presentation September 2016 Based on Second Quarter 2016, unless otherwise noted 1 FORWARD LOOKING STATEMENTS Certain statements contained in this document constitute forward-looking information
Achievements backed by organic and inorganic growth
 1 01 Grit Real CMB Estate Global Income Newsletter Group Ltd Achievements backed by organic and inorganic growth 14 Nov 2017 April 2017 FUNDAMENTAL VIEW Grit Real Estate Income Group Ltd (previously Mara
SGREIT achieves DPU of 1.18 cents for 4Q FY16/17
 Media release by: YTL Starhill Global REIT Management Limited (YTL Starhill Global) Manager of: Starhill Global Real Estate Investment Trust (SGREIT) SGREIT achieves DPU of 1.18 cents for 4Q FY16/17 HIGHLIGHTS
OUE C-REIT Achieved Distribution of S$17.8 million in 3Q 2017, 3.2% Higher YoY
 PRESS RELEASE For Immediate Release OUE C-REIT Achieved Distribution of S$17.8 million in 3Q 2017, 3.2% Higher YoY Key Highlights: 3Q 2017 amount available for distribution of S$17.8 million increased
Reviewed preliminary condensed consolidated Financial results. Key highlights for the year ended 31 March % Increase in DPS year-on-year
 Investec Property Fund Limited (Incorporated in the Republic of South Africa) (Registration number 2008/011366/06) Share code: IPF ISIN: ZAE000180915 (Income tax reference number 9332/719/16/1) Reviewed